16
www.platts.com/ petrochemicals PETROCHEMICALS PETROCHEMICALS SPECIAL REPORT JULY 2016 EUROPEAN PETROCHEMICAL OUTLOOK H2 2016
www.platts.com/petrochemicalsPETROCHEMICALS
PETROCHEMICALS SPECIAL REPORT
JULY 2016
EUROPEAN PETROCHEMICAL OUTLOOK H2 2016
SPECIAL REPORT: PETROCHEMICALS EUROPEAN PETROCHEMICAL OUTLOOK H2 2016
2© 2016 S&P Global Platts, a division of S&P Global. All rights reserved.
PETROCHEMICAL COMMODITY PRICESStay ahead of today’s unpredictable markets with regional and global commodity price assessments for polymer, aromatics, olefins and solvent markets.
Make confident pricing decisions based on Platts’ coverage of the key petrochemical markets. You can access the latest price assessments, news and market commentaries, whenever and wherever you need them.
Platts provides you with:
• Daily spot prices - Negotiate confidently on spot deals with your counterparties with access to an independent and impartial set of reference prices.
• Reported bids, offers and trades - Get a sense of where the market is trading on a particular day so that you can benchmark your own data against that of Platts.
• Assessment rationales - Gain an additional level of confidence with the knowledge of how we arrived at a particular price before you approach your counterparty or enter it into your own models.
• Daily news - Get a rounded picture of market activity to support your investment decisions.
• Access anywhere – Keep up to date wherever you are, with access to prices on your desktop, tablet or smartphone.
5 REASONS TO CHOOSE PLATTS
1. We’re impartial and independent, with no vested interest in the market.
2. We have an open and transparent price discovery process, designed to reflect the true market value.
3. We operate across the energy value chain, integrating upstream knowledge into our downstream prices.
4. We go beyond the required reporting standards to be IOSCO compliant.
5. We’re connected to every global market .
www.platts.com
For more information on Platts’ price assessments and market insight, visit: www.platts.com/petrochemicals
SPECIAL REPORT: PETROCHEMICALS EUROPEAN PETROCHEMICAL OUTLOOK H2 2016
3© 2016 S&P Global Platts, a division of S&P Global. All rights reserved.
European cracker operators have continued to enjoy solid margins so far in 2016 as low oil and gas prices support the current boom. Sharp increases in imports to Europe in the cracker chain have failed to dent margins this year so far. Spot cracker margins are currently at $600/mt, compared with a 2014 average of $265/mt and a 2015 average of $558/mt.
Imports of ethylene and polyethylene are expected to keep rising, amid attractive European prices in H2. EU imports of ethylene and polyethylene in the first four months of the year surged 235% and 52% compared with the first four months of 2015, according to the latest Eurostat data. Despite, the surging imports, polymer margins have also remained firm.
Downstream, imports have helped plastic converters to insulate themselves against similar supply crunches to the one experienced in the summer of 2015, with the dangers of operating on thin inventories still very fresh in their minds. As a result, the refinery strikes in France in May and June, along with various other planned and unplanned cracker outages, have not produced any desperate search for tonnes.
Increases in polyolefin imports to Europe from Asia, Russia, North America and the Middle East represent a ripple effect of global rises in polyethylene supply. Polyethylene prices in Europe are expected to be bearish for the second half of the year on increasing imports and following the end of the recent industrial action in France. However, there is a short-term upside to Asia polyethylene prices in the second half of the year. Increases in buying from import-dependent China are expected as the government has ordered petrochemical plants in Shanghai, Hangzhou and Ningbo to curb production in August-September ahead of the G20 Summit in Hangzhou September 4-5.
The following issue highlights the key themes for the next few months, including pressure on styrene prices from a potential supply glut as supply returns, bullish benzene and bearishness in the blending components market.
EUROPE KEEPS EARS TO THE GROUND FOR BUTADIENE EXPORT OPPORTUNITIES
With butadiene demand within Europe satiated following startups of new plants, the continent’s traders are keeping their ears close to the ground for arbitrage opportunities – East or West.
Trade statistics published in the first half have clearly set one trend for the second half: the spot market in will remain geared towards exports. Spot business within Europe has been placed on a backburner and a similar trend has been noticed for styrene butadiene rubber.
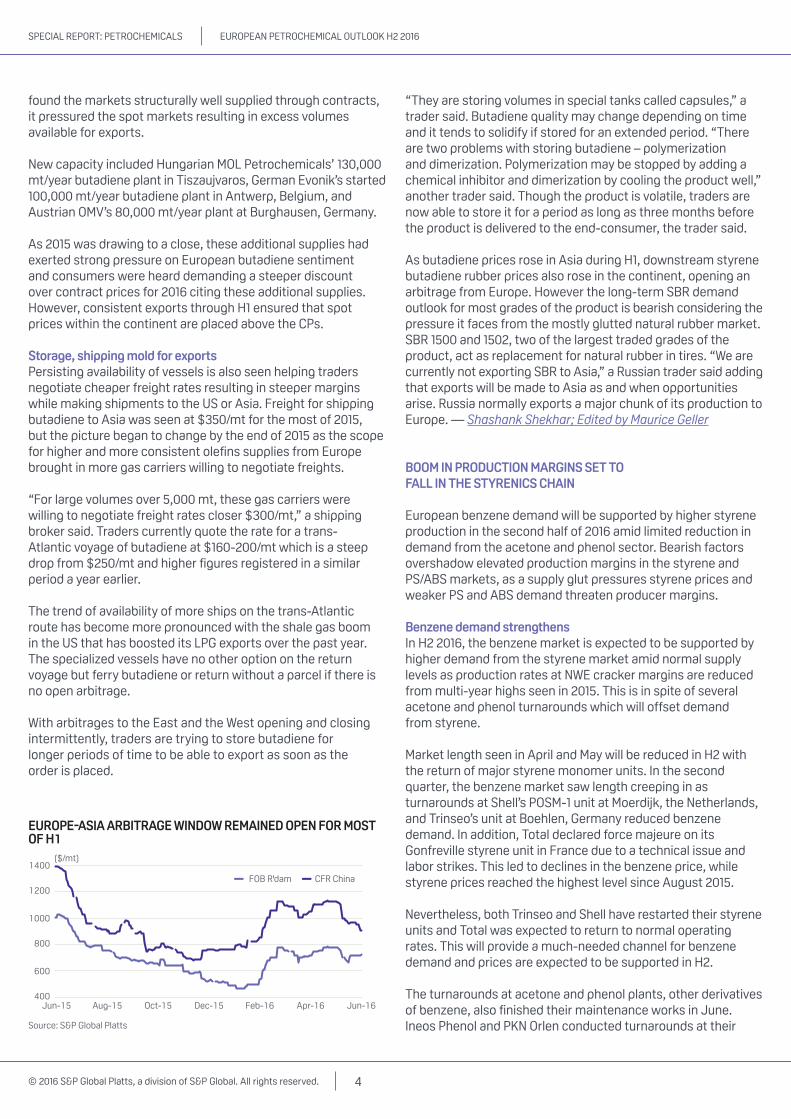
The EU exported 127,893 mt of butadiene in the period January-April, up almost threefold year on year, according to the latest figures from Eurostat: in the same period last year, EU butadiene exports totaled 42,760 mt. The data reflects the butadiene arbitrage window that had been lying open between Europe and Asia since the end of January. It closed at the end
of May but markets expect the window to open again during the course of H2. As one of the largest traders in Europe said recently, “Spot butadiene business in Europe is definitely geared towards exports.”
South Korea was the largest recipient of EU butadiene this year, taking 41,179 mt of the product, Eurostat data showed. China imported 17,160 mt in the period, data showed. The US imported 34,239 mt of butadiene during the period, but most of this was contractual volumes, sources said.
The US imported 29,623 mt of butadiene during the period but most of the country’s consumption was through contract cargoes. An arbitrage to the US was opened after Shell Chemicals declared a force majeure at its 585 million lb/year Norco, Louisiana, butadiene unit following an outage. No update is available from the company on when will it restart the plant.
“Demand in the US may not be sustained as in Asia,” another trader said, adding that the spot exports to the US may be sporadic but contract cargoes may regularly flow across the Atlantic.
Butadiene prices in Asia had risen consistently in the end-January to end-May period as a result of several crackers in the continent undergoing maintenances. However, prices fell over end-May and early June because of pressure from downstream styrene butadiene rubber and acrylonitrile butadiene styrene. Recently butadiene prices in Asia were seen finding support again on a cocktail of factors including concerns of thinner supply due to feedstock changes, turnarounds and a drop in exports from Europe.
Steam cracker turnarounds in Asia are to continue till the end of this year. According to the available turnaround schedule for Asia, Japan’s Mitsui Chem will shut its Osaka-based cracker for a month-long turnaround in June and Petrochemical Corporation of Singapore will shut its No.2 cracker in Singapore for a month in July. JX Nippon Oil will shut its Kawasaki-based cracker for a maintenance during August and September. Thailand’s RPC and IRPC have both scheduled the maintenance for their crackers in Map Ta Phut during Q4 2016. Taiwan’s CPC has scheduled the turnaround for one of its three crackers in Lin Yuan also during Q4, while Formosa has scheduled the maintenance for its three crackers at Mailiao from early August to the second half of September.
The shutdown of Shell Chemicals’ Jurong Island-based cracker way back in December 2015, continues to remain one of the strongest stimuli for butadiene in Asia, a European trader said. “I think a lot depends on whether Shell Singapore comes back,” a European SBR trader said. The cracker can produce 186,000 mt/year of butadiene besides 960,000 mt/year of ethylene and 540,000 mt/year of propylene. “Butadiene from Shell’s Singapore plant is sought because of high purity levels.”
Europe turns structurally longAbout 310,000 mt/year of additional butadiene capacity hit the European markets in the second half of 2015 and as this
SPECIAL REPORT: PETROCHEMICALS EUROPEAN PETROCHEMICAL OUTLOOK H2 2016
4© 2016 S&P Global Platts, a division of S&P Global. All rights reserved.
found the markets structurally well supplied through contracts, it pressured the spot markets resulting in excess volumes available for exports.
New capacity included Hungarian MOL Petrochemicals’ 130,000 mt/year butadiene plant in Tiszaujvaros, German Evonik’s started 100,000 mt/year butadiene plant in Antwerp, Belgium, and Austrian OMV’s 80,000 mt/year plant at Burghausen, Germany.
As 2015 was drawing to a close, these additional supplies had exerted strong pressure on European butadiene sentiment and consumers were heard demanding a steeper discount over contract prices for 2016 citing these additional supplies. However, consistent exports through H1 ensured that spot prices within the continent are placed above the CPs.
Storage, shipping mold for exportsPersisting availability of vessels is also seen helping traders negotiate cheaper freight rates resulting in steeper margins while making shipments to the US or Asia. Freight for shipping butadiene to Asia was seen at $350/mt for the most of 2015, but the picture began to change by the end of 2015 as the scope for higher and more consistent olefins supplies from Europe brought in more gas carriers willing to negotiate freights.
“For large volumes over 5,000 mt, these gas carriers were willing to negotiate freight rates closer $300/mt,” a shipping broker said. Traders currently quote the rate for a trans-Atlantic voyage of butadiene at $160-200/mt which is a steep drop from $250/mt and higher figures registered in a similar period a year earlier.
The trend of availability of more ships on the trans-Atlantic route has become more pronounced with the shale gas boom in the US that has boosted its LPG exports over the past year. The specialized vessels have no other option on the return voyage but ferry butadiene or return without a parcel if there is no open arbitrage.
With arbitrages to the East and the West opening and closing intermittently, traders are trying to store butadiene for longer periods of time to be able to export as soon as the order is placed.
“They are storing volumes in special tanks called capsules,” a trader said. Butadiene quality may change depending on time and it tends to solidify if stored for an extended period. “There are two problems with storing butadiene – polymerization and dimerization. Polymerization may be stopped by adding a chemical inhibitor and dimerization by cooling the product well,” another trader said. Though the product is volatile, traders are now able to store it for a period as long as three months before the product is delivered to the end-consumer, the trader said.
As butadiene prices rose in Asia during H1, downstream styrene butadiene rubber prices also rose in the continent, opening an arbitrage from Europe. However the long-term SBR demand outlook for most grades of the product is bearish considering the pressure it faces from the mostly glutted natural rubber market. SBR 1500 and 1502, two of the largest traded grades of the product, act as replacement for natural rubber in tires. “We are currently not exporting SBR to Asia,” a Russian trader said adding that exports will be made to Asia as and when opportunities arise. Russia normally exports a major chunk of its production to Europe. — Shashank Shekhar; Edited by Maurice Geller
BOOM IN PRODUCTION MARGINS SET TO FALL IN THE STYRENICS CHAIN
European benzene demand will be supported by higher styrene production in the second half of 2016 amid limited reduction in demand from the acetone and phenol sector. Bearish factors overshadow elevated production margins in the styrene and PS/ABS markets, as a supply glut pressures styrene prices and weaker PS and ABS demand threaten producer margins.
Benzene demand strengthensIn H2 2016, the benzene market is expected to be supported by higher demand from the styrene market amid normal supply levels as production rates at NWE cracker margins are reduced from multi-year highs seen in 2015. This is in spite of several acetone and phenol turnarounds which will offset demand from styrene.
Market length seen in April and May will be reduced in H2 with the return of major styrene monomer units. In the second quarter, the benzene market saw length creeping in as turnarounds at Shell’s POSM-1 unit at Moerdijk, the Netherlands, and Trinseo’s unit at Boehlen, Germany reduced benzene demand. In addition, Total declared force majeure on its Gonfreville styrene unit in France due to a technical issue and labor strikes. This led to declines in the benzene price, while styrene prices reached the highest level since August 2015.
Nevertheless, both Trinseo and Shell have restarted their styrene units and Total was expected to return to normal operating rates. This will provide a much-needed channel for benzene demand and prices are expected to be supported in H2.
The turnarounds at acetone and phenol plants, other derivatives of benzene, also finished their maintenance works in June. Ineos Phenol and PKN Orlen conducted turnarounds at their
400
600
800
1000
1200
1400
Jun-16Apr-16Feb-16Dec-15Oct-15Aug-15Jun-15
($/mt)
EUROPE�ASIA ARBITRAGE WINDOW REMAINED OPEN FOR MOST OF H1
Source: S&P Global Platts
FOB R'dam CFR China
SPECIAL REPORT: PETROCHEMICALS EUROPEAN PETROCHEMICAL OUTLOOK H2 2016
5© 2016 S&P Global Platts, a division of S&P Global. All rights reserved.
respective units in Antwerp, Belgium, and Plock in Poland in May for approximately a month.
Despite this, there are several turnarounds planned for H2 in the phenol and acetone markets which will offset higher benzene demand from the styrene market. Novapex and Domo are expected to conduct maintenance works at their French Roussillon (185,000 mt/year phenol; 115,000 mt/year acetone) and German Leuna (180,000 mt/year phenol; 115,000 mt/year acetone) units in August. Although these units are relatively small, they will reduce benzene demand in H2. In addition, sources said that there were imports heading towards Europe, most notably from the Americas which will eat into European benzene demand.
Overall, the outlook for the benzene market for H2 is more bullish than Q2. The main driver will be the return of major styrene monomer units.
Styrene deflatesOn the flipside of bullish benzene will be a bearish styrene market in H2. The styrene market will see ample supply of styrene following the return of European units from maintenance works and higher imports from the US.
This is likely to place downward pressure on operating rates which were reported to have increased on a year-on-year basis. Trinseo said in its Q1 earnings call in early May that operating rates had increased globally this year. Global styrene operating rates were 84% in 2015, but European styrene operating rates were at 86% in May, with rates higher in the US and lower in Asia.
This was supported by the styrene premium over its feedstock benzene which has been on an upward trend for H1 (see chart). The premium averaged $324/mt in Q1 2016 and has averaged $431/mt to date in Q2. On June 1 the premium touched $580/mt, the highest level since August 2015, though it has been easing since.
Fundamentals in the styrene market are bearish for H2, with the return of Shell, Trinseo and Total in June. They have combined capacity of 1.4 million mt/year, approximately 20% of total European capacity, creating a “supply glut” in the market, according to one market source. In addition, imports from the
US are expected to arrive through June and July, which will place downward pressure on styrene prices in Europe. Sources said that there is still room for styrene prices to fall and that the lower floor for the styrene price level will be dictated by its premium to benzene.
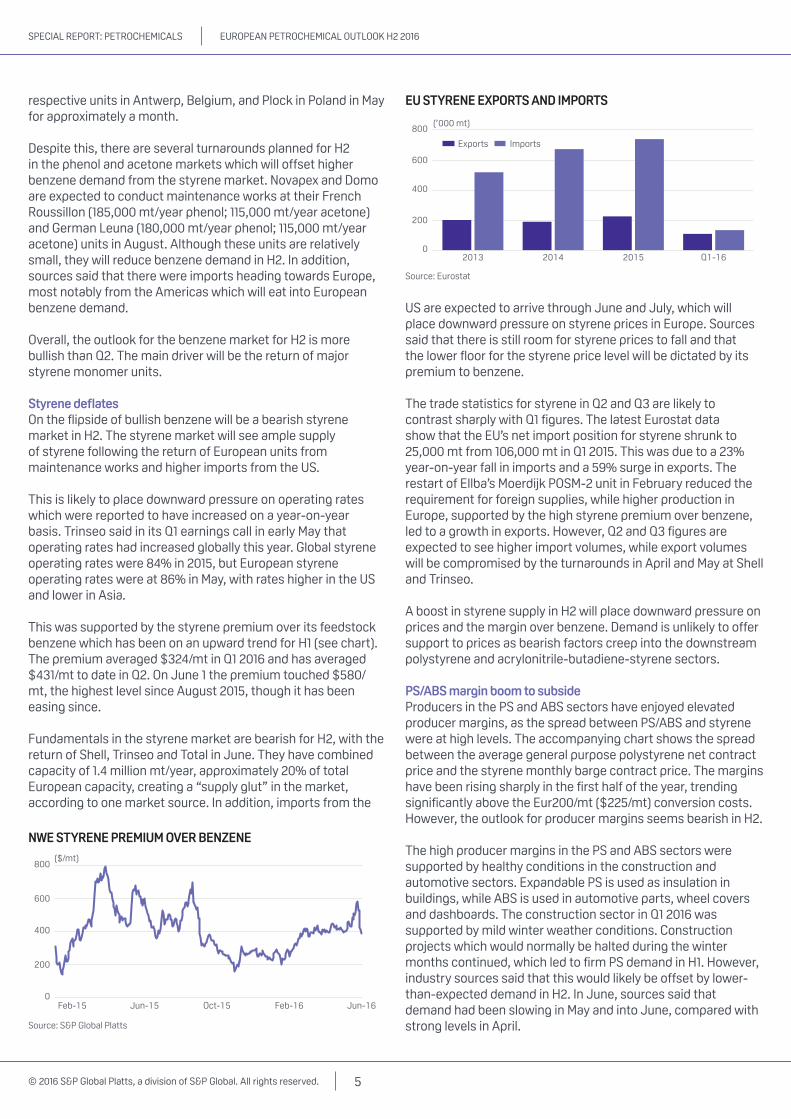
The trade statistics for styrene in Q2 and Q3 are likely to contrast sharply with Q1 figures. The latest Eurostat data show that the EU’s net import position for styrene shrunk to 25,000 mt from 106,000 mt in Q1 2015. This was due to a 23% year-on-year fall in imports and a 59% surge in exports. The restart of Ellba’s Moerdijk POSM-2 unit in February reduced the requirement for foreign supplies, while higher production in Europe, supported by the high styrene premium over benzene, led to a growth in exports. However, Q2 and Q3 figures are expected to see higher import volumes, while export volumes will be compromised by the turnarounds in April and May at Shell and Trinseo.
A boost in styrene supply in H2 will place downward pressure on prices and the margin over benzene. Demand is unlikely to offer support to prices as bearish factors creep into the downstream polystyrene and acrylonitrile-butadiene-styrene sectors.
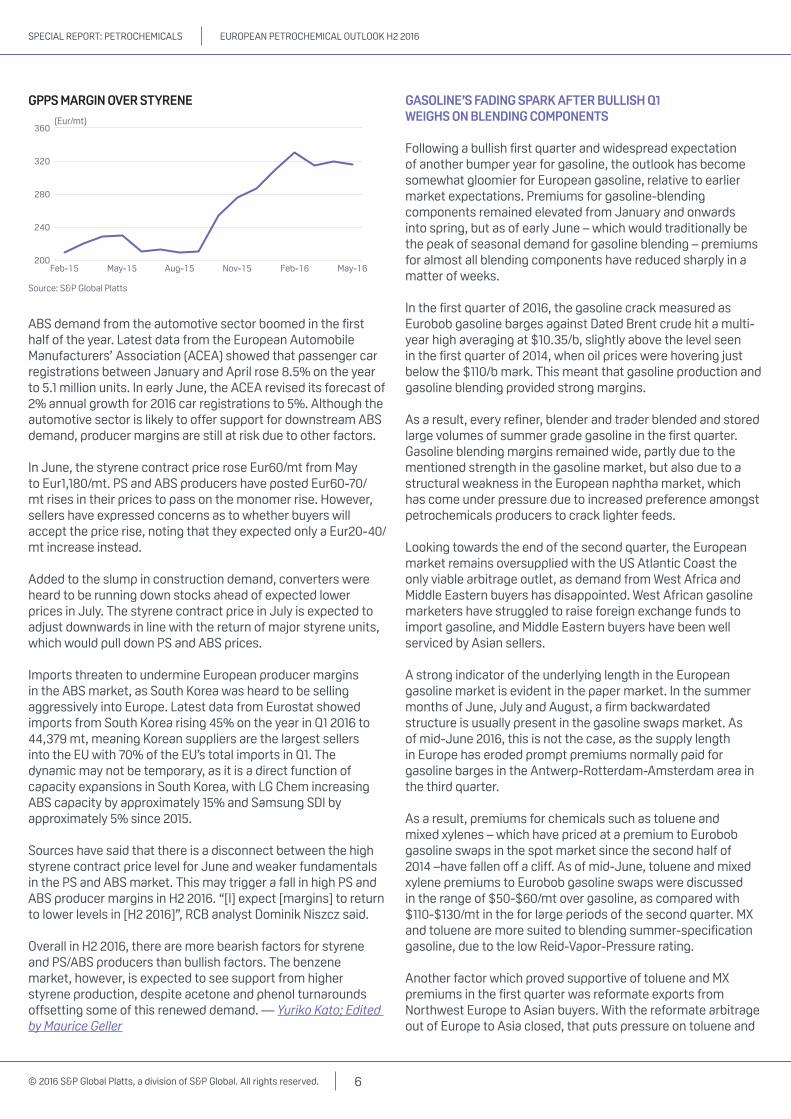
PS/ABS margin boom to subsideProducers in the PS and ABS sectors have enjoyed elevated producer margins, as the spread between PS/ABS and styrene were at high levels. The accompanying chart shows the spread between the average general purpose polystyrene net contract price and the styrene monthly barge contract price. The margins have been rising sharply in the first half of the year, trending significantly above the Eur200/mt ($225/mt) conversion costs. However, the outlook for producer margins seems bearish in H2.
The high producer margins in the PS and ABS sectors were supported by healthy conditions in the construction and automotive sectors. Expandable PS is used as insulation in buildings, while ABS is used in automotive parts, wheel covers and dashboards. The construction sector in Q1 2016 was supported by mild winter weather conditions. Construction projects which would normally be halted during the winter months continued, which led to firm PS demand in H1. However, industry sources said that this would likely be offset by lower-than-expected demand in H2. In June, sources said that demand had been slowing in May and into June, compared with strong levels in April.
0
200
400
600
800
Jun-16Feb-16Oct-15Jun-15Feb-15
($/mt)
NWE STYRENE PREMIUM OVER BENZENE
Source: S&P Global Platts
EU STYRENE EXPORTS AND IMPORTS
0
200
400
600
800
Q1-16201520142013
Source: Eurostat
(’000 mt)
Exports Imports
SPECIAL REPORT: PETROCHEMICALS EUROPEAN PETROCHEMICAL OUTLOOK H2 2016
6© 2016 S&P Global Platts, a division of S&P Global. All rights reserved.
ABS demand from the automotive sector boomed in the first half of the year. Latest data from the European Automobile Manufacturers’ Association (ACEA) showed that passenger car registrations between January and April rose 8.5% on the year to 5.1 million units. In early June, the ACEA revised its forecast of 2% annual growth for 2016 car registrations to 5%. Although the automotive sector is likely to offer support for downstream ABS demand, producer margins are still at risk due to other factors.
In June, the styrene contract price rose Eur60/mt from May to Eur1,180/mt. PS and ABS producers have posted Eur60-70/mt rises in their prices to pass on the monomer rise. However, sellers have expressed concerns as to whether buyers will accept the price rise, noting that they expected only a Eur20-40/mt increase instead.
Added to the slump in construction demand, converters were heard to be running down stocks ahead of expected lower prices in July. The styrene contract price in July is expected to adjust downwards in line with the return of major styrene units, which would pull down PS and ABS prices.
Imports threaten to undermine European producer margins in the ABS market, as South Korea was heard to be selling aggressively into Europe. Latest data from Eurostat showed imports from South Korea rising 45% on the year in Q1 2016 to 44,379 mt, meaning Korean suppliers are the largest sellers into the EU with 70% of the EU’s total imports in Q1. The dynamic may not be temporary, as it is a direct function of capacity expansions in South Korea, with LG Chem increasing ABS capacity by approximately 15% and Samsung SDI by approximately 5% since 2015.
Sources have said that there is a disconnect between the high styrene contract price level for June and weaker fundamentals in the PS and ABS market. This may trigger a fall in high PS and ABS producer margins in H2 2016. “[I] expect [margins] to return to lower levels in [H2 2016]”, RCB analyst Dominik Niszcz said.
Overall in H2 2016, there are more bearish factors for styrene and PS/ABS producers than bullish factors. The benzene market, however, is expected to see support from higher styrene production, despite acetone and phenol turnarounds offsetting some of this renewed demand. — Yuriko Kato; Edited by Maurice Geller
GASOLINE’S FADING SPARK AFTER BULLISH Q1 WEIGHS ON BLENDING COMPONENTS
Following a bullish first quarter and widespread expectation of another bumper year for gasoline, the outlook has become somewhat gloomier for European gasoline, relative to earlier market expectations. Premiums for gasoline-blending components remained elevated from January and onwards into spring, but as of early June – which would traditionally be the peak of seasonal demand for gasoline blending – premiums for almost all blending components have reduced sharply in a matter of weeks.
In the first quarter of 2016, the gasoline crack measured as Eurobob gasoline barges against Dated Brent crude hit a multi-year high averaging at $10.35/b, slightly above the level seen in the first quarter of 2014, when oil prices were hovering just below the $110/b mark. This meant that gasoline production and gasoline blending provided strong margins.
As a result, every refiner, blender and trader blended and stored large volumes of summer grade gasoline in the first quarter. Gasoline blending margins remained wide, partly due to the mentioned strength in the gasoline market, but also due to a structural weakness in the European naphtha market, which has come under pressure due to increased preference amongst petrochemicals producers to crack lighter feeds.
Looking towards the end of the second quarter, the European market remains oversupplied with the US Atlantic Coast the only viable arbitrage outlet, as demand from West Africa and Middle Eastern buyers has disappointed. West African gasoline marketers have struggled to raise foreign exchange funds to import gasoline, and Middle Eastern buyers have been well serviced by Asian sellers.
A strong indicator of the underlying length in the European gasoline market is evident in the paper market. In the summer months of June, July and August, a firm backwardated structure is usually present in the gasoline swaps market. As of mid-June 2016, this is not the case, as the supply length in Europe has eroded prompt premiums normally paid for gasoline barges in the Antwerp-Rotterdam-Amsterdam area in the third quarter.
As a result, premiums for chemicals such as toluene and mixed xylenes – which have priced at a premium to Eurobob gasoline swaps in the spot market since the second half of 2014 –have fallen off a cliff. As of mid-June, toluene and mixed xylene premiums to Eurobob gasoline swaps were discussed in the range of $50-$60/mt over gasoline, as compared with $110-$130/mt in the for large periods of the second quarter. MX and toluene are more suited to blending summer-specification gasoline, due to the low Reid-Vapor-Pressure rating.
Another factor which proved supportive of toluene and MX premiums in the first quarter was reformate exports from Northwest Europe to Asian buyers. With the reformate arbitrage out of Europe to Asia closed, that puts pressure on toluene and
200
240
280
320
360
May-16Feb-16Nov-15Aug-15May-15Feb-15
(Eur/mt)
GPPS MARGIN OVER STYRENE
Source: S&P Global Platts
SPECIAL REPORT: PETROCHEMICALS EUROPEAN PETROCHEMICAL OUTLOOK H2 2016
7© 2016 S&P Global Platts, a division of S&P Global. All rights reserved.
MX premiums for two reasons: reformate itself can be used as an octane booster in gasoline, and the feedstock to toluene and MX production also becomes longer in supply, feeding through into the premiums to gasoline swaps.
98 RON reformate barges have shed value since the end of April and are currently trading around $30-$40/mt over Eurobob gasoline barges, compared with $85/mt for most of April, Platts data shows.
MTBE and ETBE, as chemicals produced solely for gasoline blending, correlate even more strongly with gasoline-blending demand then MX and toluene. MTBE’s premium to Eurobob gasoline barges has averaged at around $108/mt in the second quarter as of mid-June, compared with $190/mt in 2015. It is however important to note that in the first quarter of 2015, large scale MTBE exports from Northwest Europe to the US Gulf Coast contributed to a tight MTBE market in the second quarter and an overall strong gasoline market.
MTBE exports from Europe have however not come near the levels seen in 2015, resulting in a long octanes market in Europe.
The refinery strikes in France in May and June only had a very short-term effect on the European gasoline market, which shifted into shallow backwardation for a matter of days, only to return to its flat-to-contango structure quickly.
Despite the gasoline market in Europe acting more bearishly than expected in the second quarter of 2016, gasoline cracks remain high compared to previous years. European traders don’t seem to hesitate to beat down the crack as soon as it looks like the arbitrage to the US Atlantic Coast looks like shutting close.
With the front-month Eurobob gasoline crack hovering around the $10/b mark, traders, refiners and blenders still have ample elbow room to take a hit on the crack in order to move product across the water. If gasoline-blending margins and gasoline cracks recede, premiums for gasoline-blending components are very likely to follow suit. — Thordur Gunnarsson; Edited by Maurice Geller
BULLISH ASIAN POLYOLEFINS, MTO DEMAND AND OIL PLAY INTO THE HANDS OF EUROPEAN METHANOL
For the European methanol market to recover from the current historic lows in the second half of 2016, two stars have to align – firmer crude oil and stronger Asian polyolefin prices.
Future projected growth in polyolefin demand in China, together with pre-2015 crude oil at $70-80/b or more drove a significant investment in coal- and methanol-to-olefins (CTO/MTO) technology. This, coupled with the capacity expansion by US-based methanol producers, ensured a degree of dependency as China olefins/polyolefins demand was expected to boost exports globally.
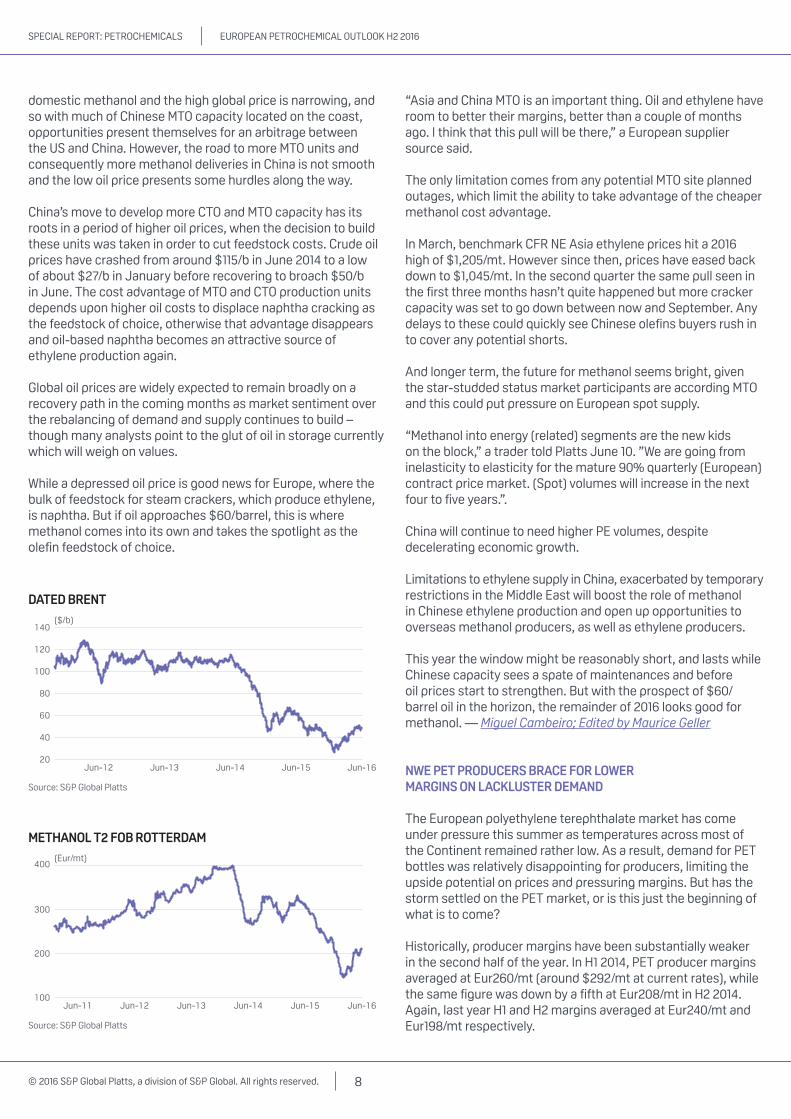
In the first quarter of 2016 European methanol spot prices hit a more than six-year low as a doubling of US capacity forced
a redirection of traditional North American imports from Latin America and the Caribbean, together with the excess US production.
Since then European supply has largely rebalanced and the trader fire-sale in the first quarter has dissipated. This was seen in the value of spot versus the contract price flattening in the second quarter. In February this relationship measured at a discount of 45% versus the first quarter contract price of Eur265/mt (about $298/mt at current prices) FOB Rotterdam. The subsequent lower Q2 CP of Eur202/mt has helped the spot market rebalance and flatten the spot-contract price relationship as buyers and those short-covering took advantage of the cheaper spot material.
Despite this, methanol spot prices have so far struggled to get back to the 2015 highs of around Eur300/mt FOB Rdam. For prices to recover, methanol traders are banking on MTO demand for support. As of June 10, Northwest European barges traded at Eur209/mt but some suggest that prices should continue on the upward path given the expectations for higher MTO production and the resultant methanol demand. That jump in MTO support could arrive as a portion of Asian crackers -- amounting to approximately a quarter of all capacity – were set to go down through the year. Naphtha and methanol are thus set to do battle for olefins supremacy in the second half of the year.
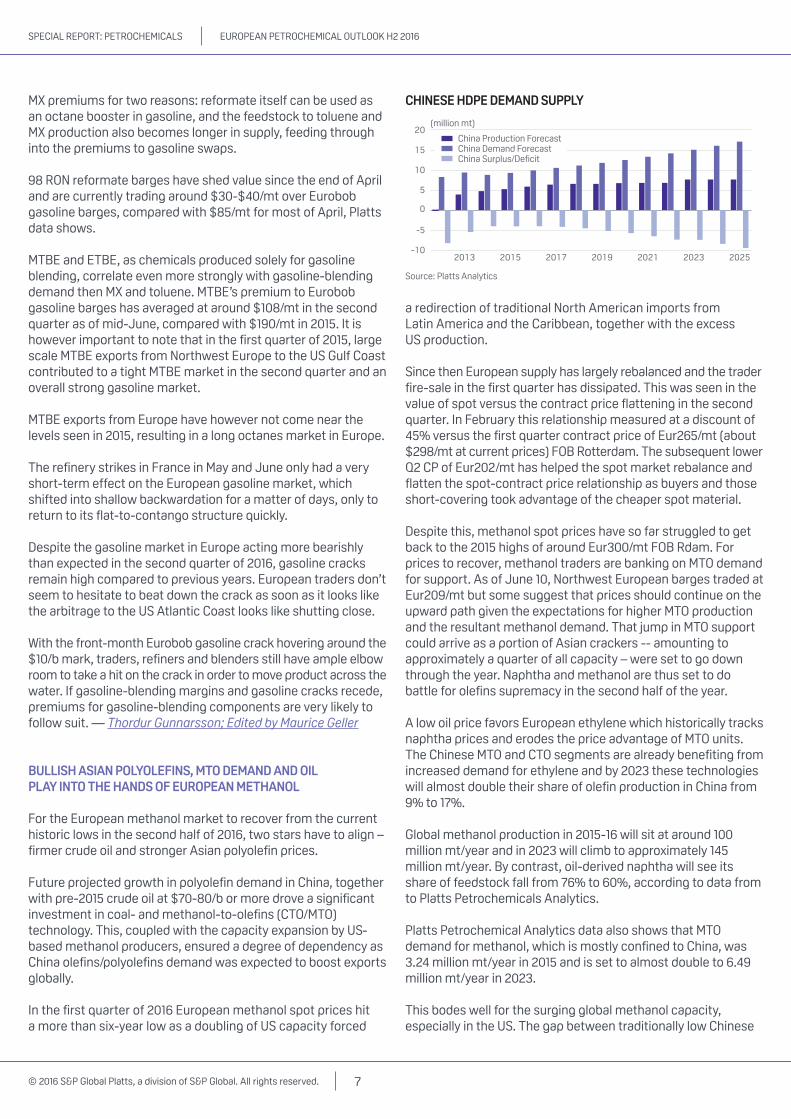
A low oil price favors European ethylene which historically tracks naphtha prices and erodes the price advantage of MTO units. The Chinese MTO and CTO segments are already benefiting from increased demand for ethylene and by 2023 these technologies will almost double their share of olefin production in China from 9% to 17%.
Global methanol production in 2015-16 will sit at around 100 million mt/year and in 2023 will climb to approximately 145 million mt/year. By contrast, oil-derived naphtha will see its share of feedstock fall from 76% to 60%, according to data from to Platts Petrochemicals Analytics.
Platts Petrochemical Analytics data also shows that MTO demand for methanol, which is mostly confined to China, was 3.24 million mt/year in 2015 and is set to almost double to 6.49 million mt/year in 2023.
This bodes well for the surging global methanol capacity, especially in the US. The gap between traditionally low Chinese
CHINESE HDPE DEMAND SUPPLY
-10
-5
0
5
10
15
20
2025202320212019201720152013
Source: Platts Analytics
(million mt)
China Production ForecastChina Demand ForecastChina Surplus/De�cit
SPECIAL REPORT: PETROCHEMICALS EUROPEAN PETROCHEMICAL OUTLOOK H2 2016
8© 2016 S&P Global Platts, a division of S&P Global. All rights reserved.
domestic methanol and the high global price is narrowing, and so with much of Chinese MTO capacity located on the coast, opportunities present themselves for an arbitrage between the US and China. However, the road to more MTO units and consequently more methanol deliveries in China is not smooth and the low oil price presents some hurdles along the way.
China’s move to develop more CTO and MTO capacity has its roots in a period of higher oil prices, when the decision to build these units was taken in order to cut feedstock costs. Crude oil prices have crashed from around $115/b in June 2014 to a low of about $27/b in January before recovering to broach $50/b in June. The cost advantage of MTO and CTO production units depends upon higher oil costs to displace naphtha cracking as the feedstock of choice, otherwise that advantage disappears and oil-based naphtha becomes an attractive source of ethylene production again.
Global oil prices are widely expected to remain broadly on a recovery path in the coming months as market sentiment over the rebalancing of demand and supply continues to build – though many analysts point to the glut of oil in storage currently which will weigh on values.
While a depressed oil price is good news for Europe, where the bulk of feedstock for steam crackers, which produce ethylene, is naphtha. But if oil approaches $60/barrel, this is where methanol comes into its own and takes the spotlight as the olefin feedstock of choice.
“Asia and China MTO is an important thing. Oil and ethylene have room to better their margins, better than a couple of months ago. I think that this pull will be there,” a European supplier source said.
The only limitation comes from any potential MTO site planned outages, which limit the ability to take advantage of the cheaper methanol cost advantage.
In March, benchmark CFR NE Asia ethylene prices hit a 2016 high of $1,205/mt. However since then, prices have eased back down to $1,045/mt. In the second quarter the same pull seen in the first three months hasn’t quite happened but more cracker capacity was set to go down between now and September. Any delays to these could quickly see Chinese olefins buyers rush in to cover any potential shorts.
And longer term, the future for methanol seems bright, given the star-studded status market participants are according MTO and this could put pressure on European spot supply.
“Methanol into energy (related) segments are the new kids on the block,” a trader told Platts June 10. ”We are going from inelasticity to elasticity for the mature 90% quarterly (European) contract price market. (Spot) volumes will increase in the next four to five years.”.
China will continue to need higher PE volumes, despite decelerating economic growth.
Limitations to ethylene supply in China, exacerbated by temporary restrictions in the Middle East will boost the role of methanol in Chinese ethylene production and open up opportunities to overseas methanol producers, as well as ethylene producers.
This year the window might be reasonably short, and lasts while Chinese capacity sees a spate of maintenances and before oil prices start to strengthen. But with the prospect of $60/barrel oil in the horizon, the remainder of 2016 looks good for methanol. — Miguel Cambeiro; Edited by Maurice Geller
NWE PET PRODUCERS BRACE FOR LOWER MARGINS ON LACKLUSTER DEMAND
The European polyethylene terephthalate market has come under pressure this summer as temperatures across most of the Continent remained rather low. As a result, demand for PET bottles was relatively disappointing for producers, limiting the upside potential on prices and pressuring margins. But has the storm settled on the PET market, or is this just the beginning of what is to come?
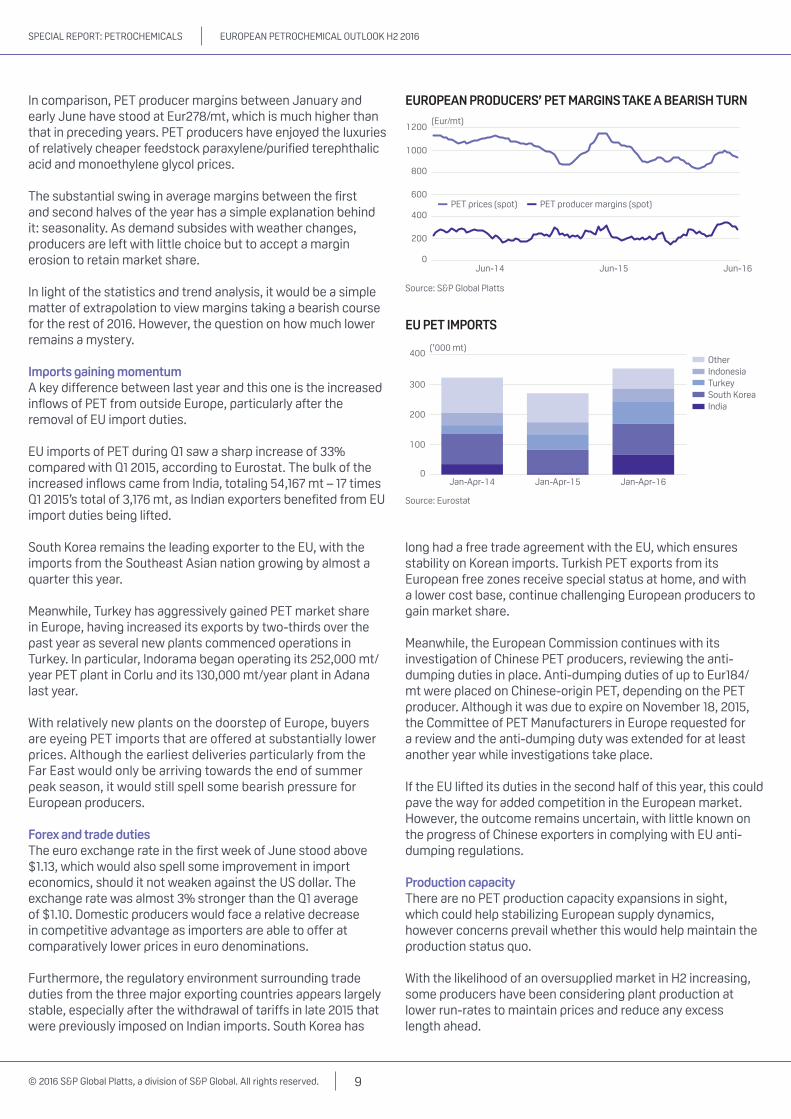
Historically, producer margins have been substantially weaker in the second half of the year. In H1 2014, PET producer margins averaged at Eur260/mt (around $292/mt at current rates), while the same figure was down by a fifth at Eur208/mt in H2 2014. Again, last year H1 and H2 margins averaged at Eur240/mt and Eur198/mt respectively.
20
40
60
80
100
120
140
Jun-16Jun-15Jun-14Jun-13Jun-12
($/b)
DATED BRENT
Source: S&P Global Platts
100
200
300
400
Jun-16Jun-15Jun-14Jun-13Jun-12Jun-11
(Eur/mt)
METHANOL T2 FOB ROTTERDAM
Source: S&P Global Platts
SPECIAL REPORT: PETROCHEMICALS EUROPEAN PETROCHEMICAL OUTLOOK H2 2016
9© 2016 S&P Global Platts, a division of S&P Global. All rights reserved.
In comparison, PET producer margins between January and early June have stood at Eur278/mt, which is much higher than that in preceding years. PET producers have enjoyed the luxuries of relatively cheaper feedstock paraxylene/purified terephthalic acid and monoethylene glycol prices.
The substantial swing in average margins between the first and second halves of the year has a simple explanation behind it: seasonality. As demand subsides with weather changes, producers are left with little choice but to accept a margin erosion to retain market share.
In light of the statistics and trend analysis, it would be a simple matter of extrapolation to view margins taking a bearish course for the rest of 2016. However, the question on how much lower remains a mystery.
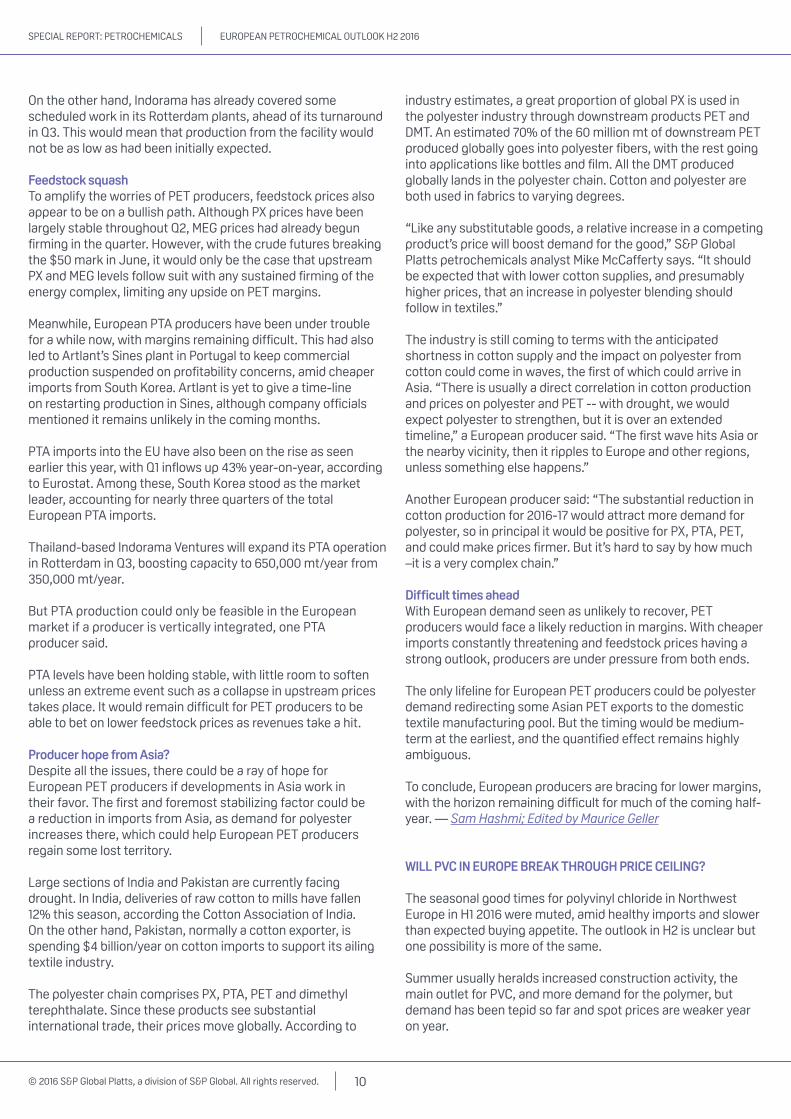
Imports gaining momentumA key difference between last year and this one is the increased inflows of PET from outside Europe, particularly after the removal of EU import duties.
EU imports of PET during Q1 saw a sharp increase of 33% compared with Q1 2015, according to Eurostat. The bulk of the increased inflows came from India, totaling 54,167 mt – 17 times Q1 2015’s total of 3,176 mt, as Indian exporters benefited from EU import duties being lifted.
South Korea remains the leading exporter to the EU, with the imports from the Southeast Asian nation growing by almost a quarter this year.
Meanwhile, Turkey has aggressively gained PET market share in Europe, having increased its exports by two-thirds over the past year as several new plants commenced operations in Turkey. In particular, Indorama began operating its 252,000 mt/year PET plant in Corlu and its 130,000 mt/year plant in Adana last year.
With relatively new plants on the doorstep of Europe, buyers are eyeing PET imports that are offered at substantially lower prices. Although the earliest deliveries particularly from the Far East would only be arriving towards the end of summer peak season, it would still spell some bearish pressure for European producers.
Forex and trade dutiesThe euro exchange rate in the first week of June stood above $1.13, which would also spell some improvement in import economics, should it not weaken against the US dollar. The exchange rate was almost 3% stronger than the Q1 average of $1.10. Domestic producers would face a relative decrease in competitive advantage as importers are able to offer at comparatively lower prices in euro denominations.
Furthermore, the regulatory environment surrounding trade duties from the three major exporting countries appears largely stable, especially after the withdrawal of tariffs in late 2015 that were previously imposed on Indian imports. South Korea has
long had a free trade agreement with the EU, which ensures stability on Korean imports. Turkish PET exports from its European free zones receive special status at home, and with a lower cost base, continue challenging European producers to gain market share.
Meanwhile, the European Commission continues with its investigation of Chinese PET producers, reviewing the anti-dumping duties in place. Anti-dumping duties of up to Eur184/mt were placed on Chinese-origin PET, depending on the PET producer. Although it was due to expire on November 18, 2015, the Committee of PET Manufacturers in Europe requested for a review and the anti-dumping duty was extended for at least another year while investigations take place.
If the EU lifted its duties in the second half of this year, this could pave the way for added competition in the European market. However, the outcome remains uncertain, with little known on the progress of Chinese exporters in complying with EU anti-dumping regulations.
Production capacityThere are no PET production capacity expansions in sight, which could help stabilizing European supply dynamics, however concerns prevail whether this would help maintain the production status quo.
With the likelihood of an oversupplied market in H2 increasing, some producers have been considering plant production at lower run-rates to maintain prices and reduce any excess length ahead.
0
200
400
600
800
1000
1200
Jun-16Jun-15Jun-14
(Eur/mt)
EUROPEAN PRODUCERS’ PET MARGINS TAKE A BEARISH TURN
Source: S&P Global Platts
PET prices (spot) PET producer margins (spot)
EU PET IMPORTS
0
100
200
300
400
Jan-Apr-16Jan-Apr-15Jan-Apr-14
Source: Eurostat
(’000 mt)OtherIndonesiaTurkeySouth KoreaIndia
SPECIAL REPORT: PETROCHEMICALS EUROPEAN PETROCHEMICAL OUTLOOK H2 2016
10© 2016 S&P Global Platts, a division of S&P Global. All rights reserved.
On the other hand, Indorama has already covered some scheduled work in its Rotterdam plants, ahead of its turnaround in Q3. This would mean that production from the facility would not be as low as had been initially expected.
Feedstock squashTo amplify the worries of PET producers, feedstock prices also appear to be on a bullish path. Although PX prices have been largely stable throughout Q2, MEG prices had already begun firming in the quarter. However, with the crude futures breaking the $50 mark in June, it would only be the case that upstream PX and MEG levels follow suit with any sustained firming of the energy complex, limiting any upside on PET margins.
Meanwhile, European PTA producers have been under trouble for a while now, with margins remaining difficult. This had also led to Artlant’s Sines plant in Portugal to keep commercial production suspended on profitability concerns, amid cheaper imports from South Korea. Artlant is yet to give a time-line on restarting production in Sines, although company officials mentioned it remains unlikely in the coming months.
PTA imports into the EU have also been on the rise as seen earlier this year, with Q1 inflows up 43% year-on-year, according to Eurostat. Among these, South Korea stood as the market leader, accounting for nearly three quarters of the total European PTA imports.
Thailand-based Indorama Ventures will expand its PTA operation in Rotterdam in Q3, boosting capacity to 650,000 mt/year from 350,000 mt/year.
But PTA production could only be feasible in the European market if a producer is vertically integrated, one PTA producer said.
PTA levels have been holding stable, with little room to soften unless an extreme event such as a collapse in upstream prices takes place. It would remain difficult for PET producers to be able to bet on lower feedstock prices as revenues take a hit.
Producer hope from Asia?Despite all the issues, there could be a ray of hope for European PET producers if developments in Asia work in their favor. The first and foremost stabilizing factor could be a reduction in imports from Asia, as demand for polyester increases there, which could help European PET producers regain some lost territory.
Large sections of India and Pakistan are currently facing drought. In India, deliveries of raw cotton to mills have fallen 12% this season, according the Cotton Association of India. On the other hand, Pakistan, normally a cotton exporter, is spending $4 billion/year on cotton imports to support its ailing textile industry.
The polyester chain comprises PX, PTA, PET and dimethyl terephthalate. Since these products see substantial international trade, their prices move globally. According to
industry estimates, a great proportion of global PX is used in the polyester industry through downstream products PET and DMT. An estimated 70% of the 60 million mt of downstream PET produced globally goes into polyester fibers, with the rest going into applications like bottles and film. All the DMT produced globally lands in the polyester chain. Cotton and polyester are both used in fabrics to varying degrees.
“Like any substitutable goods, a relative increase in a competing product’s price will boost demand for the good,” S&P Global Platts petrochemicals analyst Mike McCafferty says. “It should be expected that with lower cotton supplies, and presumably higher prices, that an increase in polyester blending should follow in textiles.”
The industry is still coming to terms with the anticipated shortness in cotton supply and the impact on polyester from cotton could come in waves, the first of which could arrive in Asia. “There is usually a direct correlation in cotton production and prices on polyester and PET -- with drought, we would expect polyester to strengthen, but it is over an extended timeline,” a European producer said. “The first wave hits Asia or the nearby vicinity, then it ripples to Europe and other regions, unless something else happens.”
Another European producer said: “The substantial reduction in cotton production for 2016-17 would attract more demand for polyester, so in principal it would be positive for PX, PTA, PET, and could make prices firmer. But it’s hard to say by how much –it is a very complex chain.”
Difficult times aheadWith European demand seen as unlikely to recover, PET producers would face a likely reduction in margins. With cheaper imports constantly threatening and feedstock prices having a strong outlook, producers are under pressure from both ends.
The only lifeline for European PET producers could be polyester demand redirecting some Asian PET exports to the domestic textile manufacturing pool. But the timing would be medium-term at the earliest, and the quantified effect remains highly ambiguous.
To conclude, European producers are bracing for lower margins, with the horizon remaining difficult for much of the coming half-year. — Sam Hashmi; Edited by Maurice Geller
WILL PVC IN EUROPE BREAK THROUGH PRICE CEILING?
The seasonal good times for polyvinyl chloride in Northwest Europe in H1 2016 were muted, amid healthy imports and slower than expected buying appetite. The outlook in H2 is unclear but one possibility is more of the same.
Summer usually heralds increased construction activity, the main outlet for PVC, and more demand for the polymer, but demand has been tepid so far and spot prices are weaker year on year.
SPECIAL REPORT: PETROCHEMICALS EUROPEAN PETROCHEMICAL OUTLOOK H2 2016
11© 2016 S&P Global Platts, a division of S&P Global. All rights reserved.
Shipments from the US played a significant role in boosting imports in Q1, according to data from Eurostat, which added to spot volumes. Some of this material is still on the market, sources said. US market sources say production in the region may continue strong and this leaves the door open for lower US prices and higher volumes of shipments to Europe.
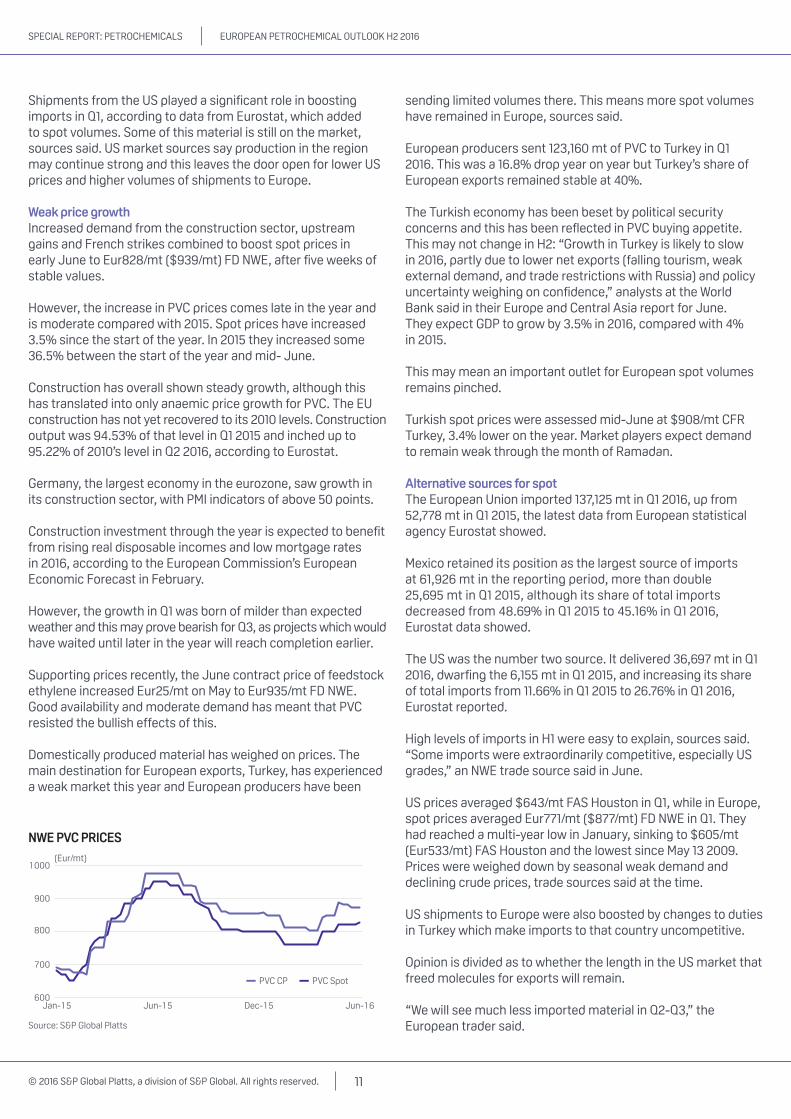
Weak price growthIncreased demand from the construction sector, upstream gains and French strikes combined to boost spot prices in early June to Eur828/mt ($939/mt) FD NWE, after five weeks of stable values.
However, the increase in PVC prices comes late in the year and is moderate compared with 2015. Spot prices have increased 3.5% since the start of the year. In 2015 they increased some 36.5% between the start of the year and mid- June.
Construction has overall shown steady growth, although this has translated into only anaemic price growth for PVC. The EU construction has not yet recovered to its 2010 levels. Construction output was 94.53% of that level in Q1 2015 and inched up to 95.22% of 2010’s level in Q2 2016, according to Eurostat.
Germany, the largest economy in the eurozone, saw growth in its construction sector, with PMI indicators of above 50 points.
Construction investment through the year is expected to benefit from rising real disposable incomes and low mortgage rates in 2016, according to the European Commission’s European Economic Forecast in February.
However, the growth in Q1 was born of milder than expected weather and this may prove bearish for Q3, as projects which would have waited until later in the year will reach completion earlier.
Supporting prices recently, the June contract price of feedstock ethylene increased Eur25/mt on May to Eur935/mt FD NWE. Good availability and moderate demand has meant that PVC resisted the bullish effects of this.
Domestically produced material has weighed on prices. The main destination for European exports, Turkey, has experienced a weak market this year and European producers have been
sending limited volumes there. This means more spot volumes have remained in Europe, sources said.
European producers sent 123,160 mt of PVC to Turkey in Q1 2016. This was a 16.8% drop year on year but Turkey’s share of European exports remained stable at 40%.
The Turkish economy has been beset by political security concerns and this has been reflected in PVC buying appetite. This may not change in H2: “Growth in Turkey is likely to slow in 2016, partly due to lower net exports (falling tourism, weak external demand, and trade restrictions with Russia) and policy uncertainty weighing on confidence,” analysts at the World Bank said in their Europe and Central Asia report for June. They expect GDP to grow by 3.5% in 2016, compared with 4% in 2015.
This may mean an important outlet for European spot volumes remains pinched.
Turkish spot prices were assessed mid-June at $908/mt CFR Turkey, 3.4% lower on the year. Market players expect demand to remain weak through the month of Ramadan.
Alternative sources for spotThe European Union imported 137,125 mt in Q1 2016, up from 52,778 mt in Q1 2015, the latest data from European statistical agency Eurostat showed.
Mexico retained its position as the largest source of imports at 61,926 mt in the reporting period, more than double 25,695 mt in Q1 2015, although its share of total imports decreased from 48.69% in Q1 2015 to 45.16% in Q1 2016, Eurostat data showed.
The US was the number two source. It delivered 36,697 mt in Q1 2016, dwarfing the 6,155 mt in Q1 2015, and increasing its share of total imports from 11.66% in Q1 2015 to 26.76% in Q1 2016, Eurostat reported.
High levels of imports in H1 were easy to explain, sources said. “Some imports were extraordinarily competitive, especially US grades,” an NWE trade source said in June.
US prices averaged $643/mt FAS Houston in Q1, while in Europe, spot prices averaged Eur771/mt ($877/mt) FD NWE in Q1. They had reached a multi-year low in January, sinking to $605/mt (Eur533/mt) FAS Houston and the lowest since May 13 2009. Prices were weighed down by seasonal weak demand and declining crude prices, trade sources said at the time.
US shipments to Europe were also boosted by changes to duties in Turkey which make imports to that country uncompetitive.
Opinion is divided as to whether the length in the US market that freed molecules for exports will remain.
“We will see much less imported material in Q2-Q3,” the European trader said.
600
700
800
900
1000
Jun-16Dec-15Jun-15Jan-15
(Eur/mt)
NWE PVC PRICES
Source: S&P Global Platts
PVC SpotPVC CP
SPECIAL REPORT: PETROCHEMICALS EUROPEAN PETROCHEMICAL OUTLOOK H2 2016
12© 2016 S&P Global Platts, a division of S&P Global. All rights reserved.
However, some US sources say length may continue in the US market going forwards. US prices were assessed at $735/mt FAS Houston early June, 6.37% lower on the year. They were not expected to rise significantly through July and possibly August, at which point demand will start to decrease, in line with seasonal trends, US sources said.
European PVC will likely see feedstock rises. Most domestic production of feedstock ethylene is naphtha based, which in turn is affected by upstream crude oil. The US Energy Information administration’s June forecasts for Brent crude oil prices are $46/b in Q3 2016 and $47/b in Q4 2016. In June, front-month ICE Brent futures broached $50/b.
The outlook for ethylene is increased length in the market as the year wears on and this may cause a decrease in the olefin’s prices.
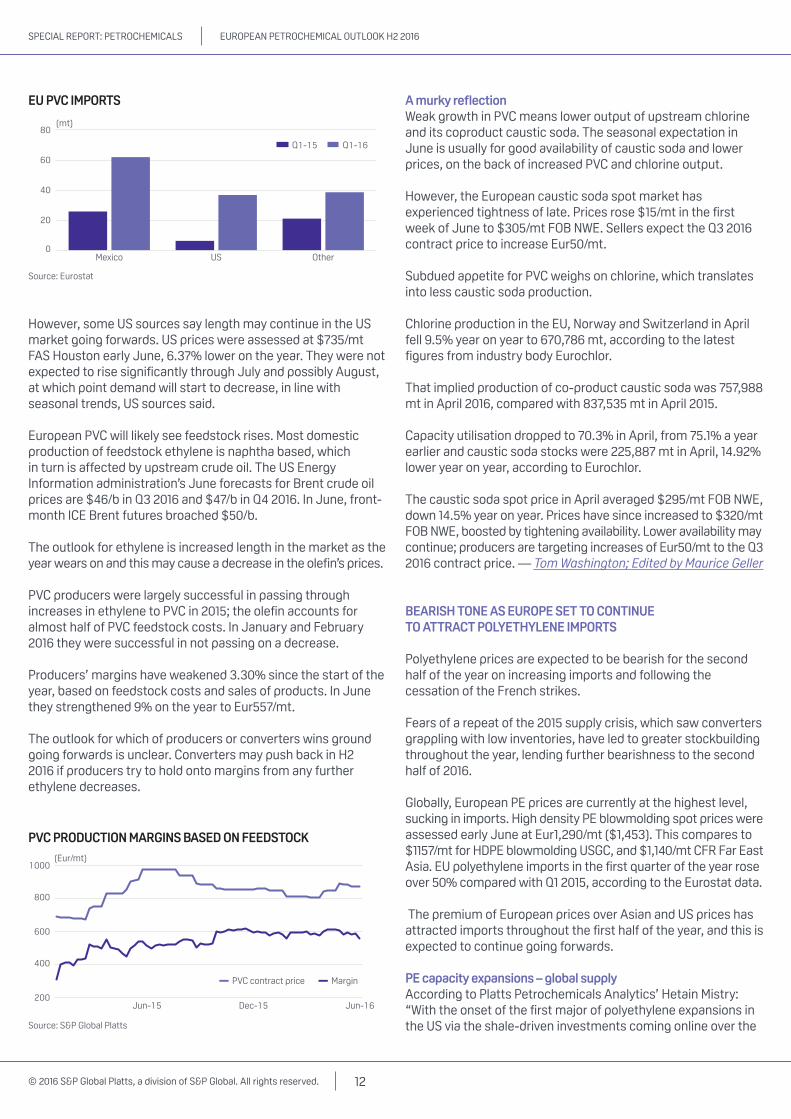
PVC producers were largely successful in passing through increases in ethylene to PVC in 2015; the olefin accounts for almost half of PVC feedstock costs. In January and February 2016 they were successful in not passing on a decrease.
Producers’ margins have weakened 3.30% since the start of the year, based on feedstock costs and sales of products. In June they strengthened 9% on the year to Eur557/mt.
The outlook for which of producers or converters wins ground going forwards is unclear. Converters may push back in H2 2016 if producers try to hold onto margins from any further ethylene decreases.
A murky reflectionWeak growth in PVC means lower output of upstream chlorine and its coproduct caustic soda. The seasonal expectation in June is usually for good availability of caustic soda and lower prices, on the back of increased PVC and chlorine output.
However, the European caustic soda spot market has experienced tightness of late. Prices rose $15/mt in the first week of June to $305/mt FOB NWE. Sellers expect the Q3 2016 contract price to increase Eur50/mt.
Subdued appetite for PVC weighs on chlorine, which translates into less caustic soda production.
Chlorine production in the EU, Norway and Switzerland in April fell 9.5% year on year to 670,786 mt, according to the latest figures from industry body Eurochlor.
That implied production of co-product caustic soda was 757,988 mt in April 2016, compared with 837,535 mt in April 2015.
Capacity utilisation dropped to 70.3% in April, from 75.1% a year earlier and caustic soda stocks were 225,887 mt in April, 14.92% lower year on year, according to Eurochlor.
The caustic soda spot price in April averaged $295/mt FOB NWE, down 14.5% year on year. Prices have since increased to $320/mt FOB NWE, boosted by tightening availability. Lower availability may continue; producers are targeting increases of Eur50/mt to the Q3 2016 contract price. — Tom Washington; Edited by Maurice Geller
BEARISH TONE AS EUROPE SET TO CONTINUE TO ATTRACT POLYETHYLENE IMPORTS
Polyethylene prices are expected to be bearish for the second half of the year on increasing imports and following the cessation of the French strikes.
Fears of a repeat of the 2015 supply crisis, which saw converters grappling with low inventories, have led to greater stockbuilding throughout the year, lending further bearishness to the second half of 2016.
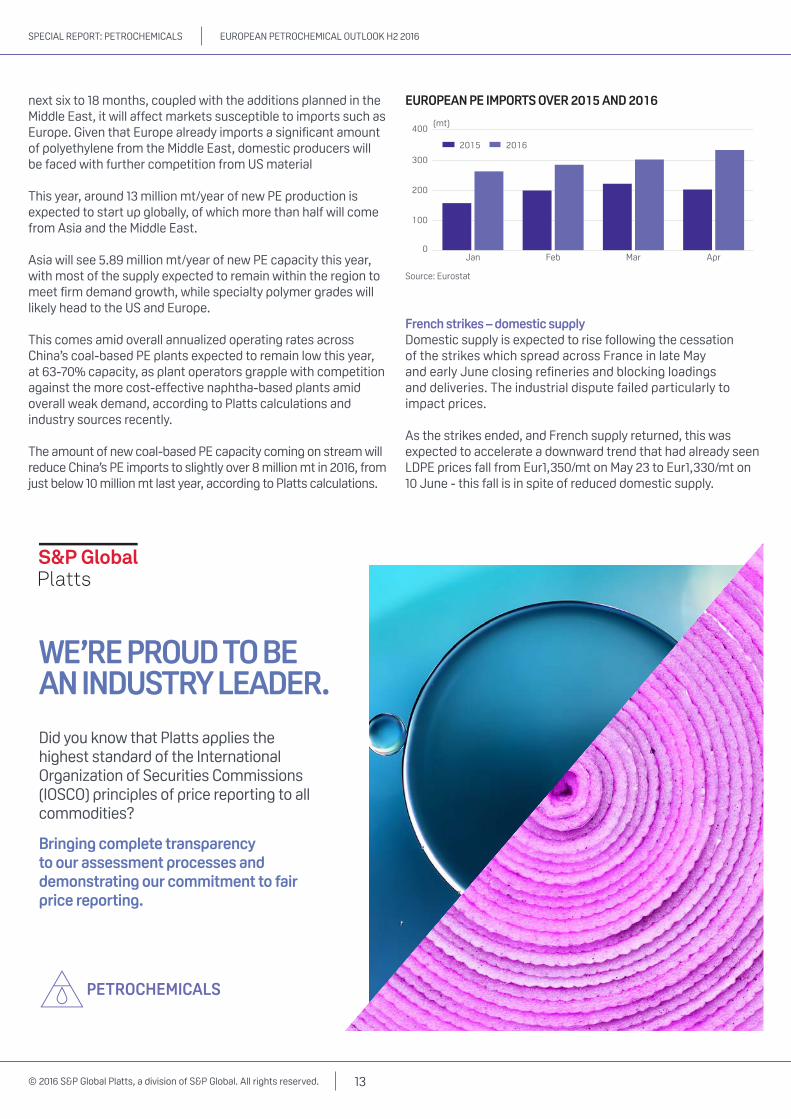
Globally, European PE prices are currently at the highest level, sucking in imports. High density PE blowmolding spot prices were assessed early June at Eur1,290/mt ($1,453). This compares to $1157/mt for HDPE blowmolding USGC, and $1,140/mt CFR Far East Asia. EU polyethylene imports in the first quarter of the year rose over 50% compared with Q1 2015, according to the Eurostat data.
The premium of European prices over Asian and US prices has attracted imports throughout the first half of the year, and this is expected to continue going forwards.
PE capacity expansions – global supplyAccording to Platts Petrochemicals Analytics’ Hetain Mistry: “With the onset of the first major of polyethylene expansions in the US via the shale-driven investments coming online over the
EU PVC IMPORTS
0
20
40
60
80
OtherUSMexico
Source: Eurostat
(mt)
Q1-15 Q1-16
200
400
600
800
1000
Jun-16Dec-15Jun-15
(Eur/mt)
PVC PRODUCTION MARGINS BASED ON FEEDSTOCK
Source: S&P Global Platts
MarginPVC contract price
SPECIAL REPORT: PETROCHEMICALS EUROPEAN PETROCHEMICAL OUTLOOK H2 2016
13© 2016 S&P Global Platts, a division of S&P Global. All rights reserved.
next six to 18 months, coupled with the additions planned in the Middle East, it will affect markets susceptible to imports such as Europe. Given that Europe already imports a significant amount of polyethylene from the Middle East, domestic producers will be faced with further competition from US material
This year, around 13 million mt/year of new PE production is expected to start up globally, of which more than half will come from Asia and the Middle East.
Asia will see 5.89 million mt/year of new PE capacity this year, with most of the supply expected to remain within the region to meet firm demand growth, while specialty polymer grades will likely head to the US and Europe.
This comes amid overall annualized operating rates across China’s coal-based PE plants expected to remain low this year, at 63-70% capacity, as plant operators grapple with competition against the more cost-effective naphtha-based plants amid overall weak demand, according to Platts calculations and industry sources recently.
The amount of new coal-based PE capacity coming on stream will reduce China’s PE imports to slightly over 8 million mt in 2016, from just below 10 million mt last year, according to Platts calculations.
French strikes – domestic supplyDomestic supply is expected to rise following the cessation of the strikes which spread across France in late May and early June closing refineries and blocking loadings and deliveries. The industrial dispute failed particularly to impact prices.
As the strikes ended, and French supply returned, this was expected to accelerate a downward trend that had already seen LDPE prices fall from Eur1,350/mt on May 23 to Eur1,330/mt on 10 June - this fall is in spite of reduced domestic supply.
WE’RE PROUD TO BE AN INDUSTRY LEADER.
Did you know that Platts applies the highest standard of the International Organization of Securities Commissions (IOSCO) principles of price reporting to all commodities?
Bringing complete transparency to our assessment processes and demonstrating our commitment to fair price reporting.
EUROPEAN PE IMPORTS OVER 2015 AND 2016
0
100
200
300
400
AprMarFebJan
Source: Eurostat
(mt)
2015 2016
SPECIAL REPORT: PETROCHEMICALS EUROPEAN PETROCHEMICAL OUTLOOK H2 2016
14© 2016 S&P Global Platts, a division of S&P Global. All rights reserved.
In May, Total and Ineos declared force majeure on deliveries from all their polymer sites in France as the national strike and associated blockades of industrial areas of Gonfreville, Carling and Lavera prevented them from fulfilling contractual obligations.
But the strikes occurred amid high inventories in the polyethylene market. In fact, the inventories more than offset the potential price increase from reduced supply from the strikes, causing LDPE prices to fall from Eur1,350/mt on May 23, to Eur1,330/mt on 10 June.
Further upstream, the Naphthachimie steam cracker in Lavera declared force majeure on ethylene production. Total ethylene capacity in France is 2.79 million mt, 10% of Western European capacity.
The return of French supply comes amid high margins. Over Q1 2016, the European low density polyethylene/ethylene margin averaged Eur600/mt, compared with Eur344/mt in Q1 2015. With margins so high, with many steam crackers emerging from turnaround – such as Dow’s 560,000 mt/year Bohlen facility and BASF’s 660,000 mt/year Ludwighsafen, site in Germany – and with the impending return of French supply, polyethylene prices are expected to ease in the second half of the year.
Need for inventoriesIn May, the head of the Polymers for Europe Alliance, Ron Marsh, said that EU tariff suspension and quota laws were failing EU plastics converters.
Plastics converters submitted 45 requests for tariff suspensions and quotas in seven EU member states in 2015 following the revision of EU Generalized Scheme of Preferences. On January 1, 2014, EU custom tariffs for plastic imports more than doubled to 6.5% from 3%, after the EU revised its Generalized Scheme of Preferences, yet this has done little to reassure industry concerns that a wave of imports are on their way.
With the history of the severe production shortages in 2015 still fresh in their minds, market participants have been keen to build inventories.
As import availability continues to grow, wary European converters will look to competitive tons coming from the Middle East and the US, in a bid to build the level of inventory necessary to shrug off domestic shocks. — Daved Chohan; Edited by Maurice Geller
EUROPEAN PROPYLENE BALANCE EXPECTED TO HOLD LENGTH ON GLOBAL CAPACITY INCREASES
Europe, formerly home of a balanced propylene market, is establishing itself as one at length this year. This is not the result of a direct change in fundamentals within the continent but instead a result of supply growth outside of it.
Growing supplies in the global propylene market are expected to continue and this has led to petrochemical majors questioning their investment decisions. BASF delayed its decision on a
planned methanol-to-propylene plant in Freeport, Texas, in June. The unit with 475,000 mt/year of propylene output would mark the first methanol-to-propylene plant in the US, but the company said it delayed the investment decision planned for this year due to “the current volatility of raw material prices and the prevailing economic environment.”
“[There is] too much propane in the US, too many PDH [propane dehydrogenation] projects in that environment, MTP is too expensive,” HSBC analyst Sriharsha Pappu said.
Against other on-purpose propylene production methods standalone MTP production ranks as the most expensive, with PDH production in the US Gulf as the cheapest, followed by coal to olefins production in China.
Feedstock costs for US PDH plant operators have fallen since a H2 2014 crash in propane. US propane prices average 43.5 cents/lb or $227/mt in 2016 this far, compared with an average of 103.8 cents/lb ($541/mt) in 2014.
North American PDH capacity is set to increase to 2.8 million mt/year in 2018 from around 500,000 mt/year in 2013.
Asian PDH capacity is expected to increase to 10 million mt/year from around 2.5 million mt/year in 2013. Meanwhile in Asia, China has seen significant expansion of methanol-to-olefins capacity, with 13 MTO and MTP plants with an annual methanol consumption of 12 million mt/year. The country should see the start-up of an additional four plants this year with a combined methanol consumption of 6.5 million mt/year.
Propylene is traditionally produced as a by-product of steam crackers, which take in feeds such as naphtha and LPGs for the production of ethylene.
However, alternative on-purpose production has been seen where needed, which includes PDH and coal/methanol to propylene. Another traditional source of propylene has been as a by-product of fluid catalytic cracking units in refineries.
The US and Asia have led the wave of investment in PDH capacity expansion, expecting higher growth of the propylene value chain versus the ethylene value chain and the lack of future supply coming from traditional routes, namely co-product cracking amid increased ethane cracking in the US.
Propylene yield from refineries risesThe economics of new propylene capacity in the US are uncertain, according to Joe Pilaro of New York based-consultancy BRAE Partners, due to conditions in the US shale gas business (leading to increases in propane supplies) and the increased production of refinery propylene.
“I believe that gasoline demand in the US is on the rise because prices are the lowest they have been in over five years just when people are setting summer holiday plans. Refineries are increasing gasoline production and that results in an increase in propylene output,” he said.
SPECIAL REPORT: PETROCHEMICALS EUROPEAN PETROCHEMICAL OUTLOOK H2 2016
15© 2016 S&P Global Platts, a division of S&P Global. All rights reserved.
HSBC’s Pappu added that some of the increase in propylene supplies in US and globally was amid “higher refining run rates,” leading to higher propylene production.
Lower gasoline prices bringing increased gasoline demand has, in turn, resulted in higher refinery-grade propylene. The rise in production helped contribute to higher inventories early this year.
Propylene stocks for non-fuel use were at 3.859 million barrels for the week ending May 27, US Energy Information Administration data showed. Stocks have climbed 22% since the beginning of the year where they were at 3.152 million barrels.
US propylene markets generally move in unison. RGP is sourced from refineries and can be further purified into PGP, or it can be used in the production of alkylate, a high-value gasoline blend stock.
Propylene price stumblesPropylene prices have been steadily falling since 2014 amid capacity additions and falls in crude.
Propylene spot prices have averaged $647/mt FD USG, $687/mt CFR China and $620/mt CIF NWE across 2016. In comparison, these averaged over double those levels through 2014 at $1,500/mt, $1,348/mt and $1,432/mt respectively.
European capacity lags, imports aidIn Europe, no new capacity has been seen of late. Supply had lengthened on attractive import offers, a result of Asia and the US becoming more self-sufficient as well as strong domestic refinery run rates.
The European Union imported 95,643 mt of propylene in Q1 of this year, over 70% above the 55,938 mt imported in the same quarter of 2015.
Russian exports of propylene to Europe boomed, more than doubling on the year to 29,534 mt in Q1 from 13,079 mt a year earlier.
Russian propylene has met with more interest in Europe this year as a high water content, which had previously left some EU buyers uninterested, was being reduced from shipments.
A European trade source cited EU refinery run rates to the length seen this year so far, “I think refineries had really good run rates in past months and therefore we had good propylene production and the supply build-up.”
Grupy Azoty said in 2015 it planned to build a 400,000 mt/year PDH plant at Police, Poland, by 2019. “We will examine the case closely from the side of the technology and market competitiveness. At this stage we are not changing our approach to our investment,” a company spokeswoman said early June.
Polypropylene demand not expected to remove lengthEuropean production of propylene’s major derivative, polypropylene, may slow as prices fall amid high converter inventory levels and an abundance of competitive import offers.
High imports and plentiful stocks of polypropylene had protected European converters from supply shocks early summer, keeping a ceiling on prices. “We look at what price level imports make sense and do not go above it,” a producer source said.
According to Platts Petrochemicals Analytics, Europe had been at a slim 226,000 mt supply surplus in 2015. The implication is that a single plant outage may leave Europe at a deficit – but the series of force majeures across France in May and June, as a result of strike action, had not managed to dent converter confidence. The price stability reflects abundant imports, as reported by European statistics agency Eurostat. Imports of PP have risen from the Middle East, Russia and Asia.
EU PP imports in the first quarter of the year rose 43% compared against Q1 2015. Imports rose from 215,197 mt in Q1 last year to 308,338 mt in Q1 2016.
This trend looks likely to remain as a greater availability of imports to Europe has been attributed to new capacity in regions where even further growth is expected.
The Middle East looks outward, strengthening itself as a pivotal exporter in the coming years. A 400,000 mt/year PP unit from the new Sadara Chemical facility in Saudi Arabia will push additional supplies onto the market in 2016. In Iran, a 450,000 mt/year Mehr petrochemical facility at Assaluyeh is expected to start operations in 2017, and the 300,000 mt/year Khomein petrochemicals facility at Khomein will commence operations the following year.
Asia is expected to hold a PP production capacity 41.4 million mt by the end of 2016 an increase of 16% from 2015, where production stood at 35.8 million mt.
Cheaper European deliveries from Asia were heard in May, a month after China added 650,000 mt/year of polypropylene production.
A 350,000 mt/year Fujian Meide Petrochemical plant started in early April, followed by China Coal Mengda New Energy’s 300,000 mt/year coal-to-olefins, or CTO, plant in mid-April.
As China increases domestic PP output, traditional exporters to China, such as South Korea, are finding it difficult to maintain market share and therefore look to other regions, such as Europe to take up the slack.
In Russia, two PP plants were commissioned in 2014: Omsk-based Poliom plant (owned by the Titan Group, Sibur and Gazprom Neft), which was put into operation in February 2013, and Tobolsk-Polymer (Sibur) in the Tyumen Region, which was commissioned in October 2013.
Russia became a net exporter of polypropylene in 2014 and is expected to cement that position as current PP surpluses of around 200,000 mt rise to 500,000 mt by 2017, according to Platts Petrochemical Analytics data. This on the introduction of Nizhnekamskneftekhim’s Tatarstan plant, due to begin 400,000 mt of polypropylene production in 2017. — Amar Carmody; Edited by Maurice Geller
SPECIAL REPORT: PETROCHEMICALS EUROPEAN PETROCHEMICAL OUTLOOK H2 2016
16© 2016 S&P Global Platts, a division of S&P Global. All rights reserved.
For more information, please visit us online or speak to one of our sales specialists:
www.platts.com | [email protected]
NORTH AMERICA +1-800-PLATTS8 (toll-free) +1-212-904-3070 (direct)
EMEA +44-(0)20-7176-6111
LATIN AMERICA +55-11-3371-5755
ASIA-PACIFIC +65-6530-6430
RUSSIA +7-495-783-4141


