68
European Real SnapShot! Current developments in the key real estate markets in Europe Special focus: Logistics Spring 2016

European Real SnapShot!Current developments in the key real estate markets in Europe
Special focus: Logistics
Spring 2016

© 2016 KPMG Holding AG/SA, a Swiss corporation, is a member of the KPMG network of independent firms affiliated with KPMG International Cooperative (“KPMG International”), a Swiss legal entity. All rights reserved. Printed in Switzerland. The KPMG name and logo are registered trademarks.

Content6 35
16 43
29 56
10 39
25 50
19 48
31 61
FranceAn excellent recovery after a disappointing start
Switzerland There is no means of avoiding real estate
Germany Stable economic data fuel real estate
Italy Out of the doldrums?
Belgium On a path of economic recovery
Russia A time of challenges and opportunities
United Kingdom Continued growth, with downside risks for the months ahead
Austria A stable market supported by a sustainable economy
The Netherlands Positive economic outlook
CEE Real estate investment volume increasing for three years in a row
Nordic Region Cross-border investors taking advantage of currency movements
Spain One of Europe’s fastest growing economies
Luxembourg Another strong year for the real estate sector
Turkey Istanbul continues to be a centre of attraction for investors
© 2016 KPMG Holding AG/SA, a Swiss corporation, is a member of the KPMG network of independent firms affiliated with KPMG International Cooperative (“KPMG International”), a Swiss legal entity. All rights reserved. Printed in Switzerland. The KPMG name and logo are registered trademarks.
European Real SnapShot! 1

Sentiment remains positive in the European property investment market. At EUR285bn, the volume of transactions last year was the highest recorded since 20071. That year’s high point was missed by nearly 5%. Compared to last year, the volume of transactions has risen by a remarkable 23%.
After many indicators in the first half pointed to a record year, transaction activity weakened in the second half of the year. In Q4 2015, transaction activity was 6% below the previous year’s level at EUR73bn. High prices in some submarkets resulted in increased caution on the side of domestic investors.
Demand for European property investments continues to be driven strongly by international investors. For the first time since records began, they have been responsible for over 50% of total investment. A breakdown of investment activity shows that 32% of transactions by volume came from global investors and 20% from supra-regional investors. Global players investing in European property are mainly based in the USA or Canada. However, the strongest growth in recent years has been seen in transactions by Asian investors.
With the exception of industrial properties, all use categories registered higher investment volumes compared to 2014. Office properties remain the most attractive, with a 40% share of total investments. In this segment, a trend can be seen towards large single-property transactions, with a volume greater than EUR100m per transaction. In the past year, there have been over 200 transactions above this level.
Office properties were followed in second place by retail property, with a market share of 25%. The highest growth compared to 2014 was recorded in this asset class (39%). This positive trend is attributable in particular to a record number of shopping centre transactions. It is also clear that investors are now favouring quality properties in central locations. The difference in yield compared to lower quality investment properties, at over 100bps, is above long term average.
1 Real Capital Analytics
Stefan PfisterCEO KPMG Switzerland Head of Real Estate Europe / EMA
Global Capital Puts Pressure on Yields
© 2016 KPMG Holding AG/SA, a Swiss corporation, is a member of the KPMG network of independent firms affiliated with KPMG International Cooperative (“KPMG International”), a Swiss legal entity. All rights reserved. Printed in Switzerland. The KPMG name and logo are registered trademarks.
2 European Real SnapShot!

Residential properties rank third, with a 13% share of total investments. In this segment too, investments have increased Y-o-Y, by a massive 39%. This growth is driven by a trend towards more rental properties and also by investments in student accommodation (with a share of 20% of the residential property segment). Investors consider the residential property segment to be less sensitive to the economic cycle than commercial uses.
The United Kingdom remains by far the largest investment market in the European area. Last year, a new record volume of transactions of EUR91bn was achieved (+24% compared to 2014). British property deals account for a share of almost one third of the total European property market. In Q4 2015, a drop of 9% in the volume of transactions was observed compared to 2014, with the result that transaction yields in the United Kingdom stabilised at 6.2%. At the same time, the number of deals with a holding period of less than 24 months has risen.
In Germany, the second largest European investment market with EUR66bn invested, there has been a marked increase in the transaction volume compared to 2014. However, the 2007 high of EUR72bn was not surpassed. Here too, strong interest from global investors was recorded, with a 45% share of transactions by volume. An extraordinarily high volume of transactions was seen in the residential property segment. A key reason for this was the ongoing consolidation in the quoted residential property segment.
Thanks to a high volume of transactions in the second half of the year, the volume of recorded transactions in France was 16% higher than in 2014. France is one of the few European countries where the transaction activity of international investors is falling. Notwithstanding a reduction in investment volumes, US investors remain the most active foreign purchaser group. Investors from Germany are
showing increasing interest. The generally lower level of foreign interest can be explained by the limited optimism in France’s economic outlook.
International investors are increasingly focusing their attentions on peripheral European cities such as Milan and Madrid. With a volume of EUR5bn, the Spanish capital has moved from 8th to 5th place amongst the most popular European investment locations. Milan rose by 12 places, and is now in 9th place (EUR4bn).
In spite of relatively stable economic data, since the start of 2016, the international financial markets have been marked by extraordinarily high volatility. There is increased speculation about the threat of a recession because of low oil prices, the difficult position of European banks, uncertainties about the continued existence of the European Union (Brexit) and China’s flagging economy. However, if one looks at the available economic data, there are currently few indicators of a recession. Consequently, the International Monetary Fund is anticipating growth in 2016, of 1.7%. However, the imbalance in growth within the EU continues.
For the current year, despite an initial weakening trend, we anticipate transaction activity in Europe to remain high. Sound economic prospects are underpinning demand for property. However, the most important driver for demand is still anticipated to be the lack of alternative investments. In the search for returns, there is no route to avoid investment in property in the current low interest rate environment.
Stefan PfisterCEO KPMG Switzerland, Head of Real Estate Europe / EMA
Demand for European property investments continues to be driven strongly by international investors.
© 2016 KPMG Holding AG/SA, a Swiss corporation, is a member of the KPMG network of independent firms affiliated with KPMG International Cooperative (“KPMG International”), a Swiss legal entity. All rights reserved. Printed in Switzerland. The KPMG name and logo are registered trademarks.
European Real SnapShot! 3
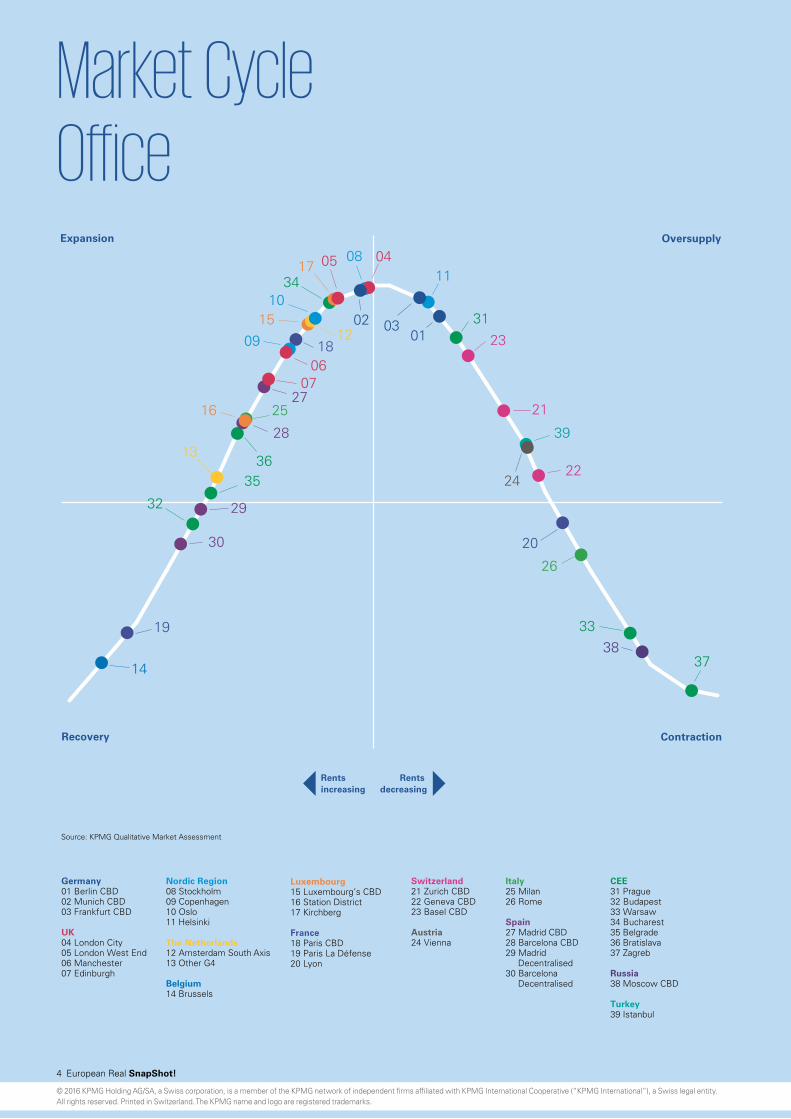
Expansion
Recovery
Oversupply
Contraction
Rents decreasing
Rents increasing
Germany01 Berlin CBD02 Munich CBD 03 Frankfurt CBD
UK04 London City05 London West End06 Manchester07 Edinburgh
Nordic Region08 Stockholm09 Copenhagen 10 Oslo 11 Helsinki
The Netherlands12 Amsterdam South Axis13 Other G4
Belgium14 Brussels
Source: KPMG Qualitative Market Assessment
Luxembourg15 Luxembourg’s CBD16 Station District 17 Kirchberg
France18 Paris CBD19 Paris La Défense20 Lyon
Switzerland21 Zurich CBD 22 Geneva CBD23 Basel CBD
Austria24 Vienna
Italy25 Milan 26 Rome
Spain27 Madrid CBD28 Barcelona CBD29 Madrid Decentralised30 Barcelona Decentralised
CEE31 Prague32 Budapest33 Warsaw34 Bucharest35 Belgrade36 Bratislava37 Zagreb
Russia38 Moscow CBD
Turkey39 Istanbul
39
38
32
3536
34
31
33
37
30
29
28
2725
26
24
23
21
22
20
19
18
17
16
15
14
13
12
11
09
10
08
0706
05 04
0102 03
Market Cycle Office
© 2016 KPMG Holding AG/SA, a Swiss corporation, is a member of the KPMG network of independent firms affiliated with KPMG International Cooperative (“KPMG International”), a Swiss legal entity. All rights reserved. Printed in Switzerland. The KPMG name and logo are registered trademarks.
4 European Real SnapShot!

Expansion
Recovery
Oversupply
Contraction
Rents decreasing
Rents increasing
Source: KPMG Qualitative Market Assessment
Germany01 Berlin02 Munich 03 Frankfurt
UK04 London City05 London West End06 Edinburgh
Nordic Region07 Stockholm 08 Copenhagen 09 Oslo 10 Helsinki
The Netherlands11 Amsterdam12 Other G4
Belgium13 Brussels
Luxembourg14 Grand-Rue15 Avenue de la Gare (Station District) 16 Rue Philippe II
France17 Paris 18 Lyon 19 Marseille
Switzerland20 Zurich 21 Geneva22 Basel
Austria23 Vienna
Italy24 Rome25 Milan
Spain26 Madrid27 Barcelona
CEE28 Prague29 Budapest30 Warsaw31 Bucharest32 Belgrade33 Bratislava34 Zagreb
Russia35 Moscow
Turkey36 Istanbul
36
35
29
32
31
3330
28
34
2627
24 25
23
22
20
2118
19
17
16
15
14
13
11
12
07
10
09
08
06
04
05
02
03
01
Market Cycle Retail Highstreet
© 2016 KPMG Holding AG/SA, a Swiss corporation, is a member of the KPMG network of independent firms affiliated with KPMG International Cooperative (“KPMG International”), a Swiss legal entity. All rights reserved. Printed in Switzerland. The KPMG name and logo are registered trademarks.
European Real SnapShot! 5

France
An excellent recovery after a disappointing start
Macroeconomic Overview The Eurozone economy grew by just 0.3% in Q3 2015 and 0.2% in Q4 2015, representing a slowdown after the 0.4% recorded in Q2 2015. This weak performance shows that Europe’s recovery remains lacklustre despite the huge stimulus measures launched by the ECB. Nonetheless, the economic situation in the Eurozone is good. The Euro depreciated as a result of the divergence in monetary policy between the ECB and the Fed. We witnessed a fall in the prices of oil and raw materials due to the prospect of a major slowdown in China.
In France, thanks to strong private consumption and a recovery in investment, growth in the country’s economy is expected to accelerate slightly. Unfortunately, growth is being held back by two glaring statistics: unemployment looks unlikely to improve until 2017, and the government’s headline budget deficit is expected to continue increasing to 3.4% of GDP in 2016.
Against this background, INSEE recorded a modest 0.25% increase in GDP for H2 2015 and forecasts +0.4% for Q1 2016. According to INSEE, French growth was 1.1% overall in 2015 and should increase gradually in 2016 to between 1.3% and 1.5%.
The top three main challenges for France in 2016 will be economic growth, unemployment and the government deficit.
Economic Indicators
1.2%
10.2%
0.2%
-4%
-2%
0%
2%
4%
6%
8%
10%
12%
2009 2010 2011 2012 2013 2014 2015
GDP growth Unemployment rate Inflation (CPI)
Source: INSEE
A total of EUR23.4bn was invested in real estate in 2015 (H2 2015 being the strongest ever half year for real estate).
All sectors are seeing strong demand, and supply of office space is also increasing, although availability of Grade A / prime space in Core locations is generally limited.
© 2016 KPMG Holding AG/SA, a Swiss corporation, is a member of the KPMG network of independent firms affiliated with KPMG International Cooperative (“KPMG International”), a Swiss legal entity. All rights reserved. Printed in Switzerland. The KPMG name and logo are registered trademarks.
6 European Real SnapShot!

Offices outperformed the rest of the asset classes in the market in 2015 and retail remains strongly in favour (but the main constraint on the market is short supply).
Office MarketIn 2015, EUR17bn was invested in office properties, representing 72% of total investments in France (an increase of 6% compared to 2014).
Thanks to better financing conditions and a more favourable tax environment, the performance of the French office market was strong in H2 2015. Strong investment activity largely compensated for the decline of 40% during H1 2015 (compared with the same period in the preceding year).
Core markets remain in demand, but interest is spreading to new markets in a search for yield and availability.
Paris and the traditional business districts saw the strongest activity:• Central Paris accounted for 39% of office investment in
France (with major activity in ZAC Rive Gauche and ZAC Clichy-Batignolles);
• La Défense accounted for 9% (Pascal towers, T1 & B towers);
• Hauts-de-Seine accounted for 26% (Noda in Issy-les-Moulineaux, Art&Fact 2).
Investment in the other regions was driven by transactions relating to new or redeveloped assets (including Sky56 in Lyon and Ekla in Lille).
French investors accounted for 65% of total investment in France and remained by far the country’s largest investors (with significant acquisitions such as the Ivanhoe portfolio, Aqua and Smart Side campus). Domestic investors are mainly represented by institutionals (such as CNP, Predica and Sogecap), SCPI/OPCI property funds (e.g. Amundi and Primonial) and REITs (such as Eurosic and Gecina).
Foreign investors (35%) vary in terms of type and nationality. US and UK investment funds (e.g. JP Morgan, Goldman Sachs, Standard Life and Carval) have been the most active. German investors (such as Deka and Realis) were active in H2 2015, acquiring five office buildings.
Demand for securely let real estate assets has kept yields close to their all-time low.
The risk premium remains positive, at 230bps on prime office yields.
In Q4 2015, 710,000 sq. m of office space was let or sold (300,000 sq. m in December). Take-up in 2015 was 1% higher than in 2014, with an annual total of 2.2 million sq. m. After a difficult H1 2015, this good performance can be explained by a boom in small and medium-sized areas, the success of the Paris area, in particular the southwest of Paris and the closing of a number of recent deals such as the new Novartis headquarters at Rueil-Malmaison.
Letting volumes have been boosted by an increased appetite for modern space in non-Core locations, with larger occupiers targeting opportunities to lower their occupation costs.
Out of all the districts of Ile-de-France, central Paris remained the principal driver in the office market. Indeed, Paris still accounted for 43% of take-up in 2015, with Paris CBD being particularly dynamic. The Southern River Bend also boasted a robust performance, the trend being especially apparent for large units, but also small and medium-sized premises. Conversely, other districts have struggled.
At year-end 2015, availability within one year stood at 4.1 million sq. m (a decrease of 2% compared to 2014).The vacancy rate in Ile-de-France dropped to 7.6% at the end of 2015 (compared to 7.8% at the end of 2014). The highest vacancy rates are still observed in the Western Crescent (notably in Péri-Défense and on the Northern River Bend).
Prime Office Rents
-5%
0%
5%
0
100
200
300
400
500
600
700
800
Par
is (C
BD
)
Par
is (R
ive
Gau
che)
Par
is (L
a D
éfen
se)
Lyon
Mar
seill
e
Bor
deau
x
Str
asbo
urg
Lille
Toul
ouse
Nic
e
EU
R/s
q. m
p.a
.
CA
GR
Prime Rent CAGR (5yr) CAGR (1yr)
Source: Cushman & Wakefield
Paris CBD’s prime rent stood at EUR750/sq. m p.a., steady compared to H1 2015 and H2 2014. The prime rent in La
© 2016 KPMG Holding AG/SA, a Swiss corporation, is a member of the KPMG network of independent firms affiliated with KPMG International Cooperative (“KPMG International”), a Swiss legal entity. All rights reserved. Printed in Switzerland. The KPMG name and logo are registered trademarks.
European Real SnapShot! 7

retail market. The highlight of 2015 was the sale by CBRE GI of the Celsius portfolio to a joint venture formed by AEW and the Chinese Sovereign Wealth Fund CIC (its first acquisition in France).
Yields have reached historic lows, lying below 3% for Paris’ best high street locations. Average cap rates stand at 4% across all retail property types.
Retail Yields
3.0%
3.5%
4.0%
4.5%
5.0%
5.5%
6.0%
6.5%
2011 2012 2013 2014 2015
Paris City Centre Retail Parks New Generation
Prime Commercial Centre
Source: Cushman & Wakefield
Prime Retail Rents for High Street Shops
-10%
-5%
0%
5%
10%
15%
0 2,000 4,000 6,000 8,000
10,000 12,000 14,000 16,000 18,000 20,000
Par
is /
Cha
mps
Ely
sées
P
aris
/ R
ue S
aint
-Hon
oré
Par
is /
St
Ger
mai
n P
aris
/ H
auss
man
n P
aris
/ Fr
ancs
-Bou
rgeo
is
Bor
deau
x
Can
nes
Lille
Ly
on
Mar
seill
e N
ice
Str
asbo
urg
Toul
ouse
S
hopp
ing
cent
res
(Par
is R
eg.)
Sho
ppin
g ce
ntre
s (P
rovi
ncia
l) R
etai
l par
ks (P
aris
Reg
.) R
etai
l par
ks (P
rovi
ncia
l)
EU
R/s
q. m
p.a
.
CA
GR
Prime rent CAGR (1yr)
Source: Cushman & Wakefield
The higher rents continued to be concentrated in Paris’ main avenues (even though there was a decline in rents in streets such as rue Saint-Honoré (-8% between Q2 2015 and Q3 2015). The highest rents are still found on Paris’ most famous street, Avenue des Champs Elysées (EUR18,000/sq. m p.a.).
In the largest regional cities, prime retail rents stand at EUR1,800/sq. m p.a. in Marseille and EUR2,300/sq. m p.a. in Lyon.
Défense has experienced a slight decrease over the years, reaching EUR520/sq. m p.a. (-1.1% over the past five years).
In the regions, prime office rents remained stable in H2 2015, except for Marseille where redevelopments of entire districts such as Euroméditerranée are boosting the city’s attractiveness, with rents increasing by 4.0%.
Prime Office Yields
Q4 2015 Q3 2015 FY 201410 Year
High10 Year
Low
Paris CBD 3.25% 3.50% 4.00% 5.75% 3.50%
Rive Gauche
4.00% 4.00% 5.00% 6.25% 4.25%
La Défense 5.25% 5.25% 5.50% 6.75% 4.50%
Provincial Lyon 5.00% 5.25% 5.75% 7.00% 5.25%
Other 5.25% 5.50% 6.25% 7.50% 5.50%
Source: Cushman & Wakefield
Retail MarketInvestment in French retail assets amounted to EUR4.3bn in 2015 (compared to EUR7.7bn a year earlier), representing 18% of total investments. 2015 saw the second best performance in terms of volume after 2014 (the all-time high).
The market was more balanced in 2015, with a few very large transactions impacting volumes. Investor appetite for retail remains strong, but there was still a lack of prime stock.
The larger transactions were for malls and shopping centres (Celsius portfolio, Nice Etoile).
High streets in Paris remain highly desirable (Atelier Renault/Häagen-Dazs on the Champs-Elysées, Roberto Cavalli in rue Saint-Honoré), but also in the provinces (the Emir of Qatar recently acquired the Printemps megastore on rue de la République in Lyon).
Investment in retail parks remains limited (retail parks suffer from a scarcity of prime opportunities).
In terms of purchasers, the French were in the majority (~60%), represented mainly by SCPI’s/OPCI property funds (such as Primonial, BNP Paribas REIM, Amundi and La Française), REITs/property companies (such as Altarea and Carmila) and insurance companies (such as CNP and CA Assurances).
Traditional foreign investors (such as Qatar, Allianz and Blackstone) continue to play a crucial role on the French
France
© 2016 KPMG Holding AG/SA, a Swiss corporation, is a member of the KPMG network of independent firms affiliated with KPMG International Cooperative (“KPMG International”), a Swiss legal entity. All rights reserved. Printed in Switzerland. The KPMG name and logo are registered trademarks.
8 European Real SnapShot!

Residential MarketAt the end of 2015, the number of existing homes sold during the year had reached 753,000 (an increase of 4.2% compared to 2014). Sales in the new housing segment increased by 2.7% during H2 2015. In 2015, conditions for investment were favourable due to the record low borrowing rates.
Looking again at the market for existing homes, prices in France increased slightly (0.5%) in Q3 2015 compared to Q2 2015. However, the annualised figures are less positive, with a decrease of 1.4% during the first ten months of 2015. The increase for existing housing was greater in the Greater Paris area than in the regions. Compared to the high point of the market, which was reached in Q3 2011, prices have decreased by 6.7% in four years.
According to data from INSEE – Notaires de France, there was a decrease of 1.2% in the regional markets during 2015. There were also significant disparities between regional cities and the Greater Paris area.
Price Variation for Second Hand Homes
Flats Flats Houses Houses
Q3 2015 on Q2 2015
Q3 2015 on Q3 2014
Q3 2015 on Q2 2015
Q3 2015 on Q3 2014
France -0.8% -3.1% -0.5% -2.6%
Paris region -0.8% -3.0% -0.3% -1.9%
Provincial -0.8% -3.2% -0.6% -2.7%
Source: Notaires de France and INSEE
Looking at the market for new housing, construction has not yet picked up. It has however stabilised, with 350,600 construction starts and 366,900 building permits issued between the beginning of the year and the end of October. This stabilisation is attributed to the caution being exercised by developers and the levels of pre-sales and pre-lettings required before construction can commence.
The average price of new apartments in France has stabilised at EUR3,887/sq. m. Nevertheless, as in the market for existing units, we can see significant disparities in prices between the regional cities. In fact, in regions such as Burgundy and the Limousin, the average price is no higher than EUR3,000/sq. m, whilst it can reach EUR10,544/sq. m. in prime locations.
Looking at the rental market, even if levels of demand have been sustained, the tax and legal system remains unfavourable and we therefore predict only a small increase
in 2016. During 2015 we saw market rents decline by 1.5%. As in other markets, we observed variations between rents in the regions and in the capital, with rents in Paris being almost twice those in the regions.
Financing conditions and the cost of household borrowing remained very favourable during H2 2015. In fact, interest rates are set at an average of 2.2%. According to CBRE, EUR190.9bn of mortgages were granted to householders during the year.
The prospects for 2016 are favourable. Even if the economic context is still not very encouraging, purchases of both existing and new homes are expected to increase in 2016.
Focus on LogisticsE-commerce grew by 22% last year in Europe, creating stronger demand for warehousing space and distribution networks. Therefore, opportunities abound for investment in and development of warehouses to service the changing needs of Europe’s e-commerce sector, particularly in megacities such as Paris, London, Berlin and Madrid.The location of logistic premises depends on the type and scale of the space and, above all, its role in the supply chain. They may be located within the urban centres of the megacities, especially in the case of “last-mile logistics” required to deliver straight to the city’s heart, whilst large warehouses are likely to be situated in well-positioned and well-connected peripheral locations where land (and labour) costs are lower.
With the growth in the e-commerce market, demand for logistic premises is expected to grow significantly, as one of the key characteristics of the e-commerce business model is to enhance product availability by streamlining the supply chain through multiple retail / storage points. An efficient footprint of logistic premises, as well as technological developments and innovations in logistics, is one of the factors underpinning the success of leading e-commerce operators such as Amazon and Vente-privée. The drivers behind the market for logistic assets are expected to push up rents and values, as retailers strive to secure the right property in the right location.
© 2016 KPMG Holding AG/SA, a Swiss corporation, is a member of the KPMG network of independent firms affiliated with KPMG International Cooperative (“KPMG International”), a Swiss legal entity. All rights reserved. Printed in Switzerland. The KPMG name and logo are registered trademarks.
European Real SnapShot! 9

United Kingdom
Continued growth, with downside risks for the months ahead
Macroeconomic Overview According to the Office for National Statistics, the UK economy grew by 0.5% in Q4, bringing overall growth in 2015 to 2.2%.1 Whilst this represents a slight slowing in the pace of economic growth, the UK remains one of the fastest growing developed economies in the world and the International Monetary Fund expects it to maintain this position for the next few years at least.
Economic Indicators
-6%
-4%
-2%
0%
2%
4%
6%
8%
10%
2007
2008
2009
2010
2011
2012
2013
2014
2015
E
2016
F
2017
F
2018
F
2019
F
2020
F
Real GDP growth Inflation (CPI) Unemployment rate
Real personal disposable income growth Average real wages
Source: Economist Intelligence Unit E – estimate F – forecast
High up on many investors’ lists of concerns is the referendum on Britain’s membership of the EU on 23 June 2016. Opinion remains divided as to what the expected result and implications will be, however given the slowdown in transactions activity that our teams witnessed in the run up to the Scottish referendum in 2014, it is possible that the uncertainty caused by the debate will have a noticeable impact on the real estate market. Foreign investors may also reconsider their appetite for sterling-denominated investments if they believe a devaluation will be likely if Britain leaves the EU. Indeed, we already have seen the pound fall by 3.9% against the dollar by 22 February 2016 (and 1.2% against the euro) over concerns of a possible exit.
Slowing growth and persistent instability in the global markets is also having an effect on the UK economy. With this in mind, the Bank of England’s (BoE) Monetary Policy Committee voted unanimously in February to keep interest rates at 0.5%. Having predicated a rate rise early in 2016 at
1 Economic Review – February 2016, Office for National Statistics
© 2016 KPMG Holding AG/SA, a Swiss corporation, is a member of the KPMG network of independent firms affiliated with KPMG International Cooperative (“KPMG International”), a Swiss legal entity. All rights reserved. Printed in Switzerland. The KPMG name and logo are registered trademarks.
10 European Real SnapShot!

the end of last year, particularly with the US upping their rate in December, many market commentators are now suggesting we will not see a change until 2018. Whilst there are others more optimistically forecasting a rise at the end of 2016, there remains a consensus that any rise will be gradual.
UK Commercial Real Estate Sales
-100%
-50%
0%
50%
100%
150%
0
10
EU
R b
n
20
30
40
50
60
70
80
Q1
07
Q3
07
Q1
08
Q3
08
Q1
09
Q3
09
Q1
10
Q3
10
Q1
11
Q3
11
Q1
12
Q3
12
Q1
13
Q3
13
Q1
14
Q3
14
Q1
15
Q3
15
Rolling 12-mo. Total Quarterly Vol. Y-O-Y change
Source: Real Capital Analytics, rcanalytics.com
Wage growth remains muted, however the continuing fall in energy prices has helped to drive a rise in real wages (adjusted for inflation) and personal disposable income. Business and consumer confidence is robust and the UK financial market is demonstrating its resilience in the current global environment. The BoE therefore remains optimistic that the 2% inflation target will be reached, or even exceeded, within the next two years and the outlook for the UK is still largely positive.
However, whilst low oil prices are having a positive impact on the UK’s consumer economy, it is possible that this will have repercussions for in-bound foreign investment. Some anecdotal evidence suggests that Sovereign Wealth Funds (SWFs) in oil-based economies – a significant source of capital for the UK real estate investment market – are retracting investments as they focus on domestic concerns. Though there remains a strong mix of investors targeting UK real estate assets, it will be interesting to see how the macroeconomic and political environment plays out for the market as we progress through 2016.
Office MarketUK business activity remains robust despite global financial and economic uncertainty in recent quarters. Strong office-based employment growth underpinned the UK office markets throughout 2015, with sustained investment, rental growth and take-up both in London and the regional markets. The trend is expected to continue in 2016, with
supportive demand conditions for London and the UK overall – slight slowing in economic growth, along with the planned referendum on EU membership, does not seem to have impacted occupier demand to date.
Investment demand for UK offices was at unprecedented levels for much of 2015. This continues to be led by the central London market, which attracted £4.1bn of investment in Q4, and a total of £16.2bn in the year.2 Overseas investors remain the dominant buyers, accounting for 75% of total volumes in Q4.2 Yields contracted further in the second half of 2015 and are at an all-time low in Central London. Domestic investors, particularly institutions, are increasingly looking outside London for higher yielding investments and properties with asset management or redevelopment potential.
Prime Office Yields (net) - December 2015
0%
1%
2%
3%
4%
5%
6%
7%
Current Quarter Last Year
Lond
on (C
ity)
Lond
on (W
est
End
)
Man
ches
ter
Birm
ingh
am
Bris
tol
Leed
s
New
cast
le
Rea
ding
Car
diff
Edi
nbur
gh
Gla
sgow
Source: Cushman & Wakefield
The development pipeline continues to lag behind demand for much of the UK, and the rise in office buildings being converted into residential space is impacting the supply of secondary stock. The West End market remains severely undersupplied and there is only limited development activity in the pipeline in core areas. With some occupiers increasingly looking outside of the capital for more cost-effective locations for their office space, cities such as Manchester and Leeds are also experiencing historically low vacancy rates. This is driving investor demand for the already limited Grade A stock. Conversely, London City potentially risks over-supply in the next 2 – 3 years if a number of the schemes currently in the development pipeline all go ahead.
2 The Property Perspective, London Q4 2015, CBRE
© 2016 KPMG Holding AG/SA, a Swiss corporation, is a member of the KPMG network of independent firms affiliated with KPMG International Cooperative (“KPMG International”), a Swiss legal entity. All rights reserved. Printed in Switzerland. The KPMG name and logo are registered trademarks.
European Real SnapShot! 11

United KingdomPrime Office Rents – December 2015
-6%
-4%
-2%
0%
2%
4%
6%
8%
10%
0
200
400
600
800
1,000
1,200
1,400
1,600
1,800
2,000
Lond
on (C
ity)
Lond
on (W
est
End
)
Man
ches
ter
Birm
ingh
am
Bris
tol
Leed
s
New
cast
le
Rea
ding
Car
diff
Edi
nbur
gh
Gla
sgow
CA
GR
EU
R/s
q. m
p.a
.
Prime Rent CAGR (5yr) CAGR (1yr)
Source: Cushman & Wakefield
Retail MarketThe macroeconomic environment continues to foster relatively strong consumer confidence – with energy prices, interest rates and inflation remaining low and disposable income marginally up. As such, market commentators expect 2016 to be another positive year for occupiers in the UK retail sector, although there are a number of factors arising that will impact profit margins for retailers and likely result in further store closures and failing businesses. With the introduction of a compulsory national living wage, over and above the current minimum wage, in April 2016 and a business rate revaluation scheduled for April 2017, profit margins will be squeezed. As with elsewhere in the world, retailers also continue to contend with ever-changing consumer trends, fuelled largely by technology. Stores are continually trialling new technologies, and the overall shopping experience is changing as food, beverage and leisure providers increasingly occupy traditional retail-only space. This is illustrated by Cushman & Wakefield’s observation that restaurant space in Birmingham’s Grand Central shopping centre now accounts for 28% of total floor space, compared to the anticipated 8% in the 2011 plans.
Prime Retail Rents – December 2015
-5%
0%
5%
10%
15%
20%
25%
0
2,000
4,000
6,000
8,000
10,000
12,000
14,000
Lond
on (C
ity)
Lond
on (W
est
End
)
Man
ches
ter
Birm
ingh
am
Leed
s
Car
diff
Edi
nbur
gh
Gla
sgow
CA
GR
EU
R/s
q. m
p.a
.
Prime Rent CAGR (5yr) CAGR (1yr)
Source: Cushman & Wakefield
Overall confidence in the occupier markets remains buoyant, and investor interest has followed suit. Shopping centres across the UK continue to see much attention from both domestic and foreign investors, with a slight dip in overseas interest in Q3 expected to return in 2016. In the high street market, there has been a downward shift in prime yields, with secondary yields also shifting in key locations. Secondary yields are expected to harden further in 2016 as investors increasingly turn their attentions to regional markets and secondary assets. Though partly a result of the limited availability of stock and high prices in London, there is also a clear trend of rising rents in the regional markets.
Meanwhile, rents in London are expected to remain high as demand continues to exceed supply, and regenerated areas such as East London and Battersea will come into fashion as new large mixed use developments are completed. London’s West End continues to outperform the rest of the market, with prime rents well above the rest of the UK and yields considerably lower. With London firmly established as a key location for the top global brands there is not expected to be any let-up in demand for space, although increasingly occupiers and investors are being forced to consider less traditional streets in the area.
© 2016 KPMG Holding AG/SA, a Swiss corporation, is a member of the KPMG network of independent firms affiliated with KPMG International Cooperative (“KPMG International”), a Swiss legal entity. All rights reserved. Printed in Switzerland. The KPMG name and logo are registered trademarks.
12 European Real SnapShot!

Prime Retail Yields (net) – December 2015
0%
1%
2%
3%
4%
5%
6%
Lond
on (C
ity)
Lond
on (W
est
End
)
Man
ches
ter
Birm
ingh
am
Leed
s
Car
diff
Edi
nbur
gh
Gla
sgow
Par
k –
Bul
ky g
oods
Par
k –
Ope
n co
nsen
t
Reg
iona
l Cen
tre
Current Quarter Last Year
Source: Cushman & Wakefield
Residential MarketUK house price growth increased to 4.5% in December 2015 according to the Nationwide House Price Index, up from 3.7% in November.3 Regional patterns remain, with price growth generally slowing as you move towards the north of the country. National price growth is expected to maintain a 3-6% growth rate through 2016, supported by healthy employment and wage statistics and only gradual rises in borrowing costs. However, the staggering hikes seen in London prices in recent years are likely to slow as the capital reaches increasingly unaffordable levels. London homeowners continue to capitalise on this price difference by selling up for more space in commutable towns.
Tax changes announced in 2015 are starting to show an impact on certain markets. The Prime Central London market, for example, has seen increased price sensitivity from buyers due to higher Stamp Duty Land Taxes (SDLT) and policy changes targeted at overseas buyers. An additional 3% rate of SDLT for second home buyers, due to come into force on 1 April 2016, appears to be fuelling the buy-to-let market for now as purchasers seek to complete before the changes. However, this policy also signals the government’s attitude towards buy-to-let investors and may ultimately see individual rental units coming onto the market as smaller landlords sell up due to reduced profitability.
These changes form part of a wider drive to combat the housing supply shortage faced in the UK, including incentives for housebuilders and a relaxation of planning
3 Nationwide House Price Index, December 2015
regulation for the redevelopment of vacant office space into residential accommodation. However the supply of homes remains a significant issue for the UK and there have been further calls for the release of public land, for more power to be entrusted outside of central government, and increased access to funding. Indeed, government initiatives such as Starter Homes and the Help to Buy ISAs have been accused of increasing demand without tackling supply, and most policy focuses on house ownership rather than private or social rent.
Whilst housebuilding completions have increased in recent years, they remain well below the long-term average and government targets. There is also a shortage of secondary stock as many who manage to get on the property ladder are then unable to move on to make room for new entrants – those looking for an upgrade to their first purchase are finding they cannot afford the next step and many over-55s are unable to downsize due to a lack of suitable retirement housing.
In the midst of the chronic supply shortage and affordability issues for house buyers, large-scale private rented sector (PRS) investment has been gaining traction. Both domestic and overseas investors are increasingly wanting to be part of this growing sector, with both London and the regions being targeted. Knight Frank’s Investment Survey of large-scale investors in PRS indicated that investment is likely to more than treble by 2020.4
Whilst demand for rented accommodation is largely fuelled by those unable to afford to buy, some are also attracted by the greater flexibility that rented accommodation offers. Many property firms in the UK are looking to replicate the very successful student accommodation model, and we are increasingly seeing purpose-built, well-thought out PRS accommodation coming onto the market. With a portfolio of properties across the UK and the means to gather potentially extensive data on their tenants’ wants and needs, these firms are able to accommodate the young professional who may want to move seamlessly from London to Manchester, for example, without the inconvenience of looking for a new landlord. As the sector becomes more sophisticated, they will likely find that they can move to a near identical set up with matching facilities and even similar neighbours.
The retirement sector is also sparking investor interest, as the UK’s ageing population puts increasing demand on the supply of appropriate retirement housing. In particular, “housing with care” accommodation has risen in popularity as today’s retirees desire a home that enables them to maintain their independence whilst providing appropriate
4 Private Rented Sector Update January 2016, Knight Frank
© 2016 KPMG Holding AG/SA, a Swiss corporation, is a member of the KPMG network of independent firms affiliated with KPMG International Cooperative (“KPMG International”), a Swiss legal entity. All rights reserved. Printed in Switzerland. The KPMG name and logo are registered trademarks.
European Real SnapShot! 13

United Kingdomcare facilities. Some specialist developers are already replicating the set-up often seen in the U.S. and New Zealand, with luxury retirement villages fully equipped to provide every need for their residents. There is clearly an opportunity for investors to tap into this undersupplied market – in 2014 Knight Frank estimated that the over-60s in England have £1.23 trillion in unmortgaged housing wealth and evidence suggests that those who can afford to are willing to pay for carefully planned high-end housing.
Source: Department for Communities and Local Government
The constraining factor across the UK residential markets continues to be lack of supply – something that is very much at the forefront of political agendas of late. As such, the affordability of UK homes and the success of sub-sectors like PRS largely depend on the extent to which a solution can be found to provide enough stock for the market.
0
50,000
100,000
150,000
200,000
250,0000
Sta
rts
Com
plet
ions
Sta
rts
Com
plet
ions
Sta
rts
Com
plet
ions
Sta
rts
Com
plet
ions
Sta
rts
Com
plet
ions
Sta
rts
Com
plet
ions
Sta
rts
Com
plet
ions
Sta
rts
Com
plet
ions
Sta
rts
Com
plet
ions
Sta
rts
Com
plet
ions
Sta
rts
Com
plet
ions
Sta
rts
Com
plet
ions
Sta
rts
Com
plet
ions
Sta
rts
Com
plet
ions
Sta
rts
Com
plet
ions
Sta
rts
Com
plet
ions
Uni
ts
Q1 Q2 Q3 Q4
2000
2001
2002
2003
2004
2005
2006
2007
2008
2009
2010
2011
2012
2013
2014
2015
UK Housebuilding Starts and Completions
© 2016 KPMG Holding AG/SA, a Swiss corporation, is a member of the KPMG network of independent firms affiliated with KPMG International Cooperative (“KPMG International”), a Swiss legal entity. All rights reserved. Printed in Switzerland. The KPMG name and logo are registered trademarks.
14 European Real SnapShot!
Focus on LogisticsThe logistics sector has become an extremely attractive asset class for investors in the UK in recent years. However, 2015 witnessed real pressure on supply as demand for large, quality logistics space rose and available stock diminished. Driving this demand is the continued movement in consumer spending towards online retail which has increased pace and demanded a change in distribution flows throughout the logistics network. Amidst rising rents and contracting yields we anticipate some major changes coming out of the sector in the coming years.
Changing occupier preferences pushing up rentsLarge retailers have been driving a profound change to the established distribution network in the UK. One notable pioneer of this is Amazon, with the retail giant following its model adopted in the US of incorporating networks of small regional delivery hubs around large urban locations. These hubs are fed by a new breed of mega-shed, often in excess of 1 million sq ft in size, which provide the first point of a dedicated distribution network feeding national and regional markets. This model has brought the distributor closer to the customer creating a platform for same day, and in some cases as short as two-hour, deliveries in the UK. Amazon’s impact on the logistics market in 2015 has been substantial with Savills indicating that the company accounted for 10% of all space transacted during the year.5
As well as increasing in size, the new mega-sheds are required to be increasingly sophisticated with automated picking and sortation systems necessary as online retail and e-commerce continues to grow. This technology has required increased warehouse heights and enabled more efficient use of space with multi-storey sites becoming more common, as seen frequently in Asia. Furthermore, the requirement of office space within distribution centres is becoming more prevalent - the technology requires management and monitoring, which is taking the place of manual roles. These changing distributor requirements, pressure on available land and regional urbanisation have contributed to widespread rental growth throughout 2015 as companies are paying premium prices to secure sites of appropriate quality.
5 Savills, "Big Shed Briefing January 2016"
Lack of quality supply impacting yieldsAlongside increasing rents, prime logistics yields are decreasing in the UK due to fierce competition for prime assets. Prime yields for big sheds with secured long-term incomes are being reported at record lows. This is driven partly by a major shortage of units larger than 50,000 sq ft around the UK. Indeed, Savills have reported that only 7.5% of units on the market are currently > 300,000 sq ft. With demand outstripping quality supply transaction volumes were down from 2014 levels.
The UK market is becoming characterised into two brackets with small numbers of large, technologically-capable warehouses, which are trading at historically low yields, and much greater numbers of outdated stock. Many warehouses around the UK have become obsolete. These are characterised by low ceilings, awkward layouts and locations which are not in line with the changing logistics network.
UK logistics network to continue to evolveDistributors are seeing the importance of having premises close to population centres. City delivery will be a major focus for logistics operators in 2016 as consumers get more demanding and urban transport constraints are reaching critical levels. With this in mind there is scope for existing light-industrial sites on the edge of cities being converted into small regional hubs, potentially breathing life into large quantities of tired stock. This could see multi-tenant out-of-town sites being repurposed to single-tenant logistics centres.
Another key trend witnessed in the UK is the integration of shipping companies, rail operators and logistics firms through the use of intermodal hubs. This development is one of the first steps to a future where retailers no longer manage logistics in-house but this is instead facilitated by logistics companies through an interconnected end-to-end service.
© 2016 KPMG Holding AG/SA, a Swiss corporation, is a member of the KPMG network of independent firms affiliated with KPMG International Cooperative (“KPMG International”), a Swiss legal entity. All rights reserved. Printed in Switzerland. The KPMG name and logo are registered trademarks.
European Real SnapShot! 15

Germany
Stable economic data fuel real estate
Macroeconomic Overview The first three quarters showed moderate economic growth, with domestic consumption being the market’s principal driver. Both private consumer spending and domestic consumer spending increased slightly in 2015.
Economic Indicators
80
85
90
95
100
105
110
115
120
-10% -8% -6% -4% -2% 0% 2% 4% 6% 8%
10%
2010 2011 2012 2013 2014 2015
GD
P g
row
th a
nd u
nem
ploy
men
t ra
te
GDP growth Unemployment rate Inflation (2010 = 100)
Inflation
Source: Destatis
The German Institute for Economic Research (DIW) is expecting GDP growth of 1.7% for 2015 as a whole. Similar growth is expected in 2016 and 2017.
The main drivers behind this trend are the ongoing growth in total salaries and the current immigration of refugees. Refugee immigration results in spending on accommodation, care and integration as well as increased activity in the construction industry.
Counterbalancing these positive indicators will be the loss of the one-time increase of purchasing power resulting from low oil prices and anticipated weaker global sales prospects.
In combination with low interest rates, conditions on the real estate market overall are generally favourable. However, the slight decrease in the Real Estate Climate Index in January 2016 shows that market participants are sceptical. There are concerns that the real estate market will not be able to satisfy the strong demand for Core properties in 2016. According to participants in the market, this could lead to a significant decline in transaction volume.
Office MarketOver the past five years, average growth in prime rents of 2.1% per annum has been recorded in the top five cities. In contrast, average prime rents stagnated in 2015. Whilst in Berlin, Frankfurt and Hamburg a slight increase was
© 2016 KPMG Holding AG/SA, a Swiss corporation, is a member of the KPMG network of independent firms affiliated with KPMG International Cooperative (“KPMG International”), a Swiss legal entity. All rights reserved. Printed in Switzerland. The KPMG name and logo are registered trademarks.
16 European Real SnapShot!

recorded in 2015, prime rents in Munich stagnated at a level of EUR32.50/sq. m/month. Dusseldorf even recorded a decline in prime rents. Compared to the previous year, rents have decreased by approx. 5.5% to EUR26.00/sq. m/month. Prime Office Rents
15
20
25
30
35
40
2010 2011 2012 2013 2014 2015
EU
R/s
q. m
p.m
.
Berlin Dusseldorf Frankfurt Hamburg Munich
Source: Thomas Daily
Even though there has been stagnation or even a decrease in prime rents, according to JLL, office space take-up in the top five cities has increased compared to the previous year.
The greatest take-up of office space in 2015 was achieved in Berlin, with 888,000 sq. m. This represents growth of 43% compared to 2014. The other top-five locations also saw increased take-up (Dusseldorf 46%; Munich 19%; Frankfurt and Hamburg 3% each).
Due to the strong take-up, vacancy rates fell in the top five cities. The most significant reduction was observed in Dusseldorf (down by 2.1 percentage points since 2014) and Berlin (down by 1.4 percentage points since 2014). With a 42% share by volume of commercial transactions, office space was again the most popular asset class in the German transaction market in 2015.
Prime yields have decreased compared to the previous year in all of the top five cities. The most significant decrease was observed in Berlin and Munich: in Berlin, a prime yield of 4.0% was recorded in the fourth quarter, a decrease of 60bps compared to the previous year. The prime yield in Munich was recorded at 3.7% in Q4 2015, a decrease of 70bps compared to the previous year. Hamburg registered a prime yield of 4.0%. In Frankfurt and Dusseldorf, prime yields of 4.4% and 4.6% respectively were recorded.
Prime Office Yields
3.5%
4.0%
4.5%
5.0%
5.5%
6.0%
2010 2011 2012 2013 2014 2015
Berlin Dusseldorf Frankfurt Hamburg Munich
Source: CBRE
Retail MarketPrime rents for retail units increased in all top five cities in 2015. The most significant increase, around 14.8%, was observed in Frankfurt. Munich remains the location with the highest prime rents, at EUR360/sq. m/month (an increase of 9.1%).
Prime Retail Rents
0
50
100
150
200
250
300
350
400
2010 2011 2012 2013 2014 2015
EU
R/s
q. m
p.m
.
Berlin Dusseldorf Frankfurt Hamburg Munich
Source: Empirica
The limited supply and continuing strong demand in 2015 led to further declining prime yields. The prime yield for commercial buildings in the top five cities fell by an average of about 30bps to 3.9% compared to 2014.
The pressure on the retail property market led not only to a decrease in prime yields for commercial buildings but also to declining yields across all retail asset classes. Premium shopping centres showed a decline of 20bps, whilst secondary shopping centres recorded a decline of 30bps compared to the previous year. The prime yield for retail warehouses and supermarkets fell by approx. 50bps over the same period. When one compares the current level of prime yields to the pre-crisis year of 2007, it can be seen that they have now fallen below this record level.
© 2016 KPMG Holding AG/SA, a Swiss corporation, is a member of the KPMG network of independent firms affiliated with KPMG International Cooperative (“KPMG International”), a Swiss legal entity. All rights reserved. Printed in Switzerland. The KPMG name and logo are registered trademarks.
European Real SnapShot! 17

Prime Retail Yields by Type of Use
3%
4%
5%
6%
7%
8%
H1
2010
H2
2010
H1
2011
H2
2011
H1
2012
H2
2012
H1
2013
H2
2013
H1
2014
H2
2014
H1
2015
H2
2015
Shopping Centre premium Shopping Centre secondary Retail park Retail warehouse / supermarket High Street
Source: CBRE
Due to the shortage of prime properties in prime locations, investors are more likely to invest in secondary locations or alternative retail categories.
Residential Market Over the past year, the residential rental market has seen general stabilisation. According to the German Real Estate Union (IVD), rents have increased by an average of approx. 2.7%. In major cities, where demand exceeds supply, a stronger increase averaging approx. 4.2% has been recorded.
Average Residential Rents
4 5 6 7 8 9
10 11 12 13 14
2010 2011 2012 2013 2014 2015
EU
R/s
q. m
p.m
.
Berlin Dusseldorf Frankfurt Hamburg Munich
Source: Empirica
During the first nine months of 2015, a total of EUR18.2bn was invested in residential properties consisting of more than 50 units. This represents growth of 84% compared to the previous year. Due to limited supply, investors are now also considering smaller portfolios and developments. Up until the third quarter of 2015, almost 30% of transactions by volume was invested in developments. Overall, it is expected that the volume of transactions in 2015 will exceed the previous record seen in 2005.
Focus on LogisticsPrime rents for logistic properties generally stagnated in 2015. Only Munich recorded a slight increase, from EUR6.50/sq. m/month to EUR6.60/sq. m/month. Prime rents in the other four top cities have remained stable since 2014, ranging between EUR4.70/sq. m/month in Berlin and EUR6.30/sq. m/month in Frankfurt.
Prime Logistics Rents
0 1 2 3 4 5 6 7 8 9
10
2011 2012 2013 2014 2015 E
UR
/sq.
m p
.m.
Berlin Dusseldorf Frankfurt Hamburg Munich
Source: BNP Paribas Real Estate
In the first three quarters of 2015, a total of 4.62 million square meters of logistic space was taken up. This represents the second-best result ever recorded, approx. 28% above the long-term average. About two thirds of this was invested in new-build properties, demonstrating the strong demand for modern, high-capacity logistic properties.
Prime Logistics Yields
0% 1% 2% 3% 4% 5% 6% 7% 8%
Berlin Munich
H1
2010
H2
2010
H1
2011
H2
2011
H1
2012
H2
2012
H1
2013
H2
2013
H1
2014
H2
2014
H1
2015
H2
2015
Source: CBRE
The total volume of transactions in logistic properties exceeded EUR3.9bn, some 18% above the previous year’s record result.
The increasing volume of transactions shows how logistic properties are continuing to establish themselves as an asset class in the market. One consequence of this is the internationalisation of the market. In the first half of 2015, around 72% of capital invested in logistic properties came from foreign investors. A further consequence is the continuing decline in prime yields. Compared to 2014, yields decreased by 80bps, reaching 5.2% in Q4 2015.
Germany
© 2016 KPMG Holding AG/SA, a Swiss corporation, is a member of the KPMG network of independent firms affiliated with KPMG International Cooperative (“KPMG International”), a Swiss legal entity. All rights reserved. Printed in Switzerland. The KPMG name and logo are registered trademarks.
18 European Real SnapShot!

Nordic Region
Cross-border investors taking advantage of currency movements
Macroeconomic Overview Sweden• GDP: A pick-up ahead, led primarily by investment and
consumer spending • Inflation: Near-zero inflation is likely to persist in the short
term; increases expected in late 2015 thanks to low interest rates
• Employment: Expected to continue to improve gradually
Growth in the Swedish economy accelerated in Q2 2015 to 1.1% Q-o-Q (3.3% Y-o-Y). The consumer sector continues to witness favourable conditions, namely low inflation (0.1% in September following three months of deflation). GDP growth is expected to accelerate to 2.8% in 2015, driven by both domestic and external demand, with consumer spending expected to grow at a healthy pace and exports benefiting from gradual improvements in demand.
Economic Indicators
-6%-4%-2%0%2%4%6%8%10%12%
0%
2012
2013
2014
2015
2016
F
2017
F
2018
F
2019
F
2020
F
1%2%3%4%5%6% U
nemploym
ent & Inflation
GD
P g
row
th
GDP growth Unemployment rate Inflation (CPI)
Source: Economist Intelligence UnitF – forecast
Norway• GDP: A deceleration in H2 2015 followed by a rebound in
early 2016 • Inflation: Stable• Employment: Will fall gradually until mid-2016 and
stabilise thereafter
The Norwegian economy continued to grow, with a fall in GDP of 0.1% Q-o-Q in Q2 2015. However, consumers were affected by a continuing contraction in the oil sector and related industries. The economy is expected to grow at a rate of 2.3% in 2015 amid considerable uncertainty over the scale of the spill-over effects of the decline in the oil price to rest of the economy.
© 2016 KPMG Holding AG/SA, a Swiss corporation, is a member of the KPMG network of independent firms affiliated with KPMG International Cooperative (“KPMG International”), a Swiss legal entity. All rights reserved. Printed in Switzerland. The KPMG name and logo are registered trademarks.
European Real SnapShot! 19

quarter of expansion – the longest period of uninterrupted growth since 2000. As expected, fixed investment became the main driver of growth (up by 0.8% Y-o-Y) after a period of weakness during which private consumption faltered and government consumption was flat. Domestic demand contracted overall, whilst net exports contributed to growth on the back of a sharp decline in import volumes.
Economic Indicators
-6%-4%-2%0%2%4%6%8%10%12%
-1%
0%
1%
2%
3% Unem
ployment &
Inflation
GD
P g
row
th
GDP growth Unemployment rate Inflation (CPI)20
12
2013
2014
2015
2016
F
2017
F
2018
F
2019
F
2020
F
Source: Economist Intelligence Unit F – forecast
Office MarketSwedenPositive economic growth and a rise in employment have underpinned a robust office market in Sweden.
Sustained occupier demand was noted across the board, leading to falling vacancies and higher rents in the best submarkets in Stockholm and Gothenburg. Although office investment volumes were strong in Q3 2015, the EUR3.3bn achieved in the first nine months of 2015 are slightly below the figures achieved during the same time period in 2014. Furthermore, supply constraints continued to stifle turnover.
The outlook for the office market remains positive due to a strong labour market. This will help sustain occupier demand and lift prime rents even further.
Prime Office Rents
CA
GR
EU
R/s
q. m
p.a
.
Prime Rent CAGR (5yr) CAGR (1yr)
Sto
ckho
lm(N
orm
alm
stor
g)
Sto
ckho
lm(B
irger
Jar
lsga
tan)
Sto
ckho
lm(R
eger
ings
gata
n)
Sto
ckho
lm(D
ecen
tral
ised
)
Got
henb
urg
Mal
mö
0% 5% 10% 15% 20% 25%
0 100 200 300 400 500 600
Source: Cushman & Wakefield
Economic Indicators
-6%-4%-2%0%2%4%6%8%10%12%
-5%-4%-3%-2%-1%0%1%2%3%4%5%6% U
nemploym
ent & Inflation
GD
P g
row
th
GDP growth Unemployment rate Inflation (CPI)
2012
2013
2014
2015
2016
F
2017
F
2018
F
2019
F
2020
F
Source: Economist Intelligence Unit F – forecast
Finland• GDP: Positive but below-trend growth over the next two
years• Inflation: Will remain negative in the short term • Employment: Stable, following recent declines
The Finnish economy witnessed modest growth, with a government policy of deficit reduction, and consumer spending contracted by 0.7% over the previous quarter. Exports grew by 0.5% in Q2 2015 as a result of positive net foreign trade, and they are expected to grow by 0.5% this year, followed by 1.1% in 2016. Unemployment, fiscal austerity and low levels of sentiment are likely to dampen domestic demand, with negative GDP growth of 0.1% expected in 2015 but positive growth expected for 2016 and 2017.
Economic Indicators
-6%-4%-2%0%2%4%6%8%10%12%
-5%-4%-3%-2%-1%0%1%2%3%4%5%6%
Unem
ployment &
Inflation
GD
P g
row
th
GDP growth Unemployment rate Inflation (CPI)
2012
2013
2014
2015
2016
F
2017
F
2018
F
2019
F
2020
F
Source: Economist Intelligence UnitF – forecast
Denmark• GDP: Growth is expected to continue to improve steadily• Inflation: Likely to fall on the back of lower energy prices• Employment: Stable after recent marked improvements
The Danish economy grew by 0.2% Q-o-Q in Q2 2015, from 0.6% in Q1 2015. This marked the eighth consecutive
Nordic Region
© 2016 KPMG Holding AG/SA, a Swiss corporation, is a member of the KPMG network of independent firms affiliated with KPMG International Cooperative (“KPMG International”), a Swiss legal entity. All rights reserved. Printed in Switzerland. The KPMG name and logo are registered trademarks.
20 European Real SnapShot!

NorwayThe office investment market remained a top target for investors, mainly due to favourable financing conditions and low interest rates, with take-up volumes showing stability in Q3 2015.
GDP growth in mainland Norway is expected to remain positive in 2015 and 2016 despite the knock-on effects from the faltering oil sector, with rising unemployment beginning to weigh down on the performance of the office sector. Rents in all areas are expected to hold in the remainder of 2015 and may even improve over 2016, due to the limited speculative pipeline.
So far in 2016 the unemployment rate has been rising, impacting particularly on oil-related jobs and young people with no work experience. Volumes are still high, and prices for offices and logistics buildings are actually up in popular areas. In less popular areas, we see prices stagnating and even falling. We are still seeing many foreign investors coming to Norway to acquire solid properties with solid cash flow – and this is perhaps the main reason for the increasing prices.
In the oil-dependent regions such as between Stavanger and Bergen and beyond to Ålesund and Molde, prices are stagnating and even dropping. However, we understand that there are investors contemplating purchasing in these areas because of the possibility that oil prices will pick up again. These investors are stopping prices from falling far. Prime Office Rents – September 2015
Market (Submarket)Prime Rent –
EUR/sq. m p.a. CAGR (5yr) CAGR (1yr)
Oslo 548.0 8.4% 2.1%
Source: Cushman & Wakefield
FinlandThe investment market witnessed ongoing interest from pension funds and quoted real estate companies, with several office deals closing in Q3 2015, driven by increased availability of funding from international investors. Occupier demand remained firmly focused on modern, flexible and efficient space, to the detriment of older office space in secondary locations, as companies upgraded in a tenant-driven environment. Finland’s office market is anticipated to hold up, as economic growth is expected to persist – albeit at moderate levels – for the rest of 2015 and 2016.
Prime Office Rents
0%
2%
4%
6%
8%
0
100
200
300
400
500
Hel
sink
i (C
ity C
entr
e)
Hel
sink
i(o
ut-o
f-to
wn)
Turk
u
Tam
pere
CA
GR
Prime Rent
EU
R/s
q. m
p.a
.
CAGR (5yr) CAGR (1yr)
Source: Cushman & Wakefield
DenmarkConditions in the office market were buoyant over Q3 2015, with sustained activity in both the occupier and investment segments. Although office take-up levels waned slightly compared to Q2 2015, at over 210,000 sq. m they were largely on par with those achieved in previous quarters. The majority of deals were for office premises in the 1,000-5,000 sq. m bracket in Copenhagen, particularly in the Central Business District (CBD). Institutional investors were the most active buyers in the market, focusing on well-located properties in the city’s CBD and Harbour submarkets. Prime yields in Copenhagen City hardened by 25bps over the quarter, with most other markets across the country remaining stable.
Prime Office Rents
-3%-2%-1%0%1%2%3%4%5%
0
50
100
150
200
250
300
Cop
enha
gen
(Har
bour
Are
a)
Cop
enha
gen
(City
)
Cop
enha
gen
(Øre
stad
en)
Aar
hus
Ode
nse
CA
GR
EU
R/s
q. m
p.a
.
Prime Rent CAGR (5yr) CAGR (1yr)
Source: Cushman & Wakefield
© 2016 KPMG Holding AG/SA, a Swiss corporation, is a member of the KPMG network of independent firms affiliated with KPMG International Cooperative (“KPMG International”), a Swiss legal entity. All rights reserved. Printed in Switzerland. The KPMG name and logo are registered trademarks.
European Real SnapShot! 21

FinlandThe Finnish economy continued to stagnate in Q3 2015, with both domestic and external demand indicators remaining weak. Letting activity was confined to prime high streets within Helsinki and to dominant shopping centres with steady international demand, with prime rents remaining stable and supply increasing due to the completion and redevelopment of various shopping centres. The retail investment market was steady, with the Helsinki metropolitan area and the largest regional cities attracting the majority of the demand. Economic growth is expected to average 0.8% in 2015-2016. Prime Retail Rents
0.0%
0.5%
1.0%
1.5%
2.0%
2.5%
3.0%
3.5%
0
500
1,000
1,500
2,000
2,500
Helsinki Turku Tampere
High Street Shops
CA
GR
EU
R/s
q. m
p.a
.
Prime Rent CAGR (5yr) CAGR (1yr)
Source: Cushman & Wakefield
DenmarkThe retail property sector continued to perform strongly, with healthy demand from occupiers and investors for prime and, increasingly, secondary space. Prime high streets in Copenhagen, such as Strøget and Købmagergade, remained the top targets for expanding retailers, with a steady stream of new entrants considering opening flagship stores, over the next 12 months.
Prime Retail Rents
-1.5%-1.0%-0.5%0.0%0.5%1.0%1.5%2.0%2.5%3.0%3.5%
0
500
1,000
1,500
2,000
2,500
3,000
Copenhagen Aarhus Odense
High Street Shops
CA
GR
EU
R/s
q. m
p.a
.
Prime Rent CAGR (5yr) CAGR (1yr)
Source: Cushman & Wakefield
Retail MarketSwedenSweden witnessed growth in retail investment during the first three quarters (Q1 - Q3 2015), as strong demand from investor capital led to an increase in portfolio deals within the same period.
The retail sector accounted for a 15% share of the total volume invested in Q3 2015, with high liquidity and sharpening yields expected to continue. The economic climate in Sweden will continue to benefit the retail sector, with households and retailers taking a positive outlook.
Prime Retail Rents
1,560
1,400
506
968
678484
0
500
1,000
1,500
2,000
EU
R/s
q. m
p.a
.
Stockholm Gothenburg Malmo
High Street Shopping Centres
Source: CBRE
NorwayThe slowdown in oil-related industries in Norway continued to impact on the economy, with some of this weakness offset by expansionary fiscal and monetary policy. Retail sales remained relatively resilient, with retail volumes increasing by 0.9% Y-o-Y in August. Backed by healthy demand from international mass market retailers, a large proportion of occupier demand is still focused on Oslo’s prime high streets, with vacancy rates close to zero. In terms of investment, domestic investors continued to dominate, with international demand still selective. Prime Retail Rents
0%2%4%6%8%10%12%14%
0500
1,0001,5002,0002,5003,000
Osl
o(K
arl J
ohan
Gat
e)
Osl
o(B
ogst
ad-
veie
nS
tree
t)
High Street Shops
CA
GR
EU
R/s
q. m
p.a
.
Prime Rent CAGR (5yr) CAGR (1yr)
Source: Cushman & Wakefield
Nordic Region
© 2016 KPMG Holding AG/SA, a Swiss corporation, is a member of the KPMG network of independent firms affiliated with KPMG International Cooperative (“KPMG International”), a Swiss legal entity. All rights reserved. Printed in Switzerland. The KPMG name and logo are registered trademarks.
22 European Real SnapShot!

Residential MarketSwedenSweden has witnessed a debt-fuelled house price boom, especially around Stockholm. Its price growth was the highest in Europe, increasing by 11.1% during 2014. The residential sector of the real estate market accounted for about 16.0% of total investment turnover in Q3 2015 and was backed by various significant deals. The average price for detached and semi-detached homes increased by 5.4% in November 2015 compared to November 2014.
House Price Change
-5%
0%
5%
10%
2007 2008 2009 2010 2011 2012 2013 2014 2015
Q1 Q2 Q3 Q4
Source: Statistics Sweden
NorwayResidential prices in Norway increased by 1.2% (seasonally-adjusted) between Q2 and Q3 2015. The increase in prices during that period was greatest for detached houses, at 1.4%. During the same period, prices for apartments in blocks and small houses increased by 1.1% and 0.4% respectively. Residential prices increased fastest during the quarter in Oslo and South Eastern Norway, by 2.1% and 1.9% respectively. Only Stavanger saw house prices fall during this period, by 1.9%. House prices in Oslo increased strongly, by 10.3 % Y-o-Y to Q3 2015. Prices for apartments in blocks increased most, by 12.4%.
In January 2016, prices for apartments and houses in Oslo were up 4.2%. Most sales are above the guide price. This is because there is insufficient supply to meet demand. It is planned to construct 6,000 units p.a. in Oslo, but demand is at least double that. Note that builders are avoiding projects in less popular areas on the outskirts of Oslo. We are also seeing centrally placed office buildings turned into apartment buildings - indicating perhaps that the market for apartments is stronger than the office market.
House Price Change
1.22.1
-1.9
0.71.6
6.1
10.3
-5.3
7.4 7.1
-8%
-6%
-4%
-2%
0%
2%
4%
6%
8%
10%
12%
Norway Oslo Stavanger Bergen Trondheim
Q2 2015-Q3 2015 Q3 2014-Q3 2015
Source: Statistics Norway
FinlandIn Q2 2015, prices for older homes remained unchanged from the previous quarter. In Greater Helsinki, prices went down by 0.1%, but rose by 1.2% across the rest of Finland. This represents a fall of 0.5% in prices across the country Y-o-Y. In Q3 2015, the average price of an older home was EUR2,278/sq. m in the country as a whole, EUR3,549/sq. m in Greater Helsinki and EUR1,708/sq. m elsewhere.
House Price Change
-6%
-4%
-2%
0%
2%
4%
2006 2007 2008 2009 2010 2011 2012 2013 2014 2015
Q1 Q2 Q3 Q4
Source: Statistics Finland
© 2016 KPMG Holding AG/SA, a Swiss corporation, is a member of the KPMG network of independent firms affiliated with KPMG International Cooperative (“KPMG International”), a Swiss legal entity. All rights reserved. Printed in Switzerland. The KPMG name and logo are registered trademarks.
European Real SnapShot! 23

Focus on LogisticsDenmarkDemand for modern industrial and logistic properties remains strong. The market for industrial and logistic properties in prime locations in Copenhagen, the area around Køge Bay, the Triangle Region and the Aarhus area is interesting to investors due to the low vacancy rate. The vacancy rate for industrial and logistic properties remains relatively low across the country, showing a slightly decreasing trend over the last four years. At the start of Q3 2015, the vacancy rate was 3.4% and is expected to remain stable over the next few years. The relatively weak growth in industrial production over recent years was broken by solid growth of approx. 2% in Q2 2015 (seasonally-adjusted) compared to the previous quarter. This reflects the generally positive trends in the Danish economy. If this positive trend in industrial production continues, it is expected that demand for industrial and warehousing space will strengthen.
The best industrial and logistic properties are still being traded at yields of around 6.75% for the most modern properties in top locations. The yield for prime locations has been stable for a long time, but many secondary properties are still being traded at high yields in the order of 10% - 12%. A large proportion of less modern properties in secondary and tertiary locations require even higher yields to secure a signed purchase contract. There is still a shortage of modern industrial and logistic properties in both the investment and rental markets. The lack of investment properties is a consequence of a general trend towards owner-occupation. However, this trend is showing signs of turning, as sale and lease-back arrangements have gained in popularity in recent years. In the rental market, the low vacancy rate has limited opportunities for finding attractive leases. Construction activity for new industrial and logistic properties is still low. For property developers, constructing industrial and logistic properties is often not profitable.
Property Prices
0
500
1,000
1,500
2,000
2,500
3,000
3,500
Q3 2014 Q4 2014 Q1 2015 Q2 2015 Q3 2015
EU
R/s
q. m
All Denmark detached/terraced houseAll Denmark owner-occupied flatAll Denmark holiday home
Source: Association of Danish Mortgage Banks
DenmarkResidential property prices in Copenhagen have been rising at a steady pace following their slow recovery from the global economic crisis. The average price for owner-occupied apartments rose by 11.7% Y-o-Y to EUR3,040/sq. m in Q3 2015. Holiday home prices were up by just 1.8% to EUR1,845/sq. m. Detached and terraced house prices in Denmark rose by 7.1% Y-o-Y to EUR1,624/sq. m in Q3 2015. The average price of detached and terraced houses in the capital city Copenhagen soared by 12.3% Y-o-Y to EUR4,087/sq. m in Q3 2015.
Nordic Region
© 2016 KPMG Holding AG/SA, a Swiss corporation, is a member of the KPMG network of independent firms affiliated with KPMG International Cooperative (“KPMG International”), a Swiss legal entity. All rights reserved. Printed in Switzerland. The KPMG name and logo are registered trademarks.
24 European Real SnapShot!

The Netherlands
Positive economic outlook
Macroeconomic Overview Prospects for the Netherlands have improved over the last couple of years. For the first time since the financial crisis, GDP growth is expected to exceed 2.0%. The estimate of 2.0% for 2015 and the forecast of 2.1% for 2016 continue the positive trend that started in 2014 (+1.0%).
The improvement in economic growth is driven mainly by enhanced domestic consumption which is predicted to grow by 2.0% in 2016. This growth is the result of an improving labour market, increased salaries and cuts in taxes on employment.
In Q2 2015, there was a comparative slowdown in GDP growth due to government-imposed restrictions on gas production. Nevertheless, the Dutch economy outperformed the average GDP growth of the Eurozone countries.
GDP was positively affected by an increase in international trading activity. This increased trading activity was the result of an improved market position due to the weaker Euro and improved global trading volumes.
Economic Indicators
-4%
-2%
0%
2%
4%
6%
8%
2012 2013 2014 2015E 2016F
GDP growth Unemployment rate Inflation (CPI)
Source: Centraal Plan Bureau E – estimateF – forecast
The positive economic outlook resulted in an increase in private investment and heightened hiring activity. Due to an increase in demand for manpower, the unemployment rate fell from 7.4% to 6.9% in 2015. It is expected to fall further in 2016, to 6.7%. The 2015 and 2016 unemployment rates are far lower than the average unemployment rate of 9.3% across the European Union.
At an estimated rate of 0.9% for 2016, inflation remains relatively low. This inflation forecast is in line with European Central Bank estimates (±1.0%). The increase in inflation is mainly due to oil prices bottoming out, increased labour costs and the continuous increase in rents.
© 2016 KPMG Holding AG/SA, a Swiss corporation, is a member of the KPMG network of independent firms affiliated with KPMG International Cooperative (“KPMG International”), a Swiss legal entity. All rights reserved. Printed in Switzerland. The KPMG name and logo are registered trademarks.
European Real SnapShot! 25

Prime Office Rents – September 2015
-2%
0%
2%
4%
6%
8%
10%
0 50
100 150 200 250 300 350 400
Am
ster
dam
(Sou
th A
xis)
Am
ster
dam
(Cen
tral
)
Am
ster
dam
(Sou
th E
ast)
Rot
terd
am
The
Hag
ue
Utr
echt
Ein
dhov
en
CA
GR
EU
R/s
q. m
p.a
.
Prime Rent CAGR (5yr) CAGR (1yr)
Source: Cushman & Wakefield
Amsterdam (South Axis) remains the area with the highest average rents, at approx. EUR370/sq. m p.a. In terms of movements in rental levels, only properties in Central Amsterdam and Rotterdam appear to have experienced an increase during the past year. When one extends the period under review to five years, it can be seen that all the country’s cities have experienced relatively stable rents. The highest average five year increase was recorded for properties in the centre of Amsterdam, and was attributable mainly to last year’s rise in rents. Throughout the country, in 2015 the average rent decreased by 0.8% to EUR131/ sq. m p.a.
One of the recurring trends in the office market is the contraction of gross yields. For all the regions described, a contraction of the gross yield has taken place, with the South-East district of Amsterdam appearing to have experienced the greatest contraction (from 8.3% to 7.1%). This result reflects a gradual shift in demand for office space towards relatively sub-prime locations. As well as sub-prime locations around top tier cities, demand also appears to be shifting towards second tier cities (e.g. Arnhem). Across the Netherlands, the vacancy rate decreased by 1.7% to 15.8% (or 7.8 million sq. m).
Prime Office Yields (Gross)
0% 1% 2% 3% 4% 5% 6% 7% 8% 9%
10%
Am
ster
dam
(Sou
th A
xis)
Am
ster
dam
(Cen
tral
)
Am
ster
dam
(Sou
th E
ast)
Rot
terd
am
The
Hag
ue
Utr
echt
Ein
dhov
en
Current Quarter Last Year
Source: DTZ Zadelhoff, Cushman & Wakefield
In conclusion, the Dutch economy can be expected to strengthen over the next couple of years. Nevertheless, certain external factors could harm the prosperity of the Netherlands. Factors include the volatility on the Chinese stock markets, the position of Greece in Europe and the volatility in the Middle East.
Office MarketDue to an upswing in the Dutch economy, the office market is expected to improve slightly. This improvement will result in a reduction in vacancy rates, although most of the extra demand is geographically focused on the economically stronger regions of the Netherlands.
Nevertheless, the total volume of vacancies has increased over the last few years due to the aftermath of the financial crisis and more flexible ways of working. In December 2015, the total volume of vacancies amounted to 7.8 million sq. m. Previous quarters indicate a slow stabilisation in the volume of vacancies, whilst in certain areas (e.g. Amsterdam, Tilburg and Groningen), a decrease in supply is indicated. A large proportion of office demand comes from the IT and industrial sectors.
Currently, the Dutch government is also trying to persuade owners of vacant office space to offer their properties to provide temporary shelter for refugees. The willingness of real estate investors to (temporarily) switch their business plans depends on the investment required and the estimated rental income. As well as (temporary) conversions to refugee shelters, during Q3 2015 several office premises were transformed into (student) residencies and hotels. Most of the converted office properties were already outdated, and therefore the conversions have absorbed a significant volume of vacancy. As a number of successful conversions have already been completed, this provides a (relatively) new opportunity for real estate investors.
Moreover, conversions have been required by the institutions which fund real estate investors. PGGM, for example, required all of its real estate investors to refocus on sustainability, pursuing a 50% reduction in CO2 emissions within five years.
The Netherlands
© 2016 KPMG Holding AG/SA, a Swiss corporation, is a member of the KPMG network of independent firms affiliated with KPMG International Cooperative (“KPMG International”), a Swiss legal entity. All rights reserved. Printed in Switzerland. The KPMG name and logo are registered trademarks.
26 European Real SnapShot!

Retail Market Due to an increase in income and improved consumer sentiment, the outlook for the Dutch retail market is positive. However, e-commerce remains a threat to regular retail. Previous research estimates that approx. 19% of all current consumer spending occurs online. Nevertheless, retail property posted an all-time record investment volume of EUR2.8bn in 2015.
In addition to the threat of e-commerce, recent years have shown continuous decrease in commercial rental income. Geographical positioning has also become more important over the years. Significant variations in vacancy rates, number of transactions and rents appear to depend solely on geographical location (top tier city compared to second tier city, prime location compared to off centre / secondary location). Nevertheless, several prime locations in top tier cities, e.g. Rotterdam and The Hague, experienced falls in rents.
Prime Retail Rents
10% 8% 6% 4% 2% 0%2% 4% 6%
0 500
1,000 1,500 2,000 2,500 3,000 3,500
Am
ster
dam
Rot
terd
am
The
Hag
ue
Utr
echt
Maa
tric
ht
Ein
dhov
en
CA
GR
EU
R/s
q. m
p.a
.
Prime Rent CAGR (5yr) CAGR (1yr)
Source: Cushman & Wakefield
The short-term outlook is that investors remain focused on prime locations. The insolvencies of national retail chains such as V&D, DA and Invito and the resulting potential for vacancies may stir the market and create opportunities for investors.
Residential MarketDespite the more stringent financing requirements introduced by the Dutch Government from 1 July 2015, low interest rates and improvements in consumer sentiment and the economy have impacted positively on the total number of transactions. Estimates indicate that the total number of transactions completed in 2015 was more than 20% higher than the previous year, and comparable to the situation pre-crisis.
Dutch Residential Sales
195
200
205
210
215
220
225
230
235
240
0
10
20
30
40
50
60
Q1
2012
Q2
2012
Q3
2012
Q4
2012
Q1
2013
Q2
2013
Q3
2013
Q4
2013
Q1
2014
Q2
2014
Q3
2014
Q4
2014
Q1
2015
Q2
2015
Q3
2015
Q4
2015
Average P
rice (in EU
R,000)
Tran
sact
ions
,000
Transactions Average Price
Source: Kadaster
The average transaction price per residential property increased by 5.1% to approx. EUR 225,000. Larger cities even observed double digit growth, of which the highest can be found in Amsterdam, where transaction prices increased by approx. 17%. Due to a shortage of residential real estate (especially in top tier cities), transaction prices are expected to continue increasing. There appear to be opportunities for local government, developers and investors in the development / redevelopment of residential real estate in top tier cities.
The outlook for 2016 remains positive and foreign investors may invest significant volumes of capital in view of the promising market conditions.
© 2016 KPMG Holding AG/SA, a Swiss corporation, is a member of the KPMG network of independent firms affiliated with KPMG International Cooperative (“KPMG International”), a Swiss legal entity. All rights reserved. Printed in Switzerland. The KPMG name and logo are registered trademarks.
European Real SnapShot! 27

Focus on LogisticsDemand for logistic space for both domestic and international distribution strengthened during 2015 due to increasing domestic consumption and an improved international trade situation. Take-up of logistic premises even achieved one of its highest half-year totals during the first six months of 2015 (approx. 705,000 sq. m). Compared to previous years, take-up also appeared to be spread more evenly across the country, indicating an increase in demand for domestic distribution.
One of the trends witnessed in the logistics real estate market is the gradual shift towards built-to-suit and pre-let properties. The reason for this shift can be found in occupiers’ preference for modern and customised facilities. As most of the new-build real estate includes more space than is initially let, these developments have led to an increase in vacancy rates. Vacancy rates are currently estimated at 6.3%, but will increase gradually as a result of new completions.
Finally, the rise of e-commerce described above provides new opportunities for logistic real estate. With a greater focus on nationwide coverage, e-commerce companies require warehouses throughout the Netherlands. As e-commerce business is expected to increase significantly over the years, the outlook looks promising for the market.
© 2016 KPMG Holding AG/SA, a Swiss corporation, is a member of the KPMG network of independent firms affiliated with KPMG International Cooperative (“KPMG International”), a Swiss legal entity. All rights reserved. Printed in Switzerland. The KPMG name and logo are registered trademarks.
28 European Real SnapShot!

Belgium
On a path of economic recovery
Macroeconomic Overview • GDP: Growth is expected to be steady in 2016• Inflation: Anticipated to rise in 2016• Employment: Gradually improving in 2016 as firms renew
expansion plans
The Belgian economy slowed in the second half of 2015, mainly due to weaker growth in household consumption, with the government’s imposition of a wage freeze across the whole economy until 2017. Consumer confidence has witnessed an increase in recent months, primarily due to greater positivity around employment prospects and the outlook for the economy. Exports rose steadily throughout 2015, supported by the weak Euro and improved demand from key Eurozone trading partners. In 2016, GDP growth is expected to register an increase in all sectors of the economy except public spending.
Economic Indicators
-6%
-2%
2%
6%
10%
0%
2%
4%
6% Unem
ployment &
Inflation
GD
P g
row
th
GDP growth
2012
2013
2014
2015
2016
F
2017
F
2018
F
2019
F
2020
FUnemployment rate Inflation (CPI)
Source: Economist Intelligence Unit F – forecast
Office MarketWith positive indications for employment prospects and increasing business confidence, Belgium is on a path of economic recovery. This trend suggests an active office market in 2016, following a subdued lettings market for most of 2015. Although take-up in 2015 was amongst the lowest on record, the size and number of active enquiries in the market are already pointing to a healthy start to 2016. As the economy improves, office market conditions are expected to follow suit.
© 2016 KPMG Holding AG/SA, a Swiss corporation, is a member of the KPMG network of independent firms affiliated with KPMG International Cooperative (“KPMG International”), a Swiss legal entity. All rights reserved. Printed in Switzerland. The KPMG name and logo are registered trademarks.
European Real SnapShot! 29

Residential MarketBelgium’s housing market is considered to be over-valued, with prices above the European average. Nonetheless, the market is gearing towards development. House prices rose by 1.1% Y-o-Y in 2014. On a quarterly basis, house prices increased 1% in Q4 2014. Over the past year, gross rental yields in Brussels have remained steady, with gross rental yields on apartments ranging from around 4.6% to 5.5%, whilst yields on houses range from 4.5% to 5%. There has been a sharp rise in the prices of apartments and houses in the prime districts of Brussels. The high “round trip” transaction cost for buyers of residential property also discourages investors in Belgium. House Price Change
-3%
-2%
-1%
0%
1%
2%
3%
4%
2008 2009 2010 2011 2012 2013 2014
Q1 Q2 Q3 Q4
Source: Statistics Belgium
Prime Office Rents
0%
2%
4%
6%
8%
10%
0
50
100
150
200
250
300
Bru
ssel
s(E
U L
eopo
ld)
Bru
ssel
s (P
enta
gon)
Bru
ssel
s (D
ecen
tral
ised
)
Bru
ssel
s (P
erip
hery
)
Ant
wer
p
CA
GR
EU
R/s
q. m
p.a
.
Prime Rent CAGR (5yr) CAGR (1yr)
Source: Cushman & Wakefield
Retail MarketRecent fiscal reforms, higher energy costs and poor market competitiveness have had a negative impact on retail sales in Belgium. A decline in sentiment was recorded in Belgium’s occupational market over the first half of 2015, but it has been picking up over recent quarters. The retail sector emerged as the strongest performing property segment, contributing almost half of total investments in Belgium’s property market by volume. Over the next year, the core occupier and investment markets are expected to experience strong demand, resulting in moderate rental growth in certain prime retail locations.
Prime Retail Yields
0% 1% 2% 3% 4% 5% 6% 7% 8%
Bru
ssel
s
Ant
wer
p
Lieg
e
Ghe
nt
Bru
ges
Has
selt
Bel
gium
High Street Shops Shopping Centres
Current Quarter Last Year
Source: Cushman & Wakefield
Belgium
© 2016 KPMG Holding AG/SA, a Swiss corporation, is a member of the KPMG network of independent firms affiliated with KPMG International Cooperative (“KPMG International”), a Swiss legal entity. All rights reserved. Printed in Switzerland. The KPMG name and logo are registered trademarks.
30 European Real SnapShot!

Luxembourg
Another strong year for the real estate sector
Macroeconomic Overview Economic growth slowed slightly in 2015; nevertheless, it remained significantly higher than the Eurozone average. This economic expansion is driven mainly by strong domestic consumption and a robust financial sector. The substantial exposure to the financial sector is well diversified, as Luxembourg continues to attract a growing number of mutual funds and insurance companies.
Unemployment stood at 6.9% in 2015, down from 7.1% in the previous year. The biggest improvements were in the retail, construction, hotels, restaurants and healthcare sectors. However, the manufacturing sector is still suffering. A particular concern is youth unemployment (age 15-24) which makes up 18.5% of the total (as of August 2015). Youth unemployment is concentrated amongst low-skilled workers. Overall, however, employment growth is expected to continue but the labour force will grow even faster.
Luxembourg is seen as a stable, diverse and dynamic economy, bordering on Belgium, Germany and France. Located at the heart of Europe, it benefits from excellent connections to markets across the EU and worldwide. Luxembourg exports approx. 80% of its output (mainly services) and exhibits solid macroeconomic fundamentals. Historically, the steel industry was the leading activity in the industrial sector. However, a transformation of its economic structure over time has seen Luxembourg refocusing on financial services. More recently, this sector has also been complemented by telecommunications and IT services. At present, the financial sector accounts for approx. 27% of GDP and has more than compensated for the decline in the steel industry.
Economic Indicators
-0.8%
4.3% 4.1%
3.2% 3.4%
6.1% 6.9% 7.1% 6.9% 6.8%
2.7%
1.7%
0.6% 0.5% 1.3%
-2%
-1%
0%
1%
2%
3%
4%
5%
6%
7%
8%
2012 2013 2014 2015 2016F
GDP growth Unemployment rate Inflation
Source: Statec F – forecast
© 2016 KPMG Holding AG/SA, a Swiss corporation, is a member of the KPMG network of independent firms affiliated with KPMG International Cooperative (“KPMG International”), a Swiss legal entity. All rights reserved. Printed in Switzerland. The KPMG name and logo are registered trademarks.
European Real SnapShot! 31

Prime Rent Evolution – Luxembourg-City
15
20
25
30
35
40
45
50
2005 2006 2007 2008 2009 2010 2011 2012 2013 2014 2015
EU
R/s
q.m
p.m
.
CBD Station Kirchberg
Source: Inowai
As of Q3 2015, in the CBD prime rents have remained stable at EUR45.00/sq. m/month since Q4 2014. However, Kirchberg has seen an increase of 5.3% Y-o-Y to EUR35.00/sq. m/month. It is anticipated that the shortage of supply of quality accommodation could result in a further upward pressure on prime rents going forward.
Office Market Overview 2015
Key areasVacancy
rateYield
Q3 2015
Rent (EUR/sq. m
p.m.)Stock
(sq. m)
Luxembourg City (CBD)
3.30% 5.1% 45.0 822,000
Luxembourg City (Station)
4.90% 5.2% 35.0 383,500
Luxembourg Kirchberg
1.60% 5.8% 35.0 948,500
Source: Inowai for Vacancy Rate, Rent and Stock; Cushman & Wakefield for Prime Yield
Vacancy rates declined to 4.2% in 2015 (compared to 4.7% in 2014), with the lowest vacancy in the CBD and Kirchberg. The vacancy rate in the periphery is slightly higher but it is expected to decline throughout the year due to stable demand.
Despite a number of speculative completions scheduled for 2016 which may increase the vacancy rate, overall office sector vacancy in Luxembourg remains one of the lowest in Europe.
132,000 sq. m are planned for completion in 2016, including major projects such as the new ING headquarters and Royal20.
Prospects for 2016 are positive. Growth in the Luxembourg economy is expected to intensify office demand.
As already highlighted, the ongoing growth of the economy is the result of resilient domestic demand and the dynamism of the financial sector. As a small and open economy, Luxembourg tends to rely more on overall European economic development, which is expected to be positive over the short-term for the majority of EU countries. The predominance of financial activity may create potential vulnerabilities, but the sector’s contribution may decline over the coming years. To maintain a competitive advantage, the economy may need to diversify into high added-value and highly skill-intensive activities.
In common with other European countries, Luxembourg has been registering low inflation levels since 2012.
Office MarketLuxembourg has experienced a strong year in terms of investment transactions. Investment came close to the EUR1bn mark, for a volume of 231,000 sq. m (15% higher than 2014). With regard to the letting market, 2015 was the year of “mega-deals”, with seven large lettings over 10,000 sq. m recorded. The office market is still benefitting from the prosperous economic environment and the development of the financial sector.
Office Investment Volumes
367 567
685
889 979
0
200
400
600
800
1,000
1,200
2011 2012 2013 2014 2015
EU
Rm
Source: JLL The major lettings were mainly attributable to financial and legal service providers. They included Arendt House (15,400 sq. m), the new EY headquarters (15,262 sq. m) and the European Investment Bank (21,400 sq. m), all located in the Kirchberg district.
Luxembourg
© 2016 KPMG Holding AG/SA, a Swiss corporation, is a member of the KPMG network of independent firms affiliated with KPMG International Cooperative (“KPMG International”), a Swiss legal entity. All rights reserved. Printed in Switzerland. The KPMG name and logo are registered trademarks.
32 European Real SnapShot!

Retail Market The beginning of 2015 saw a surge of interest from overseas investors focusing primarily on Core high street locations in Luxembourg City such as Grand-Rue, Avenue de la Gare and Avenue de la Liberté.
The shortage of available supply in these locations meant that a low vacancy rate was recorded. In Q3 2015, activity in the letting market was very modest, with nine new lettings (totalling approx. 3,063 sq. m). This limited activity is consistent with the trend of the preceding 18 months. The Retail Market Overview table provides a snapshot of how current rental trends in Luxembourg’s main retail locations are reflected in growth performance over one and five years. Retail Market Overview 2015
Key areasMajor
retailers
Rent (EUR/sq. m
p.m.)
Rent (EUR/sq. m
p.a.)CAGR 1Y (%)
CAGR 5Y (%)
Grand-Rue H&M, Zara, Louis
Vuitton
135.0 1,620.0 8.0 2.4
Avenue de la gare
Saturn, Veritas,
Okaidi, WE
70.0 840.0 – 1.5
Luxembourg City
Various 19.0 228.0 5.6 –
Source: Cushman & Wakefield
On the supply side, there is a substantial number of shopping centre projects in the pipeline; however, planning permission has not been granted yet for several projects. It is expected that the re-modelling of the Auchan shopping centre (Kirchberg) into a luxury shopping destination will be completed in 2016. The 16,000 sq. m Royal Hamilius development and the 5,000 sq. m extension of City Concorde are also expected to be completed in 2016.
Over the past year, the Luxembourg market has recorded an increase in the number of foreign investors launching large investments in the retail sector, such as Royal Hamilius (mentioned above), partly financed by a Middle East investment fund.
Residential MarketInvestmentThe VAT system was reformed with effect from 1 January 2015 and this affected the residential sector. Prior to 2015, a buyer of residential accommodation had to pay VAT at the rate of 3% up to a threshold of EUR416,667, irrespective of whether the purchase was an investment or for owner-occupation. Above that amount, the regular VAT rate was applicable. Since the new tax regime was put in place, investment and occupational buyers have been treated differently. An investment buyer will pay the normal VAT rate of 17%. However, a purchaser for occupation will now pay VAT at a rate of 3% up to a threshold of EUR357,153, and the regular VAT rate will apply on the portion of the price above this amount.
The announcement of the changes to the VAT system considerably increased the volume of residential transactions at the end of 2014 and generated buoyant activity until Q1 2015 (+12% for Q1 2015, Y-o-Y). However, the volume of transactions in Q2 2015 reverted to a similar level to Q2 2014 (+4% in Q2 2015, Y-o-Y).
Prices for registered sales transactions for existing accommodation increased by 3.4% to Q2 2015 (Y-o-Y), in line with the preceding years. Prices for residential property under construction rose by 8.2% over the same period.
Price Variations in the Residential Market
100
110
120
130
140
150
160
H1 H2 H1 H2 H1 H2 H1 H2 H1 H2 H1 H2 H1 H2 H1 H2
2008 2009 2010 2011 2012 2013 2014 2015
Bas
e 10
0 | Q
1 20
05
House sales Apartment sales
House rental Apartment rental
Source: Observatoire de l’habitat
© 2016 KPMG Holding AG/SA, a Swiss corporation, is a member of the KPMG network of independent firms affiliated with KPMG International Cooperative (“KPMG International”), a Swiss legal entity. All rights reserved. Printed in Switzerland. The KPMG name and logo are registered trademarks.
European Real SnapShot! 33

In Q3 2015, the average price for houses in Luxembourg stood close to EUR3,885/sq. m, whilst the prevailing average price for apartments was EUR5,160/sq. m. The Y-o-Y price variation was around 3.5% for houses and 9.2% for apartments. In the case of Luxembourg City, average prices for houses were close to EUR5,250/sq. m and EUR7,090/sq. m for apartments. The Y-o-Y price variation was 4.6% for houses and 6.3% for apartments.
Luxembourg
Focus on Logistics
BackgroundThe logistics sector in Luxembourg is constantly evolving and benefits from the direct involvement of the government. Indeed, in 2004 the national authorities launched a multimodal economic programme in order to diversify Luxembourg’s economy. Logistics and transportation were a key driver for diversification. Due to its favourable geographical location, there has been quite a high presence of logistic and cargo operators across Luxembourg, such as: Cargolux, Kühne & Nagel, Panalpina, DB Schenker, DuPont etc., and they dominate the letting market.
In 2006 and later in 2007, an action plan was drawn up in order to define the sub-sectors to be targeted within the logistics market: high added-value logistics (e.g. art, jewellery, etc.) and non-cyclical logistic activities (e.g. pharmaceutical products). Furthermore, to enhance coordination between the local sub-sectors (air, road, shipping and rail) and the efficiency of that segment, the “Cluster for Logistics” was created in 2009. The prime objectives of this public organisation are: (i) to serve as a neutral coordinator between logistic sub-sectors and as an information and communications platform; (ii) to represent the common interests of firms in relation to the future development of the logistics sector; (iii) to guide firms in innovation and the development of their logistics skills, the main drivers of competitiveness and; (iv) to promote Luxembourg abroad as a logistic hub. In 2013, the logistics sector accounted for 2.5% of Luxembourg’s GDP.
Global TrendsThe sector has seen significant growth over the past decade. Luxembourg is actually an attractive hub for logistic companies for several reasons. It is a small country in central Western Europe, close to major European seaports (such as Antwerp, Zeebrugge, and Rotterdam) with both easy and fast import / export procedures and a stable business environment.
In addition, several public initiatives helped generate business opportunities abroad, such as developing the rail connection which will soon be operational between Luxembourg and Poland.
The proactive programme to develop the logistics sector has resulted in a sustainable improvement in Luxembourg’s competitiveness over the past decade. It has been assessed by the World Bank Logistics Performance Index (LPI). The World Bank’s Domestic LPI “provides both qualitative and quantitative assessments of a country by logistics professionals working inside it. It includes detailed information on the logistics environment, core logistic processes, institutions, and performance time and cost data” (The World Bank).
Rental MarketDuring Q3 2015, the average asking rent in Luxembourg for houses was EUR2,557/month (EUR13.35/sq. m/month) and EUR1,384/month (EUR19.46/sq. m/month) for apartments. This represents an increase of 5.1% and 3.1% respectively compared to the same period last year. Looking at Luxembourg City, rents were approx. EUR3,650/month (EUR17.83/sq. m/month) for houses and EUR1,620/month (EUR22.81/sq. m/month) for apartments. This represents an annual increase of 7.5% for houses and 0.9% for apartments. The average size of properties on the market was 192 sq. m and 71 sq. m, respectively.
© 2016 KPMG Holding AG/SA, a Swiss corporation, is a member of the KPMG network of independent firms affiliated with KPMG International Cooperative (“KPMG International”), a Swiss legal entity. All rights reserved. Printed in Switzerland. The KPMG name and logo are registered trademarks.
34 European Real SnapShot!
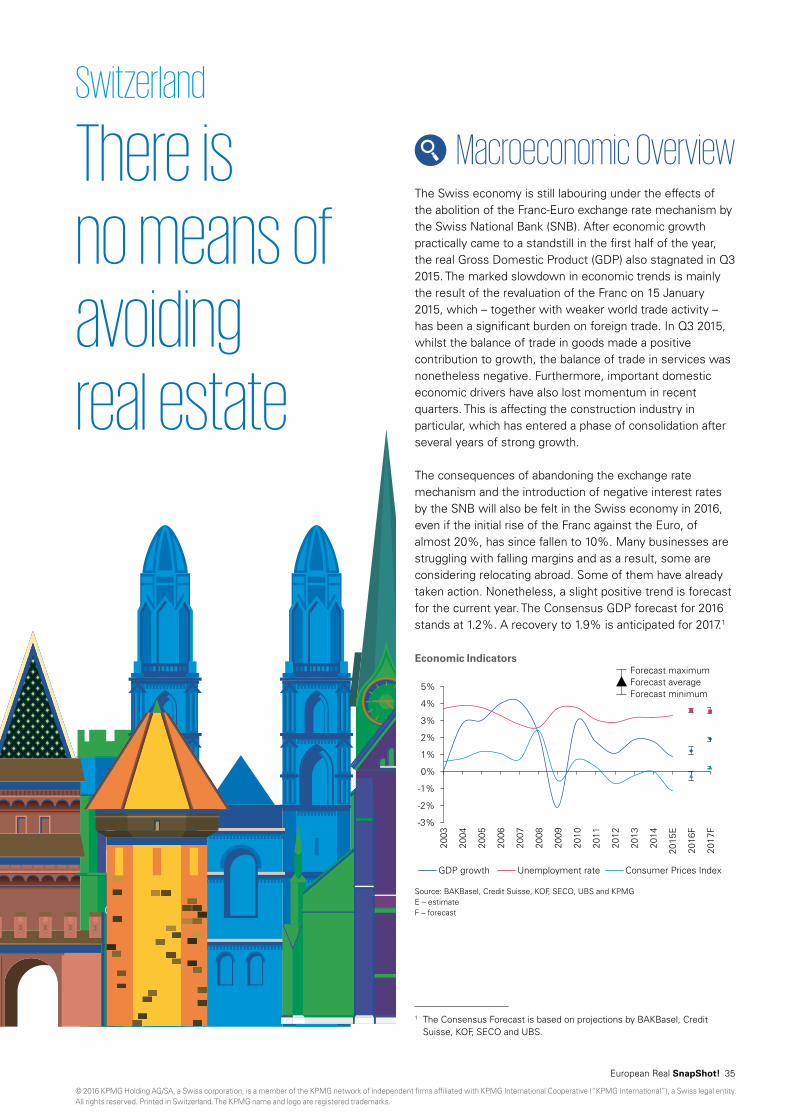
Switzerland
There is no means of avoiding real estate
Macroeconomic Overview The Swiss economy is still labouring under the effects of the abolition of the Franc-Euro exchange rate mechanism by the Swiss National Bank (SNB). After economic growth practically came to a standstill in the first half of the year, the real Gross Domestic Product (GDP) also stagnated in Q3 2015. The marked slowdown in economic trends is mainly the result of the revaluation of the Franc on 15 January 2015, which – together with weaker world trade activity – has been a significant burden on foreign trade. In Q3 2015, whilst the balance of trade in goods made a positive contribution to growth, the balance of trade in services was nonetheless negative. Furthermore, important domestic economic drivers have also lost momentum in recent quarters. This is affecting the construction industry in particular, which has entered a phase of consolidation after several years of strong growth.
The consequences of abandoning the exchange rate mechanism and the introduction of negative interest rates by the SNB will also be felt in the Swiss economy in 2016, even if the initial rise of the Franc against the Euro, of almost 20%, has since fallen to 10%. Many businesses are struggling with falling margins and as a result, some are considering relocating abroad. Some of them have already taken action. Nonetheless, a slight positive trend is forecast for the current year. The Consensus GDP forecast for 2016 stands at 1.2%. A recovery to 1.9% is anticipated for 2017.1
Economic Indicators
-3%
-2%
-1%
0%
1%
2%
3%
4%
5%
2003
2004
2005
2006
2007
2008
2009
2010
2011
2012
2013
2014
2015
E
2016
F
2017
F
GDP growth Unemployment rate Consumer Prices Index
Forecast maximumForecast averageForecast minimum
Source: BAKBasel, Credit Suisse, KOF, SECO, UBS and KPMGE – estimateF – forecast
1 The Consensus Forecast is based on projections by BAKBasel, Credit Suisse, KOF, SECO and UBS.
© 2016 KPMG Holding AG/SA, a Swiss corporation, is a member of the KPMG network of independent firms affiliated with KPMG International Cooperative (“KPMG International”), a Swiss legal entity. All rights reserved. Printed in Switzerland. The KPMG name and logo are registered trademarks.
European Real SnapShot! 35

Asking Rents for Office Space in the Major Centres
90100110120130140150160170180
Q1
2000
Q1
2001
Q1
2002
Q1
2003
Q1
2004
Q1
2005
Q1
2006
Q1
2007
Q1
2008
Q1
2009
Q1
2010
Q1
2011
Q1
2012
Q1
2013
Q1
2014
Q1
2015
Ren
tal P
rice
Inde
x
Basel Berne Geneva Zurich
Source: W&P and KPMG
Retail Market After the currency shock of January 2015, retailers began the year with significant falls in sales. Sales did recover slightly over the course of the year, but this could not prevent a negative year-end result. At year-end 2015, despite the growth in population (2015 forecast: 1.2%), nominal retail sales fell by 3% compared to 2014 (0% in real terms).2 The main driver behind the fall in sales was the continued strength of the Franc, encouraging consumers to purchase abroad. The volume of foreign purchases, at around EUR9.7bn, increased by a further 6% compared to 2014. Furthermore, towards the end of the year consumer confidence fell to -18 points, placing it below the long-term average of -9 points once more, after positive prospects at the start of the year.
As well as the reduction in the construction of new space, the falling asking rents for retail space in the major centres are suggesting saturation. In all four of the major centres, both average asking rents and prime rents for retail premises have fallen.
2 The difference between nominal and real sale figures is due to the fall in prices for convenience goods.
Office MarketDespite a certain easing on the supply side, the market environment for office space remains competitive. At the end of October 2015, the volume of planning applications submitted stood 3% above its long-term average since 1994, although building permits were 7% below that level. Demand on the market for office premises has meant that, despite the pressure to invest, investors have been rather cautious in planning new office space, so that the existing imbalances have not been further accentuated.
In view of the subdued trend in office employment, the significant expansion of supply in recent years and the rise in the vacancy rate, the limited expansion of supply is a welcome development. As many new-build developments are still only now being released onto the market, letting and reletting office space is likely to remain challenging.
Overall, since the end of the 1990s growth in office employment has turned out to be astonishingly robust in the face of economic upheaval. The employment figure stagnated only between 2002 and 2003; otherwise, demand for office employees has grown each year. The 2% growth in employment during the period from 2011 to 2013 has halved to 1% since 2014. In view of the moderately optimistic economic prospects, office employment should continue to grow at a similar rate this year and next.
At 4.1%, the highest vacancy rates are currently seen in the cities of Geneva and Berne. In contrast, in Basel and Lausanne the recorded vacancy rate remains low, at 1.8% in each case. In Zurich, vacancies have fallen slightly, by 0.1 percentage points to 2.9%.
The very recent increases in the Index of Office Rents do not signal a reversal in the trend; rather, they can be explained by the fact that recorded asking rents take no account either of changes in the quality of the supply or of concessions by landlords. Thus, for example, a shift in availability towards smaller and in some cases fitted out premises will lead to a further rise in the Rental Price Index, whereas newly agreed rents have been stagnating or even falling for some time. In the rental index for new lease contracts, which is adjusted for qualitative effects, falls in rents can be seen in many locations. Between the mid-point of 2014 and the mid-point of 2015, average rents fell by 1.2%. This trend should accelerate during the current year.
Switzerland
© 2016 KPMG Holding AG/SA, a Swiss corporation, is a member of the KPMG network of independent firms affiliated with KPMG International Cooperative (“KPMG International”), a Swiss legal entity. All rights reserved. Printed in Switzerland. The KPMG name and logo are registered trademarks.
36 European Real SnapShot!
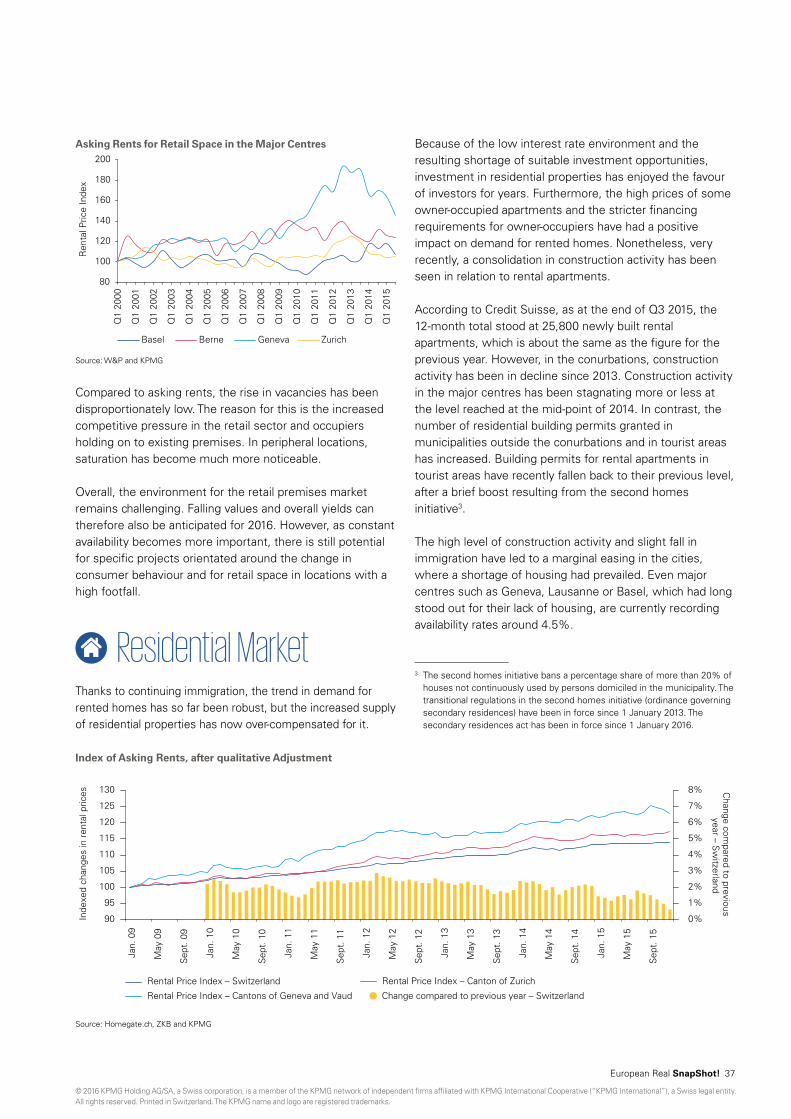
Asking Rents for Retail Space in the Major Centres
80
100
120
140
160
180
200
Ren
tal P
rice
Inde
x
Q1
2000
Q1
2001
Q1
2002
Q1
2003
Q1
2004
Q1
2005
Q1
2006
Q1
2007
Q1
2008
Q1
2009
Q1
2010
Q1
2011
Q1
2012
Q1
2013
Q1
2014
Q1
2015
Basel Berne Geneva Zurich
Source: W&P and KPMG
Compared to asking rents, the rise in vacancies has been disproportionately low. The reason for this is the increased competitive pressure in the retail sector and occupiers holding on to existing premises. In peripheral locations, saturation has become much more noticeable.
Overall, the environment for the retail premises market remains challenging. Falling values and overall yields can therefore also be anticipated for 2016. However, as constant availability becomes more important, there is still potential for specific projects orientated around the change in consumer behaviour and for retail space in locations with a high footfall.
Residential MarketThanks to continuing immigration, the trend in demand for rented homes has so far been robust, but the increased supply of residential properties has now over-compensated for it.
Because of the low interest rate environment and the resulting shortage of suitable investment opportunities, investment in residential properties has enjoyed the favour of investors for years. Furthermore, the high prices of some owner-occupied apartments and the stricter financing requirements for owner-occupiers have had a positive impact on demand for rented homes. Nonetheless, very recently, a consolidation in construction activity has been seen in relation to rental apartments.
According to Credit Suisse, as at the end of Q3 2015, the 12-month total stood at 25,800 newly built rental apartments, which is about the same as the figure for the previous year. However, in the conurbations, construction activity has been in decline since 2013. Construction activity in the major centres has been stagnating more or less at the level reached at the mid-point of 2014. In contrast, the number of residential building permits granted in municipalities outside the conurbations and in tourist areas has increased. Building permits for rental apartments in tourist areas have recently fallen back to their previous level, after a brief boost resulting from the second homes initiative3.
The high level of construction activity and slight fall in immigration have led to a marginal easing in the cities, where a shortage of housing had prevailed. Even major centres such as Geneva, Lausanne or Basel, which had long stood out for their lack of housing, are currently recording availability rates around 4.5%.
3 The second homes initiative bans a percentage share of more than 20% of houses not continuously used by persons domiciled in the municipality. The transitional regulations in the second homes initiative (ordinance governing secondary residences) have been in force since 1 January 2013. The secondary residences act has been in force since 1 January 2016.
Source: Homegate.ch, ZKB and KPMG
Index of Asking Rents, after qualitative Adjustment
90
95
100
105
110
115
120
125
130
Jan.
09
May
09
Sep
t. 0
9
Jan.
10
May
10
Sep
t. 1
0
Jan.
11
May
11
Sep
t. 1
1
Jan.
12
May
12
Sep
t. 1
2
Jan.
13
May
13
Sep
t. 1
3
Jan.
14
May
14
Sep
t. 1
4
Jan.
15
May
15
Sep
t. 1
5
0%
1%
2%
3%
4%
5%
6%
7%
8%
Inde
xed
chan
ges
in r
enta
l pric
es Change com
pared to previous year – S
witzerland
Change compared to previous year – Switzerland
Rental Price Index – Switzerland Rental Price Index – Canton of Zurich
Rental Price Index – Cantons of Geneva and Vaud
© 2016 KPMG Holding AG/SA, a Swiss corporation, is a member of the KPMG network of independent firms affiliated with KPMG International Cooperative (“KPMG International”), a Swiss legal entity. All rights reserved. Printed in Switzerland. The KPMG name and logo are registered trademarks.
European Real SnapShot! 37
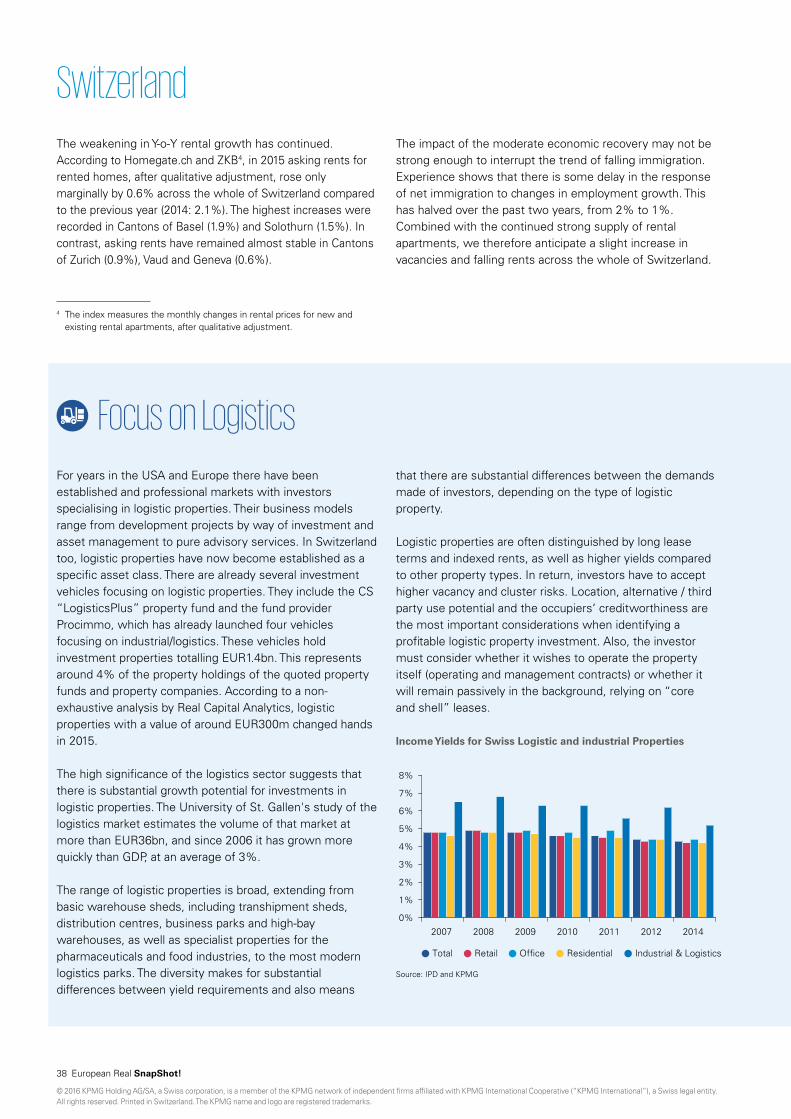
Switzerland
Focus on LogisticsFor years in the USA and Europe there have been established and professional markets with investors specialising in logistic properties. Their business models range from development projects by way of investment and asset management to pure advisory services. In Switzerland too, logistic properties have now become established as a specific asset class. There are already several investment vehicles focusing on logistic properties. They include the CS “LogisticsPlus” property fund and the fund provider Procimmo, which has already launched four vehicles focusing on industrial/logistics. These vehicles hold investment properties totalling EUR1.4bn. This represents around 4% of the property holdings of the quoted property funds and property companies. According to a non-exhaustive analysis by Real Capital Analytics, logistic properties with a value of around EUR300m changed hands in 2015.
The high significance of the logistics sector suggests that there is substantial growth potential for investments in logistic properties. The University of St. Gallen's study of the logistics market estimates the volume of that market at more than EUR36bn, and since 2006 it has grown more quickly than GDP, at an average of 3%.
The range of logistic properties is broad, extending from basic warehouse sheds, including transhipment sheds, distribution centres, business parks and high-bay warehouses, as well as specialist properties for the pharmaceuticals and food industries, to the most modern logistics parks. The diversity makes for substantial differences between yield requirements and also means
that there are substantial differences between the demands made of investors, depending on the type of logistic property.
Logistic properties are often distinguished by long lease terms and indexed rents, as well as higher yields compared to other property types. In return, investors have to accept higher vacancy and cluster risks. Location, alternative / third party use potential and the occupiers‘ creditworthiness are the most important considerations when identifying a profitable logistic property investment. Also, the investor must consider whether it wishes to operate the property itself (operating and management contracts) or whether it will remain passively in the background, relying on “core and shell” leases.
Income Yields for Swiss Logistic and industrial Properties
0%
1%
2%
3%
4%
5%
6%
7%
8%
2007 2008 2009 2010 2011 2012 2014
Total Retail Office Residential Industrial & Logistics
Source: IPD and KPMG
The impact of the moderate economic recovery may not be strong enough to interrupt the trend of falling immigration. Experience shows that there is some delay in the response of net immigration to changes in employment growth. This has halved over the past two years, from 2% to 1%. Combined with the continued strong supply of rental apartments, we therefore anticipate a slight increase in vacancies and falling rents across the whole of Switzerland.
The weakening in Y-o-Y rental growth has continued. According to Homegate.ch and ZKB4, in 2015 asking rents for rented homes, after qualitative adjustment, rose only marginally by 0.6% across the whole of Switzerland compared to the previous year (2014: 2.1%). The highest increases were recorded in Cantons of Basel (1.9%) and Solothurn (1.5%). In contrast, asking rents have remained almost stable in Cantons of Zurich (0.9%), Vaud and Geneva (0.6%).
4 The index measures the monthly changes in rental prices for new and existing rental apartments, after qualitative adjustment.
© 2016 KPMG Holding AG/SA, a Swiss corporation, is a member of the KPMG network of independent firms affiliated with KPMG International Cooperative (“KPMG International”), a Swiss legal entity. All rights reserved. Printed in Switzerland. The KPMG name and logo are registered trademarks.
38 European Real SnapShot!

Austria
A stable market supported by a sustainable economy
Macroeconomic Overview Due to the modest recovery of the Austrian economy, the forecast economic growth rate for 2015 has been adjusted to 0.7%. Growth is expected to accelerate to 1.9% and 1.8% in 2016 and 2017 respectively. At a mere 0.4%, Austrian GDP growth was disappointing in 2014, being not only lower than in the Eurozone (0.9%), but also considerably lower than in Germany (1.6%). The economic downturn was induced by sluggish export demand and uncertainties about future economic developments caused by geopolitical tensions – in particular, the conflict between Russia and Ukraine – and dampened companies’ propensity to invest. Furthermore, comparatively high inflation meant very weak growth in real income and therefore, in private consumption. The introduction of the tax reform in January 2016, expenditure on asylum seekers and a comprehensive housing initiative should enable Austria’s economy to grow by 1.9% in 2016 and 1.8% in 2017.
Economic Indicators
0%
1%
2%
3%
4%
5%
6%
7%
2013 2014 2015 2016F 2017F
GDP growth Unemployment rate Inflation (CPI)
Source: Inowai F – forecast
Whilst developed economies are en route to recovery, a number of emerging economies have slowed down: Brazil and Russia are in deep recession and a significant slowdown in growth has been recorded in China. The restructuring of the Chinese economy to a consumer- and service-based economy has also contributed to the downturn in economic growth.
Alongside positive economic growth, Austria can also look forward to an increase in exports, to 2.3% in 2016 and to 4.5% in 2017.
As well as pessimism about sales, a deterioration in entrepreneurs’ expectations contributed to the decline in investment in construction. The weakness in housing was surprising, given the strength of demand, the sharp rise in
© 2016 KPMG Holding AG/SA, a Swiss corporation, is a member of the KPMG network of independent firms affiliated with KPMG International Cooperative (“KPMG International”), a Swiss legal entity. All rights reserved. Printed in Switzerland. The KPMG name and logo are registered trademarks.
European Real SnapShot! 39

2017. Approx. 240,000 sq. m of high-quality office space will be completed in the next two years. As the scarcity of large, modern first occupancies is becoming increasingly noticeable, companies willing to relocate are now conducting negotiations on leases as many as two years prior to completion, in order to secure newly developed space early on.
Rents will remain stable in 2015. Prime rents currently stand at EUR26.00/sq. m/month; average rents are also maintaining their levels. In the medium-term, the high quality of the new properties coming on the market will result in a slight increase of average rents to EUR15.00 - 26.00/sq. m/month.
Office Yields in Vienna
0%
1%
2%
3%
4%
5%
6%
7%
2011 2012 2013 2014 2015
CBD Yield Suburban Yield
Source: Inowai
Retail Market Retailers are focusing increasingly on prime locations for new outlets. The situation in second and third tier locations remains difficult. Specifically, the Viennese retail market continues to develop very well, and Vienna remains one of the five most popular targets for expansion by international retailers in Europe.
The market will benefit in particular from the growing number of high spending tourists from the Arab and East Asian regions. International luxury brands view Vienna as an increasingly important location because of the excellent trends in tourism there. In the provinces, demand for retail space is strong primarily in Salzburg, Linz, Graz and Innsbruck. The growth in shopping centre space has also largely come to an end in the provinces.
Demand for Austrian retail real estate remains high whilst supply is low, and this is leading to a further increase in prices. In the first half of 2015, the total transaction volume in the commercial sector was EUR870m, with retail
property prices and the favourable financing conditions.Similar to recent years, developments in the labour market will be characterised over the next few years (2015-2017) by a sharp rise in labour supply. The unemployment rate in 2015 continued to increase to 5.8%, primarily due to the continuing weakness of the economic situation and the increase in overall labour supply.
Inflation as measured by the HICP will accelerate from 0.8% in 2015 to 1.3% and 1.7% in 2016 and 2017 respectively. The rise in inflation is primarily due to external cost factors. Import prices of both raw materials and imported goods are pointing upwards.
Office Market There was a transaction volume of EUR870m on the Austrian real estate investment market in the first half of 2015. At EUR570m, the second quarter was considerably stronger than the first, in which EUR300m was generated. In the first quarter, the retail segment was dominant, as was the office segment in the second quarter. In the first six months, office properties accounted for approx. 46% of the transaction volume; this is an increase of around 10% compared to the previous year.
A significant rise in the transaction volume is anticipated for the second half of the year, as negotiations on several large properties and portfolios are already quite advanced. The anticipated volume for 2015, of EUR3.45bn, exceeds last year’s record of EUR3bn.
The supply of prime properties in Vienna is already very limited due to the low level of completions and, with a further rise in price levels, investor interest has shifted increasingly to the downstream quality segments and, in some instances, to office properties in the provincial capitals. At present, yields in the federal provinces are still considerably higher than in Vienna: the prime yield for office properties in Vienna is currently 4.75%; by the end of the year, it is likely to move towards 4.5%. For comparable quality, a yield averaging 50 to 75bps above this can be achieved in the provincial capitals compared to Vienna.
Due to the limited volume of completions, which will reach a new low of just 130,000 sq. m in 2015, for the first time in several years the market has clearly been shaped by a surplus in demand. Numerous companies are actively seeking large, modern premises, but are not finding an adequate supply at present. Demand is therefore focused on the new-build properties entering the market from early
Austria
© 2016 KPMG Holding AG/SA, a Swiss corporation, is a member of the KPMG network of independent firms affiliated with KPMG International Cooperative (“KPMG International”), a Swiss legal entity. All rights reserved. Printed in Switzerland. The KPMG name and logo are registered trademarks.
40 European Real SnapShot!

properties accounting for around 16% of this figure. Interest from foreign investors is increasing. Whilst German institutional investors continue to make up the bulk of foreign buyers, new investors from the Middle and Far East and the US are entering the market. Prime High Street Rental Levels
0 50 100 150 200 250 300 350 400 450
Prime rent EUR/sq.m p.m.
Graz (Herrengasse)
Innsbruck (Maria-Theresien-Straße) Linz (Landstraße)
Salzburg (Getreidegasse) Vienna (Kohlmarkt)
Source: CBRE
Residential Market With an estimated volume of around EUR1bn invested in apartment buildings, 2015 has been a record-breaking year. This may be due, inter alia, to the increase in tax on profits from real estate to 30% in 2016.
Prices in Vienna have risen in most districts since the beginning of the year. In particular, the 1st and 20th districts recorded the highest increases, with rises of over 10%.
Prices for apartment blocks in Vienna range between EUR650/sq. m in the 11th District and EUR9,000/sq. m in the 1st District.
Prices for individual apartments in Vienna are higher, ranging from EUR2,850 - 17,000/sq. m. Purchase prices in top locations of the 1st District can reach around EUR28,000/sq. m. In other Austrian provinces, prices are quoted at EUR1,450 - 6,500/sq. m.
Average Transaction Prices Residential Apartments per District
(First Time Occ.)
0
2,000
4,000
6,000
8,000
10,000
12,000
14,000
16,000
18,000
1010
1020
1030
1040
1050
1060
1070
1080
1090
1100
1110
1120
1130
1140
1150
1160
1170
1180
1190
1200
1210
1220
1230
EU
R/s
q. m
Source: EHL BUWOG
In Vienna, yields have experienced downward pressure, falling in some regions by around 30 bps. However, a yield of approx. 3% is achievable for an apartment building with a high occupancy rate inside the “commuter belt”.
There are two types of investors in apartment buildings active on the Austrian housing market: those who invest with a long-term horizon and those who create condominium apartments. The former investor group accounts for more than 75% of the investment volume.In Vienna, more than three quarters of all apartments are rented and not even a quarter are owner occupied. This represents the highest proportion of rented apartments in Austria, but is closely followed by Linz with more than 72% rented apartments. In all other regional capitals except Innsbruck, more than half of all apartments are owner-occupied.
© 2016 KPMG Holding AG/SA, a Swiss corporation, is a member of the KPMG network of independent firms affiliated with KPMG International Cooperative (“KPMG International”), a Swiss legal entity. All rights reserved. Printed in Switzerland. The KPMG name and logo are registered trademarks.
European Real SnapShot! 41
Focus on LogisticsAustria has an extensive network of road, rail, water and air transport routes, with good international connections. The moderate cost of rail freight transport is regarded as a highly positive locational advantage. Logistic companies benefit from Austria’s economic and social stability as well as its internationally recognised logistics expertise. This is confirmed by the World Bank Logistics Performance Index (LPI), in which Austria was ranked in 22nd place among 160 countries in 2014. A better ranking could be achieved by expanding multimodal freight transport with suitable freight terminals, as this would improve the already very good modal split in Austria compared to other EU countries.
Austria’s infrastructure is embedded in the Trans European Transport Network system (TEN-T) and is located in the middle of three of the main important transport corridors: the “Brenner” axis, the “Rhine-Danube” axis and the “Baltic-Adriatic” axis. The latter two stretch along the western and southern routes, enabling the country to position itself as a logistic hub, meaning that the continuous expansion of its infrastructure is essential. In particular, the Danube shipping industry offers further potential for improvement (currently only 15% is used).
Due to their strong local industry and infrastructure, Austria’s most attractive logistic locations are situated in the areas around Vienna and Linz/Wels/Enns (tri-modality through the Danube, motorway and railway). Other important logistic areas are in Graz/Leoben, St. Pölten/Krems, Parndorf/Kittsee/Heiligenkreuz, and Klagenfurt/Villach, as well as in Salzburg. The two main logistic locations in Austria are described in more detail below.
Currently, the southern part of Vienna is the most attractive location for industry and logistics. With direct access to several major routes, motorways leading to western, southern, eastern and northern Europe intersect here. Approx. 80% of the region’s demand for logistic and industrial premises is focused on the south or southeast of Vienna.
Due to improvements in infrastructure in the eastern part of Vienna and a large supply of space, new projects are expected to be developed here.
There is already an industrial and logistic area in the northern part of Vienna. Demand for space in this area is lower than on the southern side of the city, although infrastructure improvements will improve its attractiveness.
Increasingly, more areas in the western part of Vienna and its surroundings are being reclassified as residential areas due to population growth. Consequently, this area is slowly
being transformed from an industrial to a residential/office zone, with the benefit of good transport connections.
Net rents for logistic and industrial properties range from EUR 2.50 - 6.00/sq. m/month depending on location and quality standard. A slight increase in rents can be observed for logistic centres with modern fit-out specifications. Land values for commercial properties in Vienna range from EUR 200.00 - 350.00/sq. m. Prime yields lie in a range of 7.25%–7.8% depending on the location.
The proportion of investment in logistic properties is relatively low (at less than 10% of the total investment volume), but an increase in activity in this sector can be observed. This is due in particular to the scarcity of modern logistic properties on the European market and the increase in the importance of e-commerce and the associated structural change in this segment. However, properties constructed to suit a specific user are only of interest to investors if they offer a long remaining useful lifespan or can be used by third parties. Finding a suitable logistic investment property (at a volume in excess of EUR15m) presents a challenge to investors.
© 2016 KPMG Holding AG/SA, a Swiss corporation, is a member of the KPMG network of independent firms affiliated with KPMG International Cooperative (“KPMG International”), a Swiss legal entity. All rights reserved. Printed in Switzerland. The KPMG name and logo are registered trademarks.
42 European Real SnapShot!

Italy
Out of the doldrums?
Macroeconomic Overview The Italian economy appears to have started on a path of recovery, on the back of strengthening domestic demand. The country's GDP grew by 0.3% in the first quarter of 2015, beating analysts' forecasts, and at the year-end +0.8% are forcasted.
The sight of light at the end of the tunnel has boosted consumer confidence, triggering a rise in consumer spending and household budgets. In turn, this affected the service, manufacturing and retail sectors, all of which are expanding according to PMI surveys. These brighter prospects mean that the macroeconomic analysis is predicting GDP growth to be above 1% by 2016.
Economic Indicators
-8%-6%-4%-2%0%2%4%6%8%10%12%
-3%
-2%
-1%
0%
1%
2%
3%
4%
5%
6%
2012
2013
2014
2015
F
2016
F
2017
F
2018
F
2019
F
2020
F
Unem
ployment &
Inflation
P
DG
GDP growth Unemployment rate Inflation (CPI)
Source: International Monetary Fund, December 2015 F – forecast
The labour market is benefitting from this scenario and from various reforms introduced by the government which have helped to boost workforce flexibility and to reduce the 2015 unemployment rate to 12.1%, with 11.6% anticipated for 2016.
The gap in yields between Italian government bonds and the German government bonds has narrowed to approx. 96bps, a further sign of recovery.
Spread Italian Government Bond and German Government Bond
0
100
200
300
400
500
600
Jan.
08
Bas
is P
oint
s
May
08
Aug
. 08
Dec
. 08
Apr
. 09
Aug
. 09
Dec
. 09
Apr
. 10
Aug
. 10
Dec
. 10
Apr
. 11
Aug
. 11
Dec
. 11
Apr
. 12
Aug
. 12
Dec
. 12
Apr
. 13
Aug
. 13
Dec
. 13
Apr
. 14
Aug
. 14
Dec
. 14
Apr
. 15
Aug
. 15
Dec
. 15
Source: Market data provider
© 2016 KPMG Holding AG/SA, a Swiss corporation, is a member of the KPMG network of independent firms affiliated with KPMG International Cooperative (“KPMG International”), a Swiss legal entity. All rights reserved. Printed in Switzerland. The KPMG name and logo are registered trademarks.
European Real SnapShot! 43

Office MarketIn a rising real estate investment market the office sector remains dominant, sustained by new international investors entering the market. Transaction volumes stood at EUR4.1bn during Q2 2015, underlining the level of activity in the sector after the shrinking trend recorded during 2011-2013 (-26.1% and -10.8% respectively in 2011-2012 and 2012-2013).
Number of Office Transactions (letting)
0
5,000
10,000
15,000
20,000
25,000
2006
2007
2008
2009
2010
2011
2012
2013
2014
H1
2015
Num
ber
of t
rans
actio
ns
Source: Agenzia del Territorio
International investors appear particularly interested in large portfolios and prime asset deals, whilst the domestic market is interested mainly in smaller-scale prime assets. However, secondary properties priced at the right level are becoming more attractive, especially within portfolio deals.
Milan’s investment market appears particularly active, with year-end volumes expected to reach a new record.
The principal transactions involved the completion by Qatar Investment of the Porta Nuova deal (EUR900m) and the acquisition by Blackstone of a prime asset in Piazza Cordusio (EUR132m).
Although the scarcity of prime product still represents the main factor preventing more investment, the rising trend has compressed yields, with prime office yields at 5.25% in Q2 2015 (compared to 5.4% in 2014), whereas prime rents remained steady overall at around EUR480/sq. m p.a. in the CBD of Milan.
This changed economic environment is also expected to have a positive effect on the loan market and to keep yields in fixed-income markets low, which is reflected in low interest rates on corporate and consumer loans.
Despite the apparent strengthening of the recovery, it appears that further measures are necessary to address the banking system, which still suffers from a lack of business. In particular, vulnerabilities were exposed in 2014 when nine out of the 15 major Italian banks failed the ECB’s Comprehensive Assessment stress test. Non-performing loans (NPLs) and loans in or close to default continue to increase, and this is impacting negatively on growth.
In an effort to ease market pressure on the financial sector, the Government is currently studying a measure to reduce the impact of NPLs by allowing banks to sell large portfolios of non-performing loans to private investors with a government guarantee.
Non Performing Loans (EURbn)
0
50
100
150
200
250
2008
2009
2010
2011
2012
2013
2014
2015
F
2016
F
2017
F
EU
Rbn
Source: Banca d'Italia and Prometeia F – Forecast
Boosted by the improvements in the macroeconomic environment, in September 2015 real estate investment recorded growth of 87% compared to its 2014 level.
Real estate investment by volume stood at approx. EUR5.1bn, still well below the peak levels of 2004-2007 but certainly an indicator of the strengthening of confidence in Italy.
Foreign players continue to be active in the market, with Chinese capital accounting for 27% of foreign capital invested and German capital continuing to play a key role amongst EU investments.
Confidence is rising even amongst lenders; however the tendency is to favour core markets and investments which meet fixed conditions (maximum loan EUR100m, maximum LTV 65%, margin 200bps).
Italy
© 2016 KPMG Holding AG/SA, a Swiss corporation, is a member of the KPMG network of independent firms affiliated with KPMG International Cooperative (“KPMG International”), a Swiss legal entity. All rights reserved. Printed in Switzerland. The KPMG name and logo are registered trademarks.
44 European Real SnapShot!

Office Market Highlights – MilanQ2 2015 Q1 2015 Q2 2014 2014
Investments (EURm) 552 1,567 158 1,229
Office share 75% 36% 93% 74%
Take-up (sq. m) 60,000 70,000 95,000 279,000
Prime rents (EUR/sq. m p.a.) 480 480 490 480
Prime yields 5.25% 5.25% 5.75% 5.40%
Vacancy rate 13.1% 13.3% 12.7% 13.3%
Source: BNP Paribas Real Estate
Development activity still seems weak compared to other European financial capitals; however, the completion of two projects (the refurbishment of Viale Fulvio Testi 250 and the completion of the new Sky 3 building in the Santa Giulia area) with a total area of 28,400 sq. m are evidence of an improvement in activity levels.
Albeit still far from the levels of Milan’s market, activity levels in Rome’s office market are improving, although the majority of transactions are still for premises of less than 1,000 sq. m.
Investment reached approx. EUR281m in Q2, limited by the lack of product which meets the requirements of key international players. The main transaction was the sale of the Carabinieri (police) barracks in Piazza del Popolo for EUR57m.
The lettings market is still driven by the public sector which is behind the main deals, accounting for approx. 39% of the total transacted and continuing to focus on the city centre (55% of total transactions). The EUR district comes next with 19% of total take-up.
Against a background of limited activity, with the main lettings associated with the relocation of existing tenants moving to better quality buildings, prime rents remain steady at EUR400/sq. m p.a., whereas prime office yields declined to 5.6% (compared with 5.8% in 2014), primarily due to strong competition for attractive assets.
Office Market Highlights – RomeQ2 2015 Q1 2015 Q2 2014 2014
Investments (EURm) 281 123 - 717
Office share 23% 45% 0% 37%
Take-up (sq. m) 32,000 17,000 12,700 110,700
Prime rents (EUR/sq. m p.a.) 400 400 400 400
Prime yields 5.6% 5.8% 6.2% 5.8%
Vacancy rate 9.6% 9.3% 8.5% 9.3%
Source: BNP Paribas Real Estate Research
There are signs of a recovery in development activity; in September 2015, there was approx. 76,000 sq. m under construction. Europarco is currently the main project underway in Rome, and the supply pipeline includes the Libeskind towers project which will provide 124,000 sq. m of quality new buildings as part of Rome’s Tor di Valle stadium, and the recently let EUR Towers which are due to complete by the end of 2016 and which will become Telecom’s headquarters.
Retail MarketBoosted by an increase in consumer confidence (retail sales in August were up by 1.3% Y-o-Y; food sales increased by 1.4% and non-food by 0.3%), the retail real estate market continued to be particularly active. Retailers are willing to pay higher rents to secure spaces in the most sought-after locations for the luxury market.
Specifically, Via Montenapoleone in Milan and Via Condotti in Rome experienced the strongest rental growth, sustained by continued healthy demand.
Yearly transaction volumes in the retail market are expected to grow, with Q2 2015 increasing by 2.4% compared to Q2 2014 (approx. 12,634 transactions were recorded in Q2 2015).
Number of Retail Transactions (letting)
0
10,000
20,000
30,000
40,000
50,000
60,000
2006
2007
2008
2009
2010
2011
2012
2013
2014
H1
2015
Num
ber
of t
rans
actio
ns
Source: Agenzia del Territorio
The volume invested reached approx. EUR900m for the first nine months of 2015, with 46% of this invested in the shopping centre segment.
As in the other sectors of the market, investment is driven mainly by foreign investor activity. In particular, new players such as Meyer Bergman, Thor Equities and Cara Investments entered the market.
© 2016 KPMG Holding AG/SA, a Swiss corporation, is a member of the KPMG network of independent firms affiliated with KPMG International Cooperative (“KPMG International”), a Swiss legal entity. All rights reserved. Printed in Switzerland. The KPMG name and logo are registered trademarks.
European Real SnapShot! 45

Number of Residential Transactions
0
100,000
200,000
300,000
400,000
500,000
600,000
700,000
800,000
900,000
2006
2007
2008
2009
2010
2011
2012
2013
2014
H1
2015
Num
ber
of t
rans
actio
ns
Source: Agenzia del Territorio
Milan and Rome seem to be the most active cities with approx. 8,554 and 13,168 transactions respectively.
Various factors permit analysts to assume that a new phase is commencing in the residential real estate market. In particular, interest rates have declined further and access to loans has improved, although it is still more selective than in past years. Against this background, demand for new mortgages increased in all areas of the country (53.3% compared to 2014), with consumers showing a preference for medium to large banks. The average amount lent was approx. EUR123,000.
Moreover, during 2015, the average EUR/sq. m price has continued to decline and this has boosted transaction activity.
The average discount demanded by purchasers on the seller’s initial asking price is around 15%.
Average Discount on Seller’s Initial Asking Price
9%
10%
11%
12%
13%
14%
15%
16%
17%
Q3
2009
Q4
2009
Q1
2010
Q2
2010
Q3
2010
Q4
2010
Q1
2011
Q2
2011
Q3
2011
Q4
2011
Q1
2012
Q2
2012
Q3
2012
Q4
2012
Q1
2013
Q2
2013
Q3
2013
Q4
2013
Q1
2014
Q2
2014
Q3
2014
Q4
2014
Q1
2015
Q2
2015
Source: Bank of Italy, Tecnoborsa, Agenzia del Territorio
Approx. 73% of investment was in single-asset deals, with the remaining 27% invested in portfolio deals. Amongst the single-asset deals, a major transaction was the purchase of the La Cartiera shopping centre in Pompeii by ECE European Prime Shopping Centre Fund II for approx. EUR124m.
Prime yields hardened by an average of 25bps across both high street and shopping centre segments in the northern regions, whilst a downward shift is also expected for retail parks in the coming years.
Prime Retail Rents and Yields
0%1%2%3%4%5%6%7%8%9%
02,0004,0006,0008,000
10,00012,00014,000
Mila
n
Rom
e
Bol
ogna
Nap
les
Turin
Mila
n
Rom
e
Mila
n
Rom
e
High Street Shops Retail Parks ShoppingCentres
Yields
EU
R/s
q. m
p.a
.
Prime rents Prime net yields(Q3 2015)
Prime net yields(Q1 2015)
Source: Cushman & Wakefield
The most active retailers are strengthening their positions and are also opening up in secondary centres with good fundamentals and interesting returns.
There are also signs of improvement in development activity, which has continued to grow since the summer with an increasing pipeline and new interest in the south of the country.
Residential MarketForecasts for the 2015 year-end continue the positive trend from 2014, which has seen transaction growth since 2010. A total of 211,968 transactions were recorded in Q2 2015, an increase of approx. 3% compared to Q2 2014 (206,093 transactions).
Italy
© 2016 KPMG Holding AG/SA, a Swiss corporation, is a member of the KPMG network of independent firms affiliated with KPMG International Cooperative (“KPMG International”), a Swiss legal entity. All rights reserved. Printed in Switzerland. The KPMG name and logo are registered trademarks.
46 European Real SnapShot!

Focus on LogisticsItaly continues to see interest in its logistics market, with investment accounting for 7% of total real estate investment in Italy, reaching approx. EUR196m in September 2015.
Logistics Market Highlights2014 Q3-15 YTD
Investments (EURm) 382 196
Take-up (sq. m) 718 488
Prime rents (EUR/sq. m p.a.) Milan 48 50
Prime rents (EUR/sq. m p.a.) Rome 52 52
Prime yields 7.50% 6.50%
Vacancy rate 6.5% 6.3%
Source: BNP Paribas Real Estate
Current activity is characterised by a large number of deals for small premises (< 25,000 sq. m), particularly in the Lombardy region (60% of the total transaction volume).Logicor, Prologis, P3 and SEGRO are amongst the most active in Italy. Gazely in particular, which historically has been the main player in Italy, has announced its return and is seeking interesting opportunities over the coming months.
Number of Industrial Transactions (letting)
0
2,000
4,000
6,000
8,000
10,000
12,000
14,000
16,000
18,000
20,000
2006
2007
2008
2009
2010
2011
2012
2013
2014
H1
2015
Num
ber
of t
rans
actio
ns
Source: Agenzia del Territorio
The shortage of available product and the high level of competition for prime assets is continuing to drive compression in yields, particularly for assets let to quality tenants with long leases. These have dropped to 6.5% (compared to 7.5% in 2014).
The difficulty in launching new developments over the past few years has led to stable prime rents in both Milan and in Rome, and to an increased interest in conversion projects which have benefitted from a recently-approved new law aimed at reducing the use of green-field and undeveloped areas.
Take-up of logistic space in Italy exceeded 200,000 sq. m in Q3 2015, continuing the Q2 trend (6.2% compared to 2014). In more detail, Lombardy continued to be the region preferred by the main players with 58.7% of take-up (14 transactions), followed by Emilia Romagna, with 26.9% of take-up by area.
Take-up (sq .m in ,000)
0
100
200
300
400
500
600
700
800
900
2006
2007
2008
2009
2010
2011
2012
2013
2014
Q3-
15 Y
TD
sq. m
(in
,000
)
Source: CBRE Research
Given the lack of high quality products, the renewed interest of foreign investors, the compression of vacancy levels in the major markets and healthy occupier demand, it is reasonable to consider that there could be an opportunity for a new phase of development activity.
© 2016 KPMG Holding AG/SA, a Swiss corporation, is a member of the KPMG network of independent firms affiliated with KPMG International Cooperative (“KPMG International”), a Swiss legal entity. All rights reserved. Printed in Switzerland. The KPMG name and logo are registered trademarks.
European Real SnapShot! 47

Spain
One of Europe’s fastest growing economies
Macroeconomic Overview • GDP: Robust growth expected in 2016• Inflation: Will remain negative in the short term• Employment: Gradual improvement driven by improved
labour conditions
In Q2 2015, Spain remained one of Europe’s fastest growing economies, with Q-o-Q growth of 1.0%. Unemployment remained high in 2015, starting 2016 at 21%, but is expected to fall to 17.2% by 2019. Consumer confidence in the country remained at an all-time high and the decline in unemployment began, coupled with an increase in retail sales. In recent years, the number of tourists has grown, reaching a historic high level in 2015, driven by an increase in domestic tourism.
Economic Indicators
-1%
4%
9%
14%
19%
24%
29%
-2%
-1%
0%
1%
2%
3%
4%
5%
6% Unem
ployment &
Inflation
GD
P g
row
th
GDP growth Unemployment rate Inflation (CPI)
2012
2013
2014
2015
F
2016
F
2017
F
2018
F
2019
F
2020
F
Source: Economist Intelligence Unit F – forecast
Office MarketThe Spanish office market saw some improvement in 2015, with strengthening demand, declining supply and an upward pressure on rents. Demand was principally focused on cities such as Barcelona and Madrid. However, demand will begin to spread slightly to second-tier cities and well-located secondary markets. Greater depth and liquidity in the financing market is expected to result in stronger demand over the medium term.
© 2016 KPMG Holding AG/SA, a Swiss corporation, is a member of the KPMG network of independent firms affiliated with KPMG International Cooperative (“KPMG International”), a Swiss legal entity. All rights reserved. Printed in Switzerland. The KPMG name and logo are registered trademarks.
48 European Real SnapShot!

Prime Office Rents
-5%
0%
5%
10%
15%
20%
0
50
100
150
200
250
300
350
Mad
rid (C
BD
)
Mad
rid
(Dec
entr
alis
ed)
Bar
celo
na (C
BD
)
Bar
celo
na
(Dec
entr
alis
ed)
CA
GR
EU
R/s
q. m
p.a
.
Prime Rent CAGR (5yr) CAGR (1yr)
Source: Cushman & Wakefield
Retail MarketA growing economy, low inflation, an improving labour market and easier access to finance are expected to boost demand for retail assets in the Spanish market. There was strong demand from new and existing fashion and restaurant operators, international entrants and foreign discount retailers. The level of new development activity is improving, with 312,000 sq. m of shopping centre space to be opened by 2016 and 130,000 sq. m of retail park space due to be completed by the end of 2017. Availability of space on the best high streets in Madrid and Barcelona remains limited.
Prime Retail Rents
-5%
5%
15%
25%
35%
500
1,500
2,500
3,500
Mad
rid
Bar
celo
na
Sev
ille
Bilb
ao
Val
enci
a
Mal
aga
Pal
ma
Zara
goza
Mad
rid
Bar
celo
na
High Street Shops Retail
Parks
CA
GR
EU
R/s
q. m
p.a
.
Prime Rent CAGR (5yr) CAGR (1yr)
Source: Cushman & Wakefield
Residential MarketThe Spanish housing market continues to recover, with an improving econo58my and an increasing number of foreign property buyers, especially in the coastal cities of Barcelona and the Costa del Sol. Although Spanish residential prices have been falling for seven consecutive years, the decline began to reach its end in Q4 2015. Gross rental yields on property recovered slowly, but are still not high enough to make buying an apartment attractive from the yield perspective, except in prime or highly sought-after locations. Gross rental yields for apartments in Barcelona range from 3%–4.7%, and from 3.9%–4.9% in Madrid.
House Price Change
-5%
-3%
-1%
1%
3%
2007 2008 2009 2010 2011 2012 2013 2014 2015
Q1 Q2 Q3 Q4
Source: Banco de España
© 2016 KPMG Holding AG/SA, a Swiss corporation, is a member of the KPMG network of independent firms affiliated with KPMG International Cooperative (“KPMG International”), a Swiss legal entity. All rights reserved. Printed in Switzerland. The KPMG name and logo are registered trademarks.
European Real SnapShot! 49
Macroeconomic Overview Despite economic headwinds arising from the volatility in the global financial markets, the economies of Central and Eastern Europe demonstrated resilience and solid growth in 2015.
Sustained economic growth was underpinned largely by solid domestic demand and recovery across the Eurozone. Multiple factors contributed to strengthening private consumption, including favourable labour market developments, growing confidence and growth-stimulating policies, as well as lower commodity prices.
In the CEE region, the Czech Republic stood out, after an extraordinarily strong economic performance. Full year Czech GDP is likely to achieve 4.4% growth, the fastest rate of expansion in the European Union. Growth was driven by investment spending, boosted by an influx of funds from the EU budget and by domestic demand. In addition, the unemployment rate fell rapidly and is expected to stand at 6.5% in 2015 – the lowest since 2009. Economic activity in Poland remained robust in 2015 on the back of solid domestic demand and strong investment activity. Poland’s new government announced a multi-year investment and innovation programme amounting to ZL 1 trillion (USD 250bn) as well as economic reforms including raising the minimum wage and cutting corporate income tax for small businesses from 19% to 15%. To finance these initiatives, the new conservative government will levy new taxes on bank transactions and larger supermarkets. Romania is another of the most dynamic emerging markets in the region. GDP grew by 3.6% Y-o-Y in the third quarter of 2015 – the second fastest in the EU after the Czech Republic – boosted by EU funds, fixed investment and private consumption. The main stimulus behind the increasing purchasing power was a range of tax cuts, the most relevant being a reduction in VAT from 24% to 20%. In addition, the government agreed with trade unions to raise the minimum wage by 19% from May 2016. Hungary’s economy lost momentum in Q3 2015, primarily as a result of weaker agricultural and construction output. On a positive note, the service sector (hospitality in particular), along with the automotive industry, made an important contribution to overall Q3 economic growth. GDP growth is set to slow down to more sustainable levels of 2.7% in 2015 and 2.5% in 2016.
It is also worth mentioning that Croatia’s economy is anticipated to return to growth in 2015 following six consecutive years of contraction.
Price developments are still influenced by low global commodity prices. In January 2016, Brent crude oil dipped
CEE
Real estate investment volume increasing for three years in a row
© 2016 KPMG Holding AG/SA, a Swiss corporation, is a member of the KPMG network of independent firms affiliated with KPMG International Cooperative (“KPMG International”), a Swiss legal entity. All rights reserved. Printed in Switzerland. The KPMG name and logo are registered trademarks.
50 European Real SnapShot!

below USD 30.00/barrel for the first time in 10 years. Average inflation in the Eurozone has already re-entered positive territory; however, it is still at low levels, reaching 0.2% in December 2015.
Real GDP Growth Rate
2014 2015E 2016F 2017F 2018F 2019F
World 2.50 2.40 2.70 2.90 3.00 2.60
EU28 1.30 1.70 1.80 1.70 1.80 1.70
Euro area 0.90 1.50 1.70 1.60 1.60 1.50
CEE* 1.91 2.75 2.65 2.73 2.79 2.75
Baltics** 2.77 2.00 2.87 3.33 3.27 3.23
BGR 1.50 2.60 2.90 3.20 3.50 3.20
CRO -0.40 1.80 1.50 1.60 1.90 1.90
CZE 2.00 4.40 2.70 2.40 2.30 2.30
HUN 3.70 2.70 2.50 2.40 2.60 2.30
POL 3.30 3.40 2.90 2.70 2.90 3.00
ROM 2.80 3.50 3.60 3.60 3.40 3.40
SRB -1.80 1.00 2.50 3.50 3.70 4.00
SVK 2.40 3.40 2.90 2.60 2.10 2.20
SVN 2.80 2.70 2.10 2.00 2.20 2.00
Source: Economist Intelligence Unit, December 2015 E – estimate F – forecast * = average of the Baltics, Bulgaria, Croatia, Czech Republic, Hungary, Poland, Romania,
Serbia, Slovakia and Slovenia** = average of Estonia, Lithuania and Latvia
GDP Growth, Global Outlook
0.5%
1.0%
1.5%
2.0%
2.5%
3.0%
2014 2015E 2016F 2017F 2018F 2019F
World EU28 Euro area CEE*
Source: Economist Intelligence Unit, December 2015 F – forecast * = Baltics, Bulgaria, Croatia, Czech Republic, Hungary, Poland, Romania, Serbia, Slovakia
and Slovenia
According to the Economist Intelligence Unit, the CEE region is set to outperform both the Eurozone and the EU28, with an average GDP growth rate of 2.7% between 2016 and 2019.
Investment MarketReal estate investment in Central and Eastern Europe in 2015 reached a historic high of over EUR9.6bn, representing a 20% increase on 2014.
Total Real Estate Investment Transactions in the CEE
0
1,000
2,000
3,000
4,000
5,000
6,000
7,000
8,000
9,000
2012 2013 2014 2015
EU
Rm
Bulgaria (since H1 2013) Croatia Czech Republic Hungary
Poland Romania Slovakia
Source: CBRE In 2015, the most notable transaction in the region was when U.S private equity firm Texas Pacific Group (TPG) agreed to become the majority owner of Hungarian real estate developer TriGranit, including its commercial property assets worth in excess of EUR500m. This transaction affected the entire Polish and Slovakian portfolio of TriGranit as well as some of its Hungarian and Croatian projects.
During 2015, some 50% of total real estate investment in the CEE region took place in Poland and 32% took place in the Czech Republic. Across the rest of the CEE countries, only Hungary achieved a noteworthy 8% of investment, whilst the combined share of the other countries stood at 12%.
CEE Investment Market by Country, 2015
Czech Republic
32%
48%
8%
12%
Poland Hungary Other CEE
Source: CBRE
In 2015, 47% of all real estate investment transactions in the CEE region were realised in the retail sector, followed by the office (36%) and industrial (15%) sectors. Surprisingly, the hotel sector was the least favoured asset class that year,
© 2016 KPMG Holding AG/SA, a Swiss corporation, is a member of the KPMG network of independent firms affiliated with KPMG International Cooperative (“KPMG International”), a Swiss legal entity. All rights reserved. Printed in Switzerland. The KPMG name and logo are registered trademarks.
European Real SnapShot! 51

rents can be expected due to the considerable supply of new speculative office space, which is currently outweighing demand. On the other hand, in Bulgaria and Hungary, rents for prime office space are expected to rise in the most popular locations. As a result, a decrease in tenant incentives is also forecast.
In the case of prime properties located in central business districts across the CEE region, rents remained highest in Warsaw (EUR21.00–23.50/sq. m/month), followed by Budapest (EUR19.00–21.00/sq. m/month), Prague (EUR18.50–19.50/sq. m/month) and Bucharest (EUR18.00–19.00/sq. m/month). Sofia, Zagreb and Bratislava remained the least expensive markets in the region with rents in the range of EUR11.00–15.00/sq. m/month.
The vacancy rate continued to decrease in Q3 2015 due to limited new supply and strong letting markets. However, in Poland and Romania, an increase in the vacancy rate is forecast in the short-term. Growth in the office lettings market was driven mainly by tenants from the IT, business process outsourcing and professional services sectors.
Average vacancy rates were between 5.4% and 16.4% across the capital cities under review. Due to the higher proportion of speculative office development, the highest vacancy rate was registered in Prague (16.4%) whereas, just as in the previous quarters, the lowest rates were recorded in Belgrade (5.4%) followed by Bratislava (11.5%). Office Stock and Vacancy Rates, Q3 2015
Warsaw
Prague
Bratislava
BudapestBucharest
Zagreb
Belgrade
Sofia
4%
6%
8%
10%
12%
14%
16%
18%
0.00
0.50
1.00
1.50
2.00
2.50
3.00
3.50
4.00
4.50
5.00
Office Stock (million sq. m)
Vac
ancy
Rat
e
Source: JLL. CBRE, Forton
The total volume of transactions in the CEE almost doubled compared to the last quarter, with the office sector accounting for approx. 41% of this. Due to the strong letting market and the increased transaction volume, further downward adjustments in yields were observed Q-o-Q for prime office buildings in Belgrade, Sofia, Bratislava and Prague, whilst prime office yields remained stable in the other countries under review.
registering only 2% of the total volume, although hotels as an investment opportunity are attracting more and more capital and are expected to become as well established here as in the other markets in the EMEA region.
Indicative Yields and Q-o-Q change, Q3 2015
Prime office change Prime retail change
Belgrade 9.00% 8.00%
Bratislava 7.25% 7.50%
Bucharest 7.50% 9.00%
Budapest 7.25% 6.75%
Prague 5.75% 4.75%
Sofia 8.50% 8.75%
Warsaw 6.00% 7.00%
Zagreb 8.05% 8.00%
Source: CBRE, Cushman & Wakefield
As the table above illustrates, prime yields in the region remained stable during 2015. Looking at yields for the office sector in the region, Belgrade and Sofia took the lead, while Prague and Warsaw recorded the lowest yields in Q3 2015. In the retail sector, Bucharest achieved the highest yields, at 9%, followed by Sofia. With the exception of Belgrade and Prague, retail yields remained stable on a Q-o-Q basis.
Office MarketThe economy of the CEE region improved further during Q3 2015, and a promising business environment can be seen across most of the countries under review. The improvement in market fundamentals led to an increase in demand for quality office space. Although in Q3 2015 the total volume of new lettings decreased by 18% compared to the previous quarter, total letting activity reached a record level during the first nine months of 2015 in some of the key CEE countries, such as the Czech Republic, Poland and Hungary.
Development activity varied across the region. Strong activity was observed in Poland, the Czech Republic and Romania, whilst in Slovakia, Hungary and Serbia it remained more modest. In these countries, the office market became more landlord-driven compared to those countries characterised by larger numbers of speculative developments, where the position of tenants was improving and landlords were more willing to offer generous incentives such as rent-free periods and fit-out contributions.
Prime rents were generally stable in Q3 2015; however, in some markets such as Poland and Romania, a decrease in
CEE
© 2016 KPMG Holding AG/SA, a Swiss corporation, is a member of the KPMG network of independent firms affiliated with KPMG International Cooperative (“KPMG International”), a Swiss legal entity. All rights reserved. Printed in Switzerland. The KPMG name and logo are registered trademarks.
52 European Real SnapShot!

As in the previous period, Prague and Warsaw recorded the lowest yield levels, at 5.75% and 6.00% respectively, whilst Belgrade and Sofia saw the highest yields, at 9.0% and 8.5% respectively, as illustrated in the following chart. Prime Office Yields, Q3 2015
5.0%
5.5%
6.0%
6.5%
7.0%
7.5%
8.0%
8.5%
9.0%
Bel
grad
e
Sof
ia
Zagr
eb
Bud
apes
t
Bra
tisla
va
War
saw
Pra
gue
Source: CBRE, Cushman & Wakefield
Retail MarketRetail sales volumes continued to increase across the region during 2015, and this trend is forecast to continue in the medium-term. The CEE region is growing in importance as a global retail destination, with increasing levels of disposable income and a strong growth outlook across the retail sector. A positive outlook across the region has improved retailer confidence with regard to their expansion plans.
However, the role of multi-channel retailing is becoming more significant amongst retailers as the proportion of e-commerce turnover is gradually increasing in comparison to traditional retailing. As a result, retailers are becoming more careful and selective when considering expansion. Some retailers are already downsizing their physical premises by setting up online shops.
In most of the CEE markets, there is a widening gap between rental and occupancy levels in secondary and primary centres as retailers are increasingly relocating to better performing and more modern schemes in major cities, regardless of the higher rents in these locations.
Regional Average Unemployment Rates & Real Wage
Growth (2015-2018)
0%
1%
2%
3%
4%
5%
6%
8.5%
9.0%
9.5%
10.0%
10.5%
11.0%
11.5%
12.0%
2015 2016F 2017F 2018F
Grow
th of real wages
Une
mpl
oyem
ent
rate
Average unemployement rate Average real wage growth
Source: Economist Intelligence Unit F – forecast
Based on forecasts by the Economist Intelligence Unit, on average, unemployment rates will decrease gradually in the subject countries, but in some countries, this will be from a very high starting point (e.g. Serbia and Croatia had unemployment rates of 19.3% and 19.6% respectively in 2015). Increasing average wages will also bolster positive momentum in the retail market as the increase is forecasted to continue, although the pace is expected to slow.
Developers are also becoming more active in the region due to the positive trends experienced in some of the local retail markets. An improved market environment accompanied by an increase in financing available on more favourable terms is expected to provide a boost for retail developments across the region. However, the amount of new supply will vary depending on local market conditions, such as the density of existing current shopping centres and the anticipated potential growth rate at the subject location. It is expected that the new developments will take place mainly in major cities across the region, driven by trends towards increasing urbanisation.
Rental levels for shopping centres remain at their highest in Prague and Warsaw. In terms of high street locations, landlords are demanding the highest rents in Prague, followed at some distance by Warsaw and Budapest. The lowest average shopping centre rents are still in Zagreb, Sofia and Belgrade. In terms of high street rents, Bratislava, Sofia and Belgrade were the least expensive in the region.
© 2016 KPMG Holding AG/SA, a Swiss corporation, is a member of the KPMG network of independent firms affiliated with KPMG International Cooperative (“KPMG International”), a Swiss legal entity. All rights reserved. Printed in Switzerland. The KPMG name and logo are registered trademarks.
European Real SnapShot! 53

consequence, an unprecedented increase in new-build residential units is anticipated after years of very low rates of activity.
The boom in the Polish residential market has also continued. The number of transactions in the six largest regional markets broke records in 2015. Developers are taking advantage of strong demand, launching more projects to maintain supply at a constant level. According to the Polish Central Statistical Office, in the first nine months of 2015 developers began construction of some 62,800 flats throughout the country, up by 23.7% on last year. The number of building permits issued rose by 17.1%, accounting for 68,700 apartments. During September 2015, the “Housing for the Young” Scheme was introduced. This primarily includes measures to support the younger generations and larger families.
Prime High Street Rents, Q3 2015
0 50 100 150 200
Zagreb
Warsaw
Sofia
Prague
Budapest
Bucharest
Bratislava
Belgrade
EUR/sq. m p.m.
Source: JLL
Prime shopping centre yields continued to decrease across most of the subject markets in the region. The most significant decreases were recorded in Belgrade, Bucharest, Bratislava and Warsaw, where yields have decreased by 50 basis points compared to Q3 2014. In Budapest and Sofia, prime yield expectations for shopping centres remained mostly stable.
Residential MarketNotable growth was recorded in the Czech mortgage market in the period January – October 2015, with the volume of new mortgages reaching an all-time high at more than 85,000. This substantial increase was driven largely by low interest rates and a positive economic outlook for 2015. As a result, the number of house-building projects completed in Prague increased by 24.5% in the first nine months of 2015. Prices achieved for new apartments in Q2 2015 were 2.8% higher than in the previous quarter, and prices increased further in Q3, by 3.1%. Prague’s real estate market, which is perceived to be one of the most established in the CEE region, continues to attract foreign investors, with Russian and Ukrainian investors the most active buyers despite economic sanctions and political uncertainty.
2015 was a record year in the Budapest residential market. This was largely accounted for by foreign buyers and the low volumes of bank deposits. Loan interest rates also contributed to increased sales. Pre-fabricated apartment blocks were the best sellers as they are relatively cheap and popular among young first-time buyers and individual investment purchasers. The Hungarian Parliament approved a bill to reduce VAT on new-build homes from 27% to 5% between 2016 and 2019. This proposal should increase the number of new homes and ultimately boost the construction industry. Further incentives to support new home building are under consideration and, as a
CEE
© 2016 KPMG Holding AG/SA, a Swiss corporation, is a member of the KPMG network of independent firms affiliated with KPMG International Cooperative (“KPMG International”), a Swiss legal entity. All rights reserved. Printed in Switzerland. The KPMG name and logo are registered trademarks.
54 European Real SnapShot!

Focus on LogisticsThe CEE logistics market benefitted from an improving economic environment in 2015. Both the development and take-up of industrial parks in the CEE have grown compared to last year. As a result, vacancy continued to decrease, averaging 6.8% in the CEE, its lowest rate in the past nine years. Due to the slight improvement in the economic climate, several companies in the CEE are expanding and, as a result, demand for logistic space, warehousing and production facilities are on the rise.
Investment in such assets is also increasing due to a shortage of quality stock in certain markets, resulting in downward pressure on yields in this asset class.
Indicative Yields and Q-o-Q Change, Q3 2015
Industrial change
Belgrade 11.50%
Bratislava 7.75%
Bucharest 8.75%
Budapest 8.75%
Prague 6.50%
Sofia 11.25%
Warsaw 6.50%
Zagreb 9.25%
Source: CBRE, Cushman & Wakefield
Prime Industrial Rents, 2015
2.5 3.5 4.5 5.5
Belgrade
Bratislava
Bucharest
Budapest
Prague
Sofia
Warsaw
Zagreb
EUR/sq. m p.m.
Source: JLL, Colliers, CBRE, Cushman & Wakefield
Short to medium-term trends shaping the CEE logistics real estate market include:• Built-to-suit developments dominate; however, yield
compression in some markets may pave the way for more speculative developments.
• In less developed markets, significant improvement is evident where competition and quality of stock are low, and infrastructure is being developed.
• In more mature markets, continuous development activity is based on the performance of the overall economy, albeit at a more moderate growth rate than emerging markets.
• Consolidation of operations, i.e. merger of several different locations into one built-to-suit logistic centre. The outcome of competition for such developments will be determined according to the European markets that the tenant would like to cover. The Czech Republic, Slovakia and Hungary are best positioned for such developments and remain the investment hotspots in the CEE region in the short-term.
• Emergence of the e-commerce industry can significantly increase demand for warehouse space (sometimes at the expense of retail space demand). This is especially true where an online shop is already in operation and expansion is likely.
© 2016 KPMG Holding AG/SA, a Swiss corporation, is a member of the KPMG network of independent firms affiliated with KPMG International Cooperative (“KPMG International”), a Swiss legal entity. All rights reserved. Printed in Switzerland. The KPMG name and logo are registered trademarks.
European Real SnapShot! 55

Macroeconomic Overview In 2014-2015, the issues with Russia’s commodity-based economy were highlighted by a drop in oil prices and economic sanctions, resulting in a weakening Rouble exchange rate and a drop of 3.8% in Russia’s GDP in 2015 after a modest increase of 0.7% in 2014.
Economic Indicators
4.0%
4.5%
5.0%
5.5%
6.0%
6.5%
7.0%
-5%
0%
5%
10%
15%
20%
2015E 2016F 2017F 2018F 2019F 2020F
Unem
ployment
Real GDP growth Inflation (CPI) Unemployment rate
Rea
l GD
P G
row
th &
infla
tion
Source: Economist Intelligence Unit E – estimateF – forecast
The Rouble fell sharply against the US Dollar in December 2014 and January 2015. The Central Bank of Russia (CBR) shifted to a free currency float to buttress import substitution and help maintain federal budget income. During 2015, the exchange rate was volatile, moving in close correlation to oil prices. For 2016, Bloomberg Analytics forecasts an average exchange rate of USD 1.00 / RUB 74.00.
US Dollar Exchange Rate vs Oil Price
0
10
20
30
40
50
60
70
80
0
20
40
60
80
100
120
140
160
2005 2006 2007 2008 2009 2010 2011 2012 2013 2014 2015
US
D / R
UBU
SD
/ bb
l
Brent Crude Oil Russian Rouble
Source: Bloomberg
The continuing sanctions blocking access to finance from many western markets and triggering high internal interest rates are the key reason behind the low investment spending. After a significant increase in the key interest rate in order to stabilise the Rouble, to 17% at the end of 2014,
Russia
A time of challenges and opportunities
© 2016 KPMG Holding AG/SA, a Swiss corporation, is a member of the KPMG network of independent firms affiliated with KPMG International Cooperative (“KPMG International”), a Swiss legal entity. All rights reserved. Printed in Switzerland. The KPMG name and logo are registered trademarks.
56 European Real SnapShot!

the CBR cut it in several stages to 11%. This measure was aimed at reducing debt service costs for households and small and medium sized enterprises, and stimulating investment.
A series of geopolitical and economic shocks pushed prices and inflation expectations upwards. The average annual inflation rate in 2015 was 15.5%. Analysts forecast a rate of 8.7% in 2016 and an average of 5% for 2017-2020.
The challenging economic environment has impacted significantly on the real estate industry. After the dramatic depreciation of the Rouble at the end of 2014, the usually well-balanced Dollar-denominated rental market plunged into turmoil, forcing owners and tenants to enter into painful negotiations. As a result, Dollar-denominated rents fell by an average of up to 25% - 40%, leading to a considerable increase in uncertainty over projected asset operating budgets. The volume of new construction fell in 2015, and many projects were put on hold.
Due to the currency volatility and increased borrowing costs, real estate investment activity reached its lowest level since the early 2000s. The proportion of foreign capital in Russian investment transactions fell from 25% in 2014 to 20% in 2015. Investors focused on prime real estate assets located in Moscow: these accounted for 92% of total investment, compared with 78% in 2014. The majority of deals were in retail and logistics, where the current economic situation provides some market players with opportunities for expansion.
As a result, prime yields in Moscow increased at the end of 2014, driven by increased funding costs. In 2015, analysts estimated yields for prime offices and retail in the range of 10.0%–11.0% and of 12.0%–13.0% for industrial properties.
In 2016, it is expected that Russia will pass through the most difficult phase in the current set of economic challenges. In the short term, the economic recovery is contingent on the status of sanctions, oil prices and government anti-crisis measures. A return to growth is assumed for 2017, due to an anticipated recovery in consumption and investment. Analysts forecast average annual real GDP growth of 1.3%–1.8% in 2018–2020.
The current downturn has made it clear that the country has reached the point where it can no longer rely on the oil price effect to sustain economic growth. A major change in industrial policy and consequential structural reforms are required in order to create a new, investment-led model that drives future growth.
Office MarketIn 2011-2013, the office market experienced a period of stable growth: increasing business activity generated constant demand for office space, whilst high rents attracted developers and investors. At the beginning of 2014, the deterioration in the overall economic situation forced businesses to reduce their activities in Russia, and this affected demand for office space. At the same time, development activity in 2014 remained strong, resulting in significant oversupply, growth in the vacancy rate and a decline in rents, which continued throughout 2014-2015.
Demand and Vacancy Rate of Office Space in Moscow
14.6% 17.6%
23.8%
30.0%
9.1% 9.8% 10.8%
16.5%
0%
5%
10%
15%
20%
25%
30%
35%
0
200
400
600
800
1,000
1,200
1,400
1,600
2012 2013 2014 2015E
sq. m
(in
,000
)
Take up volume, class «A» Take up volume, class «B» Vacancy rate, class «A» Vacancy rate, class «B»
E – estimateSource: Brokers’ reports
In 2015, the total supply of quality office space exceeded 15.6 million sq. m, with Grade A space accounting for 23.7%. The total volume of new construction in 2015 was estimated at 640,000 sq. m, one of the lowest figures in the past decade, with Grade A properties accounting for almost 65%. Many construction projects initially planned for 2015 were frozen or delayed. In 2016-2017, a further decrease in construction volumes is expected.
Take-up volume in 2015 was estimated at 1,100,000 sq. m, a slight decrease compared to 2014. Renegotiations, optimisations and lease renewals accounted for more than one-third of the total deal volume. The absorption of Grade A office space accounted for only 30% of the total, and was driven primarily by large multinationals. Around half of all deals were for offices located outside the central zone.
The fall in rents which had started in 2014 continued in 2015. A decline in Dollar-denominated rents of an average of 10% is predicted compared to 2014. However, the fall since 2013 looks far more dramatic – almost 40%. Although many market players are still struggling to continue the habit of thinking in Dollars, a strong “de-Dollarisation” trend was observed throughout 2014-2015. Leases which are still
© 2016 KPMG Holding AG/SA, a Swiss corporation, is a member of the KPMG network of independent firms affiliated with KPMG International Cooperative (“KPMG International”), a Swiss legal entity. All rights reserved. Printed in Switzerland. The KPMG name and logo are registered trademarks.
European Real SnapShot! 57

Nevertheless, developers have announced that approximately 1 million sq. m of new retail premises will be built in Moscow in 2016, including several large-scale projects.
However, uncertainty over the economic and geopolitical situation, the oversupply of new retail space in Moscow and a change in the development plans of most retail chains have persuaded developers to concentrate their efforts on projects close to completion and with the most attractive concepts and locations, to postpone the commissioning of other shopping centres and to freeze unprofitable projects.
Quality Retail Construction in Moscow and Volume of Vacancies
369
219
356
517
387
190 167 198
642
400
0%
2%
4%
6%
8%
10%
12%
0
200
400
600
800 sq
. m (i
n ,0
00)
New construction Vacancy level
2006
2007
2008
2009
2010
2011
2012
2013
2014
2015
Source: KPMG analysis, Cushman & Wakefield
Due to the significant depreciation in the Rouble, real wages dropped by around 3% and the CPI rose to 15.5%, resulting in reduced consumer activity and a record drop of 10% in retail turnover. Some brands could not cope with the low profit levels and left the Russian market.
Prime Rents and Capitalization Rates for Shopping Centres
in Moscow
0%
2%
4%
6%
8%
10%
12%
14%
0 500
1,000 1,500 2,000 2,500 3,000 3,500 4,000 4,500
2006
2007
2008
2009
2010
2011
2012
2013
2014
2015
US
D/ s
q. m
p.a
.
Prime rental rate Prime capitalisation rate
Source: KPMG analysis, Cushman & Wakefield
The renegotiation of commercial terms for rental agreements was a challenging issue in 2014–2015 for both owners and retailers. In order to retain tenants, the owners of shopping centres granted substantial short-term
denominated in Dollars usually fix the exchange rate or set a currency range. However, in most cases, these provisions apply only for a limited period (one to two years), after which time renegotiations are likely, and the new terms will depend on the economic situation as well as the performance of the Russian currency.
Office Rental Rates in Moscow, USD/sq. m p.a.
Class «A» Class «B»
833 800
590 504 483 492
314 293
0
200
400
600
800
1,000
2012 2013 2014 2015E
E – estimateSource: Brokers’ reports
Retail MarketThe retail sector in Russia boomed for several years: investors shook hands on a number of billion-dollar deals, developers created extensive project pipelines, the owners of the best malls proudly reported long tenant waiting lists and the streets of Moscow were counted amongst the world’s most expensive shopping locations. Last year saw drastic changes to that picture.
In 2015, new retail construction in Russia amounted to more than 700,000 sq. m (GLA), which is close to the previous year’s figure. Around half of new supply was commissioned in Moscow.
By the end of 2015, the total stock of retail space in Moscow amounted to 4.57 million sq. m. This was achieved primarily due to the opening of a large number of superregional format shopping centres in 2014-2015, despite the worsening macroeconomic situation and a potential oversupply of retail facilities. These centres include Aviapark, the largest shopping centre in Europe (GBA 463,000 sq. m).
Due to the massive increase in supply, the average vacancy level on the retail market rose to 10%. The vacancy rate in prime shopping centres remains stable, having risen slightly to 2.2% due to an increase in tenant rotation. However, shopping centres commissioned after 2014 were only 50% occupied on average, mainly by anchor tenants, whilst some projects were 90% vacant on the opening day.
Russia
© 2016 KPMG Holding AG/SA, a Swiss corporation, is a member of the KPMG network of independent firms affiliated with KPMG International Cooperative (“KPMG International”), a Swiss legal entity. All rights reserved. Printed in Switzerland. The KPMG name and logo are registered trademarks.
58 European Real SnapShot!
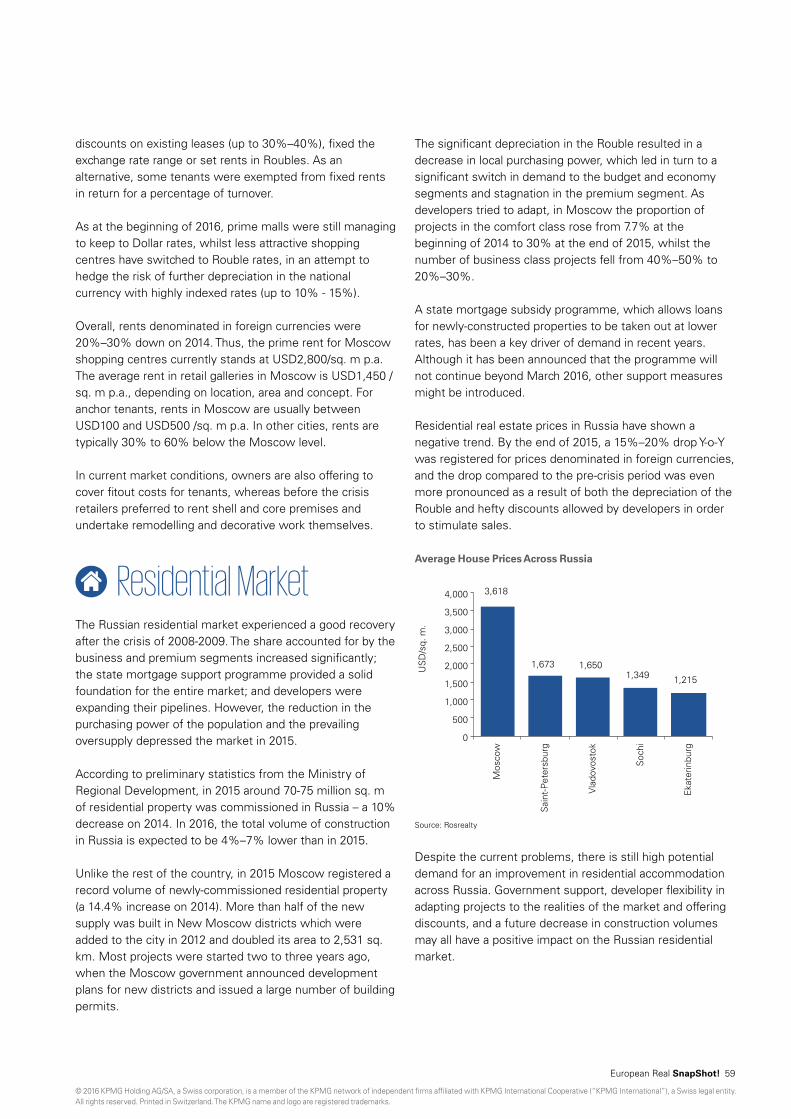
discounts on existing leases (up to 30%–40%), fixed the exchange rate range or set rents in Roubles. As an alternative, some tenants were exempted from fixed rents in return for a percentage of turnover.
As at the beginning of 2016, prime malls were still managing to keep to Dollar rates, whilst less attractive shopping centres have switched to Rouble rates, in an attempt to hedge the risk of further depreciation in the national currency with highly indexed rates (up to 10% - 15%).
Overall, rents denominated in foreign currencies were 20%–30% down on 2014. Thus, the prime rent for Moscow shopping centres currently stands at USD2,800/sq. m p.a. The average rent in retail galleries in Moscow is USD1,450 /sq. m p.a., depending on location, area and concept. For anchor tenants, rents in Moscow are usually between USD100 and USD500 /sq. m p.a. In other cities, rents are typically 30% to 60% below the Moscow level.
In current market conditions, owners are also offering to cover fitout costs for tenants, whereas before the crisis retailers preferred to rent shell and core premises and undertake remodelling and decorative work themselves.
Residential MarketThe Russian residential market experienced a good recovery after the crisis of 2008-2009. The share accounted for by the business and premium segments increased significantly; the state mortgage support programme provided a solid foundation for the entire market; and developers were expanding their pipelines. However, the reduction in the purchasing power of the population and the prevailing oversupply depressed the market in 2015.
According to preliminary statistics from the Ministry of Regional Development, in 2015 around 70-75 million sq. m of residential property was commissioned in Russia – a 10% decrease on 2014. In 2016, the total volume of construction in Russia is expected to be 4%–7% lower than in 2015.
Unlike the rest of the country, in 2015 Moscow registered a record volume of newly-commissioned residential property (a 14.4% increase on 2014). More than half of the new supply was built in New Moscow districts which were added to the city in 2012 and doubled its area to 2,531 sq. km. Most projects were started two to three years ago, when the Moscow government announced development plans for new districts and issued a large number of building permits.
The significant depreciation in the Rouble resulted in a decrease in local purchasing power, which led in turn to a significant switch in demand to the budget and economy segments and stagnation in the premium segment. As developers tried to adapt, in Moscow the proportion of projects in the comfort class rose from 7.7% at the beginning of 2014 to 30% at the end of 2015, whilst the number of business class projects fell from 40%–50% to 20%–30%.
A state mortgage subsidy programme, which allows loans for newly-constructed properties to be taken out at lower rates, has been a key driver of demand in recent years. Although it has been announced that the programme will not continue beyond March 2016, other support measures might be introduced.
Residential real estate prices in Russia have shown a negative trend. By the end of 2015, a 15%–20% drop Y-o-Y was registered for prices denominated in foreign currencies, and the drop compared to the pre-crisis period was even more pronounced as a result of both the depreciation of the Rouble and hefty discounts allowed by developers in order to stimulate sales.
Average House Prices Across Russia
3,618
1,673 1,650 1,349 1,215
0
500
1,000
1,500
2,000
2,500
3,000
3,500
4,000
Mos
cow
Sai
nt-P
eter
sbur
g
Vla
dovo
stok
Soc
hi
Eka
terin
burg
US
D/s
q. m
.
Source: Rosrealty
Despite the current problems, there is still high potential demand for an improvement in residential accommodation across Russia. Government support, developer flexibility in adapting projects to the realities of the market and offering discounts, and a future decrease in construction volumes may all have a positive impact on the Russian residential market.
© 2016 KPMG Holding AG/SA, a Swiss corporation, is a member of the KPMG network of independent firms affiliated with KPMG International Cooperative (“KPMG International”), a Swiss legal entity. All rights reserved. Printed in Switzerland. The KPMG name and logo are registered trademarks.
European Real SnapShot! 59

Focus on LogisticsLike other segments of the Russian real estate market, the industrial sector experienced growth during 2011-2013. Increasing demand triggered a rise in rents and stimulated development activity in the construction of quality warehouse space, which peaked in 2014 with almost 1.4 million sq. m of new supply.
The total new supply in the Moscow region in 2015 is estimated at 833,000 sq. m. Almost all the entire value of new supply comprises Grade A premises. Around half was built-to-suit. More than 65% of new supply is located 20 - 50 km from Moscow.
In 2014–2015, the overall economic deterioration affected demand on the logistics market, as in other industries. However, by the end of 2015 the industrial sector was in better shape than other segments.
Annual space take-up in the Moscow region in 2015 is estimated at 1.3 million sq. m. Around 30% of the deals were for large-scale premises (> 20,000 sq. m).
Average Warehouse Vacancy Rates in the Moscow Region
1.0% 1.5%
7.0%
9.5% 9.5% 9.5%
7.0%
1.5% 2.0%
5.0% 6.0%
7.0% 7.0%
5.0%
0% 1% 2% 3% 4% 5% 6% 7% 8% 9%
10%
2012 2013 2014 Q1 2015 Q2 2015 Q3 2015 2015E
Class «A» Class «B»
E – estimateSource: Brokers’ reports
In Rouble terms, the market rent stabilised at RUB 3,800 - 4,500/sq. m p.a., whilst rents in Dollars declined further, by 25%–30% compared to 2014, due to the rise in the Dollar exchange rate. The commercial terms for Rouble-denominated rents are not expected to change in the short-term. Average Warehouse Rents in the Moscow region, USD/sq. m p.a.
135 135
100
70 130 130
90
65
0
50
100
150
2012 2013 2014 2015E
Class «A» Class «B»
E – estimateSource: Brokers’ reports
In 2016, a significant decrease in new supply is expected, with more than 400,000 sq. m forecast to be commissioned. Some developers are likely to be forced out of the logistics market, whilst those who stay are expected to revise their construction plans downwards, leading to a further decrease in the volume of new supply.
As for demand, the trend of industry monopolisation is likely to continue. However, in view of the high volume of take-up in 2015 and the uncertainties in the future development plans of many market players, consumption activity in the logistics sector is expected to slow down.
© 2016 KPMG Holding AG/SA, a Swiss corporation, is a member of the KPMG network of independent firms affiliated with KPMG International Cooperative (“KPMG International”), a Swiss legal entity. All rights reserved. Printed in Switzerland. The KPMG name and logo are registered trademarks.
60 European Real SnapShot!

Turkey
Istanbul continues to be a centre of attraction for investors
Macroeconomic Overview • GDP: A slowdown from the recent robust expansion in
H2 2015• Inflation: Expected to increase; lower oil prices expected
to be offset by the weak Lira• Employment: Stable, but with downside risks
GDP expanded by an above average 3.8% Y-o-Y in Q2 2015, however, it is expected that the economy will witness a slowdown in H2 2015, with various factors including rises in unemployment and a decline in consumer confidence contributing to a softening of demand. Forecasts have been downgraded to 2.9%, with the expectation of a slowdown in 2016. Exports are anticipated to remain positive, mainly due to the weak Lira, with consumer spending and fixed investment expected to experience moderation.
Economic Indicators
0%
2%
4%
6%
8%
10%
12%
0%
1%
2%
3%
4%
5%
6%
7%
8%
9%20
12
2013
2014
2015
F
2016
F
2017
F
2018
F
2019
F
2020
F
Unem
ployment &
Inflation
GD
P g
row
th
GDP growth Unemployment rate Inflation
Source: Economist Intelligence Unit
Office MarketThe office market recorded strong take-up levels and new completions, which had little effect on the sector as a whole. The market saw take-up of around 90,000 sq. m, double the level of Q3 2014, and with 100,000 sq. m of new stock completed, vacancy rose slightly to 16.4%. Domestic investors continue to dominate, with Istanbul expected to attract more capital in the near term and, with prime yields under downward pressure in core European markets, international investors are likely to be attracted. The outlook for this market looks positive; however, following the June elections, domestic uncertainty has increased and this could prove to be an obstacle.
© 2016 KPMG Holding AG/SA, a Swiss corporation, is a member of the KPMG network of independent firms affiliated with KPMG International Cooperative (“KPMG International”), a Swiss legal entity. All rights reserved. Printed in Switzerland. The KPMG name and logo are registered trademarks.
European Real SnapShot! 61

Residential MarketPrices in Turkey were up 18.9% over the past year, compared to the 2.7% global average. Foreign investment, an expanding population and a slowdown in construction were largely responsible for the upward pressure on residential house prices. In Istanbul, Turkey’s largest city, house prices increased by 27.6% (19% inflation-adjusted) Y-o-Y in Q2 2015. The number of house sales increased by 8.8% to 104,098 in October 2015 compared to the same month of 2014. Sales financed by mortgages decreased by 18.7% Y-o-Y from October 2014, with sales to first-time buyers increasing by 13.6% to 50,564 compared to the same month the previous year.
House Sales by Type
50,564
53,534
0%
20%
40%
60%
80%
100%
First sale Second-hand sale
Source: Reidin
Prime Office Rents
-10%
-5%
0%
5%
10%
15%
0100200300400500600
CA
GR
EU
R/s
q. m
p.a
.
Prime Rent CAGR (5yr) CAGR (1yr)
Ista
nbul
(Lev
ent)
Ista
nbul
(Ese
ntep
e-G
ayre
ttep
e)
Ista
nbul
(Mas
lak)
Ista
nbul
(Asi
an s
ide)
Izm
ir
Ank
ara
Source: Cushman & Wakefield
Retail MarketThe market was buoyant, largely due to higher sales generated by shoppers and tourists during the Ramadan season, with consumers appearing relatively bullish and retail sales volumes increasing in August 2015 by 3.6% Y-o-Y. Occupier activity was relatively strong in Q3 2015, as much of the active demand remained focused on prime high street shops and well-located shopping centres in key cities. The shopping centre development pipeline remained positive, with a further 176,000 sq. m completed in Q3 2015. International investors were more wary of the uncertain political backdrop which provided new opportunities for domestic investors, and this is likely to be one of the main drivers of growth going forward.
Prime Retail Rents
5%
10%
15%
2,0000
4,000
6,000
8,000
10,000
Ista
nbul
Izm
ir
Ank
ara
High Street Shops
CA
GR
EU
R/s
q. m
p.a
.
Prime rent CAGR (5yr) CAGR (1yr)
Source: Cushman & Wakefield
Turkey
© 2016 KPMG Holding AG/SA, a Swiss corporation, is a member of the KPMG network of independent firms affiliated with KPMG International Cooperative (“KPMG International”), a Swiss legal entity. All rights reserved. Printed in Switzerland. The KPMG name and logo are registered trademarks.
62 European Real SnapShot!

bbl Barrel (42 gallons)bn BillionCAGR Compound annual growth rateCBD Central Business DistrictCPI Consumer Prices IndexE EstimateECB European Central BankEUR EuroF ForecastFED Federal ReserveGBP British pounds (sterling)GDP Gross domestic productm Millionp.a. Per annump.m. Per monthQ-o-Q Quarter-on-quartersq. m. Square meterUSD US dollarY-o-Y Year-on-year
Glossary
© 2016 KPMG Holding AG/SA, a Swiss corporation, is a member of the KPMG network of independent firms affiliated with KPMG International Cooperative (“KPMG International”), a Swiss legal entity. All rights reserved. Printed in Switzerland. The KPMG name and logo are registered trademarks.
European Real SnapShot! 63

The challenging and increasingly complex real estate markets require a clear focus and a flexible strategy. Our real estate team is involved in every stage of the asset and investment lifecycle, working with all levels of stakeholders throughout the real estate industry. Whether your focus is local, national, regional or global, we can provide you with the right mix of experience to support and enhance your needs and ambitions. We provide informed perspectives and clear solutions, drawing on our experience from a variety of backgrounds including accounting, tax, advisory, banking, regulation and corporate finance. Our client focus, our commitment to excellence, our global mindset and consistent delivery build trusted relationships that are at the core of our business and reputation.
M&A/Capital Market• Structuring and execution of transactions (Lead Advisory)
– Asset deals: Acquisition and disposal of properties and portfolios– Share deals: Mergers, spin-offs, IPOs, private placements
• Arrangement of indirect investments, such as funds or trusts• Fund raising for specific projects• Debt advisory
Investment Advisory• Investment advisory for national or international indirect real estate investments• Structuring of real estate investments within portfolios• Qualitative and quantitative analysis of investment products• Monitoring and investment controlling, portfolio performance measurement
Strategy/Organization• Strategy development and implementation
– Business planning/business modelling– Corporate/public real estate management– Asset and portfolio management
• Analysis of organization and processes; organizational development, internal control system (ICS)
• Performance management/MIS/investment monitoring• Securing of digital readiness• Risk management and financial modelling• Turnaround and financial restructuring
Valuation/Due Diligence• DCF-valuations of properties and real estate portfolios
or companies• Independent valuation reports for financial statements• Valuations for acquisitions or disposals• Feasibility studies and valuation of real estate developments• Transaction-focused due diligence and process management• Major Project Advisory
All-encompassing Real Estate Advisory from one Source
© 2016 KPMG Holding AG/SA, a Swiss corporation, is a member of the KPMG network of independent firms affiliated with KPMG International Cooperative (“KPMG International”), a Swiss legal entity. All rights reserved. Printed in Switzerland. The KPMG name and logo are registered trademarks.
64 European Real SnapShot!

Please contact us
KPMG Europe
Stefan PfisterCEO KPMG Switzerland, Head of Real Estate Europe/EMA+41 58 249 54 [email protected]
KPMG in France
Mark WyattPartner, Country Head Corporate Finance+33 15 568 93 00 [email protected]
Regis ChemounyPartner, Audit+33 15 568 68 18 [email protected]
Cyril SchlesserDirector, Corporate Finance+33 155 68 93 04 [email protected]
KPMG in UK
Andy PylePartner, Head of Real Estate+44 20 7311 [email protected]
Stephen BarterDirector, Chairman of UK Real Estate Advisory+44 20 7694 [email protected]
John TaylorAssociate Partner, Real Estate+44 20 7311 [email protected]
KPMG in Germany
Gunther LiermannPartner, Corporate Finance Real Estate+49 69 9587 [email protected]
Niels P. E. BuckPartner,Transaction Services+49 40 32015 [email protected]
Sven AndersenPartner, Real Estate M&A+49 69 9587 [email protected]
KPMG in Sweden
Björn FlinkPartner, Head of Real Estate+46 8 [email protected]
KPMG in Finland
Erik Renfors Director, Advisory+358 20 760 [email protected]
KPMG in Denmark
Michael TuborgDirector, Head of Real Estate+45 52 15 00 [email protected]
KPMG in Norway
Ole Christian FongaardPartner, Head of Real Estate+47 40 63 90 [email protected]
KPMG in The Netherlands
Hans GrönlohPartner, Head of Real Estate +31 20 656 77 [email protected]
Frank MuldersDirector, Head of Real Estate Advisory (Transactions)+31 20 656 76 [email protected]
Sander GrünewaldSenior Manager, Head of Real Estate Advisory (Consulting) +31 20 656 84 [email protected]
KPMG in Belgium
Koen MaerevoetPartner, Real Estate and Infrastructure+32 2 708 38 [email protected]
KPMG in Luxembourg
Pierre KreemerPartner, Head of Real Estate and Infrastructure+352 22 51 51 [email protected]
Yves CourtoisPartner, Corporate Finance+352 22 51 51 7503 [email protected]
KPMG in Switzerland
Ulrich PrienPartner, Head of Real Estate+41 58 249 62 [email protected]
Beat SegerPartner, Real Estate M&A+41 58 249 29 [email protected]
KPMG in Austria
Klaus MittermairPartner, Head of T&R+43 732 6938 [email protected]
KPMG in Italy
Maurizio NitratiPartner, Head of Building, Construction and Real Estate+39 06 8097 [email protected]
Andrea GiulianiAssociate Director, Advisory+39 06 8097 [email protected]
KPMG in Spain
Javier Lopez TorresPartner, Head of Real Estate+34 91 451 30 [email protected]
Emilio MiravetPartner, Corporate Finance Real Estate+34 91 451 32 [email protected]
KPMG in Central and Eastern Europe
Andrea SartoriPartner, Head of Real Estate+36 1 887 72 [email protected]
KPMG in Russia
Sven OsmersDirector, Head of Real Estate Advisory +7 495 937 44 [email protected]
KPMG in Turkey
Hakkı Özgür SıvacıPartner, Audit+90 216 681 90 [email protected]
© 2016 KPMG Holding AG/SA, a Swiss corporation, is a member of the KPMG network of independent firms affiliated with KPMG International Cooperative (“KPMG International”), a Swiss legal entity. All rights reserved. Printed in Switzerland. The KPMG name and logo are registered trademarks.
European Real SnapShot! 65

The information contained herein is of a general nature and is not intended to address the circumstances of any particular individual or entity. Although we endeavor to provide accurate and timely information, there can be no guarantee that such information is accurate as of the date it is received or that it will continue to be accurate in the future. No one should act on such information without appropriate professional advice after a thorough examination of the particular situation.
© 2016 KPMG Holding AG/SA, a Swiss corporation, is a member of the KPMG network of independent firms affiliated with KPMG International Cooperative (“KPMG International”), a Swiss legal entity. All rights reserved. Printed in Switzerland. The KPMG name and logo are registered trademarks.


