5
EUROPE’S LEADING TECH FESTIVAL For delegations
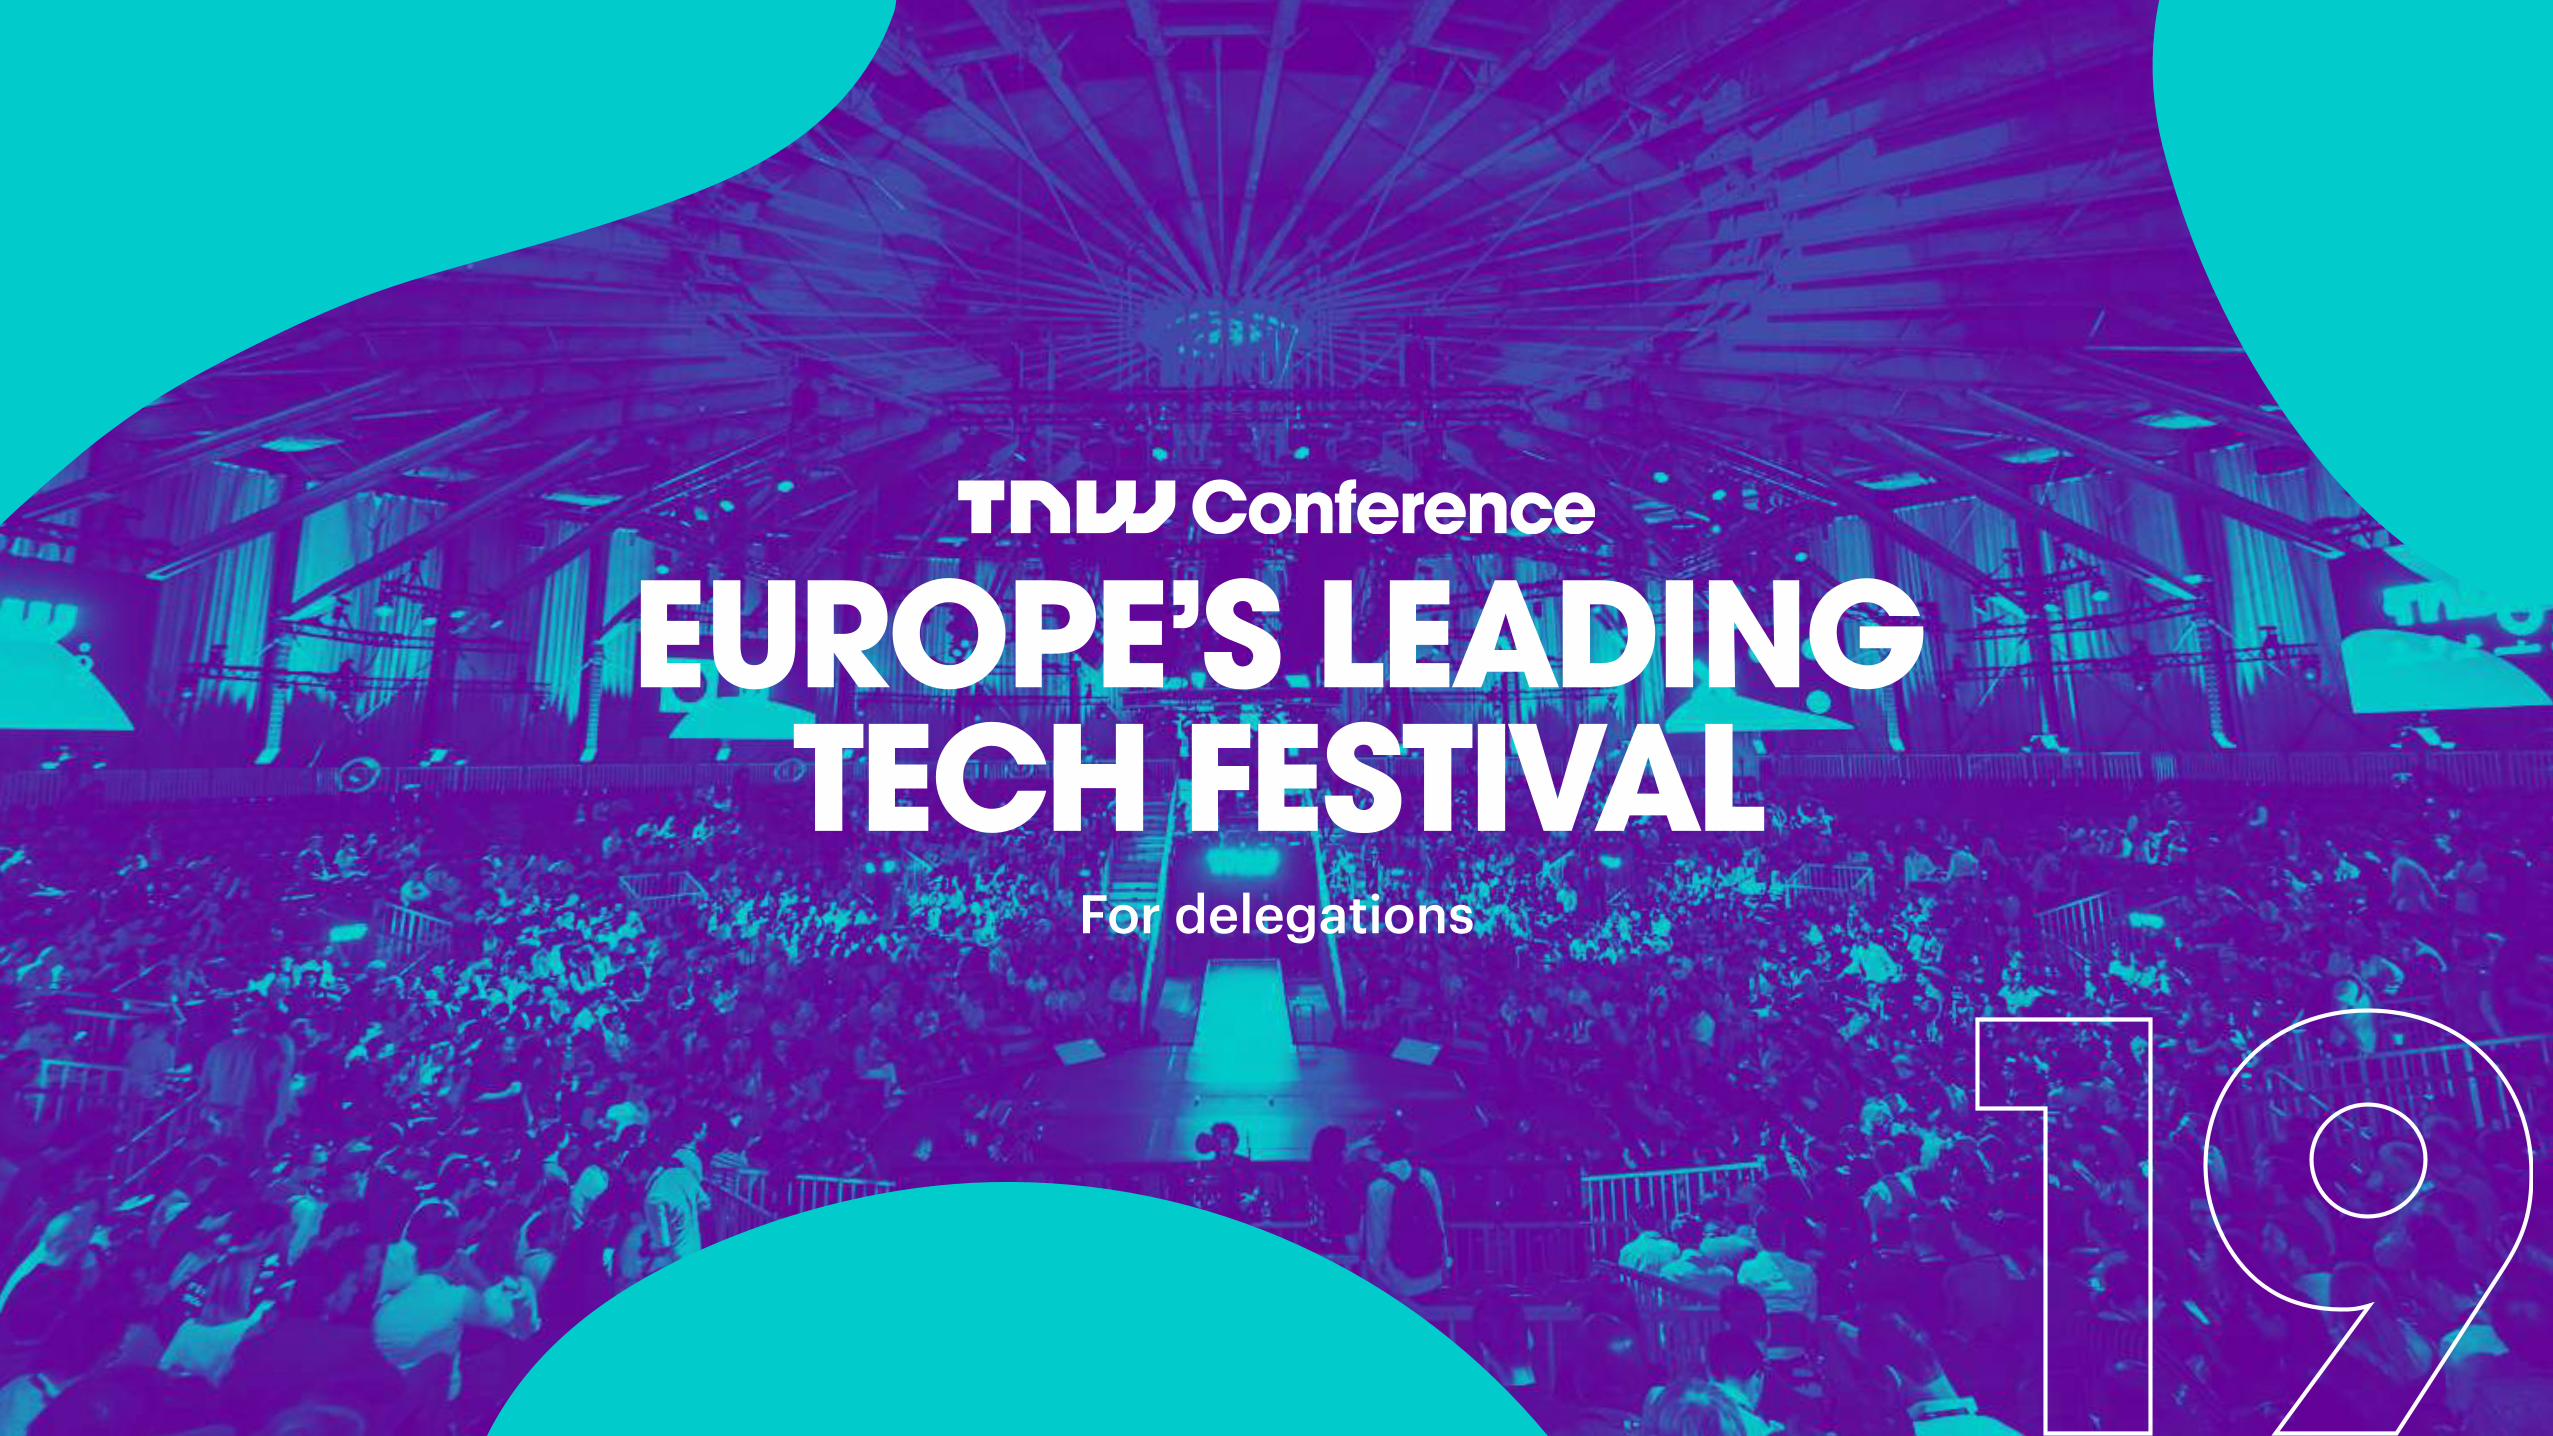
EUROPE’S LEADING TECH FESTIVAL
For delegations

“The most intimate technology conference on the planet”

The year was 2006
A lot has changed in 13 years. Back in 2006, TNW Co-founders Boris & Patrick were celebrating being able to find 300 technology and internet enthusiasts to attend the first ever edition of The Next Web Conference.
Now we're an unmissable fixture in the European tech scene, bringing together a week of side events and a 2-day conference consisting of 18 content tracks, 100+ game-changing exhibitors and partners, 600+ startups and 3000m2 of business floor – all built around our open-air festival space in Amsterdam.

TNW Conference Audience
EUROPE
78%
ROW
9%
NORTH AMERICA
13%
Benelux 47%
USA 10%
UK 9%
DACH 8%
Nordics 5%
France 3%
Rest of Europe 11%
Rest of the World 7%
17,500ATTENDEES 2019E
2006 2013 2015 2016 2017 2018 2019E
17.50015.000
12.5009.457
3.6101.625280
72%DECISION MAKERS
7000+COMPANIES
30.000+BUSINESS MEETINGS
350+PRESS
ATTENDEES
100M+SOCIAL MEDIA IMPRESSIONS
100+COUNTRIES
600+STARTUPS
*2018 Attendee Data

IndustryMarketing & Advertising tech
eCommerce & Retail
Professional Services
Fintech
Media/Agency/Online Publishing
Consumer Goods
HR & Education
AI & Machine Learning
IoT & Hardware
Venture Capital & Investment
Governmental & Trade
Other
23
13
11
10
8
6
5
5
3
2
2
12
%
8%
23%
28%
7%
13%
21% FOUNDER
CXO
VP
MID-LEVEL
PROFESSIONAL
OTHER
Seniority
Expertise
Company Size
5001+16%
1001-500011%
501-100010%
201-50016%
51-20017%
1-5030%
MARKETING & COMMUNICATION
INNOVATION
DEVELOPMENT
DESIGN & CREATIVE
SALES
PRODUCT
ADMIN (HR, FINANCE ETC.)
OTHER
3%
5%
8%
11%
13%
13%
17%
30%
*2018 Attendee Data


![SHIFT mag [n°7] - Europe by the rest of the world](https://static.documents.pub/doc/80x56/568bf3fc1a28ab89339c5984/shift-mag-n7-europe-by-the-rest-of-the-world.jpg)


