FOR RELEASE NOV. 29, 2017 FOR MEDIA OR OTHER INQUIRIES: Alan Cooperman, Director of Religion Research Conrad Hackett, Associate Director of Research Anna Schiller, Communications Manager 202.419.4372 www.pewresearch.org RECOMMENDED CITATION Pew Research Center, Nov. 29, 2017, “Europe’s Growing Muslim Population”
Transcript
FOR RELEASE NOV. 29, 2017
FOR MEDIA OR OTHER INQUIRIES:
Alan Cooperman, Director of Religion Research
Conrad Hackett, Associate Director of Research
Anna Schiller, Communications Manager
202.419.4372
www.pewresearch.org
RECOMMENDED CITATION
Pew Research Center, Nov. 29, 2017, “Europe’s
Growing Muslim Population”
1
PEW RESEARCH CENTER
www.pewresearch.org
About Pew Research Center
Pew Research Center is a nonpartisan fact tank that informs the public about the issues, attitudes
and trends shaping America and the world. It does not take policy positions. The Center conducts
public opinion polling, demographic research, content analysis and other data-driven social
science research. It studies U.S. politics and policy; journalism and media; internet, science and
technology; religion and public life; Hispanic trends; global attitudes and trends; and U.S. social
and demographic trends. All of the Center’s reports are available at www.pewresearch.org. Pew
Research Center is a subsidiary of The Pew Charitable Trusts, its primary funder.
This report was produced by Pew Research Center as part of the Pew-Templeton Global Religious
Futures project, which analyzes religious change and its impact on societies around the world.
Funding for the Global Religious Futures project comes from The Pew Charitable Trusts and the
Total 514,810,000 520,830,000 481,690,000 516,950,000 538,600,000
Note: Europe is defined here as the 28 nations of the EU plus Norway and Switzerland. In zero migration scenario, no migration of any kind takes place to
or from Europe. In medium migration scenario, regular migration continues and refugee flows cease. In high migration scenario, 2014 to mid-2016
refugee inflow patterns continue in addition to regular migration. Estimates do not include those asylum seekers who are not expected to gain legal status
to remain in Europe.
Source: Pew Research Center estimates and projections. See Methodology for details.
“Europe’s Growing Muslim Population”
PEW RESEARCH CENTER
28
PEW RESEARCH CENTER
www.pewresearch.org
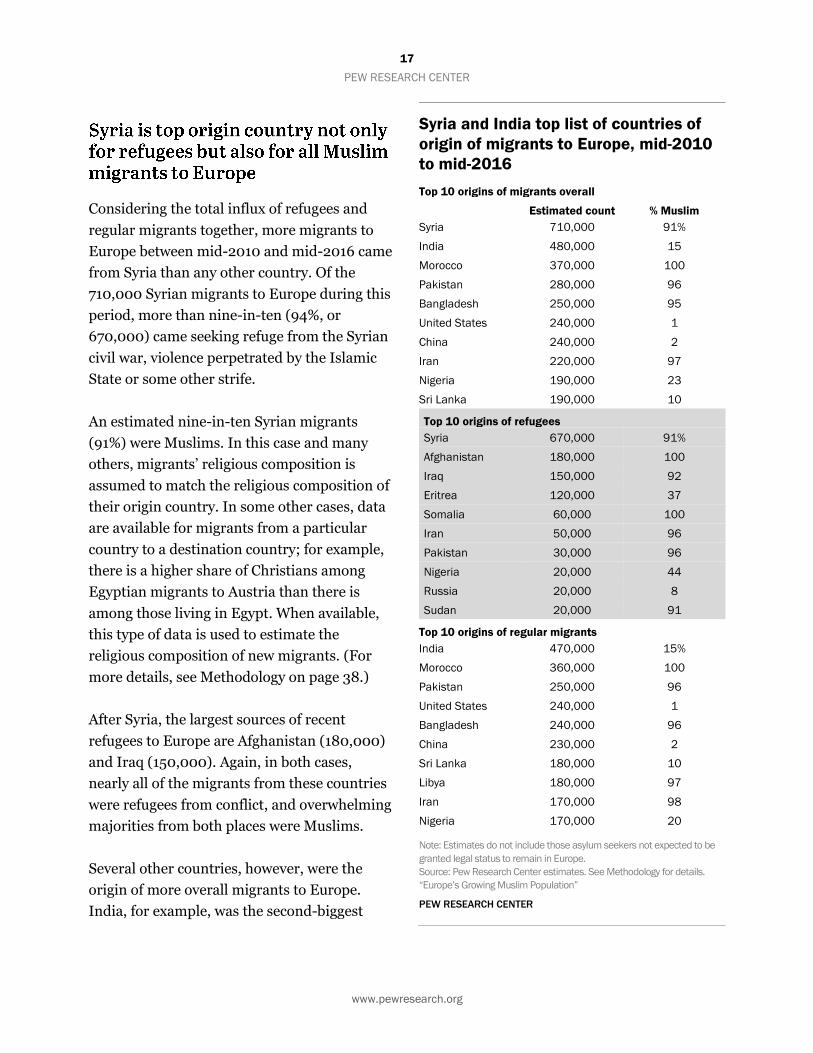
As of 2016, France and Germany have the highest numbers of Muslims in Europe. But in the
medium migration scenario, the United Kingdom would surpass them, with a projected 13 million
Muslims in 2050 (compared with a projected 12.6 million in France and 8.5 million in Germany).
This is because the UK was the top destination country for regular Muslim migrants (as opposed to
refugees) between mid-2010 and mid-2016, and the medium scenario assumes that only regular
immigration will continue.
Alternatively, in the high migration scenario, Germany would have by far the highest number of
Muslims in 2050 – 17.5 million. This projection reflects Germany’s acceptance of a large number
of Muslim refugees in recent years. The high scenario assumes that these refugee flows will
continue in the coming decades, not only at the same volume but also with the same religious
composition (i.e., that many refugees will continue to come from predominantly Muslim
countries). Compared with the UK and France, Germany has received fewer regular Muslim
migrants in recent years.
Other, smaller European countries also are expected to experience significant growth in their
Muslim populations if regular migration or an influx of refugees continues (or both). For instance,
in Sweden, the number of Muslims would climb threefold from fewer than a million (810,000) in
2016 to nearly 2.5 million in 2050 in the medium scenario, and fivefold to almost 4.5 million in
the high scenario.
But some countries – even some large ones, like Poland – had very few Muslims in 2016 and are
projected to continue to have very few Muslims in 2050 in all three scenarios. Poland’s Muslim
population was roughly 10,000 in 2016 and would only rise to 50,000 in the medium scenario and
60,000 in the high scenario.
29
PEW RESEARCH CENTER
www.pewresearch.org
Projected Muslim counts over time under different migration scenarios
2010 2016
2050 zero migration
scenario
2050 medium migration
scenario
2050 high migration
scenario
Europe overall 19,520,000 25,770,000 35,770,000 57,880,000 75,550,000
United Kingdom 2,970,000 4,130,000 6,560,000 13,060,000 13,480,000
Estonia < 10,000 < 10,000 < 10,000 < 10,000 10,000
Notes: In zero migration scenario, no migration of any kind takes place to or from Europe. In medium migration scenario, regular migration continues and
refugee flows cease. In high migration scenario, 2014 to mid-2016 refugee inflow patterns continue in addition to regular migration. Estimates do not
include those asylum seekers who are not expected to gain legal status to remain in Europe.
Source: Pew Research Center estimates and projections. See Methodology for details.
“Europe’s Growing Muslim Population”
PEW RESEARCH CENTER
30
PEW RESEARCH CENTER
www.pewresearch.org
These growing numbers of
Muslims in Europe, combined
with the projected shrinkage
of the non-Muslim population,
are expected to result in a
rising share of Muslims in
Europe’s overall population in
all scenarios.
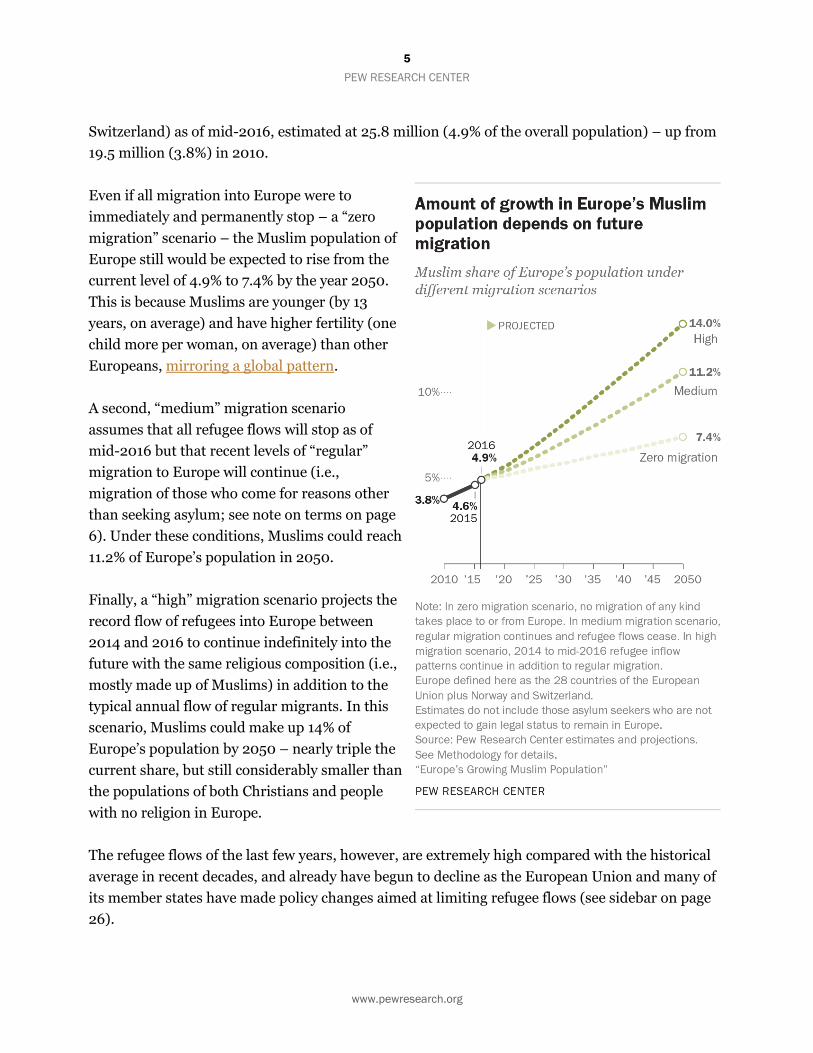
Even if every EU country plus
Norway and Switzerland
immediately closed its borders
to any further migration, the
Muslim share of the
population in these 30
countries would be expected
to rise from 4.9% in 2016 to
7.4% in 2050 simply due to
prevailing demographic
trends. In the medium
migration scenario, with
projected future regular
migration but no refugees, the
Muslim share of Europe would
rise to 11.2% by midcentury.
And if high refugee flows were
to continue in future decades,
Europe would be 14% Muslim
in 2050 – a considerable
increase, although still a
relative minority in a
Christian-majority region.
Cyprus currently has the
highest share of Muslims in
the EU (25.4%), due largely to
the historical presence of
predominantly Muslim
The size of the European Muslim population in 2050
depends largely on the future of migration
Estimated and projected Muslim population shares
Country 2010 2016 2050 zero migration
2050 medium migration
2050 high migration
Cyprus 25.3% 25.4% 25.5% 26.6% 28.3%
Sweden 4.6 8.1 11.1 20.5 30.6
France 7.5 8.8 12.7 17.4 18.0
United Kingdom 4.7 6.3 9.7 16.7 17.2
Belgium 6.0 7.6 11.1 15.1 18.2
Norway 3.7 5.7 7.2 13.4 17.0
Netherlands 6.0 7.1 9.1 12.5 15.2
Italy 3.6 4.8 8.3 12.4 14.1
Denmark 4.0 5.4 7.6 11.9 16.0
Finland 1.2 2.7 4.2 11.4 15.0
Europe overall 3.8 4.9 7.4 11.2 14.0
Germany 4.1 6.1 8.7 10.8 19.7
Austria 5.4 6.9 9.3 10.6 19.9
Switzerland 4.9 6.1 8.2 10.3 12.9
Malta 0.2 2.6 3.2 9.3 16.2
Bulgaria 11.1 11.1 12.5 9.2 11.6
Greece 5.3 5.7 6.3 8.1 9.7
Spain 2.1 2.6 4.6 6.8 7.2
Luxembourg 2.3 3.2 3.4 6.7 9.9
Slovenia 3.6 3.8 4.3 5.0 5.2
Ireland 1.1 1.4 1.6 4.3 4.4
Portugal 0.3 0.4 0.5 2.5 2.5
Croatia 1.5 1.6 1.8 2.0 2.1
Hungary 0.1 0.4 0.4 1.3 4.5
Czech Republic 0.1 0.2 0.2 1.1 1.2
Estonia 0.2 0.2 0.2 0.8 1.0
Romania 0.3 0.4 0.4 0.8 0.9
Slovakia 0.0 0.1 0.1 0.6 0.7
Latvia 0.1 0.2 0.2 0.2 0.4
Poland 0.0 0.0 0.0 0.2 0.2
Lithuania 0.1 0.1 0.1 0.1 0.2
Notes: In zero migration scenario, no migration of any kind takes place to or from Europe. In medium
migration scenario, regular migration continues and refugee flows cease. In high migration scenario,
2014 to mid-2016 refugee inflow patterns continue in addition to regular migration. Estimates do not
include those asylum seekers who are not expected to gain legal status to remain in Europe.
Source: Pew Research Center estimates and projections. See Methodology for details.
“Europe’s Growing Muslim Population”
PEW RESEARCH CENTER
31
PEW RESEARCH CENTER
www.pewresearch.org
Turkish Cypriots in the northern part of the island. Migration is not projected to dramatically
change the Muslim share of the population in Cyprus in future scenarios.
In both the zero and medium migration scenarios, Cyprus would maintain the largest Muslim
share in Europe in 2050. But in the high migration scenario, Sweden – which was among the
countries to accept a large number of refugees during the recent surge – is projected to surpass
even Cyprus. In this scenario, roughly three-in-ten Swedes (30.6%) would be Muslim at
midcentury.
Even in the medium scenario, without any future refugee flows, Sweden would be expected to have
the second-largest Muslim share (20.5%) as of 2050. If migration were to stop altogether, a much
smaller percentage of Swedes (11.1%) would be Muslim in 2050.
Migration also drives the projected increase in the Muslim shares of France, the UK and several
other countries. Both France and the UK are expected to be roughly 17% Muslim by 2050 in the
medium scenario, several percentage points higher than they would be if all future migration were
to stop. Because both countries have accepted many more Muslim regular migrants than Muslim
refugees, France and the UK do not vary as greatly between the medium scenario and the high
scenario.
Germany, on the other hand, sees a dramatic difference in its projected Muslim share depending
on future refugee flows. The share of Muslims in Germany (6.1% in 2016) would increase to 10.8%
in 2050 under the medium scenario, in which regular migration continues at its recent pace and
refugee flows stop entirely. But it would rise far more dramatically, to 19.7%, in the high scenario,
if the recent volume of refugee flows continues as well. There is a similar pattern in Austria (6.9%
Muslim in 2016, 10.6% in 2050 in the medium scenario and 19.9% in 2050 in the high scenario).
32
PEW RESEARCH CENTER
www.pewresearch.org
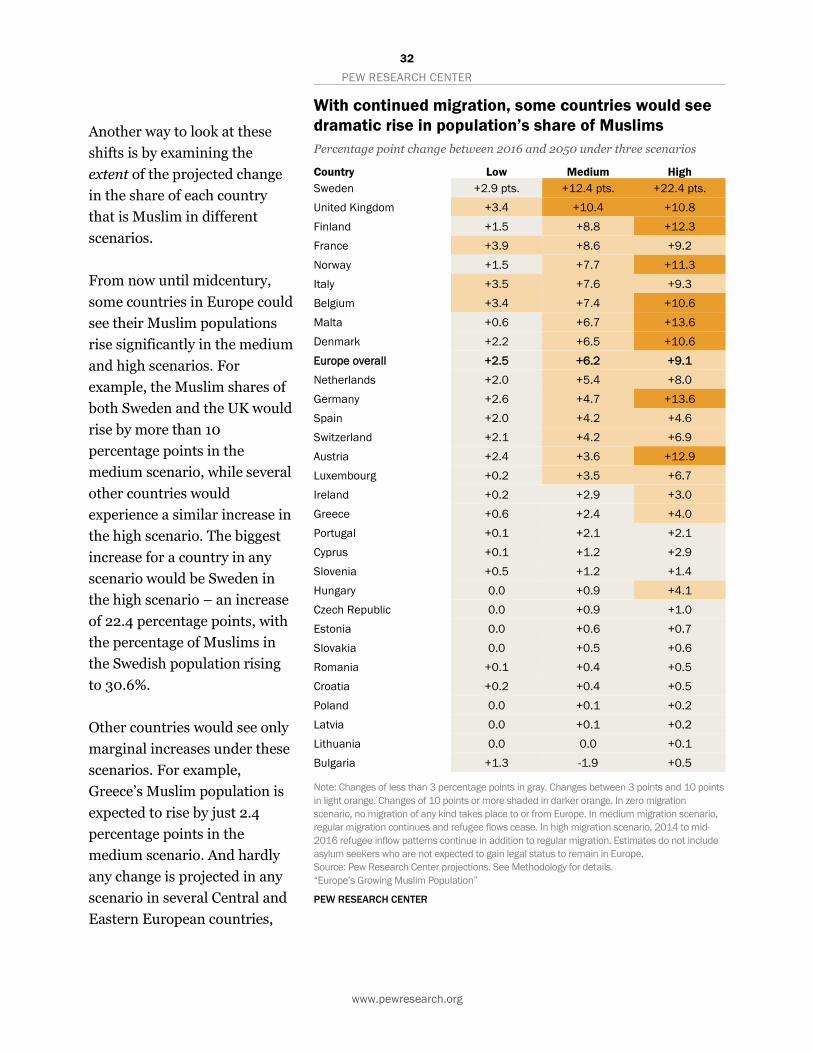
Another way to look at these
shifts is by examining the
extent of the projected change
in the share of each country
that is Muslim in different
scenarios.
From now until midcentury,
some countries in Europe could
see their Muslim populations
rise significantly in the medium
and high scenarios. For
example, the Muslim shares of
both Sweden and the UK would
rise by more than 10
percentage points in the
medium scenario, while several
other countries would
experience a similar increase in
the high scenario. The biggest
increase for a country in any
scenario would be Sweden in
the high scenario – an increase
of 22.4 percentage points, with
the percentage of Muslims in
the Swedish population rising
to 30.6%.
Other countries would see only
marginal increases under these
scenarios. For example,
Greece’s Muslim population is
expected to rise by just 2.4
percentage points in the
medium scenario. And hardly
any change is projected in any
scenario in several Central and
Eastern European countries,
With continued migration, some countries would see
dramatic rise in population’s share of Muslims
Percentage point change between 2016 and 2050 under three scenarios
Country Low Medium High
Sweden +2.9 pts. +12.4 pts. +22.4 pts.
United Kingdom +3.4 +10.4 +10.8
Finland +1.5 +8.8 +12.3
France +3.9 +8.6 +9.2
Norway +1.5 +7.7 +11.3
Italy +3.5 +7.6 +9.3
Belgium +3.4 +7.4 +10.6
Malta +0.6 +6.7 +13.6
Denmark +2.2 +6.5 +10.6
Europe overall +2.5 +6.2 +9.1
Netherlands +2.0 +5.4 +8.0
Germany +2.6 +4.7 +13.6
Spain +2.0 +4.2 +4.6
Switzerland +2.1 +4.2 +6.9
Austria +2.4 +3.6 +12.9
Luxembourg +0.2 +3.5 +6.7
Ireland +0.2 +2.9 +3.0
Greece +0.6 +2.4 +4.0
Portugal +0.1 +2.1 +2.1
Cyprus +0.1 +1.2 +2.9
Slovenia +0.5 +1.2 +1.4
Hungary 0.0 +0.9 +4.1
Czech Republic 0.0 +0.9 +1.0
Estonia 0.0 +0.6 +0.7
Slovakia 0.0 +0.5 +0.6
Romania +0.1 +0.4 +0.5
Croatia +0.2 +0.4 +0.5
Poland 0.0 +0.1 +0.2
Latvia 0.0 +0.1 +0.2
Lithuania 0.0 0.0 +0.1
Bulgaria +1.3 -1.9 +0.5
Note: Changes of less than 3 percentage points in gray. Changes between 3 points and 10 points
in light orange. Changes of 10 points or more shaded in darker orange. In zero migration
scenario, no migration of any kind takes place to or from Europe. In medium migration scenario,
regular migration continues and refugee flows cease. In high migration scenario, 2014 to mid-
2016 refugee inflow patterns continue in addition to regular migration. Estimates do not include
asylum seekers who are not expected to gain legal status to remain in Europe.
Source: Pew Research Center projections. See Methodology for details.
“Europe’s Growing Muslim Population”
PEW RESEARCH CENTER
33
PEW RESEARCH CENTER
www.pewresearch.org
including Poland, Latvia and Lithuania.
In Europe overall, even if all Muslim migration into Europe were to immediately and permanently
stop – a zero migration scenario – the overall Muslim population of Europe would be expected to
rise by 2.5 percentage points, from the current level of 4.9% to 7.4% by 2050. This is because
Muslims in Europe are considerably younger and have a higher fertility rate than other Europeans.
Without any future migrants, these prevailing demographic trends would lead to projected rises of
at least 3 percentage points in the Muslim shares of France, Belgium, Italy and the UK.
34
PEW RESEARCH CENTER
www.pewresearch.org
Migration aside, fertility rates are among the
other dynamics driving Europe’s growing
Muslim population. Europe’s Muslims have
more children than members of other religious
groups (or people with no religion) in the
region. (New Muslim migrants to Europe are
assumed to have fertility rates that match those
of Muslims in their destination countries; for
more details, see Methodology.)
Not all children born to Muslim women will
ultimately identify as Muslims, but children are
generally more likely to adopt their parents’
religious identity than any other.5
Taken as a whole, non-Muslim European
women are projected to have a total fertility rate
of 1.6 children, on average, during the 2015-
2020 period, compared with 2.6 children per
Muslim woman in the region. This difference of
one child per woman is particularly significant
given that fertility among European Muslims
exceeds replacement level (i.e., the rate of
births needed to sustain the size of a
population) while non-Muslims are not having
enough children to keep their population
steady.
The difference between Muslim women and others varies considerably from one European country
to another. In some countries, the disparity is large. The current estimated fertility rate for Muslim
5 In France, roughly 10% of those raised Muslim switch to identify with some other religion or with no religion as adults. Projections for
Western European countries assume that rising cohorts of Muslims will experience a 10% defection rate, drawing on the data from France,
the only Western European country with an adequate sample for measuring switching patterns of those raised Muslim. Patterns of switching
to Islam are captured in country-specific surveys and are incorporated into projections.
In Europe, Muslims projected to have
more children than non-Muslims
Total fertility rates, 2015-2020
Muslims Non-
Muslims Difference
Europe average 2.6 1.6 +1.0
Finland 3.1 1.7 +1.4
United Kingdom 2.9 1.8 +1.0
France 2.9 1.9 +1.0
Sweden 2.8 1.8 +0.9
Belgium 2.6 1.7 +0.9
Denmark 2.5 1.7 +0.8
Netherlands 2.3 1.7 +0.5
Austria 2.2 1.5 +0.7
Norway 2.1 1.8 +0.3
Switzerland 2.1 1.5 +0.6
Germany 1.9 1.4 +0.5
Ireland 1.8 2.0 -0.2
Slovenia 1.7 1.6 +0.1
Bulgaria 1.6 1.6 +0.1
Romania 1.6 1.5 +0.1
Greece 1.5 1.3 +0.2
Note: The total fertility rate (TFR) is an estimate of the number of children
an average woman is expected to have in her lifetime based upon age-
specific fertility patterns observed in a given period. Europe is defined here
as the 28 nations of the EU plus Norway and Switzerland. Countries
lacking sufficient data are not shown. Differences between Muslims and
non-Muslims are computed based on unrounded numbers.
Source: Pew Research Center calculations. See Methodology for details..
“Europe’s Growing Muslim Population”
PEW RESEARCH CENTER
35
PEW RESEARCH CENTER
www.pewresearch.org
women in Finland, for example, is 3.1 children
per woman, compared with 1.7 for non-Muslim
Finns.6
Among Western European countries with the
largest Muslim populations, Germany’s Muslim
women have relatively low fertility, at just 1.9
children per woman (compared with 1.4 for
non-Muslim Germans). Muslims in the UK and
France, meanwhile, average 2.9 children – a full
child more per woman than non-Muslims. This
is one reason the German Muslim population –
both in total number and as a share of the
overall population – is not projected to keep
pace with the British and French Muslim
populations, except in the high scenario (which
includes large future refugee flows).
In some countries, including Bulgaria and Greece, there is little difference in fertility rates between
Muslims and non-Muslims.
Over time, Muslim fertility rates are projected to decline, narrowing the gap with the non-Muslim
population from a full child per woman today to 0.7 children between 2045 and 2050. This is
because the fertility rates of second- and third-generation immigrants generally become similar to
the overall rates in their adopted countries.
The low fertility rate in Europe among non-Muslims is largely responsible for the projected decline
in the region’s total population without future migration.
6 The fertility difference may be even larger between Muslims and non-Muslims in Spain and Italy, but due to concerns about the reliability of
data in these countries, these values are not displayed. In European countries with small Muslim populations, data are not sufficient to
reliably estimate fertility differences.
Estimated total fertility rates (children
born per woman) over time in Europe,
for medium migration scenario
Muslim Non-
Muslim Difference
2015-2020 2.6 1.6 1.0
2020-2025 2.6 1.6 1.0
2025-2030 2.5 1.6 0.9
2030-2035 2.5 1.6 0.9
2035-2040 2.5 1.7 0.8
2040-2045 2.4 1.7 0.8
2045-2050 2.4 1.7 0.7
Note: Europe is defined here as the 28 nations of the EU plus Norway and
Switzerland. In medium migration scenario, regular migration continues
and refugee flows cease. Differences computed based on unrounded
numbers.
Source: Pew Research Center calculations. See Methodology for details.
“Europe’s Growing Muslim Population”
PEW RESEARCH CENTER
36
PEW RESEARCH CENTER
www.pewresearch.org
The age distribution of a religious group also is
an important determinant of demographic
growth.
European Muslims are concentrated in young age
groups – the share of Muslims younger than 15
(27%) is nearly double the share of non-Muslims
who are children (15%). And while one-in-ten
non-Muslim Europeans are ages 75 and older,
this is true of only 1% of Muslims in Europe.
37
PEW RESEARCH CENTER
www.pewresearch.org
As of 2016, there is a 13-year difference
between the median age of Muslims in Europe
(30.4 years of age) and non-Muslim Europeans
(43.8). Because a larger share of Muslims
relative to the general population are in their
child-bearing years, their population would
grow faster, even if Muslims and non-Muslims
had the same fertility rates.
As of 2016, France and Germany have the
greatest age differences in Europe between
Muslims and non-Muslims. The median age of
Muslims in France is just 27, compared with 43
for non-Muslims. Germany has an equally large
gap (31 for Muslims, 47 for non-Muslims).
Muslims are younger than non-Muslims
Median age, 2016
Muslims Non-Muslims Age
difference
Europe average 30 44 -13
France 27 43 -16
Germany 31 47 -16
Belgium 29 43 -14
Italy 33 47 -14
United Kingdom 28 41 -13
Denmark 30 43 -13
Finland 30 43 -13
Switzerland 30 44 -13
Austria 30 45 -15
Malta 30 42 -13
Norway 29 40 -11
Hungary 29 42 -12
Sweden 31 42 -12
Netherlands 33 44 -11
Spain 33 44 -11
Portugal 34 44 -10
Czech Republic 32 42 -10
Ireland 30 37 -7
Slovakia 32 39 -7
Poland 33 40 -7
Bulgaria 39 44 -5
Estonia 37 42 -5
Romania 38 42 -4
Slovenia 39 44 -4
Greece 40 44 -5
Luxembourg 35 40 -5
Croatia 40 43 -3
Latvia 41 43 -3
Cyprus 36 37 0
Lithuania 43 43 0
Note: Europe is defined here as the 28 nations of the EU plus Norway and
Switzerland. Differences computed based on unrounded numbers
Source: Pew Research Center calculations. See Methodology for details.
“Europe’s Growing Muslim Population”
PEW RESEARCH CENTER
38
PEW RESEARCH CENTER
www.pewresearch.org
Appendix A: Methodology
The estimates and projections in this report build upon and update data from the April 2015 Pew
Research Center report, “The Future of World Religions: Population Growth Projections, 2010-
2050.” Soon after the release of that report, a large influx of migrants entered Europe seeking
refugee status. This report includes estimates of how Europe’s Muslim population changed from
mid-2010 to mid-2016, with particular attention to change caused by migration. It also includes
projections of how the size of Europe’s Muslim population may change in the future under
different migration scenarios.
This study takes advantage of more than 2,500 data sources gathered for previous projections,
including censuses, demographic surveys, general population surveys and other studies.
Additionally, this study draws on new data, including asylum-seeker data through mid-2016 from
Eurostat (Europe’s statistical agency), as well as new survey and other government data.
The earliest population figures in this report are for the year 2010. Several Pew Research Center
reports estimated the size of religious populations, including Muslims, in Europe in the year 2010
(“The Future of the Global Muslim Population,” released in 2011; “The Global Religious
Landscape,” released in 2012; and the aforementioned “The Future of World Religions” report,
released in 2015). Each report builds on our prior reports, adjusting estimates based on new data.
While previous religious demography reports classified 50 countries, including Russia, as part of
Europe, this report focuses on a narrower set of 30 countries: the 28 member nations of the
European Union (as of mid-2016), as well as Norway and Switzerland.7 The reasons for the
narrower geographic focus of this report are both substantive and pragmatic. These 30 countries
have received the bulk of Europe’s asylum seekers in recent years and they are the countries for
which data on asylum-seeking patterns are available from Eurostat.
The gold standard for measuring religious identity in this report is a census or survey question that
asks, “What is your religion, if any?” The aim in this report is to measure identity sociologically
7 For the 50-country Europe region in “The Future of World Religions,” the Muslim population in 2010 was estimated to be 43.5 million (when
Cyprus – which is part of the European Union but is not included in Europe in that report – is added in, the total rises to 43.7 million). Of the
remaining 20 countries excluded from this report, the most consequential difference is the absence of Russia, which had an estimated 14.3
million Muslims in 2010.
When Muslim estimates used in “The Future of World Religions” report are aggregated for the 30 countries in this report, the 2010 total is
21.2 million (and 22.2 million for the remaining 20 countries, including Russia). In this report, the 2010 estimate for the size of the Muslim
population in the EU, Norway and Switzerland is 19.5 million. The country estimate that is most different between reports is Germany. “The
Future of World Religions” had a higher estimate of Germany’s Muslim population in 2010 (4.8 million) because it relied on estimates of
Germany’s overall population size that analysis of the 2011 census found to be exaggerated (see discussion of Germany in the next section).
Based on analysis of new government data, this report estimates Germany’s Muslim population in 2010 to have been 3.3 million.
Sweden, Switzerland and the United Kingdom), adequate survey data are available on both the
religious upbringing of survey respondents and on current adult religious identity.11 Data on
patterns of switching from non-Muslim religions to Islam come from the International Social
Survey Program. In France, data on patterns of switching out of Islam among those raised Muslim
come from the Trajectories and Origins survey, which found that approximately 10% of those
raised Muslim later switched to no religious affiliation or to some other religion. Because other
European countries lack sufficient data to measure patterns of switching out of Islam, the French
pattern is borrowed for other Western European countries. Thus, in Western Europe, projections
model that roughly 10% of rising cohorts of children raised in Islam will switch out of the faith as
adults.
Since men and women often follow different switching patterns, researchers calculated rates of
switching separately for men and women based on the experiences of adults ages 18 to 54 at the
time of the survey. Researchers assume that the experience of young respondents is the best
source of information about likely switching patterns for emerging generations, so the experiences
of older respondents (those ages 55 and above) are excluded from the analysis. The analysis was
initially restricted to the switching experience of 30- to 54-year-olds; while this restriction allowed
the focus to be on respondents who have recently completed their young adult years, it left less-
11 Switching data were not available for Bulgaria, Cyprus, Estonia, Greece, Lithuania, Luxembourg, Malta and Romania.
47
PEW RESEARCH CENTER
www.pewresearch.org
than-optimal sample sizes. Including the full range of adults ages 18 to 54 in the sample increased
sample sizes and did not appear to compromise the reliability of the switching rates.
The estimates of religious switching for Muslims and non-Muslims in the 3o countries of this
report are the same as those estimated for the 2015 “Future of World Religions” report.
Estimating and projecting the size and religious composition of regular migrants
To model the impact of migration on future religious change, the population projections in this
report required an estimate of the religious composition of recent migrant flows between
countries. That is, how many migrants moving from country X to country Y are Muslim? How
many have some other religious identity? Data on the size and religious breakdown of migrant
flows were pieced together in two steps. The first step was to estimate how many people move to
and from every country in the world. Second, the religious composition of migrants moving
between countries was estimated.
Generally speaking, there is much better information on migrant “stocks” (how many foreign-born
people reside in each country, and where they were born) than there is on migrant “flows” (how
many people move between countries each year). The limited flow data that are available may not
capture all modes of travel or all kinds of international migrants, and it can be difficult to
distinguish short-term travel from long-term migration. Since data on migration flows are
incomplete, data on migrant stocks for 2010 and 2015, estimated by the United Nations, were used
to estimate migration flows for both males and females.12 Demographer Guy Abel developed an
innovative technique to estimate migration flows between countries using this stock data.13 Using
empirical data and observed regularities in the age patterns of migration flows, researchers were
able to disaggregate each estimated total flow into subtotals by five-year age groups. The bilateral
flows estimated based on the UN migrant stock data include asylum-seeking and regular, non-
asylum-seeking migration. Although the UN data include refugee stock estimates from the Office
of the UN High Commissioner for Refugees, the latest UN migrant stock data (released in
December 2015) was prepared too early to capture the large volume of asylum seeker flows that
arrived late in the 2010 to 2015 interval. Since Eurostat provides updated measures of asylum
seeker flows, Eurostat is the source of asylum seeker data in this report and UN data were
manually adjusted to reduce flow estimates (such as the flow from Syria to Sweden) likely to have
been largely composed of asylum seekers. Thus, adjusted data from Guy J. Abel, based on UN
12 This approach is described in Abel, Guy J. Forthcoming. “Estimates of Global Bilateral Migration Flows by Gender between 1960 and 2015.”
International Migration Review. 13 See Abel, Guy J. 2013. “Estimating global migration flow tables using place of birth data.” Demographic Research. Also see Abel, Guy J. and
Nikola Sander. 2014. “Quantifying Global International Migration Flows.” Science.
Religious composition Age and sex Fertility Religion of migrants Switching to Islam
Austria Estimates based on 2001 Census.
Estimates based on 2001 Census.
Data on fertility differences between religious groups based on 2001 Census.
Religion of some incoming migrants is based on Pew Research Center's 2012 Global Religion and Migration Database.
Rates based on 2008 International Social Survey Programme survey.
Belgium Estimates based on 2001 Census.
Estimates based on 2001 Census.
Data on fertility differences between religious groups based on 2001 Generations and Gender Survey.
Religion of incoming migrants is based on the religious composition of the origin country.
Rates based on 2008 International Social Survey Programme survey.
Bulgaria Estimates based on 2011 Census.
Estimates based on 2011 Census.
Data on fertility differences between religious groups based on 2001 Census.
Religion of incoming migrants is based on the religious composition of the origin country.
Data unavailable; no religious switching modeled.
Croatia Estimates based on 2011 Census.
Estimates based on 2011 Census.
Data on fertility differences between religious groups unavailable; same fertility rate used for Muslims and non-Muslims.
Religion of some incoming migrants is based on Pew Research Center's 2012 Global Religion and Migration Database.
Rates based on 2008 International Social Survey Programme survey.
Cyprus Estimates based on weighted average of 2008 European Values Study in Cyprus and 2008 European Values Study in Northern Cyprus.
Estimates based on 2008 European Values Study.
Data on fertility differences between religious groups unavailable; same fertility rate used for Muslims and non-Muslims.
Religion of incoming migrants is based on the religious composition of the origin country, adjusted for selected origin countries.
Data unavailable; no religious switching modeled.
Czech Republic
Estimates based on 2011 Census.
Estimates based on 2011 Census.
Data on fertility differences between religious groups based on 2001 Census.
Religion of incoming migrants is based on the religious composition of the origin country.
Rates based on 2008 International Social Survey Programme survey.
Denmark Estimates based on 2010 Central Population Register (CPR) data prepared by Statistics Denmark.
Estimates based on 2010 Central Population Register (CPR) data prepared by Statistics Denmark.
Data on fertility differences between religious groups based on 2010 Population Register.
Religion of incoming migrants is based on the religious composition of the origin country.
Rates based on 2008 International Social Survey Programme survey.
Estonia Estimates based on 2011 Census.
Estimates based on 2011 Census.
Data on fertility differences between religious groups unavailable; same fertility rate used for Muslims and non-Muslims.
Religion of some incoming migrants is based on Pew Research Center's 2012 Global Religion and Migration Database.
Data unavailable; no religious switching modeled.
56
www.pewresearch.org
Religious composition Age and sex Fertility Religion of migrants Switching to Islam
Finland Estimates based on 2010 Population Information System data prepared by Statistics Finland.
Estimates based on 2010 Population Information System data prepared by Statistics Finland.
Data on fertility differences between religious groups based on 2010 Population Information System.
Religion of incoming migrants is based on the religious composition of the origin country.
Rates based on 2008 International Social Survey Programme survey.
France Estimates based on 2008-2009 Trajectories and Origins Survey conducted by Institut National de la Statistique et des Études Économiques and the Institut National d’études Démographiques.
Estimates based on 2016 survey conducted by the French Institute of Public Opinion for the Institut Montaigne.
Data on fertility differences between religious groups based on 2005 Generations and Gender Survey.
Religion of incoming migrants is based on the religious composition of the origin country.
Rates based on 2008 International Social Survey Programme survey.
Germany Estimates based on 2015 report from the German Federal Office for Migration and Refugees.
Estimates based on 2005 Generations and Gender survey.
Data on fertility differences between religious groups based on 2005 and 2006 Generations and Gender Survey.
Religion of some incoming migrants is based on Pew Research Center's 2012 Global Religion and Migration Database.
Rates based on 2008 International Social Survey Programme survey.
Greece Estimates based on 2001 Census.
Estimates based on 2001 Census.
Data on fertility differences between religious groups based on 2001 Census.
Religion of some incoming migrants is based on Pew Research Center's 2012 Global Religion and Migration Database.
Data unavailable; no religious switching modeled.
Hungary Estimates based on 2011 Census.
Estimates based on 2011 Census.
Data on fertility differences between religious groups based on 2004-2005 Generations and Gender Survey.
Religion of incoming migrants is based on the religious composition of the origin country.
Rates based on 2008 International Social Survey Programme survey.
Ireland Estimates based on 2011 Census.
Estimates based on 2011 Census.
Data on fertility differences between religious groups based on 2006 Census.
Religion of incoming migrants is based on the religious composition of the origin country.
Rates based on 2008 International Social Survey Programme survey.
Italy Estimates based on World Religion Database.
Estimates based on migrant data.
Data on fertility differences between religious groups based on Italian National Institute of Statistics report, "La popolazione straniera residente in Italia as 1 gennaio 2007. Statistiche in Breve."
Religion of incoming migrants is based on the religious composition of the origin country.
Rates based on 2008 International Social Survey Programme survey.
57
www.pewresearch.org
Religious composition Age and sex Fertility Religion of migrants Switching to Islam
Latvia Estimates based on 2000 Census.
Estimates based on Latvia Central Statistical Bureau.
Data on fertility differences between religious groups unavailable; same fertility rate used for Muslims and non-Muslims.
Religion of incoming migrants is based on the religious composition of the origin country.
Rates based on 2008 International Social Survey Programme survey.
Lithuania Estimates based on 2011 Census.
Estimates based on 2011 Census
Data on fertility differences between religious groups unavailable; same fertility rate used for Muslims and non-Muslims.
Religion of incoming migrants is based on the religious composition of the origin country.
Data unavailable; no religious switching modeled.
Luxembourg Estimates based on 2008 European Values Study, adjusted for missing data.
Estimates based on 2008 European Values Study.
Data on fertility differences between religious groups unavailable; same fertility rate used for Muslims and non-Muslims.
Migration in and out of this country was not included in projections.
Data unavailable; no religious switching modeled.
Malta Estimates based on 2008 European Values Study.
Estimates based on 2008 European Values Study.
Data on fertility differences between religious groups unavailable; same fertility rate used for Muslims and non-Muslims.
Migration in and out of this country was not included in projections.
Data unavailable; no religious switching modeled.
Netherlands Estimates based on 2003 Generations and Gender Survey and migrant register.
Estimates based on 2003 Generations and Gender Survey and migrant register.
Data on fertility differences between religious groups based on 2003 Generations and Gender Survey.
Religion of incoming migrants is based on the religious composition of the origin country.
Rates based on 2008 International Social Survey Programme survey.
Norway Estimates based on 2007 register of migrants.
Estimates based on 2007 register of migrants.
Data on fertility differences between religious groups based on 2007-2008 Generations and Gender Survey.
Religion of incoming migrants is based on the religious composition of the origin country.
Rates based on 2008 International Social Survey Programme survey.
Poland Estimates based on 2011 Census.
Estimates based on 2011 Census.
Data on fertility differences between religious groups unavailable; same fertility rate used for Muslims and non-Muslims.
Religion of incoming migrants is based on the religious composition of the origin country.
Rates based on 2008 International Social Survey Programme survey.
58
www.pewresearch.org
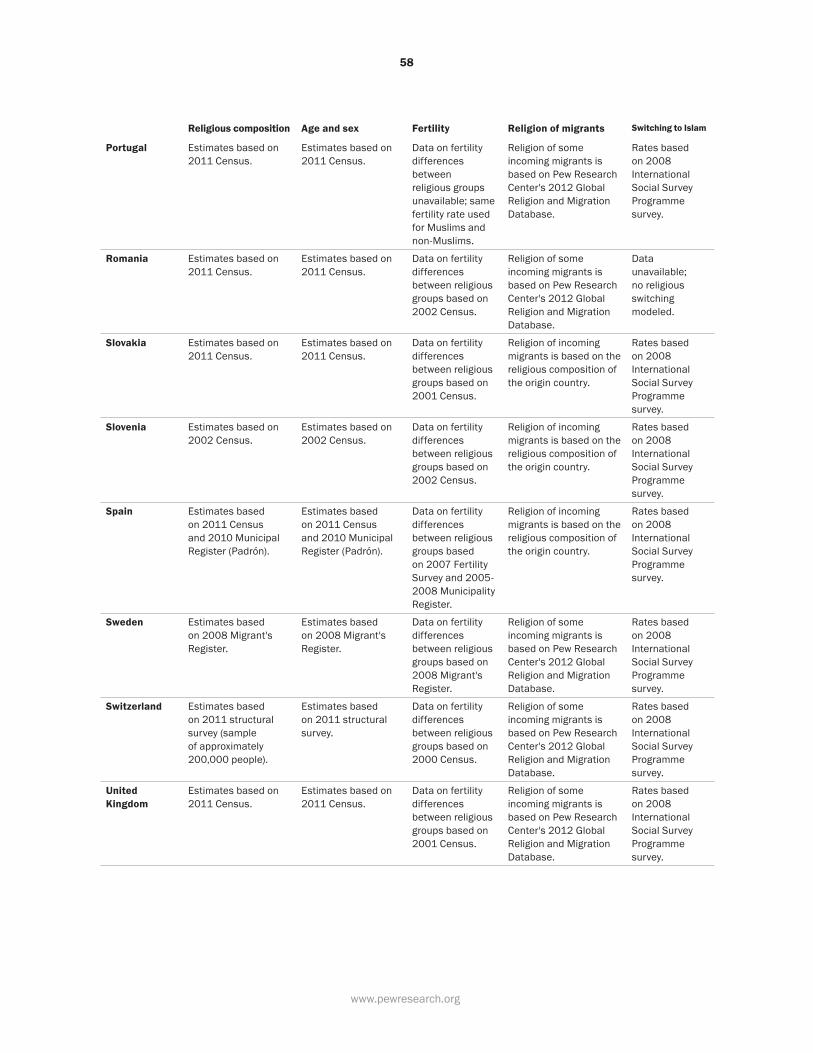
Religious composition Age and sex Fertility Religion of migrants Switching to Islam
Portugal Estimates based on 2011 Census.
Estimates based on 2011 Census.
Data on fertility differences between religious groups unavailable; same fertility rate used for Muslims and non-Muslims.
Religion of some incoming migrants is based on Pew Research Center's 2012 Global Religion and Migration Database.
Rates based on 2008 International Social Survey Programme survey.
Romania Estimates based on 2011 Census.
Estimates based on 2011 Census.
Data on fertility differences between religious groups based on 2002 Census.
Religion of some incoming migrants is based on Pew Research Center's 2012 Global Religion and Migration Database.
Data unavailable; no religious switching modeled.
Slovakia Estimates based on 2011 Census.
Estimates based on 2011 Census.
Data on fertility differences between religious groups based on 2001 Census.
Religion of incoming migrants is based on the religious composition of the origin country.
Rates based on 2008 International Social Survey Programme survey.
Slovenia Estimates based on 2002 Census.
Estimates based on 2002 Census.
Data on fertility differences between religious groups based on 2002 Census.
Religion of incoming migrants is based on the religious composition of the origin country.
Rates based on 2008 International Social Survey Programme survey.
Spain Estimates based on 2011 Census and 2010 Municipal Register (Padrón).
Estimates based on 2011 Census and 2010 Municipal Register (Padrón).
Data on fertility differences between religious groups based on 2007 Fertility Survey and 2005-2008 Municipality Register.
Religion of incoming migrants is based on the religious composition of the origin country.
Rates based on 2008 International Social Survey Programme survey.
Sweden Estimates based on 2008 Migrant's Register.
Estimates based on 2008 Migrant's Register.
Data on fertility differences between religious groups based on 2008 Migrant's Register.
Religion of some incoming migrants is based on Pew Research Center's 2012 Global Religion and Migration Database.
Rates based on 2008 International Social Survey Programme survey.
Switzerland Estimates based on 2011 structural survey (sample of approximately 200,000 people).
Estimates based on 2011 structural survey.
Data on fertility differences between religious groups based on 2000 Census.
Religion of some incoming migrants is based on Pew Research Center's 2012 Global Religion and Migration Database.
Rates based on 2008 International Social Survey Programme survey.
United Kingdom
Estimates based on 2011 Census.
Estimates based on 2011 Census.
Data on fertility differences between religious groups based on 2001 Census.
Religion of some incoming migrants is based on Pew Research Center's 2012 Global Religion and Migration Database.
Rates based on 2008 International Social Survey Programme survey.