22
EV Load Shape Presentation Alexander Lonsdale September 14, 2021

EV Load Shape Presentation
Alexander LonsdaleSeptember 14, 2021

Order of Presentation
• Overview of ADM’s EV Infrastructure Load Model• How the model functions• Key model drivers
• Model Updates• Comparison of LDV Load Shapes
2

EV Infrastructure Load Model Overview
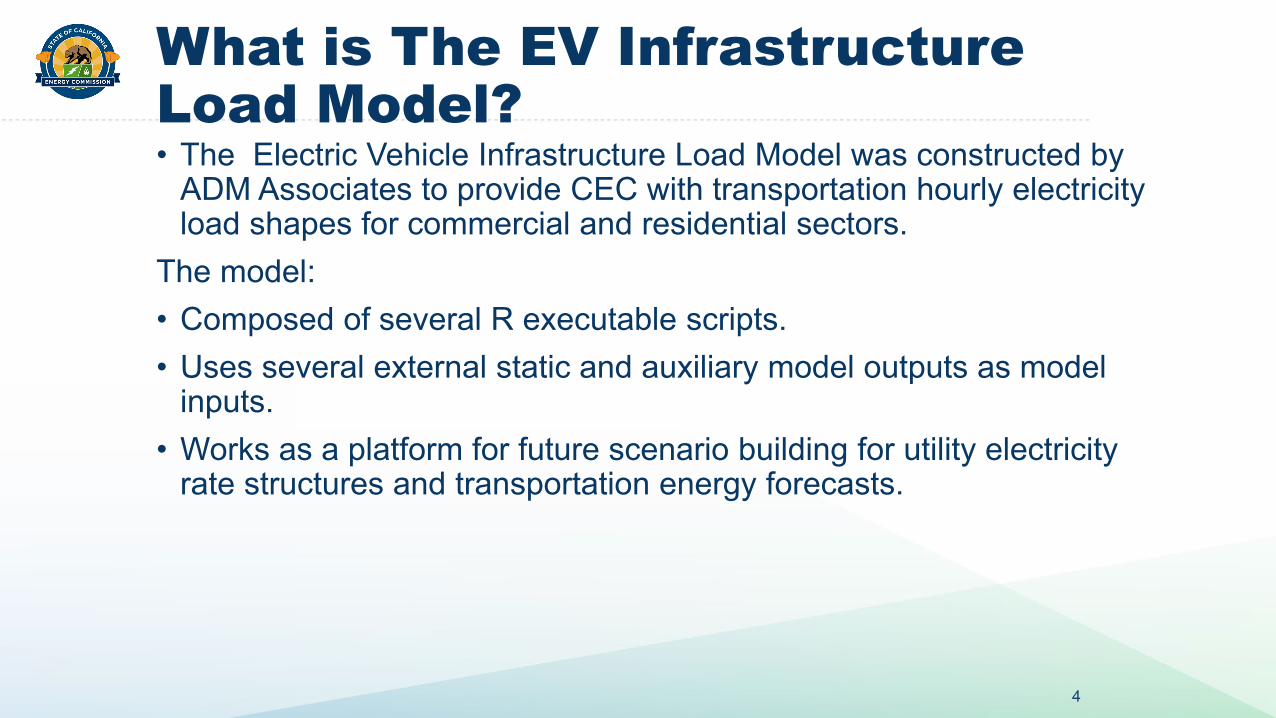
What is The EV Infrastructure Load Model?• The Electric Vehicle Infrastructure Load Model was constructed by
ADM Associates to provide CEC with transportation hourly electricity load shapes for commercial and residential sectors.
The model:• Composed of several R executable scripts.• Uses several external static and auxiliary model outputs as model
inputs.• Works as a platform for future scenario building for utility electricity
rate structures and transportation energy forecasts.
4

Model Schematic
5
Transportation ElectricityForecast
Economic Inputs
Base Loads
BaseLoadShapes.csv
PersonalVehicleChargingLocationShares.csv
Bus_Energy.csv
LDV_Energy.csv
NEV_Energy.csv
GVWR3456_Energy.csv
GVWR78_Energy.csv
Seasons.csv
Elasticity.csv
PercentTOUbyYear.csv
Prices.csv
Rates.csv
EVIL MODEL
ALL_EV.csv“Figure 205: Schematic of EVIL Model”Adapted From: ADM Associates, INC.

Key Model Drivers
6
Transportation Energy
Forecast
EconomicInputs
Generic Base Load
Shapes

Driver 1: Transportation Electricity Demand Forecast
• On-road Statewide annual electricity demand by vehicle category is disaggregated to climate zones.
• Each climate zone maps to a utility planning area.
• Vehicle categories are described in more detail in following slides.
• Includes light-, medium-, and heavy-duty vehicles.
7Source: CEC Staff

Driver 2 : Economic Inputs• Economic Inputs adjust the charging profiles for each forecast zone. • Adjustment factors are determined as follows:
8
𝐴𝐴ℎ = max 0,1 + 𝑇𝑇𝑇𝑇𝑇𝑇𝑇 × 𝑒𝑒 × 𝑃𝑃𝑃𝑃ℎ − 1
Where:
• 𝐴𝐴ℎis the adjustment factor for hour h• TOU% is the percentage of customers that have a TOU rate• 𝑃𝑃𝑃𝑃ℎ is the price ratio for hour h, defined as the price prevailing at
hour h divided by the lowest available price for the given day, at the same location
• 𝑒𝑒 is the Elasticity Factor
Source: ADM Associates, INC.
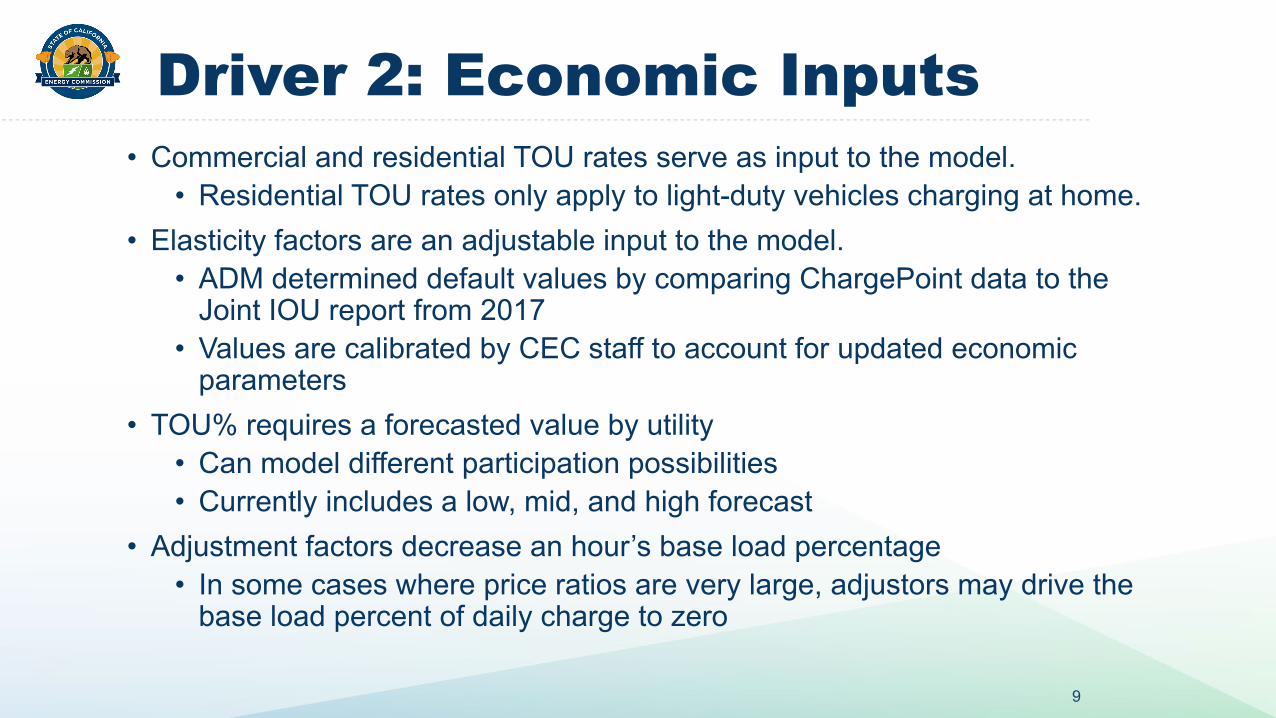
Driver 2: Economic Inputs• Commercial and residential TOU rates serve as input to the model.
• Residential TOU rates only apply to light-duty vehicles charging at home. • Elasticity factors are an adjustable input to the model.
• ADM determined default values by comparing ChargePoint data to the Joint IOU report from 2017
• Values are calibrated by CEC staff to account for updated economic parameters
• TOU% requires a forecasted value by utility• Can model different participation possibilities• Currently includes a low, mid, and high forecast
• Adjustment factors decrease an hour’s base load percentage• In some cases where price ratios are very large, adjustors may drive the
base load percent of daily charge to zero
9

Driver 3: Base Load Shapes• Base load shapes are generic charging profiles that distribute % of load across an 8760-hour year.
• Model assumes 261 weekdays and 104 weekend days in a year.• The % of load assigned to each hour of the year is modified by the adjustment factor described in previous
slides. Example:
Ah = 1 + %TOU* e* (PRh-1)
Where: %TOU participation = 0.60 , Price elasticity = -0.3 , and PRh = 2.Ah = 0.82Lah = Luh * Ah
Where: Lah = Adjusted load for hour h , Luh = Unadjusted load for hour h.
Assuming Luh= 0.10 (10% of the total daily charging load occurs during hour h.) Lah = 0.082 In other words , electricity load for hour h is 82% of what it would have been in absence of an adjustment factor.
10
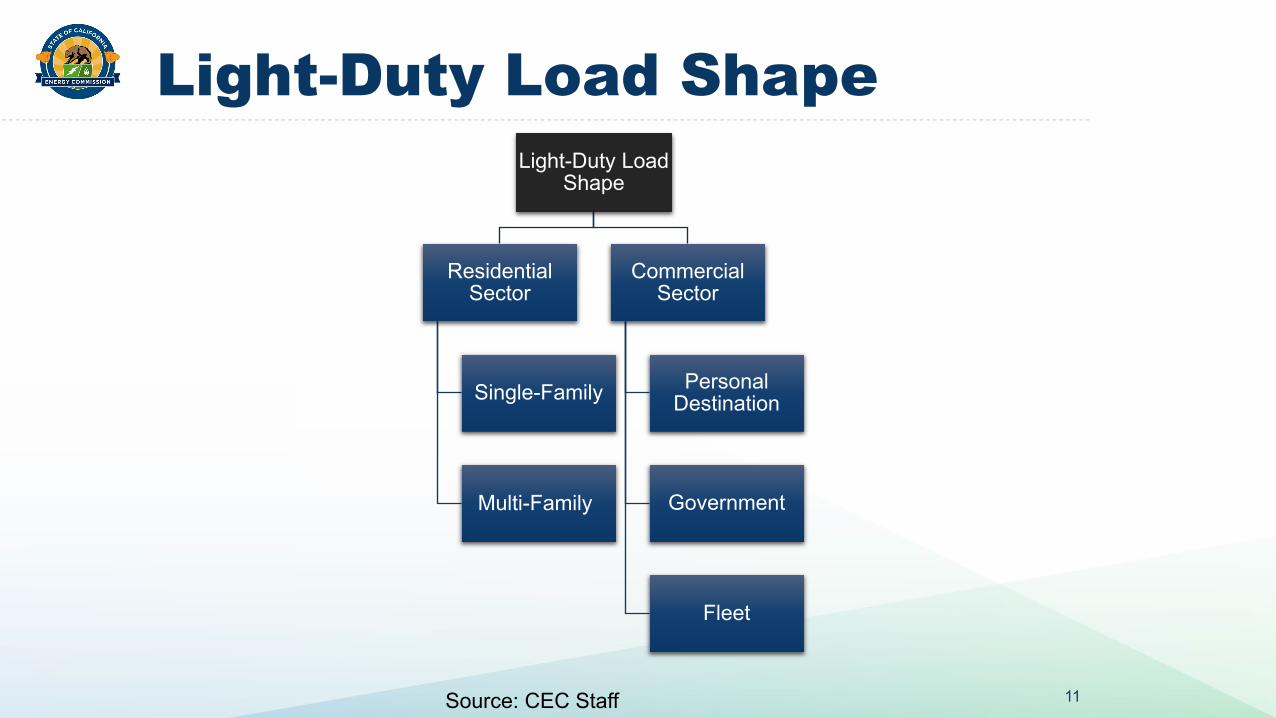
Light-Duty Load ShapeLight-Duty Load
Shape
Residential Sector
Single-Family
Multi-Family
Commercial Sector
Personal Destination
Government
Fleet
11Source: CEC Staff

Medium- and Heavy-Duty Load Shape
12
MD-HD Load Shape
Bus
School Bus
Transit Bus
Urban Bus
Other Bus
Truck
GVWR3 GVWR456 GVWR7 GVWR8
Combination
Single-Unit
Refuse and Recycle
Port
Source: CEC Staff

Model Updates
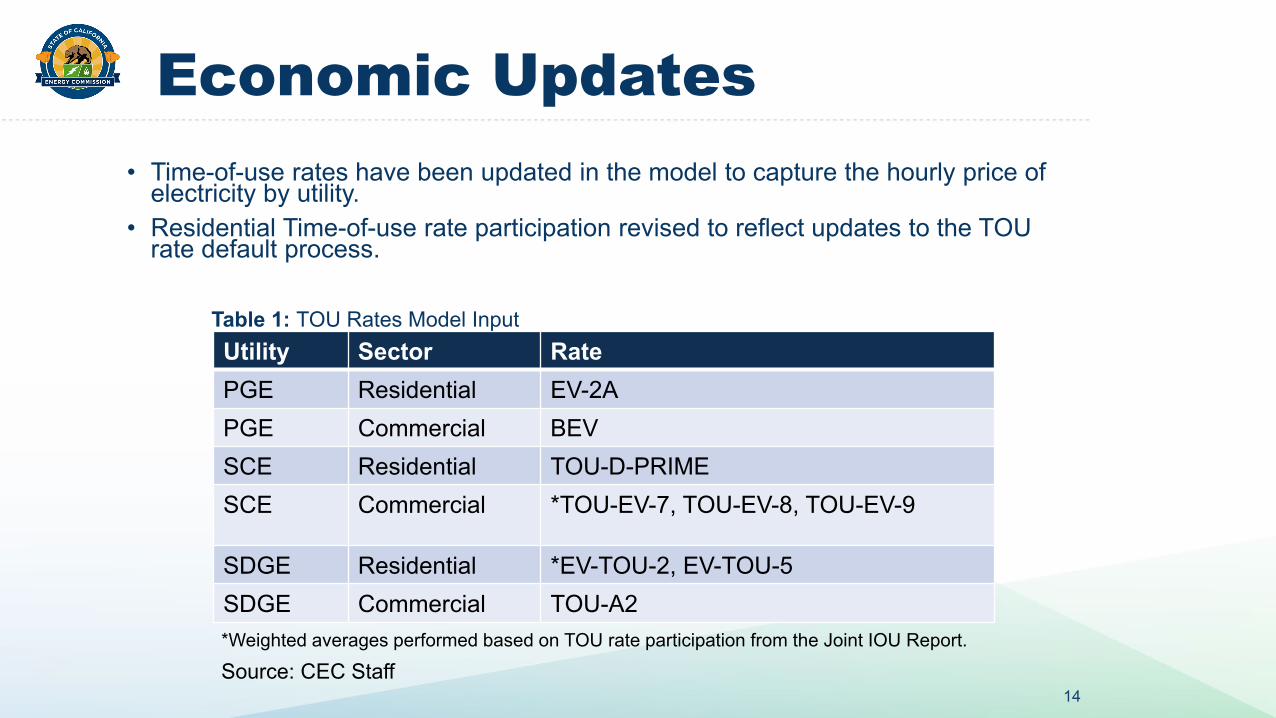
Economic Updates• Time-of-use rates have been updated in the model to capture the hourly price of
electricity by utility.• Residential Time-of-use rate participation revised to reflect updates to the TOU
rate default process.
14
Utility Sector RatePGE Residential EV-2APGE Commercial BEVSCE Residential TOU-D-PRIMESCE Commercial *TOU-EV-7, TOU-EV-8, TOU-EV-9
SDGE Residential *EV-TOU-2, EV-TOU-5SDGE Commercial TOU-A2*Weighted averages performed based on TOU rate participation from the Joint IOU Report.
Table 1: TOU Rates Model Input
Source: CEC Staff

Load Shape Updates• Previously, our model considered 3 medium- and heavy-duty load shapes (1
bus, 2 truck). Our model now considers 11 unique MD-HD load shapes.• New MD-HD load shapes developed through collaborative efforts with our
Fuels and Transportation Division and LBNL.• Personal vehicle charging location: single-family, multi-family, and destination
centers.• Updated with residential access assumptions from the AB2127 report’s
EAD Aggressive scenario. • Personal destination load shape developed from the AB2127 report’s EAD
Aggressive scenario.
15
Sector 2020 2025 2030 2035Single-Family 71% 64% 58% 50%Multi-Family 8% 9% 10% 11%Destination *commercial
21% 27% 32% 39%
Table 2: Personal Vehicle Charging Location Shares
Source: CEC Staff

LDV Load Shape Comparisons

CAISO LDV Charging Load Shape• The following mid-case load shapes for an average summer
weekday in 2030.
17Source: CEC Staff

PGE LDV Charging Load Shape• The following mid-case load shapes for an average summer
weekday in 2030.
18Source: CEC Staff

SCE LDV Charging Load Shape• The following mid-case load shapes for an average summer
weekday in 2030.
19Source: CEC Staff
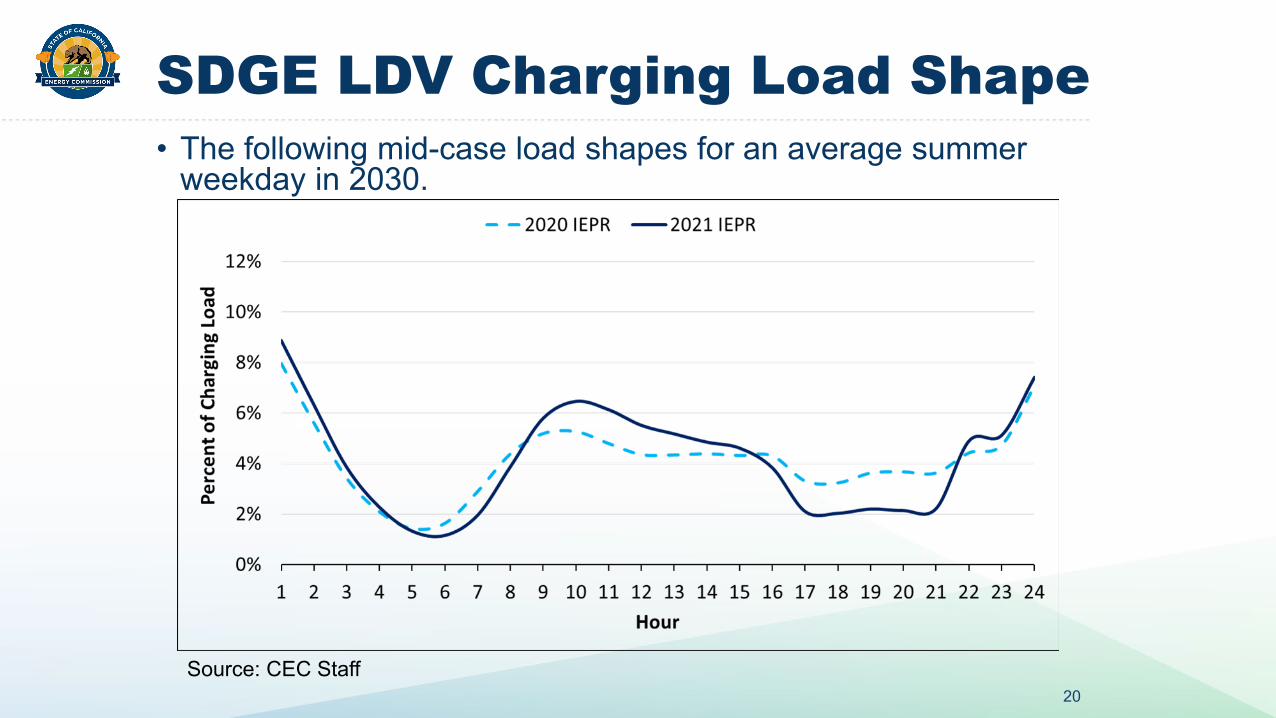
SDGE LDV Charging Load Shape• The following mid-case load shapes for an average summer
weekday in 2030.
20Source: CEC Staff

Closing Remarks
• Link to ADM’s complete documentation for the EVIL model, located in Chapter 10:
• Link: https://ww2.energy.ca.gov/2019publications/CEC-500-2019-046/CEC-500-2019-046.pdf
• Contact Information:• Email: [email protected]• Phone: 916-891-8570
21

Thank You!


