REPORT RPT0001-01406 EV Technology and Market Overview Advanced Transportation Created by: Lewis Weston Date: 03-AUG-2016 Powertech Labs Inc. 12388 88 th Avenue Surrey, BC, V3W 7R7 www.powertechlabs.com Approved by: Jeff Turner Date: 19-OCT-2016 Ref# Proposal 16-4652 Date: 18-DEC-2015 RPT0001-01406-R02 (EV Technology and Market Overview).docx Form: R01 Background Report EV Technology and Market Overview October 19 2016 Status: Final Revision: 01 Josh Power, Township of Langley Greg Brooks, City of Abbotsford Eve Hou, Metro Vancouver
Transcript
REPORT RPT0001-01406
EV Technology and Market Overview Advanced Transportation
Created by: Lewis Weston Date: 03-AUG-2016 Powertech Labs Inc. 12388 88th Avenue
Surrey, BC, V3W 7R7
www.powertechlabs.com
Approved by: Jeff Turner Date: 19-OCT-2016
Ref# Proposal 16-4652 Date: 18-DEC-2015
RPT0001-01406-R02 (EV Technology and Market Overview).docx
Form: R01
Background Report
EV Technology and Market Overview
October 19 2016
Status: Final
Revision: 01 Josh Power, Township of Langley Greg Brooks, City of Abbotsford Eve Hou, Metro Vancouver
RPT0001-01406-D01 EV Technology and Market Overview
Powertech Labs Inc. Page ii
RPT0001-01406-D01 EV Technology and Market Overview
Powertech Labs Inc. Page iii
AUTHORIZATION
Name Title Signature Role Date
Lewis Weston Project Engineer, EIT, Advanced Transportation
Author Oct 19
th, 2016
Jeff Turner Project Manager, EIT Advanced Transportation
Reviewer Oct 19th
, 2016
DISCLAIMER This report was commissioned by the Township of Langley, Metro Vancouver and City of Abbotsford. Interpretation of the results of this study, as expressed in the report, is entirely the responsibility of the consultant authors and does not imply endorsement of specific points of view by the Township of Langley, Metro Vancouver or City of Abbotsford. The findings and conclusions expressed in the report are the opinion of the authors of the study and may not necessarily be supported by the Township of Langley, Metro Vancouver or City of Abbotsford. Any use by a third party of the information presented in this report, or any reliance on or decisions made based on such information, is solely the responsibility of such third party.
RPT0001-01406-D01 EV Technology and Market Overview
Powertech Labs Inc. Page iv
EXECUTIVE SUMMARY
Electric Vehicles have become an increasingly important technology with excellent potential for reducing the cost and environmental impact of transportation. Municipalities in the lower mainland have significant influence over the growth of EV technology through implementing incentives, installing infrastructure and leading by example with their own vehicle fleets. With the potential for a large shift to electric vehicles over the coming years, municipalities must plan carefully to ensure that this new technology is supported in a way that maximizes benefits for citizens and the environment while accounting for future growth and fiscal responsibility. This report is intended to provide context for broader EV charging infrastructure planning activities in BC. It provides an overview of the EV market, as well as technical information relating to EVs and the charging infrastructure required to support them. Since late 2010, sales of EVs in North America have totaled over 500,000, with over 20,000 of those having been sold in Canada, and over 4000 in BC. Yearly sales rates have accelerated as a greater number of EV models have become available from various automakers. An analysis of two recent studies suggests that EVs will make up between 3-6% of the vehicle fleet in BC by 2024, and between 13-20% by 2030. Section 3 provides definitions of various types of EVs, a summary of currently available electric vehicles including basic technical specifications, as well as a summary of EVs that will enter the market in the coming years. Three trends are observed among upcoming products: the advent of affordable Battery Electric Vehicles (BEVs) with significantly improved driving range of 300km or more; the arrival of electric SUVs in the North American market; and a surge of plug-in hybrid electric vehicle (PHEV) versions of a broad number of makes and models. Section 4 introduces the various means of recharging EVs, including readily available and relatively inexpensive AC charging equipment, less common and more expensive DC fast charging equipment, as well as future technologies such as higher power DC fast chargers, wireless charging and battery swapping. Various technical details and standards pertaining to these charging methods are discussed. Section 5 provides an overview of emerging “Smart Grid” technologies that have the potential to better integrate EVs into the grid and minimize their impact on electrical infrastructure. “Smart Charging” is a general concept that involves reducing charging rates at certain times to avoid peak loads, and is increasingly supported by a number of available technologies. Vehicle-to-Grid (V2G) is a concept that involves EVs acting as a source of energy, potentially to provide backup power or to support grid operations. V2G has been demonstrated in a number of pilot projects, but broader commercialization of this technology is still in question. Stationary Energy Storage systems can support grid operations by minimizing the impact of significant loads, while also providing the option of zero-emissions backup power for a limited time. Stationary Energy Storage systems are transitioning from a technology demonstration stage to broader commercialization. Finally, Section 6 provides a brief summary of policies and programs supporting EV adoption in BC. These include purchase incentive, infrastructure deployment programs, and building codes.
RPT0001-01406-D01 EV Technology and Market Overview
6.3 Building Codes ...........................................................................................................61
6.3.1 Vancouver Building Bylaw ................................................................................................ 61
6.3.2 Update to the BC Building Act .......................................................................................... 61
REVISION HISTORY .................................................................................................... 62
RPT0001-01406-D01 EV Technology and Market Overview
Powertech Labs Inc. Page vii
LIST OF FIGURES Figure 1 US Cumulative PEV Sales by make up to April 2016. Source: EPRI ........................................... 10 Figure 2: US Cumulative Sales as of May 2016. “Other” includes vehicles such as the Smart ED and the Toyota RAV4-EV. Source: EPRI ................................................................................................................. 11 Figure 3: US EV Sales - May 2016. “Other” includes vehicles such as the Fiat 500e, the VW e-Golf, etc. Source: EPRI .............................................................................................................................................. 12 Figure 4: Growth in EV sales in Canada, comparing H1 sales from 2014 to 2016. Source: FleetCarma 13 Figure 5: Cumulative Canadian EV sales by model as of July 2016. Source: Matthew Klippenstein, GreenCarReports. ....................................................................................................................................... 14 Figure 6: Cumulative BC EV sales by model as of June 2016. Source: FleetCarma. .............................. 15 Figure 7: Monthly Canadian EV sales for July 2016. Source: Matthew Klippenstein, GreenCarReports 16 Figure 8: SFU Energy and Materials Research Group’s projection for EV adoption in BC ........................ 18 Figure 9: Usage of DCFC stations during May 2015, “conflicts” representing signs of queuing ................ 23 Figure 10: Usage data for DCFC sites in BC - congestion is increasing rapidly ........................................ 24 Figure 11: Visual evidence of congestion at the Bakerview Ecodairy DCFC in Abbotsford ....................... 24 Figure 12 - Categorization of electrified vehicles; “plug-in” electric vehicles are highlighted in red. .......... 26 Figure 13: 2017 Chevrolet Bolt ................................................................................................................... 28 Figure 14: BMW X5 xDrive40e.................................................................................................................... 29 Figure 15: Chrysler Pacifica Hybrid ............................................................................................................ 29 Figure 16: Lightning LS-218 electric motorcycle ......................................................................................... 33 Figure 17: Polaris GEM eL XD .................................................................................................................... 34 Figure 18: John Deere Gator TE ................................................................................................................. 34 Figure 19: CanEV Might-E Truck ................................................................................................................ 34 Figure 20: Model S battery capacity vs odometer readings – pluginamerica.org ....................................... 35 Figure 21: Diagram showing the difference between AC and DC charging - Source: www.abb.com ........ 36 Figure 22: 120V Outlet + user supplied EVSE ............................................................................................ 38 Figure 23: Telefonix L1 PowerPost ($1500) and ClipperCreek ACS-20 ($400) ......................................... 38 Figure 24: Some common Level 2 charging stations .................................................................................. 39 Figure 25: European "Mennekes" Type 2 connector .................................................................................. 39 Figure 26: A charge event from a 50kW DCFC station .............................................................................. 40 Figure 27: Comparison of 25kW and 50kW DCFC charge curves - www.americas.fujielectric.com ......... 41 Figure 28: Nissan Leaf charging ports, left to right: CHAdeMO DCFC, J1772 AC .................................... 42 Figure 29: SAE CCS charge couplers, European version on left, North American version (J1772) on right. The associated AC-only charge couplers are shown above each CCS variant for reference. ................... 42 Figure 30: Multi-standard DCFC stations: AddÉnergie, ChargePoint, and ABB (European version shown) .................................................................................................................................................................... 44 Figure 31: Charging at home represents 80% of all charging [The EV Project (Idaho National Laboratory, 2015)] .......................................................................................................................................................... 49 Figure 32: Diagram highlighting potential impact of EVs on various parts of the grid. ............................... 51 Figure 33: AddÉnergie CoRe+ Level 2 EVSE ............................................................................................ 53 Figure 34: AddÉnergie's PowerSharing system with building EMS integration .......................................... 53 Figure 35: AddÉnergie's PowerSharing system enables expansion of EVSE installations using a daisy chain configuration ...................................................................................................................................... 54 Figure 36: ChargePoint's CT4000 Level 2 EVSE with circuit-sharing capability ........................................ 54 Figure 37: Nissan's Leaf-to-home system .................................................................................................. 55 Figure 38: Export power panel on a VIA Motors V-Trux with 2x120V and 1x240V outlets ........................ 56 Figure 39: Tesla Powerwall Residential Battery ......................................................................................... 56 Figure 40: A 500kWh lithium-ion battery system designed and built by Powertech Labs for BCIT's Energy OASIS Project, supporting a 250kW solar canopy over the parking lot, and supplying 2 DCFC and 2 Level 2 EV charging stations. ............................................................................................................................... 57 Figure 41: BC DCFC Phase 1 stations - www.chargehub.com .................................................................. 59
RPT0001-01406-D01 EV Technology and Market Overview
Powertech Labs Inc. Page viii
LIST OF TABLES Table 1: BC and Lower Mainland EV sales estimates based on Navigant Research forecast for Canadian EV sales through to 2024. ........................................................................................................................... 17 Table 2: BC and Lower Mainland EV sales estimates based on SFU forecast for EV market share in BC. .................................................................................................................................................................... 18 Table 3: Usage statistics for charging stations in Metro Vancouver ........................................................... 20 Table 4: Top-ten busiest Level 2 charging stations in BC (with publicly available data), data from Dec. 2015 to May 2016 ....................................................................................................................................... 20 Table 5: Usage of DCFC stations in BC – December 2015 to May 2016 (lifetime stats in parentheses) .. 21 Table 6: Summary of significant EV models currently available in North America ..................................... 27 Table 7: Summary of upcoming EV models with expected specifications .................................................. 30 Table 8: DCFC charging rates .................................................................................................................... 41 Table 9: Summary of DCFC standards ....................................................................................................... 43 Table 10: Approximate charge station equipment costs ............................................................................. 47 Table 11: Approximate charge station installation costs ............................................................................. 47 Table 12: Charge station network service fees (as of 2015) ...................................................................... 47 Table 13: Charge station operating costs (per port) ................................................................................... 48 Table 14: Impact on charging time for power sharing scenarios ............................................................... 53
LIST OF ACRONYMS
AC Alternating Current
BEV Battery Electric Vehicle
CCS Combined Charging System, the SAE standard for DC charging
DC Direct Current
DCFC Direct Current Fast Charge or Direct Current Fast Charger
DER Distributed Energy Resource
DR Demand Response
EREV Extended Range Electric Vehicle
ESS Energy Storage System
EV Electric Vehicle (includes BEVs and PHEVs)
EVSE Electric Vehicle Supply Equipment
FCEV Fuel Cell Electric Vehicle
HEV Hybrid Electric Vehicle
J1772 The SAE standard charging connector for AC charging
kW Kilowatt
kWh Kilowatt-hour
L1 Level 1 (AC charging)
L2 Level 2 (AC charging)
PEV Plug-in Electric Vehicle (includes BEVs and PHEVs)
PHEV Plug-in Hybrid Electric Vehicle
V2G Vehicle-to-Grid
RPT0001-01406-D01 EV Technology and Market Overview
Powertech Labs Inc. Page 9
1 INTRODUCTION
Electric Vehicles (EVs) represent an excellent opportunity to reduce both the cost and the environmental impact of transportation. Using highly efficient electric motors and onboard batteries for electrical energy storage, EVs avoid the use of non-renewable fossil fuels and their associated air emissions. While it is important to take into account the environmental impact associated with electricity generation, studies have shown that EVs can make sense even in regions with largely coal-based electrical grids, and their “well-to-wheels” emissions are already improving considerably over time as grids around the world shift to cleaner forms of electricity generation
1.
While EVs were relatively common in the early 1900’s, the advent of highways and intercity travel highlighted the driving range limitations of EVs, and the remainder of the 20
th century was dominated by the internal combustion
engine. Although the late 1990’s did see a small surge of EV sales thanks to a government mandate in California, it wasn’t until December of 2010 that the current generation of EVs began to take off, with the almost simultaneous launch of the Nissan Leaf and the Chevrolet Volt. Since then, over 1 million EVs have hit the road in the world, including over 500,000 in North America. While EVs still only represent about 1% of new vehicle sales in major markets, a diversifying array of EV models with increasing performance and decreasing price has led to steady sales growth across the globe, especially in the US, Europe and China. Some markets with particularly effective government policies have seen much higher penetration of EVs, such as Norway where EVs represent 20-30% of new vehicle sales throughout 2016.
2 Meanwhile, a number of European governments are considering banning the
sale of gas-powered cars entirely within the next 10-15 years.3
In Canada, government support for EVs has so far come largely in the form of Provincial purchase incentives (in Quebec, Ontario and BC) and through charging infrastructure deployment. Municipal and Regional governments can play an important role in supporting EVs, especially by supporting the deployment of charging infrastructure in both public and private locations. Local governments can also help lead by example by adopting EVs into their own operations. In order to help inform decision makers at local governments, this report is intended to provide a technical and market overview of electric vehicles and EV charging infrastructure, establishing context for future programs and policy development. In many places, the reader may notice that information relating to pricing and sales may be discussed in terms of US numbers. While an effort will be made to present information in a Canadian context wherever possible, the automotive industry in Canada is largely influenced by what happens south of the border, and the level of detail of information pertaining to the US market is much greater.
RPT0001-01406-D01 EV Technology and Market Overview
Powertech Labs Inc. Page 10
2 THE MARKET
2.1 North American EV Sales to Date
2.1.1 United States
Since the launch of the current generation of EVs in late 2010, the list of available models has increased steadily every year, and there are now almost 30 plug-in vehicles available for sale in North America across at least 15 makes. The US plug-in vehicle market is one of the largest in the world, with annual sales rate having surpassed 100,000 vehicles per year in 2014. The total number of EVs on the road in the US today is over 450,000, as of May 2016.
4
Sales in the US were initially dominated by a few key models selling on the order of 1000-2000 vehicles per month, followed by a number of so-called “compliance cars” selling fewer than 200 vehicles per month, generally acknowledged to be sold by manufacturers seeking only to comply with California’s zero-emissions vehicle regulations. This tendency has reduced in recent years, with a great number of automakers producing EVs in significant numbers:
Figure 1 US Cumulative PEV Sales by make up to April 2016. Source: EPRI
RPT0001-01406-D01 EV Technology and Market Overview
Powertech Labs Inc. Page 11
Cumulatively speaking, the overall number of EVs currently on the road in the US still shows signs of the strong lead in sales established by the Chevrolet Volt and Nissan Leaf (together representing about 40% of EVs currently on the road in North America), followed by the Tesla Model S, the Toyota Prius PHEV, and Ford’s two Energi PHEV models (all 6 models collectively representing over 80% of the current EV fleet):
Figure 2: US Cumulative Sales as of May 2016. “Other” includes vehicles such as the Smart ED and the
Toyota RAV4-EV. Source: EPRI
RPT0001-01406-D01 EV Technology and Market Overview
Powertech Labs Inc. Page 12
Looking specifically at recent sales shows a trend towards greater diversification and a greater number of models taking a significant share of the market, although the overall ranking of models is still fairly similar:
Figure 3: US EV Sales - May 2016. “Other” includes vehicles such as the Fiat 500e, the VW e-Golf, etc.
Source: EPRI
2.1.2 Canada and BC
The Canadian EV market is behind the US market in terms of overall sales and diversity of models, although recent trends suggest that it is starting to catch up. With just over 20,000 EVs on Canadian roads today and around 500,000 in the US, cumulative Canadian EV adoption is about 30 % that of the US on a per capita basis. Canadian EV purchases accounted for 0.27% of all new vehicle purchases in 2014, which put Canada in 17
th place for EV
adoption in 2014 in terms of new vehicle market share, after such countries as the UK (0.58%), France (0.91%), Japan (0.98%), the Netherlands (3.94%) and Norway (13.93%), where very favourable tax incentives for EV purchases have propelled certain EV models into the top selling spots overall for all vehicles in Norway.
5 That said,
recent sales data from 2016 shows a significant increase in Canadian EV sales, with sales in the first half of 2016 showing a 77% increase compared to 2014
6 and hitting a market share of 0.61% in July of 2016
7, not far off from
the US EV market share of 0.88% for the same month8:
5 Axsen, J., S. Goldberg, J. Bailey, G. Kamiya, B. Langman, J. Cairns, M. Wolinetz, and A. Miele (2015). Electrifying
Vehicles: Insights from the Canadian Plug-in Electric Vehicle Study [Early Release]. Simon Fraser University, Vancouver, Canada.
RPT0001-01406-D01 EV Technology and Market Overview
Powertech Labs Inc. Page 13
Figure 4: Growth in EV sales in Canada, comparing H1 sales from 2014 to 2016. Source: FleetCarma
One reason cited for this relatively slower adoption in Canada as compared to the US is a lack of federal support programs for EVs in Canada. While BC, Ontario and Quebec have all offered provincial rebate programs (up to $5000, $14000 and $8000, respectively), there is no federal incentive program in Canada that would reinforce the provincial program and support sales in provinces that do not have their own programs. Another potential reason for reduced market share in Canada is a lack of availability of EVs, both in terms of number of distinct models available for sale, as well as a lack of inventory of established models at dealerships.
9 A number of US states try to
avoid this type of constrained supply by requiring automakers to sell a minimum number of EVs through a “Zero Emissions Vehicle Mandate”. No similar regulations are currently in place in Canada, although it is being considered in Quebec.
RPT0001-01406-D01 EV Technology and Market Overview
Powertech Labs Inc. Page 14
Compared to the US, Canadian sales numbers show a slightly less diversified market with fewer available EV models, although there are still at least 20 EV models available in Canada. Generally speaking, Canadians show a strong preference for the Chevrolet Volt above all other plug-in vehicles, possibly reflecting benefits of a plug-in hybrid powertrain for colder climates (cold temperatures can exacerbate the range limitations of a pure battery-electric vehicle):
Figure 5: Cumulative Canadian EV sales by model as of July 2016. Source: Matthew Klippenstein,
GreenCarReports.
Chevy Volt, 7,092
Tesla Model S, 4,488 Nissan Leaf, 3,967
Smart Electric Drive, 1,138
BMW i3, 759
Kia Soul EV, 740
Ford C-Max Energi, 703
Mitsubishi i-MiEV, 679
Ford Fusion Energi, 506
Porsche Cayenne S-E Hybrid, 349
BMW i8, 346
Ford Focus Electric, 315
Volvo XC90 PHEV, 312
Tesla Model X, 282 Audi A3 e-tron, 250
BMW X5 xDrive40, 150 Chevy Spark, 92
Cadillac ELR, 83
Porsche Panamera S-E Hybrid, 80
Mercedes S550e, 7
RPT0001-01406-D01 EV Technology and Market Overview
Powertech Labs Inc. Page 15
The BC market reverses this tendency somewhat, with a slight preference for pure electric vehicles such as the Nissan Leaf and Tesla Model S as compared to the Chevrolet Volt. These two models represented about 50% of the total EV fleet in BC, which was just over 4000 vehicles as of July 2016:
Figure 6: Cumulative BC EV sales by model as of June 2016. Source: FleetCarma.
Chevy Volt, 543
Tesla Model S, 1036
Nissan Leaf, 1084
Smart Electric Drive, 219
BMW i3, 313
Kia Soul EV, 185
Ford C-Max Energi, 66
Mitsubishi i-MiEV, 121
Ford Fusion Energi, 54
Porsche Cayenne S-E Hybrid, 50
BMW i8, 114
Ford Focus Electric, 61
Volvo XC90 PHEV, 45
Tesla Model X, 61 Audi A3 e-tron, 45
BMW X5 xDrive40, 43 Chevy Spark, 2
Cadillac ELR, 12 Porsche Panamera S-E Hybrid, 10
Mercedes S550e, 2
RPT0001-01406-D01 EV Technology and Market Overview
Powertech Labs Inc. Page 16
Looking at a more recent monthly snapshot of EV sales in Canada shows that some of the more recently introduced models are selling in significant numbers. While these models haven’t yet made a significant impact to the cumulative sales shown in the figures above, sales for the month of July 2016 show that models such as the all-electric Tesla Model X SUV, and the Audi A3, Volvo XC90 and BMW X5 plug-in hybrids are outpacing some of their predecessors, and contributing to a greater diversity in the Canadian EV market:
Figure 7: Monthly Canadian EV sales for July 2016. Source: Matthew Klippenstein, GreenCarReports
In 2014, ICBC reported a total of 1700 EVs in BC as of 2014, with 1200 of those being registered in the Lower Mainland.
11 The Lower Mainland has about 70% of BC’s registered EVs, while only representing about 60% of BC’s
population, showing a slightly higher proportion of EV sales per capita, likely thanks to the suitability of EVs for urban and suburban lifestyles.
RPT0001-01406-D01 EV Technology and Market Overview
Powertech Labs Inc. Page 17
2.2 Projected Future Uptake of EVs in BC
Predicting the future growth of EV market share is difficult and a large number of important factors must be taken into account. Factors that may affect sales of EVs include:
1. EV model availability 2. Dealership inventory availability 3. Cost of vehicles, which in turn is largely affected by battery costs 4. Fuel and electricity prices 5. Government rebates and non-financial incentives 6. Availability of charging infrastructure 7. Consumer awareness
Two organizations have recently attempted to take these factors into account in order to assess future market share of EVs, specifically in the Canadian and BC contexts: Navigant Research and Simon Fraser University. Navigant Research Navigant Research regularly publishes reports establishing long-term forecasts for EV adoption in various regions, and in Q2 2015 published forecasts specifically for the Canadian market
12. Navigant expects Canada to begin to
catch up with the US EV market, with a compound annual growth rate of between 22.8% in the conservative scenario and 25.7% in the aggressive scenario over the next ten years, leading to annual EV sales of between 74,000 and 91,000 vehicles by 2024, or between 3.7% and 4.6% market share of new vehicle purchases. Cumulatively speaking, this would put the overall EV fleet in Canada somewhere between 350,000 and 420,000 EVs total. Assuming BC and the Lower Mainland still account for similar proportions of the Canadian EV market, this would translate to between 39,000 and 47,000 EVs in the Lower Mainland, about a 35-fold increase over today’s numbers, although still only representing less than 4% of passenger vehicles in the region. The following table extrapolates the conservative and aggressive scenarios presented by Navigant to understand how these projections would impact the fleet composition in the Lower Mainland in 2024: Table 1: BC and Lower Mainland EV sales estimates based on Navigant Research forecast for Canadian EV sales through to 2024.
Year 2024 Canada BC Lower Mainland
Low High Low High Low High
Annual EV sales 74,000 91,000 12,000 14,500 8,300 10,000
Market Share 3.7% 4.6% 5.4% 6.6% 6.3% 7.8%
Cumulative EV sales 350,000 420,000 56,000 67,000 39,000 47,000
Percent of Fleet 1.8% 2.1% 2.5% 3.1% 3.0% 3.6%
Numbers in bold are directly pulled from Navigant Research’s forecast, all other values are derived.
Simon Fraser University Researchers at SFU’s Energy and Materials Research Group (EMRG) have performed a detailed analysis of factors affecting EV sales in BC, including a survey of over 1700 new vehicle owners from BC and elsewhere in Canada, and have incorporated this analysis into an EV sales forecast tool that predicts EV adoption in BC through to 2030
13. In
particular, the researchers found that availability of a diverse range of EV models is crucial in order to ensure significant growth in EV adoption. Fortunately, as will be detailed later in this report, a variety of new EV products are already coming to market in the next few years, and EMRG’s more optimistic projection would likely apply. This projection suggests that EV market share of new vehicle purchases will be between 6% and 16% in 2024, and between 20% and 23% by the year 2030:
RPT0001-01406-D01 EV Technology and Market Overview
Powertech Labs Inc. Page 18
Figure 8: SFU Energy and Materials Research Group’s projection for EV adoption in BC
14
For the purpose of comparison with Navigant’s forecasts, values can be taken for the year 2024 and assuming that current market trends continue to increase the availability of new PEV models. In order to map these market share values to an overall fleet size in BC and the Lower Mainland, certain assumptions need to be made regarding year-to-year growth rates and regarding the relative portion of EV sales in the Lower Mainland with respect to the rest of BC. These values are presented in the following table: Table 2: BC and Lower Mainland EV sales estimates based on SFU forecast for EV market share in BC.
Yea
r BC Lower Mainland
Low High Low High
20
24
Annual EV sales 13,000 35,000 9,300 25,000
Market Share 6% 16% 7.1% 19%
Cumulative EV sales 56,000 120,000 40,000 85,000
Percent of Fleet 2.6% 5.5% 3.0% 6.4%
20
30
Annual EV sales 44,000 50,000 30,000 35,000
Market Share 20% 23% 24% 27%
Cumulative EV sales 224,000 380,000 160,000 270,000
Percent of Fleet 10% 17% 12% 20% Numbers in bold are directly pulled from SFU’s forecast, all other values are derived.
14
Axsen, 2015.
RPT0001-01406-D01 EV Technology and Market Overview
Powertech Labs Inc. Page 19
The following two figures compare the forecasts of both studies, showing that there is relative agreement between Navigant Research’s predictions and the low end of SFU’s prediction for 2024. Only SFU’s research provided a forecast for the 2030 timeframe.
0
5
10
15
20
25
30
2023 2024 2025 2026 2027 2028 2029 2030 2031
Ne
w V
eh
icle
Mar
ket
Shar
e (
%)
Year
New Vehicle Market Share Forecasts (Lower Mainland)
SFU High
SFU Low
Navigant High
Navigant Low
0
5
10
15
20
25
2023 2024 2025 2026 2027 2028 2029 2030 2031EV P
ort
ion
of
Pas
sen
ger
Ve
hic
le F
lee
t (%
)
Year
EV Portion of Passenger Vehicle Fleet (Lower Mainland)
SFU High
SFU Low
Navigant High
Navigant Low
RPT0001-01406-D01 EV Technology and Market Overview
Powertech Labs Inc. Page 20
2.3 Current usage of public EV infrastructure in BC
Beginning in 2013, a large number of public Level 2 and DC Fast Charge stations were installed across BC as part of a number of related initiatives, funded in part by the provincial and federal governments. Under a related initiative, Powertech Labs and FleetCarma developed the evCloud, a web-based platform for collection of usage data from the 4 most popular types of public charging stations in BC. The evCloud has a public facing website intended to support public awareness of EV charging infrastructure (www.fleetcarma.com/evCloud), while also supporting in-depth research into infrastructure usage data by utility, government and academic researchers. This research will help to inform future deployments of EV infrastructure, both at a broad public policy level, and at the level of individual station owners, helping to build an understanding around what kind of business models might exist for private investment in EV infrastructure. Some usage data is available to the public directly from the evCloud website, while summary reports are available to the public through BC Hydro and Natural Resources Canada. This section contains some highlights from this data set. The evCloud is connected to over 460 charging stations across over 200 locations in BC. Of those stations, at least 250 are installed across 195 locations in the Metro Vancouver region: Table 3: Usage statistics for charging stations in Metro Vancouver
15
Metro Vancouver Level 2 Stations
Number of stations monitored 250
Number of locations monitored 195
Average number of charge events per week: 969 (9.5 per location)
Busiest week: 2073
Average charge connect time: 4h36m
Average charge energy 7.4kWh
The following list shows the top ten busiest Level 2 charging locations in BC with publicly available data, ranked according to most number of charge events per week: Table 4: Top-ten busiest Level 2 charging stations in BC (with publicly available data), data from Dec. 2015 to May 2016
Location Venue Type
Overall ranking*
Number of Ports
Charge Events
Energy Dispensed (kWh)
Average Charge†
Charges /Week
Total for All locations
428 51,080 373,181 7.3 kWh, 3hr29min
1,986
Average L2 Location 2 278 2,028 7.3 kWh, 3hr29min
11
Richmond City Hall Gov’t 5 2 1,149 7,981 7.0 kWh, 1hr36min
The region “Metro Vancouver” includes Burnaby, Langley, Maple Ridge, North Vancouver, Pitt Meadows, Tri-Cities, Richmond, Surrey, Delta, Vancouver, West Vancouver, and White Rock
RPT0001-01406-D01 EV Technology and Market Overview
Powertech Labs Inc. Page 21
Location Venue Type
Overall ranking*
Number of Ports
Charge Events
Energy Dispensed (kWh)
Average Charge†
Charges /Week
City Hall 1hr50min
Pearkes Recreation Centre
Leisure 16 2 857 4,925 5.8 kWh, 1hr34min
33
Metropolis at Metrotown
Retail 18 6 797 5,155 6.5 kWh, 1hr43min
31
Maple Ridge Business Centre**
Business 19 3 734 6,341 8.6 kWh, 9hr20min
29
ArtSpring Parking Lot (Salt Spring)
Leisure 20 2 711 4,380 6.2 kWh, 1hr35min
28
Guildford Towncentre
Retail 21 2 705 3,305 4.7 kWh, 1hr08min
27
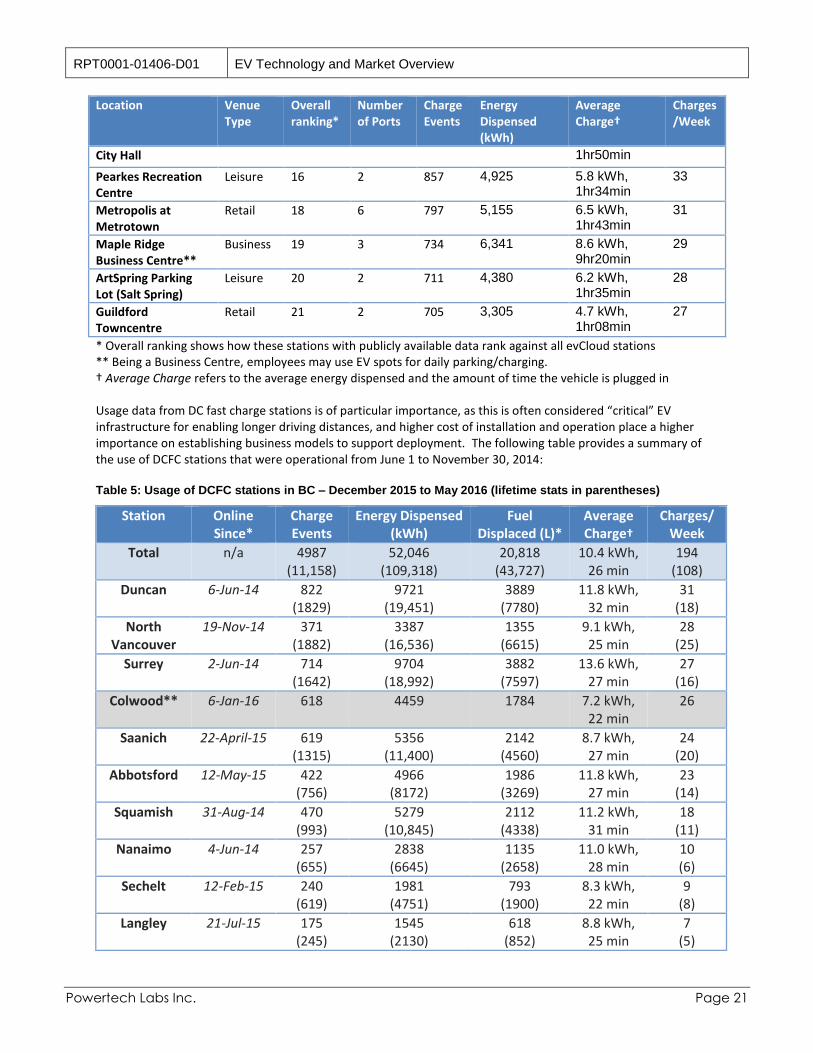
* Overall ranking shows how these stations with publicly available data rank against all evCloud stations ** Being a Business Centre, employees may use EV spots for daily parking/charging. † Average Charge refers to the average energy dispensed and the amount of time the vehicle is plugged in Usage data from DC fast charge stations is of particular importance, as this is often considered “critical” EV infrastructure for enabling longer driving distances, and higher cost of installation and operation place a higher importance on establishing business models to support deployment. The following table provides a summary of the use of DCFC stations that were operational from June 1 to November 30, 2014: Table 5: Usage of DCFC stations in BC – December 2015 to May 2016 (lifetime stats in parentheses)
Station Online Since*
Charge Events
Energy Dispensed (kWh)
Fuel Displaced (L)*
Average Charge†
Charges/Week
Total n/a 4987 (11,158)
52,046 (109,318)
20,818 (43,727)
10.4 kWh, 26 min
194 (108)
Duncan 6-Jun-14 822 (1829)
9721 (19,451)
3889 (7780)
11.8 kWh, 32 min
31 (18)
North Vancouver
19-Nov-14 371 (1882)
3387 (16,536)
1355 (6615)
9.1 kWh, 25 min
28 (25)
Surrey 2-Jun-14 714 (1642)
9704 (18,992)
3882 (7597)
13.6 kWh, 27 min
27 (16)
Colwood** 6-Jan-16 618 4459 1784 7.2 kWh, 22 min
26
Saanich 22-April-15 619 (1315)
5356 (11,400)
2142 (4560)
8.7 kWh, 27 min
24 (20)
Abbotsford 12-May-15 422 (756)
4966 (8172)
1986 (3269)
11.8 kWh, 27 min
23 (14)
Squamish 31-Aug-14 470 (993)
5279 (10,845)
2112 (4338)
11.2 kWh, 31 min
18 (11)
Nanaimo 4-Jun-14 257 (655)
2838 (6645)
1135 (2658)
11.0 kWh, 28 min
10 (6)
Sechelt 12-Feb-15 240 (619)
1981 (4751)
793 (1900)
8.3 kWh, 22 min
9 (8)
Langley 21-Jul-15 175 (245)
1545 (2130)
618 (852)
8.8 kWh, 25 min
7 (5)
RPT0001-01406-D01 EV Technology and Market Overview
Powertech Labs Inc. Page 22
Station Online Since*
Charge Events
Energy Dispensed (kWh)
Fuel Displaced (L)*
Average Charge†
Charges/Week
Salmon Arm**
8-Jan-16 80 710 284 8.9 kWh, 37 min
4
Kamloops 20-Jun-14 81 (376)
718 (3431)
287 (1372)
8.9 kWh, 34 min
3 (4)
Hope 18-Dec-15 44 563 225 12.8 kWh, 37 min
2
Penticton** 20-Feb-16 24 205 82 8.5 kWh, 29 min
2
Merritt 19-Aug-15 16 (44)
256 (650)
103 (260)
16.0 kWh, 33 min
1 (1)
Keremeos** 11-Dec-15 24 292 117 12.2 kWh, 24 min
1
Whistler** 25-Feb-16 6 48 19 8.0 kWh, 26 min
n/a
Boston Bar** 21-Jan-16 1 8 3 n/a n/a
West Kelowna**
27-May-16 3 8.8 4 n/a n/a
Revelstoke 24-Aug-15 8 88 35 11.0 kWh, 30 min
n/a
*Fuel equivalency assumes 1kWh provides similar driving range as 0.4L of gasoline. “Online Since” date based on first communications with evCloud; some DCFC stations were operational before they came “online”. **Stations shown in grey were not in operation for the full duration of the reporting period. † Average Charge refers to the average energy dispensed and the amount of time the vehicle is plugged in
RPT0001-01406-D01 EV Technology and Market Overview
Powertech Labs Inc. Page 23
The following figure is a snapshot of usage during the month of May 2015, showing how utilization varies considerably from one location to the next. One conclusion that can be drawn from this map is that DCFC stations located close to urban areas have so far been used much more regularly than stations along corridors that may facilitate longer trips. Utilization of stations may be impacted by the fact that the majority of stations are free-of-charge, although the station in Victoria is still the 3
rd most heavily used station, despite requiring a usage fee to
access the station.
Figure 9: Usage of DCFC stations during May 2015, “conflicts” representing signs of queuing
In the previous figure, a “conflict” is defined as any two charge events at a given DCFC station that are separated by less than 5 minutes, indicating that an EV driver may have had to wait in line before accessing the station. This metric provides an additional means of identifying congestion at stations, beyond simply the overall number of usage sessions. This distinction is important for stations that may see concentrated usage on particular days, but lower utilization over all. Congestion at stations will be an important consideration for future expansions of the DCFC network, and will likely drive a requirement for DCFC stations to support multiple vehicles charging at once. The following graph highlights that the number of conflicts is accelerating considerably as overall utilization of the DCFC stations increases:
RPT0001-01406-D01 EV Technology and Market Overview
Powertech Labs Inc. Page 24
Figure 10: Usage data for DCFC sites in BC - congestion is increasing rapidly
Figure 11: Visual evidence of congestion at the Bakerview Ecodairy DCFC in Abbotsford
RPT0001-01406-D01 EV Technology and Market Overview
Powertech Labs Inc. Page 25
3 THE VEHICLES
3.1 Types of Vehicles
Since the late 1990’s, a number of different types of “electrified” vehicles have come to market with varying levels of ability to move using electric power. The following are a few definitions to help clarify the distinction between these types of vehicles:
Hybrid Electric Vehicle (HEV): A vehicle with both internal combustion and electric powertrains, but that cannot be charged from the grid and requires refueling using gasoline or other fuel.
o Examples: Toyota Prius, Toyota Camry Hybrid, Ford C-Max
Battery Electric Vehicle (BEV): A vehicle that is solely powered by an electric powertrain recharged from the electric grid. Also sometimes called “Pure EV” or “100% Electric”.
o Examples: Nissan Leaf, Tesla Model S, BMW i3
Plug-in Hybrid Electric Vehicle (PHEV): A Hybrid Electric Vehicle that can be recharged from the electric grid, typically with the ability to travel significant distances without burning fuel, but with a combustion powertrain that can enable longer distances and faster acceleration.
o Examples: Toyota Prius PHV, Ford C-Max Energi
Extended-Range Electric Vehicle (E-REV): A type of PHEV that functions as a fully-performing BEV until the battery is depleted, at which point an internal combustion “range extender” (REx) or other auxiliary power unit (APU) is used to power the vehicle to enable longer distances. E-REVs typically have larger battery packs than PHEVs.
o Examples: Chevrolet Volt, BMW i3 REx
Fuel Cell Electric Vehicle (FCEV): A vehicle with an electric powertrain which may include a battery but primarily relies on a hydrogen fuel cell for power, and which can only be refueled with hydrogen
16.
o Examples: Toyota Mirai, Hyundai Tucson FCEV
16
The concept of a plug-in hybrid fuel cell electric vehicle, fueled by both hydrogen and electricity, has been shown by a number of automakers, and Mercedes is expected to launch such a vehicle with the GLC F-Cell in 2017: http://www.greencarreports.com/news/1104440_mercedes-benz-glc-to-offer-worlds-first-plug-in-fuel-cell-powertrain
RPT0001-01406-D01 EV Technology and Market Overview
Powertech Labs Inc. Page 26
This report will use the general term Electric Vehicle (EV) to include any vehicle that can be plugged in: Battery Electric Vehicles, Plug-in Hybrid Electric Vehicles, and Extended-Range EVs. In some technical contexts, the term Plug-in Electric Vehicle (PEV) is used instead, leaving “EV” to refer specifically to a BEV, but a more conversational language will use EV in the broader sense to denote any vehicle that can be charged up from the grid. The following diagram depicts the categorization of the above electrified vehicle types, with electric vehicles highlighted in red:
Figure 12 - Categorization of electrified vehicles; “plug-in” electric vehicles are highlighted in red.
While charging infrastructure may be less crucial to the operation of a PHEV (which has the ability to run on fuel once the battery is depleted), studies have shown that PHEV drivers may recharge more frequently, thereby achieving a comparable overall amount of electric driving as some BEV models.
17 In fact, public charging may have
a greater impact on overall PHEV energy use, in that charging at a destination can often extend EV-mode range to cover an entire return trip, whereas BEVs can sometimes make a return trip without an actual need for charging at a destination. For this reason, it is recommended that charging infrastructure planning take into account all types of EVs in order to support greater overall EV adoption and maximize environmental benefits.
RPT0001-01406-D01 EV Technology and Market Overview
Powertech Labs Inc. Page 27
3.2 Currently Available EVs in North America
The following is a table of some of the most significant EV models available today, based on overall sales and availability. (See section 2.1 for overall sales numbers of these models in North America). Table 6: Summary of significant EV models currently available in North America
Tesla Model S BEV 351-507km 60-100kWh 19.2kW Tesla SuperCharger, CHAdeMO (via adaptor)
135kW (Supercharger) 50kW (CHAdeMO)
Tesla Model X BEV 381-465km 75-100kWh 19.2kW Tesla Supercharger, CHAdeMO (w/ adaptor)
120kW, 50kW CHAdeMO
Toyota Prius Plug-in
PHEV 18km (blended – gas assist)
4.4kWh 3.3kW - -
BMW i3 BEV or EREV
130km 18.8kWh 7.4kW CCS 50kW
Smart ED BEV 109km 17kWh 3.3kW - -
Ford C-Max/Fusion Energi
PHEV 32km 7.6kWh 3.3kW - -
Chevrolet Spark EV
BEV 132km 21.3kWh 3.3kW CCS 50kW
Kia Soul EV BEV 150km 27kWh 6.6kW CHAdeMO 100kW
Mitsubishi iMIEV
BEV 100km 16kWh 3.3kW CHAdeMO 44kW
Ford Focus Electric
BEV 122km 23kWh 6.6kW - -
Volkswagen eGolf*
BEV 134km 26.5kWh 6.6kW CCS 50kW
*Products not currently available in Canada
RPT0001-01406-D01 EV Technology and Market Overview
Powertech Labs Inc. Page 28
3.3 Upcoming Products
Looking at upcoming models that have been announced by a number of automakers, four important trends stand out:
1. Affordable long range BEVs: While Tesla’s Model S has shown that pure electric vehicles can be made with a driving range that is comparable to a conventionally fueled vehicle, its purchase price puts it out of reach of the majority of buyers. A number of automakers, however, are confirmed to be developing relatively affordable BEVs with a range of between 240km and 320km. The following are a few models with expected specifications, pricing and availability:
a. Chevrolet Bolt
Compact hatchback
383km Range
US$ 37,500
Available in late 2016 b. Tesla Model 3
Midsize sedan
345km range
US$35,000
Available in 2018 c. Nissan Leaf (2
nd generation)
Midsize hatchback
240km range
US$30,000
Available in 2017
Increased range will make pure EVs more appealing for long trips, while also putting greater burden on charging infrastructure due to larger batteries. The “30 minutes to 80%” fast charge times often quoted for current products using typical 50kW DC Fast Charge stations will increase, unless charging stations increase in power to match these new products. Likewise, Level 2 AC charging will likely increase in power level, up to a possible maximum of 19.2kW, with 10kW being a more achievable target within reach of typical household electrical panels. Existing Level 2 infrastructure cannot typically deliver these higher power levels and would need to be replaced if higher power charging is desired.
2. Even more affordable medium range BEVs: While the above-mentioned “200-mile” EVs have attracted considerable media attention, 2016 saw the launch and/or announcement of a number of BEVs that serve to fill the gap between these “200-milers” and the first generation affordable BEVs that offered approximately 120-140km of range. In a number of cases, these are revised versions of existing BEVs that have been updated with a higher capacity battery, including the 2016 Nissan Leaf, the 2017 BMW i3, the 2017 Ford Focus Electric, and the 2017 or 2018 VW eGolf, all having batteries of between 30-36kWh and ranges of between 172-200km. If priced competitively relative to the longer range options, these models may find a market with two-car households, where the BEV is only required for daily commuting and not normally used for longer distance trips.
Figure 13: 2017 Chevrolet Bolt
RPT0001-01406-D01 EV Technology and Market Overview
Powertech Labs Inc. Page 29
3. Plug-in SUVs, Crossovers and Minivans: While the Mitsubishi Outlander PHEV SUV has recently been one of the best-selling plug-in vehicles in Europe, the SUV-friendly North American market has been oddly starved of plug-in SUVs, crossovers and minivans so far. This began to change in late 2015, with the arrival of a number of PHEV models, largely at the more luxurious end of the market. The following are all plug-in hybrid mid-size SUVs, the majority of them with around 20-30km of EV range, although the Mitsubishi Outlander currently available in Europe offers an EV range of over 40km:
a. Porsche Cayenne S E-Hydrid (available now) b. BMW X5 xDrive40e (available now) c. Mercedes GLE 550 e (available now) d. Audi Q7 e-Tron (available late 2016) e. Volvo XC90 T8 (available now) f. Mitsubishi Outlander (available early 2017)
Pure electric SUVs are also starting to hit the road, with the Tesla Model X having launched in late 2015. The Model X has specifications similar to the Model S but with seating for 7, higher ground clearance, and standard all-wheel-drive. Audi and most recently BMW have since both announced tentative plans to develop similar all-electric SUVs or crossover vehicles in the 2018 to 2020 timeframe. Finally, the Chrysler Pacifica Hybrid will launch in late 2016 with 48km of electric range, becoming the first plug-in minivan, the first plug-in model from Chrysler, and also the first potentially large-volume plug-in vehicle assembled in Canada.
4. Multiplication of PHEVs: A number of automakers, particularly high-end German makes such as Mercedes, BMW and Audi, have announced that they will produce PHEV versions of the majority of their vehicle lineup. Most of these PHEVs have a modestly-sized battery, providing an electric range of around 20-30km, most will support Level 2 charging at 3.3kW, and most are not expected to support DC fast charging. Toyota will also be launching its next generation plug-in Prius in late 2016, the Prius Prime, now with a more competitive electric range of 40km, although seating has been reduced to four.
a. Hyundai Sonata PHEV b. Toyota Prius Prime c. Various BMW sedans (eg 3-series, 7-series, 5-series) d. Various Mercedes sedans (S-Class, C-Class) e. Various Audi hatchbacks and sedans (A3 e-Tron, A6 e-Tron)
Figure 14: BMW X5 xDrive40e
Figure 15: Chrysler Pacifica Hybrid
RPT0001-01406-D01 EV Technology and Market Overview
Powertech Labs Inc. Page 30
Table 7: Summary of upcoming EV models with expected specifications
Model (availability)
Vehicle Type
Electric Range
Battery Capacity
Max AC Charging Rate
DC Charging Standard Supported
Max DC Charging Rate
Chevrolet Bolt (2016)
BEV 383km 60kWh 10kW CCS 75kW+
Tesla Model 3 (2018)
BEV 320km 60kWh 20kW Tesla Supercharger, CHAdeMO w/ adaptor (expected)
120kW, 50kW CHAdeMO
Nissan Leaf (2017/2018)
BEV 240km 48kWh 10kW CHAdeMO 75kW+
Ford Focus Electric (2016)
BEV 160km 30kWh (estimated)
6.6kW CCS 50kW
BMW i3 (2016) BEV,EREV optional
183km 33kWh 7.2kW CCS 50kW
VW eGolf (2017)
BEV 200km 36kWh 7.2kW CCS 50kW
Hyundai IONIQ (2016)
BEV 180km 28kWh 7.2kW CCS 100kW
Mitsubishi Outlander (2017)
PHEV 40km 12kWh 3.3kW CHAdeMO 50kW
Chrysler Pacifica Hybrid
PHEV 48km 16kWh 6.6kW - -
Hyundai Sonata (2016)
PHEV 30-40km 10kWh 3.3kW - -
Toyota Prius Prime (2016)
PHEV 40km 8.8kWh 3.3kW - -
Porsche Cayenne BMW X5 Mercedes GLE Audi Q7 Volvo XC90 (all 2016)
PHEV 20-30km 8-10kWh 3.3kW - -
Various Luxury sedans (2016-2017)
PHEV 20-30km 6-10kWh 3.3kW - -
RPT0001-01406-D01 EV Technology and Market Overview
Powertech Labs Inc. Page 31
3.4 Commercial Vehicles
While the vehicles discussed in the previous sections are primarily passenger vehicles, a large number and variety of commercial plug-in vehicles have entered the market in recent years, including delivery vans, utility trucks, and transit buses. The following table provides a quick summary of some of the commercial EVs that are currently available in North America (some with only limited availability of pre-production vehicles as of this writing):
Commercial EVs Vehicle Type
Smith Electric Delivery Truck (Previously in use by Novex) Range: [ 65 – 160 km ] Payload Capacity: [725 – 7,400 kg]
BEV
Nissan e-NV200 Van (available in Europe, limited availability in North America) Range: 170 km Payload Capacity: 703 kg
BEV
Navistar eStar (in use by Canada Post) Range: 160 km Price: US$150,000 Battery swap available
BEV
EVI Step-Van (in use by UPS in California) Range: 145 km Capacity: [662 – 970ft
3]
BEV
VIA Motors V-Trux (in limited use by select utility fleets) Range: 64 km (electric) Payload Capacity: 1,000 lb
PHEV
VIA Motors Shuttle Van (limited availability) Range: 55 km (electric) Payload Capacity: 2,000 lb
PHEV
RPT0001-01406-D01 EV Technology and Market Overview
Powertech Labs Inc. Page 32
Commercial EVs Vehicle Type
Odyne Bucket Truck (in use by City of Vancouver) Engine-off bucket operation Battery: [14 – 28 kWh]
PHEV
Proterra Catalyst (In use by several US transit agencies) Battery: [79 – 660 kWh] Range: [79 – 563 km] Fast overhead charging
BEV
NovaBus (limited trial by the Société de transport de Montréal) Fast overhead charging
BEV
New Flyer (under test by Winnipeg Transit) Battery: [100 – 300 kWh] Fast overhead charging
BEV
BYD K9 (In use by several US transit agencies) Range: [250 - 299 km] Price: [S$395,000 – S$592,600]
BEV
BYD T7 (Class-6 Truck) Range: 200 km Battery: 175 kWh
BEV
RPT0001-01406-D01 EV Technology and Market Overview
Powertech Labs Inc. Page 33
Commercial EVs Vehicle Type
BYD Q1M (Class-8 Terminal Tractor) Range: 15 hours Battery: 209 kWh Max Torque: 1106 lbs-ft
BEV
3.5 Other Vehicles
3.5.1 E-bikes and Scooters
E-Bikes and E-scooters are road-legal, two-wheeled vehicles. To be classified as an E-Bike, a vehicle must have pedals for human propulsion, have a less-than 500W motor and be speed-limited to 32km/h; they do not require a licence or registration. The battery is usually small (less than 1 kWh), so it can often be removed and hand-carried to be charged on any outlet. Electric scooters are limited to 1.5kW and are subject to the same restrictions as scooters with a less-than 50cc gasoline motor. Their battery packs are between 1 and 2 kWh. Typically, both E-bikes and scooters charge from a standard 120V/15A outlet, located in almost every building in the country. Charging using a standard J1772 EV charging station is typically not supported, unless the charging station is also equipped with a 120V/15A outlet, as in some earlier models from ChargePoint.
3.5.2 Motorcycles
The two major manufacturers of electric motorcycles are Lightning and Zero. Battery packs range from 5 kWh to 20 kWh providing range from 70 km to 300 km depending on driving style and conditions.
Electric motorcycles typically charge using a J1772 connector, allowing them to use a standard Level 1 or Level 2 EV charging station. The onboard charger delivers around 1.3 kW which equates to 20 km of range per hour. Some models may not have a J1772 connector, requiring a 120V/15A outlet, as with most E-bikes and E-scooters. Fast charging options are available on the Lightning motorcycle, and it is expected that future motorcycles will come standard with DC Fast charging
technology,(CCS or CHAdeMO) reducing the charging time to 15 minutes.
Figure 16: Lightning LS-218 electric motorcycle
RPT0001-01406-D01 EV Technology and Market Overview
Powertech Labs Inc. Page 34
3.5.3 Small Utility Vehicles
Small Utility Vehicles are available from companies such as Polaris and John Deere. They are classed as Low-Speed Vehicles and are limited to 40 km/h, but are allowed to drive on most roads posted at 60 km/h or less. Low-Speed Vehicles must have an electric drivetrain under Transport Canada regulations. Most of these vehicles use lead-acid batteries for their low cost and ease of replacement; however, as lithium-ion technology becomes cheaper and more commonplace, lead-acid will be phased out. The Polaris GEM comes with a standard lead-acid battery or an optional lithium-ion battery to reduce weight and increase range. Chargers can be level 1 or level 2 and can deliver up to 6 kW of power using the J1772 standard. The GEM is available in a variety of configurations for passengers (from two to six seats) and cargo (eg covered boxes or open pickup bed) with pricing ranging between approximately $10,000 and $20,000 USD. Polaris also offers an all-
terrain vehicle with the lead-acid batteries.
The John Deere Gator TE is powered by lead-acid batteries and does not offer a lithium-ion option yet. Charging is carried out at around 1.5kW and uses a standard outlet. Top speed is 25 km/h. The Gator TE currently retails for $15,703 CAD, representing about a $6000 premium over a comparable gas-powered model.
The Might-E Truck is made by Canadian Electric Vehicles Ltd (CanEV), located on Vancouver Island. It has a top speed of 40 km/hour and it is powered by a 16 kWh lead-acid battery. The load capacity is between 300 and 500 lbs on road with a 1000 lb configuration off road. It is charged by a 72V/12A charger, delivering 864 W. CanEV also has experience converting over 60 aircraft refueling trucks from fossil-fuel to electric power. Pricing for the Might-E Truck was not immediately available.
3.6 Battery degradation
One concern that is often raised about electrified powertrains is the durability of batteries. Based on experience with consumer electronics and possibly older technologies such as lead-acid batteries, one might expect that an electric vehicle would need frequent and expensive battery replacements. Older battery chemistries also required users to follow certain usage practices, such as avoiding partial charge and discharge cycles due to the so-called “memory effect”. Modern EVs, however, all use lithium-ion batteries that are relatively robust and flexible. Most EVs come with an eight- to ten-year battery warranty, and automakers do not impose any strict requirements on charging patterns. That said, some battery degradation over time is expected, and some automakers only guarantee that the battery will retain 75% to 80% of its original capacity by the end of the coverage period. Factors affecting battery degradation include calendar age, number of charge/discharge cycle, state-of-charge during storage (degradation is worst when the battery is full), and temperature (high temperatures degrade batteries faster). Regular usage of fast charging stations is generally discouraged by automakers, although a study
Figure 18: John Deere Gator TE
Figure 19: CanEV Might-E Truck
Figure 17: Polaris GEM eL XD
RPT0001-01406-D01 EV Technology and Market Overview
Powertech Labs Inc. Page 35
conducted by Idaho National Laboratory found that fast charging had less of an impact on battery life than expected, and that high temperatures and overall distance travelled (and hence battery usage cycles) were stronger factors
18.
While the oldest samples of the current generation of EVs have only been on the road for about six years, early reports suggest that battery degradation varies from one automaker to the next, likely due to differences in battery and vehicle design. The Nissan Leaf does not employ an active cooling system for its battery. Some reports suggested that this left the Leaf vulnerable to excessive battery degradation in extreme climates, and Nissan has since responded by introducing a modified battery chemistry that is more resilient to hot temperatures.
19 The Chevrolet Volt, meanwhile, does include an active cooling system for its battery, and GM has
suggested this has allowed them to avoid any warranty battery replacements due to capacity loss20
. A survey conducted by Plug-in America collected the odometer and battery capacity of over 500 Tesla Model S vehicles to estimate battery degradation
21. Generally, the battery packs were found to lose about 5% of their
capacity in the first 80,000 km after which the degradation slows; owners of vehicles with over 160,000 km have reported less than 8% degradation.
Figure 20: Model S battery capacity vs odometer readings – pluginamerica.org
RPT0001-01406-D01 EV Technology and Market Overview
Powertech Labs Inc. Page 36
4 CHARGING INFRASTRUCTURE
An electric battery is a direct current (DC) device – there is a positive and a negative terminal, and they do not alternate! Charging an electric vehicle’s battery therefore requires DC electrical power, whereas electricity is typically distributed in alternating current (eg 120V AC or 240V AC). This means that at some point, electricity must be converted from AC to DC. Whether this conversion happens onboard the vehicle or within a charging station is an important distinction for charging infrastructure. The most common way to charge an EV is through AC charging. In this configuration, AC power from the grid is provided to the vehicle through the charge port, and an onboard component (the charger) converts this AC power to DC in order to charge the battery. This configuration allows the vehicle to charge in a broader range of places, as most of the specialized equipment is carried onboard the vehicle, and the stationary charging station can be quite simple. That said, the power of an onboard charger is more limited in order to avoid adding excessive cost and weight to the vehicle. In the case of DC charging, the charging station itself performs the AC-to-DC conversion, and DC power is provided to the vehicle’s charge port, bypassing the onboard charger and going directly into the vehicle’s battery. With the DC charger off-board of the vehicle, it can be significantly larger and more powerful, and the higher cost of this equipment can effectively be shared across many users. On the other hand, this charging station is significantly more complicated and expensive than an AC charging station, adding to the cost of infrastructure deployment.
Figure 21: Diagram showing the difference between AC and DC charging - Source: www.abb.com
The following sections provide details on AC and DC charging, as well as two potential alternative means of replenishing an electric vehicle: wireless charging and battery swapping.
RPT0001-01406-D01 EV Technology and Market Overview
Powertech Labs Inc. Page 37
4.1 AC Charging
Since AC charging involves providing AC power to a vehicle’s charge port, one might assume that all that is required is a simple extension cord plugged into a household outlet. This is close to true, but not quite. All passenger EVs sold in North America comply with the SAE J1772 standard which defines a standard connector and communications protocol for AC charging of electric vehicles. The J1772 standard ensures that a vehicle is aware of the limitations of the circuit it is connected to, ensures that power is only applied when the vehicle is actively requesting power (preventing bad connections, arcing and potential fire risks), and prevents the vehicle from being driven while a charging cable is still attached. A J1772-compliant charging station or EV Supply Equipment (EVSE) essentially acts as an extension cord with these safety features built-in. An EVSE may either be a fixed piece of equipment, or a portable cordset that is kept with the vehicle in order to plug into existing outlets.
Charging Level Specification Charging Time Application
3-phase AC Large BEV: 2-8 hours Standard in progress (SAE J3068) – intended to support large commercial vehicles.
4.1.1 AC Level 1
AC Level 1 charging is the slowest form of charging, although it is quite versatile due to the ubiquity of 120V outlets. Many PHEV owners and some BEV owners get by with only Level 1 charging at home. Four hours of charging at Level 1 can provide approximately 30km worth of range, depending on the vehicle and driving conditions. This may be sufficient to support daily driving with overnight charging or while charging at work. Supporting long distance travel on Level 1 becomes more problematic: at approximately 1.5kW, a full charge for a Nissan Leaf (24kWh battery) would take approximately 16 hours. A full charge for a Tesla Model S85 (85kWh battery) would take approximately 56 hours.
Charging Level Panel
Requirements Charging time required to
replenish 30km of range (~6kWh)
Charging time required to replenish 120km of range
(~24kWh)
AC Level 1 (1.4kW)
120V, 15A 4h 16h
When discussing Level 1 charging infrastructure, it is important to consider the distinction between a simple 120V outlet, and a fixed Level 1 EVSE. While a 120V outlet is sufficient to provide power to an EV, the driver will be required to supply their own portable EVSE and leave this connected to the outlet. This can be less convenient to an EV driver – it can take a minute or two to unpack and connect a portable EVSE, and packing it up afterwards also takes time and can get messy depending on weather. This arrangement can also be less secure in that the EVSE may be easily stolen. This concern can be addressed either with a locking mechanism on the outlet, or by a charge port on the vehicle that may come equipped with a locking mechanism. A level 1 EVSE addresses these concerns by fixing the equipment to the facility and allowing EV drivers to leave their portable EVSE in the trunk. This convenience may be appreciated in regular parking scenarios such as
RPT0001-01406-D01 EV Technology and Market Overview
Powertech Labs Inc. Page 38
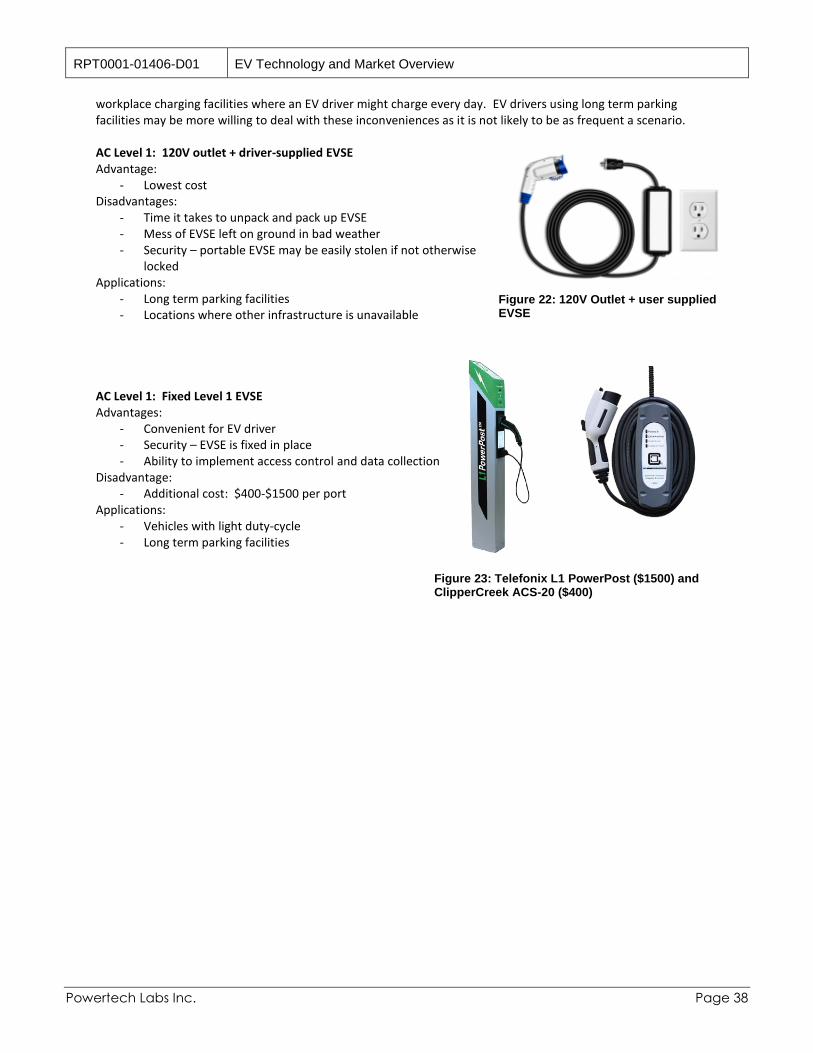
workplace charging facilities where an EV driver might charge every day. EV drivers using long term parking facilities may be more willing to deal with these inconveniences as it is not likely to be as frequent a scenario. AC Level 1: 120V outlet + driver-supplied EVSE Advantage:
- Lowest cost Disadvantages:
- Time it takes to unpack and pack up EVSE - Mess of EVSE left on ground in bad weather - Security – portable EVSE may be easily stolen if not otherwise
locked Applications:
- Long term parking facilities - Locations where other infrastructure is unavailable
AC Level 1: Fixed Level 1 EVSE Advantages:
- Convenient for EV driver - Security – EVSE is fixed in place - Ability to implement access control and data collection
Disadvantage: - Additional cost: $400-$1500 per port
Applications: - Vehicles with light duty-cycle - Long term parking facilities
Figure 22: 120V Outlet + user supplied EVSE
Figure 23: Telefonix L1 PowerPost ($1500) and ClipperCreek ACS-20 ($400)
RPT0001-01406-D01 EV Technology and Market Overview
Powertech Labs Inc. Page 39
4.1.2 AC Level 2
Level 2 charging stations are the most common type of public charging infrastructure in North America, with over 35,000 Level 2 charging ports active as of August 2016
22. The charging rate is typically more than doubled as
compared to Level 1 charging, thanks to a higher voltage (240V vs 120V) as well as typically higher amperage circuits (40A being the most common, vs 15A circuits for Level 1). The J1772 standard supports Level 2 charging at rates between 1.4kW and 19.2kW. The actual charging rate will depend on the minimum of either the EVs maximum charging rate or the EVSE’s available power. Most PHEVs and some BEVs are only capable of charging at 3.3-3.6kW due to the limitation of the onboard charger. Many BEVs now support Level 2 charging at 6.6-7.2kW (eg Nissan Leaf, Ford Focus EV, Volkswagen e-Golf). The Tesla Model S can draw up to the maximum 19.2kW allowed by the J1772 standard, provided the EVSE and electrical panel have sufficient capacity.
Charging Level
Panel Requirements
Vehicles Supported Charging time required to replenish 30km of range
(~6kWh)
Charging time required to replenish 120km of range
(~24kWh)
AC Level 2 (3.3-3.6kW)
240V, 16A All EVs 2h 8h
AC Level 2 (6.6-7.2kW)
240V, 40A Most new BEVs 1h 4h
AC Level 2 (19.2kW)
240V, 100A Tesla Model S <0.5h <1.5h
Figure 24: Some common Level 2 charging stations
4.1.3 AC Level 3 (in development)
AC Level 3 is a new category of charging that is in development as part of the SAE J3068 standard. It is intended to support larger plug-in vehicles such as electric buses and trucks; vehicles which would likely charge in commercial/industrial settings with access to high amperage 3-phase AC power. The standard is still under development but expected output power is 66 kW (480V/80A) with a connector similar to the Mennekes Type 2 plug, which is common in Europe instead of SAE J1772. An advantage of this charging configuration is a symmetric three phase load, which helps preserve grid stability. Higher power levels could be possible as it uses a similar connector to the European Tesla Superchargers which deliver up to 140 kW DC.
RPT0001-01406-D01 EV Technology and Market Overview
Powertech Labs Inc. Page 40
4.2 DC Fast Charging
DC Fast Charging enables EVs to charge much more quickly, opening the door to longer distance trips and higher overall utilization of EVs. DC Fast Charging connects the charging station directly to the vehicle’s battery terminals, therefore requiring a separate connection to the vehicle than that used for AC charging (unless wiring on the vehicle is automatically reconfigurable, such as with the Tesla Model S). DC fast charging used to be referred to as “Level 3” charging, but this nomenclature was revised in 2011 in order to distinguish between the different charging configurations, and to leave the door open for definition of 3 charging levels for both AC and DC charging. DCFC capabilities are most commonly available with BEVs, with the BMW i3 REx (equipped with range extending engine) standing out as the only PHEV currently available in North America with a DCFC port. Generally speaking, PHEVs have sufficient power from the gasoline portion of the powertrain to support long distance travel without the need for recharging. Studies have shown though that PHEV owners charge their vehicles more frequently than BEV owners
23, leading some to speculate that PHEV drivers may go out of their way to use a fast charge station in
order to avoid burning gasoline on longer trips. While not yet available in North America, the Mitsubishi Outlander PHEV includes a CHAdeMO DCFC port in European and Japanese markets, and other automakers have suggested future PHEVs are likely to offer DCFC as an option.
4.2.1 DC Charging Rates
The most common DCFC stations in North America as of 2015 support charging at up to 50kW, and this aligns well with the maximum charging rate supported by the most common BEVs (eg those with ~24kWh of battery capacity, ~120km of range). These vehicles can actually only support this maximum charging rate during the earlier part of a charge event, and the charging rate must be tapered down as the battery approaches a full charge. The following graph shows a charge event that started at approximately 50% state-of-charge (SOC), with the charging rate beginning to reduce after only 5 minutes of charging:
Figure 26: A charge event from a 50kW DCFC station
For this reason, some manufacturers (such as Bosch and Fuji) have launched DCFC products that are limited to 25kW, arguing that overall charging times for the current generation of EVs are not increased significantly, especially when vehicles are plugged in at 30% SOC or higher. Fuji claims that a typical EV charging from 30% SOC to 77% SOC would only require 7 additional minutes to charge using a 25kW station as compared to a 50kW station
RPT0001-01406-D01 EV Technology and Market Overview
Powertech Labs Inc. Page 41
Figure 27: Comparison of 25kW and 50kW DCFC charge curves - www.americas.fujielectric.com
Fuji is also correct to highlight the reduced installation and operation costs of lower power DCFC stations. It is important to consider, however, that future BEV models with significantly longer range will require longer charge times, and will likely support a higher charging rate than the products currently on the market (much like the Tesla Model S can currently support charging at up to 135kW). A BEV with 320km of range would likely take over 2 hours to charge to 80% on a 25kW station, vs about 1 hour on a 50kW station. This next generation of longer-range BEVs has many considering the need to increase DCFC charging rates to 100kW and even higher. The following table shows various power levels considered for DCFC charging: Table 8: DCFC charging rates
Charging Rate Charging Time Notes
25kW 40 mins to 80% (120km range EV) Lower cost installations, slightly slower overall charge time for current generation of EV (~120km range)
50kW 30 mins to 80% (120km range EV) Most common DCFC, maximizes charging rate on current generation of EV
100-150kW 30 mins to 80% (200km range EV) Not yet common, will support future EVs with larger batteries, broader support expected by 2018
135kW (Tesla Supercharger) 40 mins to 80% (Model S) Proprietary solution
300kW 15 mins to 80% (400km range EV) In development, expected by 2020
RPT0001-01406-D01 EV Technology and Market Overview
Powertech Labs Inc. Page 42
4.2.2 DCFC Standards
While all EVs sold in North America support the J1772 standard for AC charging, there are currently two competing standards for DC charging, as well as a proprietary solution used only by Tesla. Tokyo Electric Power Company (TEPCO): CHAdeMO CHAdeMO was the first DC fast charging protocol to be deployed, debuting with the Nissan Leaf and Mitsubishi iMIEV in 2010. It supports charging at up to 60kW, while most EVs currently max-out at 50kW. As of September 2016, there were over 1900 CHAdeMO charging stations in North America and 3500 in Europe.
25
Figure 28: Nissan Leaf charging ports, left to right: CHAdeMO DCFC, J1772 AC
Society of Automotive Engineers (SAE): Combined Charging System (CCS) SAE’s CCS charging protocol was adopted by all North American and European automakers in 2012. The vehicle charge port has a smaller footprint than the CHAdeMO protocol by reusing the same communications wires as those used by the J1772 AC charging port, thus the name “Combined Charging System”. The first CCS DCFC stations appeared in 2013, and as of September 2016, there are now over 600 available in North America
26 and
over 2400 in Europe.27
Note that the European version of CCS is based on the European “Type 2” connector, as opposed to the J1772 connector used in North America. This is in order to support 3-phase AC charging which is more common in Europe, although the communications protocol is shared in either case.
Figure 29: SAE CCS charge couplers, European version on left, North American version (J1772) on right.
The associated AC-only charge couplers are shown above each CCS variant for reference.
RPT0001-01406-D01 EV Technology and Market Overview
Powertech Labs Inc. Page 43
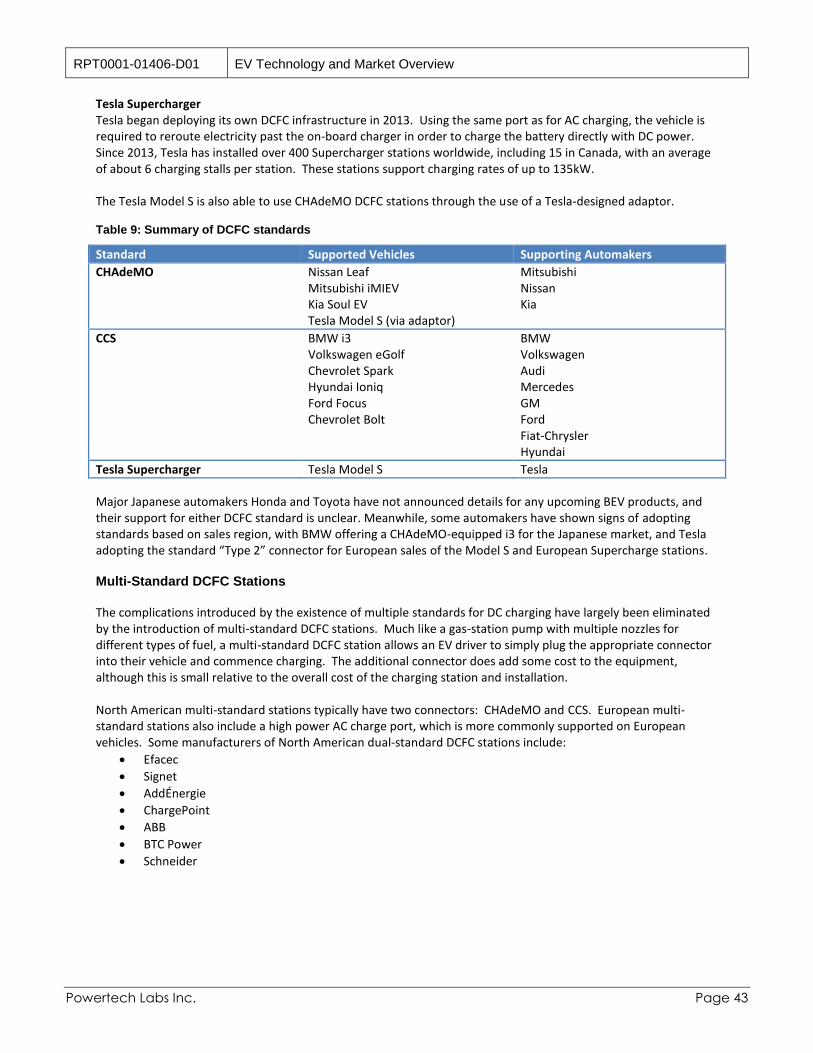
Tesla Supercharger Tesla began deploying its own DCFC infrastructure in 2013. Using the same port as for AC charging, the vehicle is required to reroute electricity past the on-board charger in order to charge the battery directly with DC power. Since 2013, Tesla has installed over 400 Supercharger stations worldwide, including 15 in Canada, with an average of about 6 charging stalls per station. These stations support charging rates of up to 135kW. The Tesla Model S is also able to use CHAdeMO DCFC stations through the use of a Tesla-designed adaptor. Table 9: Summary of DCFC standards
Standard Supported Vehicles Supporting Automakers
CHAdeMO Nissan Leaf Mitsubishi iMIEV Kia Soul EV Tesla Model S (via adaptor)
Mitsubishi Nissan Kia
CCS BMW i3 Volkswagen eGolf Chevrolet Spark Hyundai Ioniq Ford Focus Chevrolet Bolt
BMW Volkswagen Audi Mercedes GM Ford Fiat-Chrysler Hyundai
Tesla Supercharger Tesla Model S Tesla
Major Japanese automakers Honda and Toyota have not announced details for any upcoming BEV products, and their support for either DCFC standard is unclear. Meanwhile, some automakers have shown signs of adopting standards based on sales region, with BMW offering a CHAdeMO-equipped i3 for the Japanese market, and Tesla adopting the standard “Type 2” connector for European sales of the Model S and European Supercharge stations. Multi-Standard DCFC Stations
The complications introduced by the existence of multiple standards for DC charging have largely been eliminated by the introduction of multi-standard DCFC stations. Much like a gas-station pump with multiple nozzles for different types of fuel, a multi-standard DCFC station allows an EV driver to simply plug the appropriate connector into their vehicle and commence charging. The additional connector does add some cost to the equipment, although this is small relative to the overall cost of the charging station and installation. North American multi-standard stations typically have two connectors: CHAdeMO and CCS. European multi-standard stations also include a high power AC charge port, which is more commonly supported on European vehicles. Some manufacturers of North American dual-standard DCFC stations include:
Efacec
Signet
AddÉnergie
ChargePoint
ABB
BTC Power
Schneider
RPT0001-01406-D01 EV Technology and Market Overview
Powertech Labs Inc. Page 44
Figure 30: Multi-standard DCFC stations: AddÉnergie, ChargePoint, and ABB (European version shown)
4.3 Wireless Charging
Both the AC and DC charging approaches discussed above are considered “conductive” charging, in that metal conductors are used to supply electricity to a vehicle. There are, however, a number of ways of delivering power without wires. One such method is through induction, or “inductive” charging, where a receiver coil mounted on the vehicle may receive power wirelessly from a sender coil which composes part of a wireless EVSE, or WEVSE. Alternating current in the sender coil creates an alternating electromagnetic field which in turn induces alternating current in the receiver coil. Such systems have been designed to transfer power between a sender coil mounted flat on the ground to a receiver coil mounted on the underside of a vehicle. This can be used to recharge an electric vehicle while stationary, or even potentially while a vehicle is travelling. At least one after-market wireless charging retrofit package is available for installation on select EVs. PluglessPower (www.pluglesspower.com) offers a 3.3kW charging system compatible with the Nissan Leaf and Chevrolet Volt for under US$ 2000, with some Nissan and Chevrolet dealers able to assist with installation of the Vehicle Adaptor that’s required on the vehicle. Telecommunications giant Qualcomm is also actively developing wireless charging technology for EVs, and has demonstrated wireless charging BMW vehicles as part of the FIA Formula E racing series. Automakers are working together to establish automotive standards for wireless charging, and it is generally expected that the functionality will be incorporated into future models. In early 2016, SAE published the J2954 “Technical Information Report”, a specification guideline that will evolve into a formal standard once field data can be collected from early deployments
28. A large number of automakers and component developers (including
PluglessPower and Qualcomm) have contributed to the development of J2954. The advantage of wireless charging is largely convenience – an EV driver would no longer be required to manually plug their vehicle in, but would rather be required to park in a precise location within range of a WEVSE. The driver may be provided with driver aids that help guide the vehicle to this precise location such that the vehicle is within the required range to establish a wireless connection with the WEVSE. This added convenience may become critically important for scenarios that involve frequent stop-start cycles and many opportunities for
RPT0001-01406-D01 EV Technology and Market Overview
Powertech Labs Inc. Page 45
charging, where manually connecting a traditional charging station may be impractical. This could include taxis operating in a queue or buses that recharge while picking up passengers at a stop.
29
The disadvantages of wireless charging are increase in cost and decrease in efficiency. The US Department of Energy’s Idaho National Laboratory found the above-mentioned PluglessPower system to have an overall efficiency of between 86% and 90%, depending on alignment and the vertical gap between the coils.
30 This would cause an
increase in the overall energy consumption of an EV for a given distance by about 10-15%. The combination of increased vehicle cost, increased charge station cost, and decreased efficiency means that wireless charging is likely to remain an optional convenience feature, and it is not expected to replace conventional conductive charging as the standard means of charging EVs for the foreseeable future. While the technology may establish a foothold in luxury vehicle segments where cost and efficiency are often traded off for convenience features, or for specific applications with frequent opportunities for charging (such as with taxis or fleet vehicles), these vehicles are still likely to be equipped with a standard charge port as well, to ensure compatibility with existing charging infrastructure.
Wireless Charging
Opportunity: Convenience and ease of recharging, especially for frequent stop/start cycles.
Challenges: Added cost and reduced energy efficiency.
Status After-market retrofit packages readily available for existing EVs. Some future vehicle models likely to support wireless charging as early as 2017.
Ideal application: Buses charging at passenger pick-up/drop-off areas, taxis charging while in queue.
29
“London Buses to be Recharged Wirelessly During Stops” http://evworld.com/news.cfm?newsid=34021 30
RPT0001-01406-D01 EV Technology and Market Overview
Powertech Labs Inc. Page 46
4.4 Battery Swapping
Battery swapping has often been discussed as a potential means of speeding up the process of replenishing an electric vehicle’s state of charge. By physically replacing a depleted battery with a fully charged one, an EV driver would potentially be able to carry on with their drive within minutes while their original battery is recharged at the battery swapping/charging facility. This was the vision of the now-defunct Project Better Place, an Israel-based company that operated between 2007 and 2013. Better Place envisioned an EV industry with standardized battery designs and subscription-based ownership models that mimicked the cellphone industry. The challenges of battery swapping for passenger vehicles are largely due to physical design:
1. Given that an EV battery can be a very large component, it can be difficult to design it in such a way to be easily swappable without overly compromising the mechanical and electrical design of the vehicle.
2. Given challenge #1, standardizing the battery design such that batteries can be shared across a broad range of vehicle makes and models with a variety of designs is an even greater challenge.
More recently, Tesla Motors has demonstrated battery swapping with the Tesla Model S, and has even established a single battery swapping facility in California. The Model S’s design lends itself well to battery swapping, with the battery slung underneath the vehicle making it relatively easy to remove. Yet even with this swapping-friendly design, and with an automaker that’s entirely focused on a single vehicle model, Tesla has found that battery swapping may not be worth the effort, given the advances in fast charging capabilities. Tesla’s free network of 135kW “Supercharge” stations can provide a 300km charge in less than 30 minutes, whereas a battery swap requires a fee of approximately $50 (mimicking the cost of a full tank of gasoline). With a battery swapping facility located approximately midway between San Francisco and Los Angeles, Tesla has found that this service is not very popular, with most of their customers opting for the free but slower supercharging service. Battery swapping is, however, widely practiced with commercial vehicles, especially material handling equipment such as forklifts. The high duty cycle of some commercial vehicles can benefit greatly from the quick turnaround of a battery swapping approach, and the dedicated design of the vehicles operating in a large fleet out of a single facility can simplify the logistics.
Battery Swapping
Opportunity: Very fast turnaround for a full charge.
Challenges: Complicates vehicle design, difficult to standardize across vehicles
Status Basic demonstrations, limited operation at one Tesla facility. No foreseen broad availability for passenger vehicles.
Ideal application: Material handling equipment and other dedicated commercial fleets.
RPT0001-01406-D01 EV Technology and Market Overview
Powertech Labs Inc. Page 47
4.5 Costs, Usage Fees, and Best Practices
4.5.1 Typical Costs
The following cost estimates are based on actual project experience, with Powertech having installed numerous Level 1, Level 2 and DCFC stations, and played a supporting role in many more projects. The costs of EV charging equipment vary greatly depending on charging level. The following table provides approximate ranges for the three most common currently available types of charging equipment: Table 10: Approximate charge station equipment costs
Equipment Cost (per port) Factors affecting cost
AC Level 1 $50-1500 Outlet vs EVSE
AC Level 2 $1500-5000 Output power, power management and networking capabilities, station manufacturer
DC Fast Charge $15,000-50,000 Output power (25kW vs 50kW), station manufacturer, support for multiple standards
The cost of installation of charging equipment can also vary greatly. The following installation costs are based on Powertech’s experience across multiple projects, and include all aspects of a complete EV charging installation, including signage and associate hardware: Table 11: Approximate charge station installation costs
AC Level 1 $500-10000 Various site-specific considerations: distance from power source, ground surface type, future-proofing, available electrical supply.
AC Level 2 $3000-15000
DC Fast Charge $20,000-80,000
The cost of operating an EV charging installation depends heavily on the utilization of the station. According to information available through Powertech’s evCloud website (www.fleetcarma.com/evCloud), the average charge station in Metro Vancouver is used about 6 times per week, dispensing an average of 6kWh of electricity each time, adding up to about $150 of electricity per year. Some of the busier Level 2 stations in the region can see more than twice this amount utilization, while the busiest DCFC stations are used greater than 20 times per week. Depending on the peak power demand of a utility account, charging stations can incur additional fees due to demand charges
31, adding up to $6000 per year for a single DCFC station. Finally, many charging stations require
payment of a yearly service fee in order to support network transactions for usage fee collection, data collection and power management. Here are the yearly fees for some of the most common EVSE network operators in BC: Table 12: Charge station network service fees (as of 2015)
Network Yearly service fee per port
Highest $300
Lowest $125
Typical $260
31
A demand charge is a fee based not on the total energy consumed (in kWh) over a billing period, but rather on the peak power level (in kW)
delivered at any point during that period. See https://www.bchydro.com/news/conservation/2013/demand-charge.html for more information.
RPT0001-01406-D01 EV Technology and Market Overview
Powertech Labs Inc. Page 48
The following table summarizes typical charge station operational costs: Table 13: Charge station operating costs (per port)
Yearly Energy Cost Yearly Demand Charges
Yearly Network Fee Total Yearly Cost
AC Level 1 <$100 0 0 <$100
AC Level 2 $250-500 $0 - 400 $125-300 $375-1200
DC Fast Charge $300-1000 $1800 - 6000 $260 $2100-7000
4.5.2 Usage Fees
Many charging stations support the collection of usage fees through the use of network member cards and smart phone applications. These networks typically require a user to sign up for an account with each individual network, although there have been some efforts to establish roaming systems that allow networks to share members and allow universal access to equipment across multiple networks.
32
Usage fees for charging stations can be based on:
- Per usage session - Energy (kWh) - Time (minute or hour)
The most common type of fee structure is based on time. A time-based fee can be effective in incentivizing users to move their vehicle once charging is complete, and can help ensure the most effective utilization of charging equipment. Usage fees based on a per-kWh energy value can be preferable in terms of ensuring all users pay the same amount for the same service. The speed of charging may depend on a number of variables (vehicle type, state-of-charge of battery, battery temperature, power reduction due to load management) and so a usage fee based on the actual energy delivered may be the most fair. In selecting a usage fee, it may be desirable to select a fee that recovers the operating costs of the station, while still keeping the cost of charging an EV comfortably below that of fueling a conventional vehicle on a per-km basis. In BC, at $1.40/litre of gasoline, this equivalency works out to about $0.50 per kWh, or about $1.65 per hour if charging at a rate of 3.3kW. A rate of $1 per hour is common at many stations in the province of Quebec. In BC, almost all Level 2 charging stations are free to use, although many are located in paid parking lots where EV drivers pay the same rate as other drivers. DCFC stations in BC are gradually adopting a price of $0.35/kWh, placing the price comfortably below parity with gasoline, while still applying a premium fee for the fast charging service.
33
Resale of electricity in BC is regulated by the BC Utility Commission, and so the application of usage fees for EV charging is being carefully considered by the BCUC. While in other areas, time-based usage fees have avoided the scrutiny of regulatory bodies, it is not clear whether this would still be considered resale by the BCUC.
RPT0001-01406-D01 EV Technology and Market Overview
Powertech Labs Inc. Page 49
Currently, only registered utilities are allowed to sell electricity in BC, with a few exceptions: - Any municipality may resell
o Currently reselling through DCFCs: Saanich, Nanaimo, Langley, Princeton, Keremeos, Merritt - Landlords providing electricity to tenants may resell at cost (no profit) - Employers providing electricity to employees may resell at cost (no profit)
In 2016, the BCUC approved a one-time exemption that allows the Bakerview Ecodairy, a private business located in Abbotsford, to apply a usage fee of $0.35 per kWh for usage of the DCFC station that it hosts and operates
34.
The Ecodairy is required to submit annual reports to the BCUC that will hopefully help to inform any future decisions by the BCUC regarding broader application of usage fees for EV charging. BCIT applies a fee to use its DCFC stations by charging for the parking spot on a time basis.
4.5.3 Public vs residential charging
Data collected for the EV Project led by Idaho National Lab shows that 80% of EV charge events take place in the home (almost always at level 1 or level 2), while 20% take place in public locations. Of that 20%, 83% occurs at a level 2 charging stations where the car may require a few hours to fully recharge. The average charging time at public level 2 stations in BC is around 90 minutes.
35
Some charge events occur on level 1 stations but they are often unmonitored and impractical due to their low power, delivering less than 10 km of range per hour. Campgrounds, hotels and businesses allowing overnight parking could have some interest in allowing EVs to charge using level 1. Data collected estimates their use at 6% of the total of public charging. DC fast chargers provide a high-power option, as the vehicle gets hundreds of kilometers of range per hour: drivers stay on average for 25 minutes. Despite this advantage only 11% of public charging events per car use DCFCs. One explanation is the convenience of level 2: they are often close to venues and more common than expensive DCFC units.
Figure 31: Charging at home represents 80% of all charging [The EV Project (Idaho National Laboratory,
RPT0001-01406-D01 EV Technology and Market Overview
Powertech Labs Inc. Page 50
4.5.4 Other Considerations and Deployment Guidelines
For any parking lot that provides EV charging services, the number of parking stalls with access to charging equipment is an important consideration. Ideally, there should be adequate availability of charging stations to support the expected number of EVs visiting the parking lot at any given time. Section 0 recommended a guideline of 15-20% of parking stalls with access to charging infrastructure by the year 2030 based on expected uptake of EVs in the BC Lower Mainland. In order to manage growth of infrastructure leading up to that timeframe, and to prepare for increased adoption beyond 2030, it is recommended to deploy infrastructure in a way that enables scalability and easy expansion based on actual needs. While a deployment of charging infrastructure in 2016 may not be required to support 20% of parking stalls in a given lot, the long term costs of supporting that many stalls in the future can be reduced if the base infrastructure (such as transformers, electrical panels, conduit and wiring) are designed with future expansion in mind. With this base infrastructure in place, additional charging stations can be added at minimal cost as the need arises, based on analysis of utilization of existing stations. In 2014, BC Hydro sponsored the development of the “Canadian Electric Vehicle Infrastructure Deployment Guidelines”. These guidelines cover a broad range of topics that should be considered for any EV charging installation, including:
- Signage - Accessibility requirements - Lighting and shelter - Vandalism - Station layout design
These guidelines are publicly available as a PDF from the BC Hydro website – www.bchydro.com/ev.
RPT0001-01406-D01 EV Technology and Market Overview
Powertech Labs Inc. Page 51
5 SMART GRID TECHNOLOGIES FOR EV CHARGING
“Smart Grid” is a term used to describe a number of technologies and concepts that can optimize the way we generate, deliver and consume electricity. There are a number of emerging Smart Grid technologies and concepts that have the potential to reduce the impact of EV charging on electrical infrastructure, and potentially even turn EVs into valuable assets that provide a net-positive benefit to the grid. The following sections provide a brief overview of some of the most relevant EV applications for smart grid technologies.
5.1 Smart Charging
“Smart Charging” is a term used to describe the optimization of EV charging according to electrical infrastructure conditions. One example of smart charging would be controlling EV charging loads according to the availability of renewable energy, such as wind or solar – flexible loads can be extremely beneficial for accommodating these typically variable sources of energy. In regions like BC that are rich in “firm” hydroelectric resources, smart charging may be most beneficial for addressing capacity constraints by deferring or reducing charging power at certain times. These constraints could be anywhere on the grid, from the generating stations all the way down to local distribution transformers, or even constraints within a site or building.
Figure 32: Diagram highlighting potential impact of EVs on various parts of the grid.
Depending on whether constraints exist on customer-owned assets (such as wiring within a building) or on utility-owned assets, there may be different types of systems and mechanisms to manage charging.
5.1.1 Utility-Interactive Smart Charging
For situations where smart charging is motivated by constraints on the utility’s operations, a utility needs to establish a mechanism that incentivizes their customers to manage their charging loads accordingly.
RPT0001-01406-D01 EV Technology and Market Overview
Powertech Labs Inc. Page 52
Perhaps the simplest such mechanism that’s already in practice today is variable electricity pricing. Either by employing a fixed Time-of-Use (TOU) pricing schedule (common practice), or through Real-Time-Pricing (RTP) that varies on a continual basis (less common), EV drivers can be incentivized to charge their vehicles at times of lowest demand. TOU pricing schedules are communicated to utility customers, and an EV driver can either:
a) Plug their EV in only during off-peak hours; b) Use charge scheduling features built into their EV or EVSE to program charging accordingly; c) Rely on an automated connection between their EV or EVSE and a utility pricing database to optimize
charging schedule automatically. BC Hydro does not employ Time-of-Use pricing, although this is now common practice in a number of other jurisdictions in North America. BC Hydro has announced that an EV-specific tariff is in development, with details expected in late 2016 or early 2017. Some utilities are also exploring “Demand Response” (DR) systems where an EV can respond to signals from the utility and vary charging accordingly. These types of systems may rely on two-way communications between the utility and either the EVSE, the EV or both. The majority of these EV Demand Response programs are at the pilot stage, such as Pacific Gas and Electric and BMW’s “i ChargeForward Program”
37 and FleetCarma and Toronto
Hydro’s “ChargeTO” program38
.
Smart Charging – Utility Interactive
Opportunity: Reduces impact of EV charging on utility assets
Challenges: Need to establish value proposition for EV drivers
Status: Large pilots in progress, broader roll-out dependent on standardized EV-utility interfaces
Ideal application: Residential charging
5.1.2 Local Load Management Smart Charging
For scenarios where a customer may have local load constraints on their own electrical infrastructure, they may be motivated to implement Smart Charging using a local load management system, without the need for advanced, utility-interactive communications. These types of local load constraints become particularly relevant any time a large number of electric vehicles might be charging in the same location, such as in a workplace or fleet vehicle charging scenario. The 2015 Canadian Electrical Code added an allowance for sizing of circuits according to the maximum power allowed by a load management system, and this was adopted in BC in early 2016.
RPT0001-01406-D01 EV Technology and Market Overview
Powertech Labs Inc. Page 53
AddÉnergie Technologies - PowerSharing Systems
AddÉnergie Technologies, a Canadian manufacturer of EV charging equipment, has developed a charging solution specifically designed to address local load constraints. This solution consists of two main components:
1. CoRe+ Level 2 charging stations ($3250 each)
Mounted in pairs, up to 24 stations per installation
Up to 7.2kW each 2. Site Controller (one per installation, provided by AddÉnergie)
Communicates wirelessly with charging stations
Controls maximum power output of each charging station
Minimizes charging impact according to building demand schedule or through integration with building energy management system (eg BACnet)
Provides internet communications for EV driver user management and usage fee options
Figure 34: AddÉnergie's PowerSharing system with building EMS integration
While a single vehicle may charge at up to 7.2kW, the site controller may restrict charging to as low as 1.5kW if many vehicles are charging at the same time, or if it determines that the building is experiencing high overall demand. The approximate impact on charging time for a typical EV would be as follows: Table 14: Impact on charging time for power sharing scenarios
Charging rate Charging time required to
replenish 30km of range (~6kWh)
Charging time required to replenish 120km of range
(~24kWh)
1.5kW 4h 16h
7.2kW 1h 4h
Given typical commuting distances, most drivers would likely be able to receive a full charge by the end of a work day even with significant load management, although higher charging rates can be prioritized for certain drivers based on their specific driving needs.
Figure 33: AddÉnergie CoRe+ Level 2 EVSE
RPT0001-01406-D01 EV Technology and Market Overview
Powertech Labs Inc. Page 54
Scalability Another advantage of this solution is that it allows a charging installation to be expanded in the future as needed to support increasing EV adoption. By installing stations in a “daisy-chain” configuration along a single high-amperage circuit, additional charging stations can be added down the road without the need to add additional circuits, greatly simplifying and reducing the cost of future expansions.
Figure 35: AddÉnergie's PowerSharing system enables expansion of EVSE installations using a daisy chain configuration
In the example above, a 150A circuit is shown expanding from six to eight 40A branch circuits through a daisy-chain configuration (each 40A branch circuit supporting one 7.2kW charging station). This 150A circuit could potentially support up to 24 charging stations, although in practice, AddÉnergie recommends reserving 10A per station (15 stations total in this case) in order to provide a minimum level of charging power for each station. This approach of sharing circuits across multiple charging stations is supported by the 2015 edition of the Canadian Electrical Code, and has been approved for multiple installations in Quebec. ChargePoint – CT4000 Power Sharing ChargePoint’s CT4000 Level 2 charging station
39 also offers the ability to increase the total number
of charging ports supported by a given size of electrical service by sharing a single 40A circuit across two charging ports. The charging station allows each port to charge at full power (7.2kW) if only one vehicle is connected, automatically reducing power by 50% (to 3.6kW) if both ports are in use. This allows a station host to effectively double the number of EVs that can be supported for a given size of electrical capacity, although it would not be as flexible in terms of optimizing a larger group of stations collectively and taking into account overall building demand. More recently, ChargePoint has announced availability of a panel-level load management solution similar to AddÉnergie’s, relying on cloud-based control to manage groups of charging stations on shared infrastructure. This Power Sharing capability is a standard feature of all dual-port CT4000 charging stations (CT402X), with pricing starting at approximately $6000 for a dual port station.
Smart Charging – Local Load Management
Opportunity: Reduces impact of EV charging on local electrical infrastructure
Challenges: Need to establish value proposition for EV drivers
Status: Availability from a limited number of charge station suppliers
Ideal application: Workplace, fleet or public charging facilities supporting multiple EVs in a single location.
RPT0001-01406-D01 EV Technology and Market Overview
Powertech Labs Inc. Page 55
5.2 Vehicle-to-Grid
Vehicle-to-Grid (or “V2G”) is the most common term used to describe the concept of an electric vehicle providing electric power back to the grid. Other terms include “bi-directional charging”, “reverse power flow” and “EV as a distributed energy resource (DER)”. EVs could effectively act as additional sources of generation on the grid, providing valuable services by alleviating peak demands on the grid, or by providing generation that is quicker to respond to changing grid conditions than some less agile types of power plants, thereby improving grid stability. V2G capable vehicles could also provide power during blackout scenarios, an application sometimes referred to as vehicle-to-home (V2H) or vehicle-to-building (V2B) – both typically considered special cases of V2G. Even in non-blackout scenarios, a V2G-capable vehicle could provide power back to a building in a way that offsets the rest of that building’s energy consumption and minimizes its operating costs. Finally, the simplest form of V2G-like capability is for the vehicle to provide power to a stand-alone load, much like a generator that might be used to support power tools out in the field. This might be referred to as vehicle-to-load (V2L).
Figure 37: Nissan's Leaf-to-home system
While the above described services are all likely valuable to either the vehicle owner, building owner or electric utility, it becomes important to consider this value against the cost of providing such services. Unlike Smart Charging, V2G capabilities require significant additional equipment in the form of a DC-to-AC inverter, which may be either built into the vehicle or into a charging station (specifically one that connects to the vehicle through a DC charging port). This equipment is likely on the order of at least $1000-2000. Additionally, while Smart Charging should have little to no impact on battery life, V2G capabilities all involve adding additional usage cycles to the vehicle’s battery. While these additional usage cycles may be small compared to normal use of the vehicle in driving mode depending on the specific V2G application, the impact on battery life must still be considered against the value of V2G services, and automakers must determine how to account for V2G in defining battery warranty parameters, which are currently based solely on calendar life and vehicle odometer readings. For these reasons, V2G has thus far largely remained the subject of small trials and pilot demonstrations. These demonstrations generally require the support of the automaker, as accessing the battery onboard a vehicle for V2G purposes either requires an inverter that is built into the vehicle, or at least vehicle software that permits reverse power flow while connected to a DC station. The only products that have an apparent path to market availability are those that either support backup power functionality (such as Nissan’s “Leaf to Home” system currently being tested in Japan, using a stationary inverter connected to the Leaf’s DC charge port
40) or systems
that can be used to power equipment in remote locations (such as Via Motors’ export power system41
). Both of these applications treat the vehicle as a replacement for a gas-powered generator, and as such may find broader market appeal.
RPT0001-01406-D01 EV Technology and Market Overview
Powertech Labs Inc. Page 56
Figure 38: Export power panel on a VIA Motors V-Trux with 2x120V and 1x240V outlets
Vehicle to Grid
Opportunity: EVs can support electrical infrastructure and provide backup power for power outages
Challenges: Significant additional cost, requires a clear value proposition for EV drivers
Status: Largely limited to research projects and small scale pilot demonstrations.
Ideal application: Fleet vehicles with low utilization, zero-emissions backup power.
5.3 Stationary Energy Storage
While not specifically an Electric Vehicle-specific smart grid technology, stationary energy storage can be particularly useful in accommodating the high electrical loads associated with charging of electric vehicles. Stationary Energy Storage Systems (ESS) often use lithium-ion batteries similar to those that are used to power electric vehicles, although potentially in much larger quantities. The size of an ESS depends entirely on its intended application, and can range anywhere from household units that are the size of a small refrigerator, intended to support rooftop solar power and provide occasional backup power, to utility-scale systems of multiple megawatt-hours that are intended to support grid operations, often built using one or several full-size shipping containers. A few of the most common applications for ESS include:
1. Supporting intermittent renewable energy sources; 2. Providing temporary backup power (duration depends on specifications and
use, but durations of 2 to 20 hours are common); 3. Buffering out intermittent peak loads.
Any of these applications can be accommodated at a wide range of scales simply by scaling the design of the ESS accordingly. For example, peak loads can be accommodated at a grid-scale, with a large, multi-megawatt ESS fulfilling the role of traditional “peaker” power plants that only operate during periods of peak demand. At a much smaller scale, a single DC fast charge station can be supported by a relatively small ESS, minimizing the brief peak load typically seen during the first few minutes of a fast charge session. Similarly, the recently announced Tesla Powerwall 10kWh residential lithium-ion battery can provide a typical home with 6 hours or more of backup power during an outage, while BC Hydro’s 1MW battery system in the Canadian Rockies can power the entire town of Field, BC for 6 hours or more during outages. Energy storage systems of a wide range of sizes are now being deployed in large numbers in certain parts of the world. California in particular has recently seen a considerable surge in energy storage projects, thanks to a state
Figure 39: Tesla Powerwall Residential Battery
RPT0001-01406-D01 EV Technology and Market Overview
Powertech Labs Inc. Page 57
law which requires Californian utilities to procure 1.3 Gigawatts of energy storage capacity (equivalent to about 750,000 Tesla Powerwalls) by 2024, ranging from residential scale home-based batteries up to multi-megawatt transmission-interconnected systems.
42 This law puts an emphasis on cost-effective solutions, and the first rounds
of procurement have already shown signs of an emerging competitive field of technology providers.43
Figure 40: A 500kWh lithium-ion battery system designed and built by Powertech Labs for BCIT's Energy OASIS Project, supporting a 250kW solar canopy over the parking lot, and supplying 2 DCFC and 2 Level 2 EV charging stations.
Stationary Energy Storage
Opportunity: Can reduce impact of EV charging on local electrical infrastructure, support renewable generation, and provide zero-emission backup power.
Challenges: Cost – while volumes are driving costs down, systems typically have an installed cost of around $500-1000 per kWh.
Status: Transitioning from largely research and pilot demonstrations to a more mature commercial market with quickly decreasing costs. Tesla’s recently announced products have a cost as low as $250/kWh, although this does not include installation and supporting infrastructure.
Ideal application: Facilities with constrained electrical infrastructure, high demand from EV charging, large amounts of variable renewable energy, and/or a desire for zero-emissions backup power
RPT0001-01406-D01 EV Technology and Market Overview
Powertech Labs Inc. Page 58
6 EV PROGRAMS AND POLICIES IN BC
British Columbians can benefit from a number of programs and policies that aim to make EVs more affordable, increase access to charging infrastructure, and increase awareness of EVs. These programs are supported by a variety of organizations collaborating under the Plug in BC initiative, including the BC Ministry of Energy and Mines and BC Hydro. The PlugInBC.ca website acts as a hub of information for these programs, as well as a source for anyone looking to learn about EVs in general. This final section of the report provides a brief overview of these programs, as well as a few potential future programs and priorities.
6.1 Vehicle Incentives
The Clean Energy Vehicle for BC Point of Sale Incentive Program provides up to $5000 off the purchase price of qualifying plug-in vehicles for B.C. residents, businesses, non-profit organizations, and local government organizations. The program is managed by the BC Ministry of Energy and Mines, with support from the New Car Dealers Association of BC. The stated goal of the program is to “stimulate the market such that by 2020, 5% of new light duty vehicle purchases in British Columbia are clean energy vehicles”. More information is available here: https://www.cevforbc.ca/ As of March 2016, vehicles with an MSRP of over $77,000 are no longer eligible for the incentive. The actual incentive amounts depend on the vehicle’s battery capacity:
- Between 4kWh and 15kWh: $2,500 - Above 15kWh: $5,000
This is actually the second phase of the CEVforBC purchase incentive, with the first phase having ended in March 2014, and the second phase not launching until a year later. The current phase is slated to run until March 31, 2018 or until funds run out, whichever comes first. The CEVforBC purchase incentive can be combined with the BC SCRAP-IT program, under which an additional $3,250 can be put towards the purchase of a new EV in return for retiring an older vehicle. More information on the BC SCRAP-IT program can be found here: https://scrapit.ca/evprogram/
RPT0001-01406-D01 EV Technology and Market Overview
Powertech Labs Inc. Page 59
6.2 Charging infrastructure
6.2.1 Previous Level 2 Infrastructure Programs
Phase 1 of the BC Clean Energy Vehicle Program supported the deployment of a large number of Level 2 charging stations. In particular, 550 public Level 2 charging stations were installed across BC, primarily under the Community Charging Infrastructure fund. These public Level 2 charging stations represent the bulk of usage data monitored by the evCloud and presented in Section 2.3 of this report. A further 142 Level 2 stations were installed in multi-unit residential and commercial buildings, and incentives were provided for 306 Level 2 stations in single family homes.
6.2.2 Multi-Unit Residential Building Charging Program
In 2016, the BC government and Fraser Basin Council launched the MURB Charging Program, offering support for installation of Level 2 charging infrastructure in existing buildings. Retrofits were specifically targeted, as these can be particularly challenging from both a technical perspective, and in terms of meeting the expectations of a large number of stakeholders in any given building. The program provided 75% of cost up to $4,500 per charge port, and applicants were required to install additional conduit to allow for future expansions. The program was very popular and quickly filled up. More information is available here: http://pluginbc.ca/charging-program/murb/
6.2.3 Fleet Infrastructure Incentive
Also in 2016, the BC government and Fraser Basin Council launched the Fleet Infrastructure Incentive, in conjunction with the Fleet Champion Program, providing support for the installation of charging infrastructure for fleet vehicles. The program provides 33% of costs up to $2000 for the purchase and installation of a Level 2 charging station. More information is available here: http://pluginbc.ca/charging-program/incentives-for-fleets/
6.2.4 DCFC Phase 1
As part of the federally and provincially funded BC EV Smart Infrastructure Project, 30 50kW DC Fast Charge stations were installed across BC between 2013 and 2016 by BC Hydro with support from Powertech Labs. These DCFC stations are monitored by the evCloud data collection platform, and a summary of usage data was provided in Section 2.3 of this report. With the exception of the Bakerview Ecodairy in Abbotsford and the station installed at Powertech Labs, all stations were hosted by municipal or regional governments.
Figure 41: BC DCFC Phase 1 stations - www.chargehub.com
RPT0001-01406-D01 EV Technology and Market Overview
Powertech Labs Inc. Page 60
While the earliest DCFC stations installed under this program supported only the Chademo connector, additional funding provided by the BC government and BMW allowed BC Hydro and Powertech Labs to retrofit most of these early sites with dual-standard DCFC stations. See Section 4.2.2 of this report for a discussion of the DCFC standards landscape.
6.2.5 DCFC Phase 2
During the spring of 2015, the BC government announced funding to support up to 20 additional DCFC stations. Shortly afterwards, Fraser Basin Council conducted a gap analysis to help prioritize locations for future DCFC stations in BC, recommending an EV tourism approach, focusing on heavily populated urban areas with high EV adoption rates while connecting them to neighbouring destinations. In 2016, the federal government, through Natural Resources Canada, provided a funding opportunity to support up to 70 DCFC stations across Canada. In parallel, the BC government conducted a Request for Expressions of Interest from potential Phase 2 DCFC station hosts. Details and timing of the DCFC Phase 2 expansion are expected in late 2016.
RPT0001-01406-D01 EV Technology and Market Overview
Powertech Labs Inc. Page 61
6.3 Building Codes
Building codes can be an extremely effective tool for ensuring access to charging where it’s most valuable and convenient, especially at home. EV infrastructure is much more costly to install as a retrofit as compared to during initial construction, so ensuring that new buildings are built with EVs in mind is an excellent way for governments to reduce barriers for EV adoption.
6.3.1 Vancouver Building Bylaw
Vancouver is the only municipal government in Canada to enforce its own building codes. Vancouver leveraged this mechanism back in 2008 to require that 20% of parking stalls in multi-unit residential buildings and all stalls in houses be “EV ready”, requiring electrical infrastructure necessary to support the future installation of a charging station. This was expanded with a 10% requirement for commercial buildings in 2013. Vancouver is currently developing an electric vehicle infrastructure strategy that will aim to ensure that access to charging is available throughout the city, and this may include further revisions to the Building Bylaw. More information is available here: http://vancouver.ca/streets-transportation/electric-vehicles.aspx
6.3.2 Update to the BC Building Act
While the City of Vancouver is in a special position thanks to its Building Bylaw, the BC government sought to enable other municipalities to enact similar support for EV infrastructure in new buildings with an update to the BC Building Act in 2016
44. Under this update, requirements for EV charging infrastructure in buildings are now
considered “out-of-scope” of the BC Building Act, and this should provide local governments with greater flexibility to enact their own requirements related to EV charging infrastructure.