A B b b o e c m h p o f i P t l w a w o c __ * C # EVALUA Th Abstract The beam po Beam Acceler style pickups t beam. There beam is far fr order to con excitation we correction alg measurements Jefferson La 6 GeV polarize high quality b presently being of 10 new 100 fourth user instrumented Position Monit Figure 1: The antenna the electrodes shaped beamli linear relation with the X and according to rot X rot Y where ௫ and on the geomet constants to ac _____________________________ *Authored by Jeffe Contract No. DE-A # [email protected]ATION AN OF homas Jeffers osition monito rator Facility ( that are used to is a strong n rom the electr nduct beam need to corre gorithm is p from our stret INTROD ab’s CEBAF ac ed electron ma beam to users g upgraded to 0 MeV cryom facility . The with ~600 ¼ tors (Fig. 1). The M20 ¼ w as are rotated 4 from synchrotr ines. Througho nship has been d Y positions c o x o X X k X X of t y of Y Y k Y Y ௬ are geome try of the BPM ccount for any _______________ erson Science Asso AC05-06OR23177 ND CORR F CEBAF M. Spata # son National ors at the Conti (CEBAF) hav o measure the nonlinear respo rical center of experiments a ect for the no resented and ched wire BPM DUCTION ccelerator is a achine that has since 1995. T 12 GeV with modules and th accelerator ¼ wave anten wave antenna-st 45º to the lab ron radiation in out the operatio n assumed for calculated in th ff x ff x X X ff y ff y Y Y Y Y tric scale facto M, ߙ௫ and ߙ௬ difference in g ociates, LLC unde 7 RECTION F BEAM P # , T Allison, l Accelerator inuous Electron e four antenn location of th onse when th the device. In at large orbi onlinearity. Th compared to M test stand. 1497 MHz CW been providing The machine i the installation e addition of beamlines ar nna-style Beam tyle BPM. frame to shield n the racetrack on of CEBAF r these device he rotated fram off off X X (1 off off Y Y (2 ors that depend are calibration gain between a er U.S. DOE N OF THE POSITION K. Cole, J. M r Facility, N n a e e n it he o W g is n a re m d k- a es me 1) 2) d n pair of a strength f antenna si The posi calculated The di position ( displacem compared extent of BPM test Figure 2: X mid-pla BPM T e A surf developed perform in It was dielectric travelling finite con method f substitute systems [ of a singl The wire proper fie E NON-LI N MONIT Musson, J. Y ewport New antennas, ା from each ant ignals with the ition of the b d by a 45º rotat X Y BPM NO ifference/sum see Eq. 1 and ment from the d to the radia the nonlinearit stand and also Plot of the non ane. Linearity h est Stand face wave t d [2] along w n-air tests on C s demonstrate boundary cond wave on the nductivity [3]. for launching for low-loss [4]. The Goub le thin conduct is connected t elds for SW for NEAR DI ORS* Y an ws, VA 23606 ା refer tenna and ା e beam and cali beam in the tion 1 2 rot rot X Y 1 2 rot rot X Y ONLINEAR method of 2) is only accu e center of th al position of ty has been me o simulated usin nlinearity of a holds to about transmission with a precis CEBAF BPMs d by Somm ditions allow f surface of a co Georg Gouba and capturing coaxial micro au Line (G-Li tor coated in a o conical laun rmation and pro ISTORTIO 6, USA. r to the raw ibration signals lab frame is . RITY determining urate when the he device is the antennae easured (Fig. 2 ng Poisson [1] BPM in the ro 8 mm from ce system has sion X-Y sta (Fig. 3). erfeld that c or the existenc oaxial cylinder au first propo g these waves owave transm ine) system co a dielectric ma chers that exci ovide impeden ON signal are s off. then (3) (4) beam beam small e. The 2) on a . tated nter. been ge to certain ce of a r with osed a s as a mission onsists aterial. ite the nce TUPC172 Proceedings of IPAC2011, San Sebastián, Spain 1440 Copyright c ○ 2011 by IPAC’11/EPS-AG — cc Creative Commons Attribution 3.0 (CC BY 3.0) 06 Beam Instrumentation and Feedback T03 Beam Diagnostics and Instrumentation
Transcript
A
B
bboecm
hpofiP
t
lwa
woc
__
*C#
EVALUA
Th
Abstract The beam po
Beam Accelerstyle pickups tbeam. There beam is far frorder to conexcitation we correction algmeasurements
Jefferson La6 GeV polarizehigh quality bpresently beingof 10 new 100fourth user instrumented Position Monit
Figure 1:
The antennathe electrodes shaped beamlilinear relationwith the X andaccording to
osition monitorator Facility (that are used tois a strong nrom the electrnduct beam
need to corregorithm is pfrom our stret
INTRODab’s CEBAF aced electron mabeam to users g upgraded to 0 MeV cryomfacility. The with ~600 ¼tors (Fig. 1).
The M20 ¼ w
as are rotated 4from synchrotr
ines. Throughonship has beend Y positions c
ofx
of
X Xk
X X
offt y
off
Y Yk
Y Y
are geometry of the BPM
ccount for any
_______________
erson Science AssoAC05-06OR23177
ND CORRF CEBAF
M. Spata#
son National
ors at the Conti(CEBAF) havo measure the
nonlinear resporical center of experiments aect for the noresented and ched wire BPM
DUCTION ccelerator is a achine that has
since 1995. T12 GeV with
modules and thaccelerator
¼ wave anten
wave antenna-st
45º to the lab ron radiation in
out the operation assumed forcalculated in th
ff x
ff x
X
X
ff y
ff y
Y Y
Y Y
tric scale factoM, and difference in g
ociates, LLC unde7
RECTIONF BEAM P
#, T Allison, l Accelerator
inuous Electrone four antennlocation of th
onse when thf the device. Inat large orbi
onlinearity. Thcompared to
M test stand.
1497 MHz CWbeen providing
The machine ithe installatione addition of beamlines ar
nna-style Beam
tyle BPM.
frame to shieldn the racetrackon of CEBAF r these devicehe rotated fram
off
off
X
X
(1
off
off
Y
Y
(2
ors that dependare calibrationgain between a
er U.S. DOE
N OF THEPOSITION
K. Cole, J. Mr Facility, N
n a e e n it
he o
W g is n a
re m
d k-a
es me
1)
2)
d n
pair of astrength fantenna siThe posicalculated
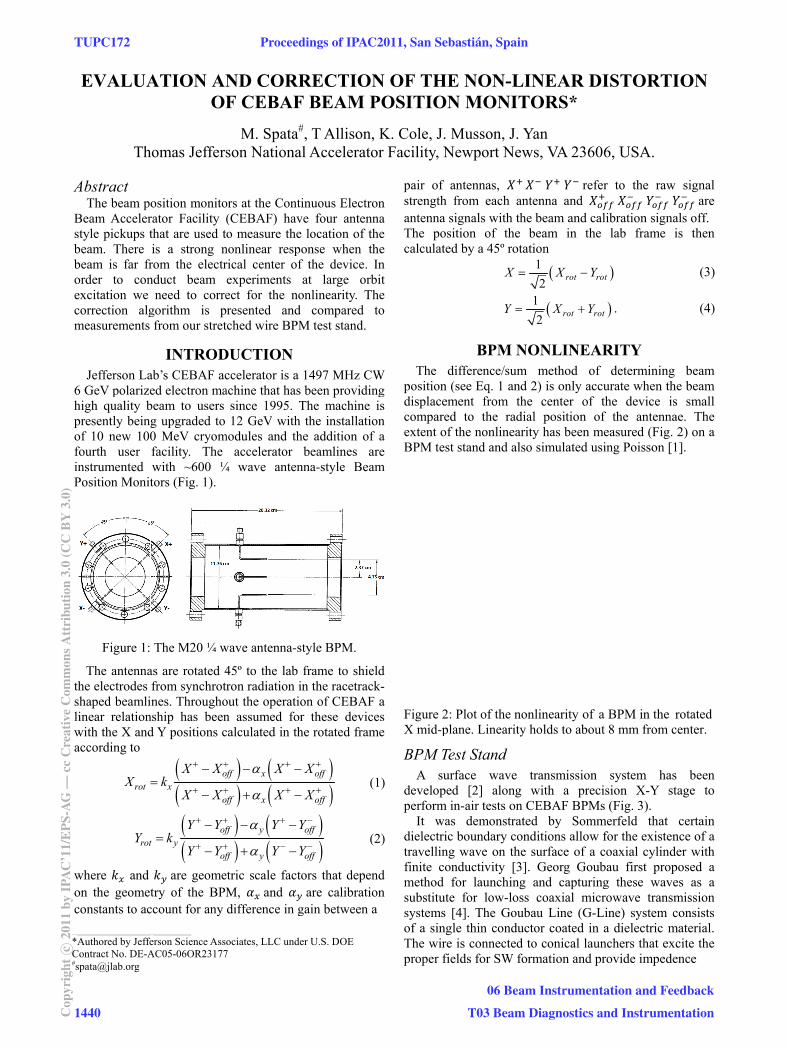
The diposition (displacemcomparedextent ofBPM test
Figure 2: X mid-pla
BPM TeA surf
developedperform in
It wasdielectric travellingfinite conmethod fsubstitute systems [of a singlThe wire proper fie
E NON-LIN MONIT
Musson, J. Yewport New
antennas, from each antignals with theition of the bd by a 45º rotat
X
Y
BPM NOifference/sum see Eq. 1 and
ment from thed to the radiathe nonlinearitstand and also
Plot of the nonane. Linearity h
est Stand face wave td [2] along wn-air tests on Cs demonstrateboundary cond wave on the
nductivity [3].for launching
for low-loss [4]. The Gouble thin conductis connected t
elds for SW for
NEAR DIORS*
Yan ws, VA 23606 refer
tenna and e beam and calibeam in the tion
1
2rot rotX Y
1
2rot rotX Y
ONLINEARmethod of
2) is only accue center of thal position of ty has been meo simulated usin
nlinearity of a holds to about
transmission with a precis
CEBAF BPMs d by Sommditions allow fsurface of a coGeorg Gouba
and capturingcoaxial micro
au Line (G-Litor coated in ao conical launrmation and pro
ISTORTIO
6, USA.
r to the raw ibration signalslab frame is
t
.
RITY determining
urate when the he device is
the antennaeeasured (Fig. 2ng Poisson [1]
BPM in the rot8 mm from ce
system has sion X-Y sta(Fig. 3). erfeld that c
for the existencoaxial cylinderau first propo
g these wavesowave transmine) system coa dielectric machers that exciovide impeden
ON
signal are s off. then
(3)
(4)
beam beam small
e. The 2) on a .
tated nter.
been ge to
certain ce of a r with
osed a s as a
mission onsists aterial. ite the nce
B
TUPC172 Proceedings of IPAC2011, San Sebastián, Spain
1440Cop
yrig
htc
2011
byIP
AC
’11/
EPS
-AG
—cc
Cre
ativ
eC
omm
onsA
ttri
butio
n3.
0(C
CB
Y3.
0)
06 Beam Instrumentation and Feedback
T03 Beam Diagnostics and Instrumentation
Figure 3: BPM test stand showing X-Y stage at right with a mounted BPM. The 160 micron wire stretched between the RF cones at both ends of the system simulates a beam.
matching from the 50 Ω transmission line to the nominal 200 Ω of the single conductor (Fig. 4).
The electron beam is simulated with a #34 AWG enamelled magnet wire which has a diameter of 160 microns and is comparable to typical beam sizes in CEBAF. The wire is soldered to the center conductor of
Figure 4: Conical coaxial launcher for generating a surface travelling wave to simulate an electron beam.
the cones at either end of the test stand. One end is terminated to a 50 Ω load while the other end is connected to an RF source.
The stepper stand is capable of moving the BPM in the horizontal or vertical plane in 10 micron steps and across the full aperture of the BPM. The Test Stand was used to take data on an M20 style BPM across the rotated X mid-plane with 200 micron step size to ±21 mm (Fig. 2). The raw wire data was processed using the difference/sum method and shows that the system behaves linearly to about ±8 mm.
Poisson Model A two-dimensional electrostatic model was developed
using Poisson [5]. A potential of 1 Volt was placed on a single electrode with the outside of the can grounded. The potential map was calculated across the interior of the BPM (Fig. 5). Using Green’s reciprocity theorem [6] we can infer that the simulated voltage at any point within the BPM is simply the voltage that would be induced on the antenna. Potential maps for the other three antennae are generated through rotations using the inherent symmetry of the BPM.
Figure 5: Two-dimensional potential map of the BPM.
A series of points across the X mid-plane were simulated using the potential maps and the difference/sum method. The results are shown in Fig. 2 and compare well with the Stretched Wire Test Stand data. Poisson also predicts that the BPM is linear to about ±8 mm. At large amplitude the nonlinearity of the system is also observed.
CORRECTION OF BPM NONLINEARITY The Poisson model was applied across the full aperture
of the BPM to simulate the nonlinearity within a square grid of points (Fig. 6) between the antennae. For each point within the grid a spline interpolation was performed to calculate the potential on each wire based on the Poisson model. The difference/sum method was then applied using the geometrical constants from the Stretched Wire Test Stand data to create a 2-dimensional map of what would be measured with the linear method.
Proceedings of IPAC2011, San Sebastián, Spain TUPC172
06 Beam Instrumentation and Feedback
T03 Beam Diagnostics and Instrumentation 1441 Cop
yrig
htc
2011
byIP
AC
’11/
EPS
-AG
—cc
Cre
ativ
eC
omm
onsA
ttri
butio
n3.
0(C
CB
Y3.
0)
Figure 6: A 2x2 cm square grid of points for seeding the Poisson simulation.
The simulations were done in the rotated frame which places the antennae at the top, bottom, left and right of the grid. Significant pin cushioning of the linear map is observed (Fig. 7).
Figure 7: Beam position of square grid of points after the difference/sum method is used to calculate the position.
A correction of the distortion is made by generating a pair of two-dimensional polynomials. The square grid of points and the values from the linear method are used to calculate the coefficients in a least squares sense and then applied to the distorted position map. The corrected grid of points is shown in Fig. 8. The precision of the correction is gauged by plotting the absolute value of the difference between the square grid of points and the corrected grid of points (Fig. 9). The method recovers the original grid to better than 100 microns across the entire grid of points.
Figure 8: Corrected grid of points after applying a two-dimensional 11th order polynomial to the linear data.
Figure 9: Colour map showing the precision of the polynomial correction for the X-plane. The Y-plane has similar results.
CONCLUSION The nonlinearity of ¼ wave antenna-style BPMs has
been modelled and measured with good agreement between simulation and test stand data. An algorithm was applied to correct for the instrumental nonlinearity with better than 100 micron precision over a 2x2 cm grid of points.
REFERENCES [1] K. Halbach and R. F. Holsinger, PAC 7 (1976) 213-
222. [2] J. Musson, K. Cole and S. Rubin, PAC09 (2005)
4060-4062. [3] A. Sommerfeld, Ann. Phys. u. Chemie (Neue Folge)
67-1, 233, December, 1899. [4] G. Goubau, Proc. IRE 39 (1951), 619–624 [5] P. Piot, “Evaluation and correction of nonlinear
effects in FNPL beam position monitors”, Internal FNAL note, 2005.
[6] R. Helms and G. Hoffstaetter, PRSTAB 8 062802, 2005.
TUPC172 Proceedings of IPAC2011, San Sebastián, Spain