12
austincc.edu
1 | ACC’S 2015 STUDENT SUCCESS REPORT
austincc.edu

1 | ACC’S 2015 STUDENT SUCCESS REPORT
For more than 40 years, Austin Community College
District has provided affordable, open access to higher
education and training for Central Texans. Today, more
than 41,000 credit students and 15,000 noncredit
students attend ACC to further their education,
learn new job skills, or advance their career.
In recent years, the college has redoubled its efforts
to ensure that this access to higher education is
accompanied by student achievement. The college
has sought to improve student outcomes through a
multi-pronged approach addressing topics including
college-readiness, student persistence, success and
equity, and degree/certificate completion. The efforts
are paying off: Degree, certificate, and other award
completions have risen 71 percent since AY 2010.
ACC has become a top choice for area high school
graduates and a valued partner to local employers.
Meanwhile, studies continue to point to the necessity
for a postsecondary education in today’s workforce.
Increasing the number of students earning a
postsecondary certificate or degree is not only
good for individuals, but also for communities.
ACC has launched several interconnected initiatives
designed to help more students earn a credential that
will lead to gainful employment or university transfer.
These initiatives align with four critical areas of the
student’s college experience:
• Connection, a time when students gain an interest
in college and qualify for enrollment;
• Entry, when students enroll, choose an academic
goal, remediate if necessary, and successfully
complete their gateway college-level courses;
• Progress, when students persist from semester
to semester and receive support as needed; and
• Completion, when students successfully complete
their academic goals and obtain a credential that is
valued in the labor market, or transfer for further
study toward a bachelor’s degree at a university.
This report highlights a few of ACC’s recent
accomplishments in these four areas and provides
a baseline for measuring our progress.
Evaluating 4 Key AreasConnection | Entry | Progress | Completion
ACC’S 2015 STUDENT SUCCESS REPORT | 2
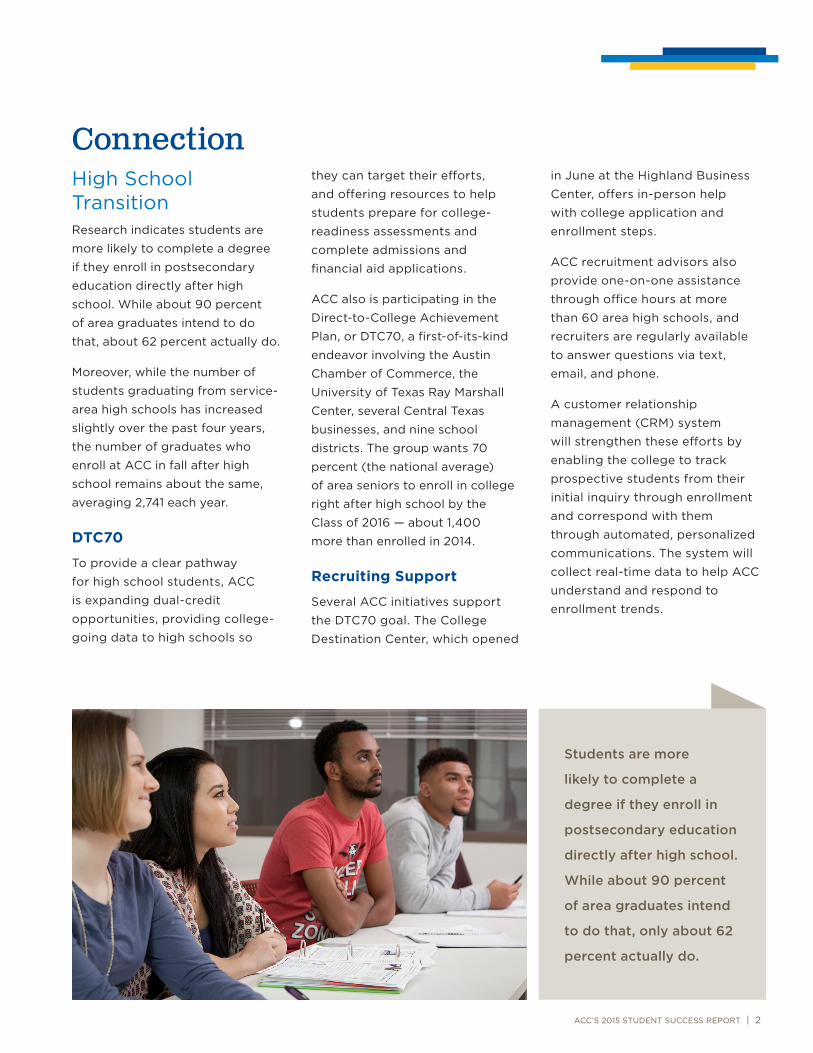
ConnectionHigh School Transition Research indicates students are
more likely to complete a degree
if they enroll in postsecondary
education directly after high
school. While about 90 percent
of area graduates intend to do
that, about 62 percent actually do.
Moreover, while the number of
students graduating from service-
area high schools has increased
slightly over the past four years,
the number of graduates who
enroll at ACC in fall after high
school remains about the same,
averaging 2,741 each year.
DTC70
To provide a clear pathway
for high school students, ACC
is expanding dual-credit
opportunities, providing college-
going data to high schools so
Students are more
likely to complete a
degree if they enroll in
postsecondary education
directly after high school.
While about 90 percent
of area graduates intend
to do that, only about 62
percent actually do.
they can target their efforts,
and offering resources to help
students prepare for college-
readiness assessments and
complete admissions and
financial aid applications.
ACC also is participating in the
Direct-to-College Achievement
Plan, or DTC70, a first-of-its-kind
endeavor involving the Austin
Chamber of Commerce, the
University of Texas Ray Marshall
Center, several Central Texas
businesses, and nine school
districts. The group wants 70
percent (the national average)
of area seniors to enroll in college
right after high school by the
Class of 2016 — about 1,400
more than enrolled in 2014.
Recruiting Support
Several ACC initiatives support
the DTC70 goal. The College
Destination Center, which opened
in June at the Highland Business
Center, offers in-person help
with college application and
enrollment steps.
ACC recruitment advisors also
provide one-on-one assistance
through office hours at more
than 60 area high schools, and
recruiters are regularly available
to answer questions via text,
email, and phone.
A customer relationship
management (CRM) system
will strengthen these efforts by
enabling the college to track
prospective students from their
initial inquiry through enrollment
and correspond with them
through automated, personalized
communications. The system will
collect real-time data to help ACC
understand and respond to
enrollment trends.
3 | ACC’S 2015 STUDENT SUCCESS REPORT
High School ProgramsACC offers several options that
enable high school students to earn
credits toward a college degree.
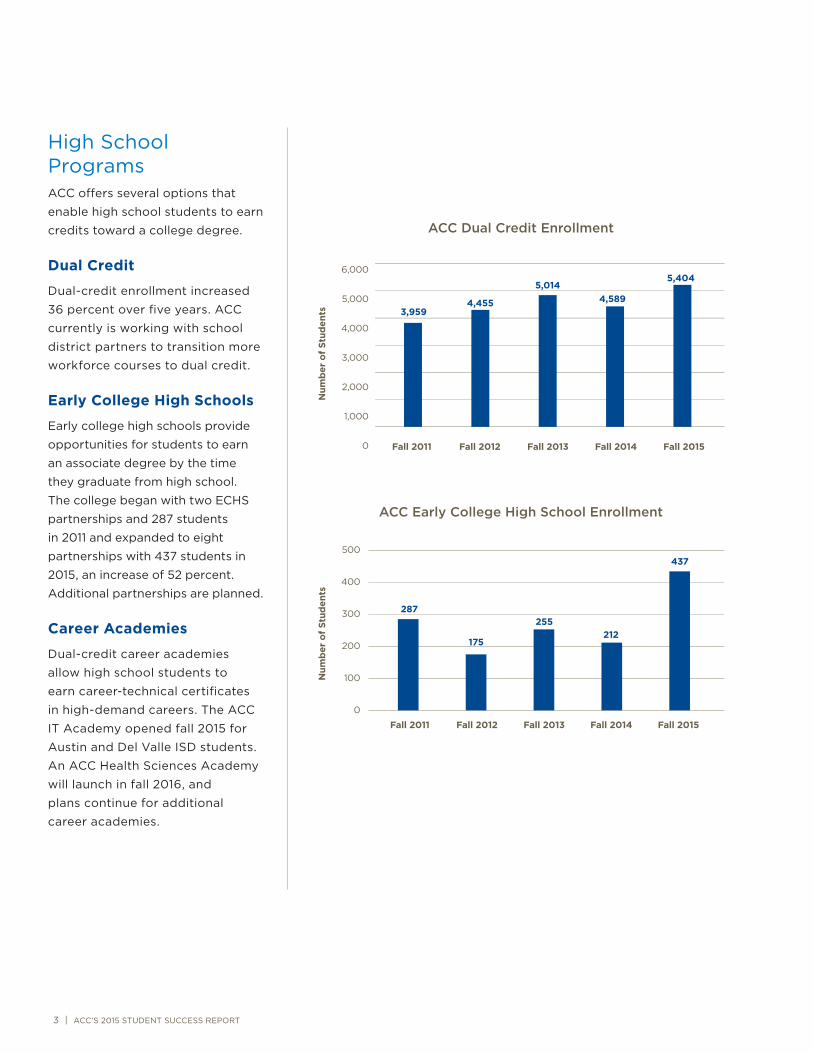
Dual Credit
Dual-credit enrollment increased
36 percent over five years. ACC
currently is working with school
district partners to transition more
workforce courses to dual credit.
Early College High Schools
Early college high schools provide
opportunities for students to earn
an associate degree by the time
they graduate from high school.
The college began with two ECHS
partnerships and 287 students
in 2011 and expanded to eight
partnerships with 437 students in
2015, an increase of 52 percent.
Additional partnerships are planned.
Career Academies
Dual-credit career academies
allow high school students to
earn career-technical certificates
in high-demand careers. The ACC
IT Academy opened fall 2015 for
Austin and Del Valle ISD students.
An ACC Health Sciences Academy
will launch in fall 2016, and
plans continue for additional
career academies.
ACC Dual Credit Enrollment
6,000
5,000
4,000
3,000
2,000
1,000
0 Fall 2011 Fall 2012 Fall 2013 Fall 2014 Fall 2015
4,4553,959
5,0144,589
5,404
Num
ber
of
Stud
ents
500
400
300
200
100
0
437
212255
175
287
Fall 2011 Fall 2012 Fall 2013 Fall 2014 Fall 2015
ACC Early College High School Enrollment
Num
ber
of
Stud
ents
ACC Dual Credit Enrollment
ACC Early College High School Enrollment
ACC’S 2015 STUDENT SUCCESS REPORT | 4
Adult Basic EducationACC provides Adult Basic
Education (ABE) programs for
area residents with less than a high
school education. Two primary
ABE programs are GED Preparation
and English as a Second Language
(ESL). The Adult Education Division
also offers the Career Pathways
and Transitions programs to
expand students’ access to career
training and college transition
support respectively.
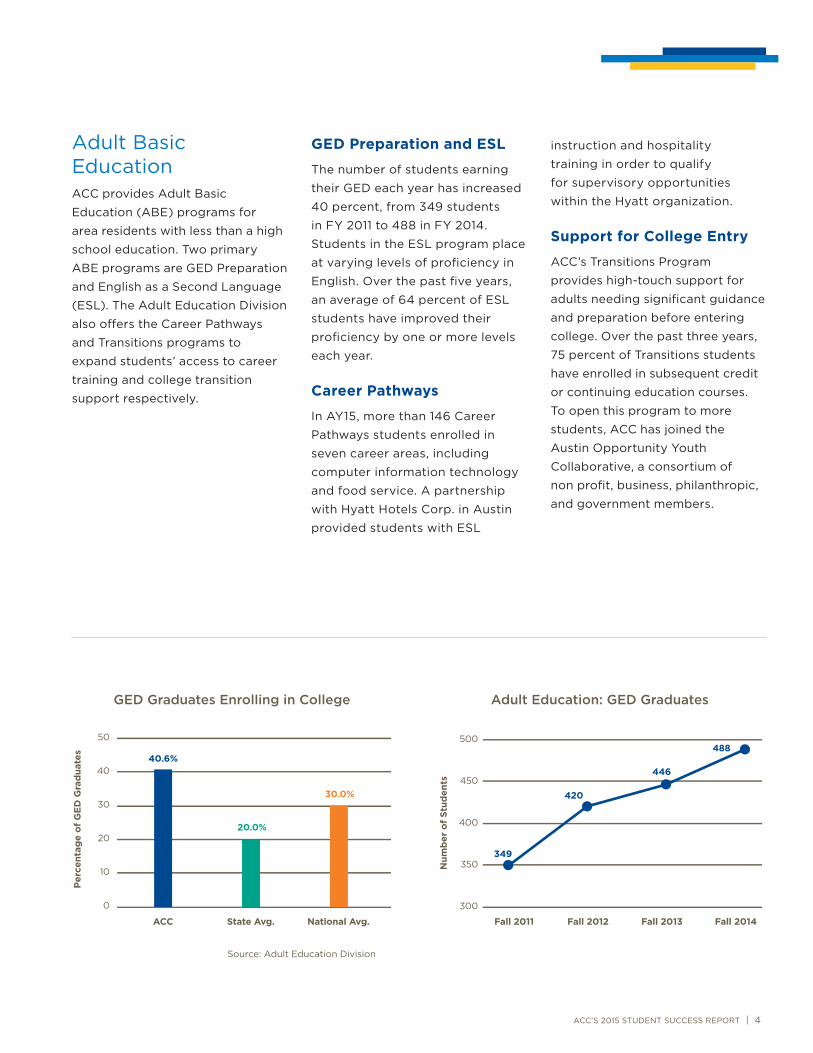
Adult Education: GED GraduatesGED Graduates Enrolling in College
GED Preparation and ESL
The number of students earning
their GED each year has increased
40 percent, from 349 students
in FY 2011 to 488 in FY 2014.
Students in the ESL program place
at varying levels of proficiency in
English. Over the past five years,
an average of 64 percent of ESL
students have improved their
proficiency by one or more levels
each year.
Career Pathways
In AY15, more than 146 Career
Pathways students enrolled in
seven career areas, including
computer information technology
and food service. A partnership
with Hyatt Hotels Corp. in Austin
provided students with ESL
instruction and hospitality
training in order to qualify
for supervisory opportunities
within the Hyatt organization.
Support for College Entry
ACC’s Transitions Program
provides high-touch support for
adults needing significant guidance
and preparation before entering
college. Over the past three years,
75 percent of Transitions students
have enrolled in subsequent credit
or continuing education courses.
To open this program to more
students, ACC has joined the
Austin Opportunity Youth
Collaborative, a consortium of
non profit, business, philanthropic,
and government members.
State Avg.ACC National Avg.
Perc
enta
ge
of G
ED
Gra
dua
tes
50
40
30
20
10
0
40.6%
20.0%
30.0%
Source: Adult Education Division
Num
ber
of
Stud
ents
Fall 2012Fall 2011 Fall 2013 Fall 2014
349
420
446
488500
450
400
350
300

5 | ACC’S 2015 STUDENT SUCCESS REPORT
EntryOverall EnrollmentCommunity college enrollments
are significantly impacted by
economic trends: The number
of students enrolling in ACC
credit classes reached record
levels in 2011 at the height of the
economic recession, then declined
as the economy recovered.
Preliminary fall 2015 enrollment
data suggest enrollments again
are increasing, indicating a return
to enrollment growth, even at a
time of high employment.
Required RemediationThe percentage of first-time-in-
college (FTIC) students* requiring
developmental courses in reading,
writing, or mathematics decreased
between fall 2010 and fall 2014.
Developmental math, typically
the largest segment, saw a 14
percentage-point decrease in
the number of FTIC students —
indicating more students were better
prepared for college math courses.
*The Integrated Postsecondary Education Data System defines FTIC as a student with no prior postsecondary experience attending any institution for the first time at the undergraduate level.
Developmental EducationSuccessful grades earned in
developmental reading, writing,
and math showed an average
increase of about 3 percent from
fall 2010 to fall 2014. The largest
increase was in developmental
writing, which increased 29 percent.
Developmental math successful
completions increased almost
8 percent over five years.
Developmental reading increased
about 7 percent.
Fall Enrollment in Credit Courses(o�cial reporting date)
50,000
40,000
30,000
20,000
10,000
0Fall 2011 Fall 2012 Fall 2013 Fall 2014 Fall 2015
43,31545,10041,627 40,949 41,574
Num
ber
of
Stud
ents
0%
20%
30%
10%
40%
50%
Mandated in DevEd: Math
Mandated in DevEd: Reading
Mandated in DevEd: Writing
Not College Ready (Mandated in one or more DevEd subjects)
Fall 2011 Fall 2012 Fall 2013 Fall 2014Fall 2010
Students Requiring DevEd - FTIC Credential Seeking Students(IPEDS Definition) Mandated to DevEd Subjects
11%13%
15%16%15%
7%
11%12%11%10%
26%29%
35%34%
40%30%
33%
40%39%
44%
Perc
enta
ge
of S
tud
ents
Students Requiring DevEd - FTIC Credential-Seeking Students (IPEDS Definition) Mandated to Dev Ed Subjects
Fall Enrollment in Credit Courses (official reporting date)
Successful Developmental Course Completions
40%
50%
60%
70%
80%
Fall 2010
DevEd Math DevEd Writing DevEd Reading
Fall 2012Fall 2011 Fall 2014Fall 2013
Successful Course completions: Developmental Courses by Subject
65.77% 68.80% 68.80%65.00%
57.30%58.30%
48.44%
69.70%
53.85%
51.56%
53.71%
53.50% 51.50%
55.50%
70.30%
Perc
ent
Succ
essf
ul G
rad
es (
A, B
, C &
S)

ACC’S 2015 STUDENT SUCCESS REPORT | 6
Developmental MathematicsACC has introduced courses
to improve achievement in
developmental math, a common
barrier to student success. These
include Developing Mathematical
Thinking (MATD 0385), Basic Math
with Study Skills (MATD 0332),
and Developmental Mathematics
(MATD 0421).
MATD 0385/0332
Since 2011, about 80 percent
of students in MATD 0385
(introduced in 2009) earned an
A, B, or C. About 54 percent of
students in MATD 0332 have earned
passing grades since the course was
introduced in 2013. These compare
to pass rates of 47 percent for
traditional developmental math
courses. Preliminary data also
suggest the gap in success rates
between students of different
ethnicities/races is narrowing.
MATD 0421
MATD 0421, introduced in fall 2014,
uses a modular approach that lets
students progress through
coursework at a faster pace. It is
taught in the ACC Highland Campus
ACCelerator, a 604-station
computer lab in which students
have access to instructors, tutors,
and academic coaches. In fall 2014,
about 80 percent of MATD 0421
students received a passing grade
of A, B, or C, compared with 47
percent of students in traditional
developmental math courses.
Further, preliminary data indicate
that MATD 0421 students are less
likely to withdraw from the course
than those in traditional
developmental math courses
(10 percent versus 22 percent).
MATD 0421 Successful Completions vs. Other MATD Courses
MATD 0332 Successful Course Completions
Fall 2013 Fall 201410%
40%
30%
50%
60%
70%
80%
20%
Successful Course completions: MATD-0332Basic Math with Collaborative Learning (by Ethnicity/Race)
60.0%
70.4%
56.0%58.1%
48.9%
18.2%
56.1%
52.1%
Perc
ent
Succ
essf
ul G
rad
es (
A, B
, C &
S)
OtherHispanicBlackWhite
70%
60%
80%
90%
50%
40%
100%
Fall 2011 Fall 2012 Fall 2013 Fall 2014Fall 2010
Successful Course completions: MATD-0385 Developing Mathematical Thinking (by Ethnicity/Race)
Perc
ent
Succ
essf
ul G
rad
es (
A,B
,C&
S)
OtherHispanicBlackWhite
91.1%
85.3%82.7%83.1%
79.3%
70.0%
50.0%
73.3%
81.3%
64.5%
75.0%74.4% 75.0%
71.9%
72.3%
75.0%
88.0%
80.4%
77.7%
81.9%
0%
20%
45%
60%
80%
100%
MATD (0330, 0370, 0390)Fall 2014
MATD 0421Fall 2014
MATD-0421 vs. All Other MATD CoursesSuccessful Course Completions:
80.1%
47.3%
Perc
ent
Succ
essf
ul G
rad
es (
A, B
, C &
S)
MATD 0421 includes 12 objectives that cover the material traditionally offered in three courses: MATD 0330, MATD 0370, and MATD 0390 (with each course represented by four objectives within the total of 12).
Because Asian students are a small segment of students in these courses, they are included in the category “Other.”
MATD 0385 Successful Course Completions
7 | ACC’S 2015 STUDENT SUCCESS REPORT
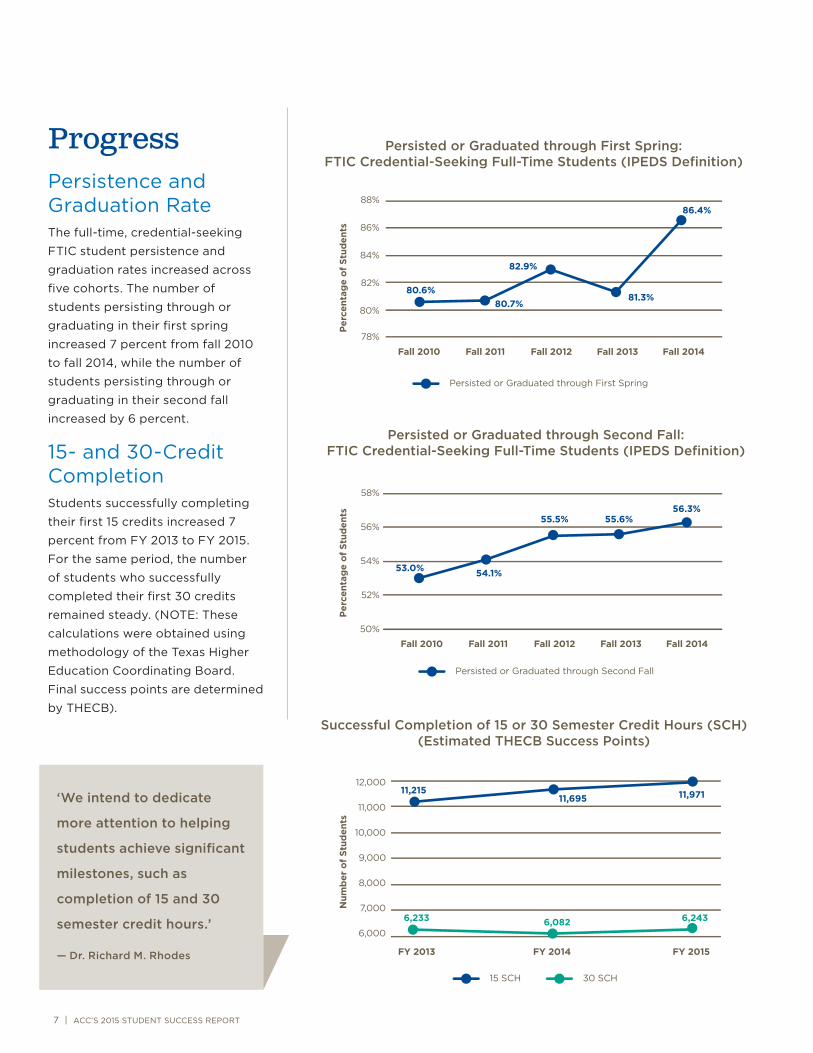
ProgressPersistence and Graduation RateThe full-time, credential-seeking
FTIC student persistence and
graduation rates increased across
five cohorts. The number of
students persisting through or
graduating in their first spring
increased 7 percent from fall 2010
to fall 2014, while the number of
students persisting through or
graduating in their second fall
increased by 6 percent.
15- and 30-Credit CompletionStudents successfully completing
their first 15 credits increased 7
percent from FY 2013 to FY 2015.
For the same period, the number
of students who successfully
completed their first 30 credits
remained steady. (NOTE: These
calculations were obtained using
methodology of the Texas Higher
Education Coordinating Board.
Final success points are determined
by THECB).
FY 2013 FY 2014 FY 2015
6,000
8,000
9,000
10,000
11,000
12,000
7,000
Successful Completion of 15 or 30 Semester Credit Hours (SCH) (Estimated THECB Success Points)
11,21511,695 11,971
6,233 6,082 6,243
Num
ber
of
Stud
ents
15 SCH 30 SCH
Fall 2011Fall 2010 Fall 2012 Fall 2013 Fall 2014
80%
78%
88%
86%
84%
82%
Persisted or Graduated through First Spring:FTIC Credential Seeking Full-Time Students (IPEDS Definition)
82.9%
80.6%81.3%
86.4%
80.7%
Perc
enta
ge
of S
tud
ents
Persisted or Graduated through First Spring
Persisted or Graduated through Second Fall:FTIC Credential Seeking Full-Time Students (IPEDS Definition)
50%
52%
54%
56%
58%
55.5% 55.6%56.3%
53.0% 54.1%
Perc
enta
ge
of S
tud
ents
Fall 2011Fall 2010 Fall 2012 Fall 2013 Fall 2014
Persisted or Graduated through Second Fall
Persisted or Graduated through First Spring:FTIC Credential-Seeking Full-Time Students (IPEDS Definition)
Persisted or Graduated through Second Fall:FTIC Credential-Seeking Full-Time Students (IPEDS Definition)
Successful Completion of 15 or 30 Semester Credit Hours (SCH) (Estimated THECB Success Points)
‘We intend to dedicate
more attention to helping
students achieve significant
milestones, such as
completion of 15 and 30
semester credit hours.’
— Dr. Richard M. Rhodes
ACC’S 2015 STUDENT SUCCESS REPORT | 8
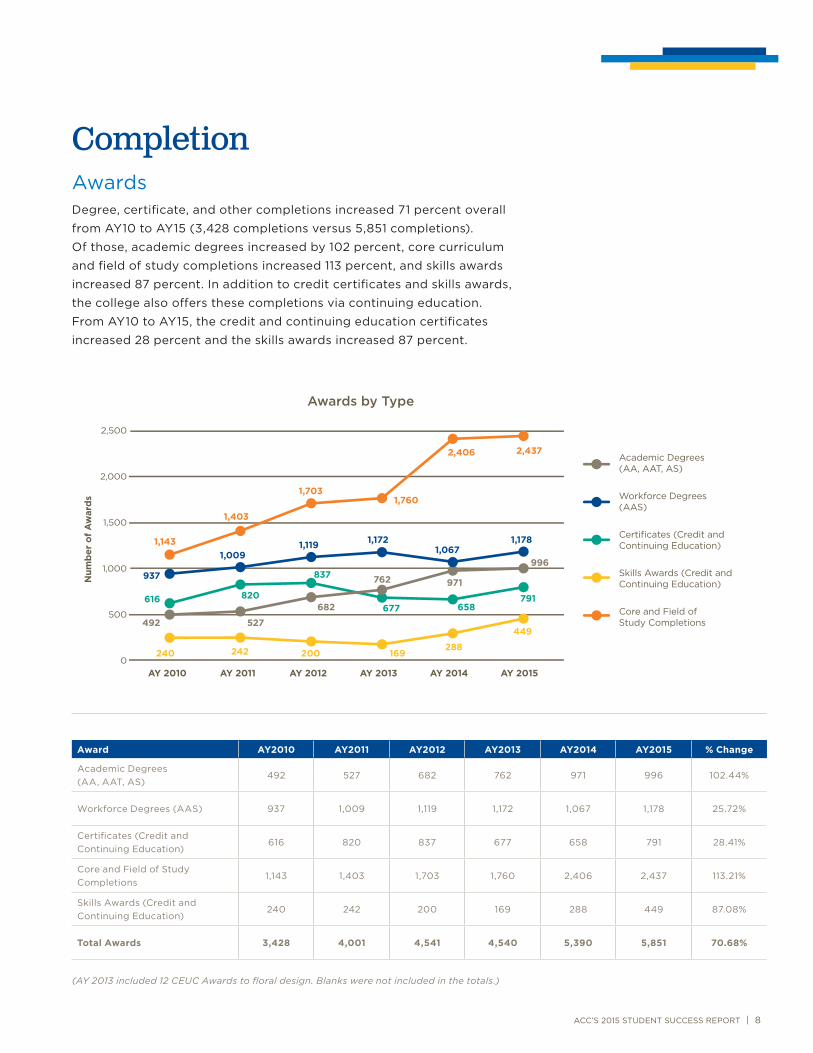
CompletionAwards Degree, certificate, and other completions increased 71 percent overall
from AY10 to AY15 (3,428 completions versus 5,851 completions).
Of those, academic degrees increased by 102 percent, core curriculum
and field of study completions increased 113 percent, and skills awards
increased 87 percent. In addition to credit certificates and skills awards,
the college also offers these completions via continuing education.
From AY10 to AY15, the credit and continuing education certificates
increased 28 percent and the skills awards increased 87 percent.
Award AY2010 AY2011 AY2012 AY2013 AY2014 AY2015 % Change
Academic Degrees (AA, AAT, AS)
492 527 682 762 971 996 102.44%
Workforce Degrees (AAS) 937 1,009 1,119 1,172 1,067 1,178 25.72%
Certificates (Credit and Continuing Education)
616 820 837 677 658 791 28.41%
Core and Field of Study Completions
1,143 1,403 1,703 1,760 2,406 2,437 113.21%
Skills Awards (Credit and Continuing Education)
240 242 200 169 288 449 87.08%
Total Awards 3,428 4,001 4,541 4,540 5,390 5,851 70.68%
(AY 2013 included 12 CEUC Awards to floral design. Blanks were not included in the totals.)
Awards by Type
0
500
1,000
1,500
2,000
2,500
AY 2011AY 2010 AY 2012 AY 2013 AY 2014 AY 2015
Awards by Type
2,437
616
937
1,143
1,403
1,7031,760
2,406
1,0091,119 1,172
1,0671,178
820
837
677 658791
240
492 527
682
762 971
996
242 200 169288
449
Num
ber
of
Aw
ard
s
Academic Degrees (AA, AAT, AS)
Certificates (Credit and Continuing Education)
Core and Field of Study Completions
Skills Awards (Credit and Continuing Education)
Workforce Degrees(AAS)
9 | ACC’S 2015 STUDENT SUCCESS REPORT
Transfer to a 4-Year InstitutionThe number of ACC students
transferring to four-year
institutions remained constant —
approximately 3,300 students
each year — as did the proportion
of credits they earned from fall
2011 to fall 2013. On average, 36
percent of students earned fewer
than 30 ACC credits before
transferring; 21 percent earned
31-45 ACC credits, and 44 percent
earned more than 45 ACC credits.
University Co-enrollmentACC launched co-enrollment
programs with the University of
Texas at Austin and Texas State
University. Participating students
take most of their courses at ACC
Licensure Exam Passing Rates 2011-12 2012-13 2013-14
Program Number Tested
Percent Passed
Number Tested
Percent Passed
Number Tested
Percent Passed
Criminal Justice 22 100% 24 100% 24 100%
Dental Hygiene 17 100% 14 100% 17 100%
Emergency Medical Services 63 100% 47 100% 37 100%
Firefighter 56 100% 29 100% 43 100%
Massage Therapy 8 100% 11 91% 8 100%
Medical Laboratory Technology 13 92% 19 95% 12 100%
Nursing (Professional) 280 99% 254 98% 207 100%
Nursing (Vocational) 84 94% 53 100% 56 100%
Occupational Therapy Assistant 20 95% 16 100% 16 100%
Pharmacy Technician 36 100% 31 100% 35 100%
Physical Therapy Assistant 16 100% 18 100% 19 100%
Professional Accountant 4 100% 3 100% 3 100%
Radiology 35 100% 46 100% 32 100%
Real Estate 34 100% 14 100% 27 100%
Sonography 20 100% 22 100% 20 100%
Surgical Technology 31 90% 30 90% 31 94%
‘Without ACC, I may not
have advanced my
education past high school.’
— Jeremy Dertien, graduate
student, Colorado State University
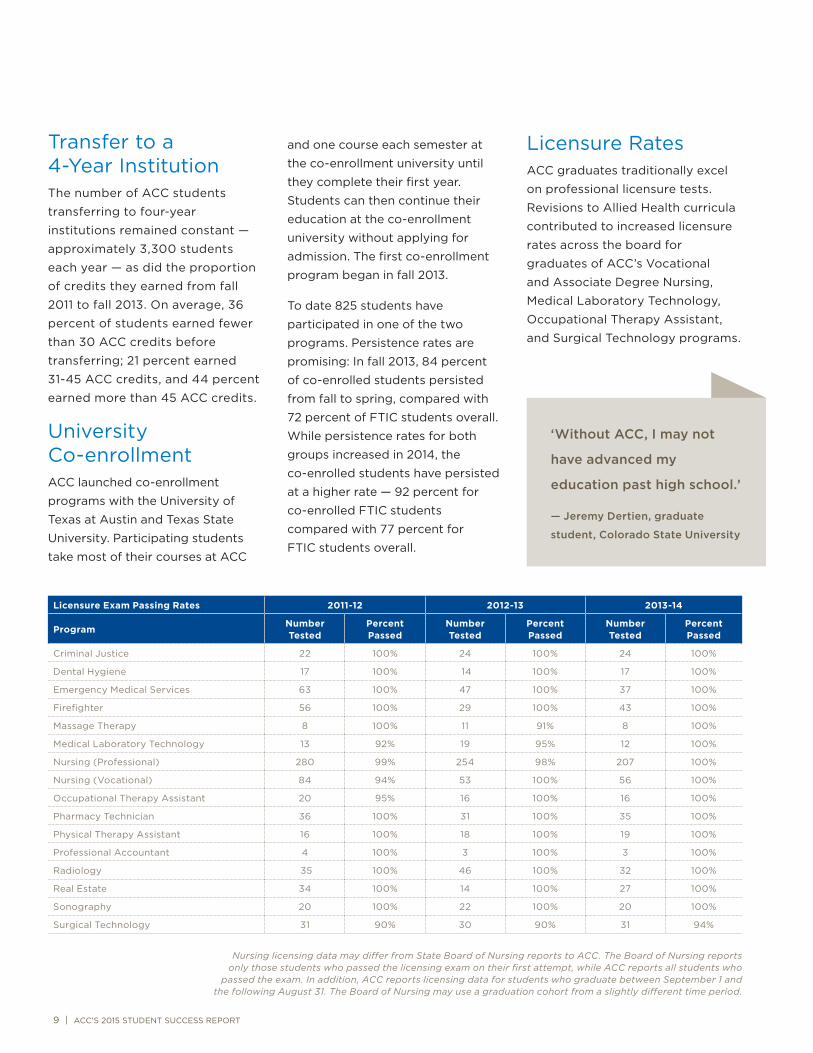
Nursing licensing data may differ from State Board of Nursing reports to ACC. The Board of Nursing reports only those students who passed the licensing exam on their first attempt, while ACC reports all students who
passed the exam. In addition, ACC reports licensing data for students who graduate between September 1 and the following August 31. The Board of Nursing may use a graduation cohort from a slightly different time period.
and one course each semester at
the co-enrollment university until
they complete their first year.
Students can then continue their
education at the co-enrollment
university without applying for
admission. The first co-enrollment
program began in fall 2013.
To date 825 students have
participated in one of the two
programs. Persistence rates are
promising: In fall 2013, 84 percent
of co-enrolled students persisted
from fall to spring, compared with
72 percent of FTIC students overall.
While persistence rates for both
groups increased in 2014, the
co-enrolled students have persisted
at a higher rate — 92 percent for
co-enrolled FTIC students
compared with 77 percent for
FTIC students overall.
Licensure RatesACC graduates traditionally excel
on professional licensure tests.
Revisions to Allied Health curricula
contributed to increased licensure
rates across the board for
graduates of ACC’s Vocational
and Associate Degree Nursing,
Medical Laboratory Technology,
Occupational Therapy Assistant,
and Surgical Technology programs.
ACC’S 2015 STUDENT SUCCESS REPORT | 10
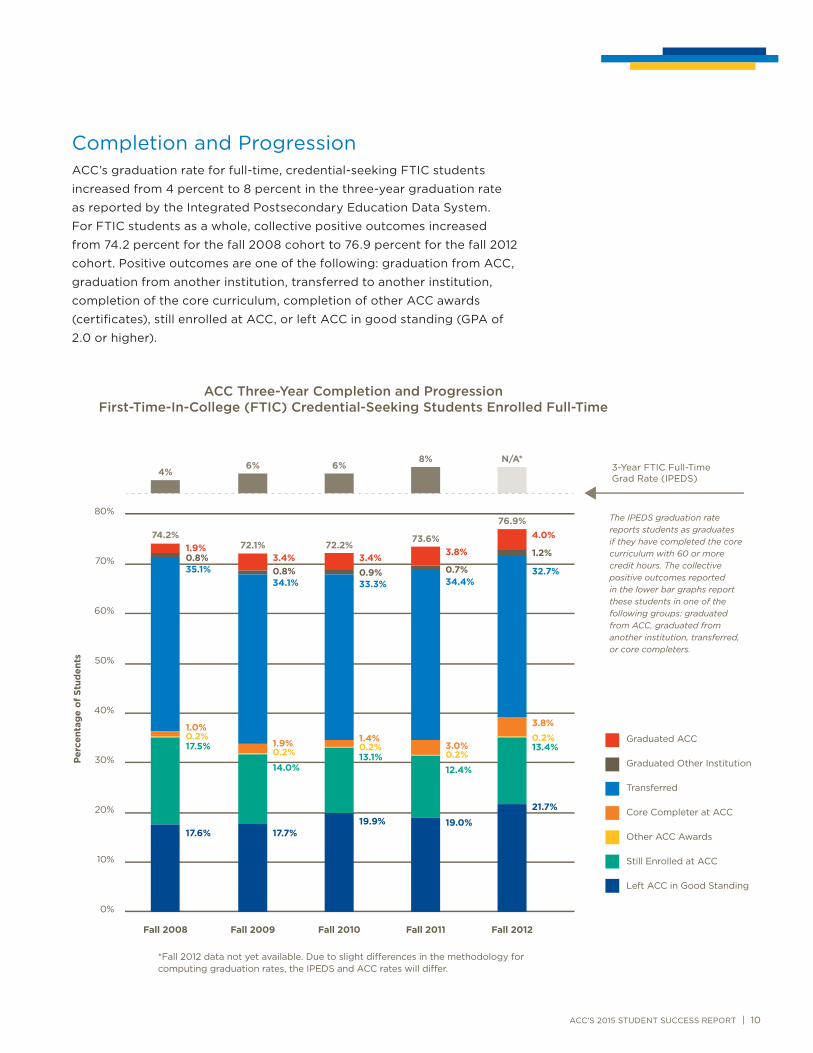
Completion and ProgressionACC’s graduation rate for full-time, credential-seeking FTIC students
increased from 4 percent to 8 percent in the three-year graduation rate
as reported by the Integrated Postsecondary Education Data System.
For FTIC students as a whole, collective positive outcomes increased
from 74.2 percent for the fall 2008 cohort to 76.9 percent for the fall 2012
cohort. Positive outcomes are one of the following: graduation from ACC,
graduation from another institution, transferred to another institution,
completion of the core curriculum, completion of other ACC awards
(certificates), still enrolled at ACC, or left ACC in good standing (GPA of
2.0 or higher).
Perc
enta
ge
of S
tud
ents
0%
20%
30%
40%
50%
60%
70%
80%
10%
ACC Six-Year Completion and Progression First-Time-In-College (FTIC) Credential-Seeking Students Enrolled Full-Time
Fall 2011Fall 2010Fall 2009Fall 2008
*Fall 2012 data not yet available. Due to slight di�erences in the methodology for computing graduation rates, the IPEDS and ACC rates will di�er.
Graduated ACC
3-Year FTIC Full-Time Grad Rate (IPEDS)
Graduated Other Institution
Transferred
Core Completer at ACC
Other ACC Awards
Still Enrolled at ACC
Left ACC in Good Standing
Fall 2012
N/A*
76.9%
21.7%
13.4%0.2%3.8%
32.7%
1.2%
4.0%
8%
73.6%
19.0%
12.4%0.2%3.0%
34.4%0.7%
3.8%
6%
72.2%
19.9%
13.1%0.2%1.4%
33.3%0.9%3.4%
6%
72.1%
17.7%
14.0%
0.2%1.9%
34.1%0.8%3.4%
74.2%
4%
17.6%
17.5%0.2%1.0%
35.1%0.8%1.9%
The IPEDS graduation rate reports students as graduates if they have completed the core curriculum with 60 or more credit hours. The collective positive outcomes reported in the lower bar graphs report these students in one of the following groups: graduated from ACC, graduated from another institution, transferred, or core completers.
ACC Three-Year Completion and Progression First-Time-In-College (FTIC) Credential-Seeking Students Enrolled Full-Time

11 | ACC’S 2015 STUDENT SUCCESS REPORT
austincc.edu
What’s NextACC’s degree/certificate completion rate remains below state and
national averages, a disconcerting data point that does not reflect the
college’s commitment to institutional excellence and one that demands
a bold response. Below are two initiatives that address the concern.
Guided PathwaysThe Futures Institute, composed of 24 faculty, staff, and students selected
from more than 100 internal applicants, is developing a proposal to
restructure college programs and services into guided pathways that
support on-time degree and certificate completion. In fall 2015 Futures
Institute members are researching pathway models at leading colleges.
In spring 2016 they will work with the college community to convert their
recommendations into a strategic, measurable plan that will begin
implementation in fall 2016.
Required Student Success CourseStarting in fall 2015, the college began phasing in a new student success
course requirement for credit students who entered ACC with fewer than
12 transferable college level credits. By fall 2016, the requirement will extend
to all new students with fewer than 12 transferable credits. Most students will
take Effective Learning: Strategies for College Success (EDUC 1300 or EDUC
1100), a course designed to teach students the latest theories and strategies
for effective learning and introduce them to tools and services for career
exploration and college success.
The Futures Institute is
exploring options for
grouping ACC programs
into ‘guided pathways’
that are supported by
services and activities
designed to keep students
on track to graduate.


