Forest Qua lity more valuable trees FWPA Project PNC325-1314: Evaluating and modelling radiata pine wood quality in the Murray valley region Geoff Downes Forest Quality Pty. Ltd. Dave Drew Forest Forecasting Validation and development of eCambium within an evaluation of Pinus radiata wood variability in the Murray Valley Basin Jul 2014 – Aug 2016
Transcript
Forest Qualitymore valuable trees
Forest Qualitymore valuable trees
FWPA Project PNC325-1314: Evaluating and modelling radiata pine wood quality in the
Murray valley region
Geoff DownesForest Quality Pty. Ltd.
Dave DrewForest Forecasting
Validation and development of eCambium within an evaluation of Pinus
radiata wood variability in the Murray Valley Basin
Jul 2014 – Aug 2016
Forest Qualitymore valuable trees
Wealth from forestry
• The ability to turn sunlight into product and add value to it.
• eCambium predictions made 4 months before logs were harvested
• Partly dependent on grade thresholds for converting MOE into grade
y = 0.41x + 239.37R² = 0.62
$225
$250
$275
$300
$325
$350
$375
$400
$425
$225 $250 $275 $300 $325 $350 $375 $400 $425
Act
ual c
alcu
late
d va
lue
$/m
3
eCambium predicted $/m3
VicNSW
Bago cpt 66 high elevation
Forest Qualitymore valuable trees
eCambium’s prediction of log MOE
• eCambium predictions made 4 months before logs were harvested
y = 1.01xR² = 0.50
6
7
8
9
10
11
12
13
14
6 7 8 9 10 11 12 13 14
Mea
n lo
g M
OE
(GPa
)
eCambium predicted BH MOE (GPa)
Vic
NSW
Bg066
Me111
Hv013a
Forest Qualitymore valuable trees
Overview of eCambium (Version 2)
• eCambium predictions of wood variation link effects of growth on board volume and quality
Forest Qualitymore valuable trees
Drilling down into the lower level values
• Daily predictions of
• Wood density• MFA• Fibre diameter• Fibre wall
thickness
Forest Qualitymore valuable trees
Tree growth predictions
Predictions of• Height• DBH• Stand Volume• Soil water
availability• Predawn water
potential
Forest Qualitymore valuable trees
eCambium’s main user interface
Forest Qualitymore valuable trees
Defining site
Forest Qualitymore valuable trees
Defining regime
Forest Qualitymore valuable trees
Defining weather
Forest Qualitymore valuable trees
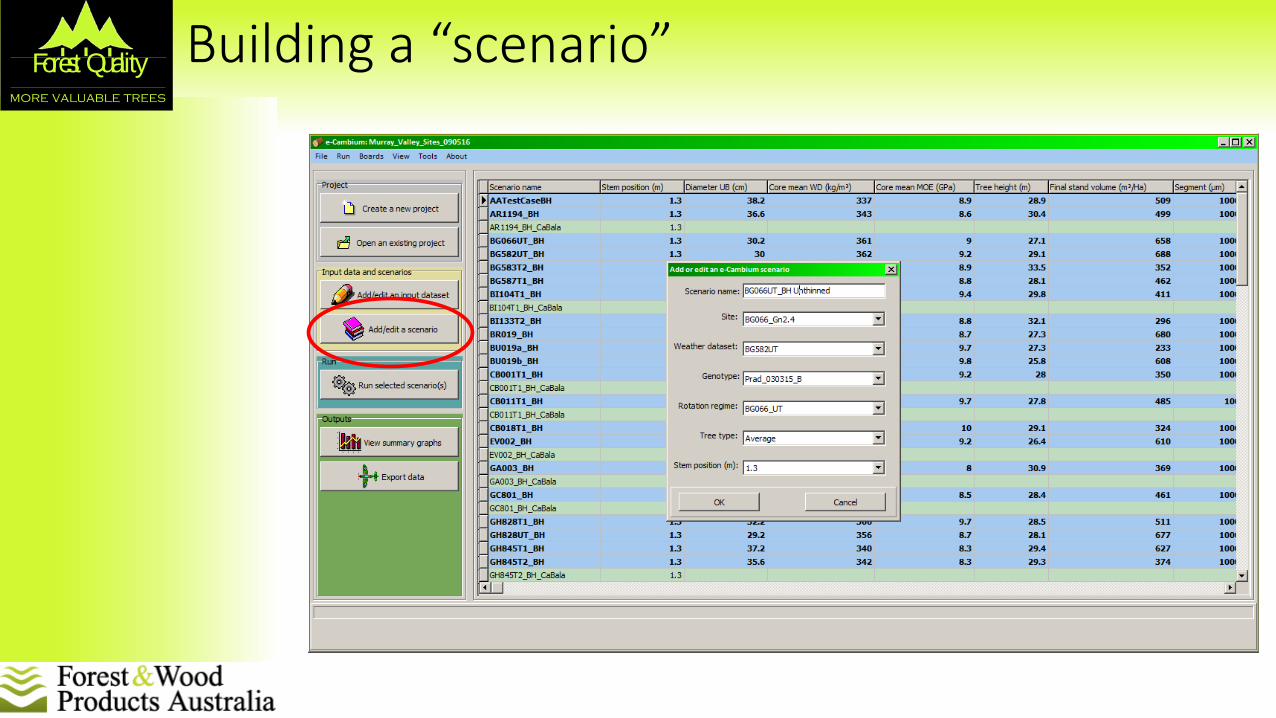
Building a “scenario”
Forest Qualitymore valuable trees
Murray Valley Basin ValidationProject Objectives•Regional assessment of wood property variation from P.radiata sites in the Murray Valley Basin
•close to harvest•represent wide range of resource variability
•Obtain a representative data set describing site average andvariance data of tree and wood properties as a basis forevaluating the performance of the eCambium modelling tool
•Produce a “commercially-ready” version of eCambium
Forest Qualitymore valuable trees
Site SelectionBuccluegh
Greenhills
BagoCarabost
Maragle
Shelley
Ovens Valley
Benalla
Forest Qualitymore valuable trees
Stage 1: NDE Resource Evaluation
• 53 sites• 30 trees per site
• DBH• Outerwood density cores • Standing tree acoustic velocity
ring level to assess whether the model was predicting radial trends
accurately.
Radial trends
Forest Qualitymore valuable trees
IML Resistograph
• 30 secs per tree• Provides radial variation• No Laboratory work• Easy –to-use
y = 0.15x + 17.06R² = 0.88
300
350
400
450
500
550
2000 2500 3000 3500 4000
Oute
rWoo
d Den
sity (
kg/m
3)
Outerwood Resi (resistance units)
a.
Forest Qualitymore valuable trees
eCambium site value predictions
1:HV013
8264
$329
Count =DBHUB =
0.250.500.75
2:HV013a
10268
$347
2:ST048
7242
$252
3:BR019
12278
$265
5:MG001
7242
$310
6:MG001
13316
$314
7:MG001
21390
$340
8:ME111
15330
$315
9:NN001
21386
$355
10:HC427
13316
$320
11:MH00
13316
$219
Count =DBHUB =
0.250.500.75
12:WT00
13302
$318
13:HL224
13304
$315
14:WC15
21372
$314
15:EV002
13312
$276
16:JN058
21378
$342
17:KO057
18350
$345
18:LV015
16334
$348
19:LV018
10274
$305
20:LV018
13314
$337
21:GO024
20364
$247
Count =DBHUB =
0.250.500.75
22:BU019
13308
$337
23:BU019
8262
$317
24:TR016
12284
$307
25:TR014
15332
$344
26:GA003
21374
$314
27:WB026
38506
$369
27:WB02
16340
$282
28:AR119
20354
$352
29:GC80
16334
$348
30:OC119
13320
$330
Count =DBHUB =
0.250.500.75
31:OC119
12290
$295
32:OC101
12282
$321
33:OC101
21392
$369
34:WJ115
18352
$357
35:SP118
13298
$223
36:SP118
20370
$217
37:BI104T
13312
$386
38:BI133
20358
$363
39:MA04
12286
$302
40:MA05
13308
$309
Count =DBHUB =
0.250.500.75
41:BG582
12288
$303
42:BG587
13308
$321
43:BG583
21380
$362
44:BG066
12280
$318
45:GH849
13322
$236
46:GH849
20358
$277
47:GH845
13324
$331
48:GH845
20368
$268
49:GH828
18352
$232
49:GH828
13312
$229
Count =DBHUB =
0.250.500.75
50:CB001
13302
$323 51:MU20
7250
$354 52:CB011
12280
$368 53:CB018
12284
$328
utilityF5MGP10MGP12MGP15
Boar
d Pr
opor
tions
Forest Qualitymore valuable trees
Sawmill study sites value predictions
2:HV013avalue = $ 344 m^3
10268
utilityF5MGP10MGP12MGP15
Board Count =DBHUB =
0.0000
0.0625
0.1250
0.1875
0.2500
8:ME111value = $ 320 m^3
15330
11:MH001value = $ 250 m^3
13316
18:LV015value = $ 344 m^3
16334
19:LV018bvalue = $ 310 m^3
10274
Board Count =DBHUB =
0.0000
0.0625
0.1250
0.1875
0.2500
20:LV018avalue = $ 334 m^3
13314
37:BI104T1value = $ 375 m^3
13312
40:MA044UTvalue = $ 316 m^3
12286
42:BG587T1value = $ 325 m^3
13308
Board Count =DBHUB =
0.0000
0.0625
0.1250
0.1875
0.2500
44:BG066UTvalue = $ 328 m^3
12280
47:GH845T2value = $ 331 m^3
13324
52:CB011T1value = $ 360 m^3
12280
Boa
rd V
olum
e (m
^3)
Forest Qualitymore valuable trees
Log Preparation
Forest Qualitymore valuable trees
Comparing actual and eCambium log end images
Forest Qualitymore valuable trees
Barcode application to log ends
Forest Qualitymore valuable trees
Logs weighed for green density calculation
Forest Qualitymore valuable trees
Logs loaded into mill infeed
Forest Qualitymore valuable trees
Resultant boards imaged
Forest Qualitymore valuable trees
eCambium’s prediction of site value
• eCambium predictions made 4 months before logs were harvested
• Partly dependent on grade thresholds for converting MOE into grade
y = 0.41x + 239.37R² = 0.62
$225
$250
$275
$300
$325
$350
$375
$400
$425
$225 $250 $275 $300 $325 $350 $375 $400 $425
Act
ual c
alcu
late
d va
lue
$/m
3
eCambium predicted $/m3
VicNSW
Bago cpt 66 high elevation
Forest Qualitymore valuable trees
Conclusions: 1 of 2• eCambium explained similar OWD variance to empirical models,
• These were fitted regressions and not applied in a predictively • What is a commercially acceptable?
• Discussions with industry: 60% or better is what most would be comfortable with.
• eCambium predictions in range using general inputs for site descriptions• publically available database values• FR constant at 0.3, • rock content constant at zero
• Parameter optimization, across Tasmania, Green Triangle, Victoria and NSW yielded calibration r2 > 60%.
• Comprehensive optimization and further development should improve predictions.
Forest Qualitymore valuable trees
Conclusions: 2 of 2
• eCambium explained 50-60% of the site average sawlog value and log MOE
• Cheap and simple way to obtain broad-scale insights into wood property and value variation across an estate
• Used to target field sampling programs• combine with Resistograph as a cost-effective approach to sampling for density
and AWV.
• Model setup and operation has been simplified • ready for commercial application
Forest Qualitymore valuable trees
Industry workshops
• Two workshops will provide an opportunity for FWPA levy payers to try the model