Lundin A. 2013 Evaluating and Optimizing a Protocol for Mesodermal Differentiation of Pluripotent Stem Cells towards Cardiomyocytes and Adipocytes Master of Science Thesis – Biotechnology, Tissue engineering ANDERS LUNDIN Department of Applied Physics Division of Biological Physics CHALMERS UNIVERSITY OF TECHNOLOGY Gothenburg, Sweden2013
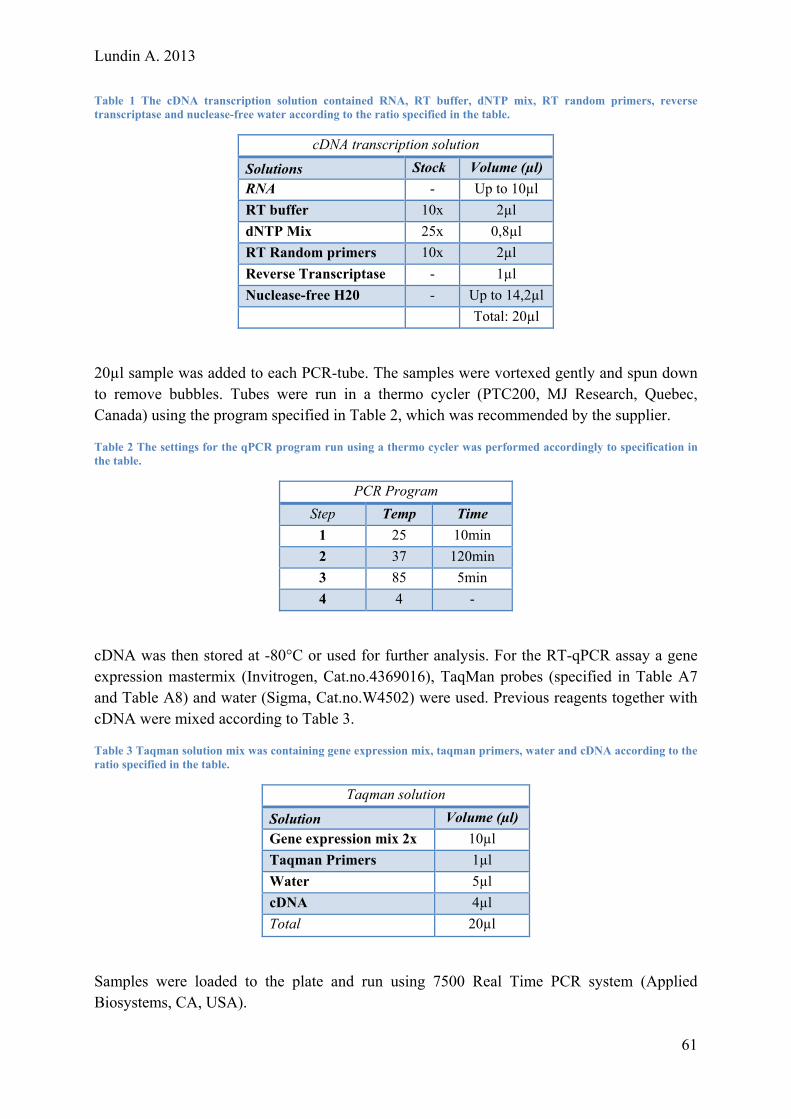
Transcript
Lundin A. 2013
Evaluating and Optimizing a Protocol for Mesodermal Differentiation of Pluripotent Stem Cells towards Cardiomyocytes and Adipocytes Master of Science Thesis – Biotechnology, Tissue engineering
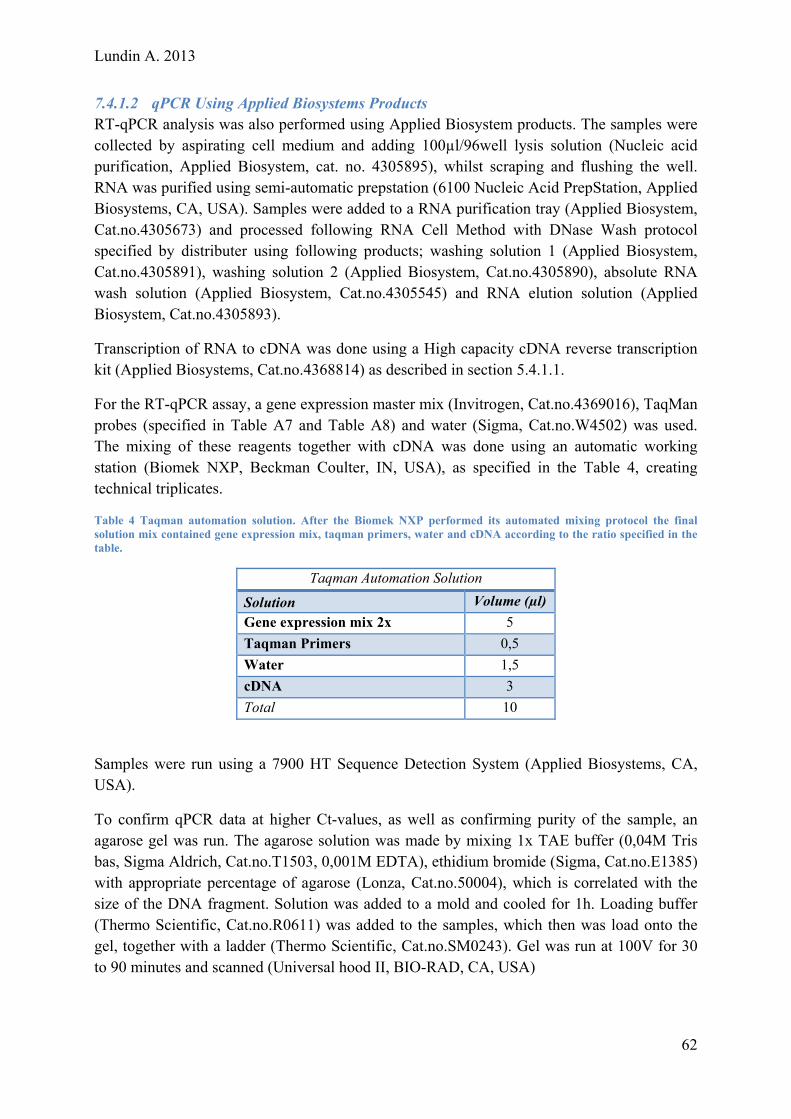
ANDERS LUNDIN
Department of Applied Physics Division of Biological Physics CHALMERS UNIVERSITY OF TECHNOLOGY Gothenburg, Sweden2013
Lundin A. 2013
Lundin A. 2013
Evaluating and Optimizing a Protocol for Mesodermal Differentiation of Pluripotent Stem Cells towards
Cardiomyocytes and Adipocytes
ANDERS LUNDIN
Department of Applied Physics CHALMERS UNIVERSITY OF TECHNOLOGY
This master’s thesis was performed and supervised at AstraZeneca, Mölndal, Sweden. Cover: [Cover photo: (Left) iPSC derived cardiomyocytes stained with cardiac troponin T (cTnT). (Right) Primary adipocyte differentiated for 16 days using classical differentiation cocktail stained with LipidTOX (10x enlargement]
Gothenburg, Sweden 2013
Lundin A. 2013
Evaluating and Optimizing a Protocol for Mesodermal Differentiation of Pluripotent Stem Cells towards Cardiomyocytes and Adipocytes ANDERS LUNDIN Department of Applied Physics CHALMERS UNIVERSITY OF TECHNOLOGY Abstract The fat epidemic is an increasing issue in today’s society, and with it follows obesity-related diseases, such as type 2 diabetes and coronary heart disease. Many of today’s drug candidates are withdrawn from the market due to negative cardiac effect, which result in huge setbacks for drug companies if detected at late stage trials Therefore, there is a necessity of appropriate in vitro models, which can detect these toxic effects at early stages in drug development. Consequently, there is an increasing demand in providing cells with high biological relevance. A large portion of the study models used today are performed with in vitro cells lines of cancerous origin, and often from species other than human. In addition, usage of different in vivo models also add to the complexity with the matter of accurate translability. This issue can be addressed by using primary cells. However, this raises the problem of accessibility, which can almost be impracticable when it comes to accessing and isolating cells from neuronal or heart tissue. Fatty tissue is more accessible, but the amount of cells that can be isolated from a subject are not sufficient to run large drug screens. Using cells from different subjects can be a solution to the problem of poor accessibility, but creates a large complexity of donor to donor variations. Another model, using pluripotent stem cells (PSC), provides beneficial properties of indefinite growth with sustained pluripotency, an immense source of cells, and the theoretical possibility of differentiation into any cell type in the body. In addition, the cells can be of human origin, providing a good biological relevance. The discovery and development of the induced pluripotent stem cell (iPSC) technique, meaning the possibility of creating a PSC from a somatic cell, also circumvented the major ethical hurdles of isolating embryonic stem cells. To be able to take advantage of the beneficial properties of the iPSC technology there is a need for establishing robust differentiation protocols, which can transform iPSCs into mature functional somatic cells. This thesis focused on evaluating and optimizing differentiation protocols to derived cardiomyocytes and adipocytes from iPSCs. A robust protocol for providing stem cell derived adipocytes was not achieved. Evaluation of the differentiation process mainly focused on functional assays, such as; glucose uptake of radioactive isotopes, lipolysis and western blot. These assays did not supply data supporting derivation of functional adipocytes. The observed poor functionality was due to the low percentage of derived adipocytes, a feature correlating with recent publications. Differentiation of cardiomyocytes was achieved, both through embryo body formation and by direct differentiation in a monolayer format. Characterization of the cardiomyocytes was conducted by immunocytochemistry (ICC), fluorescent activated cell sorting (FACS), quantitative PCR and high content imaging (ImageXpress). Moreover, the cardiomyocytes exhibited the characteristics of spontaneous contractions and expressed the typical cardiac markers, as Nkx2.5 and cTnT. Finally, the outcome of the cardiomyocyte differentiation protocol show promising results for future application and development as an in vitro model for drug screening.
Acknowledgements I would like to thank my supervisors Gabriella Brolén, Anna Jonebring and Helena Peilot for excellent support and guidance during this master’s thesis. I would also like to thank the iPSC-team and other colleagues at AstraZeneca, Mölndal for their contribution and inspiring scientific discussions, making this thesis possible.
Lundin A. 2013
Abbreviations
aSHF – anterior second heart field BAT – Brown adipose tissue dWAT – deposit EB – Embryonic body ECC – Embryonic carcinoma cell ESC– Embryonic cell FHF – First heart field fWAT - fibrous hASC – human adipose stem cell hESC – human embryonic stem cell hiPSC – Human induced pluripotent stem cell hMADS – human mesenchymal adipose derived stem cell iPSC – Induced pluripotent stem cell LA – Left atrium LV – Left ventricle MCE – Mitotic clonal expansion MDI – A medium composed of IBMX, Dexamethasone and insulin MPC – Myocyte progenitor cell MSC – mesenchymal stem cell OFT – Out flow tract phPA – primary human preadipocyte PSC – Pluripotent stem cell pSHF – posterior second heart field RA – Right atrium RV – Right ventricle SCNT – Somatic-cell nuclear transfer SHF – Second heart field sWAT – structural VPC – Vascular progenitor cell WAT – White adipose tissue
1 Introduction The differentiation of pluripotent stem cells (PSCs) toward different lineages and target cells provide huge possibilities for providing biologically relevant cells for regenretive medicine and in vitro studies. There is an increasing demand within drug discovery and development for human cardiomyocytes and adipocytes. Cardiomyocytes are needed both within the cardiovascular disease area as well as within toxicology studies for drug metabolites within safety assessment. Adipocytes are cells of large interest, both within the diabetes and obesity disease area. For both cell types there is a limited accessibility both to primary cells as well as established cell lines with a primary phenotype of enough quality. Embryonic cells can solve the issue of quality and biological relevance but accessibility is still a problem and there is also a large ethical issue in harvesting the embryonic PSCs from human embryos. The revolutionary discovery by Yamanaka, showing the potential of generating PSCs from somatic cells (Takahashi et al. 2007), offer huge possibilities in providing human cells in large quantities of biological relevance. Today, studies are often performed using immortalized cell lines, often from non human origin, for instance mouse or hamster, which create a biological relevance issue. With the technique of Yamanaka human cells become more accessible and it also opens up possibilities in many research areas due to the fact that one is able to theoretically differentiate these cells into any linage. For regenerative medicine, which have the necessity of providing cells with low or no immune response, the Yamanaka method have the potential of creating patient specific cells in order to restore deficient tissue. Studies of developmental biologists now have the possibility of obtaining easy access to pluripotent cells to study development towards different germlines and cell lineages in healthy as well as in diseased cells. Establishing induced pluripotent stem cell (iPSC) lineages from donors with healthy and diseased backgrounds also provide the opportunity to generate disease models, which can be used in early drug discoverys. However, all future possibilities using iPSC rely on creating robust differentiation protocols which provides cell types with the desired differential state.
1.1 Aim The aim of this thesis is to evaluate, optimize and establish a robust protocol with high reproducibility and yield for differentiating iPSCs into functional cardiomyocytes and adipocytes, which can be further developed into in vitro models for future drug screening. The evaluation will be based on biomarker specific characteristics and functional assays.
The aim for cardiomyocyte differentiation was further defined into prioritized milestones as to first, achieve differentiation of hiPSC into beating cardiomyocytes via EB formation or suspension culturing, second, provide a protocol for direct differentiation of hiPSC into beating cardiomyocytes via monolayer, third, optimize protocols in terms of quality, yield and scalability, and fourth, evaluate the maturation process of cardiomyocyte to observe possible phenotypic changes.
The aim for adipocyte differentiation was further defined into prioritized milestones as to first, differentiate hiPSC to adipocytes with morphological similar structures containing triglyceride droplets, second, evaluate functional properties, such as lipolysis and glucose
1
Lundin A. 2013
response, third, characterize cells according to biomarker and protein expression, and fourth, compare differentiation protocols for “brown” and “white” adipocytes.
1.2 Limitations Limitations will partly be concerning evaluation methods were full expression analysis to characterize the differentiation process will not be done, but instead focus on specific markers which are scientifically accepted in literature. iPSC-lines used will be those provided by AstraZeneca, and will mainly be restricted to one cell line. Regarding cardiomyocyte differentiation, no functional assays will be done besides morphological observations of contractility. No drug screening will be covered in this project.
2 Background
2.1 Differentiation Potency Mammalian development starts with cells of high placidity and proliferation capacity which progressively differentiate into highly specialized cells producing functional somatic tissue. The cell differentiation process and the maturation to a certain cell type have different stages, in which the potential of becoming any cell type is described. The zygote, a fertilized oocyte and the morula, which are the first proliferating mass of the zygote, are totipotent. Totipotent means that the cell can give rise to every cell type in the adult mammal including the extraembryonic tissue, later forming the placenta. The morula develops into a blastocyst which contains the inner cell mass. The cells that constitute the inner cell mass are of pluripotent nature, meaning that they can differentiate into all germ layers making up the adult mammal. A cell committed to one of the three germ layers, ectoderm, mesoderm or endoderm, is a multipotent stem cells, which gradually develops into a unipotent stem cell as maturation proceeds, thus minimizing the development options. Eventually a cell is terminally differentiated with developmental potential. Theses cells are frequently highly specialized, providing organ and tissues their functionality, a characteric somatic cell (Blitterswijk, Thomsen 2008).
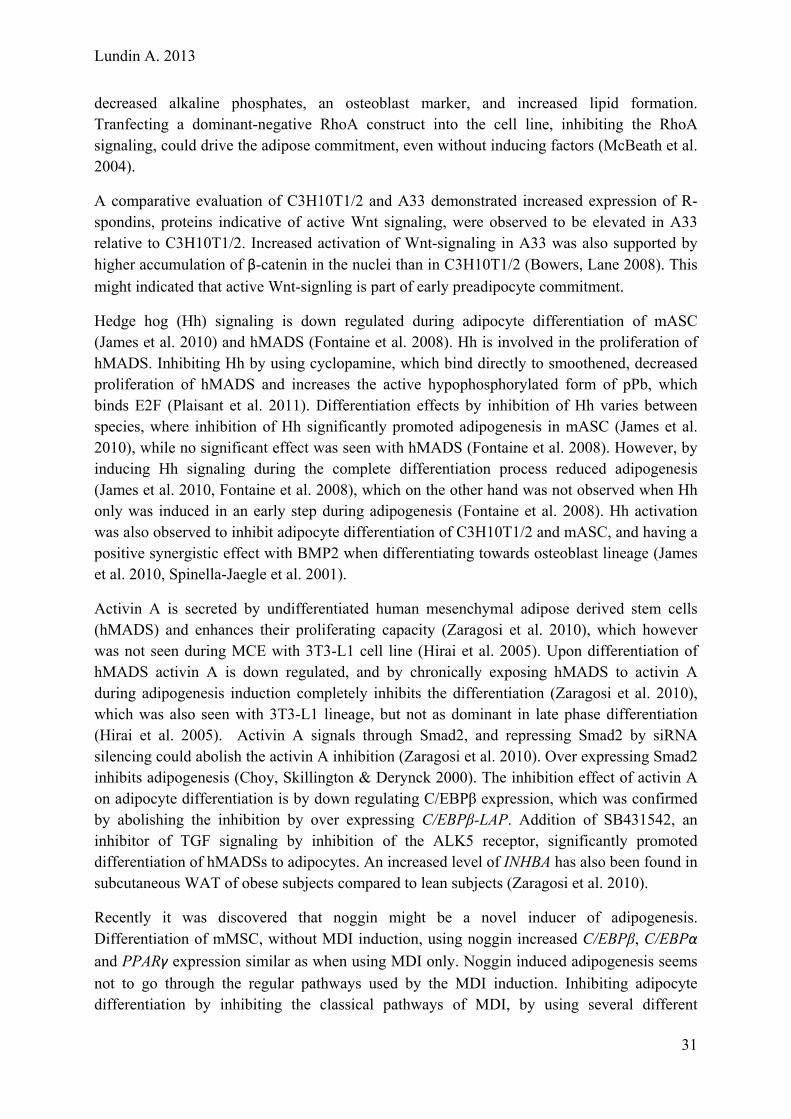
2.2 Historical Milestones for iPSC Technology The differentiation process was first viewed to be permanent and irreversible, but this was challenged and proven otherwise in 1962, when John Gurdon demonstrate by inserting nuclei from intestinal epithelium cells into a frog’s egg, resulting in a cloned frog. The somatic-cell nuclear transfer (SCNT) technique, cloning, which was established by Briggs and King (Briggs, King 1952), resulted in full grown frogs, providing evidence that all cells are genetically totipotent, having the genetic information to create all cell types (Gurdon 1962). This has been done with several different species since then, more famously the cloning of the sheep Dolly (Wilmut et al. 1997). An important step in how the genetic information is controlled was the establishment (Kahan, Ephrussi 1970) and application of pluripotent embryonal carcinoma cells (ECCs) (van, Defize 2003). ECCs are derived from teratocarcinomas, malignant tumors spontaneously occurring in mouse strain 129 (Stevens, Little 1954), which contain PSCs (Kleinsmith, Pierce 1964). By fusing ECCs with somatic cells it was shown that these hybrids behaved like normal teratocarcinomas, creating
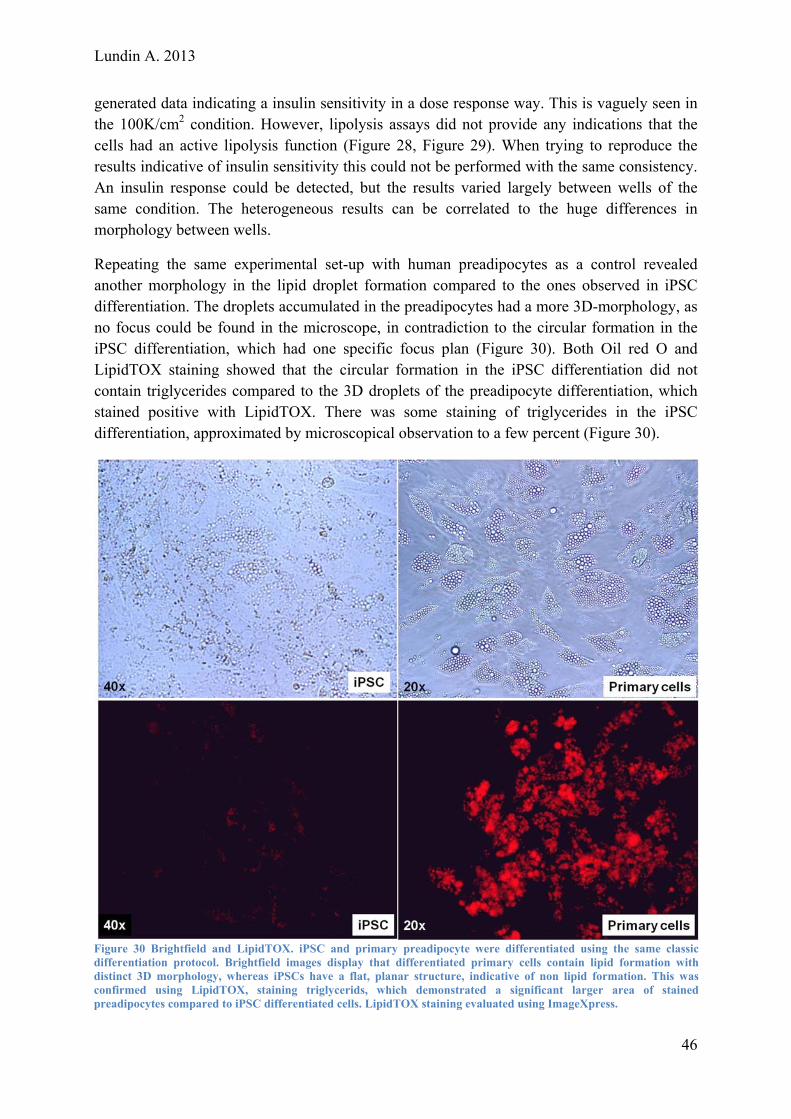
2
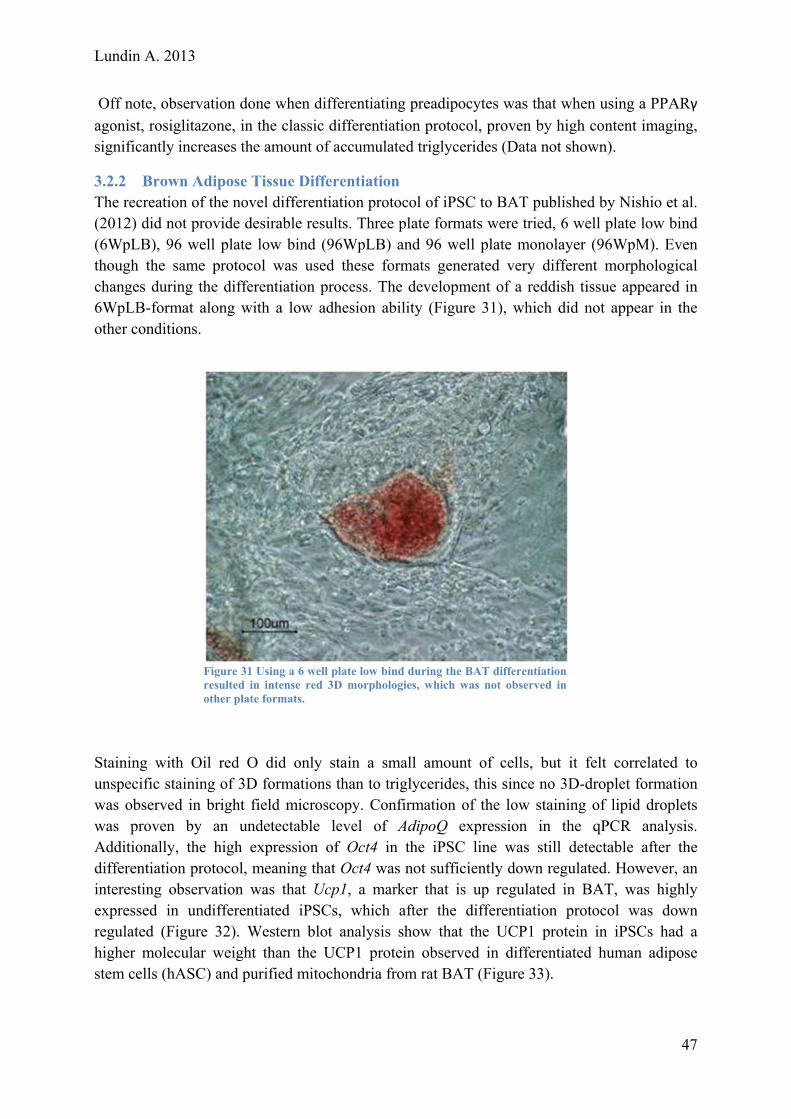
Lundin A. 2013
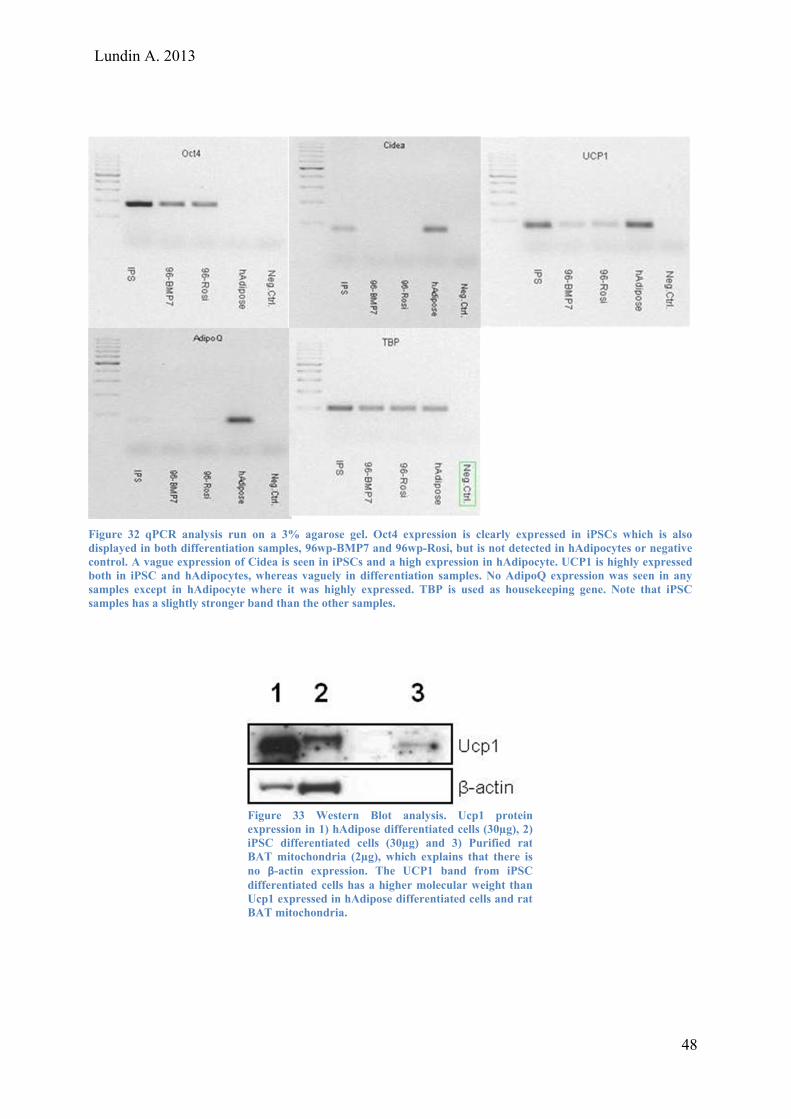
teratomas with all three germ layers (Miller, Ruddle 1976). The results indicated that pluripotent ECCs comprise soluble factors that could retrieve a pluripotent state of somatic cells. A problem with ECCs line is that most ECC are aneuploid, having abnormal numbers of chromosomes, and participate minimally in somatic tissue generation using blastocyst chimaerism (Brinster 1974). By the same method the ideas that the inner cell mass had pluripotent characteristics were strengthened (Gardner 1968). Later in 1981 ESCs isolation was achieved directly from the inner cell mass of a mouse embryo, which had normal karyotype compared to ECCs. This provided the possibility of culturing native ES cells in vitro demonstrating its high proliferating capacity while maintaining pluripotency (Evans, Kaufman 1981, Martin 1981). It was later shown that ESCs alone could support normal fetal development (Nagy et al. 1990). The success of isolating human ES cells was later done in 1998 (Thomson et al. 1998). The differentiation of a pluripotent cell towards a committed fate is accompanied by activation of specific genes and thereby expression of certain transcription factors to further drive the cell determination. Linage specific factors were in 1987 proven to be able to alter cell fate by transfection of retroviral vectors expressing MyoD inducing myogenesis in fibroblast (Davis, Weintraub & Lassar 1987). Then in 2006 Yamanaka successfully derived induced pluripotent stem cells (iPSC) from mouse fibroblast (Takahashi, Yamanaka 2006) and later in 2007 from human fibrolast (Takahashi et al. 2007) only using four factors Oct3/4, Sox2, Klf4 and c-Myc, which are called the Yamanaka factors.
2.3 Reprogramming of Somatic Cells to iPSCs Reprogramming techniques of somatic cells to a pluripotent state have developed over the years since Yamanaka did it in 2006 using retroviral vectors (Takahashi, Yamanaka 2006) and is well summarized (Robinton, Daley 2012, Stadtfeld, Hochedlinger 2010). There are four major techniques; 1) integration technique, where retroviral, lentiviral and induced lentiviral techniques are used to incorporate the reprogramming factors into the genome to be expressed; 2) excisable technique, which is as the previous technique except that the vector is flanked by loxP sites, providing the possibility to excise the integration only leaving the loxP sites; 3) integration free, where adenoviral vectors or plasmids containing the factors are transfected, but not integrated into the genome; and 4) DNA free technique, which uses mRNA, microRNA or proteins to drive the reprogramming. Identification of compounds driving over expression of the Yamanaka factors has also been done.
The highest reprogramming efficiency has been seen with the modified mRNA technique, which has several advantages, besides being integration free, such as faster kinetics and being more controllable. The drawback by using this technique is that it requires several rounds of transfection to keep the mRNA level at a high concentration for complete reprogramming. Overall, the other techniques are inferior due to application of integration procedures in the genome and/or having lower efficiency (Robinton, Daley 2012, Stadtfeld, Hochedlinger 2010).
2.4 Cardiac Tissue Heart failure is one of the most common causes of morbidity and mortality in the United States (Hoyert, Xu 2012). Myocardial infarction causes apoptosis and/or necrosis, which eventually lead to non functional heart tissue. Myocardium has a low regeneration capacity
3
Lundin A. 2013
(Bergmann et al. 2009) making it incapable of restoring large damages to the heart. Dead tissue is replaced by fibroblasts that migrates into the diseased area and creates scar tissue which does not possess the same functionality as the original tissue, resulting in loss of impulse response and contractibility. Regenerative medicine is a future hope in medical treatment for heart diseases, either by direct in vivo reprogramming(Qian et al. 2012, Song et al. 2012) generating new cardiac tissue or cell transplantation from in vitro production (Ieda et al. 2010), which is later injected into the diseased area. iPSCs provide a large quantity and diversity of cells that could be used in regenerative therapy, but the differentiation towards a desired cell type from a pluripotent state demands differentiation protocols providing a signaling composition that induce the right type of differentiation. To be able to study cardiomyocytes several articles provide different approaches in how to differentiate PSCs into cardiomyocytes (Burridge et al. 2011, Lian et al. 2012, Minami et al. 2012, Yang et al. 2008, Hazeltine et al. 2012).
Protocols include a large variety in growth factors, medium compositions, induction time points, culture conditions, matrixes and more since no main single signaling regulator has been found. The success of producing beating cardiomyocytes has been performed, but where in the differentiation process theses cells are is constantly debated.
4
Lundin A. 2013
2.4.1 Early Embryonic Development of the Heart. The embryonic development starts, as described in section 2.1, with the fertilization of the oocyte becoming the zygote (Figure 1A), which develops through the morala stage to a blastocyst containing the inner cell mass (Figure 1B). The inner cell mass will later give rise to the three germ layers, ectoderm, mesoderm and endoderm, which differentiation pathways are set to certain bodily functions. The ectoderm will give rise to the skin, brain and nerve cells, while the endoderm will generate the gastrointestinal and respiratory tracts, as well as the liver, pancreas, thyroid gland and thymus. The mesoderm will make up the skeletal muscle, bone, kidneys, cartilage, fat, blood vessels, bone marrow, blood and the heart. The inner cell mass forms two sac structures, the amniotic sac and the yolk sac, whereas in between those structures the bilaminar embryonic disc is formed, consisting of the epiblast and hypoblast. All these formations are encapsulated by the chorionic sac (Blitterswijk, Thomsen 2008) (Figure 1C). Gastrulation, the development of the germ layers, starts by the formation of the primitive streak (Figure 2A), which is the first step in changing the disk morphology into a tube formation. At this time the transition from a bilaminar to a three
Figure 1 Embryonic development. A) The fertilized oocyte becomes a zygote, which through cell division developsinto a B) blastocyst containing the inner cell mass. C) The inner cell mass forms two sac structures, the amnioticand yolk sac, which are surrounded by the chorionic sac. In the interface between the amniotic and yolk sac is thebilaminar embryonic disc, which is composed of the epiblast and hypoblast.
5
Lundin A. 2013
laminar embryonic disk takes place. Cells from the epiblast migrate over the primitive streak (Figure 2B), defined as the central line area in the embryonic disk defining an anterior-posterior axis, creating the primitive groove and the primitive node (Figure 2A). The epiblast migration gives rise to the mesoblast and the definitive endoblast. Now, one defines the three layers as ectoderm, mesoderm and endoderm (Figure 2B). Cells from the ectoderm now migrate posterially from the primitive node creating the notochord, which together with the mesoderm helps to create the neural plate of which the neural tube is formed. Mesoderm development will continue by differentiating on both sides of the primitive streak into the paraxial, intermediate and lateral plate mesoderm. Lateral plate mesoderm will then give rise to the somatic and splanchnic mesoderm. The splanchnic mesoderm will start to move laterally and create the bilateral cardiogenic fields that moves anteriorly in embryonic disk (Figure 3A) creating the cardiac crescent (Hill 2011) (Figure 3B). The cardiac crescent will start to differentiate and move towards the midline and fuse together, initiating the growth of the primitive heart tube. When the two front lines of the cardiac crescent are fused and the
Figure 2 Gastrulation. A) The creation of the primitive streak and primitive node in the embryonic disc is theinitiation of gastrulation, which leads to the formation of the three germ layers. B) Cells from the epiblast migrateover the primitive streak creating the mesoblast and definitive endoblast. C) At this stage the different “layers”are defined as ectoderm, mesoderm and endoderm.
6
Lundin A. 2013
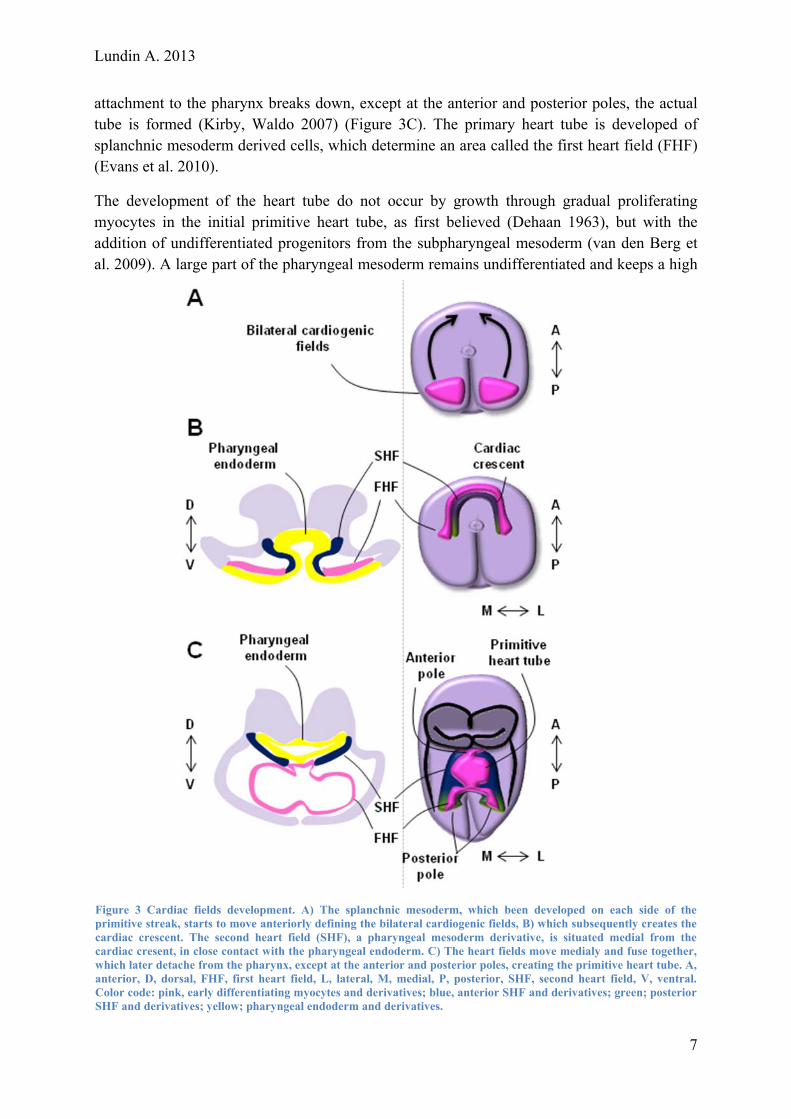
attachment to the pharynx breaks down, except at the anterior and posterior poles, the actual tube is formed (Kirby, Waldo 2007) (Figure 3C). The primary heart tube is developed of splanchnic mesoderm derived cells, which determine an area called the first heart field (FHF) (Evans et al. 2010).
The development of the heart tube do not occur by growth through gradual proliferating myocytes in the initial primitive heart tube, as first believed (Dehaan 1963), but with the addition of undifferentiated progenitors from the subpharyngeal mesoderm (van den Berg et al. 2009). A large part of the pharyngeal mesoderm remains undifferentiated and keeps a high
Figure 3 Cardiac fields development. A) The splanchnic mesoderm, which been developed on each side of theprimitive streak, starts to move anteriorly defining the bilateral cardiogenic fields, B) which subsequently creates thecardiac crescent. The second heart field (SHF), a pharyngeal mesoderm derivative, is situated medial from thecardiac cresent, in close contact with the pharyngeal endoderm. C) The heart fields move medialy and fuse together,w ,a l.C rS d derivatives.
hich later detache from the pharynx, except at the anterior and posterior poles, creating the primitive heart tube. Anterior, D, dorsal, FHF, first heart field, L, lateral, M, medial, P, posterior, SHF, second heart field, V, ventraolor code: pink, early differentiating myocytes and derivatives; blue, anterior SHF and derivatives; green; posterioHF and derivatives; yellow; pharyngeal endoderm an
7
Lundin A. 2013
proliferation rate while cells are added sequentially to the tubular heart scaffold during heart development at the anterior and posterior poles (Evans et al. 2010, van den Berg et al. 2009) (Figure 4A). This subpopulation is called the second heart field (SHF), which is characterized by its delayed differentiation and high proliferation rate (van den Berg et al. 2009, Abu-Issa,
convoluted tube proceeds by the creation of four septa; interatrial septum, interventricular septum, atrial-ventricular septa and the pulmonary-aortic septa. The partitioning and physiological definment of the heart is then complete (Hill 2011).
As to understand the process of cardiogenesis different models are developed, and with that the definition and characterization of different heart fields. To identify the developmental origin of specific cardiac tissue, different cell populations are being characterized into different fields of origin. Subpopulations are characterized based on their clonal history, their position in the mesoderm, and their time of addition to the development of the heart as well as their function in the more mature heart. The definition and characterization of heart fields are under constant development and changes as scientific data provides new insights in this area. The first definition of a cardiogenic field acting as an originating source of cells to the development of the heart was the later plate mesoderm/cardiac crescent, which dates back to the 1940s, done by Rawls et al. (1943) on chick embryos. Subsequent studies of the development of the heart, often observed in chick and mouse, already in 1977 (de la Cruz et al. 1977)postulated the existence of a second source of myocardium that adds cells after the initial heart tube is formed. However, it was not until in 2001, as cell mapping techniques improved, the confirmation of this novel SHF was achieved by Kelly et al. (2001), Mjaatvedt et al. (2001) and Waldo et al. (2001). For more comprehensive review (Dyer, Kirby 2009). There are several subpopulations to the SHF that are being characterized in the attempt to clarify the development of the heart (Dyer, Kirby 2009). Since the heart tube is detached from the pharyngeal mesoderm, addition of cells from the SHF takes place at the anterior and posterior poles of the heart tube (Abu-Issa, Kirby 2008). Two subpopulations to the SHF, anterior-SHF (aSHF) and secondary heart field, were established using a chick model, revealing distinguishable cellular fields. The aSHF contributed to the RV and OFT (Kelly, Brown & Buckingham 2001, Mjaatvedt et al. 2001), while the secondary heart field contributes with myocardium and smooth muscle to the end of the OFT, the definitive arterial pole, (Waldo et al. 2001). Additional studies providing supporting data that the SHF give rise to the RV, OFT, and large parts of the atria in mammals was performed using mouse models (Cai et al. 2003, Zaffran et al. 2004), as well as through clonal mapping (Meilhac et al. 2004).
Kirby 2008). As the growth and elongation of the heart tube continues, by addition of cells from the SHF, the tube is bent into a loop and expands, developing the different chambers and sections of the heart (Evans et al. 2010). These can roughly be divided into five areas making up the developing heart; right atrium (RA), left atrium (LA), right ventricle (RV), left ventricle (LV) and outflow tract (OFT) (Figure 4B). The chamber development of the
8
Lundin A. 2013
Figure 4 Development of the heart tube. A) The growth of the linear heart tube is performed by addition of cells fromthe subpharyngeal mesoderm, also defined as the second heart field (SHF), at the anterior and posterior poles, asindicated by the red arrows. By addition of cells the linear heart tube starts looping, initiating sequentialcompartment formation. B) The more mature heart can be divided into five major compartments; right atria (RV);left atria (LA), out flow tract (OFT); right ventricle (RV); and left ventricle (LV). C) The believed lineage relationshipwhich constitute the heart. A, anterior, D, dorsal, FHF, first heart field, P, posterior, V, ventral. Color code: pink,early differentiating myocytes and derivatives; blue, anterior SHF and derivatives; green; posterior SHF andderivatives.
9
Lundin A. 2013 Lundin A. 2013
10
A third subpopulation, the posterior second heart field (pSHF), is also defined, generating specific differentiated cells of the atria (Galli et al. 2008). The FHF will give rise to the LV and contribute to parts of the artia (Cai et al. 2003, Zaffran et al. 2004, Meilhac et al. 2004). However, these classifications of region contributing cell populations are not strictly designated to a defined anatomical location, but instead an indication of the major contributor to that physiological region of the hear, since there are cells originating from both major heart fields in the hole heart. The fact that cells from both heart fields can be seen in the different parts of the heart is suggested to be due to a third cell population, myocardial founder cells, which contribute to the whole heart (Meilhac et al. 2004). The definition and characteristics of the subclassifications of the SHF is also under constant development (Lescroart et al. 2012) (Figure 4C).
Even though the cardiac development is extensively studied the view of how the heart is derived is not unified among scientist, which is important to take into consideration when assessing the literature of this field. In a review by José Xavier-Neto different models of heart development are described, such as the light and strong interpretation, the segmental model and the novel scaffold model, which reconcile previous models (Xavier-Neto et al. 2012). The light interpretation model is based on the existence of a single cardiac field, which however may be extremely complex. The idea is that there is a common progenitor from which cardiomyocytes develop, and not two distinct lineages making up the heart as in the strong model. Cell development is based on initial location and on pattering, which then include the acceptance of the segmental model, as long as it is not defined by two distinct clonal origins. Strong interpretation model suggests that the heart is derived from two distinct heart progenitor cells originating from the classic lateral splanchnic mesoderm and the pharyngeal mesoderm. The distinct populations express different markers and are developed through a lineage specification based on clonal diversity between the populations. The model can be seen as an adaptation of the mosaic model, where the cell potency and fate is determined based on the descendence from a few specific cell lineages created early in the ontology time line. This is in contrast with idea of a regulative development based on positional factors through signaling mechanisms. According to the strong interpretation, one lineage makes up the LV, AV canal and atrium, while the second lineage makes up all parts of the heart, but the left ventricle. The interpretation of heart development by using the strong model often dismisses the segmental model. In the segmental model heart development is based on the assumption of a segmental distribution along the anterior-posterior axis of the lateral splanchnic mesoderm generated by clonally separated populations, which give rise to a segmented heart tube and specific parts of the heart without mixing with one another. The scaffold model is a view that reconciles the segmental model with the idea of a subpharyngeal
, to their fate of contributing to the arterior and posterior pole, adding cells to the
progenitor cell. The primary hear tube is believed to be segmented and have two majorfunction, 1) to initiate a fast pumping organ for circulatory flow, and 2) to serve as a scaffold, which the additional cardiac cells will add to, and execute final differentiation based on signaling patterning, making up the definitive heart. The model thereby applies the segmental view of a segmented heart tube, and that the subpharyngeal progenitors are specified, but not determinedheart tube (Xavier-Neto et al. 2012).
10
Lundin A. 2013
2.4.2 Major Genes in Cardiac Development To decipher the complex regulatory network that controls the cardiac development signaling pathways are trying to be mapped out and linked together. This includes the expression of certain genes, indicating the cellular origin and its future possibilities and destiny. Several major genes in the development have been identified: Brachyury T, Mesp1, Gata4, Nkx2.5, Mef2c, Isl1, Tbx5, Hand1/2. However, their roles in the cardiac differentiation are continuously refined as new scientific data is appear, often illuminating the complexity of the regulatory network that drives pluripotent cells to generate the heart. The translational capability from murinae, which the data below is based on, to human is also a very critical step that need to be assessed to confirm similarities and differences. To provide an overview, the expression time lines of certain markers during cardiac differentiation are presented in Figure 5.
Mesoderm induction can be recognized by the increased expression of Brachyury T (Herrmann et al. 1990), which induces mesoderm posterior 1 (MESP1) gene (David et al. 2011), indicating cardiovascular progenitor commitment (Saga, Kitajima & Miyagawa-Tomita 2000). Mesp1, described as a “master” regulator, then acts to stimulate cardiac progenitor specification by activating a complex mesh of genes involved in cardiac development, Gata4, Nkx2.5, Mef2c, Hand2, and indirectly down regulating pluripotent genes, Nanog, Oct4 and Sox2 (Bondue et al. 2008). The Mesp1 subpopulation of T positive cells, in combination with KDR (also known as Flk1, VEGFR2), PDGFRα and CXCR4 markers, designate a tripotent cardiovascular precursor population giving rise to cardiomyocytes (CMs), endothelial cells (ECs) and smooth muscle cells (SMCs). Continued differentiation of Mesp1+ cells resulted in Tbx5 and Isl1 expression, indicating that the Mesp1+ population is a common progenitor of the FHF and SHF (Bondue et al. 2011). Mesp1 and Mesp2, a homologue to Mesp1, are important for mesoderm specification (Saga, Kitajima & Miyagawa-Tomita 2000) where a double gene knock-out (dKO) results in the absence of mesoderm (Kitajima et al. 2000). Overexpression of Mesp1 up-regulates cardiac genes as Gata4, Nkx2-5 and Mef2c (David et al. 2011), which are expressed in the cardiac crescent (Sepulveda et al. 2002, Lints et al. 1993, Lin et al. 1997). A study by Bearzi et al. (2007) indicated that KDR together with c-Kit can be used to define and separate the early cardiovascular progenitor population into to two subpopulations, coronary vascular progenitor
Figure 5 The differentiation process is defined into six stages starting from human induced pluripotent stem cells,mesoderm, cardiac mesoderm, cardiac progenitor cells, immature cardiomyocytes and cardiomyocytes. Markerswhich are expressed at the different stages are presented.
11
Lundin A. 2013
cells (VPC) and myocyte progenitor cells (MPC). Expression of both markers define the VPC
ical development of the heart. Even though a beating cardiac tube is derived in a
these cells (Bondue et al. 2011). Tbx5 is required for cardiac differentiation (Bruneau et al. 2001) and is mainly expressed in the left ventricle and parts of the atria (Bruneau et al. 1999), which is the definition of the FHF. Tbx5 over expression has been proven to favor FHF lineage, by inducing earlier beating in the differentiation process and down regulation of Hand2 expressed in RV and OFT (Thomas et al. 1998), and not inducing gene expression of Isl1, Tbx1 and Fgf10 (Herrmann et al. 2011). Over expression of Tbx5 also repressed Tbx20, a RV marker, indicating the total abolishment of the RV (Takeuchi et al. 2003). Tbx5 is also linked to Gata4 presence in cardiac development, where dKO of Tbx5 decreased the expression of Gata4 in the cardiac crescent and subsequently in the cardiac tube (Bruneau et
e regions later forming LV and RV. A dKO of
population, differentiating mostly to ECs and SMCs, where as a c-Kit+, KDR- population marks MPC, mostly giving rise to cardiomyocytes and SMC (Bearzi et al. 2007, Bearzi et al. 2009). This bipotent precursor population has also been suggested by Wu et al. (2010) and Bondue et al. (2011) with the expression of an additional factor Nkx2.5. Gata4 is expressed very early in development and its deletion abolishes beating cardiomyocytes and reduces cardiac markers (Grepin et al. 1995). Gata4 and Gata6 are transcription factors necessary for the onset of the cardiac progenitor transcription network, where depletion of these genes down regulates Nkx2-5, Hand1/2, Mef2c Tbx5, Tbx20 (Zhao et al. 2008). Nkx2.5 is expressed in the cardiac crescent, marking early cardiac progenitor cells (Lints et al. 1993), as well as endothelium and smooth muscle (Ma, Zhou & Pu 2008), and is necessary for normal morphologdKO Nkx2.5 there is no looping development of the heart tube (Lyons et al. 1995). Nkx2.5 is having a multiple role in heart development, being linked to the FHF and SHF. In a dKO Nkx2.5 the absent expression of Hand1 is seen in the cardiac crescent and cardiac tube (Yamagishi et al. 2001), a marker defining the LV (Thomas et al. 1998). Nkx2.5 is also coupled to a FHF marker, Tbx5, where the deletion of Tbx5 reduce Nkx2.5 expression to become completely absent in development. Nkx2.5 and Tbx5 also works synergistically to induce cx40, (Bruneau et al. 2001) a protein, which is part of the mature conduction system (Delorme et al. 1995). Mef2c is also expressed early in the cardiac development and needed for the proper cardiogenesis, where double KO of Mef2c disable proper looping and development of the RV and OUT (Lin et al. 1997). The Mef2c expression is dependent on the transcription factors ISL1 and GATA4, since they are couple to the enhancer region of Mef2c. The deletion of the enhancer regions abolished the expression of Mefc2 in the SHF, RV and OUT (Dodou et al. 2004). Isl1 is an early marker in the cardiac crescent, marking cardiac progenitor cell. Isl1 is important for the development of the RV and the OUT (Cai et al. 2003, Prall et al. 2007), which are abolished in a double KO, as well as large parts of the atria, which all are derivative morphologies from the SHF (Cai et al. 2003). However, the expression of Isl1 is not distinct to the SHF, but is also localized in the FHF, subsequently showing that Isl1 progenitors give rise to FHF derivatives (Prall et al. 2007). There has been a changed view of seeing Isl1 as a SHF marker to now define cardiovascular progenitors together with Nkx2.5 and KDR (Moretti et al. 2006), and to be potentially used in isolating
al. 2001). Hand1 and Hand2 are expressed in the LV as well as RV and OUT region, respectively (Thomas et al. 1998). Both Hand1/2 are expressed in the cardiac crescent and become more restricted in their expression to th
12
Lundin A. 2013
Hand2 results in the absence of the RV segment, while Hand1 is till normally expressed (Srivastava et al. 1997). Hand1 is less defined in its differential role. However a dKO affects the blastocyst stage and later results in cardiac looping abnormalities (Riley, Anson-Cartwright & Cross 1998).
The identification of genes involved in cardiogenesis have resulted in trying to find the master regulatory genes, which have consequently led to several gene combinations. Gata4 and Tbx5 together with the chromatin remodeling complex Baf60c have been shown to drive cardiogenesis, proven by converting fibroblast into cardiomyocytes (Takeuchi, Bruneau 2009). However, this onset of genes generated different results in Idea et al. (2010), which suggested another combination of genes, Gata4, Tbx5 and Mef2c, needed for driving the direct development of cardiomyocytes from fibroblast (Ieda et al. 2010). Later, even this combination was proven inefficient, resulting in a differentiation process with incomplete electrophysiological maturation (Chen et al. 2012). So far no mastergene combination has been accepted to fully drive the differentiation. In evaluating the maturation of cardiac progenitor cells and immature cardiomyocytes, several structural proteins are evaluated, of which the most commonly are cTnT, Myh6, Mlc2a, Mlc2v. There are numerous more, which are extensively reviewed (Franco, Lamers & Moorman 1998).
2.4.3 Signaling Pathways The splanchnic mesoderm is surrounded of the endoderm, ectoderm and node, which contribute with specific signaling to govern the cardiac differentiation. There are several different signaling pathways that affect and control the differentiation process, including a complex crosstalk between these pathways:
There are several great articles (Habas, Dawid 2005, Wagner, Siddiqui 2007a, Wagner, Siddiqui 2007b, Verma et al. 2013, Dailey et al. 2005, Rhinn, Dolle 2012) that comprehend these signaling pathways, which are summarized below. For more elaborative descriptions read the articles specified.
2.4.3.1 Wnt Signaling There are two major Wnt-signaling pathways that are important during early cardiogenesis, the canonical and non-canonical Wnt-signaling pathways. The canonical Wnt pathway mediates its effect through the transcription factor β-catenin, hence the common name canonical Wnt/β-catenin pathway, by activation of the surface Frizzled-LRP5/6 complex through Wnt ligands. A cyotplasmic protein, Dishevelled (Dsh), is then activated, which inhibits GSK-3β phosphorylation of β-catenin and stabilizes its expression. β-catenin is
13
Lundin A. 2013
subsequently translocated to the nucleus and activates and binds to TCF/LEF transcription factor and induce target gene expression (Habas, Dawid 2005). It is believed to be two non-canonical pathways, the planar cell polarity (PCP) pathway and Ca2+/Wnt pathway, which are relative newly explored, meaning that they are not fully elucidated. PCP goes via Frizzled
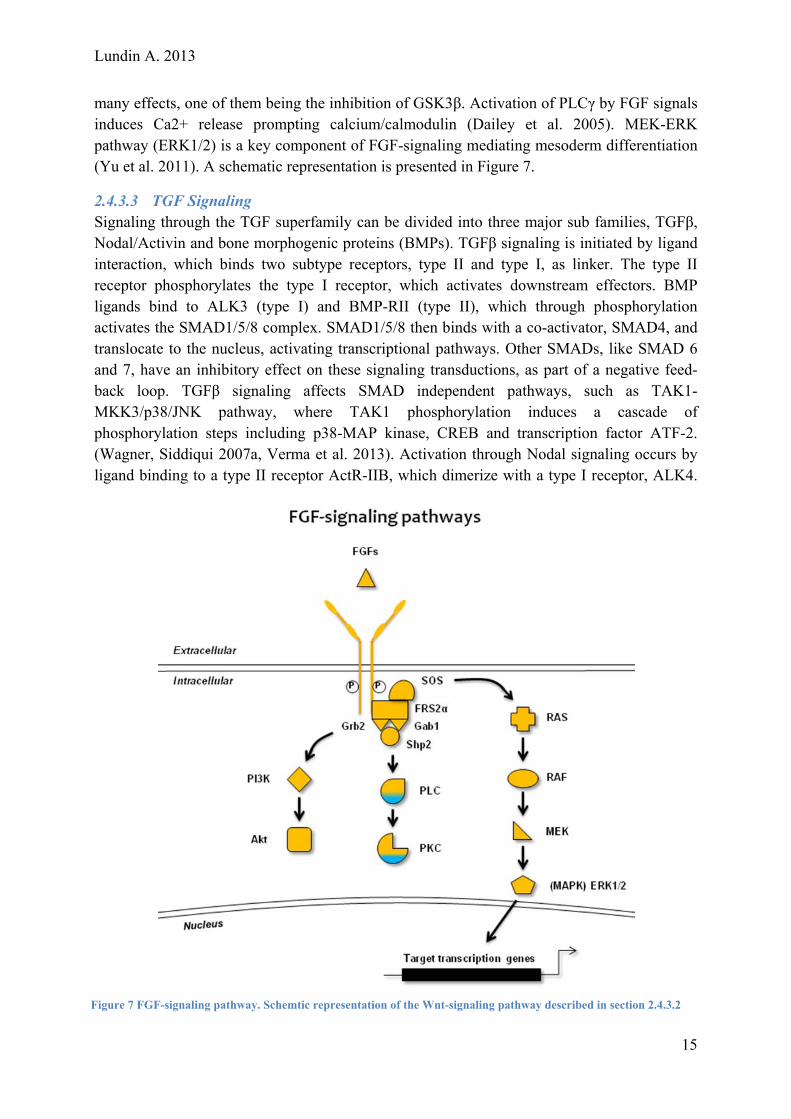
ng protein FRS2α. Subsequent FGF signaling to RAS/MAPK or PI3-kinase-
alone and subsequently activates Dsh in another way, triggering two signaling pathways involving Rho and Rac. Rho and Rac further activates Rho-associated kinase (ROCK) and c-Jun N-terminal kinase (JNK), respectively, mediating target transcription genes (Habas, Dawid 2005). The Ca2+/Wnt pathway works though mediators like calcium-calmodulin-dependent kinase 2 (Cam2K) and protein kinase C (PKC), and induce Ca2+-release inside the cell (Tian, Cohen & Morrisey 2010). A schematic representation is presented in Figure 6.
2.4.3.2 FGF Signaling Fibroblast growth factor (FGF) proteins are characterized by their high affinity towards heparin, making up parts of the FGF receptor (FGFR). There are three main pathways, Ras-MAP kinase, PLCγ and PI3-kinase-Akt pathways, where Ras-MAPK is the major signaling pathway. There are four types of FGFRs, all capable of splicing variants resulting in diversity regarding ligand specificity. Activation of a receptor leads to its dimerization and phosphorylation, which trigger binding of FGF receptor dockirecruitment of Grb2, Gab1 and Shp2 directs AKT pathways. Further recruitment of SOS activates Ras and downstream effectors through RAS/MAPK pathway. PI3 kinase activations instead trigger PDK and then AKT, which has
Figure 6 Wnt-signaling pathway. Schemtic representation of the Wnt-signaling pathway described in section 2.4.3.1
14
Lundin A. 2013
many effects, one of them being the inhibition of GSK3β. Activation of PLCγ by FGF signals induces Ca2+ release prompting calcium/calmodulin (Dailey et al. 2005). MEK-ERK pathway (ERK1/2) is a key component of FGF-signaling mediating mesoderm differentiation (Yu et al. 2011). A schematic representation is presented in Figure 7.
2.4.3.3 TGF Signaling Signaling through the TGF superfamily can be divided into three major sub families, TGFβ, Nodal/Activin and bone morphogenic proteins (BMPs). TGFβ signaling is initiated by ligand interaction, which binds two subtype receptors, type II and type I, as linker. The type II receptor phosphorylates the type I receptor, which activates downstream effectors. BMP ligands bind to ALK3 (type I) and BMP-RII (type II), which through phosphorylation activates the SMAD1/5/8 complex. SMAD1/5/8 then binds with a co-activator, SMAD4, and translocate to the nucleus, activating transcriptional pathways. Other SMADs, like SMAD 6 and 7, have an inhibitory effect on these signaling transductions, as part of a negative feed-back loop. TGFβ signaling affects SMAD independent pathways, such as TAK1-MKK3/p38/JNK pathway, where TAK1 phosphorylation induces a cascade of phosphorylation steps including p38-MAP kinase, CREB and transcription factor ATF-2. (Wagner, Siddiqui 2007a, Verma et al. 2013). Activation through Nodal signaling occurs by ligand binding to a type II receptor ActR-IIB, which dimerize with a type I receptor, ALK4.
Figure 7 FGF-signaling pathway. Schemtic representation of the Wnt-signaling pathway described in section 2.4.3.2
15
Lundin A. 2013
However, an essential co-receptor, Cryptic, is already bound to the type I receptor, then creating a trimeric receptor when ActR-IIB dimerize. Subsequently the signal goes via activation by phosphorylation of SMAD2/3, which also binds with the signal transducer SMAD4, as the SMAD1/5/8 complex. SMAD4 binding translocate SMAD2/3 into the
criptional activators activating target genes. Besides the
degraded, freeing the Smo receptor, which inhibits the Fu-Cos2-SuFu-Gli complex to bind Gli and prevents it to be fragmented. When the full length Gli then binds to the promoter it activates the responsive gene (Wagner, Siddiqui 2007a). A schematic representation is
nucleus where it complex with transdifference in Smad signaling, Nodal and BMP signaling differ in their higher affinity to type II receptors and type I receptors, respectively (Wagner, Siddiqui 2007a, Verma et al. 2013). A schematic representation is presented in Figure 8.
2.4.3.4 Hedgehog Signaling There are three Hedgehog (Hh) responsive genes; Indian Hedgehog (Ihh), Desert Hedgehog (Dhh) and Sonic Hedgehog (Shh), which the lateral is the most studied. The basal state of the Hh pathway is repression. Two transmembrane receptor, Patched (Ptc) and Smoothened (Smo), binds together in a unactive Hh pathway. When Smo is hindered the Kinase fused protein (Fu), kinesin motor protein Costal 2 (Cos2) and suppressor of Fused (SuFU) creates a multiprotein complex Fu-Cos2-SuFu-Gli, which strongly binds transcription factors from the Gli family. Gli is then is fragmented into a zinc-finger without transcriptional activation domain. The zinc-finger is translocated to the nucleus and blocks the activation of the Hh responsive gene. However, when Hh ligand binds to the Ptc receptor it is endocytosed and
Figure 8 TGF-signaling pathway. Schemtic representation of the Wnt-signaling pathway described in section 2.4.3.3
16
Lundin A. 2013
presented in Figure 9.
2.4.3.5 Notch Signaling Notch signaling pathway is based on the release of peptides by proteolytic cleavage, which translocate into the nucleus and activate target genes. Notch is a transmembrane protein complex made of a Notch Extra Cellular Domain (NECD) and an intracellular domain Notch Intra-Cellular Domain (NICD). Activation of Notch is done by cell contact through Delta or Jagged binding to NECD. Activation will induce cleavage of NECD and NICD, which the later translocates to the nucleus where it binds to a DNA-binding domain, CSL; activating
2007b). Cleavage of the transmembrane receptor is governed transcription (Wagner, Siddiquiby presenilin-1 and γ-secretase. There are four Notch receptors in mammals, Notch1-4, which are activated by Delta like ligands, Delta-like1,2,4 and Jagged1,2 (Verma et al. 2013). A schematic representation is presented in Figure 10.
2.4.3.6 Retinoic Acid Signaling Retinoic acid is a metabolite derived from vitamin A. Retinoic signaling is performed by ligand binding of a dimerized receptor of two major groups, retinoic acid receptor (RAR) and retinoic X receptor (RXR), which aree either homodimerized or hetrodimerized. RAR and RXR are part of the nuclear receptor family, and both receptors have three isotopes, α/β/γ. Ligands to retinoic receptors are mostly mediated by all-trans retinoic acid and 9-cis-retinoic
Figure 9 Hh-signaling pathway. Schemtic representation of the Wnt-signaling pathway described in section 2.4.3.4
17
Lundin A. 2013
acid, which binds intracellular to the a receptor dimer which translocates to the nucleus. In the or complex binds to motifs know as RA-responsive elements
oderm induction
nucleus the ligand recept(RARS) which initiate transcriptional genes (Rhinn, Dolle 2012).
2.4.4 Cardiomyocyte Differentiation from Pluripotent Stem Cells The molecular pathways that control the differentiation process are intertwined in a complex network. Pathways that govern the mesoderm differentiation later inhibit cardiomyocyte differentiation, evidently providing a biphasic role of specific pathways in the signaling process. The major steps in differentiating PSCs to cardiomyocytes can be roughly explained in different stages; 1) mesoderm and cardiac mesoderm specification; 2) cardiac progenitor induction from cardiac mesoderm; and 3) cardiomyocyte differentiation. A fourth phase might also be the maturation of immature cardiomyocytes, a phase which is of huge interest in regenerative medicine and drug screening.
2.4.4.1 Mesoderm/Cardiac mesFGF2, which acts through MAP-ERK pathways, increases mesoderm specification from hPSCs in combination with BMP4, seen as increased Brachyury T expression. FGF2 prolongs NANOG expression, which is shown to be a downstream target of FGF, by ERK signaling (Yu et al. 2011), and Activin/Nodal signaling, by smad2/3 (Greber et al. 2010). NANOG as stated helps to differentiate hPCS into mesoderm lineage (Yu et al. 2011), but also assists
Figure 10 Notch-signaling pathway. Schemtic representation of the Notch-signaling pathway described in section2.4.3.5
18
Lundin A. 2013
inhibiting neuroectoderm induction (Greber et al. 2010).
Even though the timing of activating and inhibiting TGFβ, Nodal/Activin, BMP and canonoical-Wnt pathways are not fully explored, they are known to play an essential role in
diminishes mesoderm
arkers Mesp1 and KDR (Willems et al. 2012, Cai et al. 2012). Another pathway involved in the differentiation
mesoderm specification. The inhibition of TGFβ, Nodal and Wnt induction (Willems et al. 2012). BMP4 treatment of pluripotent cells, to activate the BMP-pathway, increases the differentiation towards a mesoderm/cardiac mesoderm fate, increasing expression of Brachyury T, Mesp1 (Ren et al. 2011), which is also seen in the combination of BMP4 and Activin A (Paige et al. 2010), as well as KDR, in a dose dependent pattern (Cheung et al. 2012). Wnt-signaling is necessary to promote cardiac mesoderm differentiation where inhibition at a pluripotent stage abolishes cardiac specification (Paige et al. 2010, Naito et al. 2006). Triggering the nodal and TGFβ pathway, which is necessary for induce cardiac mesoderm specification, increases the early specification m
process is the notch pathway, which through its inhibition during a pluripotent state induces mesoderm lineage specification by up-regulation of Brachyury T and Mesp1 (Jang et al. 2008).
p38 MAPK activation during cardiac lineage specification is necessary for the differentiation process to occur. Reduced activity of p38a diminished later expression of cardiac progenitor marker Mef2c, Mhca and Mlc2a (Aouadi et al. 2006, Wu et al. 2010). The p38MAPK seems to be critical at a specific time point during lineage specification, acting as a switch between different lineages. During cardiac specification p38MAPK has a peak in its activity, and if inhibited at this time point this will promote neural differentiation, whereas maintained high activity leads to cardiac lineage specification (Aouadi et al. 2006, Wu et al. 2010). The p38MAPK pathway seems to affect and induces the BMP pathway around the same time point (Aouadi et al. 2006, Wu et al. 2010), via regulation of MEF2C (Han et al. 1997), indicating the p38MAPK has a role in early cardiac commitment (Wu et al. 2010). The appearance of neural lineage is also seen when cultures are treated with RA, which inhibited p38MAPK activity. RA treatment had similar effects as when deleting the p38a gene (Aouadi et al. 2006).
2.4.4.2 Cardiac Mesoderm Specification to Cardiac Progenitors After the cardiac mesoderm specification and differentiation to multipotent cardiovascular progenitors, the pathways that induced this differentiation needs to be turned off in order for cells to further differentiate into a cardiac lineage. The notch pathway also needs to be inhibited to promote cardiac fate.
A prolonged activation of TGFβ and nodal signaling seems to favor endothelial instead of cardiomyocyte specification, where down regulation of cardiac progenitor markers Myh6, Mef2c and Tbx5 is seen, while endothelial markers, PECAM and Myh11, are up-regulated. Nodal expression decline due to negative feedback loop while expression of TGFβ persists (Cai et al. 2012). By actively inhibiting the TGFβ pathway at a later stage enhances the Myh6 expression (Willems et al. 2012, Cai et al. 2012). As a confirmation of the biphasic role of the TGFβ-pathway, inhibition in a pluripotent stage diminishes mesoderm specification (Willems
19
Lundin A. 2013
et al. 2012) and abolished Mesp1 expression (Cai et al. 2012). The inhibition of BMP, another
tor markers Nkx2.5, Gata4, Tbx5, Isl1 (Onizuka et al. 2012, Cohen et al. 2012), while
iac progenitor markers Gata4, Nkx2.5 and Mef2c, when over expressed in embryonic stem cells during differentiation (Gianakopoulos, Skerjanc 2005).
010). Inhibition of retinoic acid signaling enhances the immature cardiomyocyte population by increasing both the progenitor marker Nkx2.5 and
TGF superfamily pathway, results also in an increased cardiac progenitor specification with increased expression of Tbx5 (Onizuka et al. 2012), and an increased immature cardiomyocyte population (Zhang et al. 2011). A prolonged exposure to BMP4 provide instead of cardiac progenitors trophoblast like cells (Xu et al. 2002). The inhibition of canonical-Wnt signaling after cardiac mesoderm induction promotes differentiation towards a cardiac progenitor lineage (Willems et al. 2012), by increasing the expression Nkx2.5, Isl1, Gata4, Mef2c (Ren et al. 2011) and b-MHC (Paige et al. 2010), whereas induced canonical signaling inhibits this transition and promotes smooth muscle and endothelial differentiation instead (Naito et al. 2006). The inhibition of canonical Wnt before mesoderm specification reduces, or abolishes cardiac differentiation (Ren et al. 2011, Paige et al. 2010). The needed inhibition of canonical signaling for cardiac progenitor development and its negative effect whilst active is the opposite state than which is needed for mesoderm specification. Noncanonical Wnt-pathway induction at a cardiac mesoderm stage increased cardiac progenitor specification (Onizuka et al. 2012, Cohen et al. 2012) as well as the inhibition of canonical Wnt-signaling (Cohen et al. 2012). The activation increases expression of progenisilencing this pathway reduces previous mentioned markers. However, by turning off the non-canonical pathway at a pluripotent stage it did not affect cardiac mesodermal markers Brachyury T and Mesp1, indicating a role in promoting cardiac specification from cardiac mesoderm (Onizuka et al. 2012). Retinoic acid seems to be driving early cardiac progenitors to express Mef2c and it is suggested that Gata4 is a downstream target of RA (Li, Pashmforoush & Sucov 2010). In mouse it has been indicated that RA-signaling inhibit Fgf8 and Fgf10, thereby resulting in an increased proliferation of the Isl1+ population (Sirbu, Zhao & Duester 2008, Ryckebusch et al. 2008). The exact role of RA-signaling in vitro differentiation still needs to be further elucidated. As mentioned previously, inhibiting the notch pathway favors the cardiac progenitor specification, resulting in an increased expression of Nkx2.5, Gata4 and Tbx5 (Jang et al. 2008, Schroeder et al. 2003)(). Another pathway which is part of the cardiogenesis is the Sonic hedge hog, which is shown to up-regulate card
2.4.4.3 Cardiac Differentiation During the time point of progenitor maturation the inhibition of p38MAPK seems to favor this process. A significant increase in Gata4, Nkx2.5, cTnT and aMHC could be observed in beating formations (Gaur et al. 2
expression of the structural protein cTnT. Another effect by inhibiting RA-signaling is a strong up-regulation of the cardiac ventricle marker, Mlc2v, indicating that RA-inhibition also might specify immature cardiomyocytes into specific subpopulations (Zhang et al. 2011).
Even though a lot of information is gathered about the pathways governing the differentiation of PSCs to cardiomyocytes the network is still very complex. The results presented are regarding the activation and inactivation of pathways at vague time points. A number of
20
Lundin A. 2013
questions still need a lot more information before they can be answered. Which target should be chosen to activate/inactivate certain pathways, leading to the choice of reagents. Then the optimization of concentrations needs to be done, which will vary among cell lines depending on their endogenous signaling capacity. Often when trying to elucidate the effect of different pathways only a single or a few compounds are tried. The big combination of several compounds still needs to be performed, which probably will result in different optimal concentration each time a new compound is added to the cocktail. Then there always is the bothersome effect of batch to batch variation regarding compounds and factors, which will have significant impact in such a delicate system, where reagent gradients have an important effect in development.
2.4.5 Cardiomyocyte Differentiation Protocols Differentiating PSCs to cardiomyocytes by mimicking the embryonic development has resulted in several different protocols using slightly different factors and timings, each with its pro’s and con’s. The differentiation of PSCs can be performed using several different methodologies of which there are two main choices, either generating embryonic bodies (EBs), a form of large cell aggregates believed to mimicking embryonic development, or culturing cells as a monolayer. When going through EB-formation the creation and culturing protocols of EBs differ. The creation can be performed using hanging drop methodology (Takahashi et al. 2003), where cell suspension is added to a specific plate creating droplets in which the cells adhere to each other creating an EB. Another method to generat EB’s is to add cell suspension to a low-bind plate, in which cells do not attach to the surface as easily and hence leads to spontaneous cell aggregates (Kattman et al. 2011). This is similar to the hanging drop, but less controlled, creating EBs of different sizes. A third method in creating EBs is through forced aggregation by using a V-bottom well (Burridge et al. 2007, Elliott et al. 2011), forcing the cells to accumulate at the bottom of the well. In this way it is possible to regulate the size of the EBs. Culturing of EBs can be done in suspension during the entire differentiation process (Kattman et al. 2011) or plated onto a matrix coated surface at specific time points during differentiation (Minami et al. 2012, Willems et al. 2011). However, instead of culturing via EBs, direct monolayer differentiation can also be used (Hazeltine et al. 2012, Elliott et al. 2011, Laflamme et al. 2007, Hudson et al. 2012). The obvious difference between the EB-method and monolayer is that the former always create cell to cell contact, whilst using the monolayer method, cell density is critical for cell to cell contact, and needs to be optimized (Lian et al. 2012).
The medium composition in form of reagent combinations, concentration as well as addition time points vary greatly between protocols, and different authors emphasize different parameters or a key factor as being particularly favorable for the differentiation process. However, the protocols are based on a simplified timeline of first inducing mesoderm or cardiac mesoderm specification followed by differentiation into cardiac progenitors and then, subsequently, into immature cardiomyocytes. The maturation process of cardiomyocytes is however difficult to umambiguously define and is at present a matter of intense debate. Different protocols used are presented in Figure 11.
21
Lundin A. 2013
The first protocols suggested were based on spontaneous differentiation of suspension EBs by using a medium composition of 20% FBS, which eventually resulted in natural beating. However this resulted in very low differentiation of about 8% beating EBs (Kehat et al. 2001). By developing serum free medium, prompted by the discovery that insulin inhibits early cardiac specification, the differentiation improved (Xu et al. 2008). The negative effects of insulin on early differentiation is proven by another study (Freund et al. 2008), which showed that insulin had no inhibitory effect after a certain stage in the differentiation process (Freund et al. 2008), and even a proliferative effect in immature cardiomyocytes (McDevitt, Laflamme & Murry 2005).
It has been demonstrated that adding BMP4 and activin A increases the efficiency in l. 2012), and by adding FGF2 seems to differentiation (Laflamme et al. 2007, Hudson et a
increase the cardiac progenitor population even further (Yang et al. 2008). BMP4 and FGF2 have been shown to have synergistic effects, significantly increasing mesoderm differentiation (Yu et al. 2011, Greber et al. 2010). Kattmn et al. (2011), studying a cardiovascular population of KDR+ and PDGFRα+ cells of a human embryonic cell line, provided additional indications that the combination of BMP4 and activin A are favorable. At optimal concentrations of BMP4 and activin A there was a promotion of cardiovascular progenitors and the cardiac progenitor marker cTnT, which however was reduced significantly at too high
Figure 11 Three different methods for cardiomyocyte differentiation are presented in the figure; 1) EB format withadhesion to a surface, 2) EB format in a suspension, and 3) a monolayer format. The differentiation factors arecharacterized based on their applied function in the differentiation protocol; pre-differentiation factors, mesoderminducing factors, and cardiac specification factors.
22
Lundin A. 2013
concentrations (Kattman et al. 2011). Most interesting, the same group revealed different results when trying to differentiate an iPSC line toward cardiomyocytes, where the addition of activin A inhibited the differentiation instead of promoting it. Results then showed that the iPSC line had a 4-fold higher expression of endogenous expressed BMP4 then the ES line (Kattman et al. 2011), which is likely the cause of the different optimal differential conditions between the lines, since to high expression of BMP4 could induce alternative differentiation schemes (Xu et al. 2002).
Optimizing the induced cardiac differentiation by modulating the canonical Wnt pathway is proven successful when adding Wnt3a, a canonical Wnt activator, at the same time point as
signaling during cardiac progenitor specification the efficacy of differentiated cells increase (Minami et al. 2012, Paige et al. 2010, Willems et al. 2011), and by using small molecules as IWR-1, IWP-3, and XAV939, the efficacy is even higher comparing to using protein factors as DKK1 (Willems et al. 2011). Minami et al. (2012) discovered a quite novel small molecule, KY02111, which improved differentiation further compared to other Wnt-inhibitors, XAV939, IWP-2. IWR-1 and DKK1. The exact target of KY02111 is still unknown, but it acts differently opposed to XAV939 and IWP-2, and there are also indications that the combination of KY0211 with IWP-2 or XAV939 has better effect than either one alone (Minami et al. 2012).
Since indication of prolonged activation of TGFβ and nodal signaling favors endothelial specification (Cai et al. 2012), the use of inhibitors targeting these pathways are used. A small molecule inhibitor, SB-431442, target the TGFβ/nodal pathway, which evidently have been proven to increased cardiac progenitor differentiation (Cai et al. 2012, Kattman et al. 2011). A recent published compound, ITD-1, which is a specific TGFβ inhibitor, showed good results increasing the differentiation from mesoderm to cardiomyocytes, while additionally not inducing SMC or EC differentiation (Willems et al. 2012).The uses of Dorsomorphin (Kattman et al. 2011)cand Noggin (Zhang et al. 2011), as BMP-signaling inhibitors, have also show beneficial effects on cardiac progenitor specification. Inhibition of Notch-signaling, by GSI, also seems favorable during the differentiation of establishing cardiac progenitor (Jang et al. 2008).
There are also indications that inhibition of the p38MAPK signaling would assist with
days after the start of differentiation (Gaur et al.
FGF and BMP4. The inhibition of canonical Wnt by exchanging Wnt3a with Dkk1 reduced differentiation, but adding Dkk1 at a later time point induced the cardiac progenitor population (Paige et al. 2010). The use of other types of Wnt signaling modulators have also improved differentiation. The wnt-activator, CHIR99021, improves differentiation, which also could have a beneficial synergistic effect with BIO, which otherwise proved not to have a significant effect (Minami et al. 2012). Low oxygen tension can also activate canonical Wnt-signaling (Mazumdar et al. 2010), and has been proven effective in the differentiation process (Yang et al. 2008, Kattman et al. 2011) and more specifically having a significant effect in the initial phase of differentiation (Burridge et al. 2011). By inhibiting the canonical Wnt-
differentiation toward a cardiac progenitor fate. It is observed that the inhibition of p38MAPK, with SB203580, is very dependent on timing as for many other signaling pathways. The best effect is seen a few
23
Lundin A. 2013
2010). However, there are also indications that the activation of p38MAPK is necessary in early cardiac mesoderm specification, where a targeted inhibition at the maximal p38MAPK activity induced ectoderm differentiation (Aouadi et al. 2006, Wu et al. 2010). Even though the best effect of activation and inhibition overlaps in the different publications, the differentiation stage at which the cells are positioned is uncertain and consequently not ruling out the possibility of a biphasic role, but it needs to be further elucidated. RA also affects the p38MAPK and has an uncertain role. The addition of RA inhibits the p38MAPK and has similar effects as when deleting the p38a gene, which decreases cardiac differentiation (Aouadi et al. 2006). However, another publication indicates that RA is important for Mef2c activation in Isl1+ and Nkx2.5+ cell populations (Li, Pashmforoush & Sucov 2010), whereas inhibition of RA signaling at a cardiac progenitor stage induce differentiation towards different cardiac subpopulations is suggested else were (Zhang et al. 2011). Even though the impact of RA is uncertain many protocols use B27-supplement in their medium (Lian et al. 2012, Zhang et al. 2011, Hudson et al. 2012), which contain Vitamin C, a substrate for RA, indicating that differentiation is possible in the presence of vitamin A, but its effect remains uncertain.
VEGF has been used in differentiation protocols (Yang et al. 2008, Kattman et al. 2011, Elliott et al. 2011), but only Yang et al. (2008) display data on an increased differentiation effect following the exposure to VEGF.
A summary of the signaling pathways that govern the differentiation from a pluripotent state to a cardiomyocyte, based on the literature presented, is presented in Figure 12.
One thing to take into consideration is that the experimental design used in most studies are single compound treatments, or at most, in the combination of two or three additional compounds. Since the signaling pathways during developmental biolology are a complex
Figure 12 Signaling pathways that govern the cardiomyocyte differentiation from a pluripotent state to a maturecardiomyocyte
24
Lundin A. 2013
matrix there is a problem to understand which combinatory factors that are essential together when only evaluating them one by one. Using this methodology you will not be able to discover positive or negative synergistic effects, which likely will be crutial for the development of a specific and successful differentiation protocol.
2.5 Adipose Tissue The increased obesity has developed into being described as a world epidemic, relating to other diseases as cardiovascular disease, diabetes and cancer. As a consequence, the need for treatments in this area is crucial subsequently pressuring the need for good cellular models that can be used in future drug screening.
The in vitro models mainly used are divided into two main groups; preadipocytes, cells designated to the adipocyte lineage, 3T3-L1 (Green, Meuth 1974), 3T3-F442A (Green, Kehinde 1976)(Negrel, Grimaldi & Ailhaud 1978), Ob17 (Negrel, Grimaldi & Ailhaud 1978); and multipotent stem cells being able to differentiate into muscle, bone, cartilage and adipose tissue, C3H10T1/2 (Konieczny, Emerson 1984). All cell lines are derived from mouse and have been extensively used as models studying the adipocyte differentiation process. The
uman patients could be a solution to circumvent the
atural habitat, since they illustrate a huge placidity (Matsumoto et al. 2008). A consequence due to huge
whereas preadipocyte isolated from fat tissue can be propogated a few passages and then cryopreserved for future differentiation maturation and use. The low accessability can be partly solved by including several donors. However, this results in a large donor-to-donor varience, which is a major hurdle in result analysis. The application of hiPSC could be a solution, providing a large amount cells needed for drug screening and toxicity evaluations, and at the same time provide the possibilities of a larger biological relevance. However, to take advantage of the possibilities that hiPSC can provide, a proper differentiation protocol needs to be established.
Differentiation protocols have had quite similar appearance over the last decade (Tang, Otto & Lane 2003) due to the fact that the in vitro models described previously have been used. Therefore the differentiation protocols are applied to cells often already designated to the adipogenic cell lineage, a preadipocyte stage, which focus on terminal differentiation. The application of iPSCs needs a differentiation protocol governing the cells from a pluripotent cell state to a fully differentiated adipogenic state. There are few articles in which this is performed, and often with very low yield, when performing differentiation without transfection techniques (A
problem with using these in vitro models is the doubt concerning translability due to a murinae origin, as well as the question how the immortalization will affect future results.
The use of primary cells isolated from hproblems using immortalized mouse cell lines. However, one challenge using isolated primary adipocytes is to keep them in a differentiated state when taken out of their n
placicity is that the model used when isolating primary cells will affect the cells, resulting in a cell specific differential state dependent on the model used. A second problem is the limited access, which is too low for large drug screenings. Mature adipocyte can not be propoated,
hfeldt et al. 2012, Taura et al. 2009, Xiong et al. 2005).
25
Lundin A. 2013
2.5.1 Adipose Tissue Development Most mammals have two types of adipose tissue, white adipose tissue (WAT) and brown adipose tissue (BAT). These possess different functional properties where WAT primarily functions as energy storage in the form of triglyceride accumulation and BAT as a major
non-shivering heat production, through lipid and glucose brown description originates from their appearance where WAT
The energy consumption of cells is continuous while the energy intake is sporadic in higher
and
ipocytes, chondrocytes, osteoblasts (Pittenger et al. 1999), and
contributor to thermogenesis,combustion. White andcontain large unilocular droplets of triglycerides creating a light appearance whereas BAT encloses small multilocular droplets with an increased concentration of mitochondria, generating the dark appearance (Moreno-Navarrete, Fernández-Real 2012).
organisms, which creates the need for energy storage and distribution to supply the constant energy demand. This issue has been solved by storing energy in the form of triglycerides in the specialized tissue, by transformation of glucose and fatty acids. WAT is the most abundant tissue in mammals and the main tissue for energy storage. Its distribution varies among species and between individuals of the same species. However, there are two main depots of WAT, subcutaneous and intra-abdominal adipose tissue, which are located beneath the skin and surrounding the intestines and kidney, respectively (Gesta, Kahn 2012). These depots have different properties and function regarding production of bioactive moleculesmetabolic processes and activity, where intra-abdominal adipose tissue has higher metabolic activity than subcutaneous adipose tissue (Bays et al. 2008). The intra-abdominal adipose tissue is represented by several depots based on their anatomical location; mesenteric, omental, retroperitoneal, perirenal, mediastinal and epicardial adipose tissue (Gesta, Kahn 2012). Subcutaneous WAT have been further characterized based on structural and ultrasonic characteristics into deposit (dWAT), structural (sWAT) and fibrous (fWAT) WAT. dWAT is highly packed and has a rich and large lipid content with low amount of connective collagen structures, while sWAT display a stromal characteristics which is poorly displayed, present in limbs, containing good vascularity. fWAT is present in areas withstanding high mechanical stress containing thick collagen layers (Sbarbati et al. 2010).
Adipose tissue contain a heterogeneous population of cells including mature adipocytes, preadipocytes and stromal-vascular cells, such as fibroblasts, pericytes, smooth muscle cells and endothelial cells (Kats 2002). The adipose tissue is also composed of multipotent stem cells (Gimble, Guilak 2003), which can be isolated (Estes et al. 2010), and posses the ability to differentiate into adcardiomyocytes (Rangappa et al. 2003).
An old view of adipose tissue was that it only functioned as an energy storage, but was later seen as a endocrine organ (Mohamed-Ali, Pinkney & Coppack 1998). The adipose tissue secretes a number of hormones, proteins, cytokines (adipokines), and lipids, which reflects its active partition in metabolic homeostasis. However, many of the proteins secreted, RBP4, Resistin, TNFα, IL-6, can be associated with other cell types than adipocytes within the adipose tissue, but two proteins, leptin and adiponectin, are almost exclusively secreted by adipocytes (Fain et al. 2004).
26
Lundin A. 2013
Thermogenic activity can be categorized into shivering and non-shivering thermogenesis.
here BAT can be
& Friedman 2008, Zhang et al. 2004). A dKO of KLF4 and CREB, respectively, inhibits adipogenesis and down regulates
BPβ and PPARγ was recently performed by Park et
eedback loop with C/EBPβ. If the induction is not enough the
Shivering thermogenesis is the periodic contraction of muscle fibers without performing any major contraction, but only increasing the turnover of ATP thereby generating heat. Non-shivering heat production is performed in the mitochondria, where an uncoupling protein, UCP1, generates heat by exploiting the proton motive force, which normally is used for ATP production. In rodents BAT can be found in distinct locations; subcutaneously in the interscapular and subscapular region, intraperitoneally, mainly around the kidneys and adrenals, and intrathoracically, mainly surrounding large blood vessels, heart, trachea and esophagus. However, the distinction of WAT and BAT is not always clear, wfound in depots regarded as WAT depots and vice versa. Additionally, the depots are dynamic and change their appearance depending on ambient temperature or during development (Klingenspor, Fromme 2012). BAT was recently discovered to also be active in adult humans, located mostly supraclavicular and in the neck regions (Nedergaard, Bengtsson & Cannon 2007). This discovery has given new fuel to the debate if BAT also is active in metabolic regulation, trying to sustain energy balance (Nedergaard, Cannon 2010).
2.5.2 Major Genes in Adipocyte Development The expression profile from PSC to a mature adipocyte having a transitional characterization profile is not defined, especially the phase from PSC to preadipocyte, which is under constant debate (Cawthorn, Scheller & MacDougald 2012). An intermediate step in the cell differentiation process from PSC to an adipocyte is a multipotent cell state, called mesenchymal stem cell (MSC). MSCs are characterized and defined to be able to differentiate into osteoblasts, chondrocytes and adipocytes. Besides multilineage potential, the MSC is supposed to adhere to plastic and express the surface antigens CD73, CD105 and CD90, whilst being negative for CD45, CD34, CD14, CD79α and HLA-DR surface molecules (Dominici et al. 2006).
KLF4 together with CREB are early markers in adipocyte differentiation, which both binds to C/EBPβ promoter activating its transcription (Birsoy, Chen
C/EBPβ expression (Birsoy, Chen & Friedman 2008, Zhang et al. 2004).C/EBPβ and C/EBPδ play important roles in the onset of preadipocyte determination, which together has a catalytic effect inducing the expression of C/EBPα (Yeh et al. 1995). PPARγ and C/EBPα are master regulators of adipogenesis, which are necessary and sufficient to drive the differentiation process, which is greatly reviewed in Farmer et al. (2006). A thorough evaluation of the signaling relations between C/EBPα C/Eal. (2012), which suggested a bistable switch controlling the conversion of preadipocytes to adipocytes. The model, based on well documented experimental data, suggests an all-or-none switch, which allows the cells to disallow short and low stimuli for terminal differentiation. This is based on three consecutive positive feedback loops, first between PPARγ and C/EBPα, secondly between PPARγ and C/EBPβ, and finally between PPARγ and the insulin receptor. The cascade starts with C/EBPβ induction by glucocorticoids and increased cAMP levels triggering PPARγ and C/EBPα, activating their positive feedback loop. Increased levels of PPARγ triggers the positive f
27
Lundin A. 2013
PPARγ and C/EBPβ levels fall down, abandoning the differentiation, but with a sufficient induction the PPARγ and C/EBPβ levels increases and are sustained at a high levels overcoming the bistable switch. Insulin stimulation activates the third positive feedback loop with PPARγ, which however is not necessary for the switch to be made, but instead boost PPARγ expression after the switch. It was also shown that the activity in the insulin signaling pathway could be linked proportional to the lipid accumulation, meaning that when the switch is made there is no threshold to overcome to be able to accumulate lipids (Park, Ahrends & Teruel 2012). C/EBPβ has a transitional expression profile with high induction at early adipogenesis, but a low expression in immature adipocyte (Lechner et al. 2013). There are two isoforms of C/EBPβ, C/EBPβ-LAP and C/EBPβ-LIP, where over expression of the former one induce adipocyte differentiation, while C/EBPβ-LIP have an antiadipogenic effect (Lechner et al. 2013, Zaragosi et al. 2010).
Several maturation markers are indicative of immature and mature adipocytes. Several markers are linked to triglycerides, where cidea is a protein which is colodroplets together with perilipin (Puri et al. 2008), whereas FAB4, also known as aP2, which is
calized around lipid
mportant role in fatty acid solubilization,
ontrary, C3H10T1/2, is a mouse derived
increasingly expressed in preadipocytes, has an itransport and storage (Bernlohr et al. 1984, Banaszak et al. 1994). Adiponectin is a secreted protein, increasing insulin sensitivity, and is exclusively expressed by adipocytes (Scherer et al. 1995).
2.5.3 Adipocyte Differentiation Assessment Using Various Models When deciphering the signaling pathway, which will guide the differentiation process, one needs to consider the different models that are being used. Ob17, is a mouse cell lineage seen to represent a late preadipocyte stage, while 3T3-F442A and 3T3-L1 is characterized as advanced committed and early committed adipogenic lineages, respectively (Moreno-Navarrete, Fernández-Real 2012). On the cmesenchymal cell line, which is not committed to the adipogenic fate and do not spontaneously differentiate into adipocytes (Moreno-Navarrete, Fernández-Real 2012). These models can be used to observe if signaling pathways have stage specific funtions in the differentiation process, revealing eventual biphasic roles. However, the mouse origin always needs to be considered in a biological relevance aspect.
Already in the 1980s the development of an induction medium to drive the final differentiation of 3T3-L1 to adipocytes was developed. The cocktail contained IMBX, dexamthasone and insulin, referred to as MDI medium (Student, Hsu & Lane 1980). Dexamethasone is a glucocorticoid and has been shown to induce the expression of C/EBPδ (Yeh et al. 1995). Recently, it was demonstrated that dexamethasone promotes adipogenesis by suppressing the Runx2 gene. Runx2 is a master regulatory gene for osteoblast differentiation and when dexamethasone binds to the glucocorticoid receptor (GR) it translocates to the nucleus and binds to the Runx2 promotor region and inhibits its expression (Zhang et al. 2012). It is also shown that dexamethasone promotes adipogenesis by inhibiting INHBA expression, the gene transcribing inhibinβA protein that makes up activin A, which was demonstrated to inhibit adipocyte differentiation (Zaragosi et al. 2010). However, dexamethasone has been shown to have a negative effect on late commited/adipocyte
28
Lundin A. 2013
progenitor cells, 3T3-F442A, and in late exposure of 3T3-L1 cells. 3T3-F442A is independent of glucocorticoid stimulation, needing only insulin to drive the maturation (Caprio et al. 2007).
IBMX increase cAMP levels, which activates CREB, resulting in increased C/EBPβ expression (Zhang et al. 2004). Wnt10b is down regulated by high cAMP levels, which promotes Wnt inhibition and adipocyte differentiation (Bennett et al. 2002). However, in another study, did increased cAMP levels inhibited adipogenesis in MDI induced differentiation in a dose-dependent manner, signaling via PKA. Pretreatment with a cAMP inhibitor, SQ22536, increased expression levels of C/EBPα and PPARγ, which also was seen by inhibiting PKA with H89, a PKA inhibitor. Reduction of differentiation due to high cAMP levels could be rescued by adding H89, demonstrating that cAMP signals via PKA. The negative effect of PKA on adipogenesis is believed to be due to inhibition of insulin signaling
in the adipogenic differentiation cascade, uction of PPARγ and
ependent window of RA addition. Differentiation via EB formation with continuous culturing by adherent method demonstrated
(Li et al. 2008). The use of DMI is questioned in Li et al. (2008) due to their findings, and this display inconsistencies between results regarding cAMP induction, which needs to be further elucidated. However, in another study, the use of IMBX induces another important gene in the adipocyte differentiation, KLF4, which together with Krox20 binds directly to the C/EBPβ promoter, activating its transcription (Birsoy, Chen & Friedman 2008).
Insulin is part of the differentiation process partly by promoting phosphorylation of MAPK and CREB (Klemm et al. 2001), which are included(Zhang et al. 2004, Tang et al. 2005), but insulin is also part of the indlipid accumulation (Park, Ahrends & Teruel 2012). An additional component in the differentiation cocktail usually is a PPARy agonist. Pioglitazone is one example and is part of the thiazolidinedione (TZD) class and is a PPARy agonist, which promotes adipocyte differentiation (Forman et al. 1995).
2.5.3.1 Embryonic derived adipocytes Spontaneous differentiation of hESC to adipocytes occurs when using high concentration FBS condition media going via EB formation (Xiong et al. 2005). In the focus on increasing the differentiation efficacy, it was shown that the differentiation of mESCs toward adipocytes was influenced by a concentration specific and time d
that adding RA for 3 days after EB formation at a concentration of 100nM both induced expression of ALBP, adipsin and PPARy, but also inhibited spontaneous contractions (Dani et al. 1997). The positive effect of initial RA addition was strengthen by another study, which suggest that RA is signaling through the ERK pathway (Bost et al. 2002). Early RA treatment was later proven successful in both hESC and hiPSC (Taura et al. 2009). However, only number of EBs containing adipocyte colonies was assessed, and not quantitative percentage of total number of differentiated cells. The percentage of differentiated adipocytes derived from hESC and hiPSC has proven to be quite low (Ahfeldt et al. 2012). RA induced adipogenesis of mESCs acts via RARβ isomer, which is sufficient and necessary for adipogenic commitment. RA treatment decreased Wnt-signaling, but RARβ treatment did not, indicative that inhibition of Wnt might not be necessary for adipogenic induction of mESCs. Another interesting observation was that active GSK3 was required for RARβ induced adipogenesis,
29
Lundin A. 2013
which together with the fact that RARβs did not inhibit Wnt-signaling, suggests that GSK3 might act through another pathway than Wnt inhibition in early adipogenesis (Monteiro et al. 2009).
2.5.3.2 Mesenchymal derived adipocytes MSCs can differentiate into adipocyte, myocytes, chondrocytes and osteocytes (Pittenger et al. 1999, Rangappa et al. 2003). The multiline capability with MSC has also has been proven with human embryonic stem cell derived mesenchymal precursors (hESMPC), which was derived using a feeder layer (Barberi et al. 2005) and later also feeder-free derivation (Trivedi, Hematti 2008).
Addition of BMP4 to C3H10T1/2, as a pretreatment before MDI induction, is needed for adipocyte commitment. The same synchrony of G1-S phase as seen in 3T3-L1 differentiation, due to growth arrest, could also be observed in C3H10T1/2 pretreated with BMP4, which was necessary for differentiation induction (Tang, Otto & Lane 2004). Treatment of C3H10T1/2 with 5-aza-c, a methylation inhibitor, was used to isolate an early committed adipocyte line, A33. Through evaluation of the endogenous signaling of A33 it was seen that BMP4 was expressed in the proliferative phase before growth arrest and MDI differentiation. Using Noggin to inhibit the BMP4 signaling completely block the adipose commitment and
). Confirmation that BMP4 induction has a biological relevant aspect was proven when BMP4 treated C3H10T1/2 was implanted into epididymal
subsequent differentiation, revealing that BMP4 is part of line adipocyte commitment (Bowers et al. 2006). Interestingly was that untreated C3H10T1/2 eventually expressed BMP4, but contrary to A33, this occurred when growth arrest was achieved. Evaluation of the BMP4 promoters revealed that promoter 1A was active in A33 and promoter 1B was active in C3H10T1/2, indicative that 5-aza-c may have altered the methylation characteristics in adipose commitment (Bowers et al. 2006). BMP4 has been shown to act mainly via Smad, but also p38 MAPK (Huang et al. 2009
adipose tissue. BMP4 treated C3H10T1/2 developed into morphological similar tissue as the native tissue, which non BMP4 treated C3H10T1/2 failed to do (Tang, Otto & Lane 2004). Initial RA treatment seems to favor adipose commitment of mESC (Dani et al. 1997, Bost et al. 2002, Monteiro et al. 2009). However, BMP4 induced C3H10T1/2 commitment was inhibited by RA addition, acting through RARβ receptor. RA also inhibited the BMP4 activation of SMAD1/5/8 and P38MAPK pathways (Lee et al. 2011).
Proteomics profiling of C3H10T1/2 treated with BMP2/4 displayed a large up regulation of three cytoskeleton proteins, LOX, TPT1, and αB-crystallin compared to non-treated C3H10T1/2. Inhibition of LOX completely blocked the adipose commitment, while TPT1, and αB-crystallin had an inhibitory effect, demonstrating that cytoskeleton proteins are involved in adipocyte commitment (Huang et al. 2011). Another study showed that cell density has a large impact on cell commitment of hMSC towards adipocyte and osteoblasts, where low density with spread out morphology favors osteoblast commitment, while high density with round up morphology favors adipocyte commitment. The impact of cell density was linked to the actomyosin cytoskeleton, which was increased in osteblasts, showing an increased RhoA activity compared to adipocytes. The expansion of actomyosin and commitment to osteablast lineage could be inhibited by using a ROCK inhibitor, which
30
Lundin A. 2013
decreased alkaline phosphates, an osteoblast marker, and increased lipid formation. Tranfecting a dominant-negative RhoA construct into the cell line, inhibiting the RhoA signaling, could drive the adipose commitment, even without inducing factors (McBeath et al. 2004).
that active Wnt-signling is part of early preadipocyte commitment.
A comparative evaluation of C3H10T1/2 and A33 demonstrated increased expression of R-spondins, proteins indicative of active Wnt signaling, were observed to be elevated in A33 relative to C3H10T1/2. Increased activation of Wnt-signaling in A33 was also supported by higher accumulation of β-catenin in the nuclei than in C3H10T1/2 (Bowers, Lane 2008). This might indicated
Hedge hog (Hh) signaling is down regulated during adipocyte differentiation of mASC (James et al. 2010) and hMADS (Fontaine et al. 2008). Hh is involved in the proliferation of hMADS. Inhibiting Hh by using cyclopamine, which bind directly to smoothened, decreased proliferation of hMADS and increases the active hypophosphorylated form of pPb, which binds E2F (Plaisant et al. 2011). Differentiation effects by inhibition of Hh varies between species, where inhibition of Hh significantly promoted adipogenesis in mASC (James et al. 2010), while no significant effect was seen with hMADS (Fontaine et al. 2008). However, by inducing Hh signaling during the complete differentiation process reduced adipogenesis (James et al. 2010, Fontaine et al. 2008), which on the other hand was not observed when Hh only was induced in an early step during adipogenesis (Fontaine et al. 2008). Hh activation was also observed to inhibit adipocyte differentiation of C3H10T1/2 and mASC, and having a positive synergistic effect with BMP2 when differentiating towards osteoblast lineage (James et al. 2010, Spinella-Jaegle et al. 2001).
Activin A is secreted by undifferentiated human mesenchymal adipose derived stem cells (hMADS) and enhances their proliferating capacity (Zaragosi et al. 2010), which however was not seen during MCE with 3T3-L1 cell line (Hirai et al. 2005). Upon differentiation of hMADS activin A is down regulated, and by chronically exposing hMADS to activin A during adipogenesis induction completely inhibits the differentiation (Zaragosi et al. 2010), which was also seen with 3T3-L1 lineage, but not as dominant in late phase differentiation (Hirai et al. 2005). Activin A signals through Smad2, and repressing Smad2 by siRNA silencing could abolish the activin A inhibition (Zaragosi et al. 2010). Over expressing Smad2 inhibits adipogenesis (Choy, Skillington & Derynck 2000). The inhibition effect of activin A on adipocyte differentiation is by down regulating C/EBPβ expression, which was confirmed by abolishing the inhibition by over expressing C/EBPβ-LAP. Addition of SB431542, an inhibitor of TGF signaling by inhibition of the ALK5 receptor, significantly promoted differentiation of hMADSs to adipocytes. An increased level of INHBA has also been found in subcutaneous WAT of obese subjects compared to lean subjects (Zaragosi et al. 2010).
Recently it was discovered that noggin might be a novel inducer of adipogenesis. Differentiation of mMSC, without MDI induction, using noggin increased C/EBPβ, C/EBPα and PPARγ expression similar as when using MDI only. Noggin induced adipogenesis seems not to go through the regular pathways used by the MDI induction. Inhibiting adipocyte differentiation by inhibiting the classical pathways of MDI, by using several different
31
Lundin A. 2013
mediators, could always be rescued by adding noggin. Increased noggin plasma was also linked to obese individuals and mice. Mesenchymal stem cells from obese mice differentiated with MDI did not need additional noggin to sustain differentiation when treated with MDI-pathway inhibitors. Noggin induced adipogenesis was proven to be mediated through Pax1
oliferating hMADS showed a better differentiation potential than slow dividing hMADS. FGF2
comparison between cell origins showed that FGF1
es the
activation, a possible novel differentiation pathway (Sawant et al. 2012). However, these results are somewhat contradictive to the results presented by Bowers et al. (2006), where noggin treatment during BMP4 induction of C3H10T1/2 inhibited the commitment (Bowers et al. 2006).
FGF2 treatment of hMADS sustained their proliferation capacity, where high pr
increased signaling through ERK1/2, and inhibiting the ERK1/2pathway, by inhibiting MEK1, decreased FGF2 mediated proliferation, but did not demonstrate any clear differentiation effects (Zaragosi, Ailhaud & Dani 2006). Another FGF, FGF1, demonstrated, besides an increased proliferating affect, a differentiation effect on primary human preadipocyte (phPA). Pretreatment with FGF1, followed by differentiation induction, increase lipid accumulation, and increase expression of PPARγ and G3PDH. The addition of FGF1 also decreased the expression of FGFR2 (Widberg et al. 2009), a similar effect also observed in another study (Mejhert et al. 2010), where FGF1 was increased while FGF2 decreased during differentiation. An increased expression of FGF1 was also linked to obese individuals (Mejhert et al. 2010). The largest effect on phPA differentiation was seen when FGF1 was added before and during differentiation induction (Hutley et al. 2004). Addition of FGF1 also increased functionality of phPA, by increasing adiponectin secretion and insulin responsiveness (Newell et al. 2006). A pretreatment of 3T3-L1 did not significantly increase the differentiation. However, a strong basal expression of FGF1 was demonstrated in 3T3-L1, and the inhibition of FGF1 before differentiation induction showed a significant decrease in differentiation effect (Hutley et al. 2004). FGF1 signals through the ERK1/2 pathway (Newell et al. 2006), which seems to be necessary for MCE in 3T3-L1 (Tang et al. 2005). However, but phPA did not undergo MCE, indicating that ERK1/2 pathway is also required in absence of MCE (Newell et al. 2006). Off note, additionally to FGF treatment, PDGF also showed increased proliferation but no differentiation effect, while VEGF showed no effect (Widberg et al. 2009).
2.5.3.3 Preadipocyte derived adipocytes Growth arrest makes cells reenter the G1 phase and by induction with MDI the cells enter the S-phase and perform two mitotic cycles, known as the mitotic clonal expansion (MCE). MDI inductions of 3T3-L1 quickly induce expression of C/EBPβ and C/EBPδ, but they lack DNA binding abilities to C/EBP regulatory element. However, when the cell enters the S-phase, initiation of MCE, C/EBPβ and C/EBPδ acquires binding abilities which then drivdifferentiation (Tang, Lane 1999). Cells then exit the MCE due to increased levels of C/EBPα (Timchenko et al. 1996) and PPARγ (Altiok, Xu & Spiegelman 1997), having an antimitotic effect. MCE has been shown to be necessary for the differentiation of 3T3-L1 into adipocyte (Tang, Otto & Lane 2003). The differentiation induction, involving MCE, includes an increased level of cAMP and subsequently the expression and activation of CREB. CREB
32
Lundin A. 2013
binds to the promoter region of C/EBPβ, and drives its expression (Zhang et al. 2004). C/EBPβ is however, as mention, inactive, but through a double phosphorylation, first by MAPK and later by GSK3β, C/EBPβ becomes active (Tang et al. 2005).
Differentiation of early committed adipocytes, 3T3-L1, to adipocytes is inhibited by activation of Wnt-signaling by using CHIR99021, a GSK3 inhibitor, at the first days of differentiation, but is ineffective in subsequent treatments. CHIR99021 do not affect C/EBPβ and C/EBPδ, but completely blocks C/EBPα and PPARγ expression (Bennett et al. 2002). Wnt10b, a Wnt-activator, is down regulated during adipogenesis (Ross et al. 2000), which is
ring spontaneous differentiation, during insulin induction, the expression of TGFβ receptors decreases (Choy,
also an effect of IBMX, addition, due to increased cAMP levels (Bennett et al. 2002). In human stromal vascular cells the detection of Dkk1, a Wnt-inhibitor, was observed directly after differentiation induction, indicative that the necessity of Wnt-inhibition is conserved between species. Dkk1 also promoted adipogenesis in 3T3-L1 (Christodoulides et al. 2006). PPARγ activation has been shown to lower β-catenin levels, through GSKβ activity (Liu, Farmer 2004) or directly through the TCF/LEF-binding domain of β-catenin (Liu et al. 2006).
RA treatment inhibits adipogenesis in 3T3-L1 (Xue et al. 1996), by stabilizing β-catenin levels, which is normally down regulated during differentiation. RA did not increase mRNA expression of β-catenin, but increased protein levels indicating stabilization of the β-catenin. RA treatment was shown to induce Wnt-1 and Wnt-4 expression, which promoter regions has direct binding sites for RAR/RXR, via RA acts, highlighting a connection between RA and the Wnt-pathway (Kim et al. 2013). However, RA addition is ineffective at a later stage of differentiation, suggested to be due to reduction of RAR concentration during adipogenesis (Xue et al. 1996).
The TGFβ pathway inhibits adipogenesis, demonstrated by adding TGFβ to a T3T-F442A culture resulting in loss of lipid formation and extensive down regulation of PPARγ and C/EBPα (Choy, Skillington & Derynck 2000). Adding SB431542, a TGFβ inhibitor, promoted adipogenesis of hMSCs during MDI induction (Ng et al. 2008). Differentiation inhibition by TGFβ is mediated via Smad3 (Choy, Skillington & Derynck 2000), which together with Smad4 physically interacts with C/EBPβ and C/EBPδ inhibiting their transcription function (Choy, Derynck 2003). It was also noted that du
Skillington & Derynck 2000, Ng et al. 2008).
A summary of the signaling pathways that govern the differentiation from a pluripotent state to an adipocyte, based on the literature presented, is presented in Figure 13.
33
Lundin A. 2013
34
Figure 13 Signaling pathways that govern the adipocyte differentiation from a pluripotent state to a mature adipocyte.The different stages is however unclear, where stage specific markers are not deterimed in literature.
Lundin A. 2013
3 Results The cardiomyocyte differentiation has been successful, where a protocol EB has been evaluated. Beating monolayers of cardiomvia dissociation of EB and through direct differentiation from a m
resulting in beating yocytes have also been achieved both
onolayer set-up.
The adipocyte differentiation did not work as desired, where a robust protocol never was achieved. Focus has been on evaluating the cells through functional assays, but since the differentiation efficiency has been too low, the assays gave no significant results.
3.1 Cardiomyocyte Differentiation
3.1.1 EB Differentiation By using the forced EB methodology of Burridge et al. (2011), it was possible to get a yield of 26% of spontaneously contracting EBs. To increase the collection of cells in the bottom of the well, a centrifuge stage was tried directly after seeding the cells into the low attachment V-bottom well plate (V-wp). However, this did not demonstrate any significant effect in increasing EB formation or the number of contracting EBs (data not shown).
sted e EB formation after seeding and made EBs more compact, also seen in (Burridge et al.
2007), which otherwise resulted in very sensitive and fragile EBs. Evaluation of different late formats and EB sizes demonstrated an effect on the percentage of spontaneously
contracting EBs. Seeding 5000 cells/96well (5K) generated a low number of EBs and thereby also a low percentage of contracting EB, approximately 7%. Seeding density at 8000 cells/96well (8K) generated a significantly higher percentage, approximately 60% contracting EBs (Figure 14). The contractility was also affected by the plate format, were plating of EBs resulted in the highest percentage compared to keeping the EBs in suspension or V-wp (Figure 14). Contractility decreased over time (Supplement Video 1,2), but spontaneously contracting EBs was kept in culture up to 60 days , both in suspension and plated.
Including polyvinyl alcohol in the medium, specified in the Burridge protocol, truly booth
p
Figure 14 Plate format affected the percentage of contracting EBs. Plating the EBsresulted in the highest percentage of 58,6%, followed by U-bottom, 46,6% and V-bottom, 26,7%.
35
Lundin A. 2013
Evaluating other published protocol, such as those from Yang et al (2008) and Minami et al.
idge et al. (2011) resulted in successful result. However, activation of Wnt-signaling by BIO, as used in
EB size to 8K EBs created a protocol generating cting EBs (Supplement Video 3). A repeatedly occurring
he EBs stopped
(2012) did not result in any successful formation of EBs. However, by activation and inhibition of the Wnt-signaling pathway (Minami et al. 2012, Yang et al. 2008), using CHIR99021 and IWP2, respectively, in combination with the protocol of Burr
the protocol by Minami et al. (2012), did not result in “normal” size EBs, indicating that BIO do not promote EB formation and cardiac development at this stage in our experimental set up (Figure 15)
The exclusion of BIO and optimization of100% spontaneous contraphenomenon was that the EBs started to form balloon structures, which was paralleled by a decreasing beating capacity. Spontaneously contracting 8K EBs was kept in culture up to 56 days. However, during the long term culture, balloon structures increasingly developed irrespectively of EB size (Figure 16), which lead to more irregular contractility with lower frequency and force, and in some cases eventually loss of spontaneous contraction. Even though some EBs could be kept contracting up to 56 days the majority of tbeating after about 30 days. Staining of dissociated EBs showed that the EB consist of a heterogeneous cell population, staining positive for SMA, α-actinin and cTnT (Figure 17).
Figure 15 Addition of BIO reagent. The addition of BIO in the initial phase of EB formation reduced the EB size andeventually the EB was lost.
36
Lundin A. 2013
37
Figure 16 The amount of cells seeded into a well, creating the EB formation, affected the contractibility of the EB.Seeding below 8000 cells/EB resulted in massive balloon structures, which inhibited the spontaneous contraction..
Figure 17 After dissociating the EB it population w
was plated and analyzed through ICC. The results display a heterogeneoushich stains positive for smooth muscle actin (SMA), α-actinin, and cardiac troponin T (cTnT). There are
o indication that there is an increase of SMA and cTnT from day 7 to day 14. However, this was not quantified. als
Lundin A. 2013
38
Changing the Wnt-inhibitor in the cardiac progenitor specification phase had significant effects on beating frequency. The use of a combination of XAV939 and KY0211, as in Minami et al. (2012), significantly increased the initial beating frequency compared to EBs treated with IWP-2 (Figure 18, Supplement Video 4,5) However, the difference in beating frequency between the two treatments decreased over time and eventually disappeared (Figure 18). ICC imaging of XAV939 and KY0211 exposed cells also showed indications of increased expression of cTnT compared to IWP-2. It was also shown that without addition of a Wnt-inhibitor no spontaneous contractions were observed (data not shown).
3.1.2 Monolayer Differentiation The monolayer model was first performed by dissociation of beating EBs, aiming at a single cell suspension, which then was re-plated at a specific cell density. The dissociation often resulted in partial dissociation and a monolayer containing 3D clusters. A few days after dissociation, independently beating 3D clusters could be observed (Supplement Video 6), which over a couple of days matured and started to contract simultaneously (Supplement Video 7.)
Figure 18 Wnt inhibition reagents. Wnt inhibition was performed with two treatments, either by addingIWP2 or the combination of XAV939 and KY02111. The contraction frequency was initially significantlyhigher with EBs treated with XAV939+KY02111 compared to IWP2. However, the contraction frequencydecrease continuously over time and the difference in contraction frequency between the two conditions waslost. Statistical calculations was done using a Student’s t-test, n=8.
Lundin A. 2013
Dvarious dissociation reagents, and commercia
Figure 19 Matrix evaluation. The monolayer method was very sensitive to different matrixes. Using no matrix, gelatinor collage I resulted in cell aggregates, whereas using fibronectin or pluripro matrix resulted in a homogenous layer.4x magnification was used.
ue to the fact that the dissociation of the EBs proved to be difficult, despite evaluation of lly available dissociation kits, direct
differentiation of a monolayer cultures was evaluated. The EB protocol used to create the monolayer from dissociated EBs was directly applied in a monolayer format. However, the cells started to form cell aggregates, indicating that using tissue culture treated well plates without coating did not create a homogenous monolayer. The cell masses that were created did however start beating. Fibronectin, Pluripro Matrix, a commercial matrix product, and growth factor reduced (GFR) Matrigel were coatings that resulted in homogenous monolayers, whereas gelatin and collagen I created heterogeneous layers containing cell clusters (Figure 19). The cell density was proven to be significantly important, were seeding densities between 200-300K/cm2 resulted in beating monolayers (Supplement Video 8). The protocol was however hard to recreate, resulting in evaluation of other published protocols (Lian et al. 2012, Hazeltine et al. 2012). Neither of the protocols resulted in any beating and Hazeltine et al. (2012) was to a large portion stained positive for SMA (Figure 20).
Modification to the EB protocol was done by removing PVA, which was used in the EB method to increase the EB formation and could not be seen to have any significant effect in m d by F tion w Kit+ po in a beating monolayer. An attempt to FACS analysis targeting the Nkx2.5 population was performed, but very high unspecificity f the antibody made the data not valid. The qPCR analysis at day 25 also showed an
Mesp1, Gata4, Nkx2.5, Isl1, cTnT, and Myh6, while no detection of ct4 was observed (Figure 22). Exchanging IWP-2 to KY02111 resulted in a reduction of
cardiac markers, Gata4, Nkx2.5, cTnT and Myh6, but an increase in Isl1 expression, compared IWP-2 and XAV939. Treatment with XAV939 promoted a large induction of Mesp1, ata4, Nkx2.5, Isl1, cTnT, and Myh6, where the Nkx2.5 and Myh6 had a 43 and 23 times fold
orphological changes. After mesoderm induction a KDR+cKit- populations was observeACS analysis, indicative of cardiac mesoderm specification. A cardiac progenitor populaas observed after Wnt-inhibition by IWP-2, indicated by the detection of a KDR- and cpulation (Figure 21), which a few days later resulted
aoincreased expression of O
toG
39
Lundin A. 2013
Figure 20 ICC staining for smooth muscle actin (SMA) afterdifferentiation using the protocol published by Hazeltine et al.2012. 4x magnification was used.
change compared to IWP2 (Figure 23). However, whereas IWP2 treatment produced spontaneous cell contractions no spontaneous cell contractions were observed following treatment with XAV939.
Since IWP2 previously resulted in spontaneous cell contractions a more time specific evaluation of the differentiation process was performed using IWP2 as Wnt-inhibitor. However, in contrast to previous findings the IWP2 did not produce any monolayer beating. qPCR analysis shoed that the expression of Gata4, Nkx2.5, Isl1, cTnT and Myh6 was increased at time point 4, but then all markers, besides Isl1, was greatly reduced by time point 5 and then continued to decrease to time point 6 (Figure 24). An interesting observation is however that when the monolayer started to detach at time point 6 and merged into a large cell mass it started to beat.
Figure 21 FACS analysis performed early in the differentiation at time point 1 (Tp1)displayed a KDR-positive and cKit negative population, whereas later during the
40
differentiation a cKit positive and KDR negative population was achieved. FACS analysiswas performed using FACS Aria II.
Lundin A. 2013
41
Figure 22 qPCR analysis at day 25 displayed no Oct4 expression, whereas all other marker wereup-regulated. Calculations done relative to iPSC. No statistical analysis was performed due to toofew biological replicates. Technical replicates n=3.
Figure 23 Wnt inhibition was performed using IWP2, XAV939 or KY02111, respectively. Oct4 was not detected inany conditions. XAV939 induced the highest expression of Mesp1, Gata4, Nkx2.5, cTnT, Mygh6 and Mlc2v comparedto KY02111 and IWP2, whereas KY0211 induced the highest expression of Isl1. Calculations done relative to iPSC.No statistical analysis was performed due to too few biological replicates. Technical replicates n=3.
Lundin A. 2013
Figure 24 RNA samples were taken at 5 time points (Tp) excluding the iPSC state. 7 factors were analyzed at eachtime point. Oct4 is clearly expressed in the iPSC-line and is reduced during differentiation and is abolished at Tp3.Mesp1 has a high expression at Tp1-2, but is not detectable at Tp3. Isl1 is expressed at Tp3 and continues to beexpressed throughout the experiment. Gata4 expression has a peak at Tp3. Nkx.2.5 is highly expressed at Tp3 but isnon-detectable at other Tp, whereas cTnT has a similar pattern but decreases more slowly after Tp3. M
ical peak at Tp3 as cTnT. Calculations done relative to iPSC. No statistical analysis was performeiological replicates. Technical replicates n=3.
yh6 has theident d due to toofew b
Usage of vitamin A did not generate any conclusive results. Addition of vitamin A up to a cardiac progenitor phase, which was defined by a control population, did not result in any spontaneous contracting cardiomyocytes. The combination of using vitamin A and a ROCK inhibitor resulted in massive balloon structures, whereas vitamin A only generated a very homogenous layer, but without any spontaneous contractions (Figure 25). A short 24h induction of vitamin A also resulted in smaller contracting areas, compared to no treatment. The cardiac marker expression is however inconclusive, showing both higher and lower expression of cardiac markers compared to treatment without vitamin A (Data not shown).
Figure 25 Using vitamin A in combination with a ROCKi resulted in massive balloonstructures, whereas adding vitamin A without ROCKi resulted in a very homogenouslayer, but did not result in any spontaneous contractions. 4x magnification was used.
42
Lundin A. 2013
Adding TGFi, a TGFβ/Nodal inhibitor, at specific concentrations and addition time points furthered increased expression of cardiac specific markers in the differentiation process. Adding TGFi at time point B resulted in a significant up-regulation of Nkx2.5, cTnT and Myh6 expression compared to treatment solely with IWP-2 (Figure 26), whereas a reduction in Isl1 expression. In contrast, treatment with TGFi at time point A did not result in a higher expression of cardiac differentiation markers compared to IWP-2 alone, but instead lowered the expression, which was significantly decreased at a higher concentration of TGFi (Figure 26). An ICC staining for cTnT and Nkx2.5 of the monolayer is displayed in Figure 27.
A common problem using a monolayer model has been delamination. Almost all experiments have eventually resulted in detachment of the monolayer, which has occurred around the time point when spontaneous contractions have been observed. This has resulted in difficulties when trying to study maturation of cardiac progenitor cells and immature cardiomyocytes.
Figure 26 qPCR analysis performed evaluating the addition of TGFi. The results displayed a significant increase inNkx2.5, cTnT and Myh6 expression when TGFi was added at TpB, but was reduced when added at TpA, relative tono addition of TGFi. However there was no significant difference in Mesp1 expression whereas Isl1 expression weresignificantly reduced in 5µM TpA and 0,25µM TpB. Gata4 had significantly higher expression when not treated withTGFi compared to the other conditions. Fold change was calculated relative iPSC. Statistical analysis was calculatedrelative No TGFi condition using Student’s t-test, n=3, technical replicates n=3.
43
Lundin A. 2013
44
Figure 27 ICC staining of TpB 0,25µM TGFi condition using cTnT (green) and andibodies. 4x magnification was used.
Nkx2.5 (red)
Lundin A. 2013
3.2 Adipocyte Differentiation
.2.1 White Adipose Tissue Differentiation Using the classic protocol of preadipocyte differentiation in the differentiation of iPSC resulted initially in a large portion of cells containing lipid droplets (Figure 28).
These promising results lead to a functional evaluation through glucose uptake and lipolysis assays (Figure 28, Figure 29). To see if there was any glucose uptake response a basic three point insul d, which at the seeding densities of 150K/cm2
3
Figure 28 Oil ted O staining and glucose uptake analysis. The classic preadipocyte differentiation protocol generated a lipidaccumulation, observed though Oil red O staining. The experimental set-up included three different densities, 50K/cm2,100K/cm2 and 150K/cm2, which was treated with and without ROCKi at seeding, otherwise the same protocol was used for allcell densities. A tendency of insulin response was observed in 150K/cm2 condition during the glucose uptake test.
in induction test was performe
45
Figure 29 Lipolysis analysis. In the end of the differentiation process a lipolysis analysis wasperformed on 50K/cm2 and 150K/cm2 conditions treated with and without ROCKi at seeding.No dose response was observed in any conditions. The concentration gradient goes from 2mM-5,5µM glycerol (Red to blue).
Lundin A. 2013
generated data indicating a insulin sensitivity in a dose response way. This is vaguely seen in 2 condition. However, lipolysis assays did not provide any indications that the
ells had an active lipolysis function (Figure 28, Figure 29). When trying to reproduce the sults indicative of insulin se sitivity this could not be performed with the same consistency.
An insulin response could be detected, but the results varied largely between wells of the
the 100K/cmcre n
same condition. The heterogeneous results can be correlated to the huge differences in morphology between wells.
Repeating the same experimental set-up with human preadipocytes as a control revealed another morphology in the lipid droplet formation compared to the ones observed in iPSC differentiation. The droplets accumulated in the preadipocytes had a more 3D-morphology, as no focus could be found in the microscope, in contradiction to the circular formation in the iPSC differentiation, which had one specific focus plan (Figure 30). Both Oil red O and LipidTOX staining showed that the circular formation in the iPSC differentiation did not contain triglycerides compared to the 3D droplets of the preadipocyte differentiation, which stained positive with LipidTOX. There was some staining of triglycerides in the iPSC differentiation, approximated by microscopical observation to a few percent (Figure 30).
Figure ame classicdifferen ation with
This wasconfir of stainedpreadip
30 Brightfield and LipidTOX. iPSC and primary preadipocyte were differentiated using the stiation protocol. Brightfield images display that differentiated primary cells contain lipid form
distinct 3D morphology, whereas iPSCs have a flat, planar structure, indicative of non lipid formation.med using LipidTOX, staining triglycerids, which demonstrated a significant larger area
ocytes compared to iPSC differentiated cells. LipidTOX staining evaluated using ImageXpress.
46
Lundin A. 2013
Off note, observation done when differentiating preadipocytes was that when using a PPARγ , proven by high content imaging,
3.2.2 Brown Adipose Tissue Differentiation The recreation of the novel differentiation protocol of iPSC to BAT published by Nishio et al. (2012) did not provide desirable results. Three plate formats were tried, 6 well plate low bind (6WpLB), 96 well plate low bind (96WpLB) and 96 well plate monolayer (96WpM). Even though the same protocol was used these formats generated very different morphological changes during the differentiation process. The development of a reddish tissue appeared in 6WpLB-format along with a low adhesion ability (Figure 31), which did not appear in the other conditions.
agonist, rosiglitazone, in the classic differentiation protocolsignificantly increases the amount of accumulated triglycerides (Data not shown).
Staining with Oil red O did only stain a small amount of cells, but it felt correlated to unspecific staining of 3D formations than to triglycerides, this since no 3D-droplet formation was observed in bright field microscopy. Confirmation of the low staining of lipid droplets was proven by an undetectable level of AdipoQ expression in the qPCR analysis. Additionally, the high expression of Oct4 in the iPSC line was still detectable after the differentiation protocol, meaning that Oct4 was not sufficiently down regulated. However, an interesting observation was that Ucp1, a marker that is up regulated in BAT, was highly expressed in undifferentiated iPSCs, which after the differentiation protocol was down regulated (Figure 32). Western blot analysis show that the UCP1 protein in iPSCs had a higher molecular weight than the UCP1 protein observed in differentiated human adipose stem cells (hASC) and purified mitochondria from rat BAT (Figure 33).
Figure 31 Using a 6 well plate low bind during the BAT differentiationresulted in intense red 3D morphologies, which was not observed inother plate formats.
47
Lundin A. 2013
48
Figure 32 qPCR analy in iPSCs which is alsodisplayed in both di Adipocytes or negativecontrol. A vagu UCP1 is highly expressedboth in iPSC and as seen in anysamples except in hAd g gene. Note that iPSCsamples has a slightly str
sis run on a 3% agarose gel. Oct4 expression is clearly expressedfferentiation samples, 96wp-BMP7 and 96wp-Rosi, but is not detected in h
e expression of Cidea is seen in iPSCs and a high expression in hAdipocyte. hAdipocytes, whereas vaguely in differentiation samples. No AdipoQ expression w
ipocyte where it was highly expressed. TBP is used as housekeepinonger band than the other samples.
Figure 33 Western Blot analysis. Ucp1 proteinexpression in 1) hAdipose differentiated cells (30µg), 2)iPSC differentiated cells (30µg) and 3) Purified ratBAT mitochondria (2µg), which explains that there isno β-actin expression. The UCP1 band from iPSCdifferentiated cells has a higher molecular weight thanUcp1 expressed in hAdipose differentiated cells and ratBAT mitochondria.
Lundin A. 2013
4 Discussion
4.1 Discussion - Cardiomyocyte For the EB model the initial spontaneous EB formation is critical, and attempts to control this event using a V-shpaed low-bind well plate has been successful (Burridge et al. 2011) By
te that the size of the EB did have an impact
nd on difference between iPSC lines (Chetty et al. 2013) and potency of reagents.
However, actively affecting the Wnt-signaling pathway by using CHIR99021 (Minami et al. 2012, Yang et al. 2008), the number of beating EBs significantly increased, reaching approximately 100%. The positive effect seen by low oxygen tension in Burridge et al. 2011 in the initial phase is probably due to the fact that low oxygen tension also increase Wnt signaling (Mazumdar et al. 2010). However, inducing Wnt-signaling by using CHIR99021 was not efficient if not inhibiting the same pathway after cardiac mesoderm specification. This effect can be correlated to the results suggesting that a prolonged activation of Wnt-signaling inhibits differentiation (Paige et al. 2010). The different results between using low oxygen tension or CHIR99021 to activate Wnt-signaling could be explained both by activation efficiency, and a different targeting mechanism between treatments. In that case an active inhibition might be necessary when using CHIR99021 whereas it is not needed in low oxygen treatment.
using this technique it was possible to demonstraon the percentage of spontaneous beating EBs. A low amount of cells will not result in EB formation using this set-up and a size of 4K and 6K per EB resulted in massive balloon structures inhibiting contractibility. The balloon structures were also seen in monolayer culture, but what it is and why the balloons appear still needs to be evaluated. 8K EBs resulted in the best yield regarding contractility, generating 60% spontaneous beating. This differ from the results by Burridge et al. (2011) where a similar experimental set-up resulted in up to 95% spontaneous contracting EBs at a size of 5K per EB. The reson for this discrepancy is at the moment unclear but could depe
BIO has previously been observe (Cohen et al. 2012), indicativ cardiac progenitor specification. H t with BIO in other differentiation protocols has been uccessful and shown a significant effect on increasing numbers of beating EBs, but only at
low concentration and in the combination with CHIR99021 (Minami et al. 2012). In Minami
d to reduce the expression of Isl1 and Nkx2.5e of an inhibition of the canonical-Wnt signaling at owever, treatmen
s
et al. (2012) the differentiation medium including BIO was added after EB formation, which most likely would have a partly different induction effect in the differentiation process compared to adding BIO at the initiation of EB formation, as done in this study. Adding BIO in a monolayer set-up may however have positive effects, when EB formation is not needed, but that needs to be further evaluated.
The increased beating frequency that was observed when changing from IWP2 to XAV939 and KY0211 is most likely due to the different targets that the compounds hit, but that needs to be further evaluated to elucidate the downstream effects of each compound.
49
Lundin A. 2013
The addition of different compound activating and inhibiting Wnt is extremely complex and illems et al. 2011), indicative that other compounds have
etter effect than those used here. This is however dependent on cell line, where Kattman et al. (2011) proved that activin A was beneficial when using an embryonic cell line while diminishing differentiation of an iPSC line (Kattman et al. 2011). Since only a few compounds have been used in this study it has to be further evaluated. Preliminary data also indicates that the combination of compounds can be critical, as when using KY0211 and XAV939 alone did not result in as good beating frequency as when combined (not published).
Different matrixes were shown to have a significant effect on the homogeneity of the monolayer, which is important if in vitro model have to be adapted for compound screening. Fibronectin, Pluripro Matrix and Matrigel were shown to have the best effect in producing homogenous monolayers, whereas collagen I and gelatin promoted cell aggregates. The homogenicity is probably dependent on the interaction between cell type and matrix, since commercial cardiomyocytes can be grown on collagen or gelatin. The possibility that a somatic like cell needs a certain matrix to reach its differentiation stage is likely since certain matrixes help maintaining pluripotency (Rodin et al. 2010). If that would be the case, the changes of matrix during the differentiation process would help to direct the transition or might even be necessary to achieve full differentiation.
The observation of a KDR+ population during cardiac mesoderm induction and subsequently a transition towards a KDR-, cKit+ population correlates well to a cardiovascular progenitor specification (Bondue et al. 2011). Nkx2.5 was evaluated, which could have confirmed a
successful. However, using KY0211, it did ote an up-regulation of Isl1. Even though Isl1 is now seen as a cardiovascular
rogenitor marker, the 35 fold induction of Isl1 and no induction of other cardiac markers eem to correlate more to a progenitor cell of the SHF, which has a high proliferation and
delayed differentiation in vivo (Abu-Issa, Kirby 2008). That could be an explanation why duction of other markers was not seen. Adding XAV939 however, did induce a high duction of other cardiac markers although no spontaneous contractions were observed. This
aturation process was needed or that other parameters not ontroled in the experiment were essential.
he characterization docreates a high variatio R data shows that the
ifferentiation halted a esides Isl1 were greatly reduced. This could, a conversion or halted differentiation to a mor The question is why this occured since the usa ully differentiated the monolayer to beating cardiomyocytes, as it now stopped at another subpopulation. The reduction of cardiomyocyte markers and high Isl1 could also indicate a differentiation
has been evaluated else were (Wb
specific subpopulation of cardiovascular progenitors, proposed in Bondue et al. (2011), butwas unfortunately not reliable due to high unspecificity from the antibody. Spontaneouscontractions were observed and qPCR data showed an up-regulation of cardiac specific genessuggesting that the differentiation process wasonly promps
inincould indicate that a longer mc
T ne over time provided information that the system is not robust and n between experiments. Second, the qPC
time point 4, where all cardiac markers bas hypothesized previously, be due to e proliferative progenitor state of the SHF.
ge of IWP2 at previous experiment successf
d
50
Lundin A. 2013
towards endothelial cells since Isl1 has been suggested to promote endothelial differentiation at early onset (Bondue et al. 2011).
a expression was not improved, as previously proposed (Zhang et al. 2011, Li, Pashmforoush & Sucov 2010). However, due to the large diversity between the
.
sp1 (Willems et al. 2012, Cai et al. 2012).
le explaination for the detachment is that endocardial cells undergo epithelial–to-mesenchyme transition (EMT), which is linked to endocardial cushion formation during valve formation in vivo. In
Using vitamin A as a substrate for retinoic acid production and driving cardiomyocyte differentiation has produced conflicting results. Results show both an inhibitory (Aouadi et al. 2006, Wu et al. 2010) and a promoting (Li, Pashmforoush & Sucov 2010) role in cardiac differentiation. However, the possibility might also be that retinoic acid is involved in the specification of FHF and SHF, which is indicated by the proliferative and inhibiting effect of the Isl1+ and Tbx5+ population, respectively, when being inhibited (Sirbu, Zhao & Duester 2008, Ryckebusch et al. 2008). This might be linked to results showing that inhibition of retinoic acid has an effect on subpopulation specification, by increasing the expression of the ventrical marker Mlc2v (Zhang et al. 2011). The result presented in this study is in some aspects contradictive, where the addition of vitamin A did not reduce Isl1 development, as proposed in previous studies (Sirbu, Zhao & Duester 2008, Ryckebusch et al. 2008), whereas the Gata4 and Mlc2
different vitamin A samples in this study, it is indicative that other factors have a larger impact than vitamin A, making it difficult to draw any direct conclusioins. As stated previously, many protocols use vitamin A in the basal differentiation medium (Lian et al. 2012, Zhang et al. 2011, Hudson et al. 2012), but its effect is not clear and needs to be further elucidated.
In the experiments of adding vitamin A, ROCKi was removed generating different results in combination with vitamin A. ROCKi is used to increase cell viability after plating, by inhibiting apoptosis. ROCK is however part of the non-canonical wnt-pathway which promotes cardiac differentiation at a progenitor stage (Onizuka et al. 2012, Cohen et al. 2012). Even though not evaluated in this study the use of ROCKi should be taken into consideration when differentiating
Addition of TGFi significantly increased the expression of cardiac markers, besides Isl1, when added at the same time point as the Wnt-inhibition. This correlates to indication that prolonged TGFβ signaling promotes endothelial compared to cardiomyocyte differentiation (Cai et al. 2012), in which increased differentiation can be achieved by inhibiting TGFβ signaling. Supporting data of this statement was that addition of TGFi also reduced Isl1 expression, suggested to induce endothelial differentiation at certain time points (Bondue et al. 2011), and that high expression of Isl1 in this study correlated to ablation of spontaneous contracting cells. In contrast adding TGFi at time point A instead lowered the expression of cardiac marker correlating to data showing that TGFβ is necessary for cardiac mesoderm specification, increasing markers as Me
To be able to evaluate maturation of cardiomyocytes, with respect to electrophysiological properties, structure, metabolism and proliferation, the problem with detachment of cells, which is seen in most experiments in this study, needs to be solved. A possib
51
Lundin A. 2013
early development there is a myocardial and endocardial layer separated by a matrix called the cardiac jelly. During cushion formation, as a part of valve formation, endocardial cells undergo EMT and delaminate to populate the cardiac jelly (reviewed in (Eisenberg, Markwald 1995). As reviewed in Wagner et al. (2007) delamination is controlled by cardiomyocytes signaling through TGFβ, Notch and VEGF singaling. Cardiomyocytes initiate endocardial cells to undergo EMT by VEGF signaling which is further initiated and maintained by autocrine signaling of VEGF between endocardial cells (reviewed in (Wagner, Siddiqui 2007b). In an attempt to prove this suggestion an over expression study of VEGF was performed, however with caontradictoy results. High VEGF inhibit cardiac cushion formation (Dor et al. 2001). This information support the fact that delamination is observed around the time point of beating cardiomyocytes since cardiac progenitorcells mature in their cardiomyocytes signaling and thereby induce EMT of endocardial cells.
Another way to improve the differentiation efficiency could be to inhibit Notch and TGFβ signaling as well as using high concentration of VEGF. Turning off the TGFβ, as done in this study by using TGFi, during the cardiac progenitor stage did promote cardiomyocyte differentiation. The delamination was however not reduced, suggesting that the apparently improved differentiation might instead be due to an increased cardiomyocyte proliferation, since a prolonged TGFβ treatment has been suggested to promote differentiation towards
progenitor stage. Changing the medium carbon
which might be necessary for proper differentiation, as discussed previously.
endothelial cells (Cai et al. 2012).
Delamination could also be a result of other factors. The explanation that the beating itself would cause the detachment from the surface is however not likely since commercial cells attach very well and can beat for a long period of time without losing attachment. On the other hand these cell populations have a higher purity of cardiomyocytes, which probably affects the result. Delamination could also be a result of too high proliferation resulting in detachment due to an excess number of cells in the well. Since it is extremely important with cell to cell contact when differentiating iPSC towards cardiomyocytes, the seeding density at the start of the experiment needs to be quite high. Since cardiomyocytes proliferation capacity decrease during maturation (Bergmann et al. 2009), the excess proliferation is probably mainly caused by other cell types due to a heterogeneous population. During maturation cardiomyocytes change their metabolic pathway to be based on fatty acid oxidation instead of glycolysis (reviewed in (Lopaschuk et al. 2010, Robertson, Tran & George 2013). One way to control the excess proliferation could be to change the medium from a glucose rich to a glucose poor medium around the cardiac source from glucose to galactose, or a mixture of galactose and fatty acids, has been proven to drive maturation of immature cardiomyocyte becoming more native like (Rana et al. 2012). Changing medium composition might then still drive the differentiation and maturation of the cardiac progenitor cells, but inhibit the proliferation of other cell types.
Since the endocardial cell loose attachment during differentiation, another possibility to purify the cardiomyocyte population could be to re-plate the cells. During re-plating the cardiomyocytes would then adhere to the plate while the endocardial cells do not, which then are removed during medium change. This could also be combined with change of matrix,
52
Lundin A. 2013
A question that is valid for proper cardiomyocyte differentiation is if a 3D milieu is necessary? During the study we started with EB formation, which was later abandoned for the
the last decades have been on differentiating preadipocyte isolated from animals or humans, while low attention has been directed towards the differentiation of PSCs towards
uptake experiment did result in very diverse data, but did however indicate a glucose response, and in some cases also an insulin response. The diversity is
using FBS, insulin, dexamethasone, IBMX (Student, Hsu & Lane 1980) and a PPARγ agonist (Gerlach et
use of monolayer differentiation. The EB formation will always generate a heterogeneous population, whilst a monolayer approach, if optimized, might generate a good enough purity of cardiomyocytes. A monolayer is favorably used as a physiological model for different screening purposes, due to controllability in terms of affecting all cells equally. However, if a good enough purity is not achieved in the monolayer model, is the EB model then superior in terms of better differentiation due to 3D environment? Heterogeneous models are often hard to evaluate, and both the EB and monolayer model contain populations of smooth muscle cells, endothelial cells and cardiomyocytes. An advantage of using a heterogeneous population might be that it resembles a more in vivo like tissue, resulting in a more representative model. However, to be able to efficiently evaluate the combined response of a heterogeneous population the response of each cell type might need to be known.
The monolayer achieved in this study is more of a semi-3D model due to its thickness. To be a valid functional model in the future, the monolayer method needs either to be improved to produce a higher yield of cardiomyocytes or to be used as a heterogeneous model, in which the distribution and responses of different cell types have to be better characterized.
4.2 Discussion - Adipocyte Focus over
adipose tissue. This is probably due to a more accessible source of adipocytes than cardiomyocytes.
The high variation in the results proves that the protocol has to low differentiation efficiency, which generates both promising and less successful experiments, which is seen in the glucose uptake assay. Glucose
probably due to poor homogeneity between plates, which might be resolved by increasing the cell density where the best responses were detected. However, all comes back to the poor differentiation percentage that was demonstrated with the LipidTOX staining, as compared to preadipocyte differentiation. The low lipid content seen with LipidTOX also explained why no detection was observed during the lypolysis assays, which was due to too low glycerol production resulting in a signal not being able to reach above background. Overall, the variability correlates to the fact that the correct parameters are not controlled.
The classical protocol has evidently differentiated a preadipocytes model, 3T3-L1 (Green, Meuth 1974), to a more mature phenotype, which has been proven for decades by
al. 2012). The protocol is however very insufficient in differentiating iPSC to adipocytes, as shown previously (Ahfeldt et al. 2012, Taura et al. 2009). Ahfeldt et al. (2012) demonstrate that over expression of PPARγ alone, or together with CEBPB and/or PRMD16 efficiently differentiate iPSC to white or brown adipocytes (Ahfeldt et al. 2012). Even though the classic differentiation protocol includes agonists for up-regulations of PPARγ, which was shown to
53
Lundin A. 2013
be successful on preadipocytes, the differentiation is not working desirably on iPSCs. This could be due to the fact that necessary chromatin structures are not activated. The question is how to differentiate the PSC to the cell state where the classical differentiation protocol has an effect. Little is known about the first differentiation process of this pathway, if it contains a master regulator to drive the differentiation as with osteoblast specification (Otto et al. 1997), or if the pathway is more complex as with cardiomyocyte differentiation, where signaling pathways often have biphasic roles.
The BAT differentiation protocol generated very different results depending on plate format highliting that differentiation reagents are not the only parameters that needs to be optimized. However, no indication of an adipogenic differentiation could be observed as a result of the differentiation protocol. Oil red O did not stain any lipids in the cell culture, which was confirmed with no detection of AdipoQ expression. No induction of BAT specific genes (Wu et al. 2012) Ucp1 and Cidea were detected in differentiation samples. However, a high expression of Ucp1 and some expression of Cidea were observed in the iPSC sample, which was much unexpected. To confirm that the mRNA expression of Ucp1 was also translated into protein a WB was run confirming this process. The UCP1 protein expressed in iPSC was however not the same as express in differentiated human pre-adipocytes and purified mouse BAT mitochondria. The molecular weight was higher in the iPSCs which could indicate an alternative from of the UCP1 protein in terms of phosphorylation modification or another
ion, strengthening the
isoform. Next step would be to confirm that the band seen in the WB is actually UCP1 by knocking out Ucp1, which would abolish the band if truly being UCP1 protein. If that would be the case it could mean that the alternative UCP1 is inactive, or has another role at this stage of development, which could be confirmed by measuring for example oxygen consumption rate.
4.3 Discussion - Summary The cardiomyocyte differentiation process going via EB formation increased from 60% up to 100% spontaneously beating EBs. This was achieved by optimizing size to 8K cells per EB and using CHIR99021 as Wnt-activator and IWP-2, XAV939 and KY02111, in different combinations, as Wnt-inhibitors. The combination of KY02111 and XAV939 increased beating frequency, but the impact of the different Wnt-inhibitors are not clear and needs to be further elucidated. Differentiation of iPSC to cardiomyocyte via monolayer added the complexity of defining seeding cell density and matrix composition. Pluripro Matrix and Matrigel generate good homogenous monolayers, but Fibronectin produced the best results. ICC, qPCR and FACS analysis provided promising results of a working differentiation protocol by demonstrating an up-regulation of key cardiac markers, Nkx2.5, cTnT, Myh6. The addition of TGFi at a specific time point did significantly increase these markers, whereas adding the compound at an earlier time point inhibited the differentiatimportance of timing the induction of different pathways. However, the strength of the data is lowered by too high variation between experiments, which is likely to be a result of the varying quality of the iPSC-line and the large variations between specific seeding densities, making it difficult optimizing this parameter. Experiment reproducibility was also affected by delamination problems, where the cells detached at varying time points making it difficult
54
Lundin A. 2013
characterizing the differentiation process over a longer period of time. Replating the cells might be a solution to overcome this problem, otherwise the cause of the delamination needs to be elucidated. A possible theory is that the endothelial cells in the heterogeneous cell population undergo EMT when the cardiomyocytes differentiate which causes delamination. Increased differentiation efficiency is then necessary.
Differentiating iPSCs to adipocyte is not as simple as applying the classic protocol that is used to differentiate pre-adipocyte to adipocytes, which uses FBS, insulin, dexamethasone, IBMX and a PPARγ agonist. The protocol has very little effect on iPSC and needs to be revised. The possibility is that it might be necessary to only differentiate the iPSC to a state where the classical protocol can be applied. The novel BAT differentiation protocol by Nishio et al. (2012) was not reproducible and the results did not indicate an adipocyte differentiation. Since the results indicate that the protocols available in the literature are not applicable to differentiate iPSCs to adipocytes a re-evalutation is necessary, focusing on the initial
The evaluation and optimization of differentiation protocols toward different cell types are ssential parameters. The question is which parameters are
tion and development as an in vitro model for drug screening. The initial
cess could be
differentiation process from an iPSC to a mesenchymal stem cell.
5 Conclusion
difficult due the multitude of ecritical for proper differentiation including medium composition, timing of inducing agents, matrix composition and stiffness, 2D or 3D environment, oxygen tension and more. The outcome of the cardiomyocyte differentiation protocol in this thesis showed promising results for future applicainduction of the BMP and canonical-Wnt signaling pathway together with their later inhibition were seen to have a big impact in the differentiation process, as well as the choice of fibronectin as matrix. However, the differentiation protocol did not reach the robustness that was desired in form of reproducibility, indicating that the critical parameters for proper differentiation are not controlled sufficiently. As for the adipocyte differentiation protocol no successful results were achieved proving that the critical conditions are not assessed. Since differentiation of mesenchymal stem cells to adipocyte have been successful using various cell line models, the focus should be on differentiating iPSCs towards a mesenchymal state.
The screening of critical parameters could be addressed by constructing a reporter iPSC-line, creating a specific fluorescent tags in order to more easily, and time efficient, evaluate parameters that impact the differentiation efficacy. A faster screening proobtained for complex compound combinations, which can be evaluated in real time by using high content imaging analysis or FACS analysis. This would also provide a tool for screens identifying novel compounds favoring specific differentiation processes.
Besides distinguishing the critical parameters, one must also address the objective of the differentiation, focusing on the yield of differentiation process. Do the process need to create a homogenous population or can a heterogeneous population be sufficient or even favorable. If a good enough differentiation percentage is not reached, resulting in a poor purity of target cells, the construction of a recombinant iPSC-line containing a selection marker, in order to
55
Lundin A. 2013
purify heterogeneous population, could be necessary. In that case a specific cell population can be enriched and used as a model.
The problem with optimizing differentiation protocols for PSC-lines is that the optimal conditions will differ between different lines, both internal differences in embryonic and iPSC lines, but especially between those two groups. This was seen in Kattman et al. (2011) where the optimal conditions differed signand reduced differentiation to a vascular
ificantly between hESC and iPSC. Activin A increased progenitor population for hES and iPSC,
ilities. The creation of different disease models will be available in the near future. The field of regenerative medicine is provided with a more accessible and applicable tool to study
rm of using specific cell types, and where the study of
respectively. This was believed to be due to different endogenous expression of BMP4 between the lines (Kattman et al. 2011). The specific endogenous expression profile of each cell line will be critical when optimization of compound concentration and composition. By providing a characterization profile of gene expression and endogenous basal signaling could maybe stream line the optimization process of different cell lines. This could also generate a basal cell profile for comparing different scientific results. That could minimize unexplained contradictive observation by defining compound concentrations and timely additions by cell profile hallmarks in form of gene expressions and endogenous signaling, instead of specification based on days of differentiation, as done today.
6 Future outlook The iPSC technology and its application is a very fast expanding area. Even though the technology was recently discovered in 2006 by Yamanaka, the use of iPSCs is already a commercialized market where several companies provide differentiated iPSCs. There are numerous cell types which can be easily bought in large quantities, providing huge research possib
the regenerative process, in the fodifferential time lines are an important factor. hiPSC derived cell-lines seems to provide an important tool for early drug discovery in form of accessibility, quantity and biological relevance with the vision of bringing more drugs to the market and decreasing the number of compounds withdrawn when going into clinical studies.
56
Lundin A. 2013
7 Methods and Materials During this project the basic technique and method was cell culturing, where iPSCs were differentiated towards cardiomyocytes and adipocytes. This was done by using published protocols as starting points. The evaluation and characterization of the protocols was performed by using immunocytochemistry (ICC), real time quantitative polymerase chain
basis of recent published protocols (Minami et al. 2012, Yang et al. 2008) were combined with the protocol by
2011), where CHIR99021 (Cayman, Cat.no.13122), BIO (Sigma,
d then adding only dexamethasone, insulin and FBS for the following 7 days. Brown adipose
reaction (RT-qPCR), western blot (WB), fluorescent activated cell sorting (FACS), lipolysis analysis, glucose uptake analysis and high content imaging.
7.1 Cell Culturing Cell culturing was done according to recent published protocols with slight modifications. Cardiomyocyte differentiation via EB formation was done accordingly to recent published protocol (Burridge et al. 2011). Optimization was performed on EB size and well plate format, evaluating flat bottom (Costar, Cat.no.3595), U-bottom (Costar, Cat.no.7007) and V-bottom (Costar, Cat.no.3896). Different cell densities were seeded in the 96 well, ranging between 4000-8000 cells/well. Compound evaluation on the
Burridge et al. (Cat.no.B1686), IWP2 (Calbiochem, Cat.no.681671), XAV939 (Synthesized at AstraZeneca.), KY02111 (Synthesized at AstraZeneca) were tested.
Cardiomyocyte differentiation via monolayer was done accordingly to protocol used for EB differentiation, where different cell densities, ranging between 50-400 K/cm2, and matrixes, gelatin (Sigma, Cat.no.G1393), collagen I (Life Technologies, Cat.no.A10483-01), fibronectin (BD, Cat.no.356008), matrigel (DB, Cat.no.354230), and pluripro matrix (Cell Guidance Systems, Cat.no.MD4) were evaluated. Monolayer specific protocols were also evaluated (Lian et al. 2012, Hazeltine et al. 2012), but they did not generate any beating morphologies. Evaluation of another compound, a TGFβ inhibitor was also performed.
White adipocyte differentiation was done via a monolayer by seeding the cells at different densities, 50-150K/cm2 and applying media conditioned with IBMX (Sigma, Cat.no.I7018), dexamethazone (Sigma, Cat.no.D2915), insulin (Actrapid Novo Nordisk, Cat.no.13509), pioglitazone (Synthesized at AstraZeneca ) and FBS (PAA; Cat.no.A15-151) for 7 days an
differentiation was done accordingly to recent published protocol (Nishio et al. 2012), but was evaluated in different plate formats, 6wp low bind (Costar Cat.no.3471), 96wp low bind (Costar, Cat.no.7007), and 96wp tissue culture treated (Costar, Cat.no.3595).
7.1.1 Dissociation of Embryoid Bodies Following dissociation reagents were evaluated, Trypsin 0,5%, 0
Collagenase (Life Technologies, Cat.no.1704-019), Acutase (Millipore, Cat.no.SCR005), Dispase (Stemcell Technologies, Cat.no.07923) and dissociation kit (Miltenyi Biotech, Cat.no.130-098-348). The dissociation of EB formations was done by adding the dissociation reagent and incubating the well between 5-25 minutes at 37°C. During the dissociation incubation, EBs were mixed with a pipette every 5 minutes to induced mechanical force.
57
Lundin A. 2013
Several combinations of dissociating agents were tried, but no single reagent or mixture of reagents resulted in a homogenous single cell suspension.
unspecific staining increases, meaning that the secondary antibody binds to other antigens than the one of interest, resulting in a false positive. The risk of unspecific binding is reduced by applying a blocking procedure
dy and during the whole ICC process. Blocking is done by applying
look at intracellular structures and localization of proteins.
7.3.1 Immunocytochemistry Protocol Cells in 96wps were fixated in formaldehyde by first washing wells once with PBS+/+ and then adding 100µl/well formaldehyde (HistoLab, Cat.no.02176) and incubating at room temperature (RT) for 15 minutes. Three wash steps with PBS+/+ was then performed before adding 100µl/well PBS+/+ for continuous ICC staining, or storage in 4°C. If stained for intracellular markers the fixated cells were first permeabilized using permeabilization reagens, which differed depending on cell type. Adipocytes were permeabilized using 0,1% saponin (Sigma Aldrich, Cat.no.S7900) solution for 2 minutes on shake RT as a separate step from blocking. For cardiomyocytes the permeabilization step and blocking step was done simultaneously by making a 0.1% Triton-100X (Life Technologies, Cat.no.HFH10) solution together with PBS-/- and 10% serum from the host of the secondary anti-body, specified in table Table A3. Blocking solution was added for 1 hour at RT. Blocking solution was
7.2 Imaging Brightfield and fluorescence imaging was done with Nikon Eclipse TE2000-U (Nikon, Shinjuku, Tokyo, Japan) while movies on beating cardiomyocytes was done using a Nikon Eclipse TE300 (Nikon, Shinjuku, Tokyo, Japan). Quantitative image analysis was done using ImageXpress (Molecular Devices, Sunnyvale, California, USA)
7.3 Immunocytochemistry ICC uses the functionality of antibodies, which bind to specific antigens. To be able to detect the binding of the antibody a fluorescent component is linked to the antibody. This is either done by directly linking a fluorescent tag to the antibody or by creating a secondary antibody with a fluorescent tag. The secondary antibody binds to a species specific antigen enabling detection. The ICC staining works by first binding to the marker of interest, the antigen, using a primary antibody, and secondly adding a secondary fluorescent labeled antibody for detection. When using a secondary antibody, the risk of
before the primary antiboserum from the host that the secondary was created in. If the secondary antibody was created in goat, then goat serum will be used. Proteins in the serum will bind unspecifically to various antigens blocking the possibility of the primary and secondary antibody to bind unspecifically, and thereby decrease unspecific binding. The specific binding between the primary and secondary antibody is stronger than the unspecific binding of the serum, thus generating fluorescent labeling of the antigen of interest.
ICC is used to characterize cells by labeling antigens of interest, specific epitopes on proteins of interest, and thereby monitoring the expression level of the proteins, which can be associated to cell type and cell state. Observation over time can also provide indication of developmental progression. ICC can also be used to
58
Lundin A. 2013
aspirated and the primary anti-body (Ab1) was added, 40µl/well, according to concentrations
dure repeated as done previously before adding 100µl/well of PBS -/- as storage liquid. Plates were placed in darkness at 4°C
ce imaging analysis was done using Nikon Eclipse TE2000-U or
g as a template for reverse transcriptase
DNA
eated numerous times generating a large amount of specific DNA segments (Glick, Pasternak & Patten 2010).
specified in Table A1and Table A2 for 1-3 hours in RT on shake. Ab1-solution was aspirated and exchanged for PBS -/-, 100µl/well, and incubated in RT on shake for 5 minutes. Washing step was repeated 3 times before secondary anti-body (Ab2) was added, 40µl/well, according to concentrations specified in Table A3 for 1 hour in RT on shake. Washing step was repeated as previously. Staining of the nuclei was done using DAPI or Hoechst, concentrations and incubation times used specified in Table A4. Washing proce
for storage. FluorescenImageExpress.
7.4 Real-Time Quantitative Polymerase Chain Reaction (RT-qPCR) Performing a RT-qPCR from a RNA sample requires the transcription of cDNA before quantitative measurement is used through specific application of the PCR technique.
Synthesis of cDNA from mRNA is performed by first binding of a oligo(dT)primer to the poly(A) tail of the mRNA, and subsequently reverse transcriptase transcribe the first cDNA strand from the 3’ to 5’ end. The 5’ end then needs to be elongated to ensure that the whole mRNA is transcribed. This is done by addition of a oligo(C)tail by the reverse transcriptase. A oligo(dG)primer then binds to the poly(C)tail, workinto elongate the 5’ end of the newly synthesized cDNA-strand. Forward and reveres primers bind to the oligo(C) and oligo (T) tails, respectively and the double stranded cDNA is generated by DNA polymerase during PCR amplification.
A basic polymerase chain reaction (PCR) method is a process used to amplify specific DNA sequences in vitro. Four main components are necessary to perform the process; 1) the DNA samples which is to be amplified; 2) complementary primers which flank the DNA segment which is to be amplified; 3) thermostable DNA polymerase which synthesizes the newstrands; and 4) deoxyribonucleotides which are the building blocks of newly synthesized DNA. After mixing these components together a three stage thermo cycle process is performed. First step is done by increasing the temperature so that the DNA denaturates, at around 95°C, resulting in the separation of the two DNA strands. The second step includes lowering of the temperature so that renaturation occurs, at around 55°C, initiate binding of primers to the DNA sample, which binds to a higher degree than sample to sample due to molar excess of primers. In the third step the temperature is risen again to around 75°C activating DNA synthesis by the Taqman DNA polymerase. The cycle is rep
The TaqMan assay uses probes, which are primers, complementary to the cDNA segment of interest, conjugated with a fluorescent dye and a quencher. The fluorescent dye and the quencher are attached to the 5’ and 3’ end, respectively. The intact probe does not emit light, since the quencher quenches the fluorophore. However, during the PCR reaction, when the cDNA is transcribed, the Taq polymerase degrades the 5’ end of the probe releasing the fluorescent dye, removing it from the quencher generating a fluorescent signal. Thereby only probes bounded to the cDNA will fluorescent. Progressively the signal will become stronger
59
Lundin A. 2013
as the number of PCR cycles increase due to and increased binding of probes and subsequently the release of fluorescent dye (Glick, Pasternak & Patten 2010). The process can
e where a quantitative measurement is related to the number he reaction needs before the signal raises over the signaling threshold,
eased expression of specific genes, which is a great method to follow the differentiation profile during the cell
ced in a 2ml collection tube and
r was added directly to the spincolumn membrane and centrifuged at 10000rpm for 60s to elute the RNA. Samples were kept on ice for further analysis or stored in
thereby be monitored in real timof cycles that tmeasured as cycle threshold, Ct-value.
qPCR is a method used to measure the absolute or relative amount of a specific transcribed DNA sequence. This is used to analyze the increased or decr
differentiation process.
7.4.1 RT-qPCR Protocol Two main protocols were used when performing RT-qPCR analysis, one using a standard protocol with non-automated process and one using a semi-automation process applying products from Applied Biosystem.
7.4.1.1 Standard RT-qPCR Protocol The collection of cell samples was done by aspirating medium and washing once with PBS. 200µl/96well was added with 10% β-mercaptoethanol lysis buffer (RNeasy plus lysis buffer, Cat.no.1030963, Qiagen) whilst scraping and flushing the well. The sample was collected in an eppendorf tube for storage in -80°C or further analysis. RNeasy plus mini kit (RNeasy Plus Mini Kit, Cat.no.74134, Qiagen) was used to purify the RNA from the cell sample. Method was performed according to product protocol provided by supplier, which is summarized below. Cellysis sample was vortexed and transferred to a gDNA Eliminator spincolumn, which was centrifuge for 30s at 10000rpm. Column was discard and flow through saved 500µl of 70% ethanol was added to the flow-through sampled and mixed well. 700µl of sample was transferred to an RNeasy spincolumn placentrifuge at 10000rpm for 15s. Flow through was discarded and 700µl RW1 buffer was added to the RNeasy Mini spincolumn and centrifuge at 10000rpm for 15s. Flow through was discarded and 500µl RPE buffer was added to the RNeasy Mini spincolumn and centrifuge at 10000rpm for 15s. Last step was repeated once more but then centrifuged for 2 minutes. 30-50µl of RNase-free wate
-80°C.
Transcription of RNA to cDNA was done using a High capacity cDNA reverse transcription kit (Applied Biosystems, Cat.no.4368814). To be able to load the same amount of RNA the RNA content of each sample was measured using a Nano Drop (Saveen&Werner, Limhamn, Sweden). Each sample was balanced using the Table 1, were all reagents was provided in the transcription kit.
60
Lundin A. 2013
Table 1 The cDNA transcription solution contained RNA, RT buffer, dNTP mix, RT random primers, reverse transcriptase and nuclease-free water according to the ratio specified in the table.
cDNA transcription solution
Solutions Stock Volume (µl) RNA - Up to 10µl RT buffer 10x 2µl dNTP Mix 25x 0,8µl RT Random primers 10x 2µl Reverse Transcriptase - 1µl Nuclease-free H20 - Up to 14,2µl Total: 20µl
20µl sample was added to each PCR-tube. The samples were vortexed gently and spun down to remove bubbles. Tubes were run in a thermo cycler (PTC200, MJ Research, Quebec, Canada) using the program specified in Table 2, which was recommended by the supplier.
Table 2 The settings for the qPCR program run using a thermo cycler was performed accordingly to specification in the table.
PCR Program Step Temp Time
1 25 10min 2 37 120min 3 85 5min 4 4 -
cDNA was then stored at -80°C or used for further analysis. For the RT-qPCR assay a gene expression mastermix (Invitrogen, Cat.no.4369016), TaqMan probes (specified in Table A7 and Table A8) and water (Sigma, Cat.no.W4502) were used. Previous reagents together with cDNA were mixed according to Table 3.
Table 3 Taqman solution mix was containing gene expression mix, taqman primers, water and cDNA according to the ratio specified in the table.
Taqman solution
Solution Volume (µl) Gene expression mix 2x 10µl Taqman Primers 1µl Water 5µl cDNA 4µl Total 20µl
Samples were loaded to the plate and run using 7500 Real Time PCR system (Applied Biosystems, CA, USA).
61
Lundin A. 2013
7.4.1.2 qPCR Using Applied Biosystems Products RT-qPCR analysis was also performed using Applied Biosystem products. The samples were collected by aspirating cell medium and adding 100µl/96well lysis solution (Nucleic acid purification, Applied Biosystem, cat. no. 4305895), whilst scraping and flushing the well. RNA was purified using semi-automatic prepstation (6100 Nucleic Acid PrepStation, Applied
Biosystem, Cat.no.4305545) and RNA elution solution (Applied
ion master mix (Invitrogen, Cat.no.4369016), TaqMan le A8) and water (Sigma, Cat.no.W4502) was used.
Biosystems, CA, USA). Samples were added to a RNA purification tray (Applied Biosystem, Cat.no.4305673) and processed following RNA Cell Method with DNase Wash protocol specified by distributer using following products; washing solution 1 (Applied Biosystem, Cat.no.4305891), washing solution 2 (Applied Biosystem, Cat.no.4305890), absolute RNA wash solution (AppliedBiosystem, Cat.no.4305893).
Transcription of RNA to cDNA was done using a High capacity cDNA reverse transcription kit (Applied Biosystems, Cat.no.4368814) as described in section 5.4.1.1.
For the RT-qPCR assay, a gene expressprobes (specified in Table A7 and TabThe mixing of these reagents together with cDNA was done using an automatic working station (Biomek NXP, Beckman Coulter, IN, USA), as specified in the Table 4, creating technical triplicates.
Table 4 Taqman automation solution. After the Biomek NXP performed its automated mixing protocol the final solution mix contained gene expression mix, taqman primers, water and cDNA according to the ratio specified in the table.
Taqman Automation Solution
Solution Volume (µl) Gene expression mix 2x 5 Taqman Primers 0,5 Water 1,5 cDNA 3 Total 10
Samples were run using a 7900 HT Sequence Detection System (Applied Biosystems, CA, USA).
To confirm qPCR data at higher Ct-values, as well as confirming purity of the sample, an agarose gel was run. The agarose solution was made by mixing 1x TAE buffer (0,04M Tris bas, Sigma Aldrich, Cat.no.T1503, 0,001M EDTA), ethidium bromide (Sigma, Cat.no.E1385) with appropriate percentage of agarose (Lonza, Cat.no.50004), which is correlated with the size of the DNA fragment. Solution was added to a mold and cooled for 1h. Loading buffer
hermo Scientific, Cat.no.R0611) was added to the samples, which then was load onto the gel, together with a ladder (Thermo Scientific, Cat.no.SM0243). Gel was run at 100V for 30
90 minutes and scanned (Universal hood II, BIO-RAD, CA, USA)
(T
to
62
Lundin A. 2013
7.5 Western Blot Analysis Western blot analysis is used to detect proteins in a cell sample. Cells are first lysed to be able to extract proteins, which is done simultaneously as protecting the protein from degradation and phosphorylation by tain solution bu Pr n denaturated by heat and separated accordin size by gel electrophoresis. The proteins are after separation transferred to a nitrocellulose or PVDF membrane on which the protein can be stained with antibodies, as with ICC. The binding of protein by the m ne is high, which makes blocking a necessary step in this assay so that the secondary antibody does not stain the entire membrane. The membrane is exposed to a chemiluminescent substrate, which will luminescence when exposed to the reporter on the secondary antibody. The membrane is pressed against a photographic film which then can be developed an analyzed.
e analysis of proteins, which can be used to
0 mM Hepes pH7.9, Sigma, Cat.no.H3375, 5 mM NaCl, Merck, Cat.no.307696, 1 mM MgCl2, Merck, Cat.no.583343) t % NP40 (Sigma, Cat.no.1-3021), 1x Phospatase inhibitor (PhosStop, Roche, Cat.no.04406837001) and 1x Protease inhibitor (Complete Mini, Roche, Cat.no.04693124001). Plate was scraped and cell transferred to an eppendorf tube, which was then k t on ice. the sample a quick sonication was performed, 3s x 5 at 20mA (Bransen Son r 250, son Industrial Automation, CT, USA). Sample was centrifuged at 800 rpm for 10 minutes in order to eliminate nuclei, and use
e supernatant in subsequent steps.
, was added to the sample and standard solutions. Samples and standards were incubation in 37°C for 30 minutes before measuring absorbance
California, USA).
7.5.2 Western Blot ProThe blot analysis can be lectro is, protein transfer, antibody binding and chemiluminescence detection. To get a representative quantification from different batches of cell sam e same amount of prote used from each sample, which is based on the BCA assay. The dilution is performed by adding RIPA buffer, sample buffer (Life Technologies, Cat.no.NP0007) and reducing agent (Life Technologies, Cat.no.NP0004), sing Table 5 as a guide line.
using cer ffers. oteins are theg to
embra
WB blot analysis is a detection and quantitativevaluate protein expression. The result can be linked to cell state, as well as translation activity when compared to mRNA expression.
7.5.1 Cell Lysis and BCA Protein Assay Protocol Cells were rinsed twice with ice cold PBS +/+ before adding lysis buffer, composed of RIPA buffer (2
ogether with 1
ep To homogenize ifie Emer
th
Quantification of the total protein concentrations of cell lysis samples were done using a BCA assay (Thermo Scientific, Cat.no.23227), which creates a standard curve that the protein sample can be correlated to. BCA working solution, containing bicinchoninic acid, generating a color indication through binding of Cu+
at 562nm using a spectrophotometer (SpectraMax Plus, Molecular Devices, Sunnyvale,
tocol divided in for stages; e phores
ples, th in is
u
63
Lundin A. 2013
Table 5 Ratio guidelines to provide representative quantifications from different batches of cell sample, which are based on a BCA assay.
Sample dilution ratio for WB Reagent Volume
Sample X µl
Reducing agent 2.5µl
Sample Buffer 6.5µl
Dilutent Up to 16µl
Total Volume 25µl
Samples were heated in 70°C for 10 minutes before cooled to RT (Unfolding of protein is done in lower temperature (37°C, 30 minutes, when interested in mitochondria proteins which degrades at higher temperature). Separation of proteins was done using an electrophoresis cell (XCell SureLock, Life Technologies, Carlsbad, California, USA). A 10% Bis-Tris gel (Life Technologies, Cat.no.NP0301BOX) was mounted, loaded with cell suspension and a
Transfer of protein from the gel as performed using a sandwich kit (Life technologies, 2005) and a semi-dry transfer cell (Trans-Blot SD, Bio Rad, Hurcules, California, laced in transf buffer (Life technology, Cat.no.NP0006) minutes prior to the gel was finished. Activation of the membrane was done by momentarily placing it in methanol and then in transfer buffer. After electrophoresis the gel was equilibrated in transfer buffer for 5 minutes before building the sandwich which comprised of two filter membrane and two filters. Sandwich was placed in the transfer ell in an orientation were the membrane was between the gel and the anod, which then was
run at 20V for 20 minutes.
rotein transfer, the membrane was blocked by being incubated on shake at 4°C overnight in TBSt (50mM Tris bas, Sigma Aldrich, Cat.no.T1503, 130mM NaCl, Merck,
Chemiluminescence was performed accordingly to protocol provided by the supplier, using a western blot detection kit (GE health care, Cat.no.RPN2135). Solution A and B were mixed
protein ladder (Seablue Plus, Life Technologies, LC5925). Electrophoresis was run using a MOPS running buffer (Life Technologies, Cat.no.NP0001) at 180V for 30 minutes.
to an invitrolon membrane wCat.no.LCUSA). Filters were p er
s, gel,c
After p
Cat.no.307696, 10mM KCl, MP Biomedicals, Cat.no.151944, 5mM MgCl2, Merck, Cat.no.583343, 0,05% Tween solution, Sigma Aldrich, Cat.no.P1379) and 5% drymilk (Applichem, Cat.no.A0830). Membrane was rinsed with TBSt before adding the primary antibody, Table A2, in combination with 5% milk and TBSt in RT for 1 hour. Membrane was then rinsed two times with TBSt and washed two times in TBSt on shake for 10 minutes. Secondary antibody, Table A3, was incubated at RT for 1 hour and washing steps were repeated as done previously.
64
Lundin A. 2013
1:1 and added to the membrane for 5 minutes. Membrane was placed in a plastic pocket to
s analysis by exchanging cell culture
concentrate to each well. To observe if cells had an insulin response, 10µl of 100nM insulin
take Analysis dioactive isotope provides the possibility to observe cell
d to insulin and subsequently C14 radioactive labeled glucose, which after incubation is washed away. Depending on the cells insulin sensitivity they will take up different amount of glucose. Since the glucose is radioactive, the amount of glucose that is absorbed by the cells can be detected using a scintillation fluid, which generates a
avoid contamination of the solution on the photographic film. The film was pressed against the membrane using a metal case, all performed in a dark room, and was read by a chemiluminescence apparatus (Curix 60, AGFA Healthcare, Greenville, South Carolina, USA).
7.6 Lipolysis and Insulin Response Assay Lipolysis assay is based on a colorimetric indication which can be detected by a spectrophotometer. This assay can be used as a functionality experiment, which provides an indication of the metabolic activity of adipocytes. The procedure is to first starve the cells and later induce lipolysis, which will release glycerol and fatty acids, being coupled to the hydrolysis of triglycerides. By adding free glycerol reagent the glycerol is phosphorylated and oxidized creating H2O2 which will produce a quinoneimine dye. The dye can be read at 540nm and will be proportional to the produced glycerol.
7.6.1 Lipolysis Assay Protocol Cell culture was starved 24 hours prior to lipolysimedium to starvation medium (DMEM, Gibco, Cat.no.31966, 1% BSA, Sigma Aldrich, Cat.no.A8806), which was performed in 96 well plates (Corning Inc., Costar 3595). Preparation of glycerol standard (Sigma Aldrich, Cat.no.G7793) and forskolin concentration ratio (Sigma Aldrich, Cat.no.F6886) was done with an assay buffer (Krebs-Ringer, Sigma Aldrich, Cat.no.K4002, 25mM Hepes, Gibco, Cat.no.15630, 1% BSA, Sigma Aldrich, Cat.no.A8806). Glycerol standard curve and forskolin concentration ratio are presented in Table A5 and Table A6.
Starvation medium was aspirated and 80µl of assay buffer was added and 10µl of forskolin
(Novo Nordisk, Actrapid) was added to be compared with analysis of no insulin addition, where 10µl assay buffer was added instead. Glycerol standard was run in parallel. Cells were incubated for 2,5 hours in 37°C. 28µl of media was transferred from each well to a new clear well plate (NUNC, 269620 (plate), 263339 (lid)) before addition of glycerol reagent (Sigma Aldrich, Cat.no.F6428), 100µl/well, and 30 minutes incubations in RT. Absorbance was read at 540nm using a spectrophotometer (PHERAstar Plus, BMG Labtech, Ortenberg, Germany).
7.7 Glucose UpLabeling of substances with a raabsorption of substances. The glucose uptake assay is based on radioactive detection from radioactive labeled glucose, which can be detected by a scintillation counter.
The glucose uptake assay can be used as a functionality experiment observing cells response to insulin. The cells are first cultured in a starvation medium with low glucose concentration. Thereafter the cells are expose
65
Lundin A. 2013
signal from radioactive decay that can be detected by a scintillation counter. The concentration of glucose inside the cell is correlated to the concentration of insulin added, which will provide informat (Maslowska et al. 1997). The assay has been adapted making it possible to use micr r real-time quantification. This has been done by modifying the m pos ixing polystyrene with scintillants. Thereby adherent cells c radioact abeled substances can be detected (PerkinElmer 2013).
7.7.1 Glucose Uptake Analysis Protocol During the differentiation protocol cells are cu r scintillating microplate (Perkin Elmer, Cat.no.RPNQ tarvation ure was performed 24h prior to glucose uptake analysis by exchanging cell culture medium to starvation medium (Basal Medium, Zenbio, Cat.no.BM AA no.A15-151). Cells were washed two
mes with assay medium (DMEM, Life Technologies, Cat.no.11966, 25mM HEPES, Gibco, a Aldrich, Cat.no.A8806, 0,4% DMEM, Life Technologies,
ll sample can be purified generating a homogenous population of cells based on specific markers. FACS can also be used to only analyze cell samples studying
used to observe how that subpopulation develops over time by observing cells expressing the initial marker and the increased expression of a second marker,
ion of the metabolic activityoplates fo
icroplate comontaining
ition, mive l
ltured on a cytosta0162). S of cell cult
-1, 3%FBS, P , Cat.tiCat.no.15630, 0,1% BSA, SigmCat.no.31966) and incubated in assay medium, 100µl/96well, at 37°C for 180 minutes. 25µl insulin (0,6mM Novo Nordisk, Actrapid) was added to each 96 well and incubated at 37°C for 30 minutes. Finally, 25µl 3µCi/ml 2-Deoxy-[U-14C]-glucose (Perkin Elmer, Cat.no.NEC720A250UC) was added to each 96 well and incubated at 37°C for 1 hour. Detection analysis was done using a scintillation counter (Wallac 1450 MicroBeta TriLux, GMI Inc., Ramsey, Minnesota, USA)
7.8 Fluorescent Activated Cell Sorting (FACS) Fluorescent Activated Cell Sorting (FACS) is an analytical and cell sorting technique, which is based on ICC. Cells are labeled with an antibody targeting an antigen of interest. The primary antibody is either conjugated with a fluorescent dye or a secondary antibody is used for fluorescent signaling. In a fluidic system single cells are then passed through a laser beam and activating the fluorescent dye which is captured by a detector. The fluidic beam is so narrow that the cells align making it possible to capture one cell in one droplet by using a vibrating nozzle. The droplet is then given a positive or negative charge depending on if the cell contains a fluorescent dye or not. The charge is used to sort cells using a powerful electrical field. Thereby a ce
different cell populations in a heterogeneous sample. Several fluorescent dyes can be used in combination, observing subpopulation inside a main population of cells (Blitterswijk, Thomsen 2008).
The FACS analysis can be used to characterize a differentiation protocol by detecting how large portion of a cell sample express a certain marker, and thereby demonstrating how efficient a differentiation protocol is. It is also useful in characterizing how subpopulation develops over time. If a protocol differentiate cells to a specific population, defined by a certain marker, FACS can be
defining a later differentiation stage.
66
Lundin A. 2013
7.8.1 FACS Protocol The FACS protocol is similar to the ICC protocol except that it is done in suspension. It is also important to generate a single cell suspension, no aggregates, due to sensitivity of the FACS instrument, which will clog otherwise. Protocols will differ depending on if a conjugated primary antibody is use or a secondary antibody will be used for fluorescent
antigen is an intracellular marker or surface need to be permeabilized before antibody
e activity. The cell suspension was tt d up and down trying to homogenize the suspension. A washing step was done by
rding to manufacturer’s instructions.
which is related
labeling. The protocol is also depending on if the marker. If it is an intracellular marker the cells staining. The protocol below uses a secondary antibody and stains for an intracellular marker. When a conjugated primary antibody was used and staining for an extracellular antigen the fixating and permeabilization step as well as the secondary antibody staining can be skipped.
Medium was aspirated from the plate and washed once with PBS. 0,5% Trypsin (Life Technologies, Cat.no.15400-054) was added and incubated in 37°C for 5 minutes. FBS (PAA; Cat.no.A15-151) was added to the wells to stop the enzympipe ecentrifuging the samples at 400g for 3minutes, decanting the supernatant and adding PBS +/+ containing 2% FBS, before centrifuging again at 400g for 3 minutes. A viability stain (BD; Cat.no.562247) was added to the cell sample and incubated at RT for 10 minutes.
Fixation and permeabilization The washing step was performed twice before fixating the cells by adding a 4% formaldehyde solution, which was incubated at RT for 15 minutes. The washing step was repeated three times before adding a permeabilization buffer (PBS, 2% FBS, 0,1% Saponin, Sigma, Cat.no.S7900).
Primary antibody staining Samples were washed twice before adding the primary antibody (Table A1), which was incubated 1 hour in RT.
Secondary antibody staining Washing was done three times before adding the secondary antibody (Table A3), which was incubated for 1 hour in RT.
Three washing steps were done before performing the FACS analysis using a flow cytometer (FACSAria II, BD, CA, USA), acco
Besides the sample preparation and staining of the targeted antigens, several controls are used to simplify the analysis. Gating is part of the analysis where different cell populations are defined. First the cell population is gated depending on front and side scatter,to cell content and size. Second, gating is done on cells stained only with one antibody to make it easier to analyze a combination of antibodies. Isotypes of the antibodies is also used, but this to detect if there is unspecific binding, there should not be any signal from the isotype analysis. Data that was collected during the FACS measurement was analyzed using FlowJo.
67
Lundin A. 2013
7.9 Supplement Videos
Supplement Video 1 A 8000cells/EB was plated at a cardiac progenitor stage and started to contract a few days after plating.
Supplement Video 2 A 8000cells/EB was plated at a cardiac progenitor stage and was cultured for 59 days.
tial contractions seen in supplement video 1.
Bs, trying to create a single cell suspension, resulted in
Contractility has decreased compared to the ini
Supplement Video 3 By removing BIO in the initial phase of EB formation a protocol creating 100% beating EBs was achieved. The EBs were culture in suspension.
Supplement Video 4 Using the combination of XAV939 and KY02111 increased the initial beating frequency significantly compared to IWP2 treated EBs seen in supplement video 5.
Supplement Video 5 Using IWP2 resulted in a lower initial beating frequency than treatment with the combination of XAV939 and KY02111 seen in supplement video 4.
Supplement Video 6 Two days after plating of dissociated Ean unsynchronized beating “monolayer”.
Supplement Video 7 Four days of cell culturing after plating dissociated EBs resulted in a synchronized “monolayer”.
Supplement Video 8 Direct differentiation from a monolayer set-up, 250K cells/cm2 on fibronectin coating, resulted in a beating monolayer
68
Lundin A. 2013
8 References
Abu-Issa, R. & Kirby, M.L. 2008, "Patterning of the heart field in the chick", Developmental biology, vol. 319, no. 2, pp. 223-233.
Ahfeldt, T., Schinzel, R.T., Lee, Y.K., Hendrickson, D., Kaplan, A., Lum, D.H., Camahort, R., Xia, F., Shay, J., Rhee, E.P., Clish, C.B., Deo, R.C., Shen, T., Lau, F.H., Cowley, A., Mowrer, G., Al-Siddiqi, H., Nahrendorf, M., Musunuru, K., Gerszten, R.E., Rinn, J.L. & Cowan, C.A. 2012, "Programming human pluripotent stem cells into white and brown adipocytes", Nature cell biology, vol. 14, no. 2, pp. 209-219.
D.A., Cowan, S. & Jones, T.A. 1994, "Lipid-f fatty acid and retinoid transport proteins", Advances in
al precursors from human embryonic stem cells", PLoS medicine, vol. 2, no.
ces of adipocyte hypertrophy and increased visceral adiposity", scular therapy, vol. 6, no. 3, pp. 343-368.
, D'Amario, D., D'Alessandro, D.A., Michler, R.E., Dimmeler, S.,
998-31004.
inhibition of E2F/DP DNA-binding activity via down-regulation of PP2A", Genes & development, vol. 11, no. 15, pp. 1987-1998.
Aouadi, M., Bost, F., Caron, L., Laurent, K., Le Marchand Brustel, Y. & Binetruy, B. 2006, "P38 Mitogen-Activated Protein Kinase Activity Commits Embryonic Stem Cells to either Neurogenesis Or Cardiomyogenesis", Stem cells (Dayton, Ohio), vol. 24, no. 5, pp. 1399-1406.
Banaszak, L., Winter, N., Xu, Z., Bernlohr, binding proteins: a family oProtein Chemistry, vol. 45, pp. 89-151.
Barberi, T., Willis, L.M., Socci, N.D. & Studer, L. 2005, "Derivation of multipotent mesenchym6, pp. e161.
Bays, H.E., Gonzalez-Campoy, J.M., Bray, G.A., Kitabchi, A.E., Bergman, D.A., Schorr, A.B., Rodbard, H.W. & Henry, R.R. 2008, "Pathogenic potential of adipose tissue and metabolic consequenExpert review of cardiova
Bearzi, C., Leri, A., Lo Monaco, F., Rota, M., Gonzalez, A., Hosoda, T., Pepe, M., Qanud, K.Ojaimi, C., Bardelli, S.,Zeiher, A.M., Urbanek, K., Hintze, T.H., Kajstura, J. & Anversa, P. 2009, "Identification of a coronary vascular progenitor cell in the human heart", Proceedings of the National Academy of Sciences, .
Bearzi, C., Rota, M., Hosoda, T., Tillmanns, J., Nascimbene, A., De Angelis, A., Yasuzawa-Amano, S., Trofimova, I., Siggins, R.W., LeCapitaine, N., Cascapera, S., Beltrami, A.P., D'Alessandro, D.A., Zias, E., Quaini, F., Urbanek, K., Michler, R.E., Bolli, R., Kajstura, J., Leri, A. & Anversa, P. 2007, "Human cardiac stem cells", Proceedings of the National Academy of Sciences, vol. 104, no. 35, pp. 14068-14073.
Bennett, C.N., Ross, S.E., Longo, K.A., Bajnok, L., Hemati, N., Johnson, K.W., Harrison, S.D. & MacDougald, O.A. 2002, "Regulation of Wnt signaling during adipogenesis", The Journal of biological chemistry, vol. 277, no. 34, pp. 30
Briggs, R. & King, T.J. 1952, "Transplantation of living nuclei from blastula cells into enucleated frogs’ eggs", Proceedings of the National Academy of Sciences, vol. 38, no. 5, pp. 455-463.
Brinster, R.L. 1974, "The effect of cells transferred into the mouse blastocyst on subsequent development", The Journal of experimental medicine, vol. 140, no. 4, pp. 1049-1056.
Bruneau, B.G., Logan, M., Davis, N., Levi, T., Tabin, C.J., FAU, T.C., FAU, S.J. & Seidman, C.E. 1999, Chamber-specific cardiac expression of Tbx5 and heart defects in Holt-Oram syndrome.
102.
Bernlohr, D.A
mRNA encoding a homologue of myelin P2 protein", Proceedings of the National Academy of Sciences of the United States of America, vol. 81, no. 17, pp. 5468-5472.
Birsoy, K., Chen, Z. & FriedmKLF4", Cell metabolism, vol. 7, no. 4, pp. 339-347.
Blitterswijk, C.A.v. & Thomsen, P. 2008, Tissue engAmsterdam.
Bondue, A., Tannler, S., Chiapparo, G., Chabab, S., Ramialison, M., PaulHarvey, R. & Blanpain, C. 2011, "Defining the earliest step of cardiovascular progenitor specificationvol. 192, no. 5, pp. 751-765.
2008, "Mesp1 Acts as a Master Regulator of Multipotent Cardiovascular Progenitor Specification", Cell Stem Cell, vol. 3, no. 1, pp. 69-84.
Bost, F., Caron, L., Marchetti, I., Dani, C., "Retinoic acid activation of the ERK pathway is required for embryonic stem cell commitment into the adipocyte lineage", The Biochemical journal, vol. 361, no. Pt 3, pp. 621-627.
Bowers, R.R., Kim, J.W., Otto, T.C. & Lane, M.D. 2006, "Stable stem cell commitment to the adipocyte lineage by inhibitProceedings of the National Academy of Sc
70
Lundin A. 2013
Bruneau, B.G., Nemer, G., Schmitt, J.P., Charron, F., Robitaille, L., Caron, S., Conner, D.A., Gessler, M., Nemer, M., Seidman, C.E. & Seidman, J.G. 2001, "A murine model of Holt-
,
s
dal-,
7,
vol. 21, no. 9, pp. 2185-2194.
Chetty, S., Pagliuca, F.W., Honore, C., Kweudjeu, A., Rezania, A. & Melton, D.A. 2013, "A .
Che
vol. 278, no. 11, pp. 9609-9619.
Oram syndrome defines roles of the T-box transcription factor Tbx5 in cardiogenesis anddisease", Cell, vol. 106, no. 6, pp. 709-721.
Burridge, P.W., Anderson, D., Priddle, H., Barbadillo Munoz, M.D., Chamberlain, S., Allegrucci, C., Young, L.E. & Denning, C. 2007, "Improved human embryonic stem cell embryoid body homogeneity and cardiomyocyte differentiation from a novel V-96 plate aggregation system highlights interline variability", Stem cells (Dayton, Ohio), vol. 25, no. 4, pp. 929-938.
Burridge, P.W., Thompson, S., Millrod, M.A., Weinberg, S., Yuan, X., Peters, A., MahairakiV., Koliatsos, V.E., Tung, L. & Zambidis, E.T. 2011, A Universal System for Highly Efficient Cardiac Differentiation of Human Induced Pluripotent Stem Cells That Eliminates Interline Variability.
Cai, C.L., Liang, X., Shi, Y., Chu, P.H., Pfaff, S.L., Chen, J. & Evans, S. 2003, "Isl1 identifiea cardiac progenitor population that proliferates prior to differentiation and contributes a majority of cells to the heart", Developmental cell, vol. 5, no. 6, pp. 877-889.
Cai, W., Guzzo, R.M., Wei, K., Willems, E., Davidovics, H. & Mercola, M. 2012, "A Noto-TGFbeta cascade exerts biphasic control over cardiopoiesis", Circulation researchvol. 111, no. 7, pp. 876-881.
Caprio, M., Feve, B., Claes, A., Viengchareun, S., Lombes, M. & Zennaro, M.C. 200"Pivotal role of the mineralocorticoid receptor in corticosteroid-induced adipogenesis", FASEB journal : official publication of the Federation of American Societies for Experimental Biology,
Cawthorn, W.P., Scheller, E.L. & MacDougald, O.A. 2012, "Adipose tissue stem cells meet preadipocyte commitment: going back to the future", Journal of lipid research, vol. 53,no. 2, pp. 227-246.
Chen, J.X., Krane, M., Deutsch, M.A., Wang, L., Rav-Acha, M., Gregoire, S., Engels, M.C., Rajarajan, K., Karra, R., Abel, E.D., Wu, J.C., Milan, D. & Wu, S.M. 2012, "Inefficient reprogramming of fibroblasts into cardiomyocytes using Gata4, Mef2c, and Tbx5", Circulation research, vol. 111, no. 1, pp. 50-55.
ung, C., Bernardo, A.S., Trotter, M.W., Pedersen, R.A. & Sinha, S. 2012, "Generation of human vascular smooth muscle subtypes provides insight into embryological origin-dependent disease susceptibility", Nature biotechnology, vol. 30, no. 2, pp. 165-173.
Choy, L. & Derynck, R. 2003, "Transforming growth factor-beta inhibits adipocyte differentiation by Smad3 interacting with CCAAT/enhancer-binding protein (C/EBP) and repressing C/EBP transactivation function", The Journal of biological chemistry,
71
Lundin A. 2013
Choy, L., Skillington, J. & Derynck, R. 2000, "Roles of autocrine TGF-beta receptor and Smad signaling in adipocyte differentiation", The Journal of cell biology, vol. 149, nopp. 667-682.
. 3,
Christodoulides, C., Laudes, M., Cawthorn, W.P., Schinner, S., Soos, M., O'Rahilly, S., Sethi, e
l.
Cohen, E.D., Miller, M.F., Wang, Z., Moon, R.T. & Morrisey, E.E. 2012, "Wnt5a and Wnt11 e,
g ponses to FGF signaling", Cytokine Growth Factor, vol. 16, no. 2, pp.
233-247.
Dan
0 ( Pt 11), no. Pt 11, pp. 1279-1285.
ular 15-122.
de la Cruz, M.V., Sanchez Gomez, C., Arteaga, M.M. & Arguello, C. 1977, "Experimental study of the development of the truncus and the conus in the chick embryo", Journal of
Deharch, vol. 29, pp. 544-560.
of connexin 40 gene expression in mouse heart correlates with the differentiation of the conduction system",
Dodou, E., Verzi, M.P., Anderson, J.P., Xu, S.M. & Black, B.L. 2004, "Mef2c is a direct
3931-3942.
Dom A., Prockop, D. & Horwitz, E. 2006, "Minimal criteria for defining
multipotent mesenchymal stromal cells. The International Society for Cellular Therapy position statement", Cytotherapy, vol. 8, no. 4, pp. 315-317.
J.K. & Vidal-Puig, A. 2006, "The Wnt antagonist Dickkopf-1 and its receptors arcoordinately regulated during early human adipogenesis", Journal of cell science, vo119, no. Pt 12, pp. 2613-2620.
are essential for second heart field progenitor development", Development (CambridgEngland), vol. 139, no. 11, pp. 1931-1940.
Dailey, L., Ambrosetti, D., Mansukhani, A. & Basilico, C. 2005, "Mechanisms underlyindifferential res
i, C., Smith, A.G., Dessolin, S., Leroy, P., Staccini, L., Villageois, P., Darimont, C. & Ailhaud, G. 1997, "Differentiation of embryonic stem cells into adipocytes in vitro", Journal of cell science, vol. 11
David, R., Jarsch, V.B., Schwarz, F., Nathan, P., Gegg, M., Lickert, H. & Franz, W.M. 2011, "Induction of MesP1 by Brachyury(T) generates the common multipotent cardiovascstem cell", Cardiovascular research, vol. 92, no. 1, pp. 1
Davis, R.L., Weintraub, H. & Lassar, A.B. 1987, "Expression of a single transfected cDNAconverts fibroblasts to myoblasts", Cell, vol. 51, no. 6, pp. 987-1000.
anatomy, vol. 123, no. Pt 3, pp. 661-686.
aan, R.L. 1963, "Migration patterns of the precardiac mesoderm in the early chick embrvo", Experimental cell rese
Delorme, B., Dahl, E., Jarry-Guichard, T., Marics, I., Briand, J.P., Willecke, K., Gros, D. & Theveniau-Ruissy, M. 1995, "Developmental regulation
Developmental dynamics : an official publication of the American Association of Anatomists, vol. 204, no. 4, pp. 358-371.
transcriptional target of ISL1 and GATA factors in the anterior heart field during mouse embryonic development", Development (Cambridge, England), vol. 131, no. 16, pp.
inici, M., Le Blanc, K., Mueller, I., Slaper-Cortenbach, I., Marini, F., Krause, D., Deans, R., Keating,
72
Lundin A. 2013
Dor, Y., Camenisch, T.D., Itin, A., Fishman, G.I., McDonald, J.A., Carmeliet, P. & Keshet, E.2001, "A novel role for VEGF in endocardial cushion formation and its potential contribution to congenital heart defects", Development (Cambridge, England), vol. 128, no. 9, pp. 1531-1538.
ent",
Eiseogenesis", Circulation research, vol. 77, no. 1, pp. 1-6.
Stanley, E.G. 2011, "NKX2-5(eGFP/w) hESCs for isolation of human cardiac
Este derived stem cells and their induction to a chondrogenic phenotype", Nature protocols, vol. 5, no.
Evan 1, "Establishment in culture of pluripotential cells from mouse embryos", Nature, vol. 292, no. 5819, pp. 154-156.
Evan
Fain, J.N., Madan, A.K., Hiler, M.L., Cheema, P. & Bahouth, S.W. 2004, "Comparison of the
273-2282.
Font ldi, P. 2008, "Hedgehog signaling alters adipocyte maturation of human mesenchymal stem cells", Stem cells (Dayton,
Form Tontonoz, P., Chen, J., Brun, R.P., Spiegelman, B.M. & Evans, R.M. 1995, "15-Deoxy-g12,14-Prostaglandin J2 is a ligand for the adipocyte determination factor
Frandeveloping myocardium: towards a morphologically integrated transcriptional model",
Freudt, R., Mummery, C. & Passier, R. 2008, "Insulin redirects
Dyer, L.A. & Kirby, M.L. 2009, "The role of secondary heart field in cardiac developmDevelopmental biology, vol. 336, no. 2, pp. 137-144.
release of adipokines by adipose tissue, adipose tissue matrix, and adipocytes from visceral and subcutaneous abdominal adipose tissues of obese humans", Endocrinology, vol. 145, no. 5, pp. 2
Farmer, S.R. 2006, "Transcriptional control of adipocyte formation", Cell metabolism, vol. 4, no. 4, pp. 263-273.
aine, C., Cousin, W., Plaisant, M., Dani, C. & Pera
Ohio), vol. 26, no. 4, pp. 1037-1046.
an, B.M.,
PPAGg", Cell, vol. 83, no. 5, pp. 803-812.
co, D., Lamers, W.H. & Moorman, A.F.M. 1998, "Patterns of expression in the
Cardiovascular research, vol. 38, no. 1, pp. 25-53.
nd, C., Ward-van Oostwaard, D., Monshouwer-Kloots, J., van den Brink, S., van Rooijen, M., Xu, X., Zweiger
73
Lundin A. 2013
differentiation from cardiogenic mesoderm and endoderm to neuroectoderm in differentiating human embryonic stem cells", Stem cells (Dayton, Ohio), vol. 26, no. 3, pp. 724-733.
Galli, D., Dominguez, J.N., Zaffran, S., Munk, A., Brown, N.A. & Buckingham, M.E. 2008, "Atrial myocardium derives from the posterior region of the second heart field, whiacquires left-right identity as Pitx2c is expressed", Development (Cambridge, England), vol. 135, no. 6, pp. 1157-1167.
ch
Gaur, M., Ritner, C., Sievers, R., Pedersen, A., Prasad, M., Bernstein, H.S. & Yeghiazarians,
Greb Tapia, N., Sabour, D., Sterneckert, J., Tesar, P. & Scholer, H.R. 2010, "Conserved and divergent roles of FGF
Gree ipose , pp. 105-113.
in
Grepin, C., Robitaille, L., Antakly, T. & Nemer, M. 1995, "Inhibition of transcription factor GATA-4 expression blocks in vitro cardiac muscle differentiation", Molecular and
Gardner, R.L. 1968, "Mouse Chimaeras obtained by the Injection of Cells into the Blastocyst", Nature, vol. 220, no. 5167, pp. 596-597.
Y. 2010, "Timed inhibition of p38MAPK directs accelerated differentiation of human embryonic stem cells into cardiomyocytes", Cytotherapy, vol. 12, no. 6, pp. 807-817.
2012, "Adipogenesis of human adipose-derived stem cells within three-dimensional hollow fiber-based bioreactors", Tissue engineering.Part C, Methods, vol. 18, no. 1, p54-61.
Gesta, S. & Kahn, C.R. 2012, "White Adipose Tissue" in Adipose Tissue Biology, ed. M.E. Symonds, Springer New York, New York, NY, pp. 71.
P19 cells", The Journal of biological chemistry, vol. 280, no. 22, pp. 21022-21028.
and differentiation potential", Cytotherapy, vol. 5, no. 5, pp. 362-369.
er, B., Wu, G., Bernemann, C., Joo, J.Y., Han, D.W., Ko, K.,
signaling in mouse epiblast stem cells and human embryonic stem cells", Cell stem cell, vol. 6, no. 3, pp. 215-226.
n, H. & Kehinde, O. 1976, "Spontaneous heritable changes leading to increased adconversion in 3T3 cells", Cell, vol. 7, no. 1
Green, H. & Meuth, M. 1974, "An established pre-adipose cell line and its differentiation culture", Cell, vol. 3, no. 2, pp. 127-133.
cellular biology, vol. 15, no. 8, pp. 4095-4102.
74
Lundin A. 2013
Gurdon, J.B. 1962, "The Developmental Capacity of Nuclei taken from Intestinal Epithelium Cells of Feeding Tadpoles", Journal of embryology and experimental morphology10, no. 4, pp. 622-640.
, vol.
Habas, R. & Dawid, I. 2005, "Dishevelled and Wnt signaling: is the nucleus the final
Han, J., Jiang, Y., Li, Z., Kravchenko, V.V. & Ulevitch, R.J. 1997, "Activation of the l. 386,
ate
Herr he T gene required in mesoderm formation in the mouse", Nature, vol. 343, no. 6259, pp. 617-
Herr , K., Kuhl, S.J. & Kuhl, M. 2011, "Tbx5 overexpression favors a first heart field lineage in murine embryonic stem cells and in Xenopus laevis embryos",
promotes cardiac differentiation of mouse and human pluripotent stem cell lines", Cell
Kehat, I., Kenyagin-Karsenti, D., Snir, M., Segev, H., Amit, M., Gepstein, A., Livne, E.,
s of cardiomyocytes", The Journal of clinical investigation, vol. 108, no. 3, pp. 407-414.
Kell
Wnt signaling pathway in 3T3-L1 preadipocytes", Biochemical and biophysical research communications, vol.
Kirby, M.L. & Waldo, K.L. 2007, Cardiac development, Oxford University Press, New York
Kita MesP1 and MesP2 are essential for the development of cardiac mesoderm", Development (Cambridge, England), vol. 127, no. 15, pp. 3215-3226.
ey, L., Shurety, W., Newell, F., McGeary, R., Pelton, N., Grant, J., Herington, ACameron, D., Whitehead, J. & Prins, J. 2004, "Fibroblast growth factor 1: a key regulatoof human adip
Ieda, M., Fu, J., Delgado-Olguin, P., Vedantham, V., Hayashi, Y., Bruneau, B.G. & Srivastava, D. 2010, "Direct Reprogramming of Fibroblasts into Functional Cardiomyocytes by Defined Factors", Cell, vol. 142, no. 3, pp. 375-386.
"Sonic Hedgehog influences the balance of osteogenesis and adipogenesis in madipose-derived stromal cells", Tissue engineering.Par
Jang, J., Ku, S.Y., Kim, J.E., Choi, K., Kim, Y.Y., Kim, H.S., Oh, S.K., Lee, E.J., Cho, H.J., Song, Y.H., Lee, S.H., Lee, S.H., Suh, C.S., Kim, S.H., Moon, S.Y. & Choi, Y.M. 200"Notch inhibition promotes human embryonic stem cell-derived cardiac mesoderm
an, B.W. & Ephrussi, B. 1970, "Developmental Potentialities of Clonal In Vitro Cultuof Mouse Testicular Teratoma", Journal of the National Cancer Institute, vol. 44, no. 5, pp. 1015
Kats, A. 2002, "Mesenchymal Cell Culture - Adipose Tissue" in Methods of tissue engineering, eds. A. Atala & R.P. Lanza, 2nd edn, Acade
Kattman, S.J., Witty, A.D., Gagliardi, M., Dubois, N.C., Niapour, M., Hotta, A., Ellis, J. & Keller, G. 2011, "Stage-specific optimization of activin/nodal and BMP signaling
stem cell, vol. 8, no. 2, pp. 228-240.
Binah, O., Itskovitz-Eldor, J. & Gepstein, L. 2001, "Human embryonic stem cells can differentiate into myocytes with structural and functional propertie
y, R.G., Brown, N.A. & Buckingham, M.E. 2001, "The arterial pole of the mouse heart forms from Fgf10-expressing cells in pharyngeal mesoderm", Developmental cell, vol. 1,no. 3, pp. 435-440.
Kim, D.M., Choi, H.R., Park, A., Shin, S.M., Bae, K.H., Lee, S.C., Kim, I.C. & Kim, W.K. 2013, "Retinoic acid inhibits adipogenesis via activation of
434, no. 3, pp. 455-459.
;.
jima, S., Takagi, A., Inoue, T. & Saga, Y. 2000, "
76
Lundin A. 2013
Kleinsmith, L.J. & Pierce, G.B. 1964, "Multipotentiality of Single Embryonal Carcinoma Cells", Cancer research, vol. 24, no. 9, pp. 1544-1551.
omyocytes derived from human embryonic stem cells in pro-survival factors enhance function of infarcted rat hearts", Nature biotechnology, vol. 25, no. 9, pp. 1015-
Lech Pbeta-ifferentiation of human white adipose-
derived progenitors and at later stages in immature adipocytes", Differentiation; research
Lee,mmitment to adipocyte via downregulating Smad/p38MAPK
signaling", Biochemical and biophysical research communications, vol. 409, no. 3, pp.
Lescroart, F., Mohun, T., Meilhac, S.M., Bennett, M. & Buckingham, M. 2012, "Lineage tree for the venous pole of the heart: clonal analysis clarifies controversial genealogy based
Li, F., Wang, D., Zhou, Y., Zhou, B., Yang, Y., Chen, H. & Song, J. 2008, "Protein kinase A
Li, P id regulates differentiation of the secondary heart field and TGFbeta-mediated outflow tract septation", Developmental
Lianrentiation from human
pluripotent stem cells via temporal modulation of canonical Wnt signaling", Proceedings
Draznin, B. 2001, "Insulin-induced adipocyte differentiation. Activation of CREBrescues adipogenesis from the arrest caused by inhi
genspor, M. & Fromme, T. 2012, "Brown Adipose Tissue" in Adipose Tissue Biology, edM.E. Symonds, Springer
Konieczny, S.F. & Emerson, C.P.,Jr 1984, "5-Azacytidine induction of stable mesodermalstem cell lineages from 10T1/2 cells: evidence for regulatory genes controlling determination", Cell, vol. 38, no. 3, pp. 791-800.
Reinecke, H., Xu, C., Hassanipour, M., Police, S., O'Sullivan, C., Collins, L., Chen, Y., Minami, E., Gill, E.A., Ueno, S., Yuan, C., Gold, J. & Murry, C.E. 2007, "Cardi
1024.
ner, S., Mitterberger, M.C., Mattesich, M. & Zwerschke, W. 2013, "Role of C/EBLAP and C/EBPbeta-LIP in early adipogenic d
in biological diversity, vol. 85, no. 1-2, pp. 20-31.
J.S., Park, J.H., Kwon, I.K. & Lim, J.Y. 2011, "Retinoic acid inhibits BMP4-induced C3H10T1/2 stem cell co
550-555.
on genetic tracing", Circulation research, vol. 111, no. 10, pp. 1313-1322.
suppresses the differentiation of 3T3-L1 preadipocytes", Cell research, vol. 18, no. 2, pp. 311-323.
., Pashmforoush, M. & Sucov, H.M. 2010, "Retinoic ac
Lin, Q., Schwarz, J., Bucana, C. & Olson, E.,N. 1997, "Control of Mouse Cardiac Morphogenesis and Myogenesis by Transcription Factor MEF2C", Science, vol. 276, no. 5317, pp. 1404-1407.
Lints, T.J., Parsons, L.M., Hartley, L., Lyons, I. & Harvey, R.P. 1993, "Nkx-2.5: a nomurine homeobox gene expressed in early heart progenitor cells and their myogenic descendants", Development (Cambridge, England), vol. 119, no. 2, pp. 41
vel
9-431.
n
expression of a subset of adipogenic genes", The Journal of biological chemistry, vol.
Liu, ome ular biology,
vol. 26, no. 15, pp. 5827-5837.
Lop l lism in health and disease", Physiological Reviews, vol. 90, no. 1, pp.
207-258.
Lyo"Myogenic and morphogenetic defects in the heart tubes of murine embryos lacking the
Ma, tivity", Developmental biology, vol. 323, no. 1, pp.
98-104.
Mar n
orders : journal of the International Association for the Study of Obesity, vol. 21, no. 4, pp. 261-266.
Mat-
t cells exhibit multilineage potential", Journal of cellular physiology, vol. 215, no. 1, pp. 210-222.
Liu, J. & Farmer, S.R. 2004, "Regulating the balance between peroxisome proliferator-activated receptor gamma and beta-catenin signaling during adipogenesis. A glycogesynthase kinase 3beta phosphorylation-defective mutant of beta-catenin inhibits
279, no. 43, pp. 45020-45027.
J., Wang, H., Zuo, Y. & Farmer, S.R. 2006, "Functional interaction between peroxisproliferator-activated receptor gamma and beta-catenin", Molecular and cell
Q., Zhou, B. & Pu, W.T. 2008, "Reassessment of Isl1 and Nkx2-5 cardiac fate maps using a Gata4-based reporter of Cre ac
tin, G.R. 1981, "Isolation of a pluripotent cell line from early mouse embryos cultured imedium conditioned by teratocarcinoma stem cells", Proceedings of the National Academy of Sciences, vol. 78, no. 12, pp. 7634-7638.
Maslowska, M., Sniderman, A.D., Germinario, R. & Cianflone, K. 1997, "ASP stimulates glucose transport in cultured human adipocytes", International journal of obesity and related metabolic dis
sumoto, T., Kano, K., Kondo, D., Fukuda, N., Iribe, Y., Tanaka, N., Matsubara, Y., Sakuma, T., Satomi, A., Otaki, M., Ryu, J. & Mugishima, H. 2008, "Mature adipocytederived dedifferentiated fa
um
Nature cell biology, vol. 12, no. 10, pp. 1007-1013.
78
Lundin A. 2013
McBeath, R., Pirone, D.M., Nelson, C.M., Bhadriraju, K. & Chen, C.S. 2004, "Cell shape, cytoskeletal tension, and RhoA regulate stem cell lineage commitment", Developmental cell, vol. 6, no. 4, pp. 483-495.
McD
rdiology, vol. 39, no. 6, pp. 865-873.
Mei , M.E. 2004, "The clonal origin of myocardial cells in different regions of the embryonic mouse heart",
Mej ., Blomqvist, L., Bouloumie, A., Frayn, K.N., Dahlman, I., Arner, P. & Ryden, M. 2010, "Mapping of the fibroblast
Mill
Minami, I., Yamada, K., Otsuji, T.G., Yamamoto, T., Shen, Y., Otsuka, S., Kadota, S.,
an
Mohamed-Ali, V., Pinkney, J.H. & Coppack, S.W. 1998, "Adipose tissue as an endocrine and
d receptor beta and active GSK3", Stem cells and development, vol. 18, no. 3, pp. 457-463.
Mor e , Springer New York, New York, NY, pp. 17.
l. 127, no. 6, pp. 1151-1165.
evitt, T.C., Laflamme, M.A. & Murry, C.E. 2005, "Proliferation of cardiomyocytesderived from human embryonic stem cells is mediated via the IGF/PI 3-kinase/Akt signaling pathway", Journal of Molecular and Cellular Ca
lhac, S.M., Esner, M., Kelly, R.G., Nicolas, J.F. & Buckingham
Developmental cell, vol. 6, no. 5, pp. 685-698.
hert, N., Galitzky, J., Pettersson, A.T., Bambace, C
growth factors in human white adipose tissue", The Journal of clinical endocrinologyand metabolism, vol. 95, no. 5, pp. 2451-2457.
er, R.A. & Ruddle, F.H. 1976, "Pluripotent teratocarcinoma-thymus somatic cell hybrids", Cell, vol. 9, no. 1, pp. 45-55.
Morone, N., Barve, M., Asai, Y., Tenkova-Heuser, T., Heuser, J.E., Uesugi, M., Aiba, K.& Nakatsuji, N. 2012, "A small molecule that promotes cardiac differentiation of humpluripotent stem cells under defined, cytokine- and xeno-free conditions", Cell reports, vol. 2, no. 5, pp. 1448-1460.
Mjaatvedt, C.H., Nakaoka, T., Moreno-Rodriguez, R., Norris, R.A., Kern, M.J., Eisenberg, C.A., Turner, D. & Markwald, R.R. 2001, "The outflow tract of the heart is recruited from a novel heart-forming field", Developmental biology, vol. 238, no. 1, pp. 97-109.
paracrine organ", International journal of obesity and related metabolic disorders : journal of the International Association for the Study of Obesity, vol. 22, no. 12, pp. 1145-1158.
Monteiro, M.C., Wdziekonski, B., Villageois, P., Vernochet, C., Iehle, C., Billon, N. & Dani, C. 2009, "Commitment of mouse embryonic stem cells to the adipocyte lineage requires retinoic aci
Moretti, A., Caron, L., Nakano, A., Lam, J.T., Bernshausen, A., Chen, Y., Qyang, Y., Bu, L.,Sasaki, M., Martin-Puig, S., Sun, Y., Evans, S.M., Laugwitz, K.L. & Chien, K.R. 2006, "Multipotent embryonic isl1+ progenitor cells lead to cardiac, smooth muscle, and endothelial cell diversification", Cell, vo
79
Lundin A. 2013
Nagy, A., Gocza, E., Diaz, E.M., Prideaux, V.R., Ivanyi, E., Markkula, M. & Rossa1990, "Embryonic stem cells alone are able to support fetal development in the mouse", Development, vol. 110,
nt, J.
no. 3, pp. 815-821.
I.
iences of the United States of America, vol. 103, no. 52, pp. 19812-19817.
Nedy And
Nedergaard, J. & Cannon, B. 2010, The Changed Metabolic World with Human Brown
Neg . 1978, "Establishment of preadipocyte clonal line from epididymal fat pad of ob/ob mouse that responds to insulin and to lipolytic hormones",
Ng, ri, M.C., Rao, M.S. & Tanavde, V. 2008, "PDGF, TGF-beta, and FGF signaling
is important for differentiation and growth of mesenchymal stem cells (MSCs):
lood,
Cell metabolism,
vol. 16, no. 3, pp. 394-406.
Oniz A.
diac myocyte differentiation from ES-cell derived mesodermal cells via non-canonical pathway", Journal of Molecular and
Otto r, K.C., Rosewell, I.R., Stamp, G.W., Beddington, R.S., Mundlos, S., Olsen, B.R., Selby, P.B. & Owen, M.J. 1997, "Cbfa1, a candidate gene for cleidocranial dysplasia syndrome, is essential for osteoblast differentiation and bone development", Cell, vol. 89, no. 5, pp. 765-771.
Naito, A.T., Shiojima, I., Akazawa, H., Hidaka, K., Morisaki, T., Kikuchi, A. & Komuro, 2006, "Developmental stage-specific biphasic roles of Wnt/beta-catenin signaling in cardiomyogenesis and hematopoiesis", Proceedings of the National Academy of Sc
ergaard, J., Bengtsson, T. & Cannon, B. 2007, "Unexpected evidence for active brown adipose tissue in adult humans", American Journal of Physiology - EndocrinologMetabolism, vol. 293, no. 2, pp. E444-E452.
Adipose Tissue: Therapeutic Visions, Cell Press.
rel, R., Grimaldi, P. & Ailhaud, G
Proceedings of the National Academy of Sciences of the United States of America, vol. 75, no. 12, pp. 6054-6058.
"Characterization of the transcriptional and functional effects of fibroblast growth facto1 on human preadipocyte differentiation", FASEB journal : official publication of the Federation of American Societies for Experimental Biology, vol. 20, no. 14, pp. 26
transcriptional profiling can identify markers and signaling pathways important in differentiation of MSCs into adipogenic, chondrogenic, and osteogenic lineages", Bvol. 112, no. 2, pp. 295-307.
Nishio, M., Yoneshiro, T., Nakahara, M., Suzuki, S., Saeki, K., Hasegawa, M., Kawai, Y., Akutsu, H., Umezawa, A., Yasuda, K., Tobe, K., Yuo, A., Kubota, K., Saito, M. & Saeki, K. 2012, "Production of functional classical brown adipocytes from human pluripotentstem cells using specific hemopoietin cocktail without gene transfer",
uka, T., Yuasa, S., Kusumoto, D., Shimoji, K., Egashira, T., Ohno, Y., Kageyama, T., Tanaka, T., Hattori, F., Fujita, J., Ieda, M., Kimura, K., Makino, S., Sano, M., Kudo,& Fukuda, K. 2012, "Wnt2 accelerates car
Cellular Cardiology, vol. 52, no. 3, pp. 650-659.
, F., Thornell, A.P., Crompton, T., Denzel, A., Gilmou
80
Lundin A. 2013
Paige, S.L., Osugi, T., Afanasiev, O.K., Pabon, L., Reinecke, H. & Murry, C.E. 2010, "Endogenous Wnt/beta-catenin signaling is required for cardiac differentiation in human embryonic stem cells", PloS one, vol. 5, no. 6, pp. e11134.
te a l. 2,
PerkinElmer 2013, 2013-last update, CytostarT Scintillating Microplates [Homepage of
Park, B.O., Ahrends, R. & Teruel, M.N. 2012, "Consecutive positive feedback loops creabistable switch that controls preadipocyte-to-adipocyte conversion", Cell reports, vono. 4, pp. 976-990.
Plaisant, M., Giorgetti-Peraldi, S., Gabrielson, M., Loubat, A., Dani, C. & Peraldi, P. 2011, man
6, no. 2, pp. e16798.
, C.,
ls heart progenitor specification and proliferation", Cell,
vol. 128, no. 5, pp. 947-959.
Puri
associated with lipid droplets and insulin sensitivity in humans", Proceedings of the
Qian, L., Huang, Y., Spencer, C.I., Foley, A., Vedantham, V., Liu, L., Conway, S.J., Fu, J.D. & Srivastava, D. 2012, "In vivo reprogramming of murine cardiac fibroblasts into
Ranm cell-derived cardiomyocytes: bioenergetics and utilization in safety
screening", Toxicological sciences : an official journal of the Society of Toxicology, vol.
Rangappa, S., Fen, C., Lee, E.H., Bongso, A. & Sim, E.K. 2003, "Transformation of adult
Raw , Physiological Zoology, vol. 16, no. 1, pp. 22-43.
Moorman, M.A., Simonetti, D.W., Craig, S. & Marshak, D.R. 1999, "Multilineage potential of adult human mesenchymal stem cells", Science (New York, N.Y.), vol. 2no. 5411, pp. 143-147.
"Inhibition of hedgehog signaling decreases proliferation and clonogenicity of humesenchymal stem cells", PloS one, vol.
Rod om, S., Hansson, E.M., Chien, K.R., Inzunza, J., Hovatta, O. & Tryggvason, K. 2010, "Long-term self-renewal of human pluripotent stem cells on
615.
Ross
.Y.), vol. 289, no. 5481, pp. 950-953.
a, vol.
Saga -Tomita, S. 2000, "Mesp1 expression is the earliest sign of cardiovascular development", Trends in cardiovascular medicine, vol. 10, no. 8, pp. 345-
Saw
nal of biological chemistry, vol. 287, no. 15, pp. 12241-12249.
Sbarry :
Scherer, P.E., Williams, S., Fogliano, M., Baldini, G. & Lodish, H.F. 1995, "A novel serum
n, M. & Dolle, P. 2012, "Retinoic acid signalling during development", Development(Cambridge, England), vol. 139, no. 5, pp. 843-858.
essential for placentation and cardiac morphogenesis", Nature genetics, vol. 18, no. 3, p271-275.
human pluripotent stem cell-derived cardiomyocytes", Stem cells (Dayton, Ohio), v31, no. 5, pp. 829-837.
Robinton, D.A. & Daley, G.Q. 2012, The promise of induced pluripotent stem cells in research and therapy.
in, S., Domogatskaya, A., Str
human recombinant laminin-511", Nature biotechnology, vol. 28, no. 6, pp. 611-
, S.E., Hemati, N., Longo, K.A., Bennett, C.N., Lucas, P.C., Erickson, R.L. & MacDougald, O.A. 2000, "Inhibition of adipogenesis by Wnt signaling", Science (NewYork, N
Ryckebusch, L., Wang, Z., Bertrand, N., Lin, S.C., Chi, X., Schwartz, R., Zaffran, S. & Niederreither, K. 2008, "Retinoic acid deficiency alters second heart field formation", Proceedings of the National Academy of Sciences of the United States of Americ105, no. 8, pp. 2913-2918.
, Y., Kitajima, S. & Miyagawa
352.
ant, A., Chanda, D., Isayeva, T., Tsuladze, G., Garvey, W.T. & Ponnazhagan, S. 2012, "Noggin is novel inducer of mesenchymal stem cell adipogenesis: implications for bone health and obesity", The Jour
bati, A., Accorsi, D., Benati, D., Marchetti, L., Orsini, G., Rigotti, G. & Panettiere, P. 2010, "Subcutaneous adipose tissue classification", European journal of histochemistEJH, vol. 54, no. 4, pp. e48.
protein similar to C1q, produced exclusively in adipocytes", The Journal of biologicalchemistry, vol. 270, no. 45, pp. 26746-26749.
82
Lundin A. 2013
Schroeder, T., Fraser, S.T., Ogawa, M., Nishikawa, S., Oka, C., Bornkamm, G.W., Nishikawa, S., Honjo, T. & Just, U. 2003, "Recombination signal sequence-binding protein Jκ alters mesodermal cell fate decisions by suppressing cardiomyogenesis", Proceedings of the National Academy of Sciences, vol. 100, no. 7, pp. 4018-4023.
Sepussion of GATA4, Nkx2-5, and serum response factor directs early
cardiac gene activity", The Journal of biological chemistry, vol. 277, no. 28, pp. 25775-
Sirbpatterning by down-regulating Isl1 through the Fgf8 pathway", Developmental dynamics
6, pp.
Song ., Huang, G.N., Acharya, A., Smith, C.L., Tallquist, M.D., Neilson, E.G., Hill, J.A., Bassel-Duby, R. & Olson, E.N. 2012, "Heart
Takeuchi, J.K. & Bruneau, B.G. 2009, "Directed transdifferentiation of mouse mesoderm to
Takeuchi, J.K., Ohgi, M., Koshiba-Takeuchi, K., Shiratori, H., Sakaki, I., Ogura, K., Saijoh,
.
005,
e 3beta is required for adipogenesis", Proceedings of the National Academy of Sciences of the United States of America, vol. 102, no. 28, pp.
Tang, Q.Q. & Lane, M.D. 1999, "Activation and centromeric localization of
Tang, Q.Q., Otto, T.C. & Lane, M.D. 2004, "Commitment of C3H10T1/2 pluripotent stem es of the
Tang, Q.Q., Otto, T.C. & Lane, M.D. 2003, "Mitotic clonal expansion: a synchronous process
Taura, D., Noguchi, M., Sone, M., Hosoda, K., Mori, E., Okada, Y., Takahashi, K., Homma, K., Oyamada, N., Inuzuka, M., Sonoyama, T., Ebihara, K., Tamura, N., Itoh, H.,
Timchenko, N.A., Wilde, M., Nakanishi, M., Smith, J.R. & Darlington, G.J. 1996, "CCAAT/enhancer-binding protein alpha (C/EBP alpha) inhibits cell proliferation
heart tissue by defined factors", Nature, vol. 459, no. 7247, pp. 708-711.
Y. & Ogura, T. 2003, "Tbx5 specifies the left/right ventricles and ventricular septum position during cardiogenesis", Development (Cambridge, England), vol. 130, no. 24, pp. 5953-5964
Tang, Q.Q., Gronborg, M., Huang, H., Kim, J.W., Otto, T.C., Pandey, A. & Lane, M.D. 2"Sequential phosphorylation of CCAAT enhancer-binding protein beta by MAPK and glycogen synthase kinas
9766-9771.
CCAAT/enhancer-binding proteins during the mitotic clonal expansion of adipocyte differentiation", Genes & development, vol. 13, no. 17, pp. 2231-2241.
cells to the adipocyte lineage", Proceedings of the National Academy of SciencUnited States of America, vol. 101, no. 26, pp. 9607-9611.
required for adipogenesis", Proceedings of the National Academy of Sciences of the United States of America, vol. 100, no. 1, pp. 44-49.
Suemori, H., Nakatsuji, N., Okano, H., Yamanaka, S. & Nakao, K. 2009, "Adipogenic differentiation of human induced pluripotent stem cells: comparison with that of human embry
Thomas, T., Yamagishi, H., Overbeek, P.A., Olson, E.N. & Srivastava, D. 1998, "The bHLHfactors, dHAND and eHAND, specify pulmonary and systemic cardiac ventricles independent of left-right sidedness", Developmental biology, vol. 196, no. 2, pp. 228-236.
Tian, Y., Cohen, E. & Morrisey, E. 2010, "The Importance of Wnt Signaling in Cardiovascular Development", Pediatric cardiology, vol. 31, no. 3, pp. 342-348.
84
Lundin A. 2013
through the p21 (WAF-1/CIP-1/SDI-1) protein", Genes & development, vol. 10pp. 804-815.
edi, P. & Hematti, P. 2008, "Derivation and immunological characterization of
, no. 7,
Trivmesenchymal stromal cells from human embryonic stem cells", Experimental
van .M., Kirby, M.L., van den Hoff, M.J. & Moorman, A.F. 2009, "A caudal
proliferating growth center contributes to both poles of the forming heart tube",
van,ll line taught us about cardiomyocyte differentiation", Cardiovascular
research, vol. 58, no. 2, pp. 292-302.
Verm
1096-1107.
Wagner, M. & Siddiqui, M.A.Q. 2007b, "Signal Transduction in Early Heart Development (II): Ventricular Chamber Specification, Trabeculation, and Heart Valve Formation",
Wal n, M.R., Platt, D.H. & Kirby, M.L. 2001, "Conotruncal myocardium arises from a secondary heart field", Development
physiology.Endocrinology and metabolism, vol. 296, no. 1, pp. E121-31.
Willen, T., Izpisua Belmonte, J.C., Cashman, J. & Mercola, M. 2012,
"Small molecule-mediated TGF-beta type II receptor degradation promotes
Will Davidovics, H., Lanier, M., Xia, Z., Dawson, M., Cashman, J. & Mercola, M. 2011, "Small-molecule inhibitors of the Wnt pathway potently promote
Wilmut, I., Schnieke, A.E., McWhir, J., Kind, A.J. & Campbell, K.H.S. 1997, "Viable offspring derived from fetal and adult mammalian cells", Nature, vol. 385, no. 6619, pp. 810-813.
hematology, vol. 36, no. 3, pp. 350-359.
den Berg, G., Abu-Issa, R., de Boer, B.A., Hutson, M.R., de Boer, P.A., Soufan, A.T., Ruijter, J
Circulation research, vol. 104, no. 2, pp. 179-188.
d.H. & Defize, L.H.K. 2003, "Twenty one years of P19 cells: what an embryonal carcinoma ce
a, V., Purnamawati, K., Manasi & Shim, W. 2013, "Steering signal transduction pathway towards cardiac lineage from human pluripotent stem cells: a review", Cellular signalling, vol. 25, no. 5, pp.
Wagner, M. & Siddiqui, M.A.Q. 2007a, "Signal Transduction in Early Heart Development (I): Cardiogenic Induction and Heart Tube Formation", Experimental biology and medicine, vol. 232, no. 7, pp. 852-865.
Experimental biology and medicine, vol. 232, no. 7, pp. 866-880.
(Cambridge, England), vol. 128, no. 16, pp. 3179-3188.
J.P., Hutley, L.J. & Prins, J.B. 2009, "Fibroblast growth factor receptor 1 is a key regulator of early adipogenic events in human preadipocytes", American journal of
ems, E., Cabral-Teixeira, J., Schade, D., Cai, W., Reeves, P., Bushway, P.J., Lanier, M., Walsh, C., Kirchhaus
cardiomyogenesis in embryonic stem cells", Cell stem cell, vol. 11, no. 2, pp. 242-252.
ems, E., Spiering, S.,
cardiomyocytes from human embryonic stem cell-derived mesoderm", Circulation research, vol. 109, no. 4, pp. 360-364.
85
Lundin A. 2013
Wu, J., Bostrom, P., Sparks, L.M., Ye, L., Choi, J.H., Giang, A.H., Khandekar, M., Virtanen,K.A., Nuutila, P., Schaart, G., Huang, K., Tu, H., van Marken Lichtenbelt, W.D., HoeksJ., Enerback, S., Schrauwen, P. & Spiegelman, B.M. 2012,
,
"Beige adipocytes are a distinct type of thermogenic fat cell in mouse and human", Cell, vol. 150, no. 2, pp. 366-
Yang, L., Soonpaa, M.H., Adler, E.D., Roepke, T.K., Kattman, S.J., Kennedy, M., Henckaerts, E., Bonham, K., Abbott, G.W., Linden, R.M., Field, L.J. & Keller, G.M.
Yeh, W.C., Cao, Z., Classon, M. & McKnight, S.L. 1995, "Cascade regulation of terminal ipper
376.
Shimizu, N., Kajiho, H., Watanabe, T., Azuma, N., Katada, T. & Nishina, H. 2010, "p38Mitogen-activated protein kinase controls a switch between cardiomyocyte and neuroncommitment of murine embryonic stem cells by activating myocyte enhancer factor 2C-dependent bo
ier-Neto, J., Trueba, S.S., Stolfi, A., Souza, H.M., Sobreira, T.J., Schubert, M. & CastillH.A. 2012, "An unauthorized biography of the second heart field and a pioneer/scmodel for cardiac development", Current topics in developmental biology, vol. 100, 67-105.
Xiong, C., Xie, C.Q., Zhang, L., Zhang, J., Xu, K., Fu, M., Thompson, W.E., Chen, Y.E. 2005, "Derivation of adipocytes from human embryonic stem cells", Stemcells and development, vol. 14, no. 6, pp. 671-675.
Xu, R.H., Chen, X., Li, D.S., Li, R., Addicks, G.C., Glennon, C., Zwaka, T.P. & Thomson, J.A. 2002, "BMP4 initiates human embryonic stem cell differentiation to trophoblast", Nature biotechnology, vol. 20, no. 12, pp. 1261-1264.
Xu, X.Q., Graichen, R., Soo, S.Y., Balakrishnan, T., Bte Rahmat, S.N., Sieh, S., Tham, S.C., Freund, C., Moore, J., Mummery, C., Colman, A., Zweigerdt, R. & Davidson, B.P. 2"Chemically defined medium supporting cardiomyocy
, J.C., Schwarz, E.J., Chawla, A. & Lazar, M.A. 1996, "Distinct stages in adipogenrevealed by retinoid inhibition of differentiation after induction of PPARgamma", Molecular and cellular biology, vol. 16, no. 4, pp. 1567-1575.
2001, "The combinatorial activities of Nkx2.5 and dHAND are essential for cardiac ventricle formation", Developmental biology, vol. 239, no. 2, pp. 190-203.
2008, "Human cardiovascular progenitor cells develop from a KDR+ embryonic-stem-cell-derived population", Nature, vol. 453, no. 7194, pp. 524-528.
adipocyte differentiation by three members of the C/EBP family of leucine zproteins", Genes & development, vol. 9, no. 2, pp. 168-181.
86
Lundin A. 2013
Yu, P4-induced human embryonic stem cell differentiation", Cell stem cell,
vol. 8, no. 3, pp. 326-334.
Zaff Right anterior heart field", Circulation research, vol.
95, no. 3, pp. 261-268.
Zara aling m cells
nia, T., Z.,
Sengenes, C., Ailhaud, G., Clement, K., Bouloumie, A., Kirkland, J.L. & Dani, C. 2010, "Activin a plays a critical role in
no. 10,
Zhang, J.W., Klemm, D.J., Vinson, C. & Lane, M.D. 2004, "Role of CREB in transcriptional
P., Pan, G., Yu, J. & Thomson, J.A. 2011, "FGF2 sustains NANOG and switches the outcome of BM
ran, S., Kelly, R.G., Meilhac, S.M., Buckingham, M.E. & Brown, N.A. 2004, "ventricular myocardium derives from the
gosi, L.E., Ailhaud, G. & Dani, C. 2006, "Autocrine fibroblast growth factor 2 signis critical for self-renewal of human multipotent adipose-derived stem cells", Ste(Dayton, Ohio), vol. 24, no. 11, pp. 2412-2419.
Zaragosi, L.E., Wdziekonski, B., Villageois, P., Keophiphath, M., Maumus, M., TchkoBourlier, V., Mohsen-Kanson, T., Ladoux, A., Elabd, C., Scheideler, M., Trajanoski,Takashima, Y., Amri, E.Z., Lacasa, D.,
proliferation and differentiation of human adipose progenitors", Diabetes, vol. 59,pp. 2513-2521.
regulation of CCAAT/enhancer-binding protein beta gene during adipogenesis", The Journal of biological chemistry, vol. 279, no. 6, pp. 4471-4478.
Chen, L., Tian, T., Wang, X., Li, P., Hescheler, J., Ji, G. & Ma, Y. 2011, "Direct differentiation of atrial and ventricular myocytes from human embryonic stem cells byalternating retinoid signals", Cell research, vol. 21, no. 4, pp. 579-5
Zhang, Y.Y., Li, X., Qian, S.W., Guo, L., Huang, H.Y., He, Q., Liu, Y., Ma, C.G. & Tang, Q.Q. 2012, "Down-regulation of type I Runx2 mediated by dexamethasone is required for 3T3-L1 adipogenesis", Molecular endocrinology (Balt
, R., Watt, A.J., Battle, M.A., Li, J., Bondow, B.J. & Duncan, S.A. 2008, "Loss ofGATA4 and GATA6 blocks cardiac myocyte differentiation and results in acardia inmice", Developmental biology, vol. 317, no. 2, pp. 614-619.
87
Lundin A. 2013
Recommended literature
kingham, M., Meilhac, S. & Zaffran, S. 2005, "Building the mammalian heart from two sources of myocardial cells", Nature reviews.Genetics, vol. 6, no. 11, pp. 826-835.
Buc
Chri
Evanent", Circulation research, vol. 107, no. 12, pp. 1428-1444.
Kell developmental biology, vol. 100,
Klin
Mor in Adipose 7.
Mur t
f -
Tang, Q.Q. & Lane, M.D. 2012, "Adipogenesis: from stem cell to adipocyte", Annual Review of Biochemistry, vol. 81, pp. 715-736.
Burridge, P.W., Keller, G., Gold, J.D. & Wu, J.C. 2012, "Production of de novo cardiomyocytes: human pluripotent stem cell differentiation and direct reprogramming", Cell stem cell, vol. 10, no. 1, pp. 16-28.
stodoulides, C., Lagathu, C., Sethi, J.K. & Vidal-Puig, A. 2009, "Adipogenesis and WNT signalling", Trends in endocrinology and metabolism: TEM, vol. 20, no. 1, pp. 16-24.
Dyer, L.A. & Kirby, M.L. 2009, "The role of secondary heart field in cardiac development", Developmental biology, vol. 336, no. 2, pp. 137-144.
Gesta, S. & Kahn, C.R. 2012, "White Adipose Tissue" in Adipose Tissue Biology, ed. M.E. Symonds, Springer New York, New York, NY, pp. 71.
Gesta, S., Tseng, Y.H. & Kahn, C.R. 2007, "Developmental origin of fat: tracking obesity to its source", Cell, vol. 131, no. 2, pp. 242-256.
y, R.G. 2012, "The second heart field", Current topics inpp. 33-65.
genspor, M. & Fromme, T. 2012, "Brown Adipose Tissue" in Adipose Tissue Biology, ed. M.E. Symonds, Springer New York, New York, NY, pp. 39.
Laugwitz, K.L., Moretti, A., Caron, L., Nakano, A. & Chien, K.R. 2008, "Islet1 cardiovascular progenitors: a single source for heart lineages?", Development (Cambridge, England), vol. 135, no. 2, pp. 193-205.
Miquerol, L. & Kelly, R.G. 2013, "Organogenesis of the vertebrate heart", Wiley Interdisciplinary Reviews: Developmental Biology, vol. 2, no. 1, pp. 17-29.
eno-Navarrete, J.M. & Fernández-Real, J.M. 2012, "Adipose differentiation"Tissue Biology, ed. M.E. Symonds, Springer New York, New York, NY, pp. 1
ry, C.E. & Keller, G. 2008, "Differentiation of embryonic stem cells to clinically relevanpopulations: lessons from embryonic development", Cell, vol. 132, no. 4, pp. 661-680.
Rana, M.S., Christoffels, V.M. & Moorman, A.F. 2013, "A molecular and genetic outline ocardiac morphogenesis", Acta physiologica (Oxford, England), vol. 207, no. 4, pp. 588615.
88
Lundin A. 2013
Tzahor, E. & Evans, S.M. 2011, "Pharyngeal mesoderm development during embryogenesimplications for both heart and head myogenesis", Cardiovascular research, vol. 91, no2, pp. 196-202.
is: .
, pp. 1096-1107.
Wagner, M. & Siddiqui, M.A.Q. 2007a, "Signal Transduction in Early Heart Development
Wag ent
logy and medicine, vol. 232, no. 7, pp. 866-880.
ld l biology, vol. 100, pp.
67-105.
Verma, V., Purnamawati, K., Manasi & Shim, W. 2013, "Steering signal transduction pathway towards cardiac lineage from human pluripotent stem cells: a review", Cellular signalling, vol. 25, no. 5
Vincent, S.D. & Buckingham, M.E. 2010, "How to make a heart: the origin and regulation of cardiac progenitor cells", Current topics in developmental biology, vol. 90, pp. 1-41.
(I): Cardiogenic Induction and Heart Tube Formation", Experimental biology and medicine, vol. 232, no. 7, pp. 852-865.
ner, M. & Siddiqui, M.A.Q. 2007b, "Signal Transduction in Early Heart Developm(II): Ventricular Chamber Specification, Trabeculation, and Heart Valve Formation", Experimental bio
Xavier-Neto, J., Trueba, S.S., Stolfi, A., Souza, H.M., Sobreira, T.J., Schubert, M. & Castillo, H.A. 2012, "An unauthorized biography of the second heart field and a pioneer/scaffomodel for cardiac development", Current topics in developmenta
89
Lundin A. 2013
Supplement Information
Specification of Antibodies
A1: Primary anti-bodies used for ICC staining regarding cardiomyocyte differentiation protocols. Table
Table A5: Standard curve concentrations used in lipolysis and insulin response analysis
Glycerol standard curve
mM Buffer (µl) Concentrate (µl) Source of Total concentrate volume (µl)
Stock 2.8 A 2,8 0 2000 Stock 1000
1,4 1000 1000 A 1000 B C 0,7 1000 1000 B 1000 D 0,35 1000 1000 C 1000 E 0,175 1000 1000 D 1000
1000 F 0,0875 1000 1000 E G 0,0438 1000 1000 F 1000 H 0,0219 1000 1000 G 1000 I 0,0109 1000 1000 H 1000 J 0,0055 1000 1000 I 2000
Table A6: Forskolin concentration ratio used in lipolysis and insulin response analysis.
Forskolin concentration ratio
mM Buffer (µl) Concentrate (µl) Source of Total volume concentrate (µl)
Stock 10 000 A 500 0 500 Stock 450 B 71,429 300 50 A 300 C 10,204 300 50 B 300 D 1,4577 300 50 C 300 E 0,2082 300 50 D 300 F 0,0297 300 50 E 300 G 0,0042 300 50 F 300
91
Lundin A. 2013
92
r Adipocyte Characterization
alysis of BAT samples
Taqman Assay Probes/ID fo
Table A7: Taqman assays used for qPCR an
BAT Taqman assay/probes
Genes Assay ID UC 3_mP1 HS0022245 1 CIDEA HS00154455_m1 PRDM16 H _S00922674 m1 AdipoQ H _Oc H _
S00605917 m1 t4 S01654807 S1
TBP HS00427620_m1
T A ob or C iz
able A8: Taqman assays used for qPCR analysis of cardiomyocyte samples
/probes
aqman ssay Pr es/ID f Cardiomyocyte haracter ation