1 Evaluating Design Alternatives using Crash Prediction Methods from the Highway Safety Manual Andrew Ooms November 2012 Outline Safety Overview Current practices Safety Fundamentals Introduction the Highway Safety Manual Part C Predictive Method Part D Crash Modification Factors Crash Prediction in Alternatives Evaluation Methodology Example Applications Calibration Applications in Alaska
Transcript
1
Evaluating Design Alternatives using Crash Prediction Methods from the Highway Safety Manual
Andrew Ooms
November 2012
Outline
Safety Overview
Current practices
Safety Fundamentals
Introduction the Highway Safety Manual
Part C Predictive Method
Part D Crash Modification Factors
Crash Prediction in Alternatives Evaluation
Methodology
Example Applications
Calibration
Applications in Alaska
2
Presentation Goals
Provide overview of safety concepts
Share new quantitative tools
Supplement current safety practices
Add reliability and capabilities to safety evaluation
Provide quantitative safety performance for existing and new facilities
Enhance message to decision makers
Discuss crash prediction applications in Alaska
OVERVIEW OF SAFETY
3
What if…
…you were asked to
evaluate the safety
performance of these
seven alternatives?
Current Common Safety Practices
System Planning: Identify high-crash locations
Crash frequency, crash rate, or severity
Some combination of these performance measures
Example: Oregon DOT SPIS List
Weighted average of frequency, rate, and severity
Performance measure: highest ranked 5-10% of segments
Example: ADOT&PF HSIP List
Intersections
Critical crash method; safety ratio > 0.90
1 fatality or 2 major injuries
Segments
1 fatality or 2 major injuries
4
Current Common Safety Practices
Project Planning through Design
Non-Safety Focused Projects
Design Standards as a Surrogate for Safety
Engineering Judgment
Peer Review Process
Safety Focused Projects
Crash Reduction Factors
Design Standards as a Surrogate for Safety
Engineering Judgment
Peer Review Process
Operations and Maintenance
Signing and Pavement Marking Inventories/Maintenance
Pavement Quality Inventories/Maintenance
Why do something different?
Able to measure safety objectively (i.e., quantitatively)
New tools build on and enhance current practice
Improve reliability
Provide new capabilities (e.g., predicting crashes, new facilities)
Able to quantify safety and compare with other project advantages and
disadvantages (e.g., costs, operations, ROW)
Opportunities to incorporate new tools and methods in the near-term
and plan for further integrating them in the long-term
No need to do everything at once
New tools/methods can provide value to decision making now
5
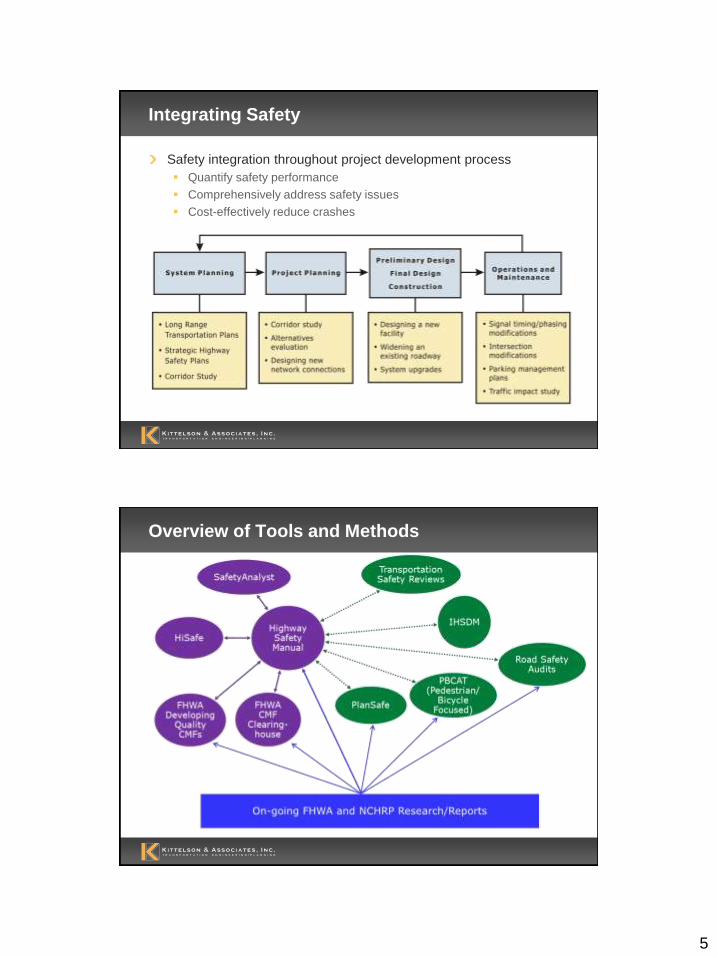
Integrating Safety
Safety integration throughout project development process
Quantify safety performance
Comprehensively address safety issues
Cost-effectively reduce crashes
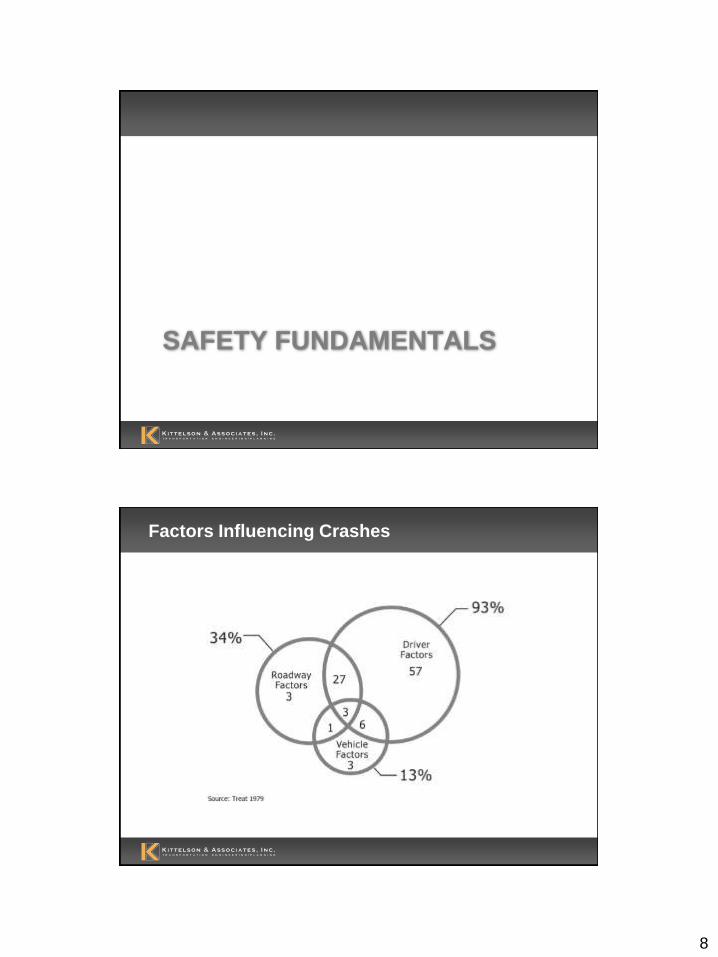
Overview of Tools and Methods
6
Safety Analysis Tools
SafetyAnalyst
Roadway safety management tool
Applies HSM Part B procedures
HiSafe
Crash prediction tool
Applies HSM Part C procedures
Interactive Highway Safety Design Model (IHSDM)
Evaluates safety and operations of geometric design
Crash prediction parallels HSM Part C
FHWA CMF Clearinghouse
Broader range of CMFs than HSM
Web-based, continually updated
ADOT&PF HSIP Handbook
Provides critical crash rate parameters
Alaska-developed CRFs
What is the HSM? It is…
…Like the HCM …NOT Like the MUTCD & Green Book
No requirements
No mandates
No warrants
No standards
An analysis tool
Assesses safety performance based upon exposure and roadway conditions
Quantifies safety
7
What can the HSM be used for?
Quantifying Safety in Project Decisions
Spending Limited Resources Wisely
Guiding Improvements for...
– Networks
– Corridors
– Intersections
Managing Risk to Reduce Tort Liability
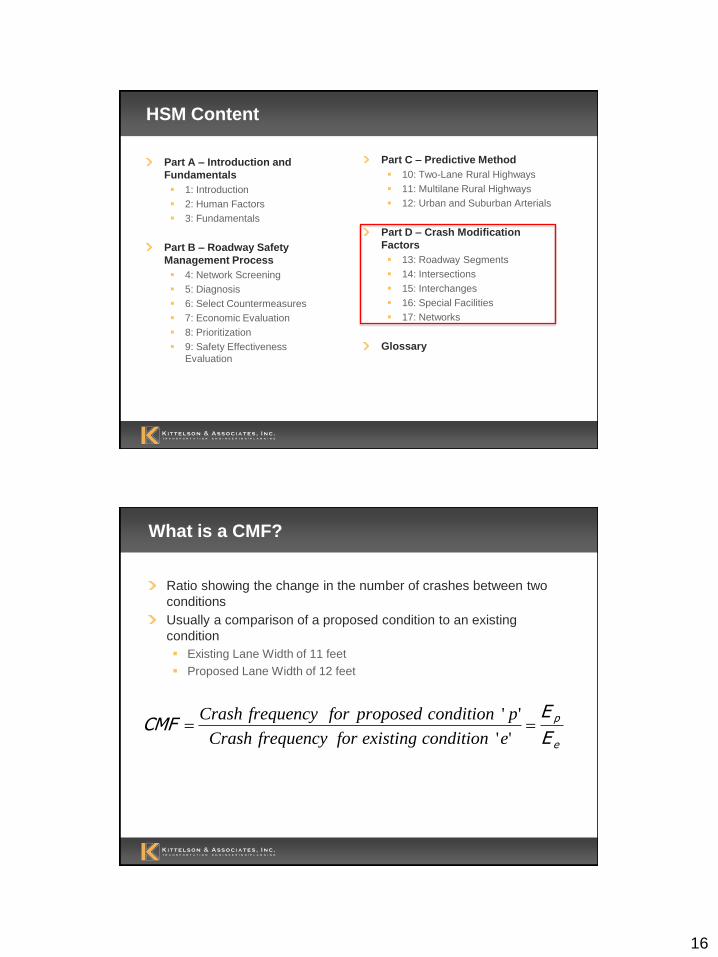
Part C – Predictive Method
10: Two-Lane Rural Highways
11: Multilane Rural Highways
12: Urban and Suburban Arterials
Part D – Crash Modification
Factors
13: Roadway Segments
14: Intersections
15: Interchanges
16: Special Facilities
17: Networks
Glossary
Part A – Introduction and
Fundamentals
1: Introduction
2: Human Factors
3: Fundamentals
Part B – Roadway Safety
Management Process
4: Network Screening
5: Diagnosis
6: Select Countermeasures
7: Economic Evaluation
8: Prioritization
9: Safety Effectiveness
Evaluation
HSM Content
8
SAFETY FUNDAMENTALS
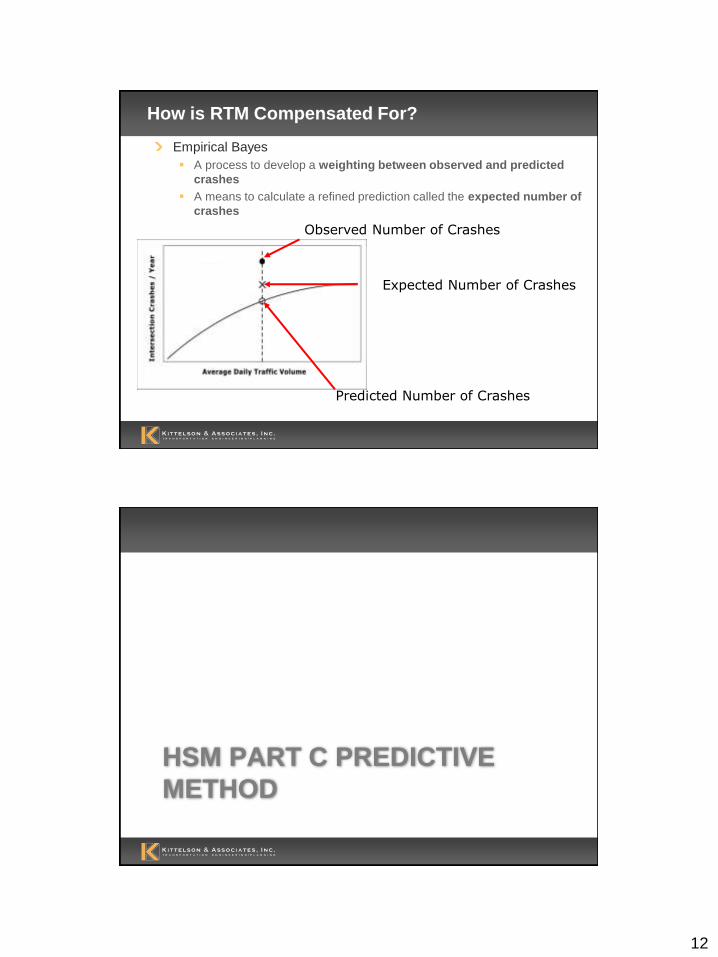
Factors Influencing Crashes
9
Objective and Subjective Safety
“Downtown is difficult as it is without having a roundabout death trap in it.” - Chico Enterprise - Record Posted: 03/08/2011
Objective – Measured
Subjective - Perceived
SUBJECTIVE
Converting a traffic signal in an urban area to a roundabout reduces injury/fatal crashes by about 60%. – HSM 2010
OBJECTIVE
Nominal and Substantive Safety
Source: NCHRP 480
10
Crashes are Rare and Random Events
Crashes are Rare and Random Events
Crashes, as rare random events, tend to regress to long-term
average – this is called “Regression to the Mean” (RTM)
Looking at short-term crash frequencies can be misleading
11
Regression to the Mean
How is RTM Compensated For?
Safety Performance Functions (SPFs)
Predicts the average number of crashes per year
It is generally a nonlinear regression equation
From HSIS Data
Crashes do NOT necessarily vary linearly with traffic volume
Data Inputs
AADT (for major and minor approaches if analyzing intersection)
Segment Length (if analyzing roadway segment)
Coefficients from tables or equations given in the HSM
Safety Performance Function
0
4
8
12
16
5000 10000 15000 20000 25000
AADT
Cra
sh
es P
er
Year
Crashes Per Year
Nspf,x
12
How is RTM Compensated For?
Empirical Bayes
A process to develop a weighting between observed and predicted
crashes
A means to calculate a refined prediction called the expected number of
crashes
Observed Number of Crashes
Expected Number of Crashes
Predicted Number of Crashes
HSM PART C PREDICTIVE
METHOD
13
Overview of Methods for Estimating and Predicting
Crashes
Why estimate or predict crashes?
Identifying potential countermeasures
Designing new roadway and want to consider safety quantitatively
Modifying existing roadway and want to consider safety quantitatively
What types of projects could this apply to?
Corridor studies
Intersection studies
Access Management activities
Capacity enhancements
Development review process
“Upgrades to an urban cross-section”
Overview of Methods for Estimating and Predicting
Crashes
Traditional Approach
Surrogates for Safety (e.g., standards, speed, number of conflict points)
Advantage – Simple and familiar
Disadvantage – Indirect measures, need an existing condition
Crash Reduction Factors
Advantages – Simple and limited data required, can account for local conditions
Disadvantages – Unreliable results (does not account for RTM), not always
able to account for variability in results
New Approaches
HSM Predictive Method
Advantages – More reliable results (accounts for RTM), do not need an existing
condition
Disadvantages – Slightly more expertise and data needed
Crash Modification Factors
Advantages – More reliable, able to account for variability in results
Disadvantages – Slightly more expertise and data needed
14
Part C – Predictive Method
10: Two-Lane Rural Highways
11: Multilane Rural Highways
12: Urban and Suburban Arterials
Part D – Crash Modification
Factors
13: Roadway Segments
14: Intersections
15: Interchanges
16: Special Facilities
17: Networks
Glossary
Part A – Introduction and
Fundamentals
1: Introduction
2: Human Factors
3: Fundamentals
Part B – Roadway Safety
Management Process
4: Network Screening
5: Diagnosis
6: Select Countermeasures
7: Economic Evaluation
8: Prioritization
9: Safety Effectiveness
Evaluation
HSM Content
Fundamentally, what is the Predictive Method?
15
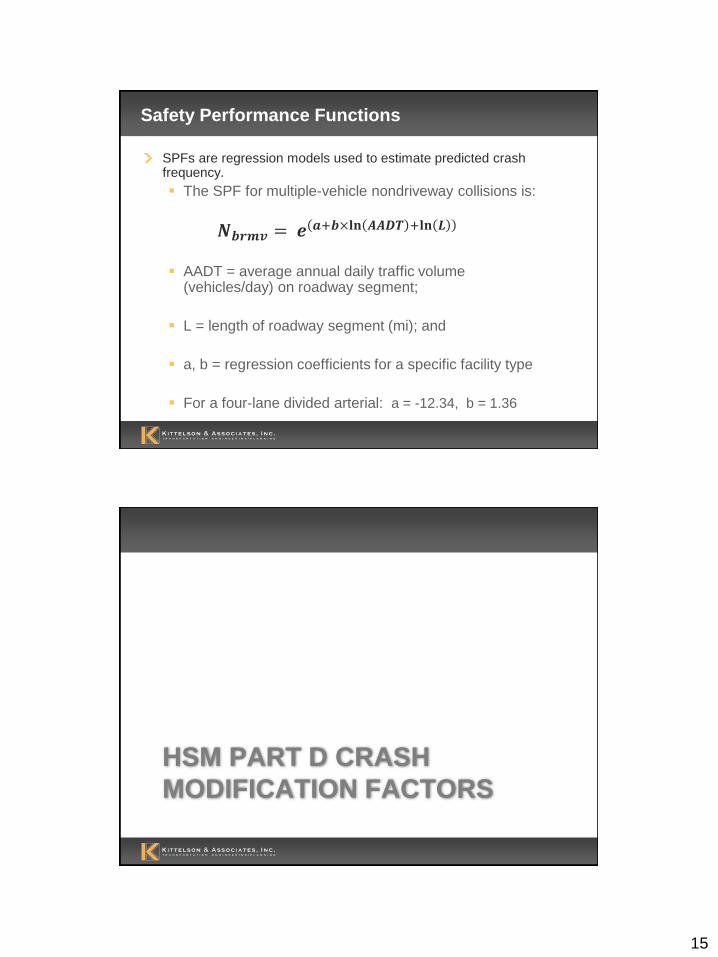
Safety Performance Functions
SPFs are regression models used to estimate predicted crash frequency.
The SPF for multiple-vehicle nondriveway collisions is:
𝑵𝒃𝒓𝒎𝒗 = 𝒆 𝒂+𝒃×𝐥𝐧 𝑨𝑨𝑫𝑻 +𝐥𝐧 𝑳
AADT = average annual daily traffic volume (vehicles/day) on roadway segment;
L = length of roadway segment (mi); and
a, b = regression coefficients for a specific facility type
For a four-lane divided arterial: a = -12.34, b = 1.36
HSM PART D CRASH
MODIFICATION FACTORS
16
Part C – Predictive Method
10: Two-Lane Rural Highways
11: Multilane Rural Highways
12: Urban and Suburban Arterials
Part D – Crash Modification
Factors
13: Roadway Segments
14: Intersections
15: Interchanges
16: Special Facilities
17: Networks
Glossary
Part A – Introduction and
Fundamentals
1: Introduction
2: Human Factors
3: Fundamentals
Part B – Roadway Safety
Management Process
4: Network Screening
5: Diagnosis
6: Select Countermeasures
7: Economic Evaluation
8: Prioritization
9: Safety Effectiveness
Evaluation
HSM Content
What is a CMF?
Ratio showing the change in the number of crashes between two
conditions
Usually a comparison of a proposed condition to an existing
condition
Existing Lane Width of 11 feet
Proposed Lane Width of 12 feet
e
p
E
ECMF
''
''
econditionexistingforfrequencyCrash
pconditionproposedforfrequencyCrash
17
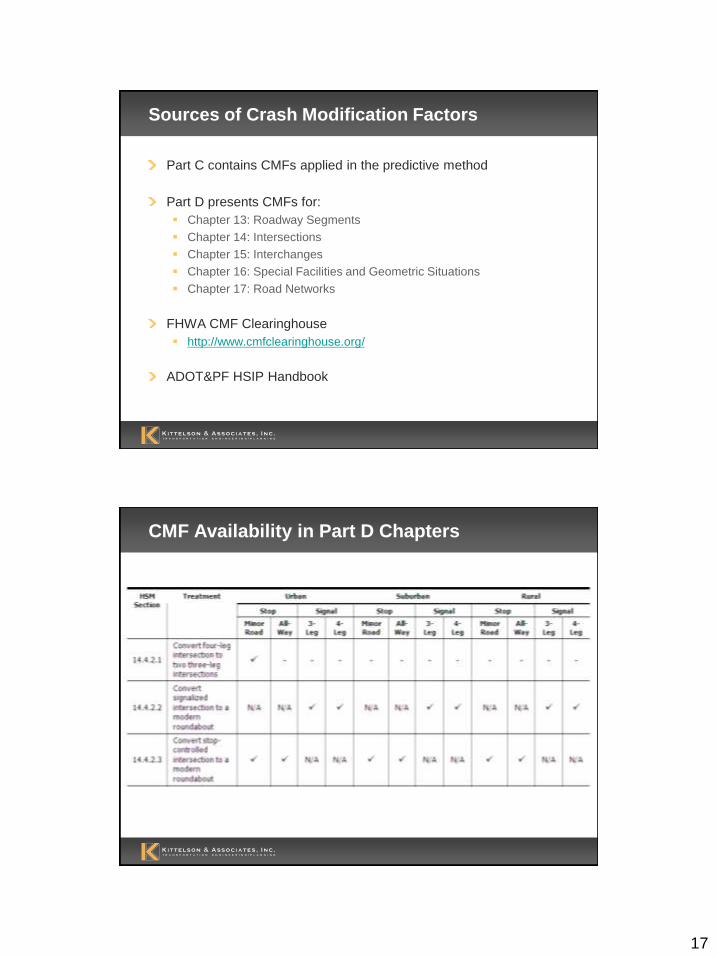
Sources of Crash Modification Factors
Part C contains CMFs applied in the predictive method
Part D presents CMFs for:
Chapter 13: Roadway Segments
Chapter 14: Intersections
Chapter 15: Interchanges
Chapter 16: Special Facilities and Geometric Situations
• Analysis result will yield a range with 95% confidence
xx SE2CMF(95%) IC
ADOT&PF HSIP Handbook (CRFs)
𝐶𝑀𝐹 = 1 −𝐶𝑅𝐹
100
Other CMF Sources
FHWA CMF Clearinghouse
20
PREDICTIVE METHOD
APPLICATION
Crash Prediction in Alternative Evaluation
SPFs
Predict the future no-build and alternative conditions
CMFs
Modify SPFs for desired conditions
OR
Represent difference in crash frequency
Results
Number of predicted crashes for each study condition
Crash costs then utilized in benefit/cost
Safety performance of alternatives quantified
Comparable to operations, right-of-way, construction costs, etc.
21
Methods for Comparing Alternative Conditions
Method Condition 1 Condition 2
1 Part C SPF Part C SPF
2 Part C SPF Part D CMF
3 Independent SPF Part D CMF
4 Observed Crash
Frequency
Part D or Independent
CMF
Methods for Comparing Alternative Conditions
Method 1: SPF vs. SPF
Requires SPFs for each study condition
Calibration preferred
Applicable to new facilities and future conditions
Method 2: SPF vs. SPF x CMF
Requires SPF for base condition
Calibration preferred
Applicable to new facilities and future conditions
Method 3: Independent SPF vs. SPF x CMF
Requires local SPF
Applicable to new facilities and future conditions
Method 4: Existing Frequency vs. Frequency x CMF
Requires only crash history and applicable CMFs
Not applicable to new facilities or future conditions
22
Predictive Method for Urban and Suburban Arterials
Collect Data
Ni = SPF *(CMF1i *CMF2i)*Ci
Volumes & Facility Type
Base Prediction
Geometric Characteristics
Predicted Average Crash Frequencies
Safety Performance Functions
Crash Modification Factors
Local Conditions Calibration Factors
Considerations
Incorporates many, but not all geometric features – absence does not mean a feature does not have an effect These models do not explain cause Weather and driver behavior is not explicitly addressed in these models
23
CORRIDOR ALTERNATIVES
EVALUATION EXAMPLE
Russell Street Corridor, Missoula, Montana
1.5 Mile-long Study Area
1 of 5 Bridge Crossings for Community of Missoula
2/3 lane cross section
ADT volumes of 25,000 (north end) to 20,000 (south end)
Important route for bicycle commuters
Earmark secured for initial funding of project
24
Alternatives
Data Collection
Much of it is standard for a traffic study
Additional data:
Fixed object density & offset
Driveway information
Alcohol sales establishments w/in 1,000 feet of signalized intersection
Data collected from
Field measurements,
Scaled aerials,
Google Streetview, and
Concept plans
25
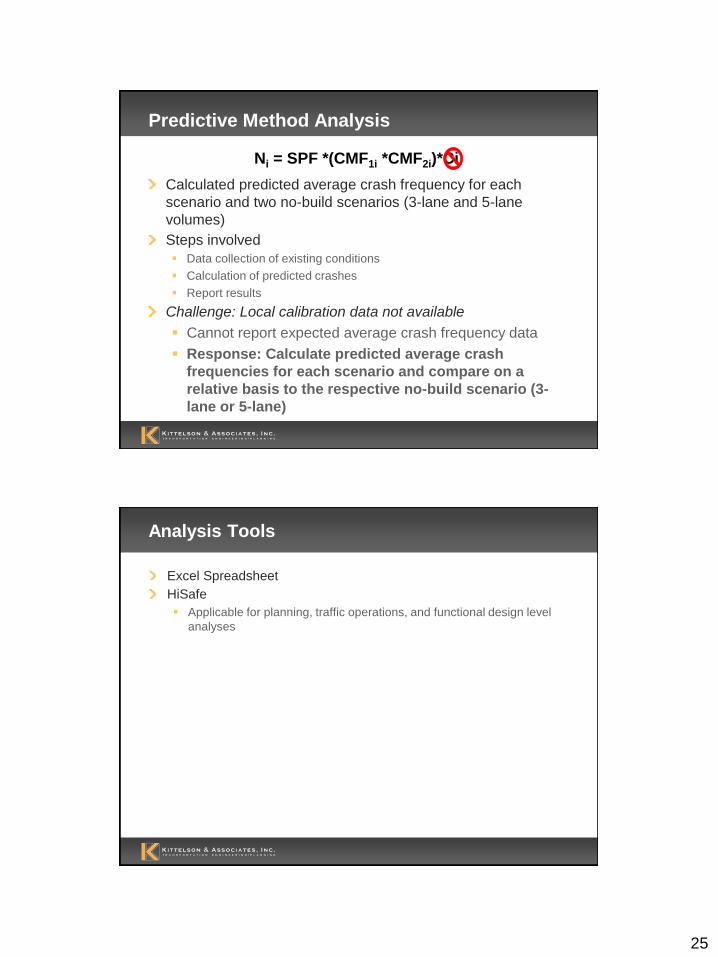
Predictive Method Analysis
Calculated predicted average crash frequency for each
scenario and two no-build scenarios (3-lane and 5-lane
volumes)
Steps involved
Data collection of existing conditions
Calculation of predicted crashes
Report results
Challenge: Local calibration data not available
Cannot report expected average crash frequency data
Response: Calculate predicted average crash
frequencies for each scenario and compare on a
relative basis to the respective no-build scenario (3-
lane or 5-lane)
Ni = SPF *(CMF1i *CMF2i)*Ci
Analysis Tools
Excel Spreadsheet
HiSafe
Applicable for planning, traffic operations, and functional design level
analyses
26
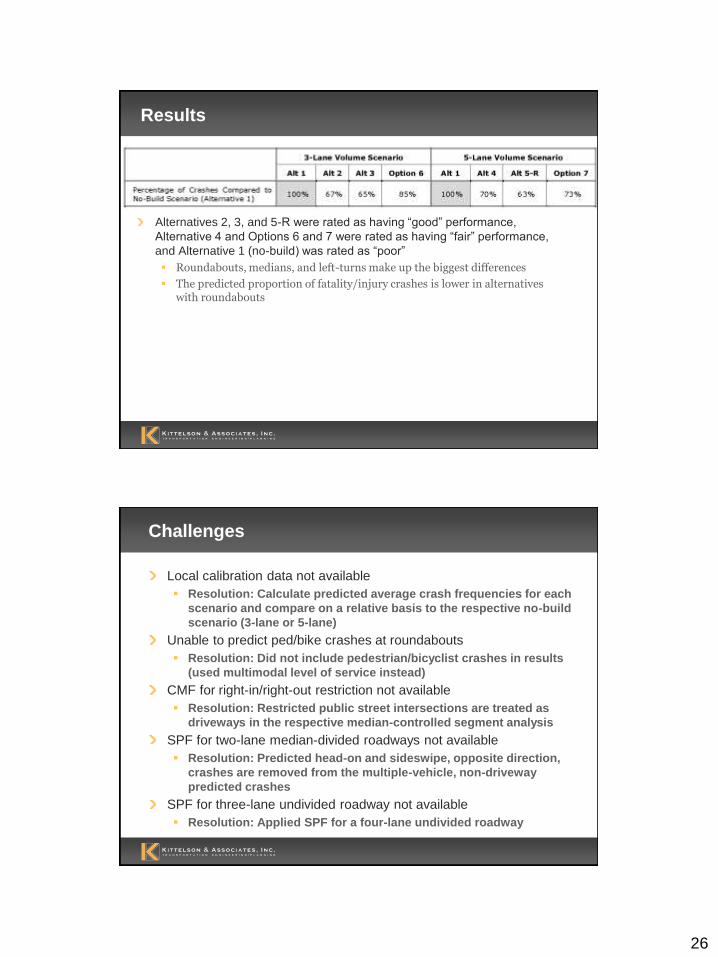
Results
Alternatives 2, 3, and 5-R were rated as having “good” performance,
Alternative 4 and Options 6 and 7 were rated as having “fair” performance,
and Alternative 1 (no-build) was rated as “poor”
Roundabouts, medians, and left-turns make up the biggest differences
The predicted proportion of fatality/injury crashes is lower in alternatives with roundabouts
Challenges
Local calibration data not available
Resolution: Calculate predicted average crash frequencies for each
scenario and compare on a relative basis to the respective no-build
scenario (3-lane or 5-lane)
Unable to predict ped/bike crashes at roundabouts
Resolution: Did not include pedestrian/bicyclist crashes in results
(used multimodal level of service instead)
CMF for right-in/right-out restriction not available
Resolution: Restricted public street intersections are treated as
driveways in the respective median-controlled segment analysis
SPF for two-lane median-divided roadways not available
Resolution: Predicted head-on and sideswipe, opposite direction,
crashes are removed from the multiple-vehicle, non-driveway
predicted crashes
SPF for three-lane undivided roadway not available
Resolution: Applied SPF for a four-lane undivided roadway
27
Russell Street Conclusions
HSM analysis was effective for evaluating the relative impacts of
different design features
Using relative results made it difficult to compare between 3-lane
and 5-lane volume scenarios
Results did not surprise engineers, but helped communicate points
to elected officials and citizens
CALIBRATION
28
Calibrating SPFs
HSM SPFs should be calibrated to local conditions
Apply locally developed factor to account for conditions not
explicitly captured in SPF models
Calibration methodology provided in Appendix to Part C
30-50 similar sites
100 or more crashes/year for all sites
By facility: ratio of observed to HSM prediction for
calibration sites
If no calibration factor, can do relative analysis
Calibration of HSM Crash Prediction Models
Uncalibrated models can be used for relative comparison of safety to “no build”
Performance Measure No Build
Concept #1
Concept #2
Concept #3
Injury/Fatal Crashes - +10% -20% -8%
PDO Crashes - +12% -16% -4%
Change in Total Crashes - +11.5% -17.4% -5.2%
29
Calibration of HSM Crash Prediction Models
Calibration allows for prediction of number of crashes per year
Performance Measure No Build
Concept #1
Concept #2
Concept #3
Number of Injury/Fatal Crashes
3 1.5 2.2 2.0
Number of PDO Crashes 12 6.0 9.9 6.9
Total Number of Crashes
15 7.5 12.1 8.9
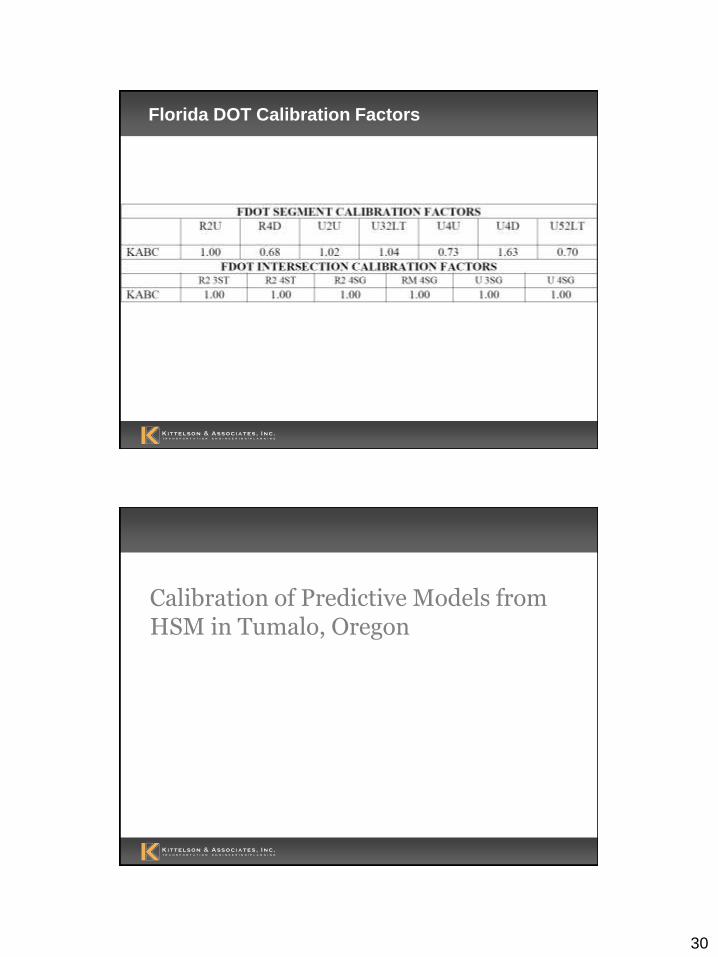
Oregon DOT Calibration Factors
30
Florida DOT Calibration Factors
Calibration of Predictive Models from HSM in Tumalo, Oregon
31
Project Background and
Purpose
Project Purpose:
Evaluate design alternatives on
US 20
Quantify safety in decision making
process
Project Considerations
Apply predictive method
Apply calibrated SPF
Calibration Procedure
1. Select Calibration Sites
2. Summarize Observed Crashes
3. Calculate Uncalibrated Predicted Crashes
4. Calculate Ratio of Observed to Predicted Crashes
32
Calibration Procedure
Calculate Uncalibrated Predicted Crashes
Calculate Ratio of Observed to Predicted Crashes
Select Calibration Sites
Summarize Observed Crashes
Calibration Procedure
Calculate Uncalibrated Predicted Crashes
Calculate Ratio of Observed to Predicted Crashes
Select Calibration Sites
Summarize Observed Crashes
33
Calibration Procedure
Calculate Uncalibrated Predicted Crashes
Calculate Ratio of Observed to Predicted Crashes
Select Calibration Sites
Summarize Observed Crashes
Segment ID Fatal & Injury
Property Damage
Only
Total Crashes
S1-2 0.2 0.8 1.0
S1-3 0.2 0.2 0.4
S1-4 0.2 0.4 0.6
S2-3 0.6 0.4 1.0
S4-1 0.2 1.2 1.4
Number of crashes per year over study period (5
years of data)
Calibration Procedure
Calculate Uncalibrated Predicted Crashes
Calculate Ratio of Observed to Predicted Crashes
Select Calibration Sites
Summarize Observed Crashes
Segment ID Fatal & Injury
Property Damage
Only
Total Crashes
S1-1 0.2 0.4 0.7
S1-2 0.4 0.9 1.3
S1-3 0.3 0.7 1.1
S1-4 0.5 1.0 1.4
S2-3 0.5 1.1 1.7
S4-1 0.7 1.4 2.1
𝑁𝑠𝑝𝑓 = 𝐴𝐴𝐷𝑇 × 𝐿 × 10−6 × 𝑒−0.312
Ni = NSPF *(CMF1 *CMF2)
34
Calibration Procedure
Calculate Uncalibrated Predicted Crashes
Calculate Ratio of Observed to Predicted Crashes
Select Calibration Sites
Summarize Observed Crashes
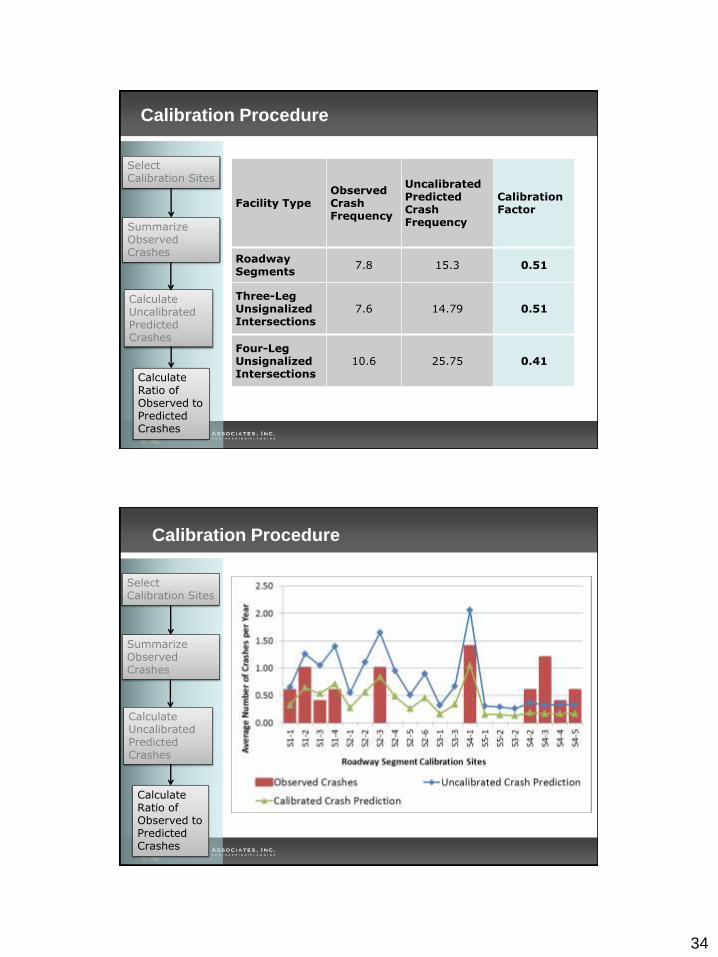
Facility Type Observed Crash Frequency
Uncalibrated Predicted Crash Frequency
Calibration Factor
Roadway Segments
7.8 15.3 0.51
Three-Leg Unsignalized Intersections
7.6 14.79 0.51
Four-Leg Unsignalized Intersections
10.6 25.75 0.41
Calibration Procedure
Calculate Uncalibrated Predicted Crashes
Calculate Ratio of Observed to Predicted Crashes
Select Calibration Sites
Summarize Observed Crashes
35
APPLICATION IN ALASKA
Corridor Studies/Intersection Design Applications
Provide engineers and designers with quantitative safety
performance to evaluate alternatives
Increase the reliability of safety assessments
Offer capability to evaluate new or substantially modified facilities
Supply input for benefit/cost
Better inform decision makers and the public of the impacts of
design decisions
36
Example: Integration into ADOT&PF HSIP
Existing HSIP Process
1. Critical crash rate + severity screening
2. Identify treatments, apply CRFs to existing crash frequency
3. Benefit/Cost ranking
4. Project Evaluation
Possible Modified HSIP Process
1. Alternate Screening Method (RTM)
2. Calibrated SPFs + CMFs to predict future crash frequency
3. Benefit/Cost ranking
4. Project Evaluation
Summary
The HSM helps the safety practice evolve from reactive to predictive
The HSM allows for quantitative evaluation of safety impacts
The HSM allows a quantitative comparison of design, operations, and management alternatives
The profession now has the ability to begin to more fully integrate operations and safety into the design decision process