Munich Personal RePEc Archive Evaluating Economic Warfare: Lessons from Efforts to Suppress the Afghan Opium Trade Clemens, Jeffrey University of California at San Diego, National Bureau of Economic Research January 2013 Online at https://mpra.ub.uni-muenchen.de/57890/ MPRA Paper No. 57890, posted 14 Aug 2014 11:58 UTC
Transcript
Munich Personal RePEc Archive
Evaluating Economic Warfare: Lessons
from Efforts to Suppress the Afghan
Opium Trade
Clemens, Jeffrey
University of California at San Diego, National Bureau of Economic
Research
January 2013
Online at https://mpra.ub.uni-muenchen.de/57890/
MPRA Paper No. 57890, posted 14 Aug 2014 11:58 UTC
Evaluating Economic Warfare:
Lessons from Efforts to Suppress the Afghan Opium Trade
Jeffrey Clemens∗
January 28, 2013
Abstract
In the mid-2000s, U.S. anti-opium policy intensified with a goal of reducing the resourcesavailable to Afghan insurgents. To achieve this objective, I show that opium suppressionefforts must accurately distinguish between insurgent and non-insurgent suppliers. Therequired level of accuracy will be particularly high if demand for opium is inelasticand if the insurgents’ initial market share is large. Empirically, I show that demandfor Afghan opium is relatively inelastic, that the market share of Taliban-heavy areas islarge, and that enforcement has primarily impacted non-Taliban territory. Consequently,anti-opium efforts have significantly increased the drug-trade resources flowing to theTaliban.
∗Clemens: University of California at San Diego, Jeffrey Clemens, Economics Department, 9500 GilmanDrive #0508, La Jolla, CA 92093-0508, USA. Telephone: 1-509-570-2690. E-mail: [email protected] thank John Shoven, Greg Rosston, Gopi Shah Goda, and the rest of the SIEPR team for their feedbackduring working-group meetings. I thank Emily Tian for assistance in assembling data on Afghan poppycultivation and opium prices, Justin Levitt for assistance in producing this paper’s maps, Melissa Dell, JeffFriedman, David Mansfield, Jeff Miron, Nirupama Rao, Juan Carlos Suarez Serrato, and Stan Veuger forcomments, and Eli Berman and and Erin Troland for help in obtaining and working with Afghan conflictdata. I also thank Martin Feldstein for his mentorship during both undergraduate and graduate studyand for sparking my interest in the economics of national security.
1
Clemens Evaluating Economic Warfare
In times of conflict, an adversary’s resources are a source of potential harm. Many
geopolitical tactics are thus quite explicitly economic, as they seek either to deter an
adversary’s worst intentions or reduce their capacity to inflict damage (Richardson, 1960;
Tullock, 1974). Relevant policies include trade-limiting sanctions (Galtung, 1967; Pape,
1997) and direct attacks on an adversary’s military infrastructure or personnel.1 This
paper explores a third example, namely efforts to undermine an adversary’s source of
income. I focus on U.S. efforts to reduce the resources of Taliban-loyal insurgents by
suppressing the Afghan opium trade.
When they controlled Afghanistan’s central government, the Taliban levied a 10 per-
cent, in-kind tax on opium production in addition to an Islamic tithe known as zakat
(Blanchard, 2009). More recent linkages between the Taliban and drug-trade resources
are less fully understood. In areas the Taliban effectively controls, they are believed to
make similarly structured, though less generous, in-kind collections (Mansfield, 2012).2
Such links between opium income and Taliban resources, coupled with concerns about
a Narcotics-Insecurity Cycle, motivates the view that the United States should suppress
the Afghan opium trade (Blanchard, 2009). Caution is warranted, however, as work by
Miron (1999, 2001), Miron and Zwiebel (1995), and Dell (2011) shows that such efforts
may increase violence involving industry participants.3
This paper’s first section derives a condition under which anti-opium policies would
achieve the objective of reducing Taliban resources. Anti-opium policies seek to suppress
1Also relevant, in particular in counter-insurgency contexts, are efforts to win hearts and mindsthrough the provision of public goods and stable economic conditions (Berman, Shapiro and Felter, 2011;Berman et al., 2011).
2Through detailed survey work in central Hilmand province, Mansfield (2012) recently documentsdirect Taliban collections on the order of 2 percent. Village mullahs typically collect an ushr on the orderof 5 to 10 percent. Mansfield writes that “It is currently unknown whether village mullahs make paymentsto those in the Taliban or to government officials.”
3The Narcotics-Insecurity Cycle can be described as the view that the narcotics trade per se createsinsecurity that, in turn, hinders the success of an anti-narcotics effort. The research just cited questionsthis view by emphasizing the extent to which insecurity results directly from counter narcotics efforts.
2
Clemens Evaluating Economic Warfare
Taliban income by discouraging poppy cultivation and interdicting narcotics.4 As such
policies move forward, however, they shift the market up its demand curve and thus
increase the value of remaining opiates. I show that the net effect on Taliban resources
depends crucially on three factors. These factors are the extent to which enforcement
distinguishes between insurgent and non-insurgent suppliers, the price-responsiveness
of demand, and insurgents’ initial market shares.
Section 2 empirically assesses the determinants of anti-opium policy’s capacity to
reduce Taliban resources.5 After receiving little attention during the war’s early years,
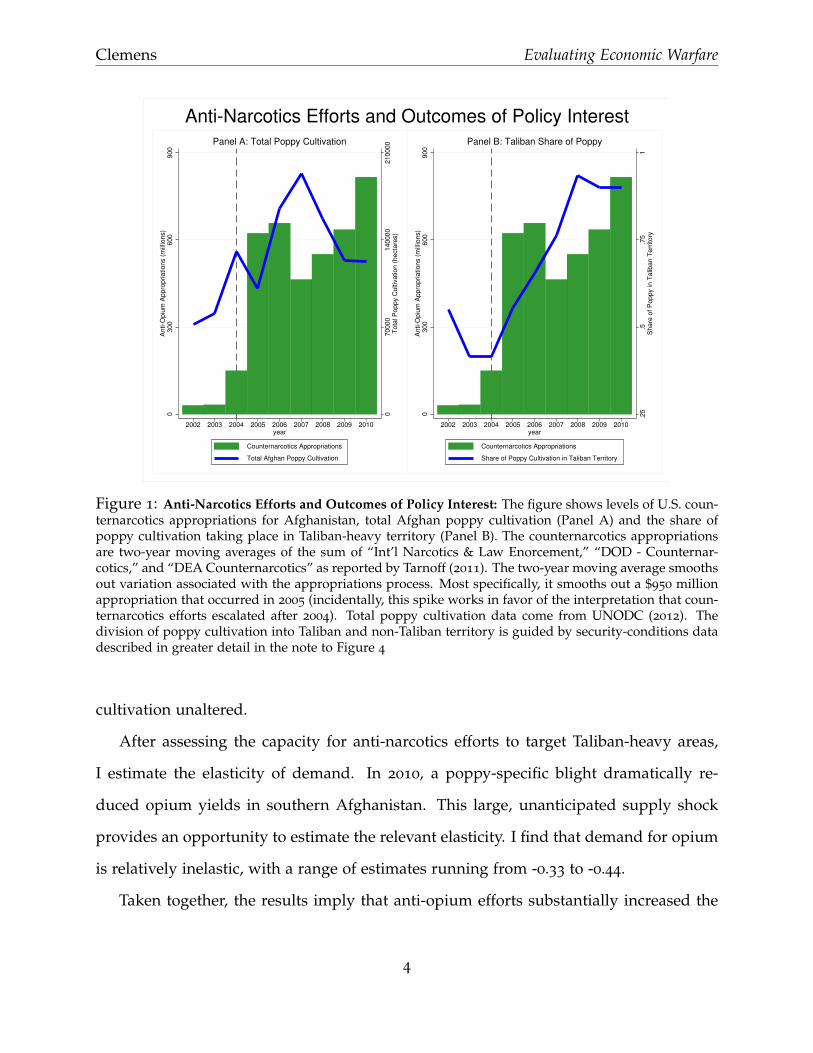
funding for anti-opium efforts escalated substantially.6 As shown in Figure 1’s Panel A,
heightened enforcement did not reduce total poppy cultivation. Furthermore, reductions
occurred in government-controlled districts while increases occurred in Taliban-heavy
territory (see Figure 1’s Panel B).7 To rule out the view that this correlation reflects an
influence of poppy cultivation on Taliban control, I instrument for Taliban influence with
pre-enforcement data on districts’ ethnic composition. This instrumental variables strat-
egy leaves the estimated relationship between Taliban influence and changes in poppy
4Clemens (2008) analyzes policies directed at Afghan farmers (e.g., crop eradication and efforts todevelop alternative livelihoods) in detail, showing that they are unlikely to achieve much success at re-ducing flows of opiates. Such policies are encumbered by their limited capacity to shift the supply curveand by relatively inelastic demand for opium within Afghanistan. Additional work, including papersby Caulkins and Reuter (2006), Kennedy, Reuter and Riley (1993), Reyes (2010), and Andersson (2010),highlight additional complications associated with drug control policies targeted at farmers in drug-cropsource countries. For recent advocacy of interdiction policies, see recommendations by Peters (2009, p.34),who suggests “establishing checkpoints manned by NATO troops and counternarcotics police to seizedrug shipments on highways” and “destroying drug labs and targeting opium convoys.”
5The link between this paper’s theory and empirics is very much in the spirit of Chetty (2009). In animportant sense, the current paper also owes much to Becker (1968).
6Appropriations data reported by Tarnoff (2011) show a spike in counternarcotics funding from near0 in 2003 to $300 million in 2004 and to $950 million in 2005. Appropriations subsequently stabilized ataround $600 million per year. Figure 1 shows two-year moving averages of these appropriations. In analternative accounting, Blanchard (2009) reports that the United States appropriated a total of $2.9 billiontowards counter narcotics efforts in Afghanistan from 2001 through 2009, of which $2.23 billion wereappropriated from 2007 through 2009.
7Among districts that eliminated poppy cultivation, for example, only one-sixth were in Taliban-controlled areas.
3
Clemens Evaluating Economic Warfare
070000
140000
210000
Tota
l P
oppy C
ultiv
ation (
hecta
res)
0300
600
900
Anti-O
piu
m A
ppro
priations (
mill
ions)
2002 2003 2004 2005 2006 2007 2008 2009 2010year
Counternarcotics Appropriations
Total Afghan Poppy Cultivation
Panel A: Total Poppy Cultivation
.25
.5.7
51
Share
of P
oppy in T
alib
an T
err
itory
0300
600
900
Anti-O
piu
m A
ppro
priations (
mill
ions)
2002 2003 2004 2005 2006 2007 2008 2009 2010year
Counternarcotics Appropriations
Share of Poppy Cultivation in Taliban Territory
Panel B: Taliban Share of Poppy
Anti-Narcotics Efforts and Outcomes of Policy Interest
Figure 1: Anti-Narcotics Efforts and Outcomes of Policy Interest: The figure shows levels of U.S. coun-ternarcotics appropriations for Afghanistan, total Afghan poppy cultivation (Panel A) and the share ofpoppy cultivation taking place in Taliban-heavy territory (Panel B). The counternarcotics appropriationsare two-year moving averages of the sum of “Int’l Narcotics & Law Enorcement,” “DOD - Counternar-cotics,” and “DEA Counternarcotics” as reported by Tarnoff (2011). The two-year moving average smoothsout variation associated with the appropriations process. Most specifically, it smooths out a $950 millionappropriation that occurred in 2005 (incidentally, this spike works in favor of the interpretation that coun-ternarcotics efforts escalated after 2004). Total poppy cultivation data come from UNODC (2012). Thedivision of poppy cultivation into Taliban and non-Taliban territory is guided by security-conditions datadescribed in greater detail in the note to Figure 4
cultivation unaltered.
After assessing the capacity for anti-narcotics efforts to target Taliban-heavy areas,
I estimate the elasticity of demand. In 2010, a poppy-specific blight dramatically re-
duced opium yields in southern Afghanistan. This large, unanticipated supply shock
provides an opportunity to estimate the relevant elasticity. I find that demand for opium
is relatively inelastic, with a range of estimates running from -0.33 to -0.44.
Taken together, the results imply that anti-opium efforts substantially increased the
4
Clemens Evaluating Economic Warfare
opiate-industry resources flowing to the Taliban. For each kilogram of opium removed
from the market, the estimates imply that only one-sixth of a kilogram would have come
from Taliban-heavy areas. Demand is sufficiently inelastic that, absent supply responses,
the value of remaining opium would rise substantially, increasing the net income of
farmers in Taliban-heavy areas by around $120. Supply responded quickly, and did so
largely in Taliban-heavy districts. All told, the opium-source income of farmers in these
districts rose from $240 million in 2004 to $580 million in 2010.
In section 3 I extend the application of section 1’s framework to hypothetical scenar-
ios involving oil-producing nations. A crucial feature of these settings is that an adver-
sary’s oil infrastructure should be readily distinguishable from allies’ oil infrastructure,
enabling relatively flawless targeting. Economic warfare is more likely to achieve its
objectives in such scenarios than in the case of Afghan opiates. Nonetheless, the scenar-
ios illustrate that even with perfect targeting it is possible for demand to be sufficiently
inelastic, and adversaries’ market shares sufficiently large, that economic warfare per-
versely increases their available resources. Viewing the oil market through the lens of
economic warfare readily yields a broader set of geopolitical predictions. A nation’s own
position in the oil market is an important determinant of the costs and benefits it will
realize from attempting economic warfare. Oil exporters, for example, may have strong
interests in one another’s instability.
I conclude with a discussion of how general the Afghanistan-specific impediments to
economic warfare might be. Targeting is likely to pose significant difficulty across a wide
range of prohibition-related settings. The Afghan context highlights a central problem of
territorial control; it is difficult if not impossible for a government to enforce prohibitions
in areas where it lacks dominion. More generally, to the extent that a government’s
primary adversaries are among those most capable of generating violence, they will
naturally tend to pose the hardest targets.
5
Clemens Evaluating Economic Warfare
1 A Model of Economic Warfare
The following model contains a simple but informative framework for assessing the
potential effectiveness of economic warfare. The policies under consideration involve
the reduction of output in an industry in which at least one market participant is an
adversary. Afghanistan’s opiate industry is this paper’s primary application.
I characterize the industry as involving the output of a fixed number, N, of actors
or regions (think, e.g., drug cartels or Afghanistan’s administrative provinces).8 Due to
alliances and adversarial relationships, U.S. welfare, W, depends on the incomes, Ii, of
each of these N actors. For simplicity, I assume that W = ∑Ni=1 λi Ii, with the λi being
positive for allies and negative for adversaries.9
I characterize the incomes of industry participants as follows. Potential gross industry-
wide output is Qgross = ∑Ni=1 qi. The policy of interest is an “enforcement” level, E. E
is the total amount of opium eliminated from the market, either through interdiction,
eradication, or by deterring farmers from cultivating poppy, with Ei eliminated from
producer i. This leaves net output of Qnet = Qgross − E. Demand determines the market-
clearing price, with P = p(Qnet). Producer i’s income is thus Ii = [qi − Ei]× p(Qnet).
The extent to which enforcement falls upon producer or region i depends on a target-
ing parameter, ρi, with Ei = ρiE. The ability to target enforcement at producers with low
λi is clearly crucial for the success of economic warfare. I treat the ρi as reflecting fixed
limitations on the U.S.’s ability to target.10 Given these ρi, the expression for welfare can
be written as:
8This should not be interpreted as applying at the level of, for example, individual Afghan farmers,who might be assumed to freely enter and exit into the production of opium. The relevant unit is someequivalent of a state actor (e.g., a country or a provincial warlord possessing the taxing authority relevantin the Afghan context).
9Of course this function need not be linear in the producer incomes.
10A natural extension would involving allowing these targeting weights to be improved at some cost.
6
Clemens Evaluating Economic Warfare
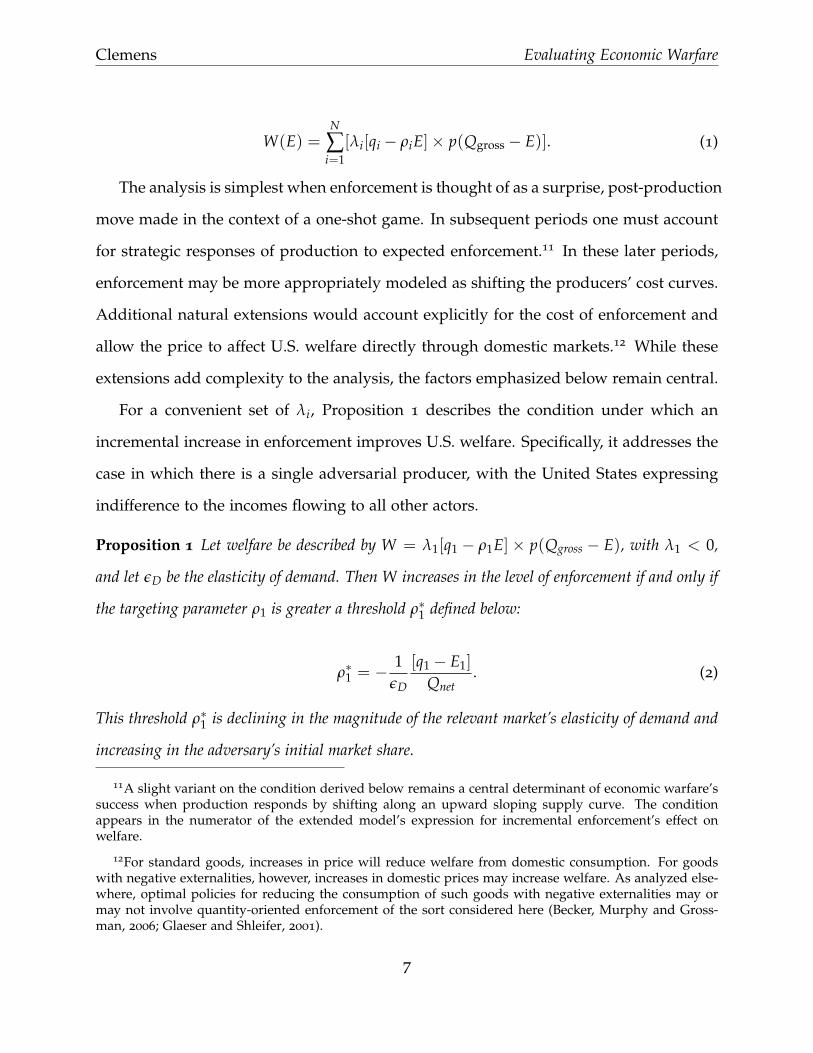
W(E) =N
∑i=1
[λi[qi − ρiE]× p(Qgross − E)]. (1)
The analysis is simplest when enforcement is thought of as a surprise, post-production
move made in the context of a one-shot game. In subsequent periods one must account
for strategic responses of production to expected enforcement.11 In these later periods,
enforcement may be more appropriately modeled as shifting the producers’ cost curves.
Additional natural extensions would account explicitly for the cost of enforcement and
allow the price to affect U.S. welfare directly through domestic markets.12 While these
extensions add complexity to the analysis, the factors emphasized below remain central.
For a convenient set of λi, Proposition 1 describes the condition under which an
incremental increase in enforcement improves U.S. welfare. Specifically, it addresses the
case in which there is a single adversarial producer, with the United States expressing
indifference to the incomes flowing to all other actors.
Proposition 1 Let welfare be described by W = λ1[q1 − ρ1E]× p(Qgross − E), with λ1 < 0,
and let ǫD be the elasticity of demand. Then W increases in the level of enforcement if and only if
the targeting parameter ρ1 is greater a threshold ρ∗1 defined below:
ρ∗1 = −1
ǫD
[q1 − E1]
Qnet. (2)
This threshold ρ∗1 is declining in the magnitude of the relevant market’s elasticity of demand and
increasing in the adversary’s initial market share.
11A slight variant on the condition derived below remains a central determinant of economic warfare’ssuccess when production responds by shifting along an upward sloping supply curve. The conditionappears in the numerator of the extended model’s expression for incremental enforcement’s effect onwelfare.
12For standard goods, increases in price will reduce welfare from domestic consumption. For goodswith negative externalities, however, increases in domestic prices may increase welfare. As analyzed else-where, optimal policies for reducing the consumption of such goods with negative externalities may ormay not involve quantity-oriented enforcement of the sort considered here (Becker, Murphy and Gross-man, 2006; Glaeser and Shleifer, 2001).
7
Clemens Evaluating Economic Warfare
The proposition’s economic content can initially be illustrated by considering its im-
plications for several cases:
1. Incremental enforcement necessarily reduces welfare when demand is sufficiently
inelastic that − 1ǫD
[q1−E1]Qnet
> 1.
2. To improve welfare, enforcement must be better-than-random (i.e., ρ1 >[q1−E1]
Qnet)
when demand is inelastic, and increasingly so as demand becomes increasingly in-
elastic. Similarly, enforcement may be worse-than-random when demand is elastic,
and may be increasingly so as demand becomes increasingly elastic.
3. When adversaries account for the entire market, either as a monopoly or as a
cartel, and when disutility from their resources uniformly equals λ1, enforcement
improves (worsens) welfare if demand is elastic (inelastic).
4. Even when demand is elastic and adversaries account for the entire market, suffi-
ciently poor targeting can reduce welfare when λi varies across adversaries.
2 The Case of Afghan Opiates
In this section I empirically assess the key determinants of economic warfare’s im-
pact in the context the Afghan opiate industry. With the export value of opiates regularly
amounting to one sixth to one third of Afghanistan’s GDP (UNODC, 2010, 2012), the po-
tential for opium-source income to fuel the insurgency is a salient concern. Furthermore,
historical concentrations of poppy cultivation in Taliban-oriented areas raise the possi-
bility of a well-targeted anti-opium campaign. As shown below, recent experience has
belied such optimism.
For simplicity, Afghanistan and its opiate industry can be divided into two pro-
ducing regions: those influenced by the Taliban and those controlled by the national
8
Clemens Evaluating Economic Warfare
government. Flows of income from the opiate industry to Taliban-heavy territory have
an unambiguously negative effect on U.S. welfare; this income undermines U.S. secu-
rity interests as well as its concerns associated with the war on drugs. U.S. sentiment
towards flows of opiate income to government-controlled territories is less clear. On the
one hand, it is associated with the narcotics industry, with its implications for global
public health and corruption within Afghanistan. On the other hand, it contributes to
our ally’s resource base and improves the livelihoods of low-income families on whose
loyalty our ally’s government relies. As a first approximation I consider the simplest
case, namely the case in which the United States is, on net, indifferent to opiate-industry
income outside of Taliban-heavy areas.
2.1 Data Describing Afghan Poppy Cultivation and Taliban Influence
A retrospective analysis of anti-opium policy in Afghanistan looks bleak for reasons
related to each of the key parameters from equation (2). I begin with an assessment
of the targeting parameter. The analysis focuses on poppy cultivation rather than post-
production interdiction for two reasons. First, dissuasion of poppy cultivation, both
through the threat of crop eradication and due to farmer respect for either secular or
Islamic law, plays a central role in driving the distribution of opiate-industry income
across the country (UNODC, 2012).13 In contrast, post-production interdiction typically
accounts for less than 5 percent of total opium output, and is in some years closer to
1 percent (UNODC, 2010, 2011, 2012). Second, data on the cross-district distribution of
13Among farmers who had previously cultivated poppy but ceased doing so in 2011, 23 percent re-ported doing so due to the existence of the government ban, 11 percent because poppy cultivation is (onlyrecently, apparently) “against Islam,” and an additional 5 percent due to a decision of local elders; 15
percent reported fear of the government and an additional 5 percent fear, specifically, of eradication; theremainder cited traditional production-related factors including input costs, yields, and market prices.Suggestively, the U.N.’s 2009 report (UNODC, 2010) provides a separate tabulation of responses by farm-ers in the South and West, which are under relatively heavy Taliban influence. These farmers were farless likely to cite reasons related to government or Islamic prohibitions and far more likely to cite reasonsrelated to the profitability of production.
9
Clemens Evaluating Economic Warfare
poppy cultivation are readily available while such data on interdiction are not.
Table 1 reports summary statistics describing poppy cultivation in 2004 and 2009, two
district-level measures of security conditions, and a characterization of each district by its
dominant ethnic group. The sample is restricted to the 233 of Afghanistan’s 409 districts
in which poppy was cultivated in 2004 and in which the measure of security conditions
was available.14 From 2004 to 2009, poppy cultivation was eliminated from some 153
of these districts while originating in 26 that are outside of the sample. The measure
of the security threat is a categorical variable running from 1 to 4, with 4 indicating
that a district was essentially controlled by the Taliban. The variable “High Security
Threat” is simply an indicator equal to 1 for districts with security threats coded as 3
or 4. 44 percent of the districts described in Table 1 were dominated by the Pashtun
ethnicity, which is prominent in Afghanistan’s southern provinces and is predictive of
relatively strong Taliban influence. 37 percent were Tajik dominated and 9 percent Uzbek
dominated. In contrast with the Pashtun ethnicity, Tajiks and Uzbeks were the principal
players in the Northern Alliance that worked with U.S. forces towards the Taliban’s
ouster in 2001.
2.2 Analysis of Targeting in the Context of Afghan Opium Poppy
2004 marked a high point for dispersion of poppy cultivation across Afghanistan.
Anti-opium efforts were minimal during that and previous years, as stated policy ob-
jectives involved limited emphasis on the drug trade. In that year, the UNODC docu-
mented a then-record 131,000 hectares of land under opium poppy cultivation. This in-
cluded 45,000 hectares in three Taliban-heavy provinces that have long poppy-cultivating
14I choose 2004 as the base year because it described the maximum extent of poppy cultivation acrossAfghanistan; the 233 poppy-cultivating districts encompassed 32 of Afghanistan’s 34 provinces, as illus-trated in Figure 2. It is also one of the final years preceding the U.S.’s increased emphasis on anti-opiumenforcement (Blanchard, 2009).
10
Clemens Evaluating Economic Warfare
Table 1: Summary Statistics Describing Afghan Poppy Cultivation and Security
mean sd min maxOpium Hectares (2004) 530.67 914.15 2 6486
Opium Hectares (2009) 466.09 1697.36 0 17063
Opium Poppy Eliminated 0.66 0.48 0 1
Opium Poppy Reduced 0.84 0.37 0 1
Pct Change in Opium Poppy -1.45 1.08 -2 2
High Security Threat 0.35 0.48 0 1
Categorical Security Threat 1.87 0.97 1 4
Pashtun District 0.44 0.50 0 1
Tajik District 0.27 0.44 0 1
Uzbek District 0.09 0.29 0 1
Observations 233
Note: The data describe the poppy cultivation, security, and dominant ethnic group associated with the
233 Afghan districts documented to have area under opium poppy cultivation in 2004. Poppy cultivation
levels (and additional related variables generated by the author) come from the United Nations Office on
Drugs and Crime (UNODC, 2010). The percent change in poppy cultivation from 2004 to 2009 was cal-
culated using the mid-point formula (hence the minimum and maximum of -2 and 2, respectively). Data
on the level of security and Taliban influence was obtained from a threat assessment map produced by
the Afghan National Security Forces and obtained through a website associated with Radio Netherlands
November 4, 2012). Data on the dominant ethnic group in each district was obtained from a map avail-
able on the website of the Masawat Development Fund: http://masawatdevelopmentfund.org.au/wp-
content/uploads/2011/11/ethnicgroupsmap.gif (last accessed November 4, 2012).
11
Clemens Evaluating Economic Warfare
Figure 2: Opium Poppy Cultivation across Afghanistan (2004): The map shows levels of poppy culti-vation (in hectares) across Afghanistan’s districts in 2004. Source: UNODC (2012).
traditions (29,000 hectares in Hilmand, 11,000 in Uruzgan, and 5,000 in Kandahar). Nan-
garhar, a traditional poppy-cultivating province in the East, accounted for an additional
28,000 hectares while Badakshan, a traditional poppy-cultivating province in the North,
accounted for 16,000. The remaining 42,000 hectares were scattered across a record 27 of
Afghanistan’s 29 remaining provinces.15
Anti-opium enforcement escalated substantially in 2005 and subsequent years, as il-
lustrated previously in Figure 1. By 2009, the distribution of poppy cultivation had
changed dramatically. Nearly half of Afghanistan’s provinces (16) were documented to
be poppy free. However, neither the elimination nor significant reduction of poppy culti-
15A 2004 realignment of Afghanistan’s districts into provinces, increasing the total number of provincesfrom 32 to 34, creates some ambiguity on this point. The UNODC’s Illicit Crop Monitoring Report fromthat year (UNODC, 2004) shows poppy cultivation in all 32 of the 32 administrative provinces in place atthe beginning of the year. Subsequent reports, using the current division of districts into provinces (thedivision utilized in this paper’s empirical analysis) show poppy cultivation as having occurred in 32 ofthe 34 current provinces (UNODC, 2012).
12
Clemens Evaluating Economic Warfare
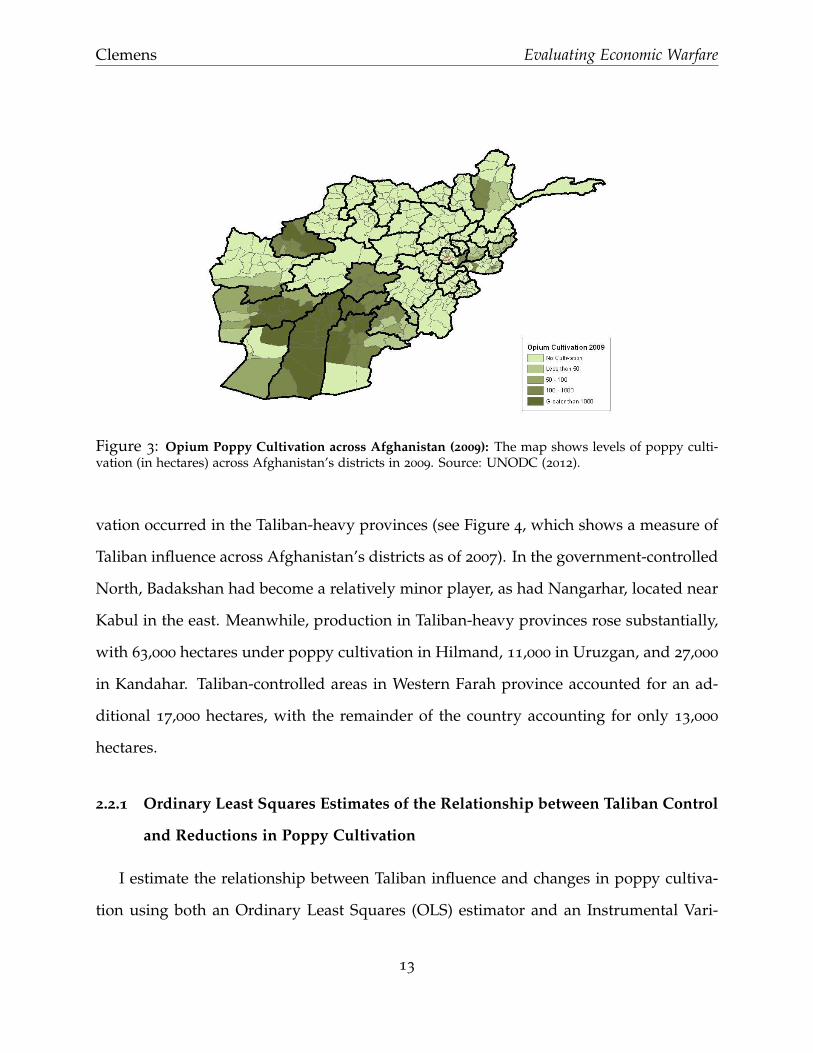
Figure 3: Opium Poppy Cultivation across Afghanistan (2009): The map shows levels of poppy culti-vation (in hectares) across Afghanistan’s districts in 2009. Source: UNODC (2012).
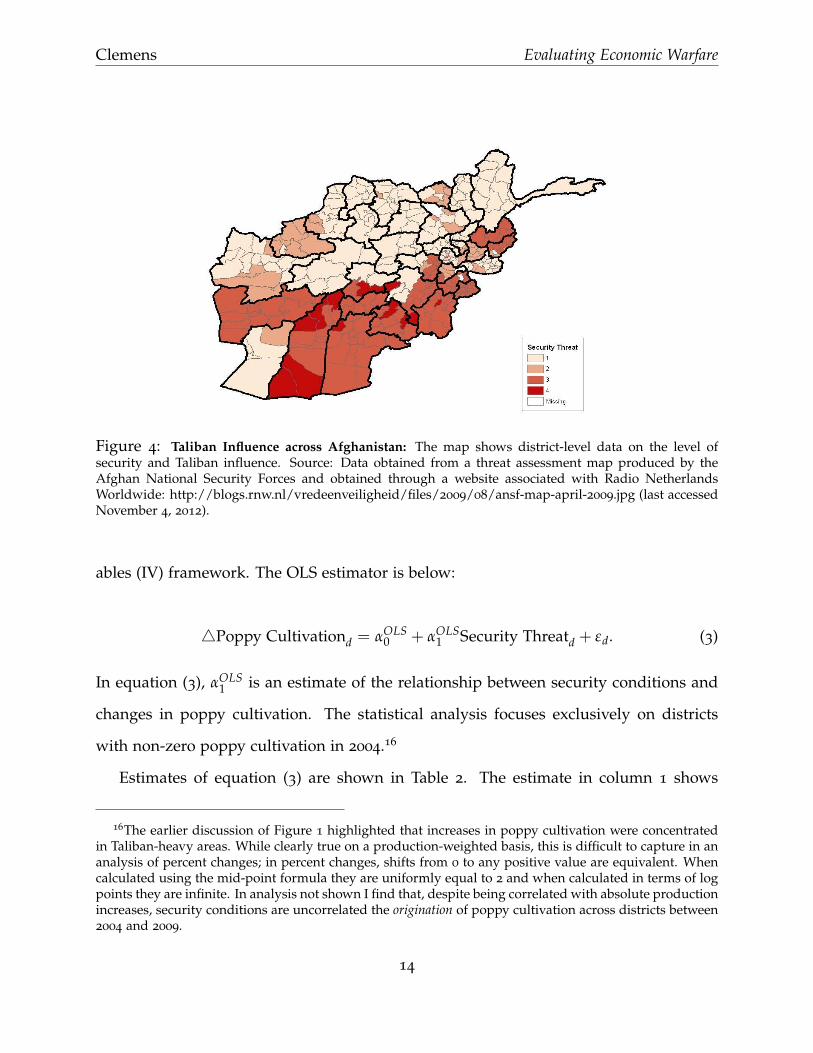
vation occurred in the Taliban-heavy provinces (see Figure 4, which shows a measure of
Taliban influence across Afghanistan’s districts as of 2007). In the government-controlled
North, Badakshan had become a relatively minor player, as had Nangarhar, located near
Kabul in the east. Meanwhile, production in Taliban-heavy provinces rose substantially,
with 63,000 hectares under poppy cultivation in Hilmand, 11,000 in Uruzgan, and 27,000
in Kandahar. Taliban-controlled areas in Western Farah province accounted for an ad-
ditional 17,000 hectares, with the remainder of the country accounting for only 13,000
hectares.
2.2.1 Ordinary Least Squares Estimates of the Relationship between Taliban Control
and Reductions in Poppy Cultivation
I estimate the relationship between Taliban influence and changes in poppy cultiva-
tion using both an Ordinary Least Squares (OLS) estimator and an Instrumental Vari-
13
Clemens Evaluating Economic Warfare
Figure 4: Taliban Influence across Afghanistan: The map shows district-level data on the level ofsecurity and Taliban influence. Source: Data obtained from a threat assessment map produced by theAfghan National Security Forces and obtained through a website associated with Radio NetherlandsWorldwide: http://blogs.rnw.nl/vredeenveiligheid/files/2009/08/ansf-map-april-2009.jpg (last accessedNovember 4, 2012).
ables (IV) framework. The OLS estimator is below:
△Poppy Cultivationd = αOLS0 + αOLS
1 Security Threatd + εd. (3)
In equation (3), αOLS1 is an estimate of the relationship between security conditions and
changes in poppy cultivation. The statistical analysis focuses exclusively on districts
with non-zero poppy cultivation in 2004.16
Estimates of equation (3) are shown in Table 2. The estimate in column 1 shows
16The earlier discussion of Figure 1 highlighted that increases in poppy cultivation were concentratedin Taliban-heavy areas. While clearly true on a production-weighted basis, this is difficult to capture in ananalysis of percent changes; in percent changes, shifts from 0 to any positive value are equivalent. Whencalculated using the mid-point formula they are uniformly equal to 2 and when calculated in terms of logpoints they are infinite. In analysis not shown I find that, despite being correlated with absolute productionincreases, security conditions are uncorrelated the origination of poppy cultivation across districts between2004 and 2009.
14
Clemens Evaluating Economic Warfare
that the binary indicator for a high level of Taliban threat predicts a 50 percentage point
lower likelihood that poppy cultivation was eliminated from a district. This same vari-
able predicts a 34 percentage point lower likelihood that a district’s poppy cultivation
was reduced (column 3), and predicts relative poppy cultivation increases on the order
of 120 percent (column 5). Columns 2, 4, and 6 report a similar set of results where
the independent variable is the 4-category indicator of the severity of the Taliban threat.
The results are quite similar, suggesting that a 2-category movement up the scale pre-
dicts poppy-cultivation changes similar to those associated with the binary threat-level
indicator.
In specifications 1, 3, and 5, where the measure of Taliban control is binary, it is
straightforward to convert the results into estimates of the targeting parameter ρ1 from
the model in section 1. In specification 1, for example, αOLS0 is the probability of poppy
elimination in non-Taliban territory, while αOLS0 + αOLS
1 is the probability of poppy elimi-
nation in Taliban territory. Weighting these probabilities by the fraction of districts falling
into each category yields an estimate of the fraction of affected districts that were under
Taliban control. The resulting estimates, reported immediately beneath the estimates of
αOLS0 (the Intercept term in the table) range from 0.15 to 0.25. The relevant measures of
the Taliban’s initial market share exceed 30 percent when measured as a fraction of dis-
tricts and 40 percent when measured as a fraction of all land under poppy cultivation;
the results thus imply worse-than-random targeting.
It is important to keep in mind that the parameter of interest is not a causal estimate
of the effect of Taliban control on the ease of targeting particular areas. The parameter of
interest could be better described as an all-inclusive technological constraint on targeting.
Suppose, for example, that anti-opium enforcement is difficult in mountainous regions
and that mountainous regions are also controlled by the Taliban. In this hypothetical,
Taliban control per se would not be a cause of difficulty in targeting enforcement at these
15
Clem
ens
Evalu
ating
Econ
omic
Warfare
Table 2: Taliban Influence and Changes in Poppy Cultivation
Note: **, *, and + indicate statistical significance at the 0.01, 0.05, and 0.10 levels respectively. Standard errors allow for the possibility that
errors are correlated at the level of the 31 administrative provinces contained in the sample. The table reports coefficients from ordinary least
squares estimates of equation (3). The sample consists of 233 Afghan districts with positive levels of opium poppy cultivation in 2004. The
dependent variable in columns 1 and 2 is an indicator set equal to 1 if poppy cultivation was entirely eliminated from the district from 2004
to 2009. The dependent variable in columns 3 and 4 is an indicator set equal to 1 if poppy cultivation was reduced in the district from 2004
to 2009. The dependent variable in columns 5 and 6 is calculated as the percent change in poppy cultivation from 2004 to 2009; this percent
change is calculated using the mid-point formula, and thus has a range from -2 to 2. The independent variables, which describe security
conditions and the extent of Taliban control, are defined as descried in the note to Table 1.
16
Clemens Evaluating Economic Warfare
regions. Nonetheless, the average difficulty of targeting Taliban-controlled regions is
precisely what must be known to evaluate opium-suppression efforts.
There is, however, an important potential flaw with the coefficients in Table 2. Be-
cause the measure of security conditions comes from a period after the initial measure
of poppy cultivation, reverse causality may be at work. A tendency for the continuation
of poppy cultivation and opium production to increase Taliban influence may induce a
negative correlation between poppy elimination and Taliban control. Importantly, the
mechanism just described would tend to bolster the argument for attempting to elim-
inate poppy. This contrasts sharply with the “targeting” interpretation of αOLS1 , under
which a negative correlation suggests that anti-opium efforts may be ineffective at best
and harmful at worst.
2.2.2 Instrumental Variables Estimates of the Relationship between Taliban Control
and Reductions in Poppy Cultivation
I use an IV framework to rule out reverse causality by purging the measure of Taliban
influence of developments associated with the ongoing conflict. Long-standing ethnic
loyalties play a significant role in Afghanistan’s extended internal conflict. I show the
distribution of ethnic groups across Afghanistan in Figure 5. A comparison of Figures
4 and 5 reveals the relationships between ethnic groups and Taliban influence. Pashtun
dominated areas are relatively likely to be influenced by the Taliban. The government
firmly controls most areas associated with Tajiks and Uzbeks, who formed the core of the
Northern Alliance that toppled the Taliban in 2001 with assistance from U.S. and other
NATO forces. The IV estimation framework, which utilizes linkages between ethnic
history and proclivity towards the Taliban, is presented below in equations (4) and (5).
By using largely pre-conflict data on ethnicity, I ensure that the instrument is not driven
by developments associated with the conflict itself.
17
Clemens Evaluating Economic Warfare
Figure 5: Distribution of Ethnic Groups across Afghanistan: The map displays the eth-nic groups estimated to make up a majority of each district’s population. Source: Datawas obtained from a map available on the website of the Masawat Development Fund:http://masawatdevelopmentfund.org.au/wp-content/uploads/2011/11/ethnicgroupsmap.gif (last ac-cessed December 1, 2012). The data collection associated with source map is described here:http://afghanistanelectiondata.org/election/2009/about/ethnic-data (last accessed December 1, 2012).The map “is based on data collected by the Office of the United Nations High Commissioner for Refugees(UNHCR) for AIMS in 2002 for approximately 200 districts and is supplemented with information fromthe Afghan Central Statistical Office published in 1985.”
△Poppy Cultivationd = αIV0 + αIV
1Security Threatd + εd (4)
Security Threatd = β0 + β1Ethnicityd (5)
Table 3 reports the first stage relationship between ethnic groups and Taliban influ-
ence. In columns 1 and 2, Taliban influence is described by the High Threat indicator
variable while in columns 3 and 4 it is described by the 4-category threat assessment
variable. In columns 1 and 3, the indicator variables associated with the relevant ethnic
groups are included separately. The estimates are consistent with what one would expect
18
Clemens Evaluating Economic Warfare
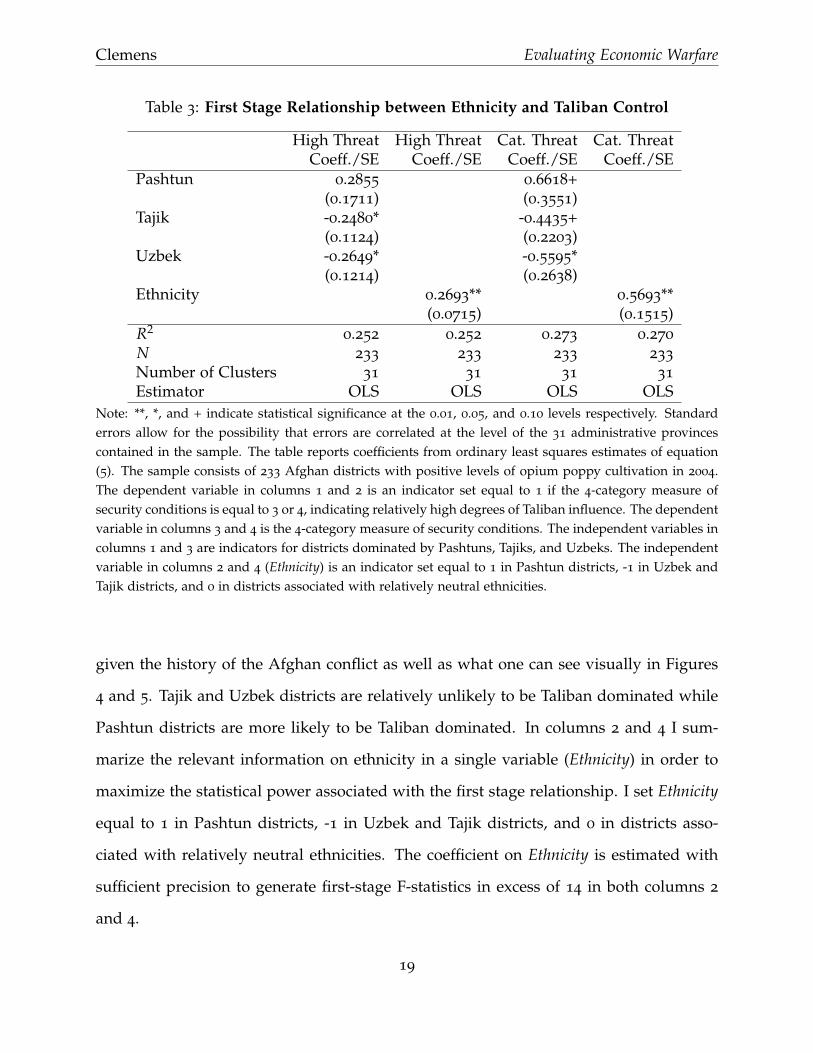
Table 3: First Stage Relationship between Ethnicity and Taliban Control
High Threat High Threat Cat. Threat Cat. ThreatCoeff./SE Coeff./SE Coeff./SE Coeff./SE
Pashtun 0.2855 0.6618+(0.1711) (0.3551)
Tajik -0.2480* -0.4435+(0.1124) (0.2203)
Uzbek -0.2649* -0.5595*(0.1214) (0.2638)
Ethnicity 0.2693** 0.5693**(0.0715) (0.1515)
R2 0.252 0.252 0.273 0.270
N 233 233 233 233
Number of Clusters 31 31 31 31
Estimator OLS OLS OLS OLS
Note: **, *, and + indicate statistical significance at the 0.01, 0.05, and 0.10 levels respectively. Standard
errors allow for the possibility that errors are correlated at the level of the 31 administrative provinces
contained in the sample. The table reports coefficients from ordinary least squares estimates of equation
(5). The sample consists of 233 Afghan districts with positive levels of opium poppy cultivation in 2004.
The dependent variable in columns 1 and 2 is an indicator set equal to 1 if the 4-category measure of
security conditions is equal to 3 or 4, indicating relatively high degrees of Taliban influence. The dependent
variable in columns 3 and 4 is the 4-category measure of security conditions. The independent variables in
columns 1 and 3 are indicators for districts dominated by Pashtuns, Tajiks, and Uzbeks. The independent
variable in columns 2 and 4 (Ethnicity) is an indicator set equal to 1 in Pashtun districts, -1 in Uzbek and
Tajik districts, and 0 in districts associated with relatively neutral ethnicities.
given the history of the Afghan conflict as well as what one can see visually in Figures
4 and 5. Tajik and Uzbek districts are relatively unlikely to be Taliban dominated while
Pashtun districts are more likely to be Taliban dominated. In columns 2 and 4 I sum-
marize the relevant information on ethnicity in a single variable (Ethnicity) in order to
maximize the statistical power associated with the first stage relationship. I set Ethnicity
equal to 1 in Pashtun districts, -1 in Uzbek and Tajik districts, and 0 in districts asso-
ciated with relatively neutral ethnicities. The coefficient on Ethnicity is estimated with
sufficient precision to generate first-stage F-statistics in excess of 14 in both columns 2
and 4.
19
Clem
ens
Evalu
ating
Econ
omic
Warfare
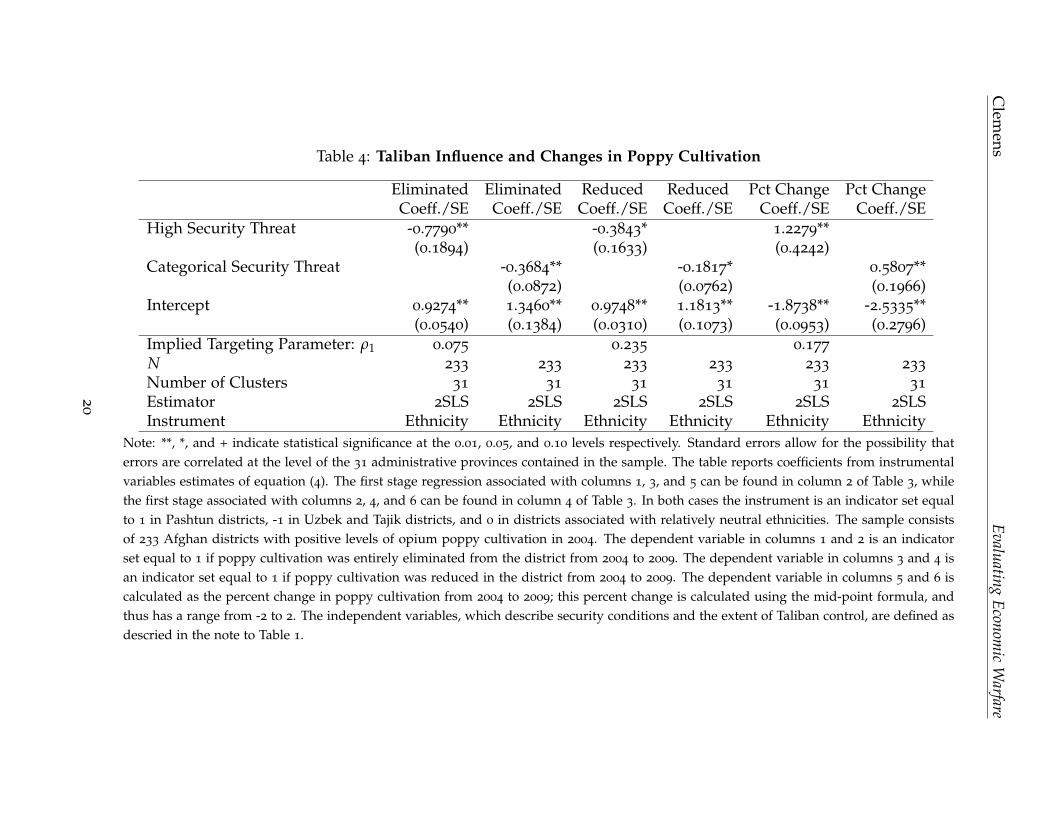
Table 4: Taliban Influence and Changes in Poppy Cultivation
Note: **, *, and + indicate statistical significance at the 0.01, 0.05, and 0.10 levels respectively. Standard errors allow for the possibility that
errors are correlated at the level of the 31 administrative provinces contained in the sample. The table reports coefficients from instrumental
variables estimates of equation (4). The first stage regression associated with columns 1, 3, and 5 can be found in column 2 of Table 3, while
the first stage associated with columns 2, 4, and 6 can be found in column 4 of Table 3. In both cases the instrument is an indicator set equal
to 1 in Pashtun districts, -1 in Uzbek and Tajik districts, and 0 in districts associated with relatively neutral ethnicities. The sample consists
of 233 Afghan districts with positive levels of opium poppy cultivation in 2004. The dependent variable in columns 1 and 2 is an indicator
set equal to 1 if poppy cultivation was entirely eliminated from the district from 2004 to 2009. The dependent variable in columns 3 and 4 is
an indicator set equal to 1 if poppy cultivation was reduced in the district from 2004 to 2009. The dependent variable in columns 5 and 6 is
calculated as the percent change in poppy cultivation from 2004 to 2009; this percent change is calculated using the mid-point formula, and
thus has a range from -2 to 2. The independent variables, which describe security conditions and the extent of Taliban control, are defined as
descried in the note to Table 1.
20
Clemens Evaluating Economic Warfare
Table 4 reports the IV estimates of the relationship between Taliban influence and
changes in poppy cultivation. The 6 specifications reported in Table 4 are IV analogs of
the 6 OLS specifications reported in Table 2. The coefficients are relatively little changed
from the results in Table 2. The results describing the relationship between Taliban
influence and the elimination of poppy cultivation are strengthened (columns 1 and
2), with the high-threat indicator predicting 78 percentage point lower likelihood of
elimination. The point estimates in columns 3 through 6 are shifted by less than 15
percent from their OLS counterparts. The high threat level is associated with a 38 percent
lower likelihood of poppy reduction and with relative poppy cultivation increases on the
order of 120 percent. Like the point estimates, estimates of the targeting parameter ρ1
are little changed from those in Table 2.
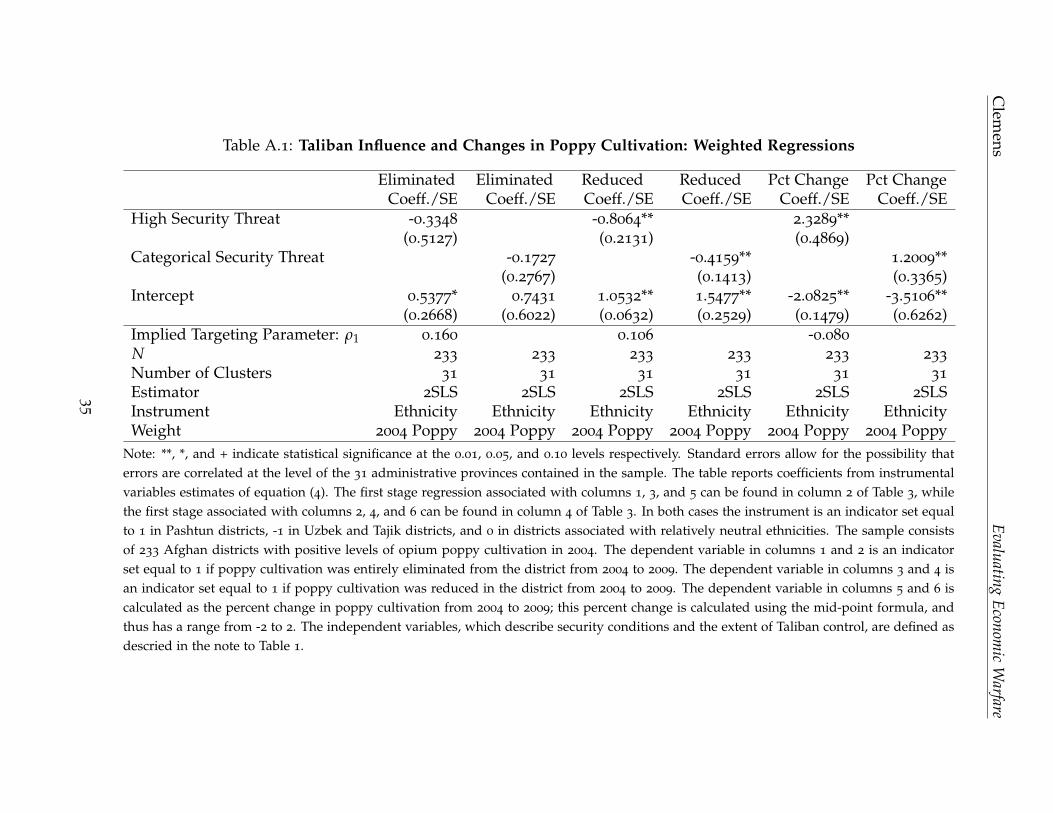
Improved estimates of the true targeting parameter could, in principal, be obtained
by weighting the regressions by each district’s share of total poppy cultivation in 2004.
Specifications that apply such weights can be found in Appendix Table A.1. The results
are suggestive of even worse targeting than was implied by the results in Table A.1.
This reflects that fact that several of the most prominent poppy-cultivating districts in
southern Afghanistan experienced significant increases in production over the relevant
time period. On average, the estimates thus imply a targeting parameter of less than 0.1.
Statistically, however, these results are less reliable than those reported in the main text.
The strong right skew of the 2004 cultivation levels places a great deal of weight on a
small number of districts. Most relevant to the validity of the IV estimation framework
is that this weighting scheme significantly reduces the power of the first stage.
Finally, it is again worth emphasizing that the estimates correspond to changes in
poppy cultivation in districts with non-zero production levels in 2004. In the language of
the model from Section 1, the estimates relate to the targeting of the output of an initial,
fixed set of producers. Accounting for subsequent differences in the origination of poppy
21
Clemens Evaluating Economic Warfare
production in Taliban and non-Taliban areas would tend to result in an increasingly
pessimistic assessment of the targeting parameter (see Figure 1).
2.3 The Elasticity of Demand
I estimate the elasticity of demand for opium in Afghanistan by utilizing a convenient
natural experiment. In 2010, a blight beset the poppy fields of southern Afghanistan, re-
sulting in far lower yields than were initially expected (UNODC, 2011). Southern yields
averaged roughly 30 kg per hectare, roughly half of their level from the previous year.
With the south accounting for the majority of national (and with it global) opium pro-
duction in recent years, nationwide supply was roughly 44 percent less than anticipated
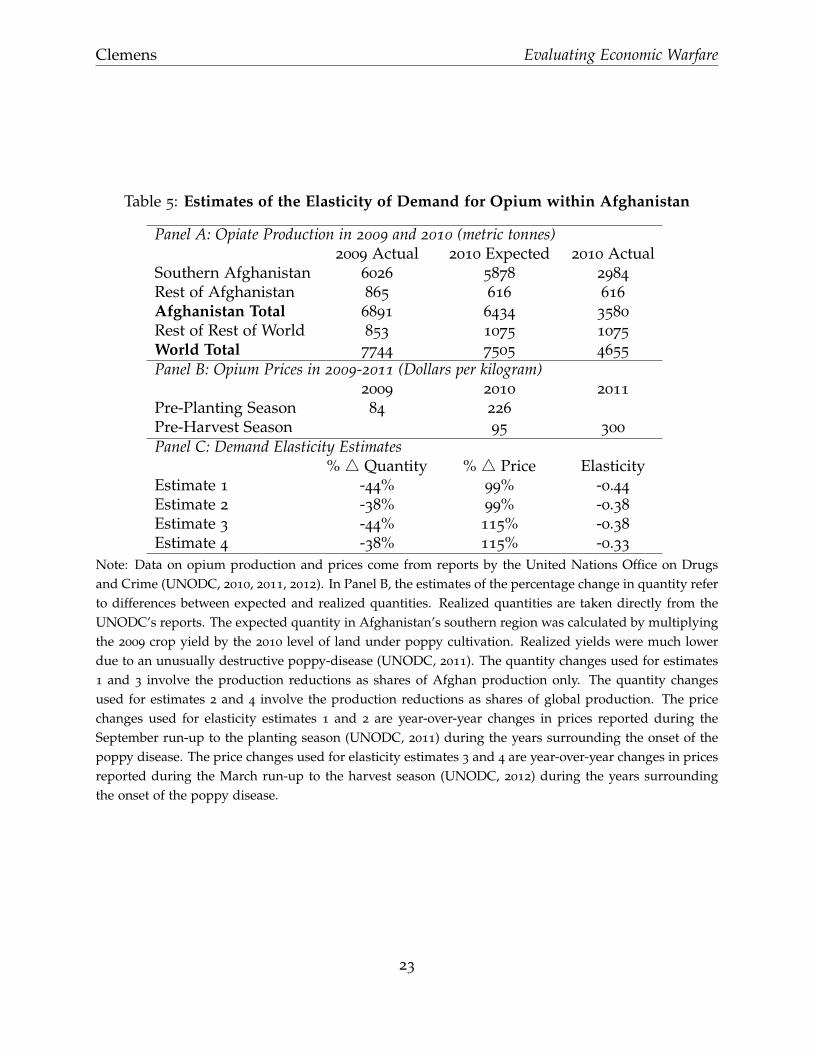
and global supply roughly 38 percent less than expected. Expected and realized quanti-
ties of opium production can be found in Panel A of Table 5.
Prices rose dramatically in response to these unexpected declines in the quantity of
opium supplied during the 2010 harvest. Afghan opium traders reported that year-
over-year prices rose by around 99 log points from the 2009 planting season through the
2010 planting season (from around $84 per kilogram to around $226 per kilogram). They
similarly reported that year-over-year prices rose by around 115 log points from the lead-
up to the 2010 harvest to the lead-up to the 2011 harvest (from around $95 per kilogram
to around $300 per kilogram).17 Various permutations of the price and quantity effects
of the poppy blight can be found in Table 5’s Panel C. As reported in column 3, they
imply demand elasticities ranging from -0.33 to -0.44.
An alternative approach, taken by Clemens (2008), involves backing out the elastic-
ity of demand for opiates within Afghanistan’s borders by using estimates of demand
17Seasonality in opium prices makes year-over-year price changes a more appropriate means of estimat-ing the demand-side response to the poppy blight than relatively high-frequency changes. High-frequencyprice changes are also difficulty to utilize in this setting due to uncertainty over both the timing of theblight and the pace at which news of the blight would have traveled to Afghanistan’s various regions.
22
Clemens Evaluating Economic Warfare
Table 5: Estimates of the Elasticity of Demand for Opium within Afghanistan
Panel A: Opiate Production in 2009 and 2010 (metric tonnes)2009 Actual 2010 Expected 2010 Actual
Southern Afghanistan 6026 5878 2984
Rest of Afghanistan 865 616 616
Afghanistan Total 6891 6434 3580
Rest of Rest of World 853 1075 1075
World Total 7744 7505 4655
Panel B: Opium Prices in 2009-2011 (Dollars per kilogram)2009 2010 2011
Note: Data on opium production and prices come from reports by the United Nations Office on Drugs
and Crime (UNODC, 2010, 2011, 2012). In Panel B, the estimates of the percentage change in quantity refer
to differences between expected and realized quantities. Realized quantities are taken directly from the
UNODC’s reports. The expected quantity in Afghanistan’s southern region was calculated by multiplying
the 2009 crop yield by the 2010 level of land under poppy cultivation. Realized yields were much lower
due to an unusually destructive poppy-disease (UNODC, 2011). The quantity changes used for estimates
1 and 3 involve the production reductions as shares of Afghan production only. The quantity changes
used for estimates 2 and 4 involve the production reductions as shares of global production. The price
changes used for elasticity estimates 1 and 2 are year-over-year changes in prices reported during the
September run-up to the planting season (UNODC, 2011) during the years surrounding the onset of the
poppy disease. The price changes used for elasticity estimates 3 and 4 are year-over-year changes in prices
reported during the March run-up to the harvest season (UNODC, 2012) during the years surrounding
the onset of the poppy disease.
23
Clemens Evaluating Economic Warfare
elasticities in retail markets. This exercise produces a range of relatively small demand
elasticites, running from -0.02 to -0.16.18 Such low elasticities have even more pessimistic
implications for the effects of opium interdiction and poppy eradication efforts than the
elasticities just estimated.
2.4 Estimating the Effect of Anti-Opium Efforts on Taliban Resources
I use the results above to estimate the implications of anti-opium enforcement circa
2004 (the base year from which the targeting parameter was estimated) on the resources
available to the Taliban. I take my preferred estimate of the targeting parameter to be
the estimate of 0.18 from column 5 of Table 4. I take the demand elasticity to be -0.4,
the market price to be $142 per kg (UNODC, 2004), and estimate the 2004 market share
of Taliban-heavy areas to be 40 percent. Placing these estimates into the formula for the
welfare effect of incremental enforcement yields:
dW
dE= −λ1pρ1 + λ1p
1
−ǫD
[q1 − E1]
Qnet
= −λ1142 × 0.18 + λ11421
0.4.4
= λ1116. (6)
The parameterization implies that seizing or deterring the production of one kilo-
gram of opium channels roughly $116 in income to farmers in Taliban-heavy areas.19
The intended effect of reducing Taliban income by seizing 0.18 kilogram from areas they
influence is swamped by the unintended effect of increasing the value of their remain-
18Relatively inelastic demand at the source-country level is driven by the fact that source-country pricesare a very small fraction of retail prices. Source-country demand will be highly inelastic unless mark-upsfrom the source-country to retail markets are nearly purely multiplicative.
19Given the standard ushr of 10 percent, this would translate into $12 for the Taliban itself.
24
Clemens Evaluating Economic Warfare
ing opium stocks. This increase is large both because demand is relatively inelastic and
because an additional 0.82 kilogram of opium in government-controlled territory has
simultaneously been removed from the market.
A direct comparison of 2004 and 2010 provides a suggestive estimate of the aggre-
gate impact of anti-opium policy on the distribution of opium income between Taliban
and non-Taliban territory. In 2004, there were 131,000 hectares of land under poppy
cultivation, yielding an estimated 4,200 metric tonnes, of which roughly 40 percent was
produced in Taliban-heavy districts. At an average price of $142 per kilogram of dry
opium, the estimated opium-source income of farmers in Taliban-heavy districts was
$240 million. In 2009, there were 123,000 hectares of land under poppy cultivation,
yielding an estimated 3,600 metric tonnes, of which roughly 90 percent was produced
in Taliban-heavy districts. At an average price of $169 per kilogram of dry opium, the
estimated opium-source income of farmers in Taliban-heavy districts was $580 million.
The opium-source income of Taliban-heavy territory had thus more than doubled, as
had its share of the total.
3 Additional Model Calibrations Involving Conflict with
an Oil-Producing Country
In this section I expand the application of section 1’s model of economic warfare to
the context of conflicts involving oil-producing nations. Historical conflicts involving
oil-producing nations point to many of the salient considerations surrounding economic
warfare. The years following the U.S. invasion of Iraq, for example, saw extensive insur-
gent efforts to derail Iraqi oil production and sabotage its pipelines (Fattouh, 2007). The
Iran-Iraq War also featured several permutations of relevant strategies. These included
the early destruction of Iraq’s port facilities (Foote et al., 2004), Iraqi responses in kind
25
Clemens Evaluating Economic Warfare
(Sterner, 1984), and Iranian threats, directed at the world as a whole, “to close the Gulf
for ‘everybody’” (Sterner, 1984, p.129). In contrast with the previous section’s analysis
of anti-opium policy, conflicts involving oil-producing countries provide illustrations of
equation (2)’s implications in a setting where targeting should not be particularly diffi-
cult.
3.1 A Short-Run Conflict Involving Iran
Consider a hypothetical conflict involving Iran, which accounts for 5 percent of global
oil output so that[q1−E1]
Qnet= 0.05 (USEIA, 2012). Typical estimates of the short-run elastic-
ity of demand for oil are on the order of -0.1 (Cooper, 2003; Hamilton, 2008). Substitut-
ing these numbers into equation (2) yields ρ∗1 = 0.5. If oil infrastructure can be readily
targeted, the targeting parameter should approach 1. This implies that incremental de-
struction of Iranian oil output and/or infrastructure could improve the reference nation’s
The reference nation’s own position in the oil market may radically alter the net
benefit it realizes from attempting economic warfare with Iran. A net importer of oil
will suffer losses from the increase in oil’s price. For the United States, the benefit from
reducing Iranian resources would thus be blunted, and possibly reversed, by domestic
considerations. In contrast, a net exporter stands to gain from the resulting increase
in the value of its own production. Beyond their obvious military value, attacks on
one another’s oil infrastructure may thus have served more explicitly economic ends
in the case of the Iran-Iraq War. The same can be said for efforts to sabotage Iraqi oil
production following the U.S.’s 2003 invasion. It is also apparent that a net exporter like
modern-day Russia can benefit substantially from protracted Middle East instability. A
broader range of consequences, including the potential escalation of existing conflicts
and changes in the environment of international relations, are also of clear importance;
26
Clemens Evaluating Economic Warfare
these considerations are well beyond this paper’s scope.
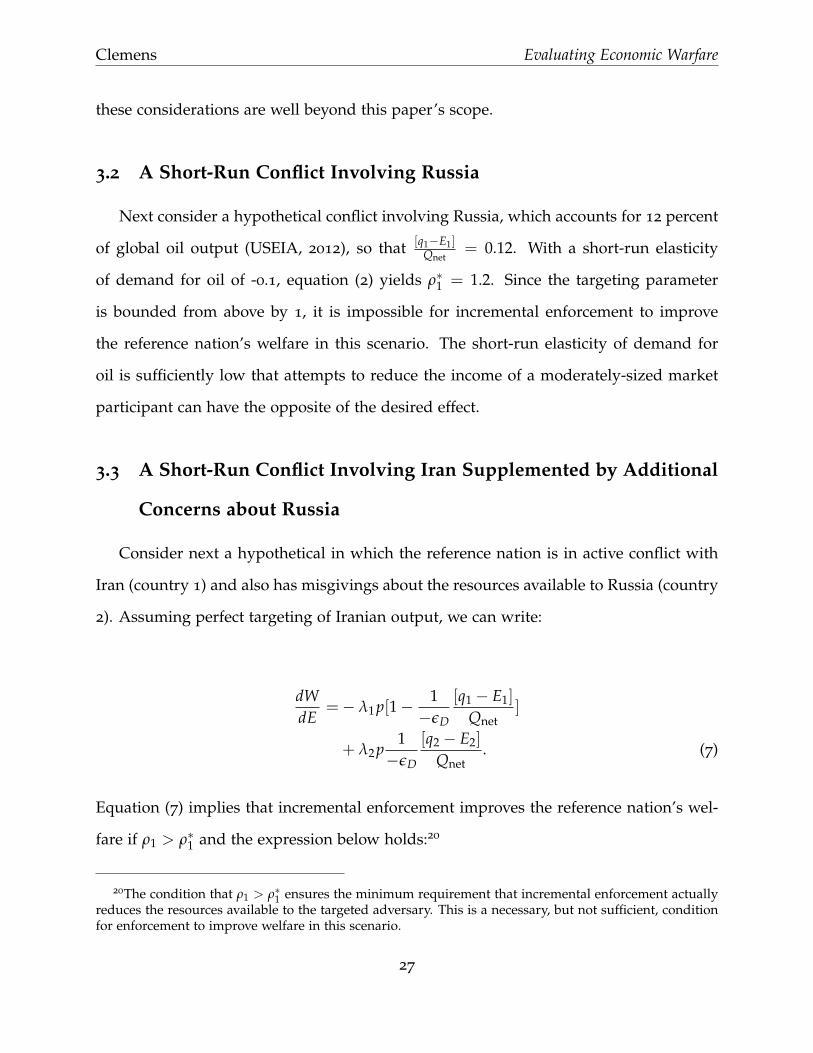
3.2 A Short-Run Conflict Involving Russia
Next consider a hypothetical conflict involving Russia, which accounts for 12 percent
of global oil output (USEIA, 2012), so that[q1−E1]
Qnet= 0.12. With a short-run elasticity
of demand for oil of -0.1, equation (2) yields ρ∗1 = 1.2. Since the targeting parameter
is bounded from above by 1, it is impossible for incremental enforcement to improve
the reference nation’s welfare in this scenario. The short-run elasticity of demand for
oil is sufficiently low that attempts to reduce the income of a moderately-sized market
participant can have the opposite of the desired effect.
3.3 A Short-Run Conflict Involving Iran Supplemented by Additional
Concerns about Russia
Consider next a hypothetical in which the reference nation is in active conflict with
Iran (country 1) and also has misgivings about the resources available to Russia (country
2). Assuming perfect targeting of Iranian output, we can write:
dW
dE=− λ1p[1 −
1
−ǫD
[q1 − E1]
Qnet]
+ λ2p1
−ǫD
[q2 − E2]
Qnet. (7)
Equation (7) implies that incremental enforcement improves the reference nation’s wel-
fare if ρ1 > ρ∗1 and the expression below holds:20
20The condition that ρ1 > ρ∗1 ensures the minimum requirement that incremental enforcement actuallyreduces the resources available to the targeted adversary. This is a necessary, but not sufficient, conditionfor enforcement to improve welfare in this scenario.
27
Clemens Evaluating Economic Warfare
λ1
λ2>
1−ǫD
[q2−E2]Qnet
1 − 1−ǫD
[q1−E1]Qnet
. (8)
The denominator of (8)’s right hand side is positive when ρ1 > ρ∗1 . Concern for Russian
resources results in an additional cost from enforcement targeted at Iran, as the reduction
in the total quantity supplied increases the value of Russia’s output. This is captured
by the numerator of (8)’s right hand side, which is positive unless demand is infinitely
elastic, in which case the expression equals 0. For the increase in enforcement to improve
welfare, the ratio of dollars given to Russia to dollars taken from Iran must be sufficiently
small. Specifically, it must be smaller than the ratio describing the reference nation’s
relative disutility from resources flowing to these two countries.
Substituting into the expression, we have λ1λ2
>
10.1×0.12
1− 10.1×0.05
= 1.20.5 . Thus incremen-
tal enforcement could improve the reference nation’s welfare if disutility from Iranian
resources is more than 2.4 times disutility from Russian resources.
3.4 A Long-Run Conflict Involving Iran Supplemented by Additional
Concerns about Russia
Consider finally the case in which the conflict from the previous example is expected
to last for quite some time. This variant is relevant because the long-run elasticity of
demand for oil is much larger than the short-run elasticity. Typical estimates place it in
the neighborhood of -0.5 (Hamilton, 2008). The required ratio of disutility from Iranian
resources relative to Russian resources declines with this elasticity.21 With a demand
elasticity of -0.5, it declines by nearly 90 percent to just over 0.25.
21It also rises as either adversary’s market share rises.
28
Clemens Evaluating Economic Warfare
4 Discussion
The contrast between this paper’s analysis of economic warfare in the contexts of
the oil market and Afghan opiates highlights the importance of targeting. When target-
ing faces few impediments, as may be true in the case of oil infrastructure, successful
economic warfare becomes plausible. When targeting is difficult, the prospects for suc-
cess are highly unfavorable; poorly targeted enforcement can only yield the intended
result when the relevant market’s demand is highly elastic. The Afghan opiate industry
emerges as a context in which the targeting problem has, for a number of years, ap-
peared to be intractable. I conclude with some discussion of why this might be the case
and how general the relevant issues might be.
The most obvious explanation for ineffective targeting of Taliban poppy is territorial
control. Afghanistan’s national government has the capacity to enforce the poppy ban
in areas it controls, while enforcement elsewhere is difficult if not impossible. It fol-
lows quite directly that Taliban-loyal poppy farmers are less likely to be encountered by
poppy-ban enforcers.
A second explanation relates to the government’s persuasive influence. Conditional
on the government’s degree of territorial control, Taliban-oriented farmers are relatively
un-persuadable for two reasons. Soft persuasion is relatively ineffective on Taliban-
oriented farmers because they are, by definition, disinclined to respect the government’s
legal authority; they are thus unlikely to abstain from cultivating poppy out of respect for
the ban itself. Similarly, persuasion through the threat of enforcement is made difficult
by the Taliban’s protective services.
A third potential explanation for the difficulty of targeting Taliban-loyal poppy farm-
ers relates to contracting, specifically to the incentives laid out for those implementing
enforcement on the ground. In this and other prohibition-related contexts, perfect target-
ing could, in principal, be achieved through a strategy of catch-and-release; enforcement
29
Clemens Evaluating Economic Warfare
agents could turn a blind eye when they encounter non-adversarial producers. Because
catch-and-release incidents generate little tangible evidence, however, they are difficult
to verify and reward. Instead, anti-drug enforcement agencies tend to be rewarded on
the basis of interdiction statistics and the ability to show “drugs on the table.”22
Difficulties with economic warfare may extend to a broad range of prohibition-related
contexts. Reflecting on the cartels associated with modern drug trafficking, as in Mex-
ico, policymakers’ dislike of industry participants is driven in part by their capacity to
generate violence. The ability to target market participants will thus quite naturally be
negatively correlated with the extent to which they are viewed as adversaries. The ten-
dency for enforcement to increase the market shares of those most capable of generating
violence, and least inclined to respect legal authority, creates an important impediment
to the effectiveness of income-suppression policies.
References
Andersson, C. 2010. “Counterproductive counternarcotic strategies? A study of the
effects of opium eradication in the presence of imperfect capital markets and share-
cropping arrangements.” Umea Economic Studies.
Becker, G.S. 1968. “Crime and Punishment: An Economic Approach.” The Journal of
Political Economy, 76(2): 169–217.
Becker, G.S., K.M. Murphy, and M. Grossman. 2006. “The market for illegal goods: the
case of drugs.” Journal of Political Economy, 114(1): 38–60.
Berman, E., J.N. Shapiro, and J.H. Felter. 2011. “Can Hearts and Minds Be Bought? The
Economics of Counterinsurgency in Iraq.” Journal of Political Economy, 119(4): 766–819.
22Also potentially relevant is that, on a purely operational level, there may be difficulty transmitting anorder that policy has become selectively anti opium.
30
Clemens Evaluating Economic Warfare
Berman, E., M. Callen, J.H. Felter, and J.N. Shapiro. 2011. “Do working men rebel?
Insurgency and unemployment in Afghanistan, Iraq, and the Philippines.” Journal of
Conflict Resolution, 55(4): 496–528.
Blanchard, Christopher M. 2009. “Afghanistan: Narcotics and U.S. Policy.” Congres-
sional Research Service.
Caulkins, Jonathan P., and Peter Reuter. 2006. “Illicit drug markets and economic irreg-