226
Evaluating Florida’s Medicaid Provider Service Network Demonstration Patient Experience Analysis Final Project Report June, 2004

Evaluating Florida’s Medicaid
ProviderService NetworkDemonstration
Patient Experience AnalysisFinal Project ReportJune, 2004

Acknowledgements This research was commissioned by the Florida Agency for Health Care Administration (AHCA), office of Medicaid Program Development. (Due to reorganization at AHCA, project oversight is now through the Bureau of Medicaid Research.) The study was funded by Grant Number 38155 from the Robert Wood Johnson Foundation, through the “Changes in Health Care Financing and Organization” program. The HCFO program is a national initiative of the Foundation, managed by AcademyHealth. The University of Florida team appreciates the assistance of Janet Barber, Kim Shuey, Nancy Ross, Chris Mallison, Mel Chang, Ronda Johnson (AHCA) and Stephanie Schmidt and Sharon Hatch (South Florida Community Care Network). In addition, Kezia Adwazi and William Mkanta assisted with data, Teresa Davis provided invaluable assistance with report production, and Cynthia Wilson Garvan consulted on the sample and analysis.

Table of Contents
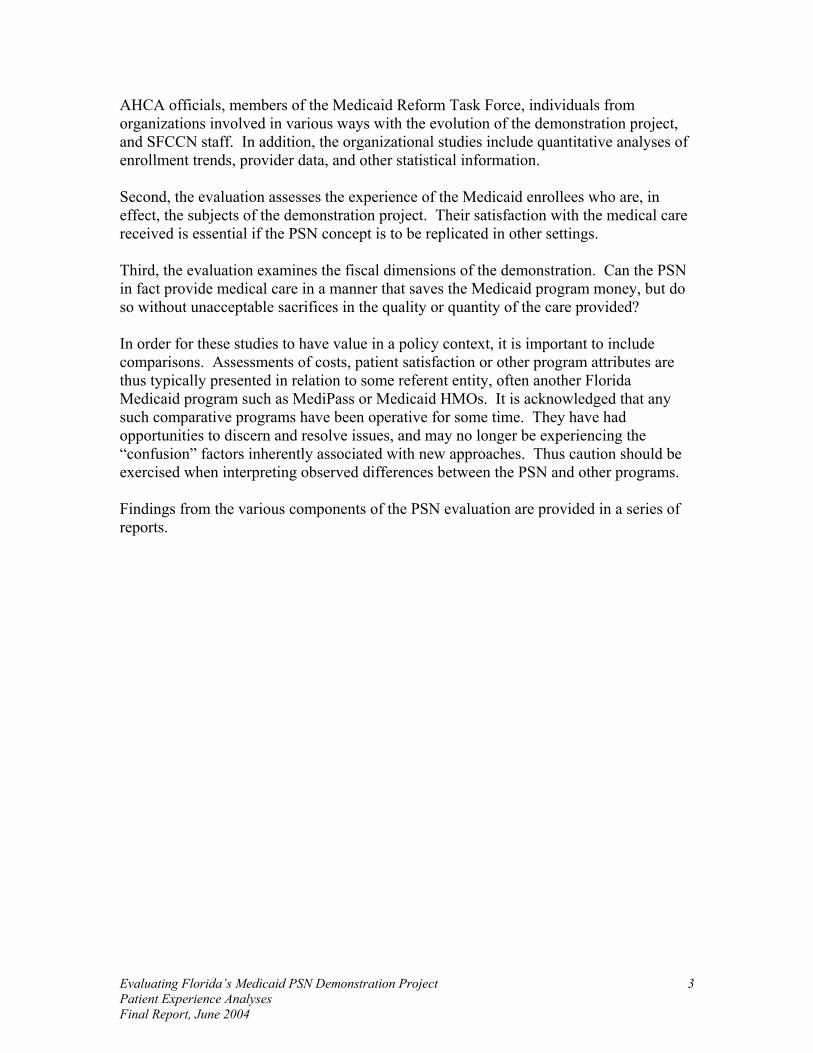
Preface................................................................................................................................ 1
Executive Summary ........................................................................................................... 5
Overview ............................................................................................................................. 7
I. Patient Satisfaction Surveys
Year 1 (2001) .............................................................................................................................. 9 Introduction and Methodology ............................................................................................................. 11 Key Findings ........................................................................................................................................ 17 Discussion ............................................................................................................................................ 37 Appendix A, Detailed Results and Standard Errors.............................................................................. 39 Multivariate Analyses from Year 1 ...................................................................................................... 59
Year 3 (2003) ............................................................................................................................ 65 Introduction and Methodology ............................................................................................................. 67 Key Findings ........................................................................................................................................ 71 Discussion .......................................................................................................................................... 105 Appendix B, Detailed Results and Standard Errors............................................................................ 107
Appendix C, Questionnaires ................................................................................................. 149 Appendix C-1, Adult Questionnaire, 2001 and 2003 ......................................................................... 151 Appendix C-2, Child Questionnaire, 2003 ......................................................................................... 167
Comparison of 2001 to 2003 Survey Findings..................................................................... 183
II. Disease Management ............................................................................................... 185
Description of Program......................................................................................................... 187
Qualitative Research With Enrollees ................................................................................... 197 Introduction and Methodology ........................................................................................................... 197 Major Themes..................................................................................................................................... 199 Appendix D, Methodological Details on Recruitment ....................................................................... 203
III. Disenrollee Study..................................................................................................... 205 Introduction ........................................................................................................................................ 207 Key Findings ..................................................................................................................................... 209 Discussion .......................................................................................................................................... 218
Conclusions .................................................................................................................... 220

Evaluating Florida’s Medicaid PSN Demonstration Project 1 Patient Experience Analyses Final Report, June 2004
Preface Florida’s PSN Demonstration Project Continuing increases in the cost of medical care threaten the viability of Medicaid programs in numerous states, and most have responded with various cost-containment initiatives. In Florida, programs have included aggressive use of HMOs, case management programs, an innovative prescription drug cost containment program, and many other interventions. One such program is a demonstration project focused on the provision of Medicaid services through a Provider Sponsored Organization. A provider sponsored organization (PSO) is one in which a provider organization, or network of organizations, provides medical care services to a defined population and also agrees to perform the associated insurance functions, such as enrollee services, provider credentialing, claims processing, quality assurance, and the like. Generally speaking, the concept of a “provider sponsored organization” can be traced to the 1980s. Further development, primarily associated with the Medicare+Choice program, can be observed throughout the 1990s.1 The concept is built on a core assumption that medical care costs can be contained when money flows directly from payer to provider, removing the health plan, insurance company or comparable “middle man” from the transaction.2 The extent to which the anticipated savings can actually be realized under the PSO model is essentially unknown. Specifically, there is scant empirical evidence that moving these functions from an insurance company or health plan to a provider organization such as a PSO will result in overall savings. Clearly, moving functions from one organization to another does not eliminate the activities. Whether or not such relocations might reduce the cost of performing the activities has not been thoroughly examined. In Florida, the general concept is manifested in a specific demonstration project. Structured around a Provider Service Network (PSN) known as the South Florida Community Care Network, the demonstration is intended, in part, to assess the core assumption defined in the previous paragraph with reference to Medicaid. It is anticipated that further savings will be achieved by the coordination and management of care processes and improved efficiencies.
The demonstration can be traced to September 1996, when Governor Lawton Chiles issued an executive order calling for the creation of the Florida Medicaid Reform Task 1 See, for example: Hirschfield, E.B., Nino, K., & Jameson, H. (1999) Structuring Provider-Sponsored Organizations: The Legal and Regulatory Hurdles. Journal of Legal Medicine, 20, (3): 297-363. Also see: Davis, G.S. (1997) Provider-sponsored Organizations: The Next Generation of Managed Care? Managed Care, 6, (9): 83-5. 2 Garriss J., Aistrop J., Slavic B., Wagner K., Calvaruso J., Reiner R., Dille J., & Schrock R. (Jul 5, 1997) Participants in the Medicare Choices Project Say They’re Nudging Out the Insurance Middleman—And Insuring Their Own Survival. Hospitals & Health Networks, 71,(13): 32-4, 36.

Evaluating Florida’s Medicaid PSN Demonstration Project Patient Experience Analyses
Final Report, June 2004
2
Force. This 33-member bipartisan advisory group was charged with studying the state’s $6.5 billion Medicaid program in order to make recommendations for its reform. One of its recommendations was to develop provider service networks. The 1997 Florida legislature authorized the establishment of four Medicaid Provider Service Networks. The PSN demonstration was established with these objectives:
• To develop a successful managed care partnership between Florida’s Agency for Health Care Administration (AHCA) and various historical high-volume providers of care to Florida’s Medicaid enrollees;
• To provide and test a new kind of health care choice for Medicaid enrollees in the demonstration areas;
• To achieve favorable cost savings and improved enrollee health outcomes through enhanced coordination between Medicaid and local indigent health care programs; and
• To improve the quality of life for Medicaid recipients living with chronic health conditions.
The PSN concept originally envisioned networks primarily structured in a fee-for-service model with payment withholds and an administrative allocation. The administrative allocation would be used to cover the costs associated with the development and operation of an administrative infrastructure that would pay off in savings to both AHCA and the PSNs. After a competitive bidding process, a series of legal protests, and a period of negotiation, the South Florida Community Care Network (SFCCN) became operational on March 1, 2000. SFCCN is a unique partnership of three large public health care systems in Miami-Dade and Broward Counties: the Public Health Trust of Miami-Dade County, Memorial Healthcare System, and the North Broward Hospital District. In its first year of operations, SFCCN enrollment grew to over 24,000 enrollees. The PSN Evaluation Project The PSN initiative is of great interest to Medicaid programs in other states, to the federal government (given its funding role in Medicaid and its responsibility for the Medicare program) and to large employers who may consider similar direct contracting initiatives for their employees. To inform such interested parties, Florida’s Medicaid Program Development Office determined that the PSN Demonstration Project should be thoroughly evaluated by an independent research organization. The University of Florida was granted that opportunity. The evaluation consists of three interrelated areas of observation and inquiry. First, the PSN demonstration project and the resulting organization (SFCCN) are documented and described, using the methodologies of organizational analysis. This aspect of the evaluation is based on a review of all relevant PSN documents, extensive literature and media reviews, and over 40 interviews with various informants, including
Evaluating Florida’s Medicaid PSN Demonstration Project 3 Patient Experience Analyses Final Report, June 2004
AHCA officials, members of the Medicaid Reform Task Force, individuals from organizations involved in various ways with the evolution of the demonstration project, and SFCCN staff. In addition, the organizational studies include quantitative analyses of enrollment trends, provider data, and other statistical information. Second, the evaluation assesses the experience of the Medicaid enrollees who are, in effect, the subjects of the demonstration project. Their satisfaction with the medical care received is essential if the PSN concept is to be replicated in other settings. Third, the evaluation examines the fiscal dimensions of the demonstration. Can the PSN in fact provide medical care in a manner that saves the Medicaid program money, but do so without unacceptable sacrifices in the quality or quantity of the care provided? In order for these studies to have value in a policy context, it is important to include comparisons. Assessments of costs, patient satisfaction or other program attributes are thus typically presented in relation to some referent entity, often another Florida Medicaid program such as MediPass or Medicaid HMOs. It is acknowledged that any such comparative programs have been operative for some time. They have had opportunities to discern and resolve issues, and may no longer be experiencing the “confusion” factors inherently associated with new approaches. Thus caution should be exercised when interpreting observed differences between the PSN and other programs.
Findings from the various components of the PSN evaluation are provided in a series of reports.

Evaluating Florida’s Medicaid PSN Demonstration Project 5 Patient Experience Analyses Final Report, June 2004
Executive Summary This report describes findings from a series of analyses that explore the PSN demonstration from the enrollee’s point of view. Three areas of inquiry are included: a series of patient satisfaction surveys, qualitative research with enrollees in disease management programs, and an analyses of voluntary disenrollees from the PSN to another Medicaid program. For the surveys, a random sample of enrollees in the South Florida Community Care Network (SFCCN) was interviewed. For the 2001 survey, only adults were included; families with children were also included in 2003. Interviews were conducted by telephone, using a standardized patient satisfaction questionnaire known as the Consumer Assessment of Health Plans Study (CAHPS). For comparative purposes, a similar sample of enrollees participating in Florida’s MediPass program was surveyed during the same period of time, using the same questionnaire. Florida’s MediPass program is based on a primary care case management model and has been operational since 1991. In general, participants in both of these Medicaid programs report a high level of satisfaction with the medical care they receive, and with the administrative processes and procedures associated with that care. Specifically:
• A majority of respondents in both programs reported having “no problems” in finding a personal doctor or nurse (73-95%), obtaining referrals when needed (62-79%), or having to delay care while waiting for program approvals (72-88%).
• Fewer than half of respondents in both surveys experienced problems in obtaining information or processing paperwork.
• About three quarters of both PSN and MediPass respondents gave the most favorable score regarding how their doctor or other health care provider communicated with them, including such things as listening carefully, explaining things clearly, and spending sufficient time.
• Very few participants in either program reported having called or written to express complaints about service (2-9%).
• Respondents to all surveys gave very high ratings to the doctors and nurses from whom they had recently received care (76-82% gave the highest ratings), and to their health program overall (60-81% gave the highest ratings).
• Differences in satisfaction and related phenomena continue to be observed between the PSN and MediPass samples. The magnitude of such differences were generally modest. Where observed, the differences indicated a higher level of satisfaction among MediPass enrollees.
• In general, satisfaction scores among families with children were higher than similar measures for adults reporting on their own care.
• Findings between 2001 and 2003 were overall very stable, with similar high ratings of satisfaction. Time between seeking and getting care had increased, and enrollee services for the PSN had improved.

Evaluating Florida’s Medicaid PSN Demonstration Project Patient Experience Analyses
Final Report, June 2004
6
The second section of this report explores the disease state management programs of the PSN, beginning with a description of the operations and measurable indicators for programs targeted to diabetes, asthma, HIV/AIDS and high risk pregnancy. Where data were available, information on outcomes is also included. Additionally, we conducted qualitative research with enrollees in the asthma and diabetes programs, which had been operational for more than two years at the time of our research. Major themes that came out of our interviews and focus groups include the following:
• There was a great deal of variation in the level of participant awareness that they were enrolled in a disease management program.
• Some participants could give practical examples of how the care manager had assisted them, such as arranging transportation, cutting through red tape, and reminding them about diet and exercise.
• Educational classes on how to manage and live with their disease were given as one of the benefits of the program.
• Overall, enrollees were enthusiastic about the quality of their care, and sincerely appreciative of the services provided by Medicaid.
The third element of the report uses administrative data provided by Medicaid to better understand those enrollees who called Medicaid to elect a Medicaid program other than the PSN. The objective was to identify the number and characteristics of those who voluntarily disenrolled from the PSN. Key findings from this analysis included the following:
• Few enrollees chose to voluntarily disenroll from the PSN. On average, only 2.5% of enrollees changed plans each month for which we had enrollment and disenrollment data.
• The most common reasons for people to voluntarily disenroll from the PSN were that their primary care provider is not with the plan (31.1%) or is no longer with the plan (17.1%), or that the enrollee is seeking enhanced benefits (29.0%) from another plan.
• Reasons associated with quality of care, such as long waits, rude treatment and dissatisfaction with the provider, made up only a small minority (about 3.7%) of stated reasons for leaving the PSN.
• Upon leaving the PSN, most enrollees went to a Medicaid HMO (48.3%) or MediPass (45.6%). Hispanics made up the largest group going to MediPass (48.9%), while Blacks were the largest group moving to HMOs (60.0%).
Evaluating Florida’s Medicaid PSN Demonstration Project 7 Patient Experience Analyses Final Report, June 2004
Overview The analyses described in this report were designed to capture critical aspects of the experience of enrollees in the PSN demonstration. Three different approaches were included: patient satisfaction surveys, qualitative research regarding disease state management programs, and a study of voluntary disenrollment from the PSN. I. Patient Satisfaction Surveys Patient satisfaction is an essential element in any comprehensive assessment of medical care or a program for medical care delivery. In the world of commercial insurance products, dissatisfied enrollees are seen as comparable to unhappy customers. Having too many of them for too long can have severely negative consequences. To the extent that Medicaid programs try to emulate the services and processes observed in the private sector, they too seek a high degree of satisfaction among their enrollees. Furthermore, any attempts to modify the structure or processes of care may meet with resistance unless enrollees can perceive improvements in their own experiences. Such experience is measured, in part, by their satisfaction. Therefore, it is important to assess the satisfaction of enrollees in various Medicaid programs. To do so well is difficult. It is methodologically complex and has itself been the subject of controversy. Any study of enrollee satisfaction entails decisions and compromises that introduce limitations. The purpose of the surveys was to assess enrollee satisfaction with this new health care delivery system, and to provide comparisons with enrollees in MediPass during the same time frame. The surveys utilized a standardized questionnaire, the Consumer Assessment of Health Plans Study (CAHPS) 2.0 Medicaid Adult and Child instruments. The CAHPS is a collaborative project sponsored by the U.S. Agency for Health Care Research and Quality (AHRQ) in order to help consumers identify the best health care plan for them. The survey package was developed by the CAHPS Consortium, a group formed by cooperative agreements between AHRQ and Harvard University, RAND, and the Research Triangle Institute. The CAHPS questionnaires and reports have been thoroughly tested. Detailed documentation on instrument development can be found at http://www.ahcpr.gov/qual/cahps/dept7.htm.
A small number of very minor changes were made for this project. These included (1) adding the specific name of the South Florida Community Care Network, PSN or MediPass as appropriate to various contexts, and (2) using the term “program” instead of “plan,” since few recipients think of Medicaid as a “health plan.” The text of the complete questionnaire is included as Appendix C to this report.
Evaluating Florida’s Medicaid PSN Demonstration Project Patient Experience Analyses
Final Report, June 2004
8
II. Disease Management From the beginning of the PSN demonstration, one aspect that set this model apart from other health care plans was the requirement to provide disease state management programs for enrollees with chronic illnesses. This aspect of care was an attraction for some organizations considering operating a PSN, and was an integral part of the demonstration. We attempt to analyze the disease state management programs in two ways. First, we offer a comprehensive description of the programs based on interviews with providers and staff, as well as reports. Second, we conducted qualitative research with enrollees in these programs, asking their views about the program, whether they feel they benefited from the care, and how the disease management program has impacted their lives. III. Disenrollee Study The purpose of this analysis was to describe the number and characteristics of enrollees who voluntarily chose to leave the PSN and enroll in another Medicaid plan, using data provided by the Medicaid contractor who took the phone calls from Medicaid recipients who chose to elect a different plan. Understanding disenrollment is essential to evaluating the quality of a health care program for several reasons. First, disenrollment can be viewed as a measure of satisfaction, since those leaving the plan are making a choice about their preferences in a health care plan. Second, reducing the number of disenrollees is important to the long-term sustainability of the program. A sufficient number of enrollees is needed to maintain a workable health care system.
Patient Satisfaction Survey
Year 1 (2001)

Evaluating Florida’s Medicaid PSN Demonstration Project 11 Patient Experience Analyses Final Report, June 2004
Introduction and Methodology Fieldwork The survey fieldwork was conducted by the University of Florida Bureau of Economic and Business Research (BEBR). The BEBR survey lab uses Sawtooth WinCATI software, a computer-assisted telephone interviewing (CATI) system, to speed the delivery of clean, machine-readable data following completion of the fieldwork. Most interviewers were undergraduate students at the University of Florida. Interviewers represented a wide range of ethnicity, gender and race categories. Bilingual interviewers must have demonstrated a proficiency at speaking without a strong accent in either language. Interviews were conducted during 3-hour shifts on each day of the week, never earlier than 9 a.m. or later than 9 p.m., respondents’ local time. Many of the interviewers had already worked on an HMO survey and were familiar with the CAHPS instrument; new interviewers received the same training that was used in the HMO survey. Additionally, background information about MediPass and the PSN was provided. To enhance the response rate, BEBR procedures include multiple callbacks for phone numbers that are busy or go unanswered. Additionally, callback appointments were scheduled for a future time that was more convenient for the respondent.
During each shift, at least one interviewer was monitored. Without prior notice, a supervisor listened in from a reception-only phone line in another room. The supervisor noted the interviewer’s performance and met with the interviewer afterward, offering suggestions for improvement if needed. Additionally, the UF PSN evaluation project coordinator visited the lab during the first few days of interviewing, monitoring several interviews. Sample This project interviewed adults age 18 or older for whom a valid telephone number was available, and who were physically able to respond to the survey by telephone. The sample was a randomly selected cross-section of adult enrollees who had been in the PSN or MediPass for at least 6 months prior to the interview. The fieldwork began in late June and was completed in mid-August, 2001. The target was 500 interviews with each group; we completed 517 interviews with PSN enrollees and 506 with MediPass enrollees. The sample was managed in replicates (representative subsamples); once a replicate had been opened, complete call procedures were followed for every phone number. Language The interviews were conducted in English, Spanish and Haitian Creole.
The breakdown of interviews by language is as follows:
Evaluating Florida’s Medicaid PSN Demonstration Project Patient Experience Analyses
Final Report, June 2004
12
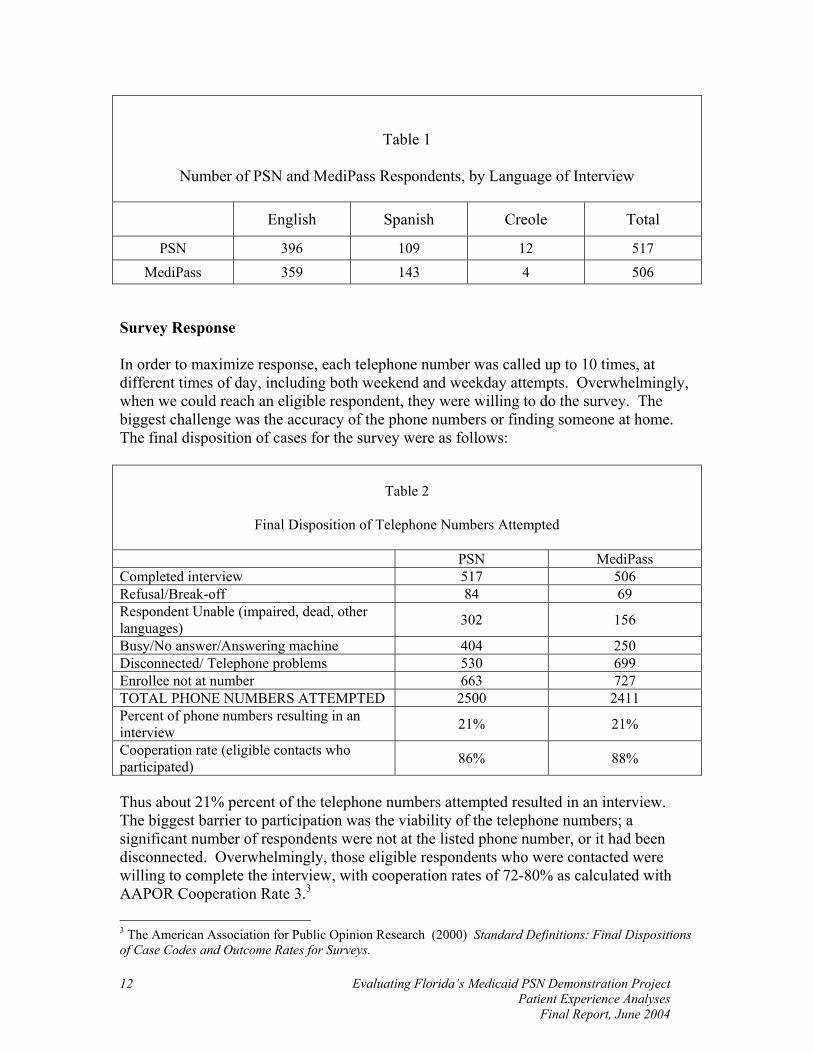
Table 1
Number of PSN and MediPass Respondents, by Language of Interview
English Spanish Creole Total
PSN 396 109 12 517 MediPass 359 143 4 506
Survey Response In order to maximize response, each telephone number was called up to 10 times, at different times of day, including both weekend and weekday attempts. Overwhelmingly, when we could reach an eligible respondent, they were willing to do the survey. The biggest challenge was the accuracy of the phone numbers or finding someone at home. The final disposition of cases for the survey were as follows:
Table 2
Final Disposition of Telephone Numbers Attempted
PSN MediPass Completed interview 517 506 Refusal/Break-off 84 69 Respondent Unable (impaired, dead, other languages) 302 156
Busy/No answer/Answering machine 404 250 Disconnected/ Telephone problems 530 699 Enrollee not at number 663 727 TOTAL PHONE NUMBERS ATTEMPTED 2500 2411 Percent of phone numbers resulting in an interview 21% 21%
Cooperation rate (eligible contacts who participated) 86% 88%
Thus about 21% percent of the telephone numbers attempted resulted in an interview. The biggest barrier to participation was the viability of the telephone numbers; a significant number of respondents were not at the listed phone number, or it had been disconnected. Overwhelmingly, those eligible respondents who were contacted were willing to complete the interview, with cooperation rates of 72-80% as calculated with AAPOR Cooperation Rate 3.3 3 The American Association for Public Opinion Research (2000) Standard Definitions: Final Dispositions of Case Codes and Outcome Rates for Surveys.
Evaluating Florida’s Medicaid PSN Demonstration Project 13 Patient Experience Analyses Final Report, June 2004
Data Quality Issues It should be noted that this study shares the limitations of all survey research, including the bias inherent in self-report. Virtually all measures in the survey reflect enrollees’ perceptions about their care. A respondent who reports long delays in receiving care, for example, is reporting his or her perception of the delay, not an empirically verifiable fact of such delays. And while every item in the survey asks about their care “now” or in the last six months, if enrollees have not changed providers, they may mentally blur together all their care in that setting. Take the example of an enrollee who has been seeing the same physician under MediPass for three years but transferred over to the PSN in March 2000 when his/her doctor joined the PSN. The survey may carefully ask about getting a referral to a specialist in the last 6 months. But instead of accurately isolating only that time period, the respondent may report on their experience in general, during all the time the respondent has seen that provider. The standard errors and response frequencies (sample size) for all items are given in Appendix A. When there are fewer than 80 responses to an item, the results are not displayed in the “Findings” section of the main report, but are included in Appendix A. During the time period in which these surveys took place, the Medicaid program was also conducting enrollee satisfaction surveys of Medicaid HMO recipients. It might, therefore, be informative to add a third point of comparison – looking at PSN, MediPass and HMO enrollees. Obviously, any comparison would have to be limited to HMO enrollees in Miami-Dade and Broward Counties, since the PSN and MediPass surveys are limited to those communities. There are, however, significant questions about comparability with the HMO survey data.
Specific issues of comparability range from sample design to implementation and instrumentation. While the PSN and MediPass sample designs were planned for this particular study, the HMO cases were part of a larger statewide design; therefore, the cases that happened to fall into the two counties of interest are not, strictly speaking, a probability sample of Medicaid HMO enrollees in those counties. Since the PSN/MediPass instrument and that of the 2001 HMO study were developed independently, there are slight differences in the questionnaires. The ordering of some questions is slightly different, and about eight items that are asked in the PSN study were not included in the HMO instrument. Further, the HMO study did not include interviews in Creole.
As a consequence of these limitations on comparability, the main focus of this report is the PSN/MediPass comparison. The HMO data, where reasonably comparable, are provided in Appendix A for those readers who are interested in that comparison. Interpretative caution is recommended.
In preparing this report, the research team observed some discrepancies in the demographic attributes noted here and the distribution of those characteristics in the Medicaid database.
Evaluating Florida’s Medicaid PSN Demonstration Project Patient Experience Analyses
Final Report, June 2004
14
The seeming discrepancy regarding “race” is the most obvious. It may arise in part from inconsistencies between the racial codes reported for Medicaid and the race/ethnicity that was self-reported by respondents in our telephone survey. In fact, about 34% of the PSN respondents and 37% of the MediPass respondents reported a different race code in our survey than is in their Medicaid file. Most of these cases involved people who reported being Hispanic on our survey, but were identified otherwise (most often “other”) in the Medicaid database. Individuals who reported being Hispanic on our survey accounted for 68% of the PSN mismatches, and 90% of the MediPass mismatches. Part of this difference may exist because the survey questionnaire allowed race and ethnicity to be reported separately, first asking whether the respondent was Hispanic, and then asking about race. Or it may be that a Medicaid intake worker coded the race/ethnicity that the person appeared to be, while the survey allowed for self-identification. The survey followed current guidelines used by the Census Bureau, allowing respondents to report multiple races. However, few respondents took advantage of that opportunity. Those cases do not account for the apparent discrepancies since there were only four in the PSN sample and one in the MediPass (and that particular person was Hispanic, which took precedence for reporting race/ethnicity). Another potential source of discrepancy is that at each step in the sampling process, a slight amount of divergence was introduced, as outlined in the table below.
It should be understood that the rates of attributes other than race observed in the two samples described in this report may also differ from their counterpart measures in the Medicaid database. Such differences do not constitute “errors.” For the most part, they simply reflect the composition of lists that emerge at various stages of any multi-stage sampling procedure.
An example of this process (as it applies to race) is provided in the following table. The column labeled “racial breakdown” is derived from the Medicaid database.
This table outlines the steps to achieve the pool of phone numbers from which the actual phone numbers to be dialed were randomly selected. But the multi-stage process of getting from a full population to the final sample essentially continues after dialing the phone number, as reported in Table 2. For the PSN sample, we had a pool of 5,537 phone numbers. Of those, we had to dial about 2,500 phone numbers to reach our target of 500 interviews. The pattern of outcomes from that step may also affect the observed racial distribution, if certain racial groups are more likely to have interrupted phone service or greater mobility so that they are less likely to be living at the listed phone number.

Evaluating Florida’s Medicaid PSN Demonstration Project 15 Patient Experience Analyses Final Report, June 2004
Table 3
PSN MediPass Enrollment Racial
Breakdown Enrollment Racial
Breakdown Step 1 Total
Miami-Dade/ Broward Enrollees as of 3/31/01
24,250 White 7.6% Black 50.9% Hisp. 30.5% OTHER 11.0%
153,359 White 11.3% Black 27.1% Hisp. 45.5% OTHER 16.1%
Step 2 Enrollees with phone numbers
~19,400 White 7.9% Black 51.2% Hisp. 28.6% OTHER 12.2%
~124,221 White 12.0% Black 26.9% Hisp. 43.1% OTHER 17.8%
Step 3 Adults age 18 or older as of 5/31/01
(7,387) White 11.7% Black 47.1% Hisp. 19.9% OTHER 21.2%
(45,142) White 18.8% Black 22.1% Hisp. 24.2% OTHER 34.7%
Step 4 Adults continuously enrolled in the PSN for a period of 4 or more months from the date of the sample (since the sample was pulled a few months in advance of the fieldwork, all respondents had been enrolled for 6 months at the time the survey was actually conducted).
6,464 (5,759)
White 12.1% Black 48.9% Hisp. 15.4% OTHER 23.5%
43,990 (38,614)
White 19.5% Black 21.4% Hisp. 21.8% OTHER 37.0%
Step 5 Deleted multiple family members/multiple entries with the same address
(5,537) White 12.0% Black 49.1% Hisp. 14.8% OTHER 24.1%
(35,017) White 19.7% Black 21.5% Hisp. 20.8% OTHER 37.8%
Notes: Numbers in parentheses are from Florida Medicaid (they are NOT negative numbers).
Step 2. Phone numbers were missing for 20% of PSN and 19% of MediPass enrollees. Step 3. Only adults were interviewed; we used the adult CAHPS Medicaid module and IRB approval was for adults only. Had the interviews been spread out among both adults and children, the cell sizes would have been very small. At the request of the Agency, we may focus on children in a later survey, but for the first pass, we started with adults only.

Evaluating Florida’s Medicaid PSN Demonstration Project Patient Experience Analyses
Final Report, June 2004
16
Step 4. Only those who had been continuously enrolled for six months at the time of interview were included in the study. Since most enrollees stay with their provider, PSN enrollment patterns are determined in part by a provider’s decision to switch into the PSN. Thus enrollment is not uniform over time, but involves mass transfers of many patients when a provider switches to the PSN. Reinstatements into the PSN were not incorporated. Step 5. Deleting duplicate addresses helped ensure that households were not sampled more than once.
Key Findings: PSN and MediPass
2001 Survey

Evaluating Florida’s Medicaid PSN Demonstration Project 19 Patient Experience Analyses Final Report, June 2004
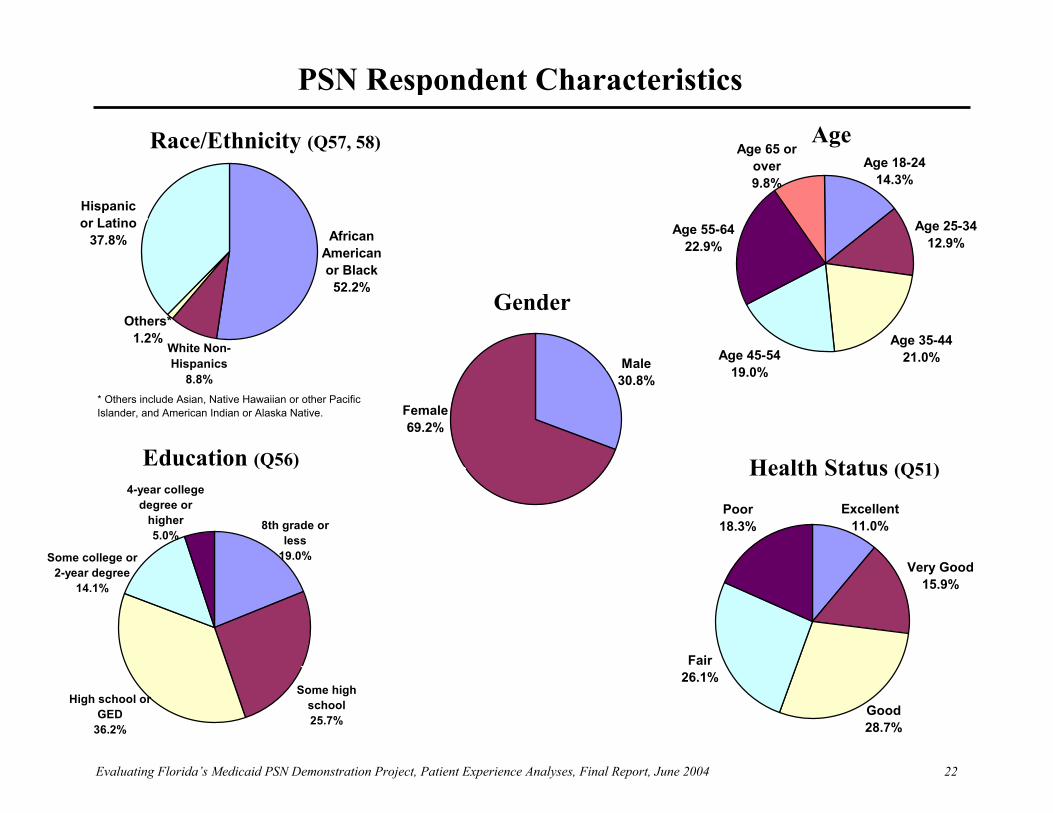
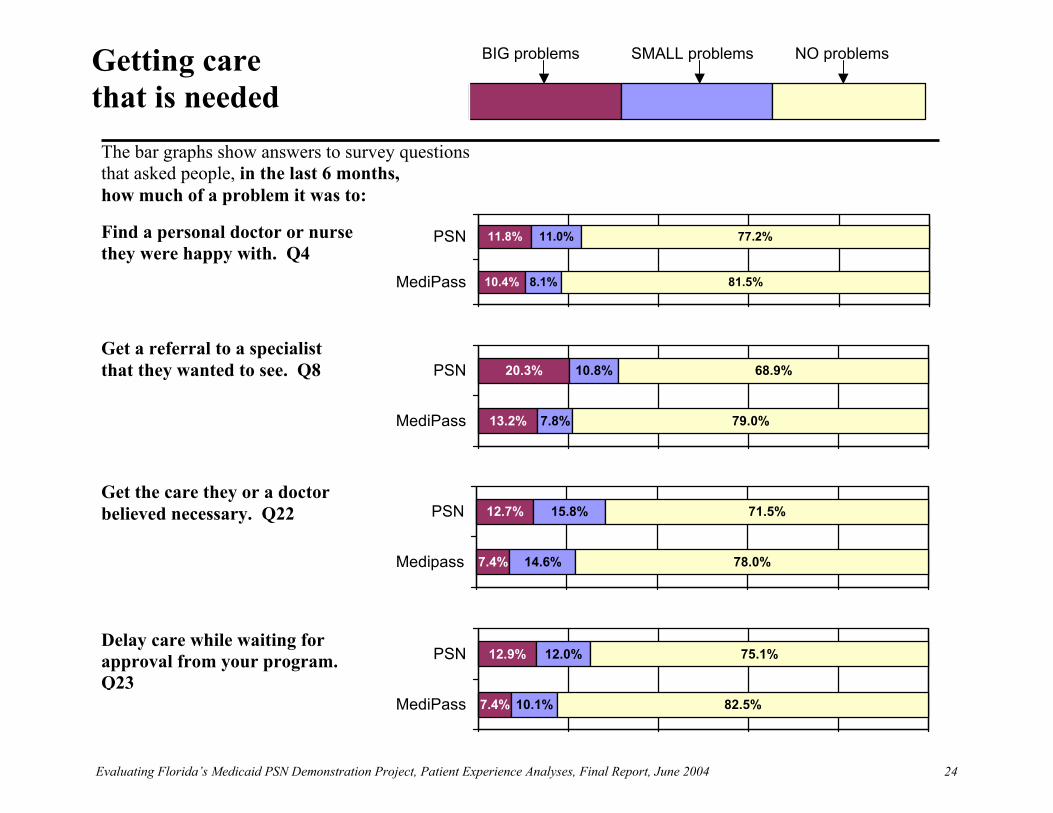
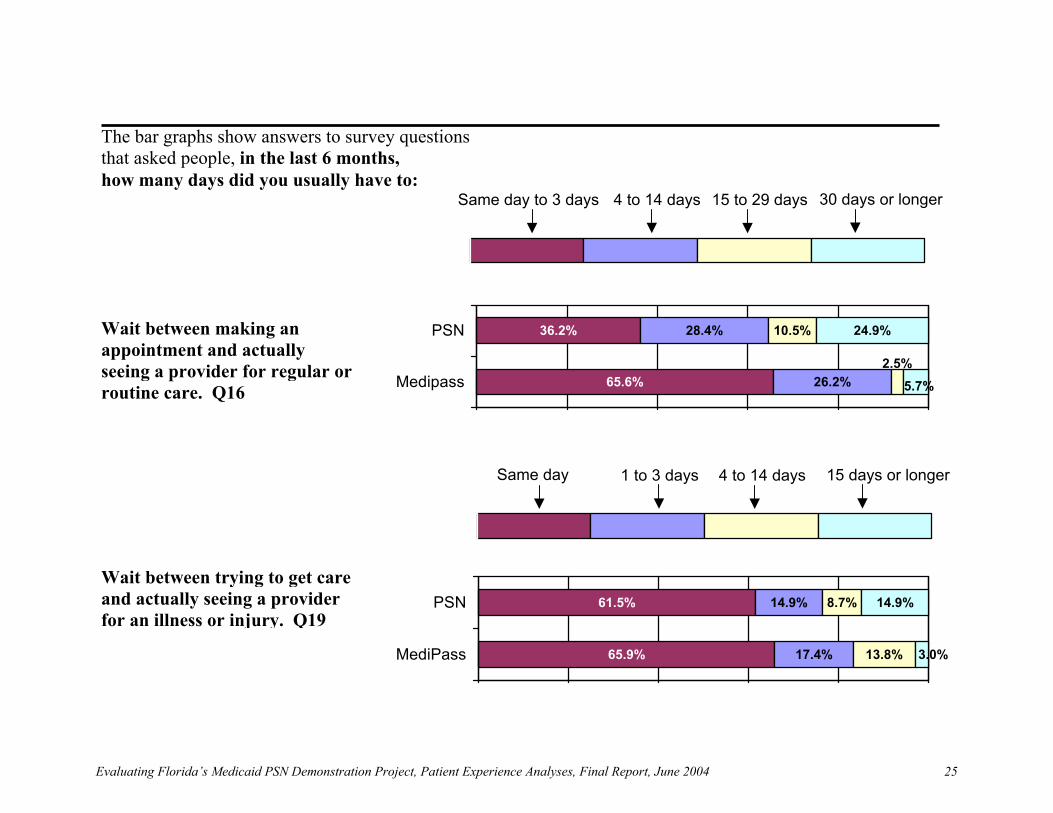
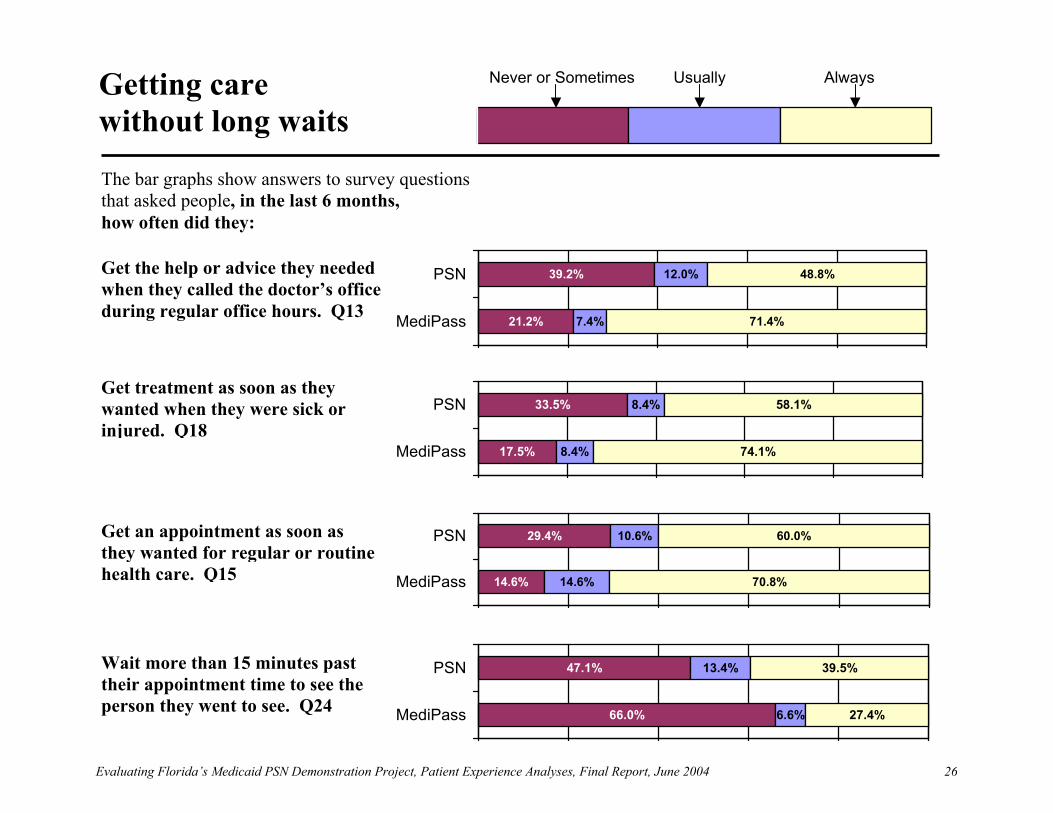
Respondent Characteristics Most respondents for both surveys were Black or Hispanic. Black respondents were the largest group in the PSN (52.2%), while Hispanics were the majority (54.4%) in the MediPass sample. Since adult Medicaid recipients are overwhelmingly female, it is not surprising that our sample was also mostly female, including 69.2% of respondents in the PSN and 83.4% of MediPass respondents. There were very similar patterns in education level in both groups, with almost half of respondents reporting less than a high school diploma, and a minority reporting any college. There were similar distributions of health status, with just over 18% reporting “Poor” health and another half of respondents reporting “Fair/Good.” Getting Care That Is Needed Overwhelmingly, most respondents from both groups reported that they have “No problems” getting care. There are similar rates of having “No problems” on the issue of finding a personal doctor or nurse they were happy with, and for getting the care that they or a doctor believed necessary. There were some slight differences when it came to getting a referral to a specialist, with 79.0% of MediPass enrollees reporting “No problems,” while 68.9% of PSN enrollees reported “No problems.” About 20.3% of PSN enrollees reported such referrals caused “Big problems,” while only 13.2% of MediPass enrollees reported “Big problems” getting a referral. This may be due to the time necessary to work out continuity-of-care issues following a plan change. This same issue (time lag due to program requirements) may also explain differences in responses to the question about delaying care while waiting for approval from the program: 82.5% of MediPass respondents said there were “No problems” while 75.1% of PSN enrollees reported “No problems.” There were some differences in the reported wait between making an appointment and actually seeing a provider for regular or routine care, with 36.2% of PSN respondents reporting that they could be seen within three days, while 65.6% of MediPass respondents reported being seen within three days. The two groups had similar waits between trying to get care and actually seeing a provider for an illness or injury, with 61.5% of PSN and 65.9% of MediPass respondents getting care the same day they first sought care. Getting Care Without Long Waits There were some differences in the percentage of respondents who said they could get the help or advice they needed when they called the doctor’s office during regular office hours. Specifically, 48.8% of PSN and 71.4% of MediPass respondents reported “Always” getting that help.
Evaluating Florida’s Medicaid PSN Demonstration Project Patient Experience Analyses
Final Report, June 2004
20
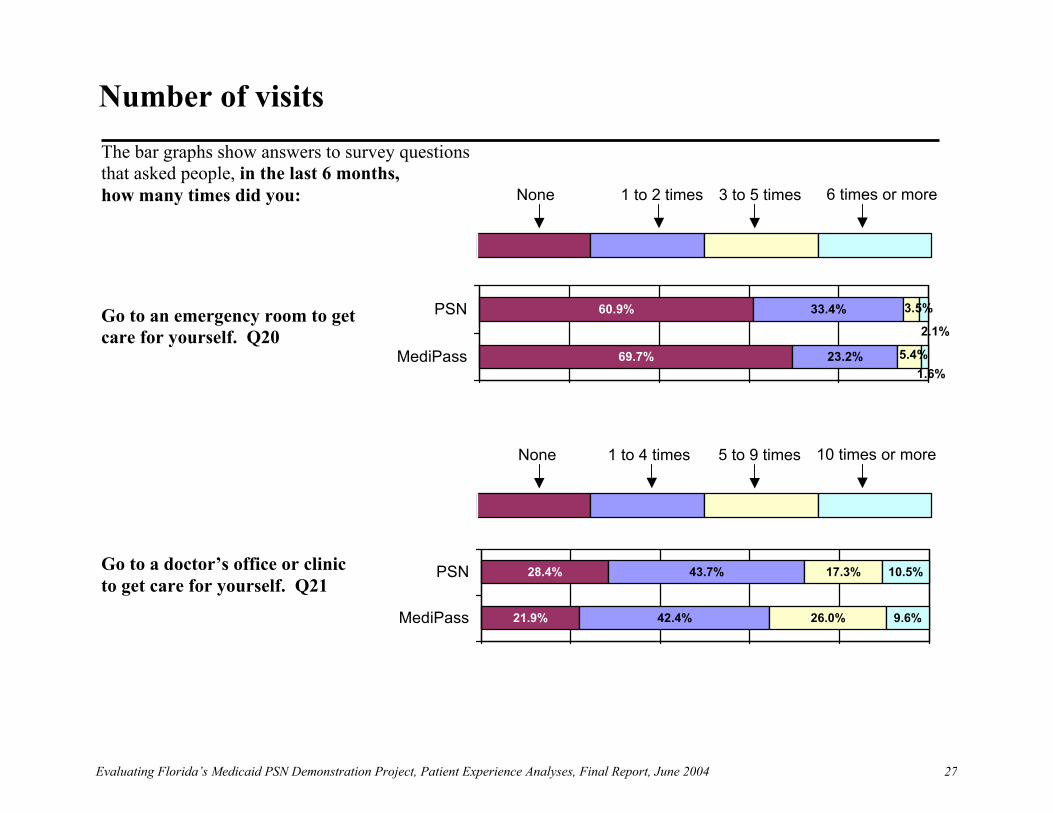
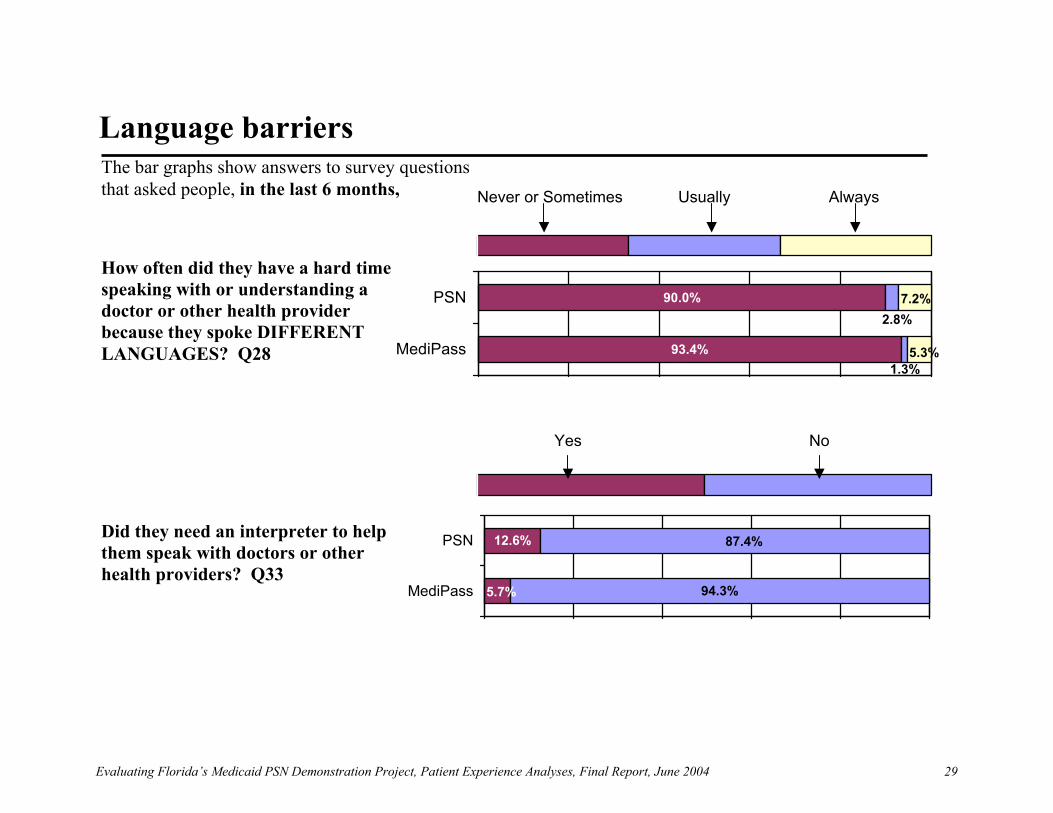
When it came to getting treatment as soon as they wanted when they were sick or injured, 58.1% of PSN and 74.1% of MediPass respondents said they “Always” got the care as soon as they wanted. For routine care, about 60% of PSN and 70.8% of MediPass respondents said they “Always” got an appointment as soon as they wanted. About 39.5% of PSN and 27.4% of MediPass respondents reported that they “Always” had to wait more than 15 minutes past their appointment time to see their health care provider. Number of visits Both samples showed similar patterns of health care utilization in the last 6 months. About 5.6% of PSN and 7.0% of MediPass respondents had 3 or more visits to the emergency room. About 39.1% of PSN and 30.3% of MediPass respondents had at least one visit to the ER, and for those reporting at least one ER visit, the mean number of visits was 1.96 for the PSN and 2.19 for MediPass. About 71.6% of PSN and 78.1% of MediPass respondents had at least one visit to a doctor’s office or clinic. How Well Doctors Communicate Overwhelmingly, patients in both plans felt that their health care provider listened carefully to them, explained things in a way they could understand, and showed respect for what they had to say. The lowest scores were on the issue of whether doctors “spent enough time” with them, but even there, 70.2% of PSN and 73.5% of MediPass respondents said the doctor “Always” spent enough time with them. Language Barriers Only a small minority of respondents (7.2% for PSN and 5.3% for MediPass) said that they “Always” had a hard time speaking with or understanding a health care provider because they spoke different languages. This low rate might be due, in part, to the bias of a telephone survey, in that some of the patients who had problems understanding might also have been unable to participate in a phone survey. About 12.6% of PSN and 5.7% of MediPass respondents said that they needed an interpreter to help them speak with doctors. How People Rated Their Health Care and Providers When asked to give a rating from 0 to 10 to their personal doctor or nurse, specialist, and health care overall, most people in both programs gave the top rankings. The lowest ratings—which were still very favorable overall —were for rating “their health program now.” About 55.6% of PSN and 69.1% of MediPass respondents gave a rating of 9 or 10.

Evaluating Florida’s Medicaid PSN Demonstration Project 21 Patient Experience Analyses Final Report, June 2004
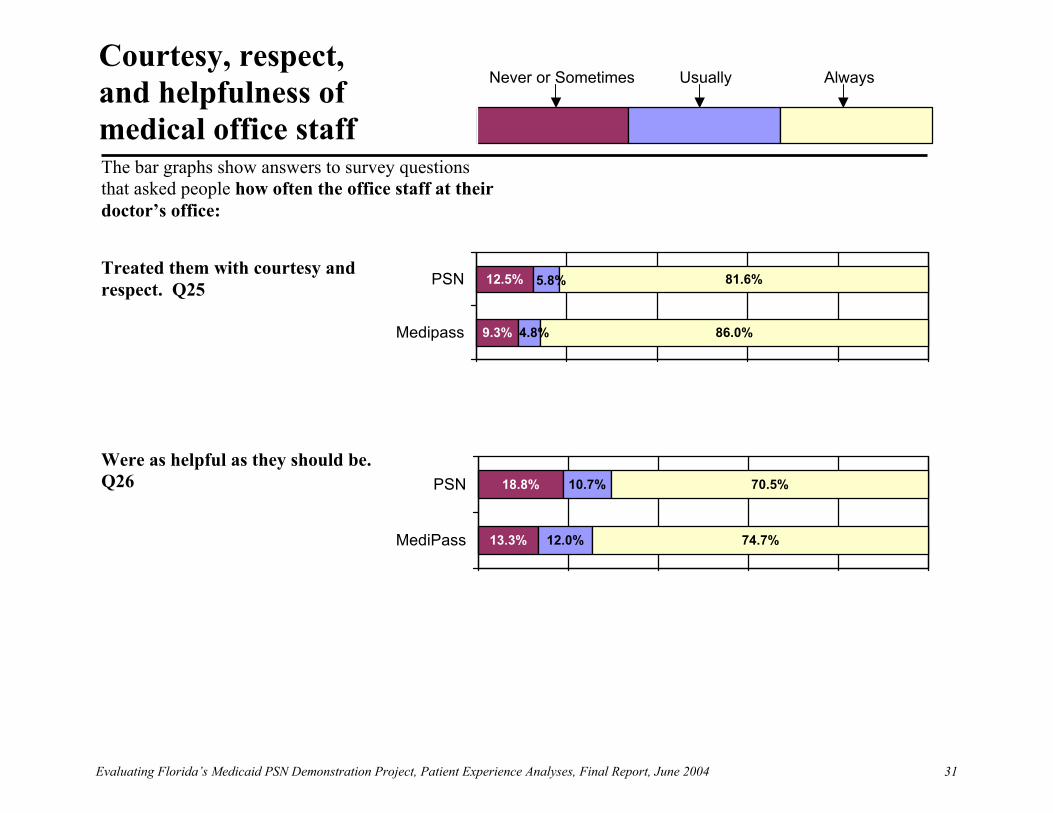
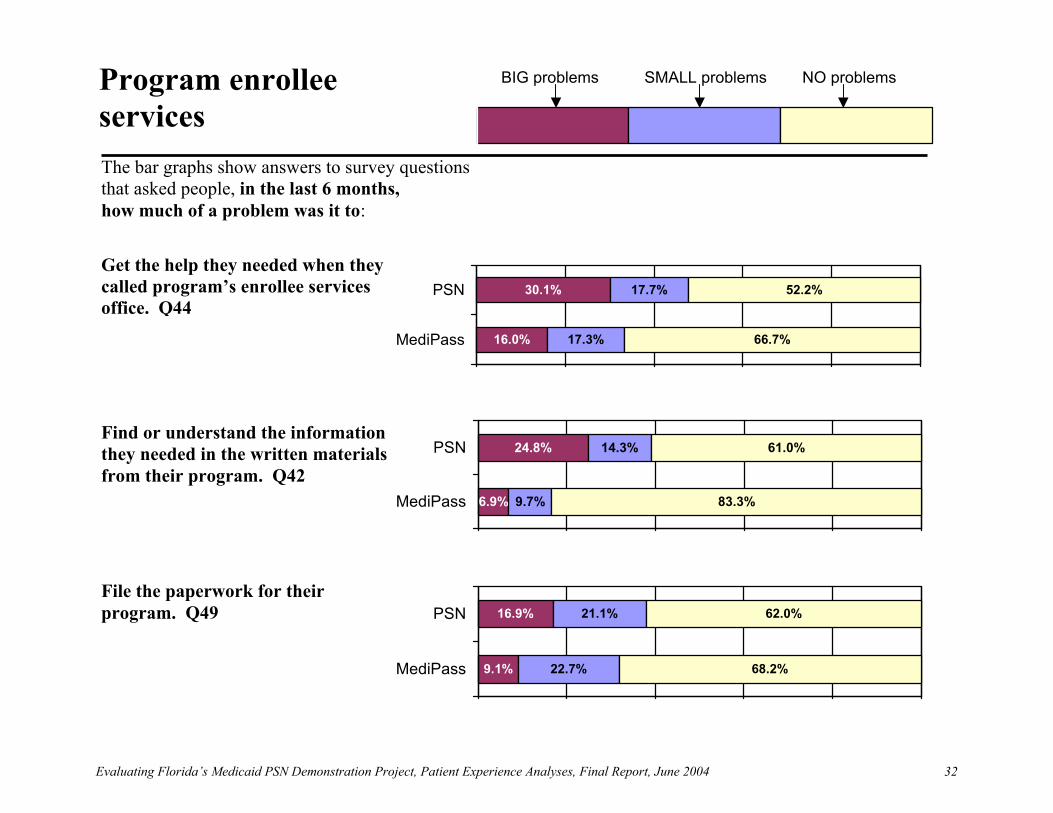
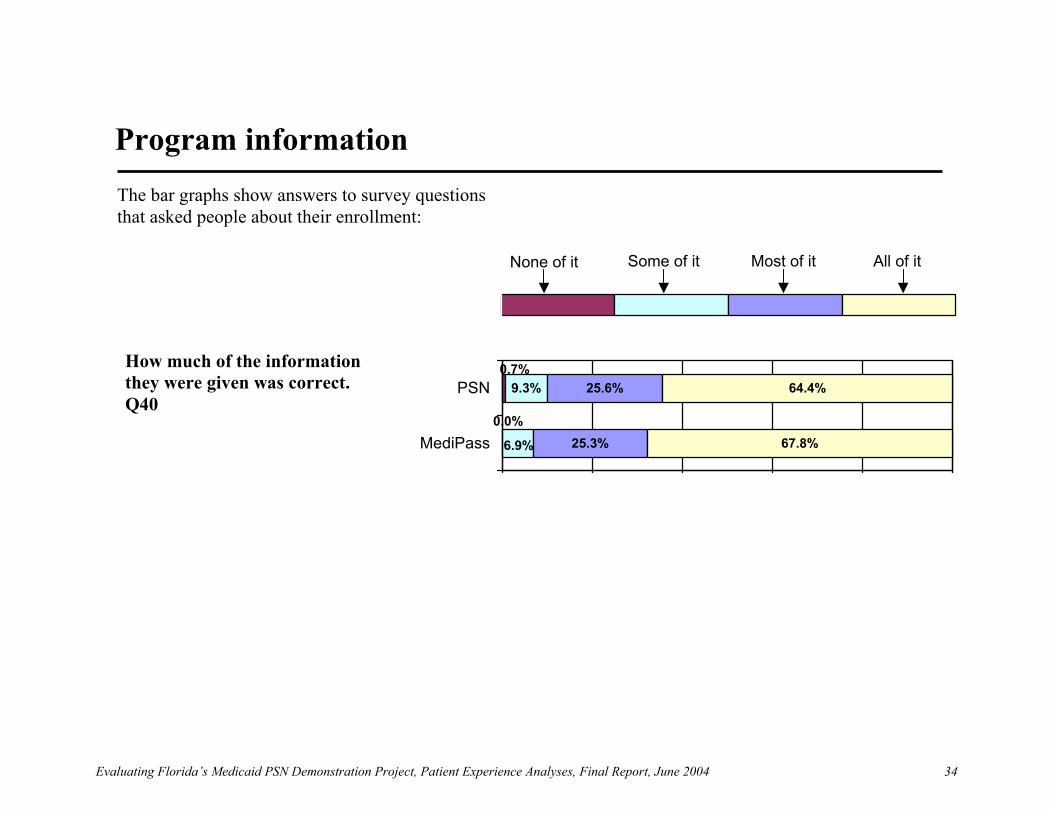
Courtesy, Respect and Helpfulness of Medical Office Staff Most respondents in both programs felt that office staff treated them with courtesy and respect, and were as helpful as they should be. About 81.6% of PSN and 86.0% of MediPass respondents reported that office staff “Always” treated them with respect and courtesy. Program Enrollee Service Most respondents reported “No problems” in getting the help they needed when they called the program’s enrollee service department or filed paperwork. There was a difference between the programs in that 39.1% of PSN and 16.6% of MediPass respondents reported some problems in finding or understanding the information they needed in the written materials from their program. Enrollment As expected, more MediPass enrollees had been in the program a year or longer (78.6%, compared to 65.7% for the PSN respondents). About half of respondents (55.0% for PSN and 50.2% for MediPass) reported that they did not choose the particular program, but had been told which program they were in. These findings for PSN enrollees are unexpected, since in fact almost all PSN enrollees were transitioned into the PSN with their primary care provider. However, they still could feel they had chosen the PSN if they read the materials, understood that they could choose a different provider, and perceived the decision to stay with their doctor as making a choice to change over to the PSN. Program Information Most respondents (64.4% for PSN and 67.8% for MediPass) found that all of the information they were given about their program proved to be correct based on their experience with the program. Complaints/Grievances About 9.1% of PSN and 3.6% of MediPass respondents reported that they had called or written their program with a complaint or grievance in the last 6 months. The rate for PSN enrollees may be slightly higher because they had more recently received information which explained the complaint procedures, at the time the PSN was initiated.
Evaluating Florida’s Medicaid PSN Demonstration Project, Patient Experience Analyses, Final Report, June 2004
22
Very Good15.9%
Fair26.1%
Poor18.3%
Excellent11.0%
Good28.7%
PSN Respondent Characteristics
Age 25-3412.9%
Age 35-4421.0%Age 45-54
19.0%
Age 55-6422.9%
Age 65 or over9.8%
Age 18-2414.3%
Others*1.2%
White Non-Hispanics
8.8%
Hispanic or Latino
37.8% African American or Black
52.2%
* Others include Asian, Native Hawaiian or other Pacific Islander, and American Indian or Alaska Native.
8th grade or less
19.0%
4-year college degree or
higher5.0%
High school or GED
36.2%
Some college or 2-year degree
14.1%
Some high school25.7%
Race/Ethnicity (Q57, 58) Age
Male30.8%
Female69.2%
Health Status (Q51)Education (Q56)
Gender

Evaluating Florida’s Medicaid PSN Demonstration Project, Patient Experience Analyses, Final Report, June 2004
23
African American
40.9%Hispanic or Latino
54.4%
Others*0.2%
White Non-Hispanic
4.4%
* Others include Asian, Native Hawaiian or other Pacific Islander, and American Indian or Alaska Native.
Excellent17.5%
Poor18.7%
Good25.7%
Fair23.9%
Very good14.1%
MediPass Respondent Characteristics
Age 18-2430.1%
Age 25-3411.8%
Age 35-4425.9%
Age 45-5417.6%
Age 55-6413.2%
Age 65 or over 1.4%
8th grade or less
15.8%
4-year degree or higher3.2%
High school or GED
38.4%
Some college or 2-year degree
12.6%
Some high school30.0%
Race/Ethnicity (Q57, 58) Age
Male16.6%
Female83.4%
Health Status (Q51)Education (Q56)
Gender
Evaluating Florida’s Medicaid PSN Demonstration Project, Patient Experience Analyses, Final Report, June 2004
24
BIG problems SMALL problems NO problems
0% 20% 40% 60% 80% 100%
Find a personal doctor or nurse they were happy with. Q4
10.4%
11.8%
8.1%
11.0%
81.5%
77.2%
0% 20% 40% 60% 80% 100%
MediPass
PSN
Get a referral to a specialist that they wanted to see. Q8
Get the care they or a doctor believed necessary. Q22
Delay care while waiting for approval from your program. Q23
13.2%
20.3%
7.8%
10.8%
79.0%
68.9%
0% 20% 40% 60% 80% 100%
MediPass
PSN
7.4%
12.7%
14.6%
15.8%
78.0%
71.5%
0% 20% 40% 60% 80% 100%
Medipass
PSN
7.4%
12.9%
10.1%
12.0%
82.5%
75.1%
0% 20% 40% 60% 80% 100%
MediPass
PSN
The bar graphs show answers to survey questions that asked people, in the last 6 months, how much of a problem it was to:
Getting care that is needed
Evaluating Florida’s Medicaid PSN Demonstration Project, Patient Experience Analyses, Final Report, June 2004
25
0% 20% 40% 60% 80% 100%
Same day 1 to 3 days 4 to 14 days 15 days or longer
65.9%
61.5%
17.4%
14.9%
13.8%
8.7% 14.9%
3.0%
0% 20% 40% 60% 80% 100%
MediPass
PSN
0% 20% 40% 60% 80% 100%
Wait between making an appointment and actually seeing a provider for regular or routine care. Q16
65.6%
36.2%
26.2%
28.4% 24.9%10.5%
2.5%5.7%
0% 20% 40% 60% 80% 100%
Medipass
PSN
Wait between trying to get care and actually seeing a provider for an illness or injury. Q19
The bar graphs show answers to survey questions that asked people, in the last 6 months, how many days did you usually have to:
Same day to 3 days 4 to 14 days 15 to 29 days 30 days or longer
Evaluating Florida’s Medicaid PSN Demonstration Project, Patient Experience Analyses, Final Report, June 2004
26
Never or Sometimes Usually Always
0% 20% 40% 60% 80% 100%
Getting care without long waits
Get the help or advice they needed when they called the doctor’s office during regular office hours. Q13
21.2%
39.2%
7.4%
12.0%
71.4%
48.8%
0% 20% 40% 60% 80% 100%
MediPass
PSN
Get treatment as soon as they wanted when they were sick or injured. Q18
Get an appointment as soon as they wanted for regular or routine health care. Q15
Wait more than 15 minutes past their appointment time to see the person they went to see. Q24
17.5%
33.5%
8.4%
8.4%
74.1%
58.1%
0% 20% 40% 60% 80% 100%
MediPass
PSN
14.6%
29.4%
14.6%
10.6%
70.8%
60.0%
0% 20% 40% 60% 80% 100%
MediPass
PSN
66.0%
47.1%
6.6%
13.4%
27.4%
39.5%
0% 20% 40% 60% 80% 100%
MediPass
PSN
The bar graphs show answers to survey questions that asked people, in the last 6 months, how often did they:
Evaluating Florida’s Medicaid PSN Demonstration Project, Patient Experience Analyses, Final Report, June 2004
27
0% 20% 40% 60% 80% 100%
0% 20% 40% 60% 80% 100%
Go to an emergency room to get care for yourself. Q20
69.7%
60.9%
23.2%
33.4% 3.5%
5.4%1.6%
2.1%
0% 20% 40% 60% 80% 100%
MediPass
PSN
Go to a doctor’s office or clinic to get care for yourself. Q21
21.9%
28.4%
42.4%
43.7%
26.0%
17.3%
9.6%
10.5%
0% 20% 40% 60% 80% 100%
MediPass
PSN
The bar graphs show answers to survey questions that asked people, in the last 6 months, how many times did you:
Number of visits
None 1 to 2 times 3 to 5 times 6 times or more
None 1 to 4 times 5 to 9 times 10 times or more

Evaluating Florida’s Medicaid PSN Demonstration Project, Patient Experience Analyses, Final Report, June 2004
28
Never or Sometimes Usually Always
0% 20% 40% 60% 80% 100%
How well doctors communicate
Listened carefully to them. Q27
9.5%
13.4% 8.4%
85.4%
78.2%
5.0%
0% 20% 40% 60% 80% 100%
MediPass
PSN
Explained things in a way they could understand. Q29
Showed respect for what they had to say. Q30
Spent enough time with them. Q31
14.9%
15.2% 8.7%
80.1%
76.1%
5.0%
0% 20% 40% 60% 80% 100%
MediPass
PSN
8.5%
9.2% 8.7%
86.2%
82.1%
5.3%
0% 20% 40% 60% 80% 100%
MediPass
PSN
14.9%
18.3%
11.7%
11.5%
73.5%
70.2%
0% 20% 40% 60% 80% 100%
MediPass
PSN
The bar graphs show answers to survey questions that asked people how often their doctor or other health provider:
Evaluating Florida’s Medicaid PSN Demonstration Project, Patient Experience Analyses, Final Report, June 2004
29
Never or Sometimes Usually Always
Yes No
0% 20% 40% 60% 80% 100%
0% 20% 40% 60% 80% 100%
How often did they have a hard time speaking with or understanding a doctor or other health provider because they spoke DIFFERENT LANGUAGES? Q28 93.4%
90.0%2.8%
1.3%
7.2%
5.3%
0% 20% 40% 60% 80% 100%
MediPass
PSN
Did they need an interpreter to help them speak with doctors or other health providers? Q33
12.6%
94.3%5.7%
87.4%
0% 20% 40% 60% 80% 100%
MediPass
PSN
The bar graphs show answers to survey questions that asked people, in the last 6 months,
Language barriers

Evaluating Florida’s Medicaid PSN Demonstration Project, Patient Experience Analyses, Final Report, June 2004
30
Rating of 6 or lower Rating of 7 or 8 Rating of 9 or 10
0% 20% 40% 60% 80% 100%
How people rated their health care and providers
Rate their personal doctor or nurse now. Q6
8.4%
12.6%
15.5%
81.5%
76.1%
5.9%
0% 20% 40% 60% 80% 100%
MediPass
PSN
Rate the specialist they saw most often in the last 6 months, including a personal doctor if he or she is a specialist. Q10
Rate all their health care in the last 6 months from all doctors and other health providers. Q32
Rate their health program now. Q50
8.0%
12.5%
11.8%
14.3%
80.2%
73.2%
0% 20% 40% 60% 80% 100%
MediPass
PSN
10.3%
10.7%
17.5%
24.8%
72.2%
64.5%
0% 20% 40% 60% 80% 100%
MediPass
PSN
14.7%
23.9%
16.2%
20.4%
69.1%
55.6%
0% 20% 40% 60% 80% 100%
MediPass
PSN
The bar graphs show answers to survey questions that asked people the rating of the following on a scale of 10:
0=“the worst experience possible” to 10=“the best experience possible”
Evaluating Florida’s Medicaid PSN Demonstration Project, Patient Experience Analyses, Final Report, June 2004
31
Always Never or Sometimes Usually
0% 20% 40% 60% 80% 100%
Courtesy, respect, and helpfulness of medical office staff
Treated them with courtesy and respect. Q25
9.3%
12.5%
86.0%
81.6%
4.8%
5.8%
0% 20% 40% 60% 80% 100%
Medipass
PSN
Were as helpful as they should be. Q26
13.3%
18.8%
12.0%
10.7%
74.7%
70.5%
0% 20% 40% 60% 80% 100%
MediPass
PSN
The bar graphs show answers to survey questions that asked people how often the office staff at their doctor’s office:
Evaluating Florida’s Medicaid PSN Demonstration Project, Patient Experience Analyses, Final Report, June 2004
32
NO problems BIG problems SMALL problems
0% 20% 40% 60% 80% 100%
Get the help they needed when they called program’s enrollee services office. Q44
16.0%
30.1%
17.3%
17.7%
66.7%
52.2%
0% 20% 40% 60% 80% 100%
MediPass
PSN
Find or understand the information they needed in the written materials from their program. Q42
File the paperwork for their program. Q49
6.9%
24.8%
9.7%
14.3%
83.3%
61.0%
0% 20% 40% 60% 80% 100%
MediPass
PSN
9.1%
16.9%
22.7%
21.1%
68.2%
62.0%
0% 20% 40% 60% 80% 100%
MediPass
PSN
The bar graphs show answers to survey questions that asked people, in the last 6 months, how much of a problem was it to:
Program enrollee services

Evaluating Florida’s Medicaid PSN Demonstration Project, Patient Experience Analyses, Final Report, June 2004
33
0% 20% 40% 60% 80% 100%
1 year or longer 6 Month or less More than 6 months but less than 1 year
They chose their program.They were told which program
they were in.
0% 20% 40% 60% 80% 100%
9.0%
12.1%
12.4%
22.2%
78.6%
65.7%
0% 20% 40% 60% 80% 100%
Medipass
PSN
49.8%
45.0%
50.2%
55.0%
0% 20% 40% 60% 80% 100%
MediPass
PSN
How many months have they been in this program. Q37
Did they choose this program or were they told which program they were in. Q38
The bar graphs show answers to survey questions that asked people about their enrollment:
Enrollment
Evaluating Florida’s Medicaid PSN Demonstration Project, Patient Experience Analyses, Final Report, June 2004
34
Most of it None of it All of it Some of it
0% 20% 40% 60% 80% 100%
9.3%
25.3%
25.6%
67.8%
64.4%
0.0%
0.7%
6.9%
0% 20% 40% 60% 80% 100%
MediPass
PSNHow much of the information they were given was correct. Q40
The bar graphs show answers to survey questions that asked people about their enrollment:
Program information

Evaluating Florida’s Medicaid PSN Demonstration Project, Patient Experience Analyses, Final Report, June 2004
35
Yes No
0% 20% 40% 60% 80% 100%
9.1%
96.4%3.6%
90.9%
0% 20% 40% 60% 80% 100%
MediPass
PSNIn the last 6 months, have they called or written their program with a complaint or problem? Q45
The bar graphs show answers to survey questions that asked people about their experience with the program in processing their complaint:
Complaints/ Grievances

Evaluating Florida’s Medicaid PSN Demonstration Project Patient Experience Analyses Final Report, June 2004
37
Discussion Overall, enrollees in both programs were satisfied with their care. Both the PSN and MediPass are seen positively as making a difference in the lives of enrollees. For the most part, survey respondents report that they get the health care they need when they need it, and in a manner that treats them with dignity. There were some modest but statistically significant differences between the two programs in perceptions of enrollees. In general, where there were differences, MediPass had the more positive scores. For example, PSN enrollees reported somewhat longer waits between making an appointment and seeing the health care provider. It is difficult to assess the impact of expectations on the results. The PSN enrollees had all been contacted in the last year or so, and informed about the change in the program in which they were enrolled. Since “new” is often equated with “improved,” they may have anticipated vast differences from other Medicaid programs, far beyond what was ever intended by the program planners and administrators. Lower scores may reflect unmet expectations rather than the actual performance of the PSN. In addition, some people are not be comfortable with change, and lower scores in part may be a reflection of these individuals’ unease with the new procedures, terminology and program. However, PSN enrollees indicate a lower level of satisfaction than their MediPass counterparts in every one of the 15 measures where a statistically significant difference is observed. Even though the magnitude of the differences is typically quite small, the consistency of direction needs attention.


Appendix A
Appendix A—Detailed results and standard errors for PSN, MediPass and Medicaid HMOs, 2001
Evaluating Florida’s Medicaid PSN Demonstration Project, Patient Experience Analyses, Final Report, June 2004
40
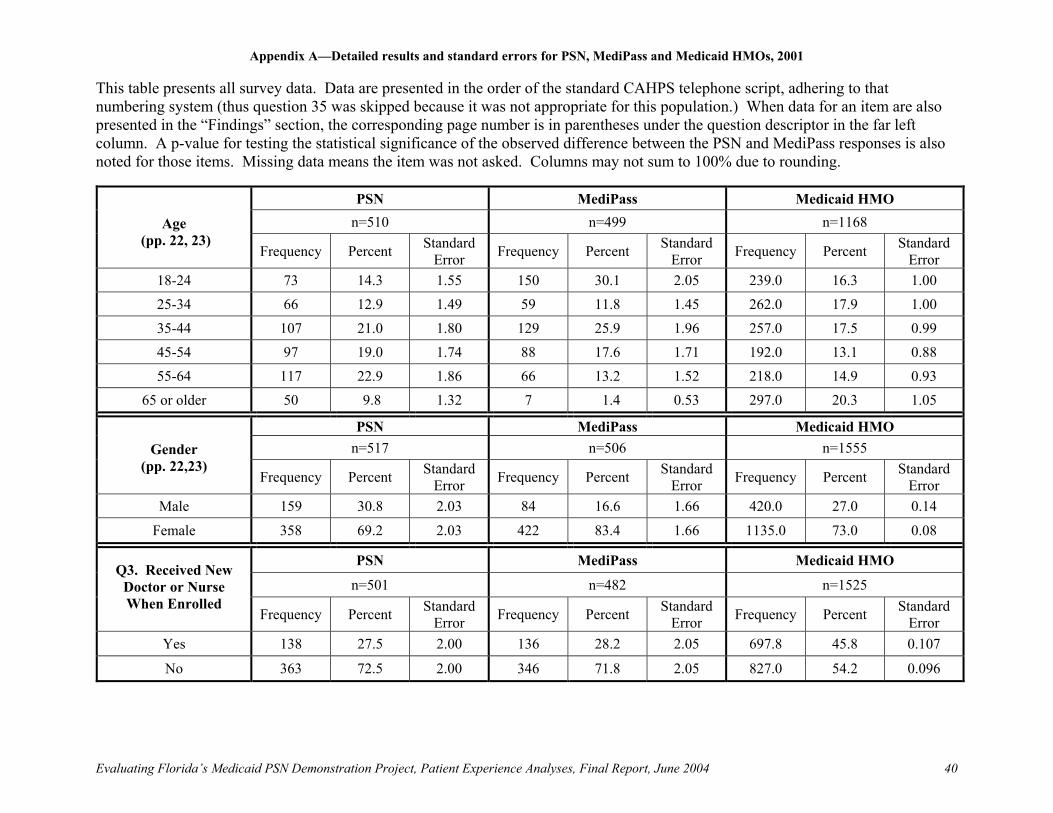
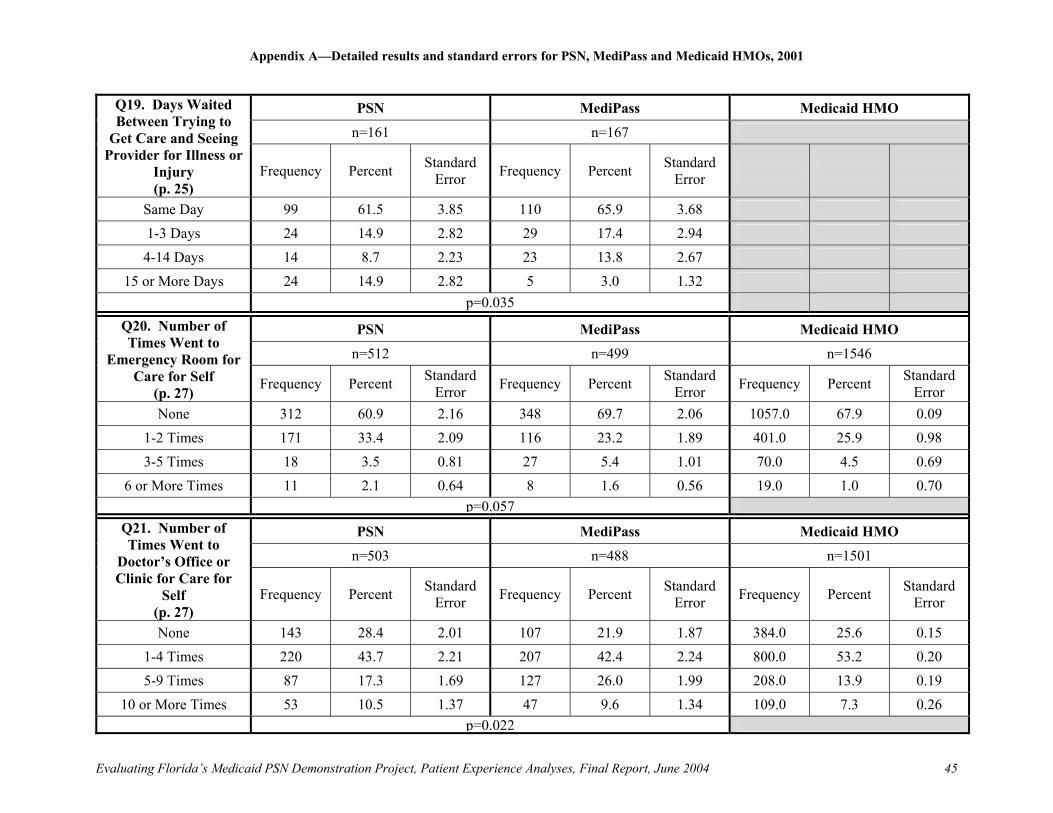
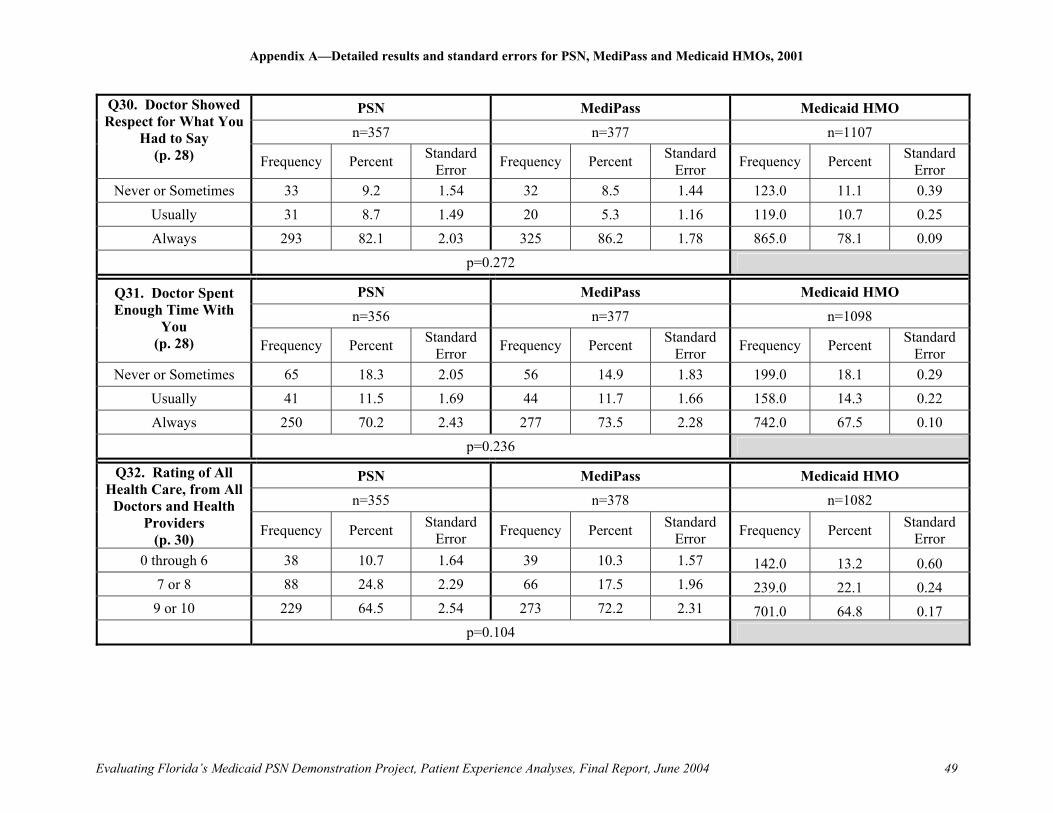
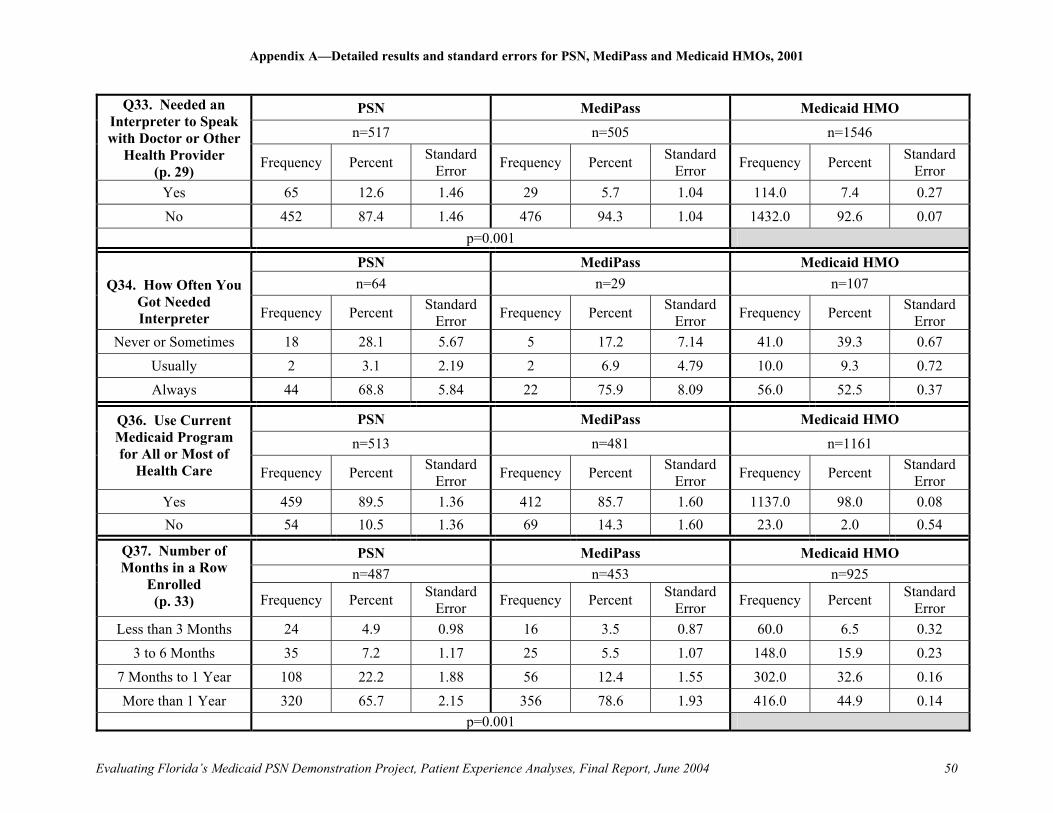
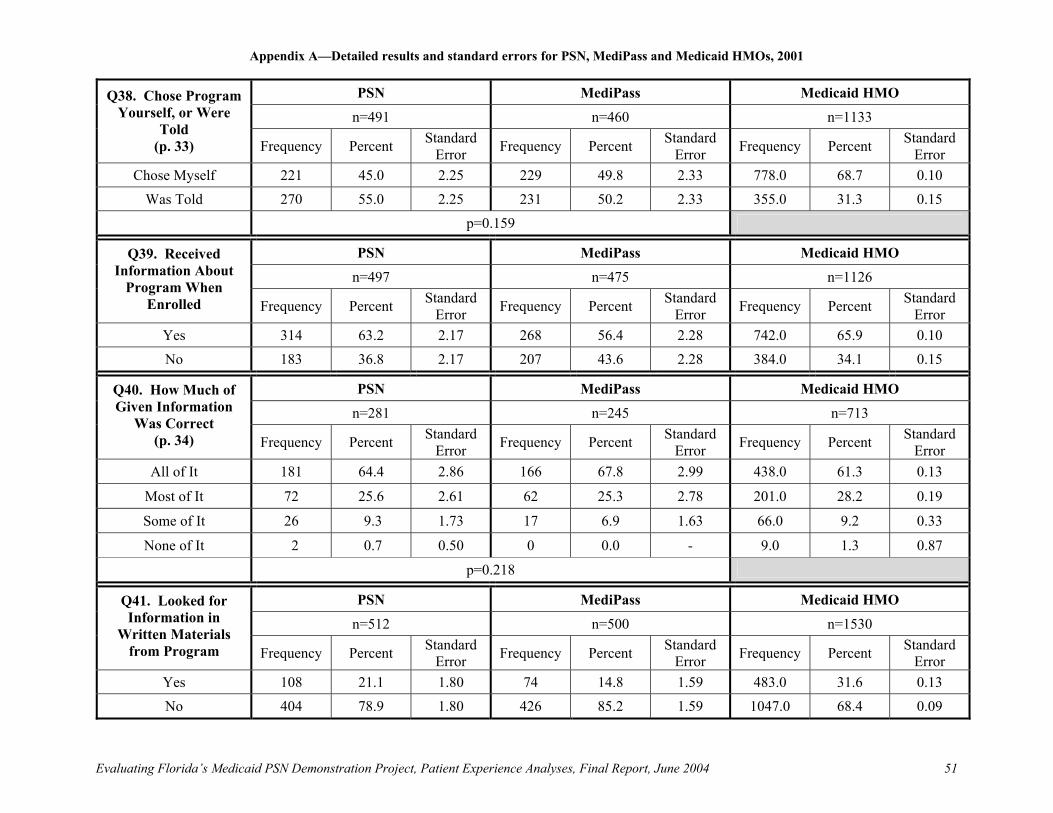
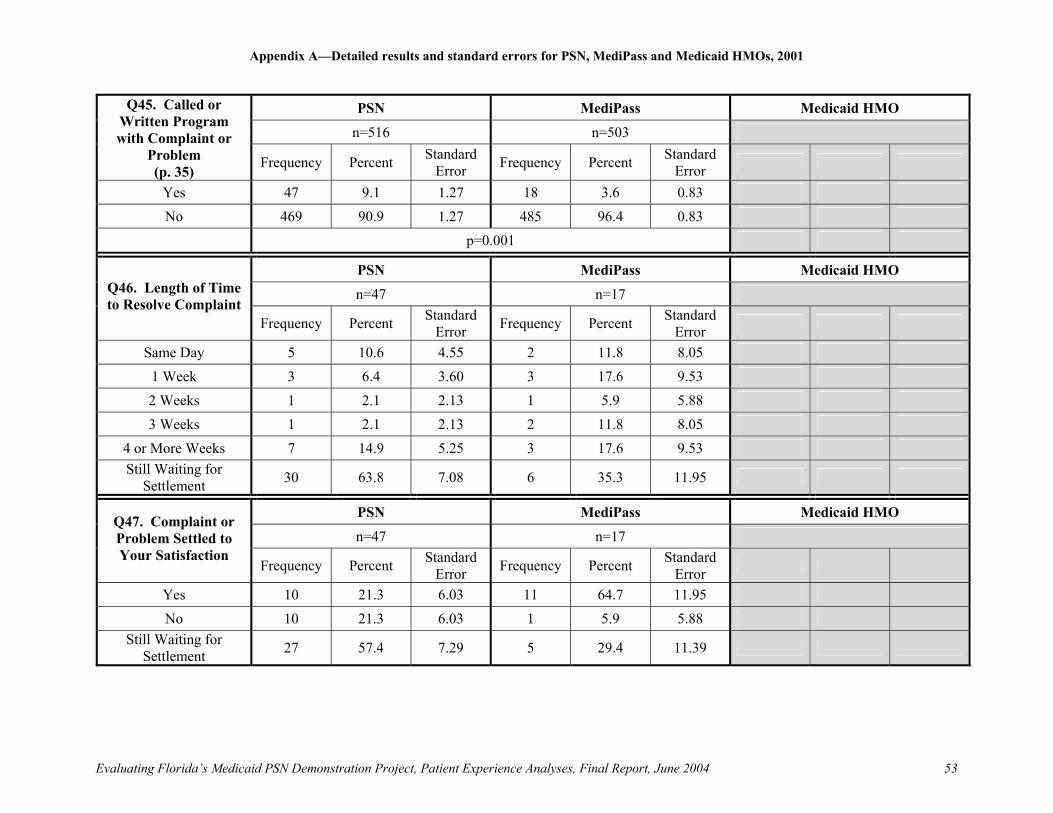
This table presents all survey data. Data are presented in the order of the standard CAHPS telephone script, adhering to that numbering system (thus question 35 was skipped because it was not appropriate for this population.) When data for an item are also presented in the “Findings” section, the corresponding page number is in parentheses under the question descriptor in the far left column. A p-value for testing the statistical significance of the observed difference between the PSN and MediPass responses is also noted for those items. Missing data means the item was not asked. Columns may not sum to 100% due to rounding.
PSN MediPass Medicaid HMO n=510 n=499 n=1168 Age
(pp. 22, 23) Frequency Percent Standard
Error Frequency Percent Standard Error Frequency Percent Standard
Error 18-24 73 14.3 1.55 150 30.1 2.05 239.0 16.3 1.00 25-34 66 12.9 1.49 59 11.8 1.45 262.0 17.9 1.00 35-44 107 21.0 1.80 129 25.9 1.96 257.0 17.5 0.99 45-54 97 19.0 1.74 88 17.6 1.71 192.0 13.1 0.88 55-64 117 22.9 1.86 66 13.2 1.52 218.0 14.9 0.93
65 or older 50 9.8 1.32 7 1.4 0.53 297.0 20.3 1.05
PSN MediPass Medicaid HMO n=517 n=506 n=1555 Gender
(pp. 22,23) Frequency Percent Standard
Error Frequency Percent Standard Error Frequency Percent Standard
Error Male 159 30.8 2.03 84 16.6 1.66 420.0 27.0 0.14
Female 358 69.2 2.03 422 83.4 1.66 1135.0 73.0 0.08
PSN MediPass Medicaid HMO
n=501 n=482 n=1525 Q3. Received New
Doctor or Nurse When Enrolled
Frequency Percent Standard Error Frequency Percent Standard
Error Frequency Percent Standard Error
Yes 138 27.5 2.00 136 28.2 2.05 697.8 45.8 0.107
No 363 72.5 2.00 346 71.8 2.05 827.0 54.2 0.096

Appendix A—Detailed results and standard errors for PSN, MediPass and Medicaid HMOs, 2001
Evaluating Florida’s Medicaid PSN Demonstration Project, Patient Experience Analyses, Final Report, June 2004
41
PSN MediPass Medicaid HMO
n=136 n=135 n=671 Q4. How Much of a Problem
to Get Satisfactory Doctor or
Nurse (p. 24)
Frequency Percent Standard Error Frequency Percent Standard
Error Frequency Percent Standard Error
Big Problem 16 11.8 2.77 14 10.4 2.63 72.3 10.8 0.31 Small Problem 15 11.0 2.70 11 8.1 2.36 45.9 6.8 0.41
No Problem 105 77.2 3.61 110 81.5 3.36 552.7 82.4 0.12 p=0.482
PSN MediPass Medicaid HMO n=513 n=504 n=1549 Q5. Has a Personal Doctor
or Nurse Frequency Percent Standard
Error Frequency Percent Standard Error Frequency Percent Standard
Error Yes 317 61.8 2.15 358 71.0 2.02 1147.0 73..7 0.84
No 196 38.2 2.15 146 29.0 2.02 408.0 26.3 0.13
PSN MediPass Medicaid HMO
n=310 n=356 n=1083 Q6. Rating of Personal
Doctor or Nurse (p. 30)
Frequency Percent Standard Error Frequency Percent Standard
Error Frequency Percent Standard Error
0 through 6 26 8.4 1.58 21 5.9 1.25 99.0 9.1 0.94 7 or 8 48 15.5 2.06 45 12.6 1.76 192.0 17.7 0.29 9 or 10 236 76.1 2.43 290 81.5 2.06 792.0 73.1 0.19
p=0.086
PSN MediPass Medicaid HMO
n=515 n=503 n=1540 Q7. Needed a Specialist
Frequency Percent Standard Error Frequency Percent Standard
Error Frequency Percent Standard Error
Yes 215 41.7 2.18 205 40.8 2.19 721.0 46.8 0.11 No 300 58.3 2.18 298 59.2 2.19 819.0 53.2 0.10
Appendix A—Detailed results and standard errors for PSN, MediPass and Medicaid HMOs, 2001
Evaluating Florida’s Medicaid PSN Demonstration Project, Patient Experience Analyses, Final Report, June 2004
42
PSN MediPass Medicaid HMO
n=212 n=205 n=712
Q8. How Much of a Problem to Get
Referral for Specialist (p. 24) Frequency Percent Standard
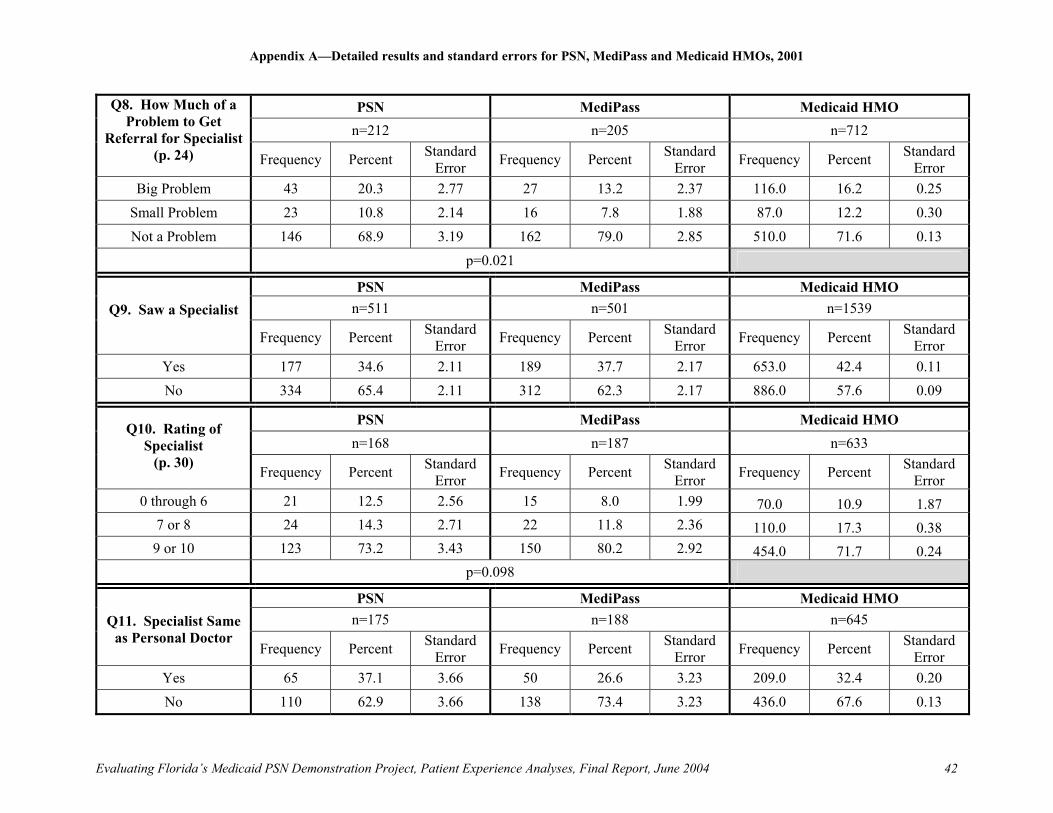
Error Frequency Percent Standard Error Frequency Percent Standard
Error Big Problem 43 20.3 2.77 27 13.2 2.37 116.0 16.2 0.25
Small Problem 23 10.8 2.14 16 7.8 1.88 87.0 12.2 0.30 Not a Problem 146 68.9 3.19 162 79.0 2.85 510.0 71.6 0.13
p=0.021
PSN MediPass Medicaid HMO n=511 n=501 n=1539 Q9. Saw a Specialist
Frequency Percent Standard Error Frequency Percent Standard
Error Frequency Percent Standard Error
Yes 177 34.6 2.11 189 37.7 2.17 653.0 42.4 0.11 No 334 65.4 2.11 312 62.3 2.17 886.0 57.6 0.09
PSN MediPass Medicaid HMO n=168 n=187 n=633
Q10. Rating of Specialist
(p. 30) Frequency Percent Standard
Error Frequency Percent Standard Error Frequency Percent Standard
Error 0 through 6 21 12.5 2.56 15 8.0 1.99 70.0 10.9 1.87
7 or 8 24 14.3 2.71 22 11.8 2.36 110.0 17.3 0.38 9 or 10 123 73.2 3.43 150 80.2 2.92 454.0 71.7 0.24
p=0.098
PSN MediPass Medicaid HMO n=175 n=188 n=645 Q11. Specialist Same
as Personal Doctor Frequency Percent Standard
Error Frequency Percent Standard Error Frequency Percent Standard
Error Yes 65 37.1 3.66 50 26.6 3.23 209.0 32.4 0.20 No 110 62.9 3.66 138 73.4 3.23 436.0 67.6 0.13

Appendix A—Detailed results and standard errors for PSN, MediPass and Medicaid HMOs, 2001
Evaluating Florida’s Medicaid PSN Demonstration Project, Patient Experience Analyses, Final Report, June 2004
43
PSN MediPass Medicaid HMO
n=515 n=501 n=1546 Q12. Called Doctor’s Office for Self During
Regular Hours Frequency Percent Standard Error Frequency Percent Standard
Error Frequency Percent Standard Error
Yes 170 33.0 2.07 189 37.7 2.17 577.0 37.3 0.11 No 345 67.0 2.07 312 62.3 2.17 969.0 62.7 0.09
PSN MediPass Medicaid HMO n=166 n=189 n=568
Q13. Received Needed Help or
Advice (p. 26) Frequency Percent Standard
Error Frequency Percent Standard Error Frequency Percent Standard
Error Never or Sometimes 65 39.2 3.80 40 21.2 2.98 175.0 8.1 0.31
Usually 20 12.0 2.53 14 7.4 1.91 86.0 22.7 0.30 Always 81 48.8 3.89 135 71.4 3.29 307.0 15.1 0.16
p=0.001
PSN MediPass Medicaid HMO
n=513 n=502 n=1543 Q14. Made
Appointment for Regular Health Care
Frequency Percent Standard Error Frequency Percent Standard
Error Frequency Percent Standard Error
Yes 273 53.2 2.21 298 59.4 2.19 911.0 59.0 0.09 No 240 46.8 2.21 204 40.6 2.19 633.0 41.0 0.11
PSN MediPass Medicaid HMO
n=265 n=295 n=899
Q15. Got Appointment for
Regular Health Care as Soon as Wanted
(p. 26) Frequency Percent Standard Error Frequency Percent Standard
Error Frequency Percent Standard Error
Never or Sometimes 78 29.4 2.80 43 14.6 2.06 213.0 23.8 0.29 Usually 28 10.6 1.89 43 14.6 2.06 154.0 17.1 0.22 Always 159 60.0 3.02 209 70.8 2.65 532.0 59.1 0.12
p=0.001
Appendix A—Detailed results and standard errors for PSN, MediPass and Medicaid HMOs, 2001
Evaluating Florida’s Medicaid PSN Demonstration Project, Patient Experience Analyses, Final Report, June 2004
44
PSN MediPass Medicaid HMO
n=257 n=282
Q16. Days Waited Between Making Appointment and
Seeing Provider for Routine Care
(p. 25) Frequency Percent Standard
Error Frequency Percent Standard Error
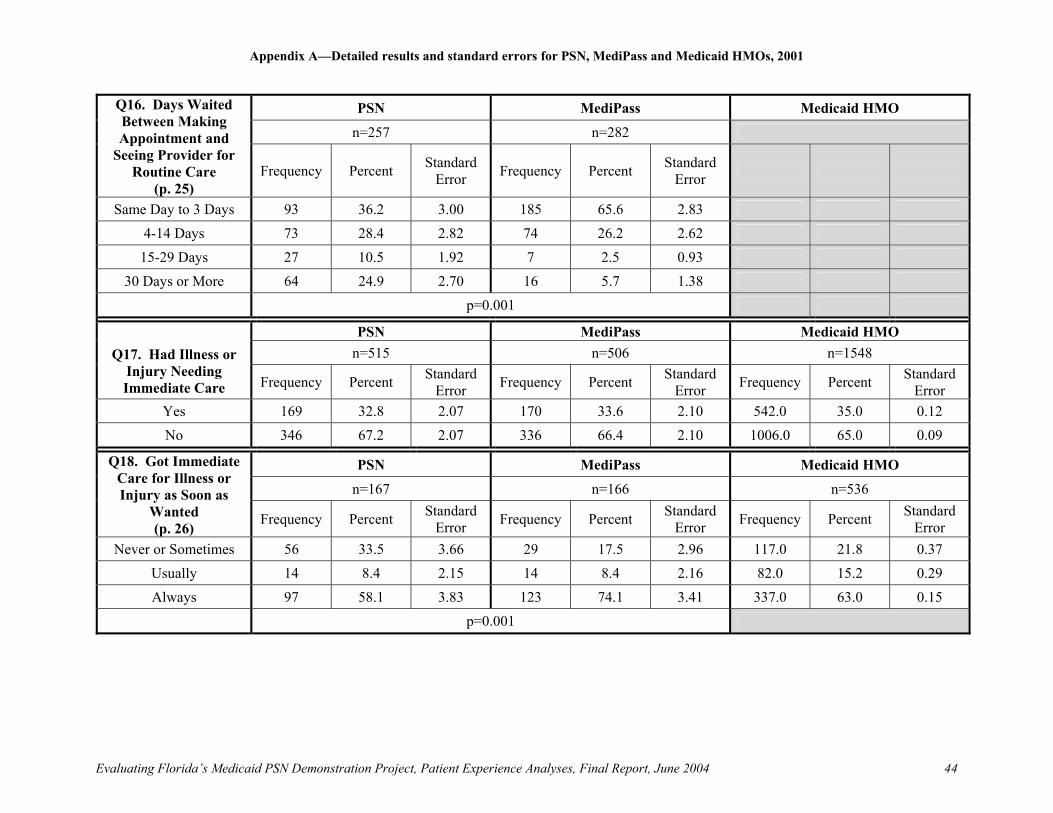
Same Day to 3 Days 93 36.2 3.00 185 65.6 2.83 4-14 Days 73 28.4 2.82 74 26.2 2.62
15-29 Days 27 10.5 1.92 7 2.5 0.93 30 Days or More 64 24.9 2.70 16 5.7 1.38
p=0.001
PSN MediPass Medicaid HMO n=515 n=506 n=1548 Q17. Had Illness or
Injury Needing Immediate Care Frequency Percent Standard
Error Frequency Percent Standard Error Frequency Percent Standard
Error Yes 169 32.8 2.07 170 33.6 2.10 542.0 35.0 0.12 No 346 67.2 2.07 336 66.4 2.10 1006.0 65.0 0.09
PSN MediPass Medicaid HMO
n=167 n=166 n=536
Q18. Got Immediate Care for Illness or Injury as Soon as
Wanted (p. 26) Frequency Percent Standard
Error Frequency Percent Standard Error Frequency Percent Standard
Error Never or Sometimes 56 33.5 3.66 29 17.5 2.96 117.0 21.8 0.37
Usually 14 8.4 2.15 14 8.4 2.16 82.0 15.2 0.29 Always 97 58.1 3.83 123 74.1 3.41 337.0 63.0 0.15
p=0.001
Appendix A—Detailed results and standard errors for PSN, MediPass and Medicaid HMOs, 2001
Evaluating Florida’s Medicaid PSN Demonstration Project, Patient Experience Analyses, Final Report, June 2004
45
PSN MediPass Medicaid HMO
n=161 n=167
Q19. Days Waited Between Trying to
Get Care and Seeing Provider for Illness or
Injury (p. 25)
Frequency Percent Standard Error Frequency Percent Standard
Error
Same Day 99 61.5 3.85 110 65.9 3.68 1-3 Days 24 14.9 2.82 29 17.4 2.94
4-14 Days 14 8.7 2.23 23 13.8 2.67 15 or More Days 24 14.9 2.82 5 3.0 1.32
p=0.035
PSN MediPass Medicaid HMO
n=512 n=499 n=1546
Q20. Number of Times Went to
Emergency Room for Care for Self
(p. 27) Frequency Percent Standard Error Frequency Percent Standard
Error Frequency Percent Standard Error
None 312 60.9 2.16 348 69.7 2.06 1057.0 67.9 0.09 1-2 Times 171 33.4 2.09 116 23.2 1.89 401.0 25.9 0.98 3-5 Times 18 3.5 0.81 27 5.4 1.01 70.0 4.5 0.69
6 or More Times 11 2.1 0.64 8 1.6 0.56 19.0 1.0 0.70 p=0.057
PSN MediPass Medicaid HMO
n=503 n=488 n=1501
Q21. Number of Times Went to
Doctor’s Office or Clinic for Care for
Self (p. 27)
Frequency Percent Standard Error Frequency Percent Standard
Error Frequency Percent Standard Error
None 143 28.4 2.01 107 21.9 1.87 384.0 25.6 0.15 1-4 Times 220 43.7 2.21 207 42.4 2.24 800.0 53.2 0.20 5-9 Times 87 17.3 1.69 127 26.0 1.99 208.0 13.9 0.19
10 or More Times 53 10.5 1.37 47 9.6 1.34 109.0 7.3 0.26 p=0.022

Appendix A—Detailed results and standard errors for PSN, MediPass and Medicaid HMOs, 2001
Evaluating Florida’s Medicaid PSN Demonstration Project, Patient Experience Analyses, Final Report, June 2004
46
PSN MediPass Medicaid HMO
n=354 n=378 n=1105
Q22. How Much of a Problem to Get Necessary Care
(p. 24) Frequency Percent Standard Error Frequency Percent Standard
Error Frequency Percent Standard Error
Big Problem 45 12.7 1.77 28 7.4 1.35 92.0 8.3 0.29 Small Problem 56 15.8 1.94 55 14.6 1.82 137.0 12.4 0.24 Not a Problem 253 71.5 2.40 295 78.0 2.13 876.0 79.2 0.09
p=0.014
PSN MediPass Medicaid HMO
n=350 n=377 n=1105 Q23. Delays While
Waiting for Approval from Program
(p. 24) Frequency Percent Standard Error Frequency Percent Standard
Error Frequency Percent Standard Error
Big Problem 45 12.9 1.79 28 7.4 1.35 91.0 8.2 0.28 Small Problem 42 12.0 1.74 38 10.1 1.55 145.0 13.1 0.22 Not a Problem 263 75.1 2.31 311 82.5 1.96 869.0 78.7 0.09
p=0.008
PSN MediPass Medicaid HMO
n=357 n=376 n=1088
Q24. Waited More Than 15 Minutes Past Appointment Time to
See Provider (p. 26) Frequency Percent Standard
Error Frequency Percent Standard Error Frequency Percent Standard
Error Never or Sometimes 168 47.1 2.65 248 66.0 2.45 670.0 61.6 0.15
Usually 48 13.4 1.81 25 6.6 1.29 136.0 12.5 0.23 Always 141 39.5 2.59 103 27.4 2.30 281.0 25.8 0.16
p=0.001

Appendix A—Detailed results and standard errors for PSN, MediPass and Medicaid HMOs, 2001
Evaluating Florida’s Medicaid PSN Demonstration Project, Patient Experience Analyses, Final Report, June 2004
47
PSN MediPass Medicaid HMO
n=359 n=378 n=1107
Q25. Office Staff at Doctor’s Office
Were Courteous and Respectful
(p. 31) Frequency Percent Standard Error Frequency Percent Standard
Error Frequency Percent Standard Error
Never or Sometimes 45 12.5 1.75 35 9.3 1.49 131.0 11.8 0.39 Usually 21 5.8 1.24 18 4.8 1.10 92.0 8.3 0.28 Always 293 81.6 2.05 325 86.0 1.79 884.0 79.8 0.09
p=0.108
PSN MediPass Medicaid HMO
n=356 n=375 n=1098 Q26. Office Staff at
Doctor’s Office Were Helpful
(p. 31) Frequency Percent Standard Error Frequency Percent Standard
Error Frequency Percent Standard Error
Never or Sometimes 67 18.8 2.07 50 13.3 1.76 188.0 14.1 0.34 Usually 38 10.7 1.64 45 12.0 1.68 141.0 12.8 0.23 Always 251 70.5 2.42 280 74.7 2.25 768.0 70.0 0.10
p=0.083
PSN MediPass Medicaid HMO n=358 n=378 n=1106
Q27. Doctor or Other Provider Listened
Carefully (p. 28) Frequency Percent Standard
Error Frequency Percent Standard Error Frequency Percent Standard
Error Never or Sometimes 48 13.4 1.80 36 9.5 1.51 137.0 12.4 0.42
Usually 30 8.4 1.47 19 5.0 1.13 120.0 10.8 0.25 Always 280 78.2 2.18 323 85.4 1.82 849.0 76.8 0.10
p=0.022

Appendix A—Detailed results and standard errors for PSN, MediPass and Medicaid HMOs, 2001
Evaluating Florida’s Medicaid PSN Demonstration Project, Patient Experience Analyses, Final Report, June 2004
48
PSN MediPass Medicaid HMO
n=359 n=380 n=1110
Q28. Had Hard Time Speaking With or
Understanding Doctor Because of Differing
Languages (p. 29)
Frequency Percent Standard Error Frequency Percent Standard
Error Frequency Percent Standard Error
Never or Sometimes 323 90.0 1.59 355 93.4 1.27 1046.0 94.3 0.18 Usually 10 2.8 0.87 5 1.3 0.59 21.0 1.9 0.60 Always 26 7.2 1.37 20 5.3 1.15 43.0 3.9 0.43
p=0.139
PSN MediPass Medicaid HMO
n=356 n=377 n=1110
Q29. Doctor Explained Things so
You Could Understand
(p. 28) Frequency Percent Standard Error Frequency Percent Standard
Error Frequency Percent Standard Error
Never or Sometimes 54 15.2 1.90 56 14.9 1.83 150.0 13.5 2.43 Usually 31 8.7 1.50 19 5.0 1.13 103.0 9.3 0.27 Always 271 76.1 2.26 302 80.1 2.06 857.0 77.2 0.09
p=0.426
Appendix A—Detailed results and standard errors for PSN, MediPass and Medicaid HMOs, 2001
Evaluating Florida’s Medicaid PSN Demonstration Project, Patient Experience Analyses, Final Report, June 2004
49
PSN MediPass Medicaid HMO
n=357 n=377 n=1107
Q30. Doctor Showed Respect for What You
Had to Say (p. 28) Frequency Percent Standard
Error Frequency Percent Standard Error Frequency Percent Standard
Error Never or Sometimes 33 9.2 1.54 32 8.5 1.44 123.0 11.1 0.39
Usually 31 8.7 1.49 20 5.3 1.16 119.0 10.7 0.25 Always 293 82.1 2.03 325 86.2 1.78 865.0 78.1 0.09
p=0.272
PSN MediPass Medicaid HMO
n=356 n=377 n=1098 Q31. Doctor Spent Enough Time With
You (p. 28) Frequency Percent Standard
Error Frequency Percent Standard Error Frequency Percent Standard
Error Never or Sometimes 65 18.3 2.05 56 14.9 1.83 199.0 18.1 0.29
Usually 41 11.5 1.69 44 11.7 1.66 158.0 14.3 0.22 Always 250 70.2 2.43 277 73.5 2.28 742.0 67.5 0.10
p=0.236
PSN MediPass Medicaid HMO
n=355 n=378 n=1082
Q32. Rating of All Health Care, from All
Doctors and Health Providers
(p. 30) Frequency Percent Standard Error Frequency Percent Standard
Error Frequency Percent Standard Error
0 through 6 38 10.7 1.64 39 10.3 1.57 142.0 13.2 0.60 7 or 8 88 24.8 2.29 66 17.5 1.96 239.0 22.1 0.24
9 or 10 229 64.5 2.54 273 72.2 2.31 701.0 64.8 0.17 p=0.104
Appendix A—Detailed results and standard errors for PSN, MediPass and Medicaid HMOs, 2001
Evaluating Florida’s Medicaid PSN Demonstration Project, Patient Experience Analyses, Final Report, June 2004
50
PSN MediPass Medicaid HMO
n=517 n=505 n=1546
Q33. Needed an Interpreter to Speak with Doctor or Other
Health Provider (p. 29) Frequency Percent Standard
Error Frequency Percent Standard Error Frequency Percent Standard
Error Yes 65 12.6 1.46 29 5.7 1.04 114.0 7.4 0.27 No 452 87.4 1.46 476 94.3 1.04 1432.0 92.6 0.07
p=0.001
PSN MediPass Medicaid HMO n=64 n=29 n=107 Q34. How Often You
Got Needed Interpreter Frequency Percent Standard
Error Frequency Percent Standard Error Frequency Percent Standard
Error Never or Sometimes 18 28.1 5.67 5 17.2 7.14 41.0 39.3 0.67
Usually 2 3.1 2.19 2 6.9 4.79 10.0 9.3 0.72 Always 44 68.8 5.84 22 75.9 8.09 56.0 52.5 0.37
PSN MediPass Medicaid HMO
n=513 n=481 n=1161 Q36. Use Current Medicaid Program for All or Most of
Health Care Frequency Percent Standard Error Frequency Percent Standard
Error Frequency Percent Standard Error
Yes 459 89.5 1.36 412 85.7 1.60 1137.0 98.0 0.08 No 54 10.5 1.36 69 14.3 1.60 23.0 2.0 0.54
PSN MediPass Medicaid HMO n=487 n=453 n=925
Q37. Number of Months in a Row
Enrolled (p. 33) Frequency Percent Standard
Error Frequency Percent Standard Error Frequency Percent Standard
Error Less than 3 Months 24 4.9 0.98 16 3.5 0.87 60.0 6.5 0.32
3 to 6 Months 35 7.2 1.17 25 5.5 1.07 148.0 15.9 0.23 7 Months to 1 Year 108 22.2 1.88 56 12.4 1.55 302.0 32.6 0.16 More than 1 Year 320 65.7 2.15 356 78.6 1.93 416.0 44.9 0.14
p=0.001
Appendix A—Detailed results and standard errors for PSN, MediPass and Medicaid HMOs, 2001
Evaluating Florida’s Medicaid PSN Demonstration Project, Patient Experience Analyses, Final Report, June 2004
51
PSN MediPass Medicaid HMO
n=491 n=460 n=1133 Q38. Chose Program
Yourself, or Were Told
(p. 33) Frequency Percent Standard Error Frequency Percent Standard
Error Frequency Percent Standard Error
Chose Myself 221 45.0 2.25 229 49.8 2.33 778.0 68.7 0.10 Was Told 270 55.0 2.25 231 50.2 2.33 355.0 31.3 0.15
p=0.159
PSN MediPass Medicaid HMO
n=497 n=475 n=1126 Q39. Received
Information About Program When
Enrolled Frequency Percent Standard Error Frequency Percent Standard
Error Frequency Percent Standard Error
Yes 314 63.2 2.17 268 56.4 2.28 742.0 65.9 0.10 No 183 36.8 2.17 207 43.6 2.28 384.0 34.1 0.15
PSN MediPass Medicaid HMO
n=281 n=245 n=713 Q40. How Much of Given Information
Was Correct (p. 34) Frequency Percent Standard
Error Frequency Percent Standard Error Frequency Percent Standard
Error All of It 181 64.4 2.86 166 67.8 2.99 438.0 61.3 0.13
Most of It 72 25.6 2.61 62 25.3 2.78 201.0 28.2 0.19
Some of It 26 9.3 1.73 17 6.9 1.63 66.0 9.2 0.33
None of It 2 0.7 0.50 0 0.0 - 9.0 1.3 0.87
p=0.218
PSN MediPass Medicaid HMO
n=512 n=500 n=1530 Q41. Looked for Information in
Written Materials from Program Frequency Percent Standard
Error Frequency Percent Standard Error Frequency Percent Standard
Error Yes 108 21.1 1.80 74 14.8 1.59 483.0 31.6 0.13 No 404 78.9 1.80 426 85.2 1.59 1047.0 68.4 0.09

Appendix A—Detailed results and standard errors for PSN, MediPass and Medicaid HMOs, 2001
Evaluating Florida’s Medicaid PSN Demonstration Project, Patient Experience Analyses, Final Report, June 2004
52
PSN MediPass Medicaid HMO
n=105 n=72 n=477
Q42. How Much of a Problem to Find or
Understand Information in
Written Materials (p. 32)
Frequency Percent Standard Error Frequency Percent Standard
Error Frequency Percent Standard Error
Big Problem 26 24.8 4.23 5 6.9 3.02 40.0 8.4 0.45 Small Problem 15 14.3 3.43 7 9.7 3.52 86.0 18.0 0.31 Not a Problem 64 61.0 4.78 60 83.3 4.42 352.0 73.7 0.15
p=0.001
PSN MediPass Medicaid HMO
n=515 n=501 n=1531 Q43. Called
Program’s Enrollee Service for
Information or Help Frequency Percent Standard Error Frequency Percent Standard
Error Frequency Percent Standard Error
Yes 115 22.3 1.84 76 15.2 1.60 563.0 36.7 0.11 No 400 77.7 1.84 425 84.8 1.60 968.0 63.3 0.09
PSN MediPass Medicaid HMO
n=113 n=75 n=554
Q44. How Much of a Problem to Get
Needed Help from Program’s Enrollee
Service (p. 32)
Frequency Percent Standard Error Frequency Percent Standard
Error Frequency Percent Standard Error
Big Problem 34 30.1 4.33 12 16.0 4.26 111.0 20.0 0.27 Small Problem 20 17.7 3.61 13 17.3 4.40 103.0 18.5 0.27 Not a Problem 59 52.2 4.72 50 66.7 5.48 341.0 61.5 0.14
p=0.024
Appendix A—Detailed results and standard errors for PSN, MediPass and Medicaid HMOs, 2001
Evaluating Florida’s Medicaid PSN Demonstration Project, Patient Experience Analyses, Final Report, June 2004
53
PSN MediPass Medicaid HMO
n=516 n=503
Q45. Called or Written Program with Complaint or
Problem (p. 35) Frequency Percent Standard
Error Frequency Percent Standard Error
Yes 47 9.1 1.27 18 3.6 0.83 No 469 90.9 1.27 485 96.4 0.83
p=0.001
PSN MediPass Medicaid HMO
n=47 n=17 Q46. Length of Time to Resolve Complaint
Frequency Percent Standard Error Frequency Percent Standard
Error
Same Day 5 10.6 4.55 2 11.8 8.05 1 Week 3 6.4 3.60 3 17.6 9.53 2 Weeks 1 2.1 2.13 1 5.9 5.88 3 Weeks 1 2.1 2.13 2 11.8 8.05
4 or More Weeks 7 14.9 5.25 3 17.6 9.53 Still Waiting for
Settlement 30 63.8 7.08 6 35.3 11.95
PSN MediPass Medicaid HMO
n=47 n=17 Q47. Complaint or Problem Settled to Your Satisfaction
Frequency Percent Standard Error Frequency Percent Standard
Error
Yes 10 21.3 6.03 11 64.7 11.95 No 10 21.3 6.03 1 5.9 5.88
Still Waiting for Settlement 27 57.4 7.29 5 29.4 11.39
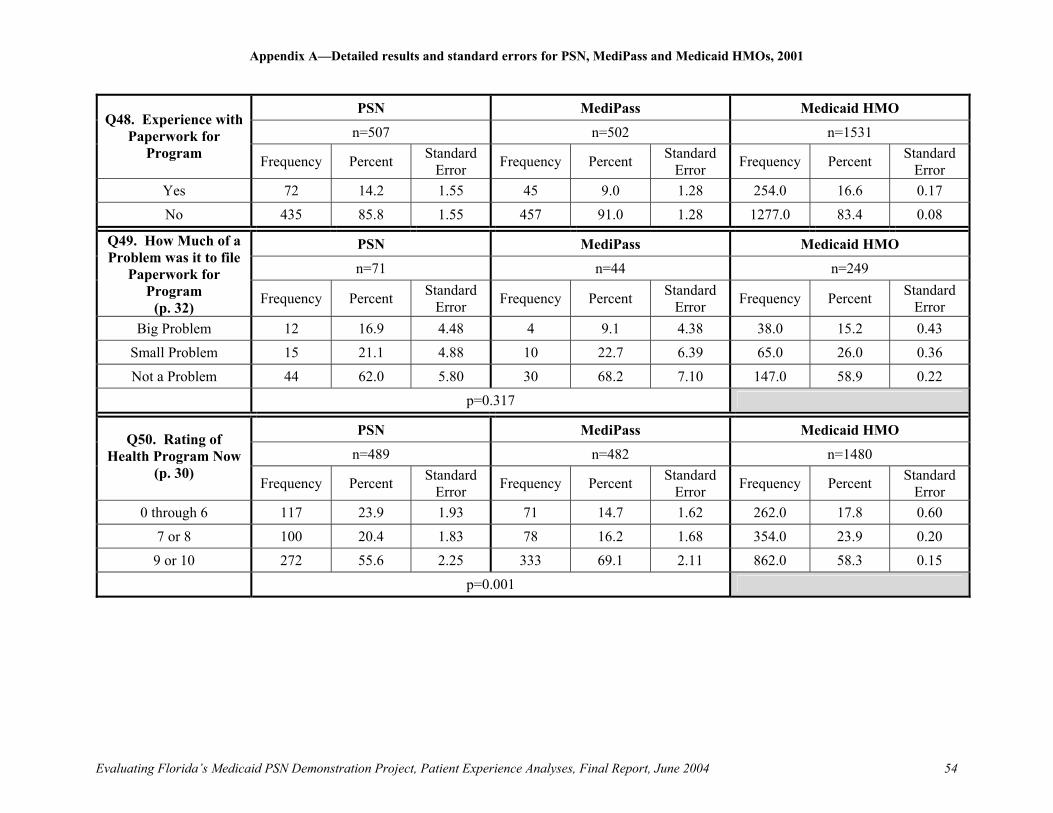
Appendix A—Detailed results and standard errors for PSN, MediPass and Medicaid HMOs, 2001
Evaluating Florida’s Medicaid PSN Demonstration Project, Patient Experience Analyses, Final Report, June 2004
54
PSN MediPass Medicaid HMO
n=507 n=502 n=1531 Q48. Experience with
Paperwork for Program Frequency Percent Standard
Error Frequency Percent Standard Error Frequency Percent Standard
Error Yes 72 14.2 1.55 45 9.0 1.28 254.0 16.6 0.17 No 435 85.8 1.55 457 91.0 1.28 1277.0 83.4 0.08
PSN MediPass Medicaid HMO
n=71 n=44 n=249
Q49. How Much of a Problem was it to file
Paperwork for Program
(p. 32) Frequency Percent Standard Error Frequency Percent Standard
Error Frequency Percent Standard Error
Big Problem 12 16.9 4.48 4 9.1 4.38 38.0 15.2 0.43 Small Problem 15 21.1 4.88 10 22.7 6.39 65.0 26.0 0.36 Not a Problem 44 62.0 5.80 30 68.2 7.10 147.0 58.9 0.22
p=0.317
PSN MediPass Medicaid HMO
n=489 n=482 n=1480 Q50. Rating of
Health Program Now (p. 30)
Frequency Percent Standard Error Frequency Percent Standard
Error Frequency Percent Standard Error
0 through 6 117 23.9 1.93 71 14.7 1.62 262.0 17.8 0.60 7 or 8 100 20.4 1.83 78 16.2 1.68 354.0 23.9 0.20
9 or 10 272 55.6 2.25 333 69.1 2.11 862.0 58.3 0.15 p=0.001
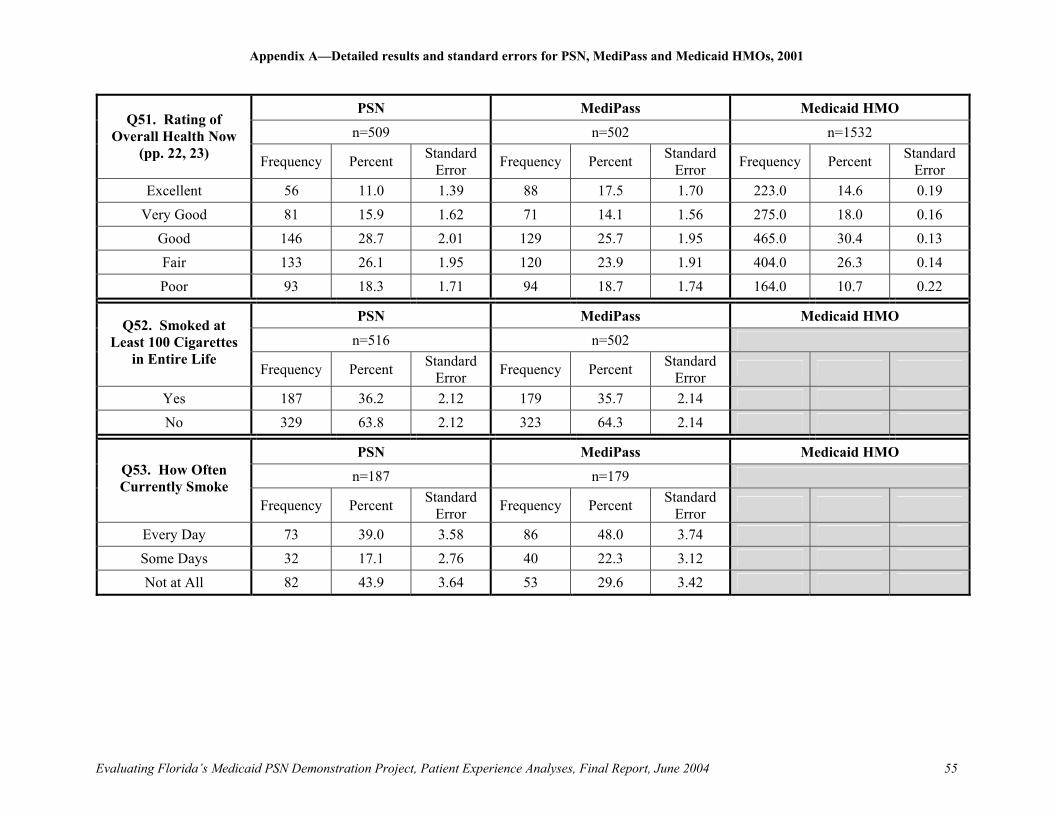
Appendix A—Detailed results and standard errors for PSN, MediPass and Medicaid HMOs, 2001
Evaluating Florida’s Medicaid PSN Demonstration Project, Patient Experience Analyses, Final Report, June 2004
55
PSN MediPass Medicaid HMO
n=509 n=502 n=1532 Q51. Rating of
Overall Health Now (pp. 22, 23) Frequency Percent Standard
Error Frequency Percent Standard Error Frequency Percent Standard
Error Excellent 56 11.0 1.39 88 17.5 1.70 223.0 14.6 0.19
Very Good 81 15.9 1.62 71 14.1 1.56 275.0 18.0 0.16 Good 146 28.7 2.01 129 25.7 1.95 465.0 30.4 0.13 Fair 133 26.1 1.95 120 23.9 1.91 404.0 26.3 0.14 Poor 93 18.3 1.71 94 18.7 1.74 164.0 10.7 0.22
PSN MediPass Medicaid HMO
n=516 n=502 Q52. Smoked at
Least 100 Cigarettes in Entire Life
Frequency Percent Standard Error Frequency Percent Standard
Error
Yes 187 36.2 2.12 179 35.7 2.14 No 329 63.8 2.12 323 64.3 2.14
PSN MediPass Medicaid HMO
n=187 n=179 Q53. How Often Currently Smoke
Frequency Percent Standard Error Frequency Percent Standard
Error
Every Day 73 39.0 3.58 86 48.0 3.74 Some Days 32 17.1 2.76 40 22.3 3.12 Not at All 82 43.9 3.64 53 29.6 3.42
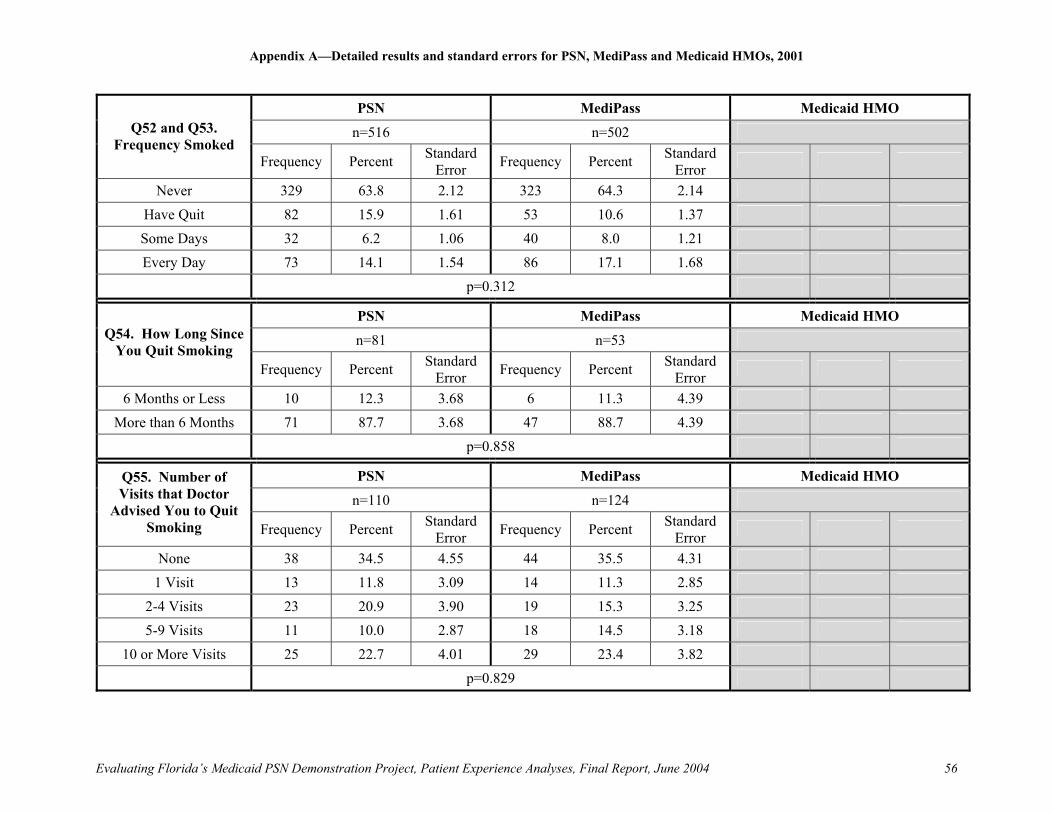
Appendix A—Detailed results and standard errors for PSN, MediPass and Medicaid HMOs, 2001
Evaluating Florida’s Medicaid PSN Demonstration Project, Patient Experience Analyses, Final Report, June 2004
56
PSN MediPass Medicaid HMO
n=516 n=502 Q52 and Q53. Frequency Smoked
Frequency Percent Standard Error Frequency Percent Standard
Error
Never 329 63.8 2.12 323 64.3 2.14 Have Quit 82 15.9 1.61 53 10.6 1.37 Some Days 32 6.2 1.06 40 8.0 1.21 Every Day 73 14.1 1.54 86 17.1 1.68
p=0.312
PSN MediPass Medicaid HMO
n=81 n=53 Q54. How Long Since You Quit Smoking
Frequency Percent Standard Error Frequency Percent Standard
Error
6 Months or Less 10 12.3 3.68 6 11.3 4.39 More than 6 Months 71 87.7 3.68 47 88.7 4.39
p=0.858
PSN MediPass Medicaid HMO
n=110 n=124 Q55. Number of Visits that Doctor
Advised You to Quit Smoking Frequency Percent Standard
Error Frequency Percent Standard Error
None 38 34.5 4.55 44 35.5 4.31 1 Visit 13 11.8 3.09 14 11.3 2.85
2-4 Visits 23 20.9 3.90 19 15.3 3.25 5-9 Visits 11 10.0 2.87 18 14.5 3.18
10 or More Visits 25 22.7 4.01 29 23.4 3.82 p=0.829

Appendix A—Detailed results and standard errors for PSN, MediPass and Medicaid HMOs, 2001
Evaluating Florida’s Medicaid PSN Demonstration Project, Patient Experience Analyses, Final Report, June 2004
57
PSN MediPass Medicaid HMO
n=505 n=500 n=1512 Q56. Highest School
Grade Completed (pp. 22, 23) Frequency Percent Standard
Error Frequency Percent Standard Error Frequency Percent Standard
Error 8th Grade or Less 96 19.0 1.75 79 15.8 1.63 296.0 19.6 0.17
Some High School, but Didn’t Graduate 130 25.7 1.95 150 30.0 2.05 356.0 23.6 0.14
High School Graduate, or GED 183 36.2 2.14 192 38.4 2.18 526.0 34.8 0.12
Some College or 2-Year College Degree 71 14.1 1.55 63 12.6 1.49 206.0 13.6 0.18
4-Year College Degree or More 25 5.0 0.97 16 3.2 0.79 127.0 8.4 0.40
PSN MediPass Medicaid HMO
n=502 n=496 n=2199 Q57 and Q58. Race/Ethnicity
(pp. 22, 23) Frequency Percent Standard
Error Frequency Percent Standard Error Frequency Percent Standard
Error White Non-Hispanic 44 8.8 1.26 22 4.4 0.93 812.0 36.9 0.93
Black or African American 262 52.2 2.23 203 40.9 2.21 615.0 28.0 2.2
Hispanic 190 37.8 2.17 270 54.4 2.24 734.0 33.4 2.1
Other 6 1.2 0.49 1 0.2 0.20 38.0 1.7 0.2
PSN MediPass Medicaid HMO
n=508 n=502 n=1546 Q57. Hispanic or Latino Origin or
Descent Frequency Percent Standard Error Frequency Percent Standard
Error Frequency Percent Standard Error
Yes 190 37.4 2.15 270 53.8 2.23 734.0 47.5 0.10 No 318 62.6 2.15 232 46.2 2.23 812.0 52.5 0.09
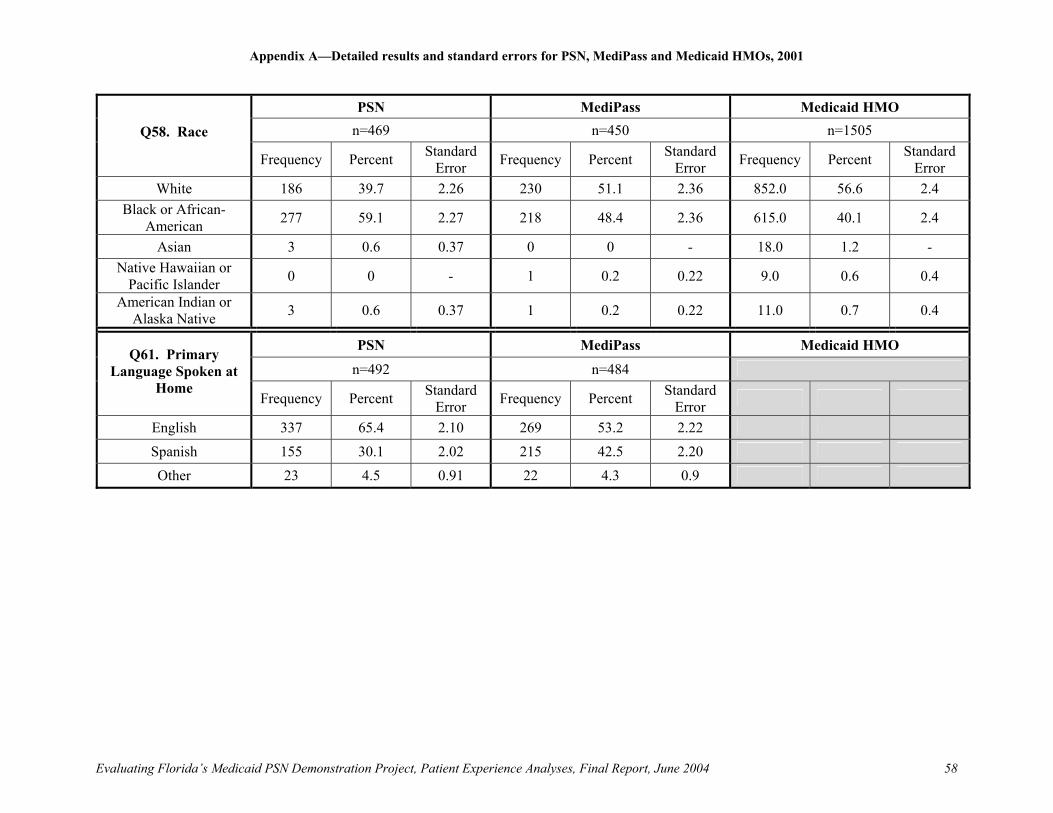
Appendix A—Detailed results and standard errors for PSN, MediPass and Medicaid HMOs, 2001
Evaluating Florida’s Medicaid PSN Demonstration Project, Patient Experience Analyses, Final Report, June 2004
58
PSN MediPass Medicaid HMO
n=469 n=450 n=1505 Q58. Race
Frequency Percent Standard Error Frequency Percent Standard
Error Frequency Percent Standard Error
White 186 39.7 2.26 230 51.1 2.36 852.0 56.6 2.4 Black or African-
American 277 59.1 2.27 218 48.4 2.36 615.0 40.1 2.4
Asian 3 0.6 0.37 0 0 - 18.0 1.2 - Native Hawaiian or
Pacific Islander 0 0 - 1 0.2 0.22 9.0 0.6 0.4
American Indian or Alaska Native 3 0.6 0.37 1 0.2 0.22 11.0 0.7 0.4
PSN MediPass Medicaid HMO
n=492 n=484 Q61. Primary
Language Spoken at Home
Frequency Percent Standard Error Frequency Percent Standard
Error
English 337 65.4 2.10 269 53.2 2.22 Spanish 155 30.1 2.02 215 42.5 2.20 Other 23 4.5 0.91 22 4.3 0.9

Evaluating Florida’s Medicaid PSN Demonstration Project Patient Experience Analyses Final Report, June 2004
59
Patient Satisfaction in Three Medicaid Managed Care Programs: Enrollees’ Characteristics and Program Differences
Poster Presentation to the AcademyHealth Annual Research Meeting,
Nashville, TN, June 2003
RESEARCH OBJECTIVE To assess, using multivariate analytic techniques the degree and manner in which Medicaid enrollees’ satisfaction with three distinct Medicaid programs is influenced by selected enrollee characteristics. Specifically, the research explores the degree to which observed differences in the satisfaction expressed by enrollees remain when the characteristics of enrollees are held constant in a multivariate model STUDY DESIGN Study Population: Adult enrollees of three Florida Medicaid programs: MediPass, HMO, and PSN. Data Source: The database was constructed from three surveys of Medicaid managed care program enrollees based on the Consumer Assessment of Health Plans Study (CAHPS) 2.0 Medicaid Adult instrument. The data were collected by telephone interview during mid-2001 with enrollees in three Medicaid programs operating in the South Florida market comprised of the Miami-Ft. Lauderdale area: (1) a new health care delivery system-Provider Service Network (PSN); (2) a primary care case management system-MediPass; and (3) HMO. The final dataset contains 2,578 cases: 517 cases from the PSN survey, 506 cases from the MediPass Survey, and 1,555 cases from the HMO survey. Study Design: Based on CAHPS 2.0 Medicaid Adult instrument, this study evaluated nine aspects of enrollee satisfaction, including four single-item global ratings: –the rating of personal doctor or nurse, –the rating of specialists, –the rating of quality of health care, and –the rating of health plan, and five composite ratings of care: –access to needed care: find personal doctor/nurse they like, get a referral, get the care they or a doctor believed necessary, delay care while waiting for approval; –promptness of care: get the help or advice they needed when they called the doctor’s office during regular office hours, get treatment as soon as they wanted when they were sick or injured, get an appointment as soon as they wanted for regular or routine health care, wait more than 15 minutes past their appointment time to see the person they went to see; –provider communication: listen carefully to them, explain things in a way they could understand, show respect for what they had to say, spend enough time with them;
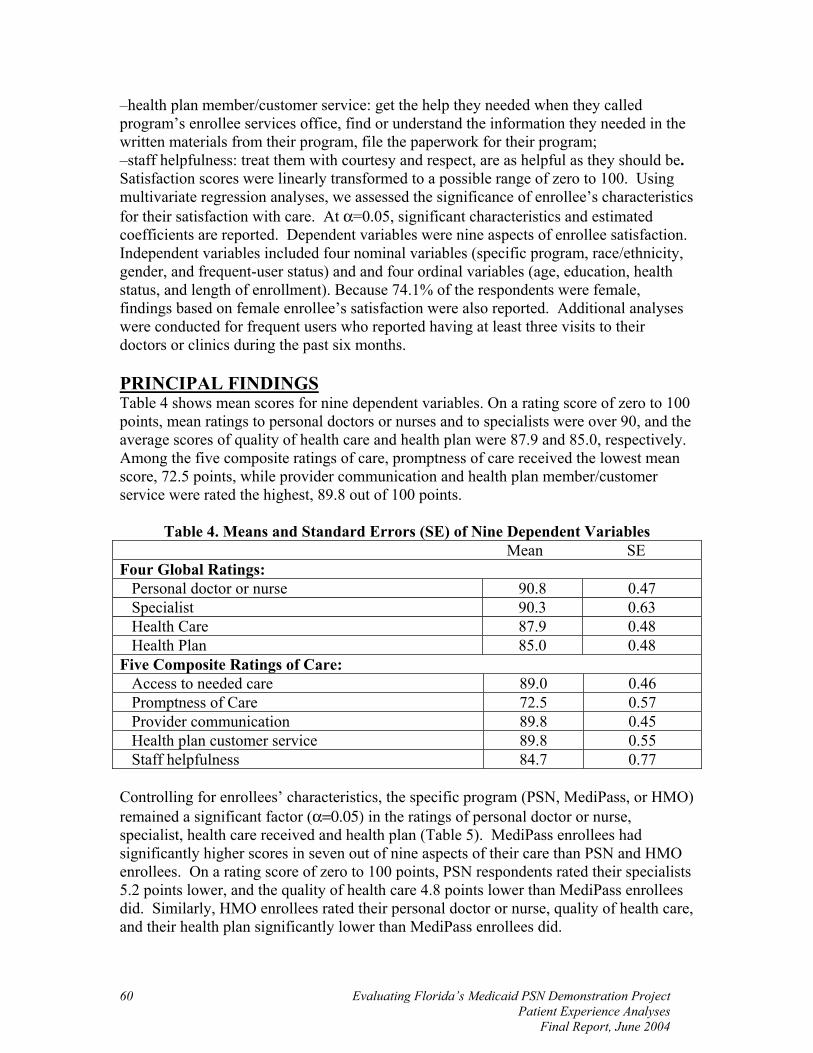
Evaluating Florida’s Medicaid PSN Demonstration Project Patient Experience Analyses
Final Report, June 2004
60
–health plan member/customer service: get the help they needed when they called program’s enrollee services office, find or understand the information they needed in the written materials from their program, file the paperwork for their program; –staff helpfulness: treat them with courtesy and respect, are as helpful as they should be. Satisfaction scores were linearly transformed to a possible range of zero to 100. Using multivariate regression analyses, we assessed the significance of enrollee’s characteristics for their satisfaction with care. At α=0.05, significant characteristics and estimated coefficients are reported. Dependent variables were nine aspects of enrollee satisfaction. Independent variables included four nominal variables (specific program, race/ethnicity, gender, and frequent-user status) and and four ordinal variables (age, education, health status, and length of enrollment). Because 74.1% of the respondents were female, findings based on female enrollee’s satisfaction were also reported. Additional analyses were conducted for frequent users who reported having at least three visits to their doctors or clinics during the past six months. PRINCIPAL FINDINGS Table 4 shows mean scores for nine dependent variables. On a rating score of zero to 100 points, mean ratings to personal doctors or nurses and to specialists were over 90, and the average scores of quality of health care and health plan were 87.9 and 85.0, respectively. Among the five composite ratings of care, promptness of care received the lowest mean score, 72.5 points, while provider communication and health plan member/customer service were rated the highest, 89.8 out of 100 points.
Table 4. Means and Standard Errors (SE) of Nine Dependent Variables Mean SE Four Global Ratings: Personal doctor or nurse 90.8 0.47 Specialist 90.3 0.63 Health Care 87.9 0.48 Health Plan 85.0 0.48 Five Composite Ratings of Care: Access to needed care 89.0 0.46 Promptness of Care 72.5 0.57 Provider communication 89.8 0.45 Health plan customer service 89.8 0.55 Staff helpfulness 84.7 0.77 Controlling for enrollees’ characteristics, the specific program (PSN, MediPass, or HMO) remained a significant factor (α=0.05) in the ratings of personal doctor or nurse, specialist, health care received and health plan (Table 5). MediPass enrollees had significantly higher scores in seven out of nine aspects of their care than PSN and HMO enrollees. On a rating score of zero to 100 points, PSN respondents rated their specialists 5.2 points lower, and the quality of health care 4.8 points lower than MediPass enrollees did. Similarly, HMO enrollees rated their personal doctor or nurse, quality of health care, and their health plan significantly lower than MediPass enrollees did.

Evaluating Florida’s Medicaid PSN Demonstration Project Patient Experience Analyses Final Report, June 2004
61
Health status, race/ethnicity, and age were important contributors to several aspects of enrollee satisfaction ratings (Table 5). Enrollees with poorer health status tended to have lower satisfaction scores, ranging from 1.3 to 3.3 points for every one level worse in health status. Black were more satisfied with five out of nine aspects of their care, but were less satisfied with promptness of care than Whites. Compared with Whites, Hispanic respondents gave significantly high ratings in eight out of nine aspects of their satisfaction. Older enrollees rated most (8) aspects of the satisfaction score more positively than other enrollees. For every one age group older, the rating in their satisfaction rose by 1.1 to 2.8 points. Length of enrollment and frequent-user status also had significant effect on three aspects of satisfaction. Length of enrollment positively affected the rating of access to needed care, staff helpfulness, and their health plan. While frequent-users gave approximate 3.0 points higher on the ratings on their personal doctor and the quality of care than non-frequent users did, their rating on promptness of care was 6.2 higher than non-frequent users. The effect of education attainment on the rating of quality of health care and health plan was small in magnitude but significant.
Table 5. Significant Coefficients (at α=0.05) from Regression Analysis on Nine Aspects of Enrollee Satisfaction
Global Ratings Composite Ratings of Care Personal Doctor or Nurse
Specialist
Health Care
Health Plan
Access of
needed care
Promptness of Care
Provider Communication
Customer Service
Staff Helpfulness
PSN -5.2153 -4.825 -3.2804 -6.6574 -2.9074
HMO -4.428 -3.9975 -5.605 -2.6644
Age(a) 1.0605 2.1753 2.0369 2.7931 1.2075 1.6499 1.1898 1.9307
Education(b) -0.9278 -0.998
Health Status(c)
-1.2785 -1.5571 -2.9864 -3.206 -3.3435 1.7032 -1.8861 -3.1284 -1.9661
Black 5.9611 4.9486 10.839 -4.1281 5.9322 7.2602
Hispanics 5.6272 6.9216 7.5388 12.598 7.948 9.2249 9.5466 4.5905
Other Races 11.8141
Length of enrollment(d)
2.5392 2.4583 2.7935
Frequent User
2.776
3.2445 6.1727
a: Seven age groups in the order of coded values (1 to 7): 18-24, 25-34, 35-44, 45-54, 55-64, 65-74, and 75 or older. b: Five education levels in the order of coded values (1 to 5): 8th grade or less, some high school, high school graduate or GED, some college or two-year degree, four-year college degree or higher. c: Five health status levels in the order of coded values (1 to 5): excellent, very good, good, fair, poor. d: Three length of enrollment in the order of coded values (1 to 3): six months or less, more than six months but less than one year, one year or longer. Enrollee characteristics affected frequent users’ satisfaction ratings differently from those of non-frequent users. Based on frequent users’ responses, Table 6 shows significant
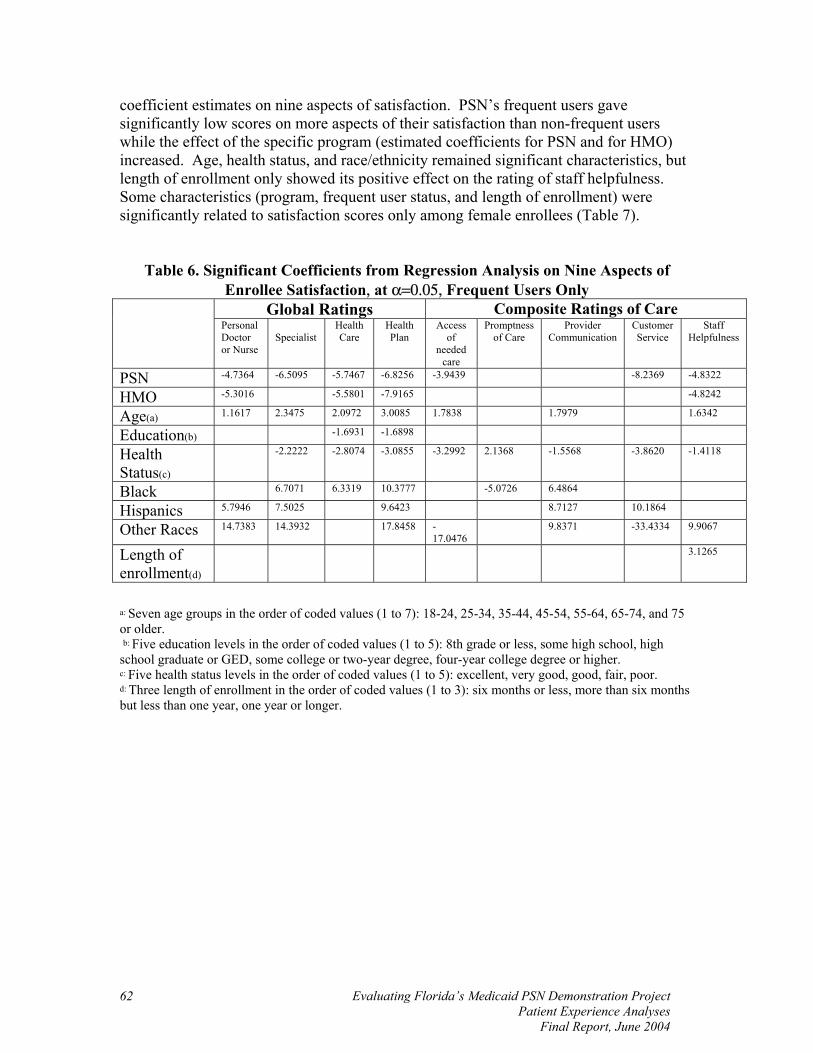
Evaluating Florida’s Medicaid PSN Demonstration Project Patient Experience Analyses
Final Report, June 2004
62
coefficient estimates on nine aspects of satisfaction. PSN’s frequent users gave significantly low scores on more aspects of their satisfaction than non-frequent users while the effect of the specific program (estimated coefficients for PSN and for HMO) increased. Age, health status, and race/ethnicity remained significant characteristics, but length of enrollment only showed its positive effect on the rating of staff helpfulness. Some characteristics (program, frequent user status, and length of enrollment) were significantly related to satisfaction scores only among female enrollees (Table 7).
Table 6. Significant Coefficients from Regression Analysis on Nine Aspects of Enrollee Satisfaction, at α=0.05, Frequent Users Only
Global Ratings Composite Ratings of Care Personal Doctor or Nurse
Specialist
Health Care
Health Plan
Access of
needed care
Promptness of Care
Provider Communication
Customer Service
Staff Helpfulness
PSN -4.7364 -6.5095 -5.7467 -6.8256 -3.9439 -8.2369 -4.8322
HMO -5.3016 -5.5801 -7.9165 -4.8242
Age(a) 1.1617 2.3475 2.0972 3.0085 1.7838 1.7979 1.6342
Education(b) -1.6931 -1.6898
Health Status(c)
-2.2222 -2.8074 -3.0855 -3.2992 2.1368 -1.5568 -3.8620 -1.4118
Black 6.7071 6.3319 10.3777 -5.0726 6.4864
Hispanics 5.7946 7.5025 9.6423 8.7127 10.1864
Other Races 14.7383 14.3932 17.8458 -17.0476
9.8371 -33.4334 9.9067
Length of enrollment(d)
3.1265
a: Seven age groups in the order of coded values (1 to 7): 18-24, 25-34, 35-44, 45-54, 55-64, 65-74, and 75 or older. b: Five education levels in the order of coded values (1 to 5): 8th grade or less, some high school, high school graduate or GED, some college or two-year degree, four-year college degree or higher. c: Five health status levels in the order of coded values (1 to 5): excellent, very good, good, fair, poor. d: Three length of enrollment in the order of coded values (1 to 3): six months or less, more than six months but less than one year, one year or longer.

Evaluating Florida’s Medicaid PSN Demonstration Project Patient Experience Analyses Final Report, June 2004
63
Table 7. Significant Coefficients from Regression Analysis on Nine Aspects of Enrollee Satisfaction, at α=0.05, Female Enrollees Only
Global Ratings Composite Ratings of Care Personal Doctor or Nurse
Specialist
Health Care
Health Plan
Access of
needed care
Promptness of Care
Provider Communication
Customer Service
Staff Helpfulness
PSN -3.3467 -3.3706 -4.9328 -3.7388 -2.7167 -3.2758
HMO -4.7077 -4.6350 -5.6840 -2.9010
Age(a) 0.9705 1.7373 2.0078 2.7845 1.0989 1.7189 2.1362
Education(b) -1.669
Health Status(c)
-1.0558 -3.0768 -3.2345 -3.2741 -1.9091 -3.2104 -1.9672
Black 12.1445 6.1731 9.3699
Hispanics 4.9373 7.9370 7.3424 14.1607 7.0930 9.8047 11.8402 4.5601
Other Races 10.3115
Length of enrollment(d)
-1.8815 2.6849 2.8340
Frequent User
3.1612
3.5344 2.4284 7.6238 2.0215
CONCLUSIONS: Although health status, race/ethnicity, and age were significant factors in the satisfaction ratings of Medicaid managed care enrollees, satisfaction score differences by program remain significant. Specifically, PSN and HMO enrollees were slightly less satisfied with many aspects of their care than MediPass enrollees, even after controlling for the enrollee characteristics measured here. In the Miami-Ft. Lauderdale area, MediPass enrollees express higher satisfaction with several aspects of their care than HMO or PSN participants their care, due in part to selected enrollee characteristics (race/ethnicity, age and health status), and in part to program attributes. IMPLICATIONS FOR POLICY, DELIVERY, OR PRACTICE: Substantial improvements in satisfaction (overall, for the various programs, and for various subsets of enrollees) would require different interventions, targeted to specific subpopulations within the programs.


Patient Satisfaction Survey
Year 3 (2003)

Evaluating Florida’s Medicaid PSN Demonstration Project Patient Experience Analyses Final Report, June 2004
67
Introduction and Methodology Overall, the 2003 study attempted to replicate the instrumentation and sample design used in the 2001 study. Thus, we used the same version of CAHPS even though a new version had been released in the meantime. The same data collection organization conducted both surveys. The only significant change was the addition of a sample of children. Since budgetary constraints meant these additional interviews would be done without increasing the total sample size, the samples for the two groups were smaller than the 2001 survey of adults, yielding less reliable confidence intervals. Fieldwork The survey fieldwork was conducted by the University of Florida Bureau of Economic and Business Research (BEBR). The BEBR survey lab uses Sawtooth WinCATI software, a computer-assisted telephone interviewing (CATI) system, to speed the delivery of clean, machine-readable data following completion of the fieldwork. Most interviewers were undergraduate students at the University of Florida. Interviewers represented a wide range of ethnicity, gender and race categories. Bilingual interviewers must have demonstrated a proficiency at speaking without a strong accent in either language. Interviews were conducted during 3-hour shifts on each day of the week, never earlier than 9 a.m. or later than 9 p.m., respondents’ local time. Many of the interviewers had already worked on an HMO survey and were familiar with the CAHPS instrument; new interviewers received the same training as used in the HMO survey. Additionally, background information about MediPass and the PSN was provided. To enhance the response rate, BEBR procedures include multiple callbacks for phone numbers that are busy or go unanswered. Additionally, callback appointments were scheduled for a future time that was more convenient for the respondent.
During each shift, at least one interviewer was monitored. Without prior notice, a supervisor listened in from a reception-only phone line in another room. The supervisor noted the interviewer’s performance and met with the interviewer afterward, offering suggestions for improvement if needed. Additionally, the UF PSN evaluation project coordinator visited the lab during the first few days of interviewing, monitoring several interviews. Sample This project interviewed adults age 18 or older for whom a valid telephone number was available, and who were physically able to respond to the survey by telephone. For children who were sampled, a parent or guardian over age 18 was interviewed. The sample was a randomly selected cross-section of enrollees who had been in the PSN or MediPass for at least 6 months prior to the interview. CAHPS procedures were followed for sampling adults and children. The fieldwork began in late June and was completed in early August, 2003. The target was 250 interviews with each group; each sample met or exceeded that goal as described in Table 8. The samples were managed in replicates

Evaluating Florida’s Medicaid PSN Demonstration Project Patient Experience Analyses
Final Report, June 2004
68
(representative subsamples); once a replicate had been opened, complete call procedures were followed for every phone number. Language The interviews were conducted in English, Spanish and Haitian Creole. The breakdown of interviews by program and language is as follows:
Table 8
Number of PSN and MediPass Respondents, by Language of Interview
English Spanish Creole Total
PSN adults 155 85 10 250 PSN children 180 61 10 251
MediPass adults 92 155 5 252 MediPass children 112 139 5 256
Survey Response In order to maximize response, each telephone number was called up to 15 times, at different times of day, including both weekend and weekday attempts. Overwhelmingly, when we could reach an eligible respondent, they were willing to do the survey. The biggest challenge was the accuracy of the phone numbers or finding someone at home. The final disposition of cases for the survey was as follows:
Table 9
Final Disposition of Telephone Numbers Attempted
PSN MediPass Adults Children Adults Children Completed interview 250 251 252 256 Refusal/Break-off 64 61 98 68 Respondents Unable (impaired, dead, other languages) 44 29 59 10
Busy/No answer/Answering machine 91 57 145 117
Disconnected/Telephone problems 252 307 246 243
Enrollee not at number 249 197 324 206 TOTAL PHONE NUMBERS ATTEMPTED 950 902 1,124 900
Percent of phone numbers resulting in an interview 26% 28% 22% 28%
Cooperation rate (eligible contacts who participated) 80% 80% 72% 79%
Evaluating Florida’s Medicaid PSN Demonstration Project Patient Experience Analyses Final Report, June 2004
69
Thus about 22-28% percent of the telephone numbers attempted resulted in an interview, with slight variation among the samples. The biggest barrier to participation was the viability of the telephone numbers; a significant number of respondents were not at the listed phone number, or it had been disconnected. Overwhelmingly, those eligible respondents who were contacted were willing to complete the interview, with cooperation rates of 72-80% as calculated with AAPOR Cooperation Rate 3.4 Data Quality Issues It should be noted that this study shares the limitations of all survey research, including the bias inherent in self-report. Virtually all measures in the survey reflect enrollees’ perceptions about their care. A respondent who reports long delays in receiving care, for example, is reporting his or her perception of the delay, not an empirically verifiable fact of such delays. And while every item in the survey asks about their care “now” or in the last six months, if enrollees have not changed providers, they may mentally blur together all their care in that setting. Take the example of an enrollee who has been seeing the same physician under MediPass for three years but transferred over to the PSN in March 2000 when his/her doctor joined the PSN. The survey may carefully ask about getting a referral to the specialist in the last 6 months. But instead of accurately isolating only that time period, the respondent may report on their experience in general, during all the time they have seen that provider. The standard errors and response frequencies (sample size) for all items are given in Appendix B. When there are fewer than 80 responses to an item, the results are not displayed in the “Findings” section of the main report, but are included in Appendix B.
4 The American Association for Public Opinion Research (2000) Standard Definitions: Final Dispositions of Case Codes and Outcome Rates for Surveys.

Key Findings: PSN and MediPass
2003 Survey
Evaluating Florida’s Medicaid PSN Demonstration Project Patient Experience Analyses
Final Report, June 2004
72
Demographics For the adult sample, Hispanics were the largest group both in the PSN (46.3%) and MediPass (74.1%). Among the survey of children with families, the target children were most often Black in the PSN (60.5%) and Hispanic in the MediPass sample (75.9%). Since adult Medicaid recipients are overwhelmingly female, it is not surprising that our adult sample was also mostly female, including 68.8% of respondents in the PSN and 71.0% of MediPass respondents. Among the children, there was a more even split: The PSN children's sample was 52.2% male and 47.8% female, while the MediPass children were virtually identical at 52.0% male and 48.0% female. Among adults, there were similar distributions of health status in both groups, with 21-22% reporting “Poor” health and half of respondents reporting “Fair" or "Good.” Among children, the rates of poor (1.2%) and fair (about 10%) were virtually identical in the two samples. The rate of "excellent" varied slightly, reported for 37.8% of PSN subjects and 42.5% of MediPass. Getting Care That Is Needed Overwhelmingly, most respondents from all groups reported that they have “No problems” getting care. There are high rates of having “No problems” on the issue of finding a personal doctor or nurse with which they were happy, and for getting the care that they or a doctor believed necessary. Families with children gave particularly high scores on the issue of finding a personal doctor or nurse, with 95% of PSN families and 93.9% of MediPass families reporting "no problem," compared to 73.3% of PSN adults and 84.6% of MediPass adults. There were some slight differences when it came to getting a referral to a specialist, with 77.6% of adult MediPass enrollees reporting “No problems,” while 62.2% of PSN enrollees reported “No problems.” About 18.9% of PSN enrollees reported such referrals caused “Big problems,” while 14.9% of MediPass enrollees reported “Big problems” getting a referral. However, among children the rates are quite similar, with "No problem" being reported by 73.1% of PSN families and 74.4% of MediPass families. Families with children also reported a slightly more positive experience when it came to delaying care while waiting for approval from the program. For children, those reporting "no problem" were 82.8% of the PSN sample and 88.0% of MediPass. For adults, "no problem" was reported by about 72.3% for the PSN and 76.9% for MediPass There were some differences in the reported wait between making an appointment and actually seeing a provider for regular or routine care, with 27.8% of PSN adult respondents reporting that they could be seen within three days, while 52.6% of MediPass respondents reported being seen within three days. Among children, 54.4% of PSN and 72.8% of MediPass reported being seen within three days. When it came to waits between trying to get care and actually seeing a provider for an illness or injury, 44.4% of PSN adults and 51.3% of MediPass adults reported getting

Evaluating Florida’s Medicaid PSN Demonstration Project Patient Experience Analyses Final Report, June 2004
73
care the same day they first sought care. Among families with children, 70.8% of PSN children and 84.4% of MediPass children were seen the same day. Getting Care Without Long Waits There were some differences in the percentage of respondents who said they could get the help or advice they needed when they called the doctor’s office during regular office hours. Specifically, 45.9% of PSN and 64.6% of MediPass adult respondents reported “Always” getting that help. For families with children, 54.1% of PSN and of 73.9% MediPass reported "Always" getting needed help or advice. When it came to getting treatment as soon as they wanted when they were sick or injured, 52.1% of PSN and 63.8% of MediPass adult respondents said they “Always” got the care as soon as they wanted. For children, 67.7% of PSN and 79.5% of MediPass families reported they "always" got treatment as soon as they wanted. For regular or routine care, about 50.0% of PSN and 65.6% of MediPass adult respondents said they “Always” got an appointment as soon as they wanted. Among families with children, "Always" was reported by 59.0% of PSN and 71.0% of MediPass families. About 39.7% of PSN and 33.2% of MediPass adult respondents reported that they “Always” had to wait more than 15 minutes past their appointment time to see their health care provider. For children, 34.3% of PSN and 26.2% of MediPass enrollees reported they "Always" had to wait 15 minutes or more. Number of visits Both samples showed similar patterns of health care utilization in the last 6 months. About 37.2% of PSN and 30.5% of MediPass adult respondents had at least one visit visits to the emergency room. Among children, 30.2% of PSN and 29.1% of MediPass child enrollees had at least one ER visit. When it came to adult utilization of doctor's office or clinic visits, there were similar numbers of people with at least one office visit, 81.7% for the PSN and 82.1% for MediPass. However, 27% of PSN adults reported 5 or more visits, while 41.6% of MediPass respondents reported 5 or more visits. Among the children, 32.4% of PSN child enrollees reported no office visits in the last six months, with less than half that number (10.3%) for the MediPass child enrollees. How Well Health Care Providers Communicate Both adult patients and parents in both plans felt that their health care providers listened carefully to them, with 80% or more of each sample saying their provider "Always" listened carefully to them. There were also high scores for showing respect for what the patient had to say. As far as explaining things in a way the patient could understand,
Evaluating Florida’s Medicaid PSN Demonstration Project Patient Experience Analyses
Final Report, June 2004
74
74.0% of PSN adults and 81.2% of MediPass adults said the provider "always" explained things understandably. For families, 73.5% of PSN parents and 85.3% of MediPass parents felt that the provider "always" explained things in a way that the parent could understand, while 69.9% of PSN and 76.6% of MediPass parents felt the provider "always" explained things in a way the child could understand. When it came to spending enough time with the patient, about 67.9% of PSN adults and 76.8% of MediPass adults said that their provider "Always" spent enough time with them, while "always" was also reported for 71.2% of PSN children and 72.9% of MediPass children. Language Barriers A minority of adult respondents (13.3% for PSN and 5.1% for MediPass) said that they “Always” had a hard time speaking with or understanding a health care provider because they spoke different languages. This low rate might be in part due to the bias of a telephone survey, in that some of the patients who had problems understanding might also have been unable to participate in a phone survey. About 12.3% of PSN adults and 15.6% of MediPass respondents said that they needed an interpreter to help them speak with doctors. Among families, about 12.0% of the PSN and 8.3% of the MediPass sample responded that the parent "always" had a hard time speaking with or understanding a doctor because they spoke different languages. For the children themselves, 9.6% of the PSN and 3.7% of MediPass were reported to "always" have a hard time with language differences. How People Rated Their Health Care and Providers When asked to give a rating from 0 to 10 to their personal doctor or nurse, specialist, and health care overall, most people in both programs gave the top rankings. More than three quarters of every sample gave the top ranking to their personal doctor or nurse. The lowest ratings—which were still very favorable—were for rating “their health program now.” About 59.7% of PSN adults and 70.2% of MediPass adult respondents gave a rating of 9 or 10. Among families with children, the top rankings were given by 67.2% of PSN families and 81.3% of those in MediPass. Courtesy, Respect and Helpfulness of Medical Office Staff Most respondents in both programs felt that office staff treated them with courtesy and respect, and were as helpful as they should be. About 78.0% of PSN adults and 84.7% of MediPass adults reported that office staff “Always” treated them with courtesy and respect. Among families with children, 73.5% of PSN and 85.8% of MediPass families said that they were "Always" treated with courtesy and respect.
Evaluating Florida’s Medicaid PSN Demonstration Project Patient Experience Analyses Final Report, June 2004
75
Program Enrollee Service Most respondents reported “No problems” in filing paperwork for their program, or finding or understanding the information they needed in the written materials from their program. When it came to getting the help they needed when they called their program’s enrollee services, “No problems” was reported by 59.0% of PSN adults and 54.2% of MediPass adults, and 66.7% of PSN families with children and 75.0% of MediPass families. Enrollment Most enrollees have been in their program for more than a year. There were strikingly similar rates for the adults (80.3% for PSN versus 82.5% for Medipass) reporting enrollment for more than a year, and some variation among children (79.5% for PSN versus 86.7% for MediPass). More than half of adult respondents (51.3% for PSN and 64.1% for MediPass) reported that they chose their program rather than being told which program they were in. Among families with children, there were more marked differences, with "chose their program" being reported by 56.3% of PSN and 81.3% of MediPass families. Program Information Most adult respondents (69.9% for PSN and 74.8% for MediPass) found that all of the information they were given about their program was correct. Among the sample of children, 53.8% of the PSN and 70.8% of MediPass families also reported that "All of it" was correct. Complaints/Grievances Only a small minority of enrollees had called or written their program with a complaint or problem. About 7.5% of PSN and 4.8% of MediPass respondents reported that they had called or written their program with a complaint or grievance in the last 6 months. For families with children, the rate was lower: Only 3.2% of PSN and 1.6% of MediPass families reported registering a complaint.
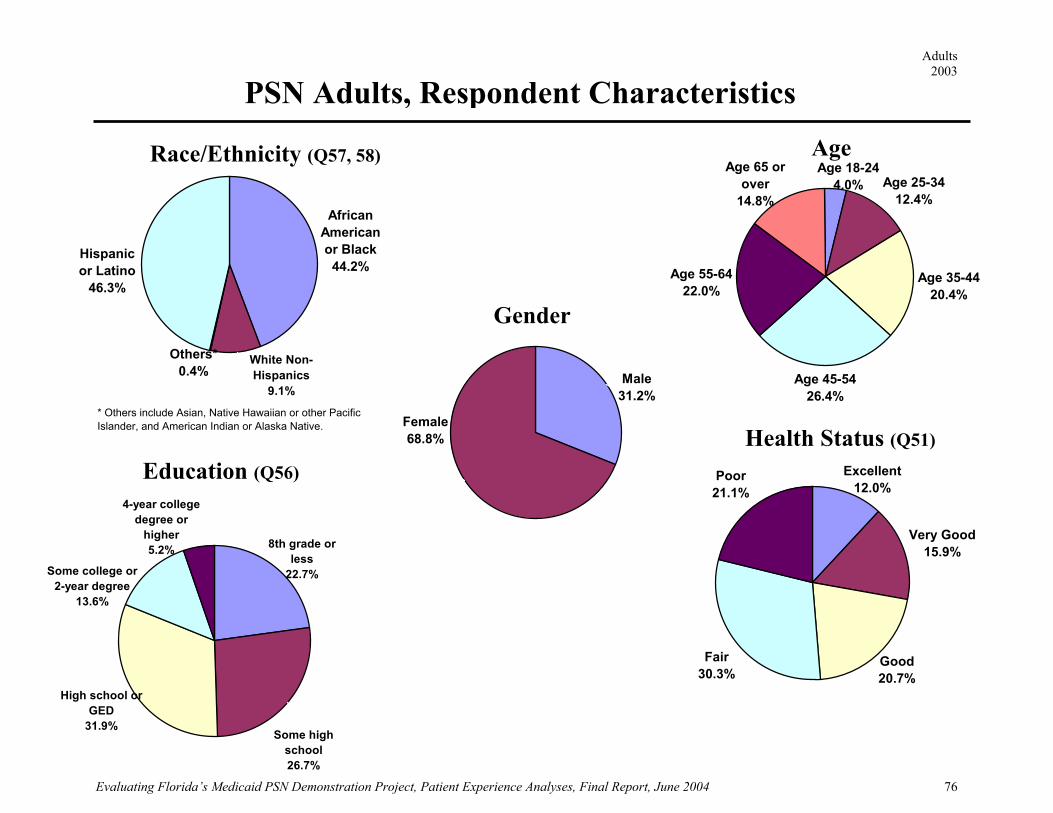
Adults 2003
Evaluating Florida’s Medicaid PSN Demonstration Project, Patient Experience Analyses, Final Report, June 2004 76
Very Good15.9%
Fair30.3%
Poor21.1%
Excellent12.0%
Good20.7%
PSN Adults, Respondent Characteristics
Age 35-4420.4%
Age 45-5426.4%
Age 55-6422.0%
Age 25-3412.4%
Age 65 or over
14.8%
Age 18-244.0%
Others*0.4%
White Non-Hispanics
9.1%
Hispanic or Latino
46.3%
African American or Black
44.2%
* Others include Asian, Native Hawaiian or other Pacific Islander, and American Indian or Alaska Native.
8th grade or less
22.7%
4-year college degree or
higher5.2%
High school or GED
31.9%
Some college or 2-year degree
13.6%
Some high school26.7%
Race/Ethnicity (Q57, 58) Age
Male31.2%
Female68.8% Health Status (Q51)
Education (Q56)
Gender

Adults 2003
Evaluating Florida’s Medicaid PSN Demonstration Project, Patient Experience Analyses, Final Report, June 2004 77
African American
13.4%
Hispanic or Latino
74.1%
Others*0.4%
White Non-Hispanic
12.2%
* Others include Asian, Native Hawaiian or other Pacific Islander, and American Indian or Alaska Native.
Excellent9.6%
Poor22.1%
Good20.5%
Fair36.5%
Very good11.2%
MediPass Adults, Respondent Characteristics
Age 35-4420.4%
Age 45-5419.2%
Age 25-3410.4%
Age 18-243.2%Age 65 or
over22.4%
Age 55-6424.4%
8th grade or less
27.0%
4-year degree or higher8.5%
High school or GED
32.3%
Some college or 2-year degree
12.9%
Some high school19.4%
Race/Ethnicity (Q57, 58) Age
Male29.0%
Female71.0%
Health Status (Q51)Education (Q56)
Gender

Adults 2003
Evaluating Florida’s Medicaid PSN Demonstration Project, Patient Experience Analyses, Final Report, June 2004 78
BIG problems SMALL problems NO problems
0% 20% 40% 60% 80% 100%
Find a personal doctor or nurse they were happy with. Q4
10.6%
15.1% 11.6%
84.6%
73.3%
4.8%
0% 20% 40% 60% 80% 100%
MediPass
PSN
Get a referral to a specialist that they wanted to see. Q8
Get the care they or a doctor believed necessary. Q22
Delay care while waiting for approval from your program. Q23
14.9%
18.9%
7.5%
18.9%
77.6%
62.2%
0 % 2 0 % 4 0 % 6 0 % 8 0 % 1 0 0 %
MediPass
PSN
8.7%
14.3%
18.5%
18.5%
72.8%
67.2%
0% 20% 40% 60% 80% 100%
Medipass
PSN
6.7%
8.7%
16.4%
19.0%
76.9%
72.3%
0% 20% 40% 60% 80% 100%
MediPass
PSN
The bar graphs show answers to survey questions that asked people, in the last 6 months, how much of a problem it was to:
Getting care that is needed

Adults 2003
Evaluating Florida’s Medicaid PSN Demonstration Project, Patient Experience Analyses, Final Report, June 2004 79
0% 20% 40% 60% 80% 100%
Same day 1 to 3 days 4 to 14 days 15 days or longer
51.3%
44.4%
21.8%
22.2%
16.7%
12.5% 20.8%
10.2%
0% 20% 40% 60% 80% 100%
MediPass
PSN
0% 20% 40% 60% 80% 100%
Wait between making an appointment and actually seeing a provider for regular or routine care. Q16
52.6%
27.8%
25.0%
24.3% 36.8%11.1%
7.2% 15.1%
0% 20% 40% 60% 80% 100%
Medipass
PSN
Wait between trying to get care and actually seeing a provider for an illness or injury. Q19
The bar graphs show answers to survey questions that asked people, in the last 6 months, how many days did you usually have to:
Same day to 3 days 4 to 14 days 15 to 29 days 30 days or longer

Adults 2003
Evaluating Florida’s Medicaid PSN Demonstration Project, Patient Experience Analyses, Final Report, June 2004 80
Never or Sometimes Usually Always
0% 20% 40% 60% 80% 100%
Getting care without long waits
Get the help or advice they needed when they called the doctor’s office during regular office hours. Q13
28.1%
40.0%
7.3%
14.1%
64.6%
45.9%
0% 20% 40% 60% 80% 100%
MediPass
PSN
Get treatment as soon as they wanted when they were sick or injured. Q18
Get an appointment as soon as they wanted for regular or routine health care. Q15
Wait more than 15 minutes past their appointment time to see the person they went to see. Q24
21.3%
24.7%
15.0%
23.3%
63.8%
52.1%
0% 20% 40% 60% 80% 100%
MediPass
PSN
19.9%
28.6%
14.6%
21.4%
65.6%
50.0%
0% 20% 40% 60% 80% 100%
MediPass
PSN
54.9%
43.8%
11.9%
16.5%
33.2%
39.7%
0% 20% 40% 60% 80% 100%
MediPass
PSN
The bar graphs show answers to survey questions that asked people, in the last 6 months, how often did they:

Adults 2003
Evaluating Florida’s Medicaid PSN Demonstration Project, Patient Experience Analyses, Final Report, June 2004 81
0% 20% 40% 60% 80% 100%
0% 20% 40% 60% 80% 100%
Go to an emergency room to get care for yourself. Q20
69.5%
62.8%
24.4%
31.2%4.8%
4.9%
1.2%
1.2%
0% 20% 40% 60% 80% 100%
MediPass
PSN
Go to a doctor’s office or clinic to get care for yourself. Q21
17.9%
18.3%
40.4%
54.8%
28.3%
18.7%
13.3%
8.3%
0% 20% 40% 60% 80% 100%
MediPass
PSN
The bar graphs show answers to survey questions that asked people, in the last 6 months, how many times did you:
Number of visits
None 1 to 2 times 3 to 5 times 6 times or more
None 1 to 4 times 5 to 9 times 10 times or more
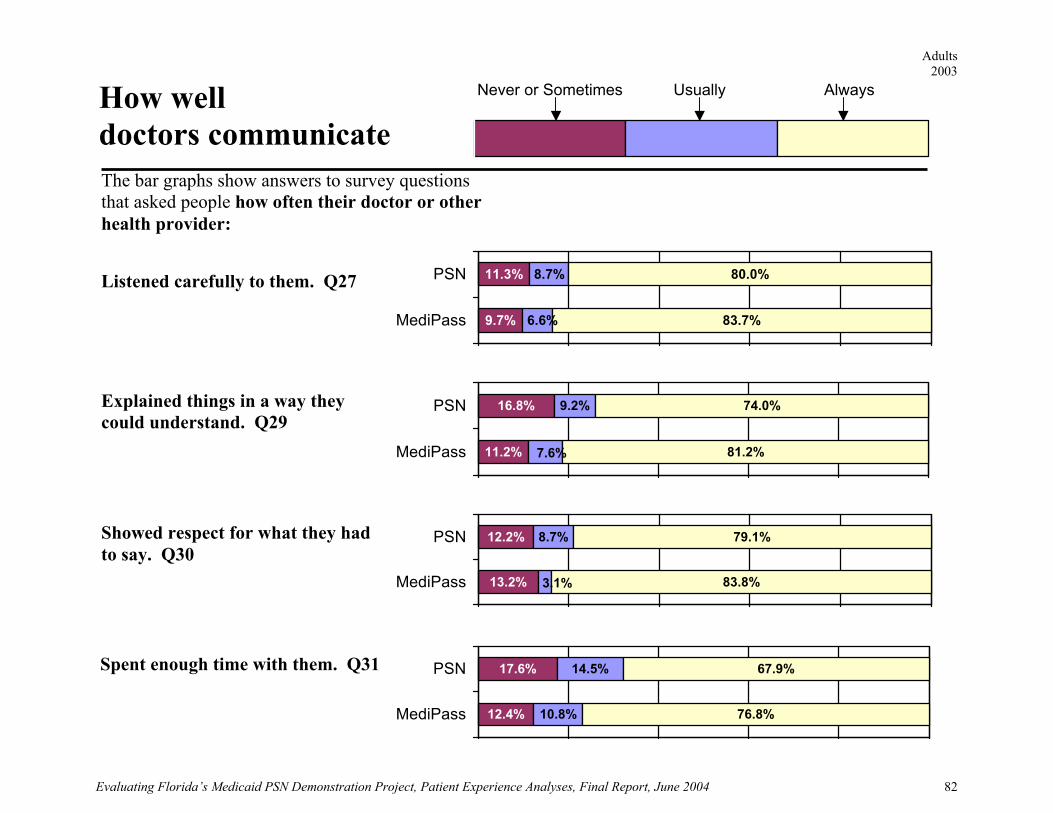
Adults 2003
Evaluating Florida’s Medicaid PSN Demonstration Project, Patient Experience Analyses, Final Report, June 2004 82
Never or Sometimes Usually Always
0% 20% 40% 60% 80% 100%
How well doctors communicate
Listened carefully to them. Q27
9.7%
11.3% 8.7%
83.7%
80.0%
6.6%
0% 20% 40% 60% 80% 100%
MediPass
PSN
Explained things in a way they could understand. Q29
Showed respect for what they had to say. Q30
Spent enough time with them. Q31
11.2%
16.8% 9.2%
81.2%
74.0%
7.6%
0% 20% 40% 60% 80% 100%
MediPass
PSN
13.2%
12.2% 8.7%
83.8%
79.1%
3.1%
0% 20% 40% 60% 80% 100%
MediPass
PSN
12.4%
17.6%
10.8%
14.5%
76.8%
67.9%
0% 20% 40% 60% 80% 100%
MediPass
PSN
The bar graphs show answers to survey questions that asked people how often their doctor or other health provider:

Adults 2003
Evaluating Florida’s Medicaid PSN Demonstration Project, Patient Experience Analyses, Final Report, June 2004 83
Never or Sometimes Usually Always
Yes No
0% 20% 40% 60% 80% 100%
0% 20% 40% 60% 80% 100%
How often did they have a hard time speaking with or understanding a doctor or other health provider because they spoke DIFFERENT LANGUAGES? Q28 90.9%
82.7%4.1%
4.1%
13.3%
5.1%
0% 20% 40% 60% 80% 100%
MediPass
PSN
Did they need an interpreter to help them speak with doctors or other health providers? Q33
12.3%
84.4%15.6%
87.8%
0% 20% 40% 60% 80% 100%
MediPass
PSN
The bar graphs show answers to survey questions that asked people, in the last 6 months,
Language barriers
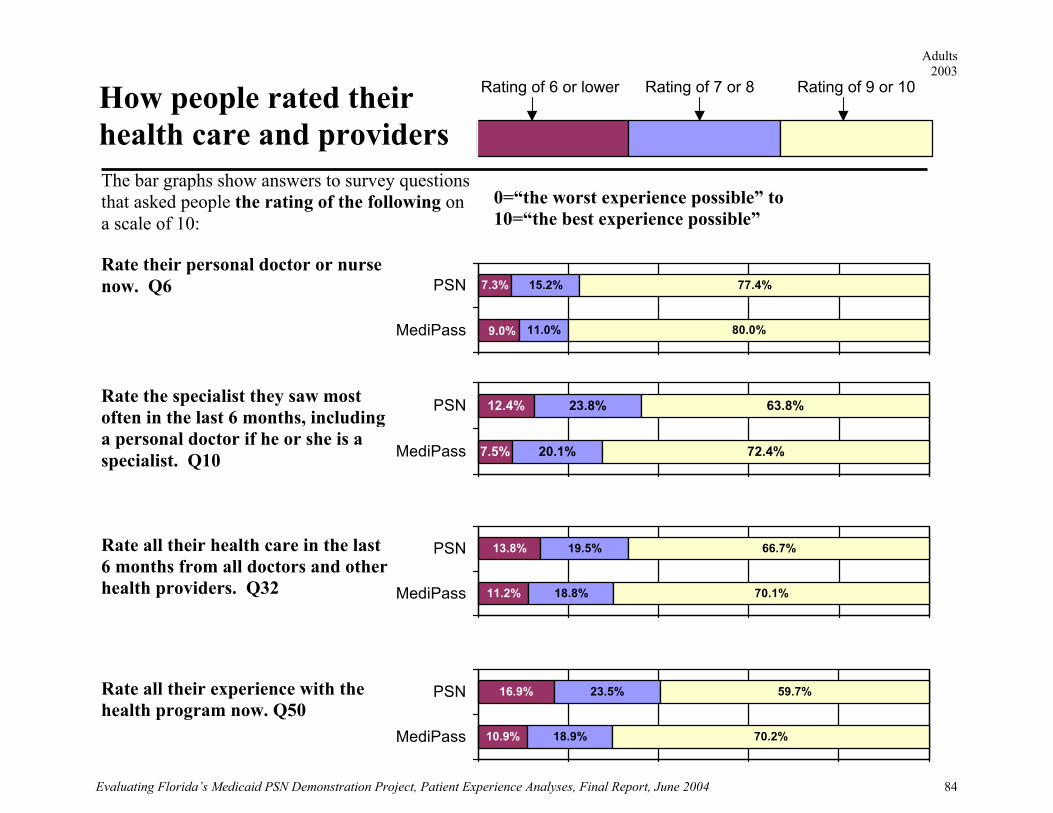
Adults 2003
Evaluating Florida’s Medicaid PSN Demonstration Project, Patient Experience Analyses, Final Report, June 2004 84
Rating of 6 or lower Rating of 7 or 8 Rating of 9 or 10
0% 20% 40% 60% 80% 100%
How people rated their health care and providers
Rate their personal doctor or nurse now. Q6 7.3%
11.0%
15.2%
80.0%
77.4%
9.0%
0% 20% 40% 60% 80% 100%
MediPass
PSN
Rate the specialist they saw most often in the last 6 months, including a personal doctor if he or she is a specialist. Q10
Rate all their health care in the last 6 months from all doctors and other health providers. Q32
Rate all their experience with the health program now. Q50
7.5%
12.4%
20.1%
23.8%
72.4%
63.8%
0% 20% 40% 60% 80% 100%
MediPass
PSN
11.2%
13.8%
18.8%
19.5%
70.1%
66.7%
0% 20% 40% 60% 80% 100%
MediPass
PSN
10.9%
16.9%
18.9%
23.5%
70.2%
59.7%
0% 20% 40% 60% 80% 100%
MediPass
PSN
The bar graphs show answers to survey questions that asked people the rating of the following on a scale of 10:
0=“the worst experience possible” to 10=“the best experience possible”

Adults 2003
Evaluating Florida’s Medicaid PSN Demonstration Project, Patient Experience Analyses, Final Report, June 2004 85
Always Never or Sometimes Usually
0% 20% 40% 60% 80% 100%
Courtesy, respect, and helpfulness of medical office staff
Treated them with courtesy and respect. Q25
11.2%
12.8%
84.7%
77.9%
4.1%
9.2%
0% 20% 40% 60% 80% 100%
Medipass
PSN
Were as helpful as they should be. Q26
12.2%
20.1%
8.2%
13.9%
79.6%
66.0%
0% 20% 40% 60% 80% 100%
MediPass
PSN
The bar graphs show answers to survey questions that asked people how often the office staff at their doctor’s office:

Adults 2003
Evaluating Florida’s Medicaid PSN Demonstration Project, Patient Experience Analyses, Final Report, June 2004 86
NO problems BIG problems SMALL problems
0% 20% 40% 60% 80% 100%
Get the help they needed when they called program’s enrollee services office. Q44 22.9%
10.2%
22.9%
30.8%
54.2%
59.0%
0% 20% 40% 60% 80% 100%
MediPass
PSN
Find or understand the information they needed in the written materials from their program. Q42
File the paperwork for their program. Q49
9.4%
33.3%
20.8%
60.6%
69.8%
6.1%
0% 20% 40% 60% 80% 100%
MediPass
PSN
15.4%
7.9%
15.4%
18.4%
69.2%
73.7%
0% 20% 40% 60% 80% 100%
MediPass
PSN
The bar graphs show answers to survey questions that asked people, in the last 6 months, how much of a problem was it to:
Program enrollee services
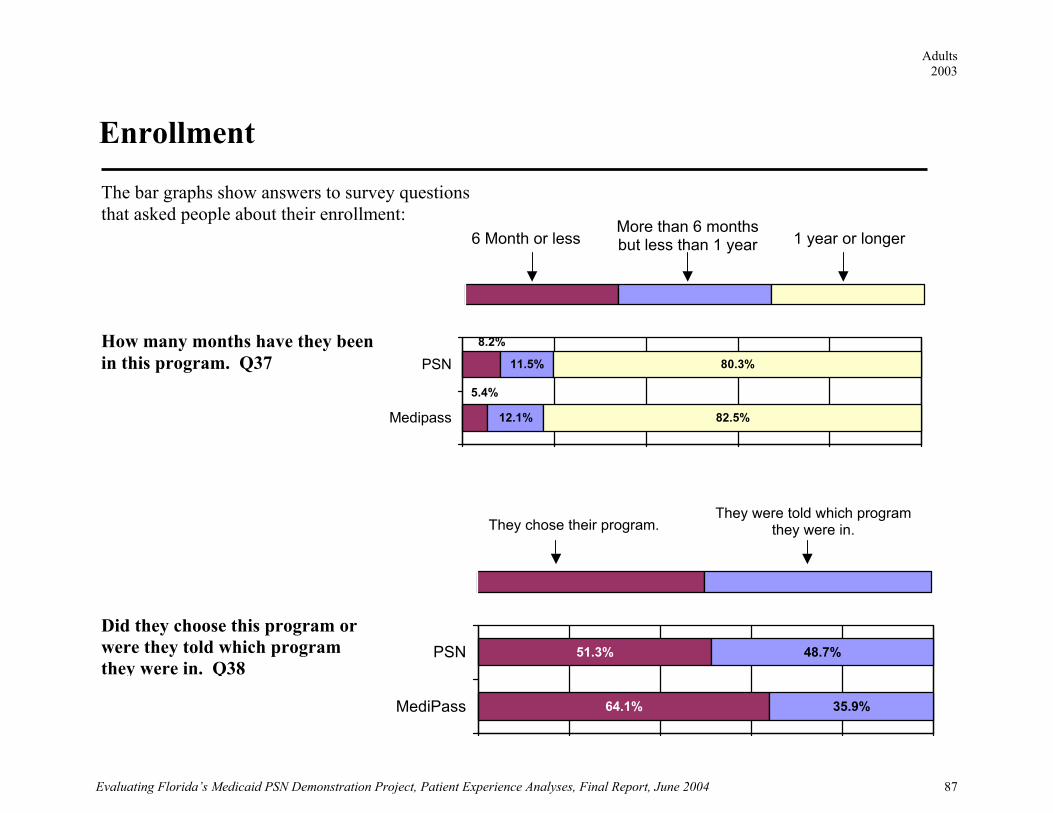
Adults 2003
Evaluating Florida’s Medicaid PSN Demonstration Project, Patient Experience Analyses, Final Report, June 2004 87
0% 20% 40% 60% 80% 100%
1 year or longer 6 Month or less More than 6 months but less than 1 year
They chose their program.They were told which program
they were in.
0% 20% 40% 60% 80% 100%
12.1%
11.5%
5.4%
8.2%
82.5%
80.3%
0% 20% 40% 60% 80% 100%
Medipass
PSN
64.1%
51.3%
35.9%
48.7%
0% 20% 40% 60% 80% 100%
MediPass
PSN
How many months have they been in this program. Q37
Did they choose this program or were they told which program they were in. Q38
The bar graphs show answers to survey questions that asked people about their enrollment:
Enrollment
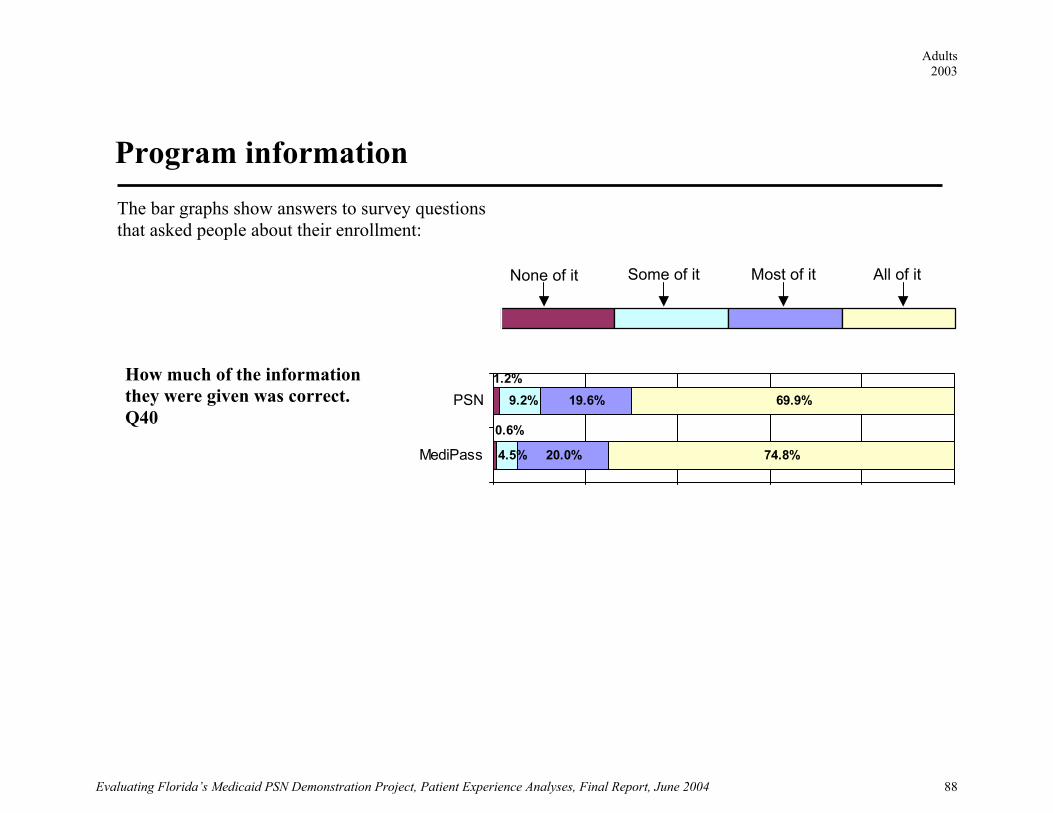
Adults 2003
Evaluating Florida’s Medicaid PSN Demonstration Project, Patient Experience Analyses, Final Report, June 2004 88
Most of it None of it All of it Some of it
0% 20% 40% 60% 80% 100%
20.0%
19.6%
74.8%
69.9%
0.6%
1.2%
4.5%
9.2%
0% 20% 40% 60% 80% 100%
MediPass
PSNHow much of the information they were given was correct. Q40
The bar graphs show answers to survey questions that asked people about their enrollment:
Program information
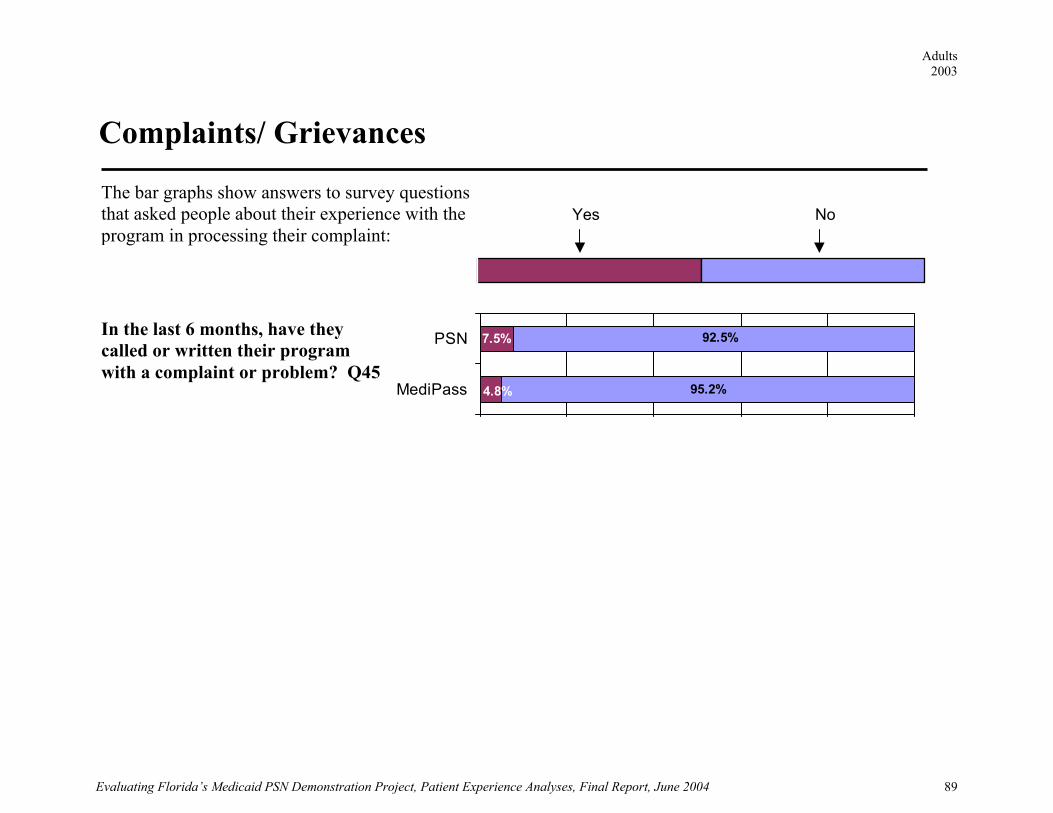
Adults 2003
Evaluating Florida’s Medicaid PSN Demonstration Project, Patient Experience Analyses, Final Report, June 2004 89
Yes No
0% 20% 40% 60% 80% 100%
7.5%
95.2%4.8%
92.5%
0 % 2 0 % 4 0 % 6 0 % 8 0 % 1 0 0 %
MediPass
PSNIn the last 6 months, have they called or written their program with a complaint or problem? Q45
The bar graphs show answers to survey questions that asked people about their experience with the program in processing their complaint:
Complaints/ Grievances
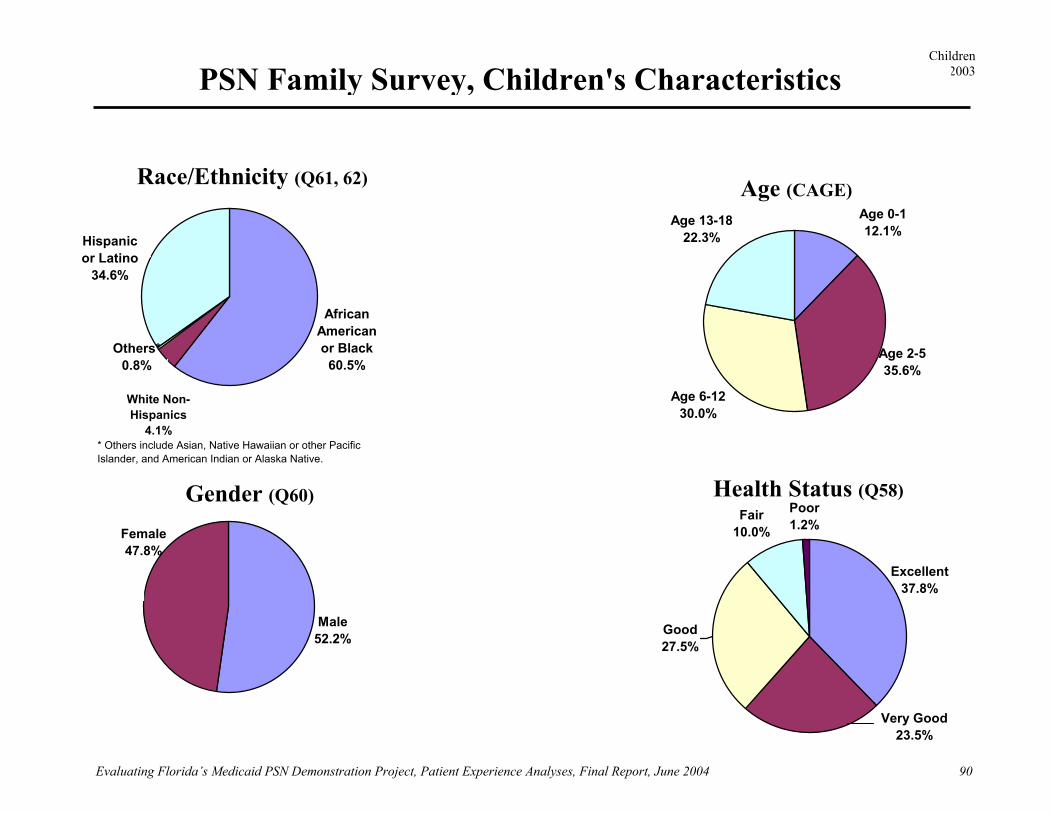
Children 2003
Evaluating Florida’s Medicaid PSN Demonstration Project, Patient Experience Analyses, Final Report, June 2004
90
Fair10.0%
Poor1.2%
Very Good23.5%
Excellent37.8%
Good27.5%
PSN Family Survey, Children's Characteristics
Age 6-1230.0%
Age 13-1822.3%
Age 0-112.1%
Age 2-535.6%
Others*0.8%
White Non-Hispanics
4.1%
Hispanic or Latino
34.6%
African American or Black
60.5%
* Others include Asian, Native Hawaiian or other Pacific Islander, and American Indian or Alaska Native.
Race/Ethnicity (Q61, 62) Age (CAGE)
Male52.2%
Female47.8%
Health Status (Q58)Gender (Q60)

Children 2003
Evaluating Florida’s Medicaid PSN Demonstration Project, Patient Experience Analyses, Final Report, June 2004
91
African American
17.7%
Hispanic or Latino
75.9%
Others*0.8%
White Non-Hispanic
5.6%
* Others include Asian, Native Hawaiian or other Pacific Islander, and American Indian or Alaska Native.
Excellent42.5%
Poor1.2%
Good20.9%
Fair10.2%
Very good25.2%
MediPass Family Survey, Children's Characteristics
Age 6-1234.0%
Age 13-1824.9%
Age 2-530.8%
Age 0-110.3%
Race/Ethnicity (Q61, 62) Age (CAGE)
Male52.0%
Female48.0%
Health Status (Q58)
Gender (Q60)

Children 2003
Evaluating Florida’s Medicaid PSN Demonstration Project, Patient Experience Analyses, Final Report, June 2004
92
BIG problems SMALL problems NO problems
0% 20% 40% 60% 80% 100%
Find a personal doctor or nurse they were happy with. Q4
93.9%
95.0%
3.7%
3.3%
2.4%
1.7%
0% 20% 40% 60% 80% 100%
MediPass
PSN
Get a referral to a specialist that they wanted to see. Q8
Get the care they or a doctor believed necessary. Q22
Delay care while waiting for approval from your program. Q23
9.8%
17.9%
15.9%
9.0%
74.4%
73.1%
0% 20% 40% 60% 80% 100%
MediPass
PSN
16.1%
20.7%
80.3%
73.8%
3.7%
5.5%
0% 20% 40% 60% 80% 100%
Medipass
PSN
88.0%
82.8%6.1%
2.8%
11.0%
9.2%
0% 20% 40% 60% 80% 100%
MediPass
PSN
The bar graphs show answers to survey questions that asked people, in the last 6 months, how much of a problem it was to:
Getting child's needed care

Children 2003
Evaluating Florida’s Medicaid PSN Demonstration Project, Patient Experience Analyses, Final Report, June 2004
93
0% 20% 40% 60% 80% 100%
Same day 1 to 3 days 4 to 14 days 15 days or longer
84.4%
70.8% 20.0%
11.7% 2.6%
4.6%4.6%
1.3%
0% 20% 40% 60% 80% 100%
MediPass
PSN
0% 20% 40% 60% 80% 100%
Wait between making an appointment and actually seeing a provider for regular or routine care. Q16
72.8%
54.4%
18.3%
27.9% 13.2%4.4%
3.9%
5.0%
0% 20% 40% 60% 80% 100%
Medipass
PSN
Wait between trying to get care and actually seeing a provider for an illness or injury. Q19
The bar graphs show answers to survey questions that asked people, in the last 6 months, how many days did you usually have to:
Same day to 3 days 4 to 14 days 15 to 29 days 30 days or longer
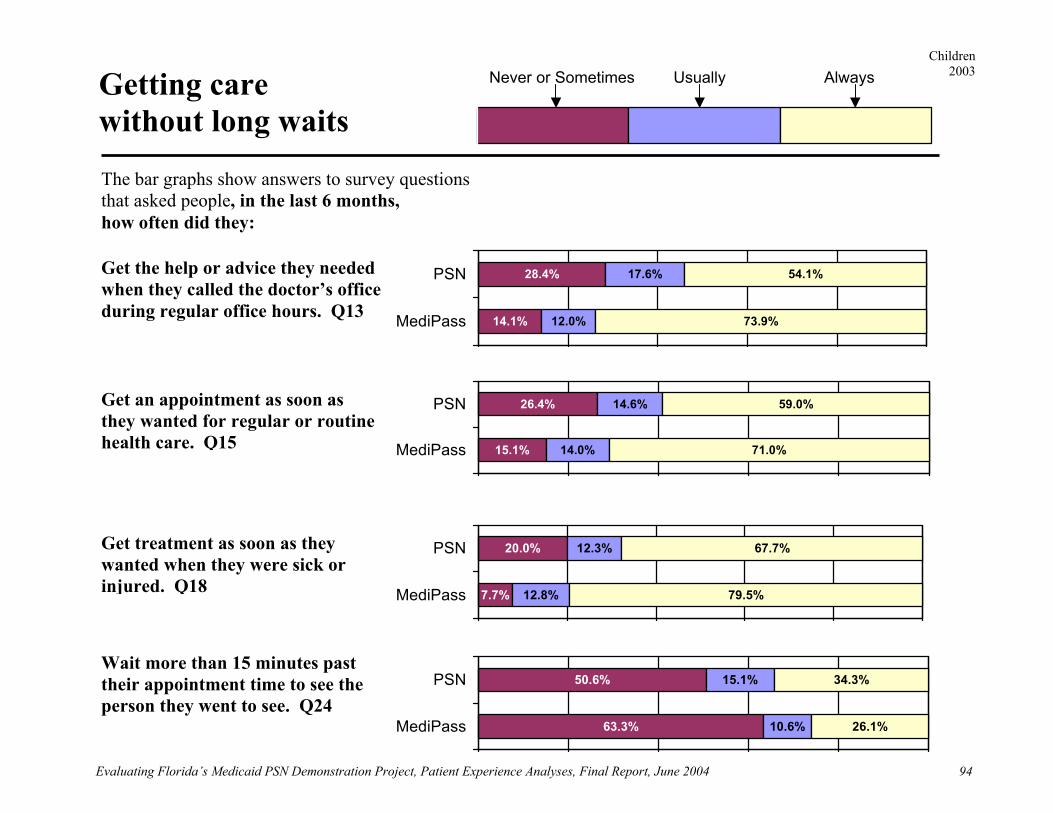
Children 2003
Evaluating Florida’s Medicaid PSN Demonstration Project, Patient Experience Analyses, Final Report, June 2004
94
Never or Sometimes Usually Always
0% 20% 40% 60% 80% 100%
Getting care without long waits
Get the help or advice they needed when they called the doctor’s office during regular office hours. Q13 14.1%
28.4%
12.0%
17.6%
73.9%
54.1%
0% 20% 40% 60% 80% 100%
MediPass
PSN
Get treatment as soon as they wanted when they were sick or injured. Q18
Get an appointment as soon as they wanted for regular or routine health care. Q15
Wait more than 15 minutes past their appointment time to see the person they went to see. Q24
7.7%
20.0%
12.8%
12.3%
79.5%
67.7%
0% 20% 40% 60% 80% 100%
MediPass
PSN
15.1%
26.4%
14.0%
14.6%
71.0%
59.0%
0% 20% 40% 60% 80% 100%
MediPass
PSN
63.3%
50.6%
10.6%
15.1%
26.1%
34.3%
0% 20% 40% 60% 80% 100%
MediPass
PSN
The bar graphs show answers to survey questions that asked people, in the last 6 months, how often did they:
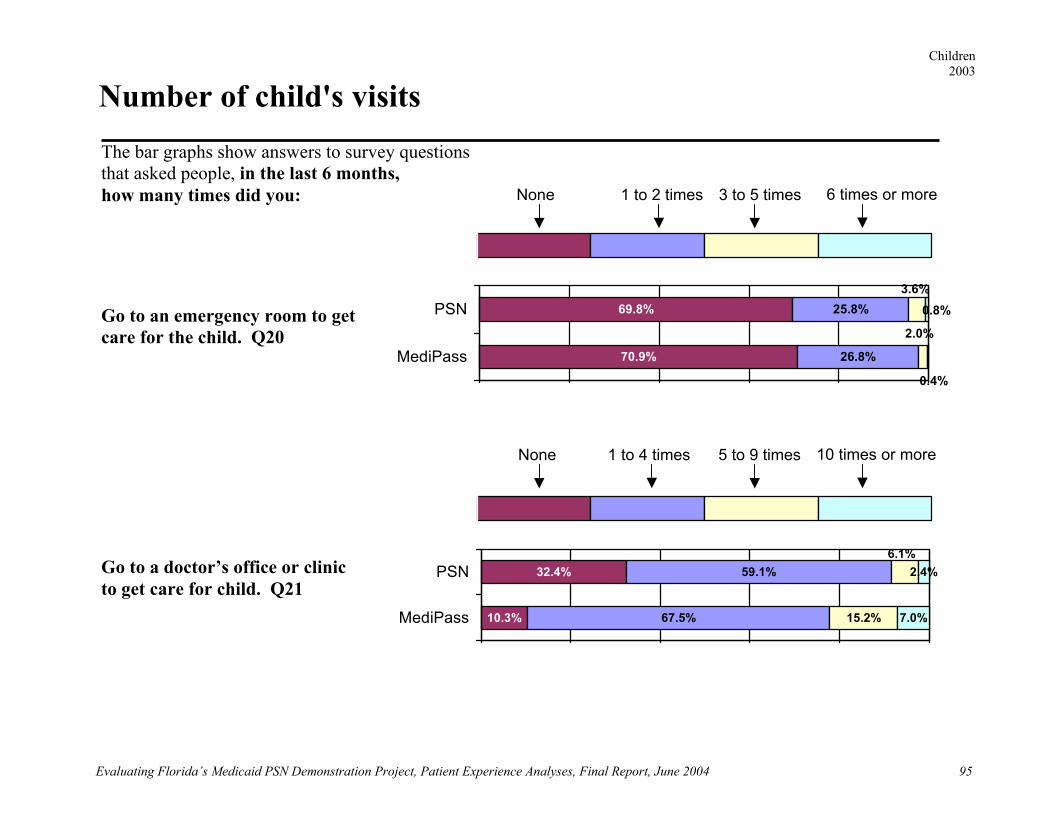
Children 2003
Evaluating Florida’s Medicaid PSN Demonstration Project, Patient Experience Analyses, Final Report, June 2004
95
0% 20% 40% 60% 80% 100%
0% 20% 40% 60% 80% 100%
Go to an emergency room to get care for the child. Q20
70.9%
69.8%
26.8%
25.8%3.6%
2.0%
0.4%
0.8%
0% 20% 40% 60% 80% 100%
MediPass
PSN
Go to a doctor’s office or clinic to get care for child. Q21
10.3%
32.4%
67.5%
59.1%
15.2% 7.0%
2.4%6.1%
0% 20% 40% 60% 80% 100%
MediPass
PSN
The bar graphs show answers to survey questions that asked people, in the last 6 months, how many times did you:
Number of child's visits
None 1 to 2 times 3 to 5 times 6 times or more
None 1 to 4 times 5 to 9 times 10 times or more
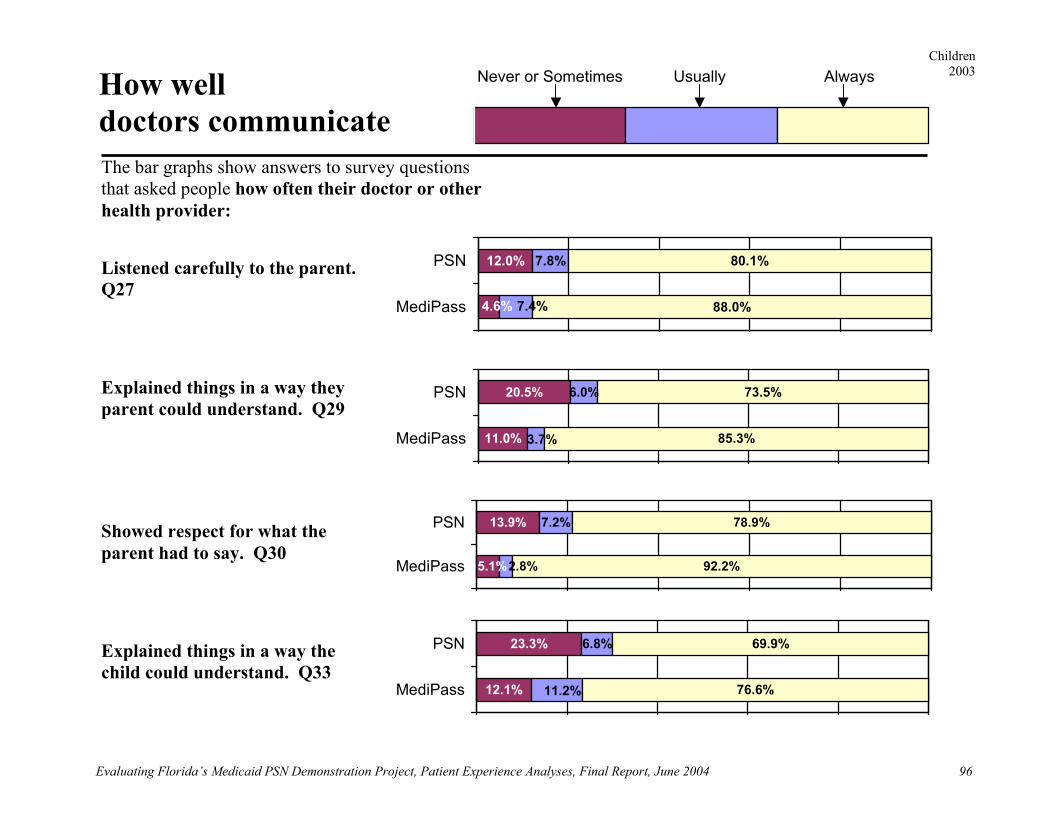
Children 2003
Evaluating Florida’s Medicaid PSN Demonstration Project, Patient Experience Analyses, Final Report, June 2004
96
Never or Sometimes Usually Always
0% 20% 40% 60% 80% 100%
How well doctors communicate
Listened carefully to the parent. Q27
12.0% 7.8%
88.0%
80.1%
4.6% 7.4%
0% 20% 40% 60% 80% 100%
MediPass
PSN
Explained things in a way they parent could understand. Q29
Showed respect for what the parent had to say. Q30
11.0%
20.5% 6.0%
85.3%
73.5%
3.7%
0% 20% 40% 60% 80% 100%
MediPass
PSN
13.9% 7.2%
92.2%
78.9%
5.1%2.8%
0% 20% 40% 60% 80% 100%
MediPass
PSN
The bar graphs show answers to survey questions that asked people how often their doctor or other health provider:
12.1%
23.3% 6.8%
76.6%
69.9%
11.2%
0% 20% 40% 60% 80% 100%
MediPass
PSNExplained things in a way the child could understand. Q33

Children 2003
Evaluating Florida’s Medicaid PSN Demonstration Project, Patient Experience Analyses, Final Report, June 2004
97
Never or Sometimes Usually Always
0% 20% 40% 60% 80% 100%
How often did the parent have a hard time speaking with or understanding a doctor or other health provider because they spoke DIFFERENT LANGUAGES? Q28 90.4%
85.6%2.4%
1.4%
12.0%
8.3%
0% 20% 40% 60% 80% 100%
MediPass
PSN
The bar graphs show answers to survey questions that asked people, in the last 6 months,
Language barriers
93.5%
87.7% 2.7%
3.7%2.8%
9.6%
0% 20% 40% 60% 80% 100%
MediPass
PSNHow often did the child have a hard time speaking or understanding doctors because they spoke DIFFERENT LANGUAGES? Q32
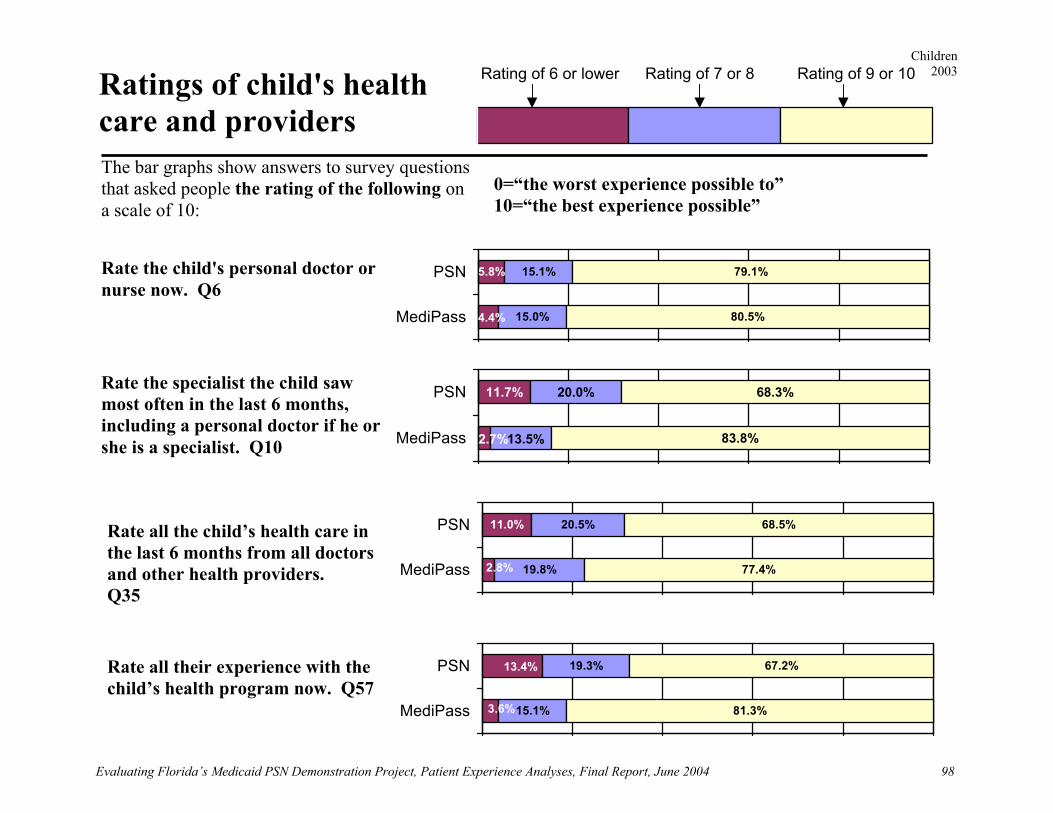
Children 2003
Evaluating Florida’s Medicaid PSN Demonstration Project, Patient Experience Analyses, Final Report, June 2004
98
Rating of 6 or lower Rating of 7 or 8 Rating of 9 or 10
0% 20% 40% 60% 80% 100%
Ratings of child's health care and providers
Rate the child's personal doctor or nurse now. Q6
5.8%
15.0%
15.1%
80.5%
79.1%
4.4%
0% 20% 40% 60% 80% 100%
MediPass
PSN
Rate the specialist the child saw most often in the last 6 months, including a personal doctor if he or she is a specialist. Q10
Rate all the child’s health care in the last 6 months from all doctors and other health providers. Q35
11.7% 20.0%
83.8%
68.3%
2.7%13.5%
0% 20% 40% 60% 80% 100%
MediPass
PSN
11.0%
19.8%
20.5%
77.4%
68.5%
2.8%
0% 20% 40% 60% 80% 100%
MediPass
PSN
The bar graphs show answers to survey questions that asked people the rating of the following on a scale of 10:
0=“the worst experience possible to” 10=“the best experience possible”
Rate all their experience with the child’s health program now. Q57 15.1%
19.3%
81.3%
67.2%13.4%
3.6%
0% 20% 40% 60% 80% 100%
MediPass
PSN

Children 2003
Evaluating Florida’s Medicaid PSN Demonstration Project, Patient Experience Analyses, Final Report, June 2004
99
Always Never or Sometimes Usually
0% 20% 40% 60% 80% 100%
Courtesy, respect, and helpfulness of medical office staff
Treated them with courtesy and respect. Q25
10.1%
19.3%
85.8%
73.5%
4.1%
7.2%
0% 20% 40% 60% 80% 100%
Medipass
PSN
Were as helpful as they should be. Q26
7.4%
19.0%
9.7%
17.8%
82.9%
63.2%
0% 20% 40% 60% 80% 100%
MediPass
PSN
The bar graphs show answers to survey questions that asked people how often the office staff at their doctor’s office:
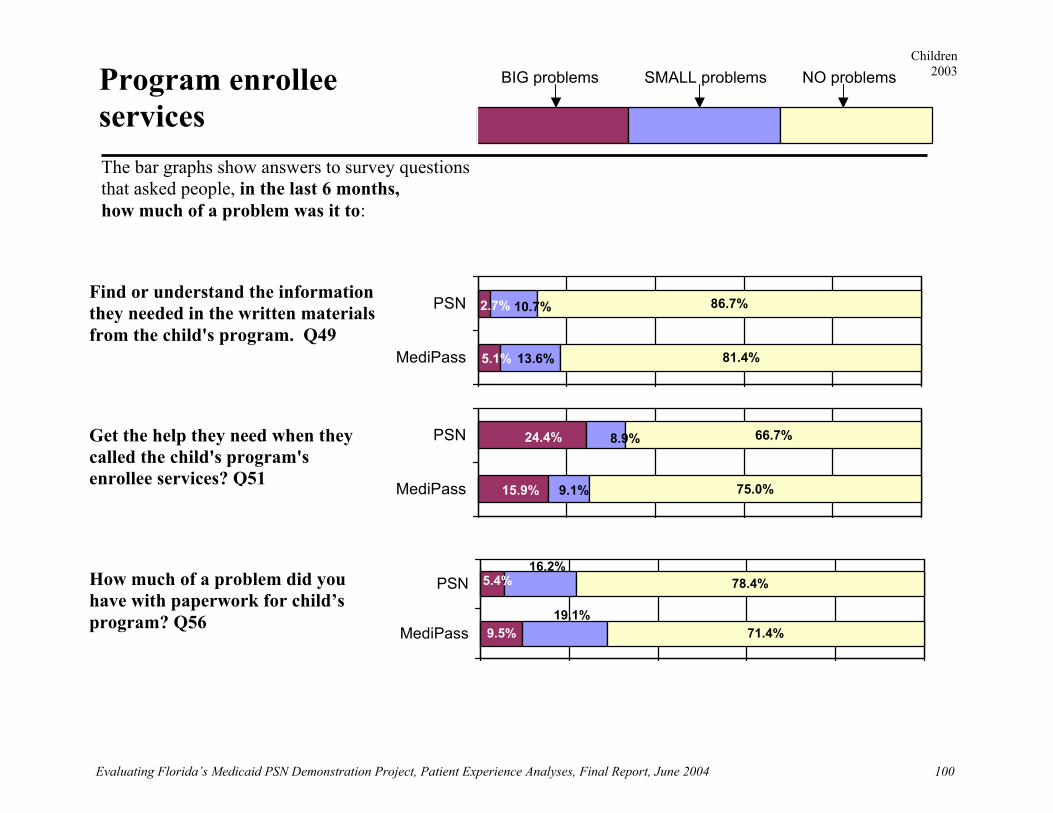
Children 2003
Evaluating Florida’s Medicaid PSN Demonstration Project, Patient Experience Analyses, Final Report, June 2004
100
NO problems BIG problems SMALL problems
0% 20% 40% 60% 80% 100%
How much of a problem did you have with paperwork for child’s program? Q56
9.5% 71.4%
78.4%5.4%
19.1%
16.2%
0% 20% 40% 60% 80% 100%
MediPass
PSN
Find or understand the information they needed in the written materials from the child's program. Q49
81.4%
86.7%
5.1%
2.7%
13.6%
10.7%
0% 20% 40% 60% 80% 100%
MediPass
PSN
The bar graphs show answers to survey questions that asked people, in the last 6 months, how much of a problem was it to:
Program enrollee services
75.0%
66.7%
15.9%
24.4%
9.1%
8.9%
0% 20% 40% 60% 80% 100%
MediPass
PSNGet the help they need when they called the child's program's enrollee services? Q51

Children 2003
Evaluating Florida’s Medicaid PSN Demonstration Project, Patient Experience Analyses, Final Report, June 2004
101
0% 20% 40% 60% 80% 100%
1 year or longer 6 Month or less More than 6 months but less than 1 year
They chose their program.They were told which program
they were in.
0% 20% 40% 60% 80% 100%
81.3%
56.3%
18.8%
43.7%
0% 20% 40% 60% 80% 100%
MediPass
PSN
How many months has the child they been in this program. Q44
Did they choose this program or were they told which program the child was in. Q45
The bar graphs show answers to survey questions that asked people about their enrollment:
Child's Enrollment
13.4%
3.6%
7.1%
9.7% 86.6%
79.5%
0% 20% 40% 60% 80% 100%
MediPass
PSN
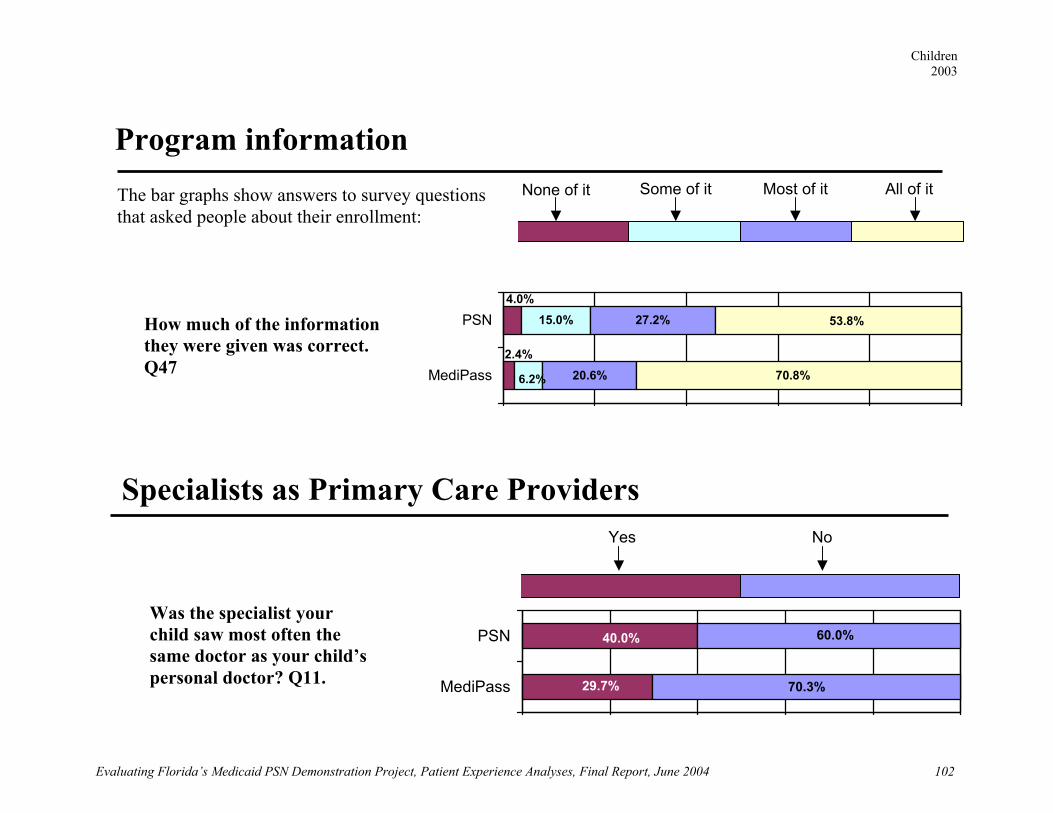
Children 2003
Evaluating Florida’s Medicaid PSN Demonstration Project, Patient Experience Analyses, Final Report, June 2004
102
15.0%
20.6%
27.2%4.0%
2.4%
6.2% 70.8%
53.8%
0% 20% 40% 60% 80% 100%
MediPass
PSNHow much of the information they were given was correct. Q47
The bar graphs show answers to survey questions that asked people about their enrollment:
Program information
0 % 2 0 % 4 0 % 6 0 % 8 0 % 1 0 0 %
Most of it None of it All of it Some of it
0 % 2 0 % 4 0 % 6 0 % 8 0 % 1 0 0 %
Yes No
70.3%
40.0%
29.7%
60.0%
0% 20% 40% 60% 80% 100%
MediPass
PSNWas the specialist your child saw most often the same doctor as your child’s personal doctor? Q11.
Specialists as Primary Care Providers
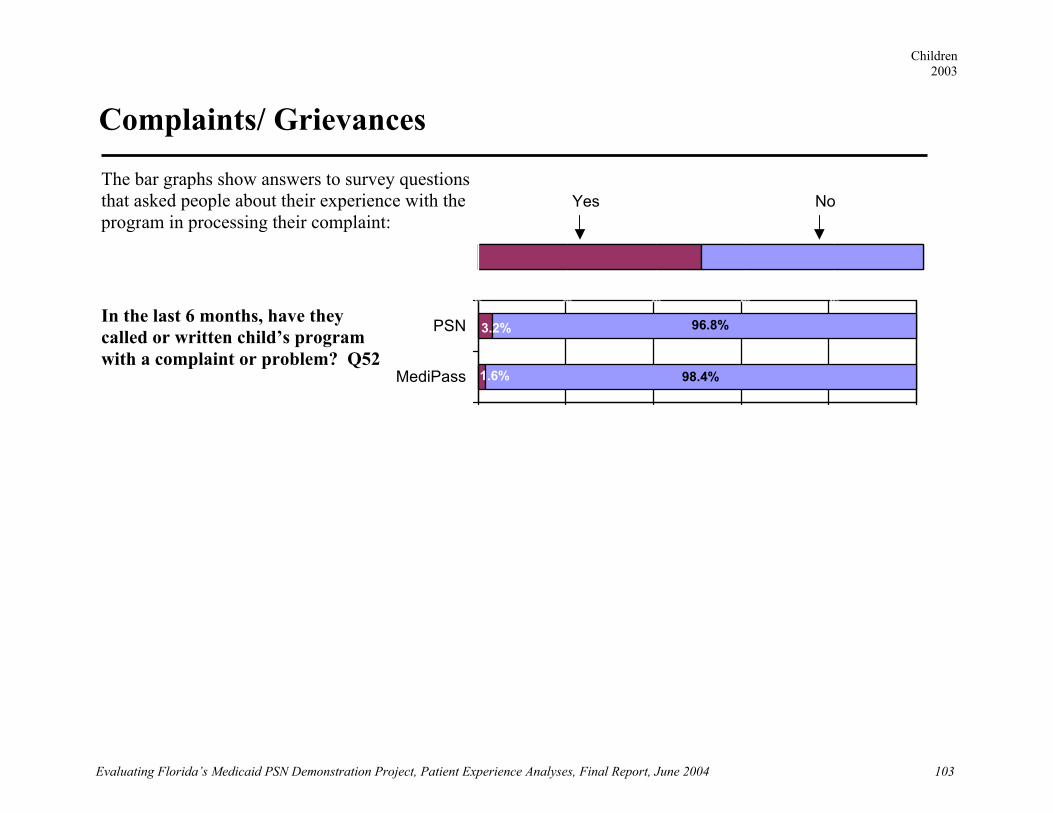
Children 2003
Evaluating Florida’s Medicaid PSN Demonstration Project, Patient Experience Analyses, Final Report, June 2004
103
Yes No
0% 20% 40% 60% 80% 100%
98.4%
3.2%
1.6%
96.8%
0% 20% 40% 60% 80% 100%
MediPass
PSNIn the last 6 months, have they called or written child’s program with a complaint or problem? Q52
The bar graphs show answers to survey questions that asked people about their experience with the program in processing their complaint:
Complaints/ Grievances
0% 20% 40% 60% 80% 100%

Evaluating Florida’s Medicaid PSN Demonstration Project Patient Experience Analyses Final Report, June 2004
105
Discussion Overall, enrollees were satisfied with the health care received for themselves or for their children. Both the PSN and MediPass are seen positively, as making a difference in the lives of their participants. For the most part, survey respondents reported that they or their children get the health care they need when they need it, and in a manner that treats them with dignity. On many measures of satisfaction, respondents reporting about the care of their children gave higher ratings than respondents reporting on their own care. For example, when it came to finding a personal doctor or nurse that they were happy with, "no problem" was reported for 95.0% of PSN children compared to 73.3% of PSN adults. In MediPass the pattern was similar, with "no problem" reported for 93.9% of children and 84.6% of adults. Overall, there were some modest but statistically significant differences between the two programs in the perceptions expressed by enrollees. In general, where there were differences, MediPass had the more positive scores. For example, PSN enrollees reported somewhat longer waits between making an appointment and seeing the health care provider. While PSN enrollees reported lower rates of utilization, fewer visits should not be automatically interpreted negatively. For example, in looking at the children's data, there is a marked difference in the percentage saying that a specialist is their personal doctor (40% for the PSN, compared to about 30% for MediPass). Patients who must see a "gatekeeper" primary care provider who is not a specialist will likely take more visits to accomplish the same number of procedures or tests. So patients with a specialist as their personal doctor may indeed receive a high level of care in fewer visits. In attempting to understand the differences between the ratings for the PSN and for MediPass, it should be noted that in the 2003 sample, there were significant differences in the demographics of respondents. Not only were there more individuals reporting a race/ethnicity of "Hispanic" in MediPass than for the PSN, but in looking at the primary language spoken at home, the percentage of English speakers was 55.6% for the PSN, but only about half that (27.9%) for MediPass. It is difficult to sort out whether different levels of satisfaction are a result of the different programs, or a reflection of the different groups of enrollees. Some previous studies have found higher rates of satisfaction expressed among Hispanics.5
5 See for example Roohan P.J., Franko S.J., Anarella J.P., Dellehunt L.K., & Gesten F.C. (2003) Do commercial managed care members rate their health plans differently than Medicaid managed care members? Health Services Research, 38 (4): 1121-1134.


Appendix B

Appendix B—Detailed results and standard errors for PSN & MediPass, 2003—Adults
Evaluating Florida’s Medicaid PSN Demonstration Project, Final Report, June 2004 108
This table presents all the data collected on the surveys. Data are presented in the order of the standard CAHPS telephone script, adhering to that numbering system (thus question 35 is skipped because it was not appropriate for this population.) When data for an item are also presented in the “Findings” section, the corresponding page number is in parentheses under the question descriptor in the far left column. A p-value for testing the statistical significance of the observed difference between the PSN and MediPass responses is also noted for those items. Columns may not sum exactly to 100% due to rounding.
PSN MediPass n=251 n=256 Age
(pp. 76, 77) Frequency Percent Standard
Error Frequency Percent Standard Error
18-24 10 4.0 1.24 8 3.2 1.11 25-34 31 12.4 2.10 26 10.4 1.93 35-44 51 20.4 2.55 51 20.4 2.55 45-54 66 26.4 2.79 48 19.2 2.49 55-64 55 22.0 2.62 61 24.4 2.72
65 or older 37 14.8 2.25 56 22.4 2.64
PSN MediPass n=253 n=252 Gender
(pp. 76, 77) Frequency Percent Standard
Error Frequency Percent Standard Error
Male 79 31.2 2.92 73 29.0 2.86
Female 174 68.8 2.92 179 71.0 2.86
PSN MediPass
n=244 n=247 Q3. Received New
Doctor or Nurse When Enrolled
Frequency Percent Standard Error Frequency Percent Standard
Error Yes 88 36.1 3.08 105 42.5 3.15
No 156 63.9 3.08 142 57.5 3.15

Appendix B—Detailed results and standard errors for PSN & MediPass, 2003—Adults
Evaluating Florida’s Medicaid PSN Demonstration Project, Final Report, June 2004 109
PSN MediPass n=86 n=104
Q4. How Much of a Problem to Get Satisfactory Doctor or Nurse
(p. 78) Frequency Percent Standard Error Frequency Percent Standard Error
Big Problem 13 15.1 3.89 11 10.6 3.03 Small Problem 10 11.6 3.48 5 4.8 2.11
No Problem 63 73.3 4.80 88 84.6 3.56
p=0.119
PSN MediPass n=249 n=248 Q5. Has a Personal Doctor or Nurse
Frequency Percent Standard Error Frequency Percent Standard Error
Yes 169 67.9 2.97 203 81.9 2.45
No 80 32.1 2.97 45 18.1 2.45
PSN MediPass
n=164 n=200 Q6. Rating of Personal Doctor or Nurse
(p. 84) Frequency Percent Standard Error Frequency Percent Standard Error
0 through 6 12 7.3 2.04 18 9.0 2.03 7 or 8 25 15.2 2.82 22 11.0 2.22
9 or 10 127 77.4 3.27 160 80.0 2.84 p=0.442
PSN MediPass
n=252 n=248 Q7. Needed a Specialist
Frequency Percent Standard Error Frequency Percent Standard Error
Yes 117 46.4 3.15 137 55.2 3.16
No 135 53.6 3.15 111 44.8 3.16

Appendix B—Detailed results and standard errors for PSN & MediPass, 2003—Adults
Evaluating Florida’s Medicaid PSN Demonstration Project, Final Report, June 2004 110
PSN MediPass
n=111 n=134
Q8. How Much of a Problem to Get
Referral for Specialist (p. 78) Frequency Percent Standard
Error Frequency Percent Standard Error
Big Problem 21 18.9 3.73 20 14.9 3.09 Small Problem 21 18.9 3.73 10 7.5 2.28 Not a Problem 69 62.2 4.62 104 77.6 3.61
p=0.012
PSN MediPass n=247 n=252 Q9. Saw a Specialist
Frequency Percent Standard Error Frequency Percent Standard
Error Yes 110 44.5 3.17 137 54.4 3.14 No 137 55.5 3.17 115 45.6 3.14
PSN MediPass n=105 n=134
Q10. Rating of Specialist
(p. 84) Frequency Percent Standard
Error Frequency Percent Standard Error
0 through 6 13 12.4 3.23 10 7.5 2.28 7 or 8 25 23.8 4.18 27 20.1 3.48 9 or 10 67 63.8 4.71 97 72.4 3.88
p=0.293
PSN MediPass n=109 n=137 Q11. Specialist Same
as Personal Doctor Frequency Percent Standard
Error Frequency Percent Standard Error
Yes 44 40.4 4.72 64 46.7 4.28 No 65 59.6 4.72 73 53.3 4.28
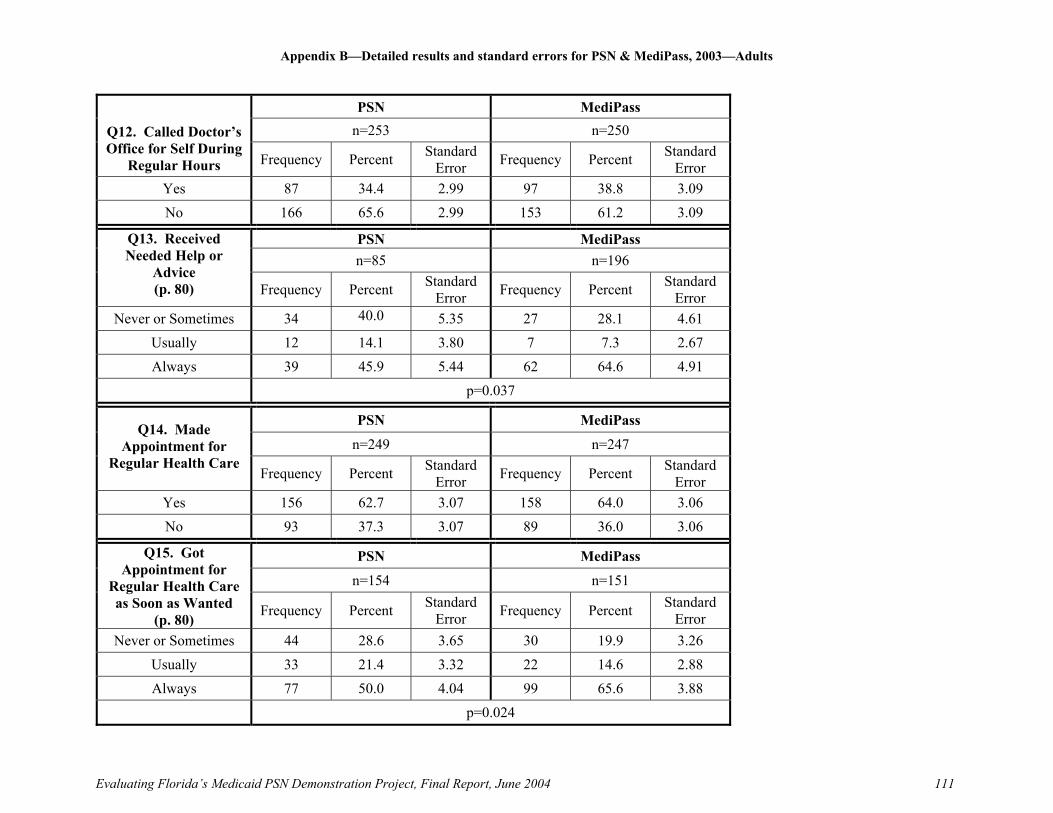
Appendix B—Detailed results and standard errors for PSN & MediPass, 2003—Adults
Evaluating Florida’s Medicaid PSN Demonstration Project, Final Report, June 2004 111
PSN MediPass
n=253 n=250 Q12. Called Doctor’s Office for Self During
Regular Hours Frequency Percent Standard Error Frequency Percent Standard
Error Yes 87 34.4 2.99 97 38.8 3.09 No 166 65.6 2.99 153 61.2 3.09
PSN MediPass n=85 n=196
Q13. Received Needed Help or
Advice (p. 80) Frequency Percent Standard
Error Frequency Percent Standard Error
Never or Sometimes 34 40.0 5.35 27 28.1 4.61 Usually 12 14.1 3.80 7 7.3 2.67 Always 39 45.9 5.44 62 64.6 4.91
p=0.037
PSN MediPass
n=249 n=247 Q14. Made
Appointment for Regular Health Care
Frequency Percent Standard Error Frequency Percent Standard
Error Yes 156 62.7 3.07 158 64.0 3.06 No 93 37.3 3.07 89 36.0 3.06
PSN MediPass
n=154 n=151
Q15. Got Appointment for
Regular Health Care as Soon as Wanted
(p. 80) Frequency Percent Standard Error Frequency Percent Standard
Error Never or Sometimes 44 28.6 3.65 30 19.9 3.26
Usually 33 21.4 3.32 22 14.6 2.88 Always 77 50.0 4.04 99 65.6 3.88
p=0.024
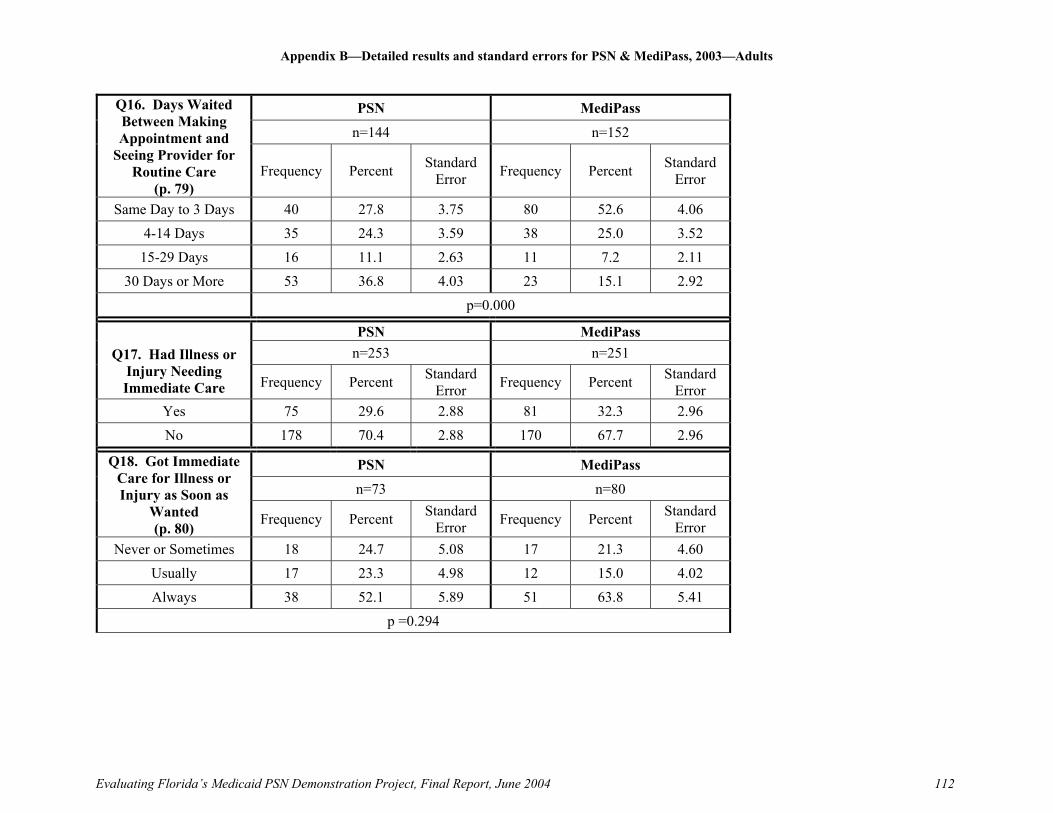
Appendix B—Detailed results and standard errors for PSN & MediPass, 2003—Adults
Evaluating Florida’s Medicaid PSN Demonstration Project, Final Report, June 2004 112
PSN MediPass
n=144 n=152
Q16. Days Waited Between Making Appointment and
Seeing Provider for Routine Care
(p. 79) Frequency Percent Standard
Error Frequency Percent Standard Error
Same Day to 3 Days 40 27.8 3.75 80 52.6 4.06 4-14 Days 35 24.3 3.59 38 25.0 3.52
15-29 Days 16 11.1 2.63 11 7.2 2.11 30 Days or More 53 36.8 4.03 23 15.1 2.92
p=0.000
PSN MediPass n=253 n=251 Q17. Had Illness or
Injury Needing Immediate Care Frequency Percent Standard
Error Frequency Percent Standard Error
Yes 75 29.6 2.88 81 32.3 2.96 No 178 70.4 2.88 170 67.7 2.96
PSN MediPass
n=73 n=80
Q18. Got Immediate Care for Illness or Injury as Soon as
Wanted (p. 80) Frequency Percent Standard
Error Frequency Percent Standard Error
Never or Sometimes 18 24.7 5.08 17 21.3 4.60 Usually 17 23.3 4.98 12 15.0 4.02 Always 38 52.1 5.89 51 63.8 5.41
p =0.294
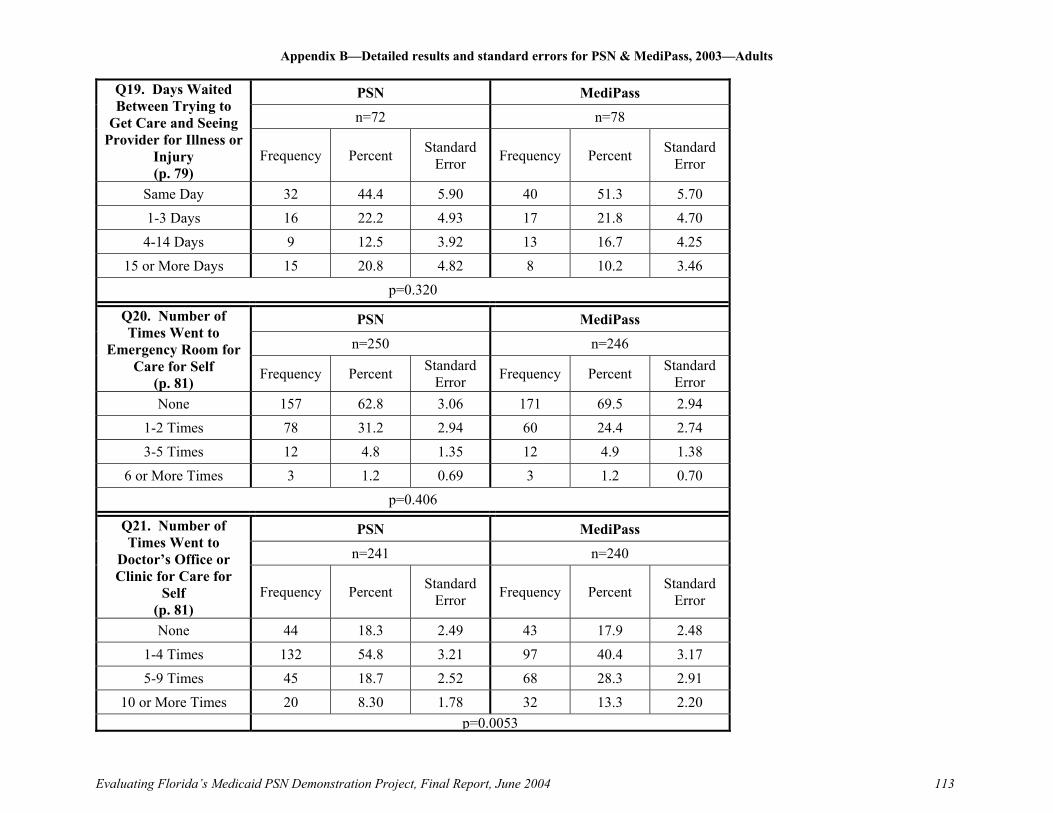
Appendix B—Detailed results and standard errors for PSN & MediPass, 2003—Adults
Evaluating Florida’s Medicaid PSN Demonstration Project, Final Report, June 2004 113
PSN MediPass
n=72 n=78
Q19. Days Waited Between Trying to
Get Care and Seeing Provider for Illness or
Injury (p. 79)
Frequency Percent Standard Error Frequency Percent Standard
Error
Same Day 32 44.4 5.90 40 51.3 5.70 1-3 Days 16 22.2 4.93 17 21.8 4.70
4-14 Days 9 12.5 3.92 13 16.7 4.25 15 or More Days 15 20.8 4.82 8 10.2 3.46
p=0.320
PSN MediPass
n=250 n=246
Q20. Number of Times Went to
Emergency Room for Care for Self
(p. 81) Frequency Percent Standard Error Frequency Percent Standard
Error None 157 62.8 3.06 171 69.5 2.94
1-2 Times 78 31.2 2.94 60 24.4 2.74 3-5 Times 12 4.8 1.35 12 4.9 1.38
6 or More Times 3 1.2 0.69 3 1.2 0.70 p=0.406
PSN MediPass
n=241 n=240
Q21. Number of Times Went to
Doctor’s Office or Clinic for Care for
Self (p. 81)
Frequency Percent Standard Error Frequency Percent Standard
Error
None 44 18.3 2.49 43 17.9 2.48 1-4 Times 132 54.8 3.21 97 40.4 3.17 5-9 Times 45 18.7 2.52 68 28.3 2.91
10 or More Times 20 8.30 1.78 32 13.3 2.20 p=0.0053
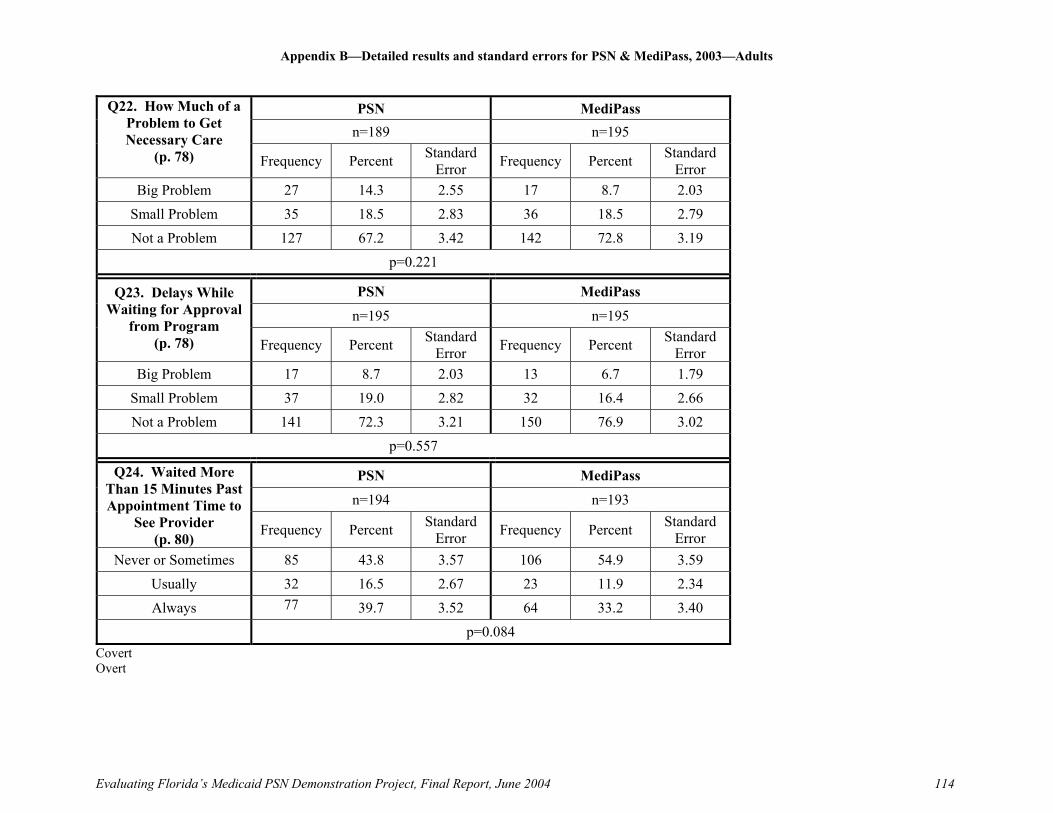
Appendix B—Detailed results and standard errors for PSN & MediPass, 2003—Adults
Evaluating Florida’s Medicaid PSN Demonstration Project, Final Report, June 2004 114
PSN MediPass
n=189 n=195
Q22. How Much of a Problem to Get Necessary Care
(p. 78) Frequency Percent Standard Error Frequency Percent Standard
Error Big Problem 27 14.3 2.55 17 8.7 2.03
Small Problem 35 18.5 2.83 36 18.5 2.79 Not a Problem 127 67.2 3.42 142 72.8 3.19
p=0.221
PSN MediPass
n=195 n=195 Q23. Delays While
Waiting for Approval from Program
(p. 78) Frequency Percent Standard Error Frequency Percent Standard
Error Big Problem 17 8.7 2.03 13 6.7 1.79
Small Problem 37 19.0 2.82 32 16.4 2.66 Not a Problem 141 72.3 3.21 150 76.9 3.02
p=0.557
PSN MediPass
n=194 n=193
Q24. Waited More Than 15 Minutes Past Appointment Time to
See Provider (p. 80) Frequency Percent Standard
Error Frequency Percent Standard Error
Never or Sometimes 85 43.8 3.57 106 54.9 3.59 Usually 32 16.5 2.67 23 11.9 2.34 Always 77 39.7 3.52 64 33.2 3.40
p=0.084 Covert Overt
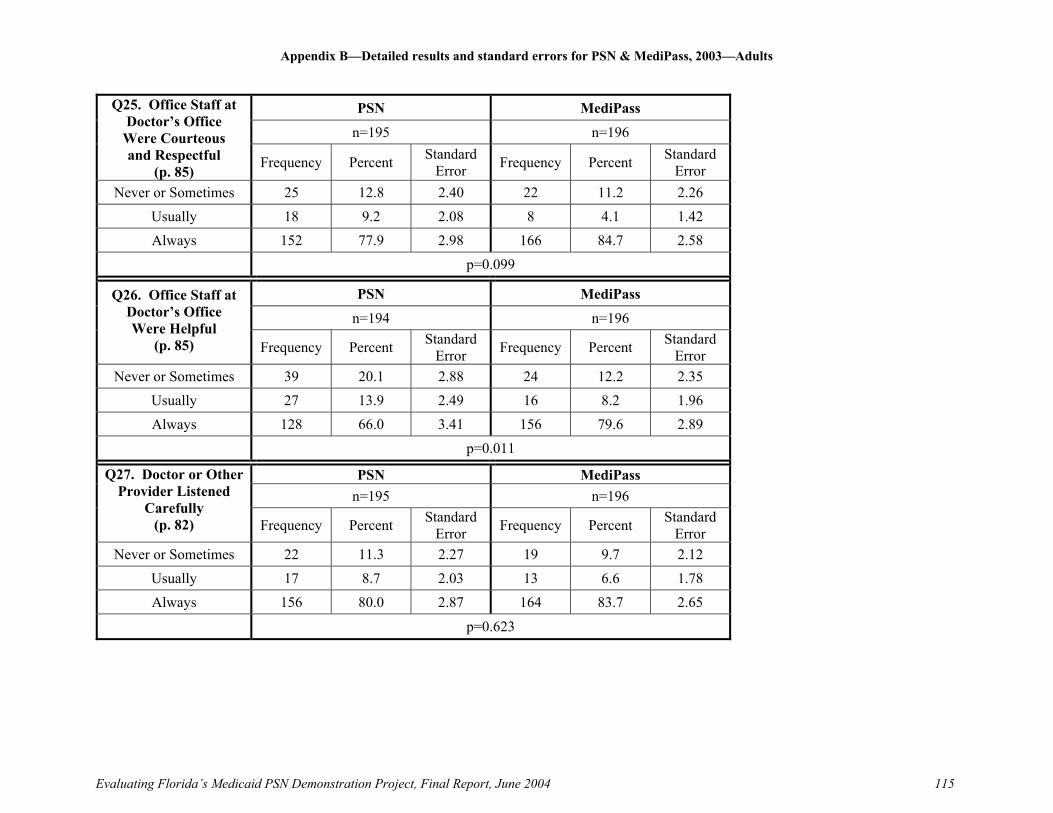
Appendix B—Detailed results and standard errors for PSN & MediPass, 2003—Adults
Evaluating Florida’s Medicaid PSN Demonstration Project, Final Report, June 2004 115
PSN MediPass
n=195 n=196
Q25. Office Staff at Doctor’s Office
Were Courteous and Respectful
(p. 85) Frequency Percent Standard Error Frequency Percent Standard
Error Never or Sometimes 25 12.8 2.40 22 11.2 2.26
Usually 18 9.2 2.08 8 4.1 1.42 Always 152 77.9 2.98 166 84.7 2.58
p=0.099
PSN MediPass
n=194 n=196 Q26. Office Staff at
Doctor’s Office Were Helpful
(p. 85) Frequency Percent Standard Error Frequency Percent Standard
Error Never or Sometimes 39 20.1 2.88 24 12.2 2.35
Usually 27 13.9 2.49 16 8.2 1.96 Always 128 66.0 3.41 156 79.6 2.89
p=0.011
PSN MediPass n=195 n=196
Q27. Doctor or Other Provider Listened
Carefully (p. 82) Frequency Percent Standard
Error Frequency Percent Standard Error
Never or Sometimes 22 11.3 2.27 19 9.7 2.12 Usually 17 8.7 2.03 13 6.6 1.78 Always 156 80.0 2.87 164 83.7 2.65
p=0.623
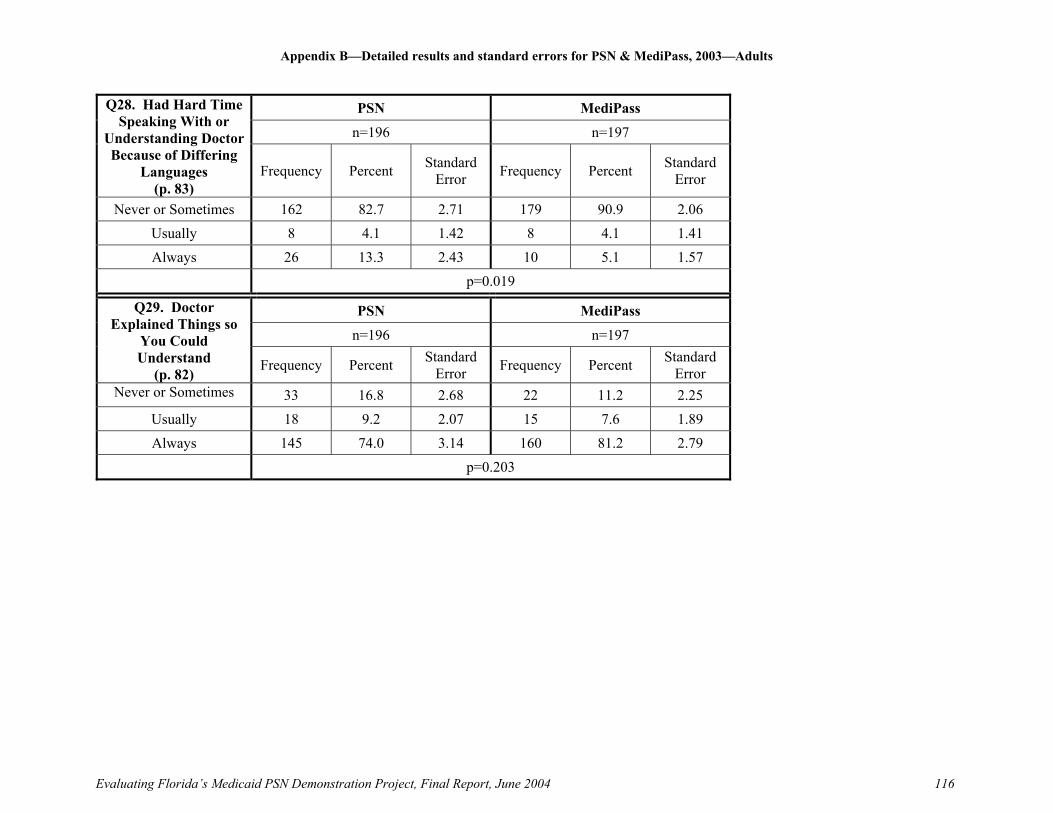
Appendix B—Detailed results and standard errors for PSN & MediPass, 2003—Adults
Evaluating Florida’s Medicaid PSN Demonstration Project, Final Report, June 2004 116
PSN MediPass
n=196 n=197
Q28. Had Hard Time Speaking With or
Understanding Doctor Because of Differing
Languages (p. 83)
Frequency Percent Standard Error Frequency Percent Standard
Error
Never or Sometimes 162 82.7 2.71 179 90.9 2.06 Usually 8 4.1 1.42 8 4.1 1.41 Always 26 13.3 2.43 10 5.1 1.57
p=0.019
PSN MediPass
n=196 n=197
Q29. Doctor Explained Things so
You Could Understand
(p. 82) Frequency Percent Standard Error Frequency Percent Standard
Error Never or Sometimes 33 16.8 2.68 22 11.2 2.25
Usually 18 9.2 2.07 15 7.6 1.89 Always 145 74.0 3.14 160 81.2 2.79
p=0.203

Appendix B—Detailed results and standard errors for PSN & MediPass, 2003—Adults
Evaluating Florida’s Medicaid PSN Demonstration Project, Final Report, June 2004 117
PSN MediPass
n=196 n=197
Q30. Doctor Showed Respect for What You
Had to Say (p. 82) Frequency Percent Standard
Error Frequency Percent Standard Error
Never or Sometimes 24 12.2 2.35 26 13.2 2.42 Usually 17 8.7 2.02 6 3.0 1.23 Always 155 79.1 2.91 165 83.8 2.63
p=0.060
PSN MediPass
n=193 n=194 Q31. Doctor Spent Enough Time With
You (p. 82) Frequency Percent Standard
Error Frequency Percent Standard Error
Never or Sometimes 34 17.6 2.75 24 12.4 2.37 Usually 28 14.5 2.54 21 10.8 2.24 Always 131 67.9 3.37 149 76.8 3.04
p=0.145
PSN MediPass
n=195 n=197
Q32. Rating of All Health Care, from All
Doctors and Health Providers
(p. 84) Frequency Percent Standard Error Frequency Percent Standard
Error 0 through 6 27 13.8 2.48 22 11.2 2.25
7 or 8 38 19.5 2.84 37 18.8 2.79 9 or 10 130 66.7 3.38 138 70.1 3.27
p=0.687
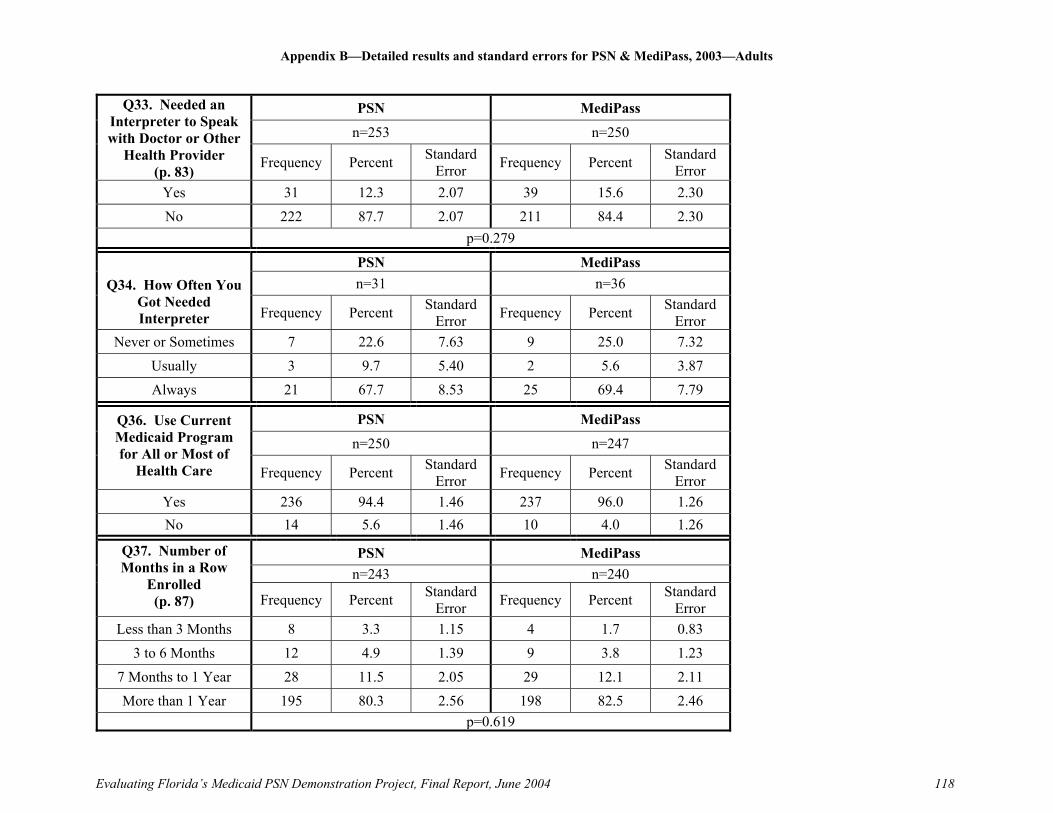
Appendix B—Detailed results and standard errors for PSN & MediPass, 2003—Adults
Evaluating Florida’s Medicaid PSN Demonstration Project, Final Report, June 2004 118
PSN MediPass
n=253 n=250
Q33. Needed an Interpreter to Speak with Doctor or Other
Health Provider (p. 83) Frequency Percent Standard
Error Frequency Percent Standard Error
Yes 31 12.3 2.07 39 15.6 2.30 No 222 87.7 2.07 211 84.4 2.30
p=0.279
PSN MediPass n=31 n=36 Q34. How Often You
Got Needed Interpreter Frequency Percent Standard
Error Frequency Percent Standard Error
Never or Sometimes 7 22.6 7.63 9 25.0 7.32 Usually 3 9.7 5.40 2 5.6 3.87 Always 21 67.7 8.53 25 69.4 7.79
PSN MediPass
n=250 n=247 Q36. Use Current Medicaid Program for All or Most of
Health Care Frequency Percent Standard Error Frequency Percent Standard
Error Yes 236 94.4 1.46 237 96.0 1.26 No 14 5.6 1.46 10 4.0 1.26
PSN MediPass n=243 n=240
Q37. Number of Months in a Row
Enrolled (p. 87) Frequency Percent Standard
Error Frequency Percent Standard Error
Less than 3 Months 8 3.3 1.15 4 1.7 0.83 3 to 6 Months 12 4.9 1.39 9 3.8 1.23
7 Months to 1 Year 28 11.5 2.05 29 12.1 2.11 More than 1 Year 195 80.3 2.56 198 82.5 2.46
p=0.619
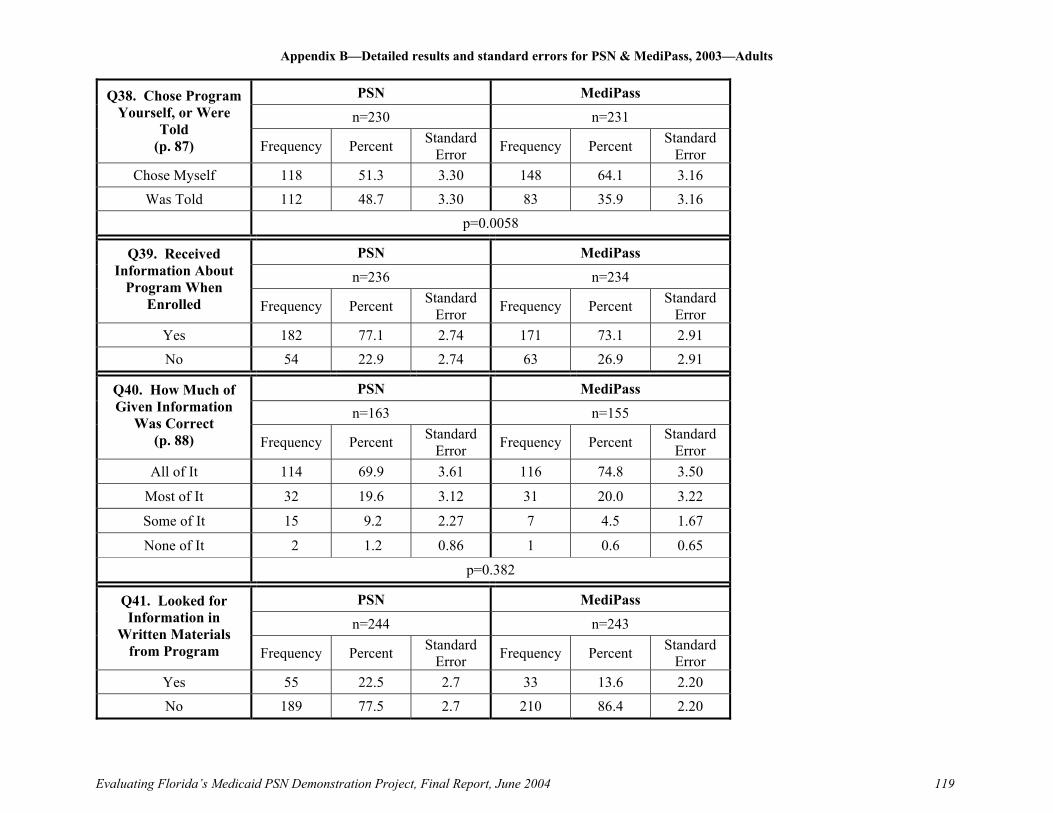
Appendix B—Detailed results and standard errors for PSN & MediPass, 2003—Adults
Evaluating Florida’s Medicaid PSN Demonstration Project, Final Report, June 2004 119
PSN MediPass
n=230 n=231 Q38. Chose Program
Yourself, or Were Told
(p. 87) Frequency Percent Standard Error Frequency Percent Standard
Error Chose Myself 118 51.3 3.30 148 64.1 3.16
Was Told 112 48.7 3.30 83 35.9 3.16 p=0.0058
PSN MediPass
n=236 n=234 Q39. Received
Information About Program When
Enrolled Frequency Percent Standard Error Frequency Percent Standard
Error Yes 182 77.1 2.74 171 73.1 2.91 No 54 22.9 2.74 63 26.9 2.91
PSN MediPass
n=163 n=155 Q40. How Much of Given Information
Was Correct (p. 88) Frequency Percent Standard
Error Frequency Percent Standard Error
All of It 114 69.9 3.61 116 74.8 3.50
Most of It 32 19.6 3.12 31 20.0 3.22
Some of It 15 9.2 2.27 7 4.5 1.67
None of It 2 1.2 0.86 1 0.6 0.65
p=0.382
PSN MediPass
n=244 n=243 Q41. Looked for Information in
Written Materials from Program Frequency Percent Standard
Error Frequency Percent Standard Error
Yes 55 22.5 2.7 33 13.6 2.20 No 189 77.5 2.7 210 86.4 2.20

Appendix B—Detailed results and standard errors for PSN & MediPass, 2003—Adults
Evaluating Florida’s Medicaid PSN Demonstration Project, Final Report, June 2004 120
PSN MediPass
n=53 n=33
Q42. How Much of a Problem to Find or
Understand Information in
Written Materials (p. 86)
Frequency Percent Standard Error Frequency Percent Standard
Error
Big Problem 5 9.4 4.05 2 6.1 4.22 Small Problem 11 20.8 5.62 11 33.3 8.33 Not a Problem 37 69.8 6.37 20 60.6 8.64
p=0.412
PSN MediPass
n=247 n=248 Q43. Called
Program’s Enrollee Service for
Information or Help Frequency Percent Standard Error Frequency Percent Standard
Error Yes 48 19.4 2.52 39 15.7 2.32 No 199 80.6 2.52 209 84.3 2.32
PSN MediPass
n=48 n=39
Q44. How Much of a Problem to Get
Needed Help from Program’s Enrollee
Service (p. 86)
Frequency Percent Standard Error Frequency Percent Standard
Error
Big Problem 11 22.9 6.13 4 10.2 4.92 Small Problem 11 22.9 6.13 12 30.8 7.49 Not a Problem 26 54.2 7.27 23 59.0 7.98
p=0.281
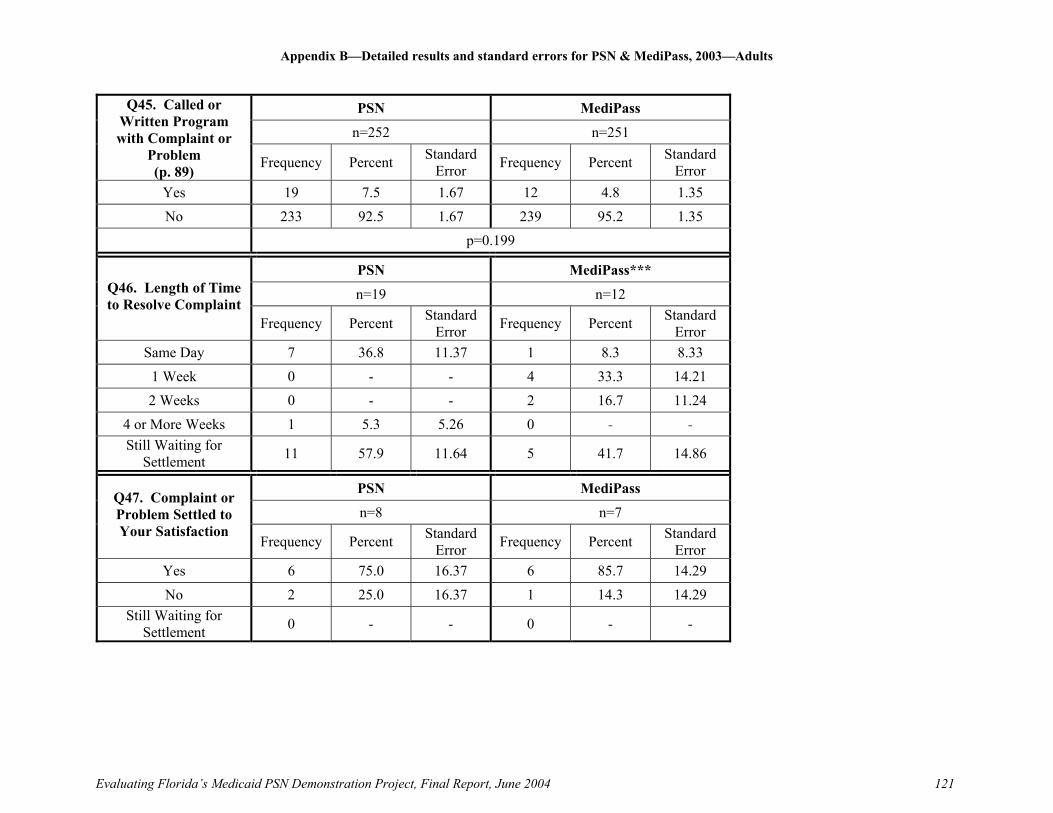
Appendix B—Detailed results and standard errors for PSN & MediPass, 2003—Adults
Evaluating Florida’s Medicaid PSN Demonstration Project, Final Report, June 2004 121
PSN MediPass
n=252 n=251
Q45. Called or Written Program with Complaint or
Problem (p. 89) Frequency Percent Standard
Error Frequency Percent Standard Error
Yes 19 7.5 1.67 12 4.8 1.35 No 233 92.5 1.67 239 95.2 1.35
p=0.199
PSN MediPass***
n=19 n=12 Q46. Length of Time to Resolve Complaint
Frequency Percent Standard Error Frequency Percent Standard
Error Same Day 7 36.8 11.37 1 8.3 8.33
1 Week 0 - - 4 33.3 14.21 2 Weeks 0 - - 2 16.7 11.24
4 or More Weeks 1 5.3 5.26 0 - - Still Waiting for
Settlement 11 57.9 11.64 5 41.7 14.86
PSN MediPass
n=8 n=7 Q47. Complaint or Problem Settled to Your Satisfaction
Frequency Percent Standard Error Frequency Percent Standard
Error Yes 6 75.0 16.37 6 85.7 14.29 No 2 25.0 16.37 1 14.3 14.29
Still Waiting for Settlement 0 - - 0 - -

Appendix B—Detailed results and standard errors for PSN & MediPass, 2003—Adults
Evaluating Florida’s Medicaid PSN Demonstration Project, Final Report, June 2004 122
PSN MediPass
n=252 n=245 Q48. Experience with
Paperwork for Program Frequency Percent Standard
Error Frequency Percent Standard Error
Yes 38 15.1 2.26 26 10.6 1.97 No 214 84.9 2.26 219 89.4 1.97
PSN MediPass
n=38 n=26
Q49. How Much of a Problem was the Paperwork for
Program (p. 86) Frequency Percent Standard
Error Frequency Percent Standard Error
Big Problem 3 7.9 4.43 4 15.4 7.22 Small Problem 7 18.4 6.37 4 15.4 7.22 Not a Problem 28 73.7 7.24 18 69.2 9.23
p=0.638
PSN MediPass
n=243 n=238 Q50. Rating of
Health Program Now (p. 84)
Frequency Percent Standard Error Frequency Percent Standard
Error 0 through 6 41 16.9 2.41 26 10.9 2.03
7 or 8 57 23.5 2.72 45 18.9 2.54 9 or 10 145 59.7 3.15 167 70.2 2.97
p=0.042

Appendix B—Detailed results and standard errors for PSN & MediPass, 2003—Adults
Evaluating Florida’s Medicaid PSN Demonstration Project, Final Report, June 2004 123
PSN MediPass
n=251 n=249 Q51. Rating of
Overall Health Now (pp. 76, 77) Frequency Percent Standard
Error Frequency Percent Standard Error
Excellent 30 12.0 2.05 24 9.6 1.87 Very Good 40 15.9 2.31 28 11.2 2.01
Good 52 20.7 2.56 51 20.5 2.56 Fair 76 30.3 2.91 91 36.5 3.06 Poor 53 21.1 2.58 55 22.1 2.63
PSN MediPass
n=252 n=248 Q52. Smoked at
Least 100 Cigarettes in Entire Life
Frequency Percent Standard Error Frequency Percent Standard
Error Yes 108 42.9 3.12 94 37.9 3.09 No 144 57.1 3.12 154 62.1 3.09
PSN MediPass
n=108 n=93 Q53. How Often Currently Smoke
Frequency Percent Standard Error Frequency Percent Standard
Error Every Day 38 35.2 4.62 41 44.1 5.18 Some Days 18 16.7 3.60 14 15.1 3.73 Not at All 52 48.1 4.83 38 40.9 5.13

Appendix B—Detailed results and standard errors for PSN & MediPass, 2003—Adults
Evaluating Florida’s Medicaid PSN Demonstration Project, Final Report, June 2004 124
PSN MediPass
n=252 n=248 Q52 and Q53. Frequency Smoked
Frequency Percent Standard Error Frequency Percent Standard
Error Never 144 57.1 3.13 154 62.3 3.09
Have Quit 52 20.6 0.05 38 15.4 5.18 Some Days 18 7.1 0.04 14 5.67 3.73 Every Day 38 15.1 4.62 41 16.6 5.13
p=0.434
PSN MediPass
n=50 n=38 Q54. How Long Since You Quit Smoking
Frequency Percent Standard Error Frequency Percent Standard
Error 6 Months or Less 6 12.0 4.64 3 7.9 4.43
More than 6 Months 44 88.0 4.64 35 92.1 4.43 p=0.533
PSN MediPass
n=56 n=55 Q55. Number of Visits that Doctor
Advised You to Quit Smoking Frequency Percent Standard
Error Frequency Percent Standard Error
None 10 17.9 5.16 21 38.2 6.61 1 Visit 4 7.1 3.47 6 10.9 4.24
2-4 Visits 17 30.4 6.20 6 10.9 4.24 5-9 Visits 10 17.9 5.16 10 18.2 5.25
10 or More Visits 15 26.8 5.97 12 21.8 5.62 p=0.046
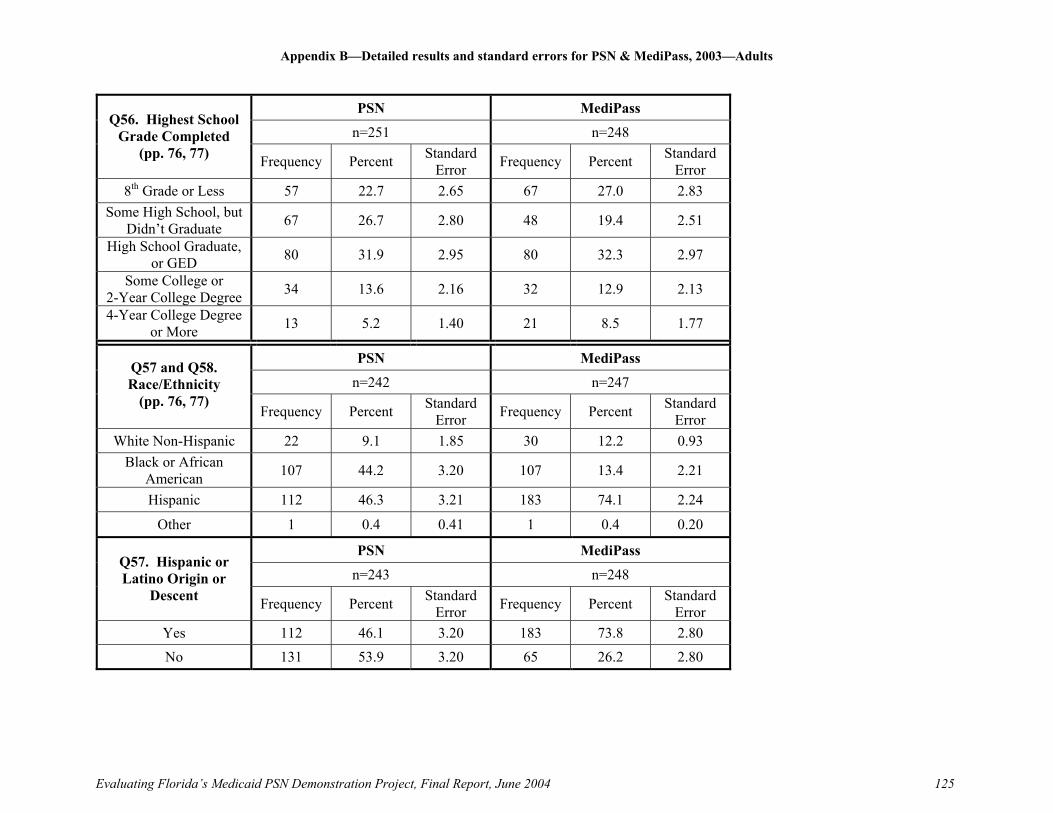
Appendix B—Detailed results and standard errors for PSN & MediPass, 2003—Adults
Evaluating Florida’s Medicaid PSN Demonstration Project, Final Report, June 2004 125
PSN MediPass
n=251 n=248 Q56. Highest School
Grade Completed (pp. 76, 77) Frequency Percent Standard
Error Frequency Percent Standard Error
8th Grade or Less 57 22.7 2.65 67 27.0 2.83 Some High School, but
Didn’t Graduate 67 26.7 2.80 48 19.4 2.51
High School Graduate, or GED 80 31.9 2.95 80 32.3 2.97
Some College or 2-Year College Degree 34 13.6 2.16 32 12.9 2.13
4-Year College Degree or More 13 5.2 1.40 21 8.5 1.77
PSN MediPass
n=242 n=247 Q57 and Q58. Race/Ethnicity
(pp. 76, 77) Frequency Percent Standard
Error Frequency Percent Standard Error
White Non-Hispanic 22 9.1 1.85 30 12.2 0.93 Black or African
American 107 44.2 3.20 107 13.4 2.21
Hispanic 112 46.3 3.21 183 74.1 2.24
Other 1 0.4 0.41 1 0.4 0.20
PSN MediPass
n=243 n=248 Q57. Hispanic or Latino Origin or
Descent Frequency Percent Standard Error Frequency Percent Standard
Error Yes 112 46.1 3.20 183 73.8 2.80 No 131 53.9 3.20 65 26.2 2.80

Appendix B—Detailed results and standard errors for PSN & MediPass, 2003—Adults
Evaluating Florida’s Medicaid PSN Demonstration Project, Final Report, June 2004 126
PSN MediPass
n=237 n=217 Q58. Race
Frequency Percent Standard Error Frequency Percent Standard
Error White 98 41.4 3.21 169 77.9 2.82
Black or African-American 135 57.0 3.22 45 20.7 2.76
Asian 3 1.3 0.73 0 0 - American Indian or
Alaska Native 1 0.4 0.42 3 1.4 0.79
PSN MediPass
n=252 n=251 Q59. Primary
Language Spoken at Home
Frequency Percent Standard Error Frequency Percent Standard
Error English 140 55.6 3.14 70 27.9 2.84 Spanish 92 36.5 3.04 168 66.9 2.98 Other 20 7.9 1.71 13 5.2 1.40

Appendix B—Detailed results and standard errors for PSN & MediPass, 2003—Children
Evaluating Florida’s Medicaid PSN Demonstration Project, Final Report, June 2004 127
This table presents all the data collected on the surveys. Data are presented in the order of the standard CAHPS telephone script, adhering to that numbering system. When data for that item are also presented in the “Findings” section, the corresponding page number is in parentheses under the question descriptor in the far left column. A p-value for testing the statistical significance of the observed difference between the PSN and MediPass responses is also noted for those items. Columns may not sum exactly to 100% due to rounding.
PSN MediPass n=251 n=256 Age (Parent)
Frequency Percent Standard Error Frequency Percent Standard
Error 18-24 32 12.7 2.11 17 6.6 1.56 25-34 90 35.8 3.03 90 35.2 2.99 35-44 83 33.1 2.98 108 42.2 3.09 45-54 28 11.2 1.99 27 10.5 1.92 55-64 11 4.4 1.29 8 3.1 1.09
65 or older 7 2.8 1.04 6 2.3 0.95
PSN MediPass n=247 n=253 Age (Child)
(pp. 90, 91) Frequency Percent Standard
Error Frequency Percent Standard Error
0-1 30 12.1 2.08 26 10.3 1.91 2-5 88 35.6 3.05 78 30.8 2.91
6-12 74 30.0 2.92 86 34.0 2.98 13-18 55 22.3 2.65 63 24.9 2.72

Appendix B—Detailed results and standard errors for PSN & MediPass, 2003—Children
Evaluating Florida’s Medicaid PSN Demonstration Project, Final Report, June 2004 128
PSN MediPass n=251 n=256 Gender (parent)
Frequency Percent Standard Error Frequency Percent Standard
Error Male 16 6.4 1.55 20 7.8 1.68
Female 235 93.6 1.55 236 92.2 1.68
PSN MediPass
n=251 n=255 Relation to child
Frequency Percent Standard Error Frequency Percent Standard
Error Mother or father 220 87.6 2.08 237 92.9 1.61
Grandparent 20 8.0 1.71 15 5.9 1.48 Auntie or uncle 6 2.4 0.97 2 0.8 0.55
Older brother or sister 1 0.4 0.40 - - - Other relative - - - 1 0.4 0.39
Legal guardian 4 1.6 0.79 - - -
PSN MediPass
n=242 n=250 Q3. Received New
Doctor or Nurse When Enrolled
Frequency Percent Standard Error Frequency Percent Standard
Error Yes 60 24.8 2.78 82 32.8 2.98
No 182 75.2 2.78 168 67.2 2.98
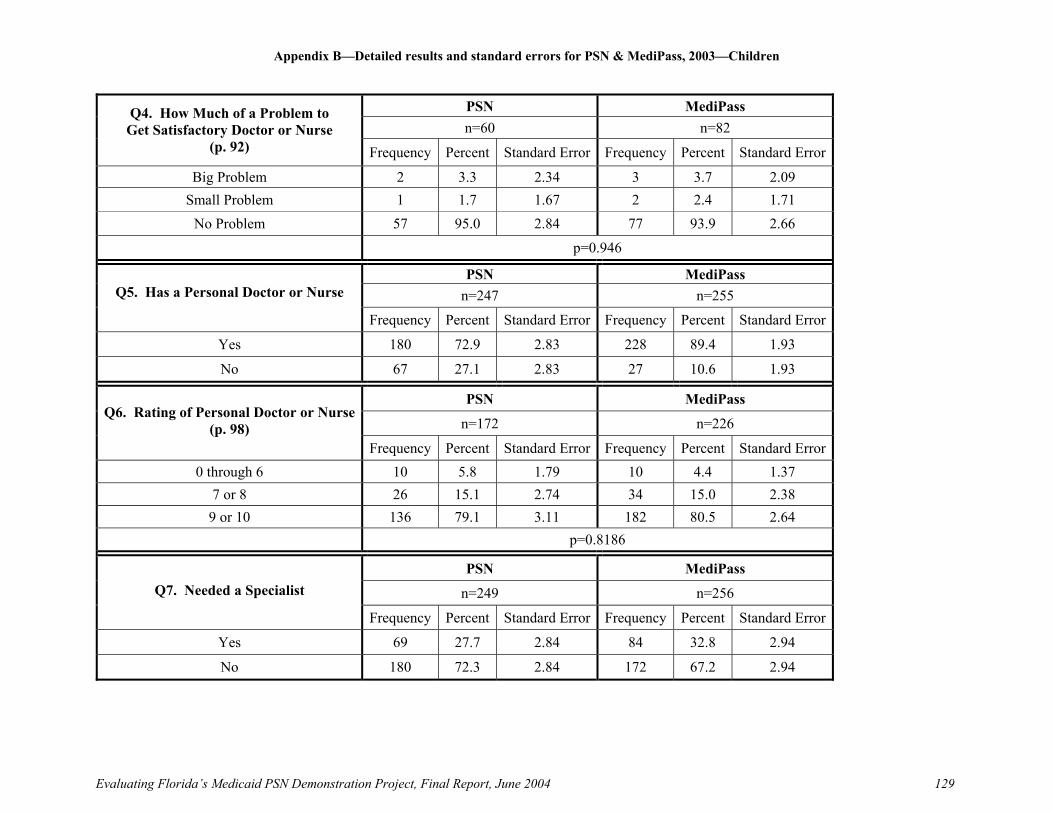
Appendix B—Detailed results and standard errors for PSN & MediPass, 2003—Children
Evaluating Florida’s Medicaid PSN Demonstration Project, Final Report, June 2004 129
PSN MediPass n=60 n=82
Q4. How Much of a Problem to Get Satisfactory Doctor or Nurse
(p. 92) Frequency Percent Standard Error Frequency Percent Standard Error
Big Problem 2 3.3 2.34 3 3.7 2.09 Small Problem 1 1.7 1.67 2 2.4 1.71
No Problem 57 95.0 2.84 77 93.9 2.66
p=0.946
PSN MediPass n=247 n=255 Q5. Has a Personal Doctor or Nurse
Frequency Percent Standard Error Frequency Percent Standard Error
Yes 180 72.9 2.83 228 89.4 1.93
No 67 27.1 2.83 27 10.6 1.93
PSN MediPass
n=172 n=226 Q6. Rating of Personal Doctor or Nurse
(p. 98) Frequency Percent Standard Error Frequency Percent Standard Error
0 through 6 10 5.8 1.79 10 4.4 1.37 7 or 8 26 15.1 2.74 34 15.0 2.38
9 or 10 136 79.1 3.11 182 80.5 2.64 p=0.8186
PSN MediPass
n=249 n=256 Q7. Needed a Specialist
Frequency Percent Standard Error Frequency Percent Standard Error
Yes 69 27.7 2.84 84 32.8 2.94
No 180 72.3 2.84 172 67.2 2.94
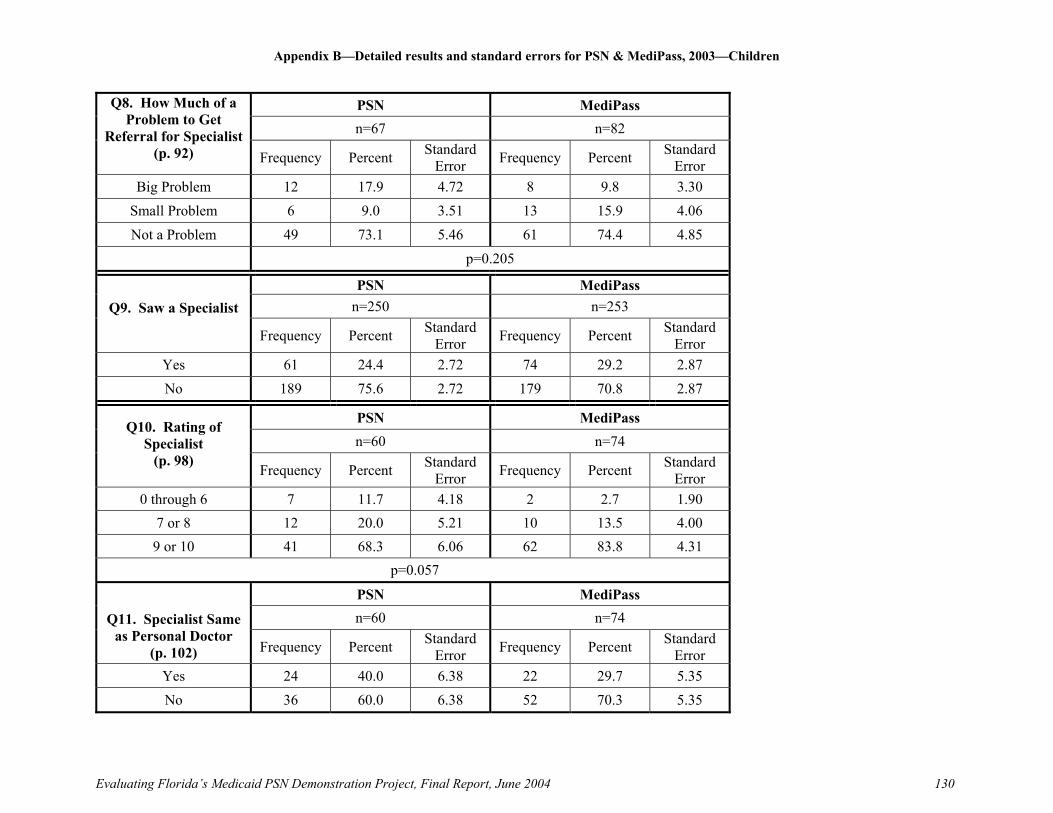
Appendix B—Detailed results and standard errors for PSN & MediPass, 2003—Children
Evaluating Florida’s Medicaid PSN Demonstration Project, Final Report, June 2004 130
PSN MediPass n=67 n=82
Q8. How Much of a Problem to Get
Referral for Specialist (p. 92) Frequency Percent Standard
Error Frequency Percent Standard Error
Big Problem 12 17.9 4.72 8 9.8 3.30 Small Problem 6 9.0 3.51 13 15.9 4.06 Not a Problem 49 73.1 5.46 61 74.4 4.85
p=0.205
PSN MediPass n=250 n=253 Q9. Saw a Specialist
Frequency Percent Standard Error Frequency Percent Standard
Error Yes 61 24.4 2.72 74 29.2 2.87 No 189 75.6 2.72 179 70.8 2.87
PSN MediPass n=60 n=74
Q10. Rating of Specialist
(p. 98) Frequency Percent Standard
Error Frequency Percent Standard Error
0 through 6 7 11.7 4.18 2 2.7 1.90 7 or 8 12 20.0 5.21 10 13.5 4.00 9 or 10 41 68.3 6.06 62 83.8 4.31
p=0.057
PSN MediPass n=60 n=74 Q11. Specialist Same
as Personal Doctor (p. 102) Frequency Percent Standard
Error Frequency Percent Standard Error
Yes 24 40.0 6.38 22 29.7 5.35 No 36 60.0 6.38 52 70.3 5.35

Appendix B—Detailed results and standard errors for PSN & MediPass, 2003—Children
Evaluating Florida’s Medicaid PSN Demonstration Project, Final Report, June 2004 131
PSN MediPass
n=250 n=252 Q12. Called Doctor’s Office for Self During
Regular Hours Frequency Percent Standard Error Frequency Percent Standard
Error Yes 74 29.6 2.89 93 36.9 3.05 No 176 70.4 2.89 159 63.1 3.05
PSN MediPass n=74 n=92
Q13. Received Needed Help or
Advice (p. 94) Frequency Percent Standard
Error Frequency Percent Standard Error
Never or Sometimes 21 28.4 5.28 13 14.1 3.65 Usually 13 17.6 4.45 11 12.0 3.40 Always 40 54.1 5.83 68 73.9 4.60
p=0.026
PSN MediPass
n=251 n=252 Q14. Made
Appointment for Regular Health Care
Frequency Percent Standard Error Frequency Percent Standard
Error Yes 145 57.8 3.12 186 73.8 2.78 No 106 42.2 3.12 66 26.2 2.78
PSN MediPass
n=144 n=186
Q15. Got Appointment for
Regular Health Care as Soon as Wanted
(p. 94) Frequency Percent Standard Error Frequency Percent Standard
Error Never or Sometimes 38 26.4 3.69 28 15.1 2.63
Usually 21 14.6 2.95 26 14.0 2.55 Always 85 59.0 4.11 132 71.0 3.34
p=0.031

Appendix B—Detailed results and standard errors for PSN & MediPass, 2003—Children
Evaluating Florida’s Medicaid PSN Demonstration Project, Final Report, June 2004 132
PSN MediPass
n=136 n=180
Q16. Days Waited Between Making Appointment and
Seeing Provider for Routine Care
(p. 93) Frequency Percent Standard
Error Frequency Percent Standard Error
Same Day to 3 Days 74 54.4 4.29 131 72.8 3.33 4-14 Days 38 27.9 3.86 33 18.3 2.89
15-29 Days 6 4.4 1.77 7 3.9 1.45 30 Days or More 18 13.2 2.92 9 5.0 1.63
p=0.004
PSN MediPass n=250 n=256 Q17. Had Illness or
Injury Needing Immediate Care Frequency Percent Standard
Error Frequency Percent Standard Error
Yes 66 26.4 2.79 78 30.5 2.88 No 184 73.6 2.79 178 69.5 2.88
PSN MediPass
n=65 n=78
Q18. Got Immediate Care for Illness or Injury as Soon as
Wanted (p. 84) Frequency Percent Standard
Error Frequency Percent Standard Error
Never or Sometimes 13 20.0 5.00 6 7.7 3.04 Usually 8 12.3 4.11 10 12.8 3.81 Always 44 67.7 5.85 62 79.5 4.60
p =0.098
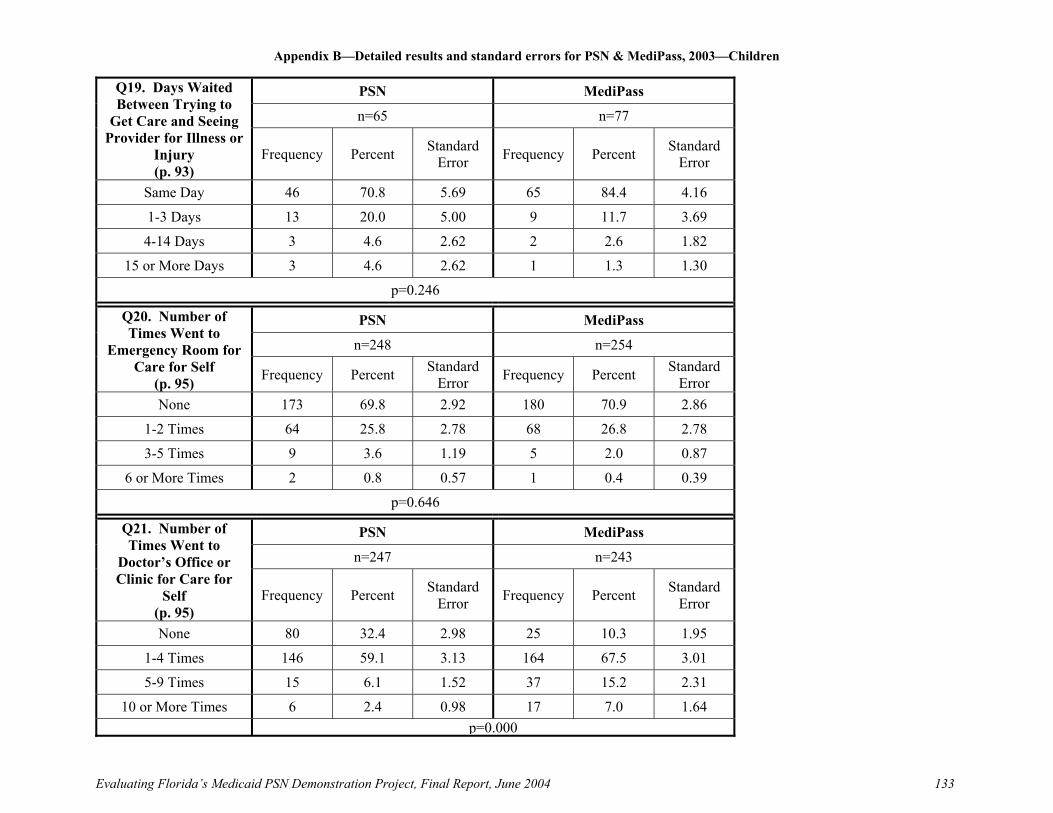
Appendix B—Detailed results and standard errors for PSN & MediPass, 2003—Children
Evaluating Florida’s Medicaid PSN Demonstration Project, Final Report, June 2004 133
PSN MediPass
n=65 n=77
Q19. Days Waited Between Trying to
Get Care and Seeing Provider for Illness or
Injury (p. 93)
Frequency Percent Standard Error Frequency Percent Standard
Error
Same Day 46 70.8 5.69 65 84.4 4.16
1-3 Days 13 20.0 5.00 9 11.7 3.69
4-14 Days 3 4.6 2.62 2 2.6 1.82
15 or More Days 3 4.6 2.62 1 1.3 1.30
p=0.246
PSN MediPass
n=248 n=254
Q20. Number of Times Went to
Emergency Room for Care for Self
(p. 95) Frequency Percent Standard Error Frequency Percent Standard
Error None 173 69.8 2.92 180 70.9 2.86
1-2 Times 64 25.8 2.78 68 26.8 2.78
3-5 Times 9 3.6 1.19 5 2.0 0.87
6 or More Times 2 0.8 0.57 1 0.4 0.39
p=0.646
PSN MediPass
n=247 n=243
Q21. Number of Times Went to
Doctor’s Office or Clinic for Care for
Self (p. 95)
Frequency Percent Standard Error Frequency Percent Standard
Error
None 80 32.4 2.98 25 10.3 1.95
1-4 Times 146 59.1 3.13 164 67.5 3.01
5-9 Times 15 6.1 1.52 37 15.2 2.31
10 or More Times 6 2.4 0.98 17 7.0 1.64 p=0.000
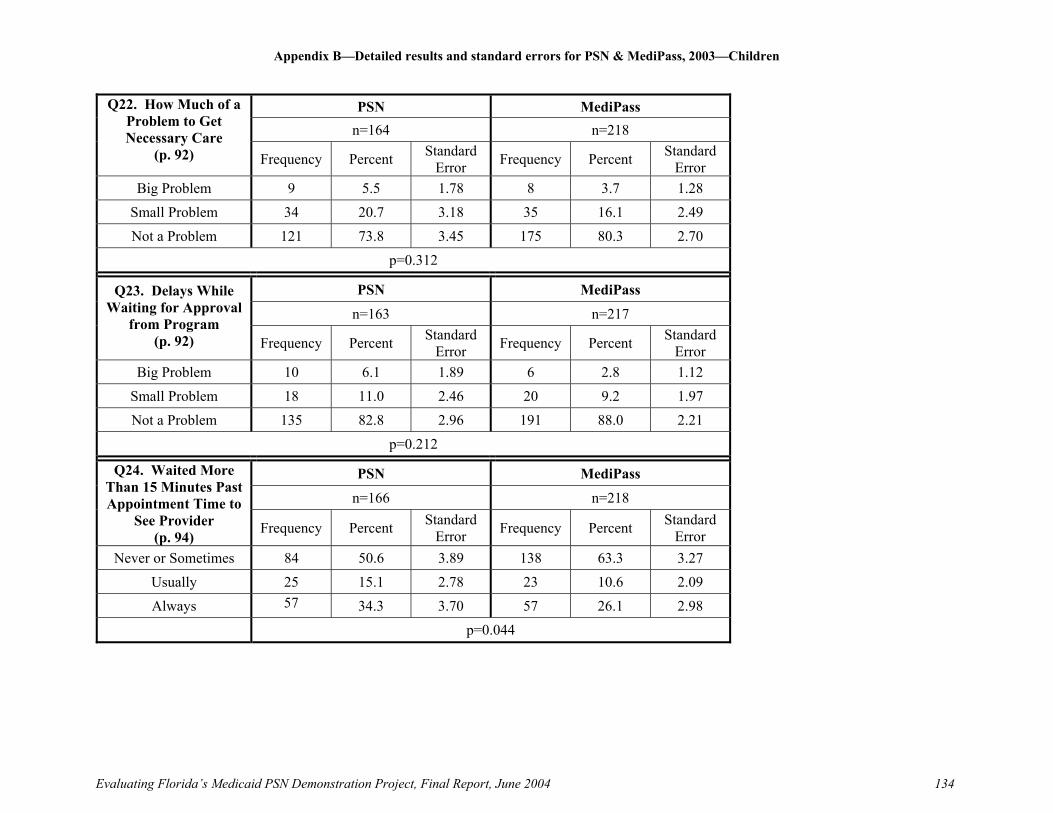
Appendix B—Detailed results and standard errors for PSN & MediPass, 2003—Children
Evaluating Florida’s Medicaid PSN Demonstration Project, Final Report, June 2004 134
PSN MediPass
n=164 n=218
Q22. How Much of a Problem to Get Necessary Care
(p. 92) Frequency Percent Standard Error Frequency Percent Standard
Error Big Problem 9 5.5 1.78 8 3.7 1.28
Small Problem 34 20.7 3.18 35 16.1 2.49 Not a Problem 121 73.8 3.45 175 80.3 2.70
p=0.312
PSN MediPass
n=163 n=217 Q23. Delays While
Waiting for Approval from Program
(p. 92) Frequency Percent Standard Error Frequency Percent Standard
Error Big Problem 10 6.1 1.89 6 2.8 1.12
Small Problem 18 11.0 2.46 20 9.2 1.97 Not a Problem 135 82.8 2.96 191 88.0 2.21
p=0.212
PSN MediPass
n=166 n=218
Q24. Waited More Than 15 Minutes Past Appointment Time to
See Provider (p. 94) Frequency Percent Standard
Error Frequency Percent Standard Error
Never or Sometimes 84 50.6 3.89 138 63.3 3.27 Usually 25 15.1 2.78 23 10.6 2.09 Always 57 34.3 3.70 57 26.1 2.98
p=0.044

Appendix B—Detailed results and standard errors for PSN & MediPass, 2003—Children
Evaluating Florida’s Medicaid PSN Demonstration Project, Final Report, June 2004 135
PSN MediPass
n=166 n=218
Q25. Office Staff at Doctor’s Office
Were Courteous and Respectful
(p. 99) Frequency Percent Standard Error Frequency Percent Standard
Error Never or Sometimes 32 19.3 3.07 22 10.1 2.04
Usually 12 7.2 2.02 9 4.1 1.35 Always 122 73.5 3.44 187 85.8 2.37
p=0.011
PSN MediPass
n=163 n=216 Q26. Office Staff at
Doctor’s Office Were Helpful
(p. 99) Frequency Percent Standard Error Frequency Percent Standard
Error Never or Sometimes 31 19.0 3.08 16 7.4 1.79
Usually 29 17.8 3.00 21 9.7 2.02 Always 103 63.2 3.79 179 82.9 2.57
p=0.0001
PSN MediPass n=166 n=217
Q27. Doctor or Other Provider Listened
Carefully (p. 96) Frequency Percent Standard
Error Frequency Percent Standard Error
Never or Sometimes 20 12.0 2.53 10 4.6 1.42 Usually 13 7.8 2.09 16 7.4 1.78 Always 133 80.1 3.11 191 88.0 2.21
p=0.0258
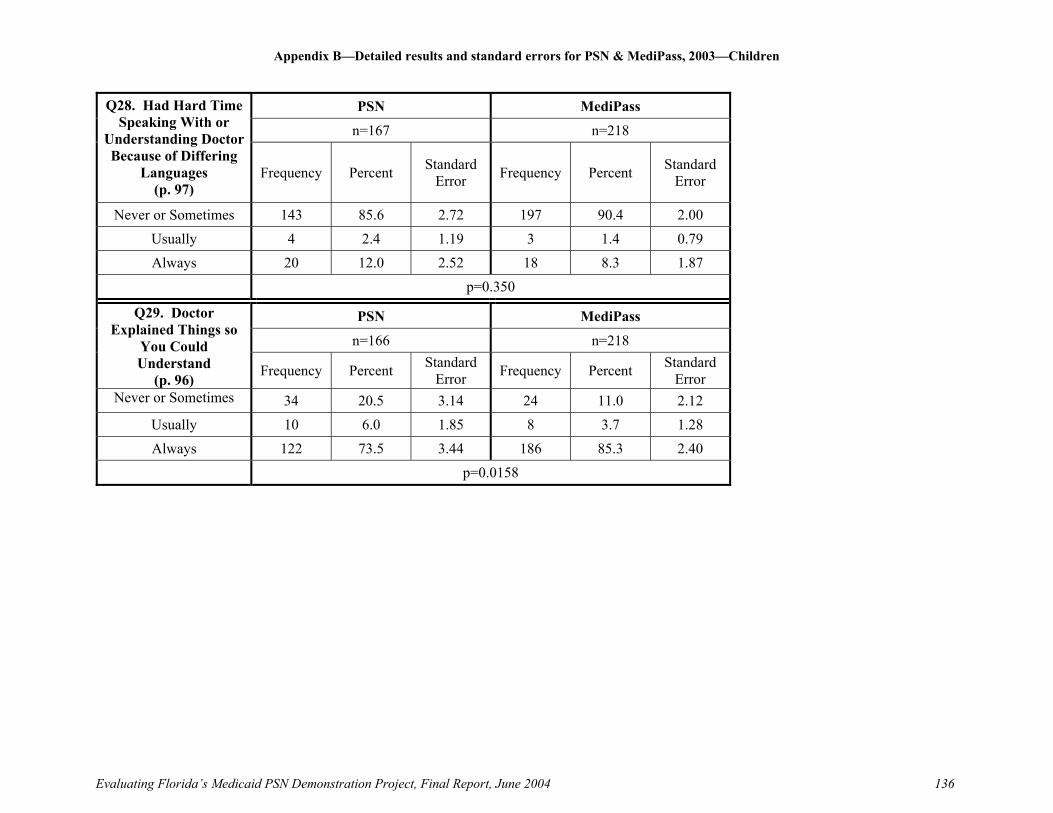
Appendix B—Detailed results and standard errors for PSN & MediPass, 2003—Children
Evaluating Florida’s Medicaid PSN Demonstration Project, Final Report, June 2004 136
PSN MediPass
n=167 n=218
Q28. Had Hard Time Speaking With or
Understanding Doctor Because of Differing
Languages (p. 97)
Frequency Percent Standard Error Frequency Percent Standard
Error
Never or Sometimes 143 85.6 2.72 197 90.4 2.00 Usually 4 2.4 1.19 3 1.4 0.79 Always 20 12.0 2.52 18 8.3 1.87
p=0.350
PSN MediPass
n=166 n=218
Q29. Doctor Explained Things so
You Could Understand
(p. 96) Frequency Percent Standard Error Frequency Percent Standard
Error Never or Sometimes 34 20.5 3.14 24 11.0 2.12
Usually 10 6.0 1.85 8 3.7 1.28 Always 122 73.5 3.44 186 85.3 2.40
p=0.0158
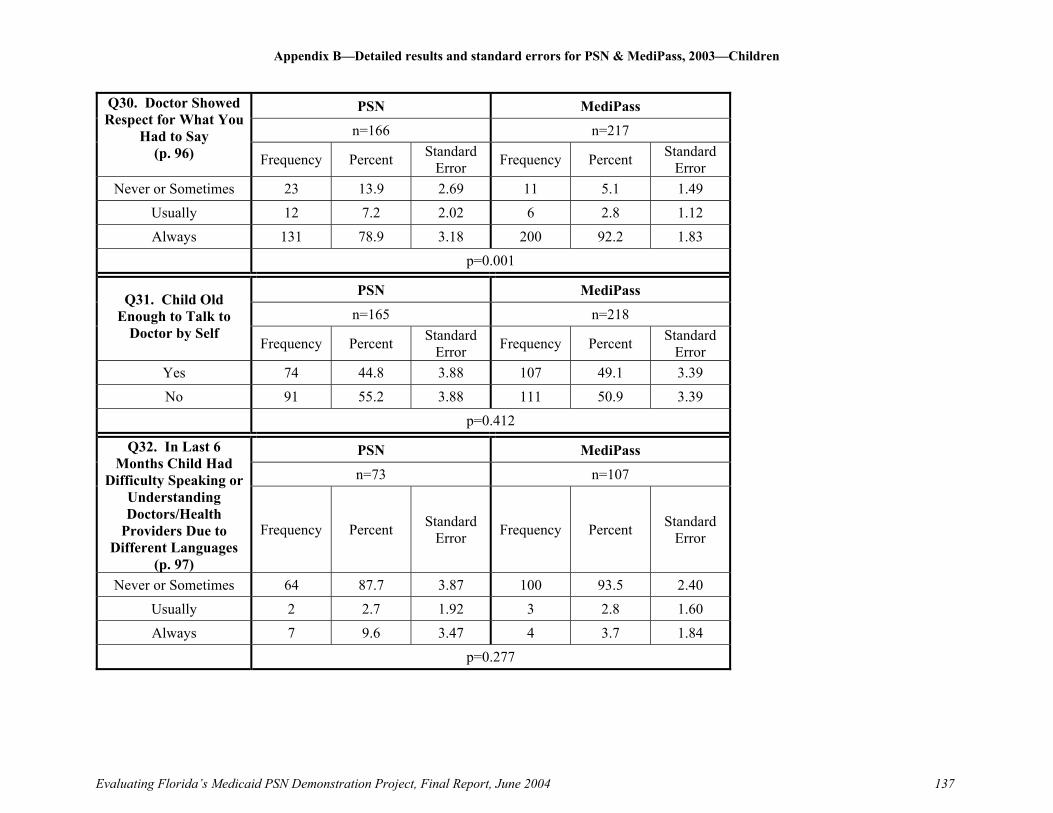
Appendix B—Detailed results and standard errors for PSN & MediPass, 2003—Children
Evaluating Florida’s Medicaid PSN Demonstration Project, Final Report, June 2004 137
PSN MediPass
n=166 n=217
Q30. Doctor Showed Respect for What You
Had to Say (p. 96) Frequency Percent Standard
Error Frequency Percent Standard Error
Never or Sometimes 23 13.9 2.69 11 5.1 1.49 Usually 12 7.2 2.02 6 2.8 1.12 Always 131 78.9 3.18 200 92.2 1.83
p=0.001
PSN MediPass
n=165 n=218 Q31. Child Old
Enough to Talk to Doctor by Self
Frequency Percent Standard Error Frequency Percent Standard
Error Yes 74 44.8 3.88 107 49.1 3.39 No 91 55.2 3.88 111 50.9 3.39
p=0.412
PSN MediPass
n=73 n=107
Q32. In Last 6 Months Child Had
Difficulty Speaking or Understanding Doctors/Health
Providers Due to Different Languages
(p. 97)
Frequency Percent Standard Error Frequency Percent Standard
Error
Never or Sometimes 64 87.7 3.87 100 93.5 2.40 Usually 2 2.7 1.92 3 2.8 1.60 Always 7 9.6 3.47 4 3.7 1.84
p=0.277

Appendix B—Detailed results and standard errors for PSN & MediPass, 2003—Children
Evaluating Florida’s Medicaid PSN Demonstration Project, Final Report, June 2004 138
PSN MediPass
n=73 n=107
Q33. Did Doctors/Other Health Providers Explain in a
Way Child Could Understand?
(p. 96) Frequency Percent Standard
Error Frequency Percent Standard Error
Never or Sometimes 17 23.3 4.98 13 12.1 3.17 Usually 5 6.8 2.98 12 11.2 3.06 Always 51 69.9 5.41 82 76.6 4.11
p=0.115
PSN MediPass n=73 n=107 Q34. How Often
Doctors or Other Health Providers Frequency Percent Standard
Error Frequency Percent Standard Error
Never or Sometimes 11 15.1 4.21 17 15.9 3.55 Usually 10 13.7 4.05 12 11.2 3.06 Always 52 71.2 5.33 78 72.9 4.32
PSN MediPass
n=73 n=106
Q35. Rating of all Child’s Health Care
from Doctors and Health Provider
(p. 98) Frequency Percent Standard Error Frequency Percent Standard
Error
0 to 6 8 11.0 3.68 3 2.8 1.61 7 or 8 15 20.5 4.76 21 19.8 3.89
9 or 10 50 68.5 5.47 82 77.4 4.08

Appendix B—Detailed results and standard errors for PSN & MediPass, 2003—Children
Evaluating Florida’s Medicaid PSN Demonstration Project, Final Report, June 2004 139
PSN MediPass n=251 n=255
Q36. Needed Interpreter to help speak with Child’s
Doctor/Health Providers
Frequency Percent Standard Error Frequency Percent Standard
Error
Yes 24 9.6 1.86 21 8.2 1.72 No 227 90.4 1.86 234 91.8 1.72
p=0.601PSN MediPass
n=23 n=21 Q37. How Often Did You Get Interpreter
Frequency Percent Standard Error Frequency Percent Standard
Error Never or Sometimes 6 26.1 9.36 7 33.3 10.5
Usually - - - 6 28.6 10.1 Always 17 73.9 9.36 8 38.1 10.9
p=0.012
PSN MediPass
n=74 n=107
Q38. Child Needed Interpreter to Help
Speak with Doctors/Health
Providers Frequency Percent Standard Error Frequency Percent Standard
Error Yes - - - 3 2.8 1.60 No 74 100.0 0.00 104 97.2 1.60
PSN MediPass
n=3 Q39. How Often did Child Get Interpreter
Frequency Percent Standard
Error Frequency Percent Standard Error
Never or Sometimes - - - 2 66.7 33.3
Usually - - - 1 33.3 33.3
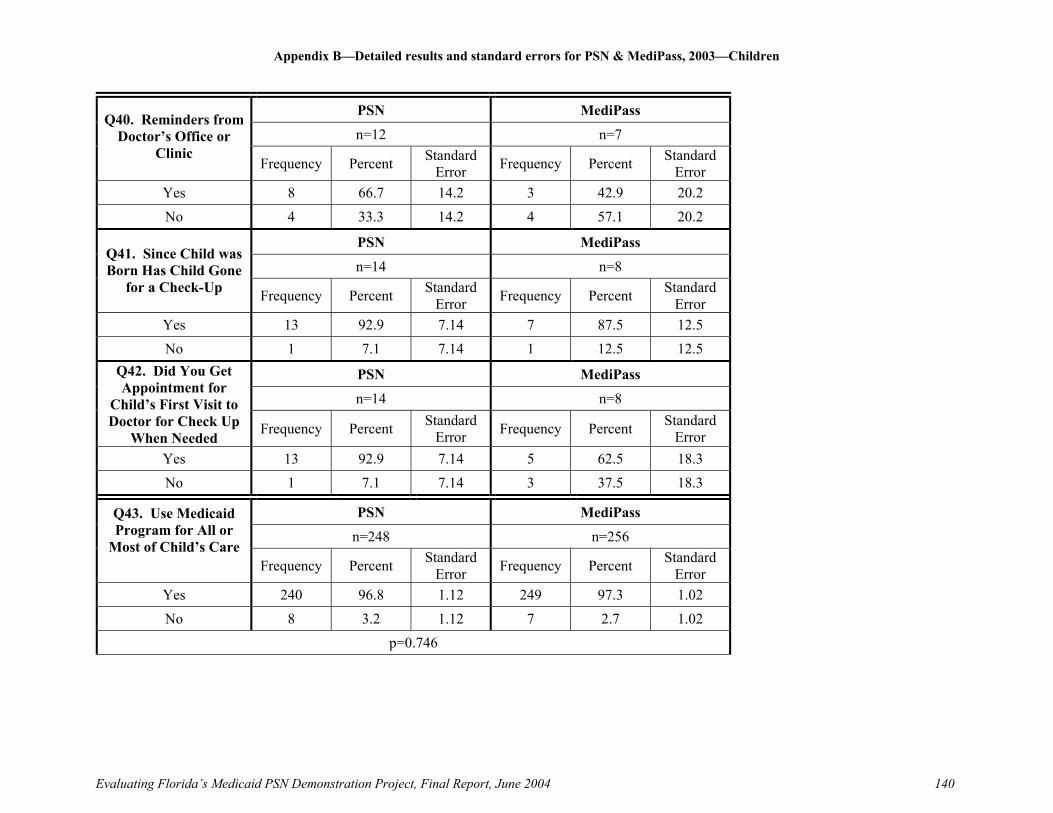
Appendix B—Detailed results and standard errors for PSN & MediPass, 2003—Children
Evaluating Florida’s Medicaid PSN Demonstration Project, Final Report, June 2004 140
PSN MediPass
n=12 n=7 Q40. Reminders from
Doctor’s Office or Clinic
Frequency Percent Standard Error Frequency Percent Standard
Error Yes 8 66.7 14.2 3 42.9 20.2 No 4 33.3 14.2 4 57.1 20.2
PSN MediPass
n=14 n=8 Q41. Since Child was Born Has Child Gone
for a Check-Up Frequency Percent Standard Error Frequency Percent Standard
Error Yes 13 92.9 7.14 7 87.5 12.5 No 1 7.1 7.14 1 12.5 12.5
PSN MediPass
n=14 n=8
Q42. Did You Get Appointment for
Child’s First Visit to Doctor for Check Up
When Needed Frequency Percent Standard Error Frequency Percent Standard
Error Yes 13 92.9 7.14 5 62.5 18.3 No 1 7.1 7.14 3 37.5 18.3
PSN MediPass
n=248 n=256 Q43. Use Medicaid Program for All or
Most of Child’s Care Frequency Percent Standard
Error Frequency Percent Standard Error
Yes 240 96.8 1.12 249 97.3 1.02 No 8 3.2 1.12 7 2.7 1.02
p=0.746
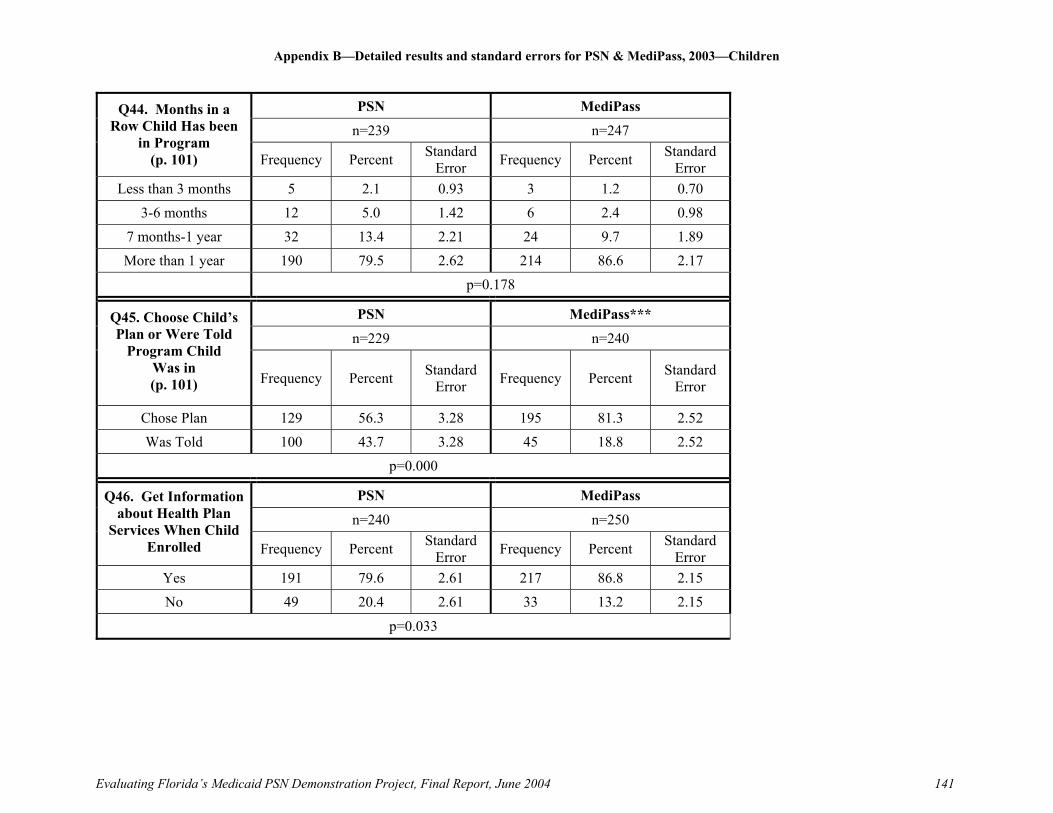
Appendix B—Detailed results and standard errors for PSN & MediPass, 2003—Children
Evaluating Florida’s Medicaid PSN Demonstration Project, Final Report, June 2004 141
PSN MediPass
n=239 n=247 Q44. Months in a
Row Child Has been in Program
(p. 101) Frequency Percent Standard Error Frequency Percent Standard
Error Less than 3 months 5 2.1 0.93 3 1.2 0.70
3-6 months 12 5.0 1.42 6 2.4 0.98 7 months-1 year 32 13.4 2.21 24 9.7 1.89 More than 1 year 190 79.5 2.62 214 86.6 2.17
p=0.178
PSN MediPass***
n=229 n=240 Q45. Choose Child’s Plan or Were Told
Program Child Was in (p. 101) Frequency Percent Standard
Error Frequency Percent Standard Error
Chose Plan 129 56.3 3.28 195 81.3 2.52 Was Told 100 43.7 3.28 45 18.8 2.52
p=0.000
PSN MediPass
n=240 n=250 Q46. Get Information
about Health Plan Services When Child
Enrolled Frequency Percent Standard Error Frequency Percent Standard
Error Yes 191 79.6 2.61 217 86.8 2.15 No 49 20.4 2.61 33 13.2 2.15
p=0.033
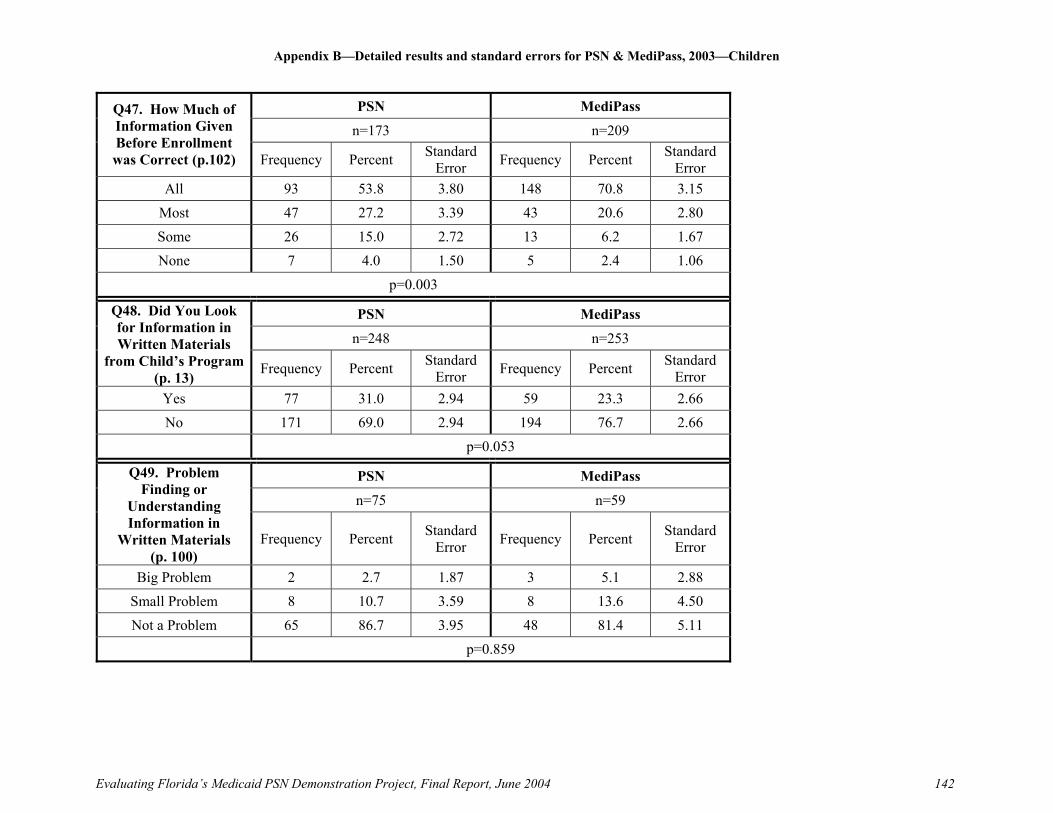
Appendix B—Detailed results and standard errors for PSN & MediPass, 2003—Children
Evaluating Florida’s Medicaid PSN Demonstration Project, Final Report, June 2004 142
PSN MediPass
n=173 n=209 Q47. How Much of Information Given Before Enrollment was Correct (p.102) Frequency Percent Standard
Error Frequency Percent Standard Error
All 93 53.8 3.80 148 70.8 3.15 Most 47 27.2 3.39 43 20.6 2.80 Some 26 15.0 2.72 13 6.2 1.67 None 7 4.0 1.50 5 2.4 1.06
p=0.003
PSN MediPass
n=248 n=253
Q48. Did You Look for Information in Written Materials
from Child’s Program (p. 13) Frequency Percent Standard
Error Frequency Percent Standard Error
Yes 77 31.0 2.94 59 23.3 2.66 No 171 69.0 2.94 194 76.7 2.66
p=0.053
PSN MediPass
n=75 n=59
Q49. Problem Finding or
Understanding Information in
Written Materials (p. 100)
Frequency Percent Standard Error Frequency Percent Standard
Error
Big Problem 2 2.7 1.87 3 5.1 2.88 Small Problem 8 10.7 3.59 8 13.6 4.50 Not a Problem 65 86.7 3.95 48 81.4 5.11
p=0.859

Appendix B—Detailed results and standard errors for PSN & MediPass, 2003—Children
Evaluating Florida’s Medicaid PSN Demonstration Project, Final Report, June 2004 143
PSN MediPass
n=249 n=253 Q50. Did you Call Program’s Enrollee
Service for Information or Help Frequency Percent Standard
Error Frequency Percent Standard Error
Yes 45 18.1 2.44 45 17.8 2.41 No 204 81.9 2.44 208 82.2 2.10
p=0.934
PSN MediPass
n=45 n=44 Q51. How Much of a Problem to Get Help with Child’s Program
Enrollee Service Frequency Percent Standard Error Frequency Percent Standard
Error Big Problem 11 24.4 6.48 7 15.9 5.58
Small Problem 4 8.9 4.29 4 9.1 4.38 No Problem 30 66.7 7.11 33 75.0 6.60
p=0.605
PSN MediPass
n=251 n=255
Q52. Called or Written Child’s Program with Complaint or
Problem (p. 103)
Frequency Percent Standard Error Frequency Percent Standard
Error
Yes 8 3.2 1.11 4 1.6 0.78 No 243 96.8 1.11 251 98.4 0.78
p=0.233
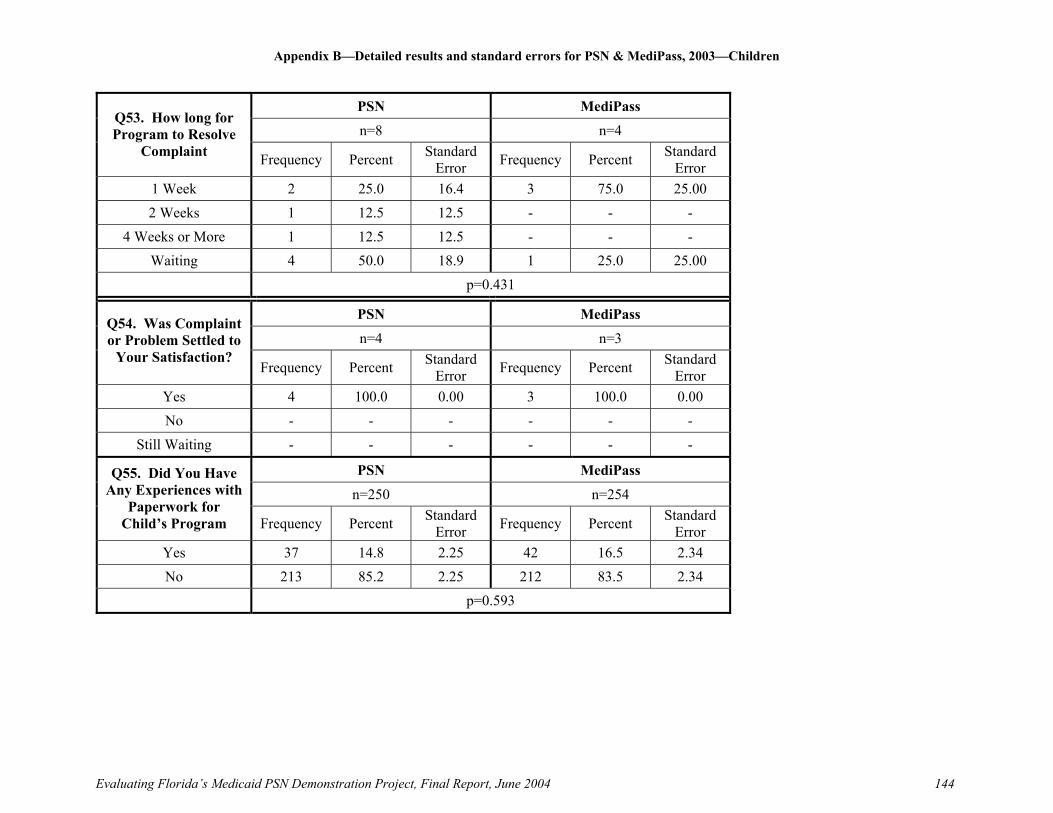
Appendix B—Detailed results and standard errors for PSN & MediPass, 2003—Children
Evaluating Florida’s Medicaid PSN Demonstration Project, Final Report, June 2004 144
PSN MediPass
n=8 n=4 Q53. How long for Program to Resolve
Complaint Frequency Percent Standard Error Frequency Percent Standard
Error 1 Week 2 25.0 16.4 3 75.0 25.00 2 Weeks 1 12.5 12.5 - - -
4 Weeks or More 1 12.5 12.5 - - - Waiting 4 50.0 18.9 1 25.0 25.00
p=0.431
PSN MediPass
n=4 n=3 Q54. Was Complaint or Problem Settled to
Your Satisfaction? Frequency Percent Standard
Error Frequency Percent Standard Error
Yes 4 100.0 0.00 3 100.0 0.00 No - - - - - -
Still Waiting - - - - - -
PSN MediPass
n=250 n=254 Q55. Did You Have
Any Experiences with Paperwork for
Child’s Program Frequency Percent Standard Error Frequency Percent Standard
Error Yes 37 14.8 2.25 42 16.5 2.34 No 213 85.2 2.25 212 83.5 2.34
p=0.593

Appendix B—Detailed results and standard errors for PSN & MediPass, 2003—Children
Evaluating Florida’s Medicaid PSN Demonstration Project, Final Report, June 2004 145
PSN MediPass
n=37 n=42
Q56. How much of a Problem Did You
Have With Paperwork for
Child’s Program (p. 100)
Frequency Percent Standard Error Frequency Percent Standard
Error
Big Problem 2 5.4 3.77 4 9.5 4.58
Small Problem 6 16.2 6.14 8 19.0 6.13
No Problem 29 78.4 6.86 30 71.4 7.06
p=0.724
PSN MediPass
n=238 n=251
Q57. How Would You Rate Your Experience with the Health Plan
Now (p. 98)
Frequency Percent Standard
Error Frequency Percent Standard Error
0-6 32 13.4 2.22 9 3.6 1.18
7 or 8 46 19.3 2.56 38 15.1 2.27
9 or 10 160 67.2 3.05 204 81.3 2.47
0.0001
PSN MediPass
n=251 n=254 Q58. How Would You Rate Child’s
Overall Health Now (p. 90, 91) Frequency Percent Standard
Error Frequency Percent Standard Error
Excellent 95 37.8 3.07 108 42.5 3.11 Very Good 59 23.5 2.68 64 25.2 2.73
Good 69 27.5 2.82 53 20.9 2.55 Fair 25 10.0 1.89 26 10.2 1.91 Poor 3 1.2 0.69 3 1.2 0.68
p=0.537
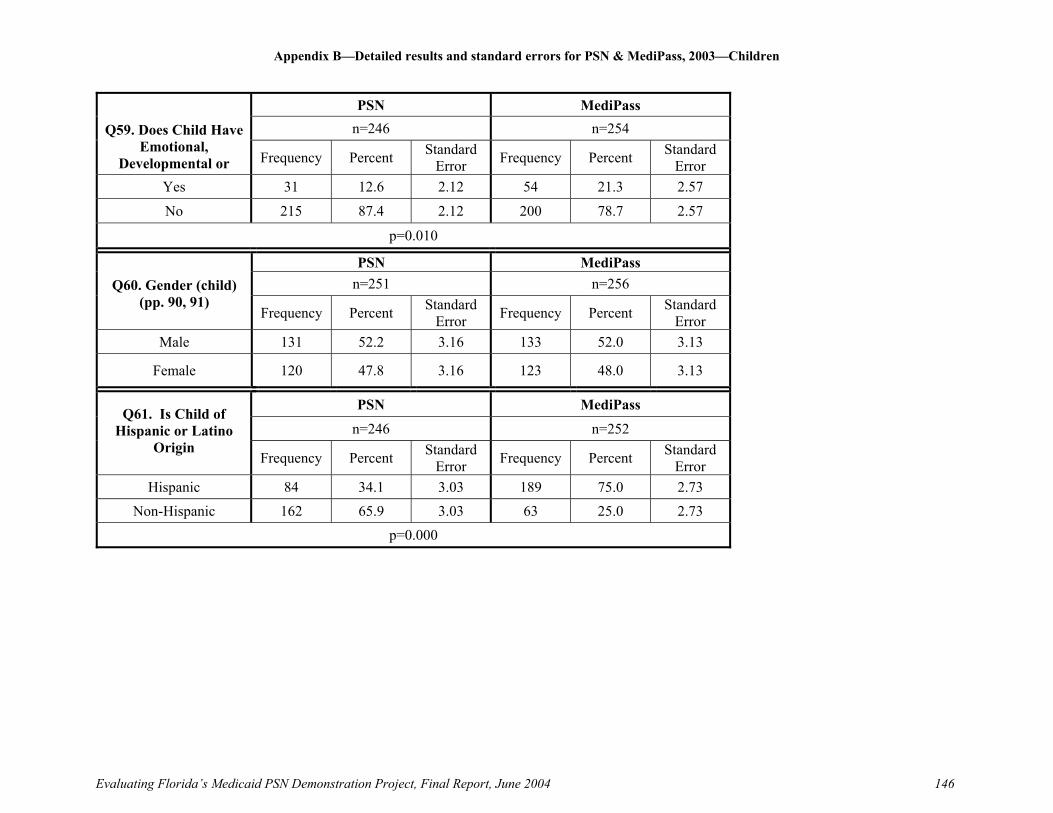
Appendix B—Detailed results and standard errors for PSN & MediPass, 2003—Children
Evaluating Florida’s Medicaid PSN Demonstration Project, Final Report, June 2004 146
PSN MediPass
n=246 n=254 Q59. Does Child Have Emotional,
Developmental or Frequency Percent Standard Error Frequency Percent Standard
Error Yes 31 12.6 2.12 54 21.3 2.57
No 215 87.4 2.12 200 78.7 2.57
p=0.010
PSN MediPass n=251 n=256 Q60. Gender (child)
(pp. 90, 91) Frequency Percent Standard
Error Frequency Percent Standard Error
Male 131 52.2 3.16 133 52.0 3.13
Female 120 47.8 3.16 123 48.0 3.13
PSN MediPass
n=246 n=252 Q61. Is Child of
Hispanic or Latino Origin
Frequency Percent Standard Error Frequency Percent Standard
Error Hispanic 84 34.1 3.03 189 75.0 2.73
Non-Hispanic 162 65.9 3.03 63 25.0 2.73 p=0.000
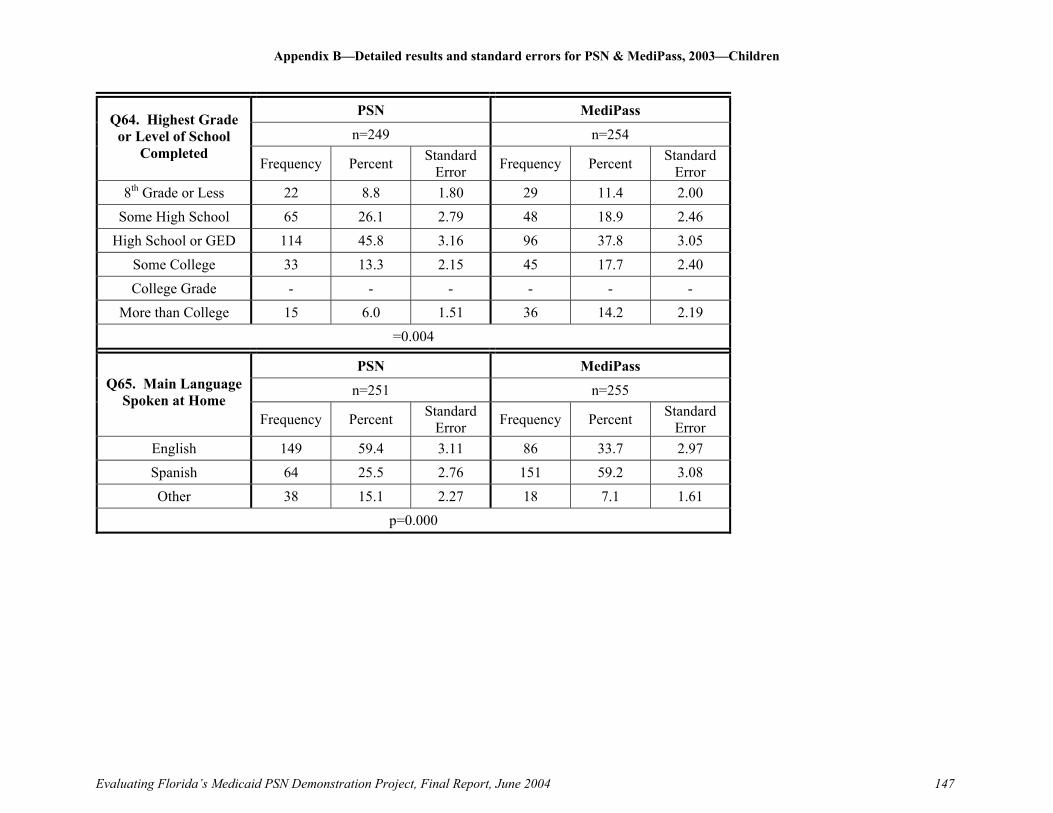
Appendix B—Detailed results and standard errors for PSN & MediPass, 2003—Children
Evaluating Florida’s Medicaid PSN Demonstration Project, Final Report, June 2004 147
PSN MediPass
n=249 n=254 Q64. Highest Grade
or Level of School Completed
Frequency Percent Standard Error Frequency Percent Standard
Error 8th Grade or Less 22 8.8 1.80 29 11.4 2.00
Some High School 65 26.1 2.79 48 18.9 2.46 High School or GED 114 45.8 3.16 96 37.8 3.05
Some College 33 13.3 2.15 45 17.7 2.40 College Grade - - - - - -
More than College 15 6.0 1.51 36 14.2 2.19 =0.004
PSN MediPass
n=251 n=255 Q65. Main Language Spoken at Home
Frequency Percent Standard Error Frequency Percent Standard
Error English 149 59.4 3.11 86 33.7 2.97 Spanish 64 25.5 2.76 151 59.2 3.08 Other 38 15.1 2.27 18 7.1 1.61
p=0.000

Appendix C
Survey
Questionnaires


Adult 2001, 2003
Evaluating Florida’s Medicaid PSN Demonstration Project Patient Experience Analyses Final Report, June 2004
151
PSN Evaluation Patient Satisfaction Survey
(HELLO) Hello, my name is__________ and I’m calling from the University of Florida. INTERVIEWER: PRESS 1 TO CONTINUE WITH SURVEY (go to HOME) PRESS 3 TO CONTINUE IN SPANISH PRESS 5 IF ANOTHER LANGUAGE (go to LANG) (LANG) INTERVIEWER PRESS 1 IF IT SOUNDS LIKE HAITIAN CREOLE PRESS 2 IF IT SOUNDS LIKE AN ORIENTAL LANGUAGE PRESS 3 IF NOT SURE/OTHER (specify) (HOME) Is this the home of [NAME]? We are conducting research sponsored by Medicaid concerning customer satisfaction with their health plans in Florida. May I please speak with [NAME]?
1 Yes 2 No – reschedule
(PROCEED) Your name was selected at random from a list provided by Medicaid. All your answers will be completely confidential and of course you do not have to answer any questions you do not wish to. NOTE: THEY MAY KNOW THE PLAN AS EITHER MEDICAID, THE SOUTH FLORIDA COMMUNITY CARE NETWORK OR “THE P.S.N.” IF NECESSARY—The entire survey should take around 10 minutes.
1 – Proceed (AGE) May I have your age?
(18-110) -9 – Not Available

Adult 2001, 2003
Evaluating Florida’s Medicaid PSN Demonstration Project Patient Experience Analyses
Final Report, June 2004
152
(ISEX) [IF NECESSARY] Are you male or female? 1 Male 2 Female
(Q1) Our records show that you are now in South Florida Community Care
Network PSN. Is that right? 1 Yes Go to Question 3 2 No
-8 Don’t know -9 Not available (Q2) What is the name of your health plan? RECORD PLAN NAME (Q3) The next questions ask about your own health care. Please do not include care you got when you stayed overnight in a hospital or times you went for dental care visits. For the purposes of this survey, a personal doctor or nurse is the health
provider who knows you best. This can be a general doctor, a specialist doctor, a nurse practitioner, or a physician assistant.
When you were enrolled in this program or at any time since then, did you get a new personal doctor or nurse?
1 Yes 2 No Go to Question 5
-8 Don’t know -9 Not available (Q4) With the choices available to you, how much of a problem, if any, was it to
get a personal doctor or nurse you are happy with? Would you say that it was….….[READ CHOICES]
1 A big problem 2 A small problem 3 Not a problem
-8 Don’t know -9 Not available (Q5) Do you have one person you think of as your personal doctor or nurse?
1 Yes 2 No Go to Question 7
-8 Don’t know -9 Not available

Adult 2001, 2003
Evaluating Florida’s Medicaid PSN Demonstration Project Patient Experience Analyses Final Report, June 2004
153
(Q6) We want to know your rating of your personal doctor or nurse. Using a scale from 0 to 10 where 0 is the worst personal doctor or nurse
possible, and 10 is the best personal doctor or nurse possible. How would you rate your personal doctor or nurse now? (0-10)
-8 Don’t know -9 Not available (Q7) The next questions are about specialists. Specialists are doctors like
surgeons, heart doctors, allergy doctors, skin doctors, and others who specialize in one area of health care. Please do not include dental visits.
In the last 6 months, did you or a doctor think you needed to see a
specialist? 1 Yes 2 No Go to Question 9
-8 Don’t know -9 Not available (Q8) In the last 6 months, how much of a problem, if any, was it to get a referral
to a specialist that you needed to see? Would you say that it was….….[READ LIST]
1 A big problem 2 A small problem 3 Not a problem
-8 Don’t know -9 Not available (Q9) In the last 6 months, did you see a specialist?
1 Yes 2 No Go to Question 12
-8 Don’t know -9 Not available (Q10) We want to know your rating of the specialist you saw most often in the
last 6 months, including a personal doctor if he or she is a specialist. Using a scale from 0 to 10 where 0 is the worst specialist possible, and 10 is
the best specialist possible. How would you rate the specialist? (0-10)
-8 Don’t know -9 Not available

Adult 2001, 2003
Evaluating Florida’s Medicaid PSN Demonstration Project Patient Experience Analyses
Final Report, June 2004
154
(Q11) In the last 6 months, was the specialist you saw most often the same doctor as your personal doctor?
1 Yes 2 No
-8 Don’t know -9 Not available (Q12) In the last 6 months, did you call a doctor’s office or clinic during regular
office hours to get help or advice for yourself? 1 Yes 2 No Go to Question 14
-8 Don’t know -9 Not available (Q13) In the last 6 months, when you called during regular office hours, how
often did you get the help or advice you needed? Would that be never, sometimes, usually or always?
1 NEVER 2 SOMETIMES 3 USUALLY 4 ALWAYS
-8 Don’t know -9 Not available (Q14) The next questions refer to health providers. A health provider could be a
general doctor, a specialist doctor, a nurse practitioner, a physician assistant, a nurse, or anyone else you would see for health care.
In the last 6 months, did you make any appointments with a doctor or other health provider for regular or routine health care?
1 Yes 2 No Go to Question 17
-8 Don’t know -9 Not available (Q15) In the last 6 months, how often did you get an appointment for regular or
routine health care as soon as you wanted? Would that be never, sometimes, usually or always?
1 NEVER 2 SOMETIMES 3 USUALLY 4 ALWAYS
-8 Don’t know -9 Not available
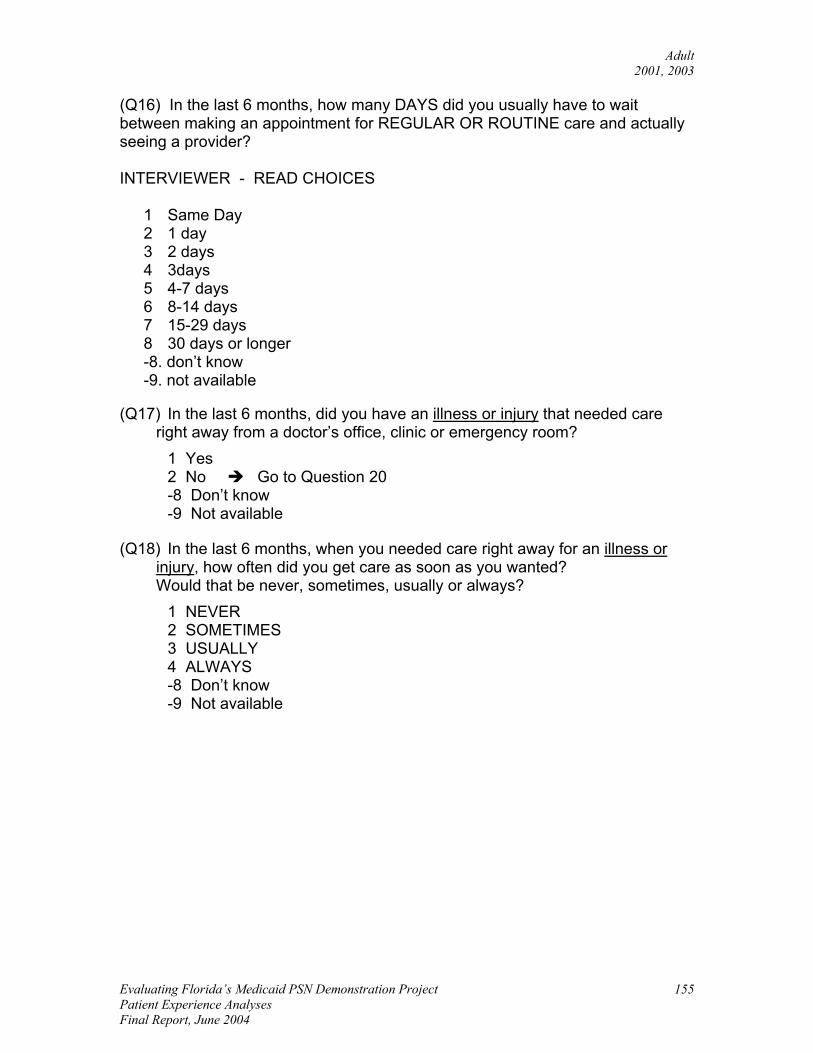
Adult 2001, 2003
Evaluating Florida’s Medicaid PSN Demonstration Project Patient Experience Analyses Final Report, June 2004
155
(Q16) In the last 6 months, how many DAYS did you usually have to wait between making an appointment for REGULAR OR ROUTINE care and actually seeing a provider? INTERVIEWER - READ CHOICES
1 Same Day 2 1 day 3 2 days 4 3days 5 4-7 days 6 8-14 days 7 15-29 days 8 30 days or longer -8. don’t know -9. not available
(Q17) In the last 6 months, did you have an illness or injury that needed care
right away from a doctor’s office, clinic or emergency room? 1 Yes 2 No Go to Question 20
-8 Don’t know -9 Not available (Q18) In the last 6 months, when you needed care right away for an illness or
injury, how often did you get care as soon as you wanted? Would that be never, sometimes, usually or always?
1 NEVER 2 SOMETIMES 3 USUALLY 4 ALWAYS
-8 Don’t know -9 Not available

Adult 2001, 2003
Evaluating Florida’s Medicaid PSN Demonstration Project Patient Experience Analyses
Final Report, June 2004
156
(Q19) In the last 6 months, how LONG did you usually have to wait between trying to get care and actually seeing a provider for an ILLNESS OR INJURY? INTERVIEWER – READ CHOICES
1. same day 2. 1 day 3. 2 days 4. 3 days 5. 4-7 days 6. 8-14 days 7. 15-29 days 8. 30 days or longer -8. don’t know -9. not available
(Q20) In the last 6 months, how many times did you go to an emergency room to
get care for yourself?
(0-182) -8 Don’t know -9 Not available (Q21) In the last 6 months, not counting times you went to an emergency room,
how many times did you go to a doctor’s office or clinic to get care for yourself? Would you say…[READ LIST] 1 None Go to Question 33 2 1 time 3 2 times 4 3 times 5 4 times 6 5 to 9 times 7 10 or more times
(Q22) In the last 6 months, how much of a problem, if any, was it to get the care
you or a doctor believed necessary? Would you say it was…[READ CHOICES]
1 A big problem 2 A small problem 3 Not a problem
-8 Don’t know -9 Not available

Adult 2001, 2003
Evaluating Florida’s Medicaid PSN Demonstration Project Patient Experience Analyses Final Report, June 2004
157
(Q23) In the last 6 months, how much of a problem, if any, were delays in health care while you waited for approval from your program? Would you say it was…[READ CHOICES]
1 A big problem 2 A small problem 3 Not a problem
-8 Don’t know -9 Not available (Q24) In the last 6 months, how often did you wait in the doctor’s office or clinic
more than 15 minutes past your appointment time to see the person you went to see? Would that be never, sometimes, usually or always?
1 NEVER 2 SOMETIMES 3 USUALLY 4 ALWAYS
-8 Don’t know -9 Not available (Q25) In the last 6 months, how often did office staff at a doctor’s office or clinic
treat you with courtesy and respect?
INTERVIEWER – REPEAT SCALE IF NECESSARY
1 NEVER 2 SOMETIMES 3 USUALLY 4 ALWAYS -8 Don’t Know -9 Not Available
(Q26) In the last 6 months, how often were office staff at a doctor’s office or clinic
as helpful as you thought they should be?
INTERVIEWER – REPEAT SCALE IF NECESSARY
1 Never 2 Sometimes 3 Usually 4 Always -8 Don’t Know -9 Not Available

Adult 2001, 2003
Evaluating Florida’s Medicaid PSN Demonstration Project Patient Experience Analyses
Final Report, June 2004
158
(Q27) In the last 6 months, how often did doctors or other health providers listen carefully to you?
INTERVIEWER – REPEAT SCALE IF NECESSARY
1 Never 2 Sometimes 3 Usually 4 Always -8 Don’t Know -9 Not Available
(Q28) In the last 6 months, how often did you have a hard time SPEAKING WITH OR UNDERSTANDING a doctor or other health provider because you spoke different languages? INTERVIEWER – REPEAT SCALE IF NECESSARY
1 Never 2 Sometimes 3 Usually 4 Always -8 Don’t Know -9 Not Available
(Q29) In the last 6 months, how often did doctors or other health providers
explain things in a way you could understand?
INTERVIEWER – REPEAT SCALE IF NECESSARY
1 Never 2 Sometimes 3 Usually 4 Always
-8 Don’t know -9 Not available

Adult 2001, 2003
Evaluating Florida’s Medicaid PSN Demonstration Project Patient Experience Analyses Final Report, June 2004
159
(Q30) In the last 6 months, how often did doctors or other health providers show respect for what you had to say?
INTERVIEWER – REPEAT SCALE IF NECESSARY
1 Never 2 Sometimes 3 Usually 4 Always
-8 Don’t know -9 Not available (Q31) In the last 6 months, how often did doctors or other health providers spend
enough time with you?
INTERVIEWER – REPEAT SCALE IF NECESSARY
1 Never 2 Sometimes 3 Usually 4 Always
-8 Don’t know -9 Not available (Q32) We want to know your rating of all your health care in the last 6 months
from all doctors and other health providers. Using a scale from 0 to 10 where 0 is the worst health care possible, and 10
is the best health care possible. How would you rate all your health care? (0-10)
-8 Don’t know -9 Not available (Q33) Sometimes people need an interpreter. An interpreter is someone who repeats or signs what one person says in a language used by another person. In the last 6 months, did you NEED an interpreter to help you speak with doctors or other health providers?
1 Yes 2 No Go to Question 36 -8 Don’t Know -9 Not Available

Adult 2001, 2003
Evaluating Florida’s Medicaid PSN Demonstration Project Patient Experience Analyses
Final Report, June 2004
160
Q34. In the last 6 months, when you needed an interpreter to help you speak with doctors or other health providers, how often did you get one? Would that be never, sometimes, usually, or always?
1. NEVER 2. SOMETIMES 3. USUALLY 4. ALWAYS -8 Don’t know -9 Not Available
Q35. The next questions ask about your experience with your health plan. Some states pay health plans to care for people covered by Medicaid. With these health plans, you may have to choose a doctor from the plan list or go to a clinic or health care center on the plan list. Are you covered by a health plan like THIS?
1. Yes 2. No -8. Don’t know -9. Not Available
(Q36) The next questions ask about your experience with Medicaid, including
Medipass, the South Florida Community Care Network and others.
Do you use your current Medicaid program for all or most of your health care? 1 Yes 2 No
(Q37) How many months in a row have you been in this program?
Was it ….[READ LIST] 1 Less than 3 months 2 up to 6 months 3 months up to a year 4 more than a year
-8 Don’t know -9 Not available
Adult 2001, 2003
Evaluating Florida’s Medicaid PSN Demonstration Project Patient Experience Analyses Final Report, June 2004
161
(Q38) Did you choose this program or were you told which program you were in?
1 I chose my program. 2 I was told which program I was in. -8 Don’t know -9 Not Available
(Q39) Health plans offer information about plan services in writing, by telephone,
or in person. Did you get any information ABOUT this program when you enrolled? 1 Yes 2 No Go to Question 41
(Q40) How much of the information you were given BEFORE you signed up for the plan was correct?
INTERVIEWER – READ CHOICES IF NECESSARY 1 All of it 2 Most of it 3 Some of it 4 None of it -8 Don’t know -9 Not Available
(Q41) In the last 6 months, did you look for any information in written materials
from this program? 1 Yes 2 No Go to Question 43
-8 Don’t know -9 Not available (Q42) In the last 6 months, how much of a problem, if any, was it to find or
understand information in the written materials? Would you say it was…[READ CHOICES]
1 A big problem 2 A small problem 3 Not a problem
-8 Don’t know -9 Not available
Adult 2001, 2003
Evaluating Florida’s Medicaid PSN Demonstration Project Patient Experience Analyses
Final Report, June 2004
162
(Q43) In the last 6 months, did you call your program’s enrollee service to get information or help? 1 Yes 2 No Go to Question 45 -8 Don’t know -9 Not available
(Q44) In the last 6 months, how much of a problem, if any, was it to get the help
you needed when you called your program’s enrollee service? Would you say it was…[READ CHOICES] 1 A big problem 2 A small problem 3 Not a problem -8 Don’t know -9 Not available
(Q45) In the last 6 months, have you called or written your program with a complaint or problem?
1. Yes 2. No Go to Question 48 -8. Don’t know -9. Not Available
(Q46) How long did it take for the program to RESOLVE your complaint?
1. Same day 2. 1 week 3. 2 weeks 4. 3 weeks 5. 4 or more weeks 6. I am still waiting for it to be settled. -8. Don’t know -9. Not Available
(Q47) Was your COMPLAINT OR PROBLEM settled to your satisfaction?
1. Yes 2. No 3. I am still waiting for it to be settled. -8. Don’t know -9. Not Available
Adult 2001, 2003
Evaluating Florida’s Medicaid PSN Demonstration Project Patient Experience Analyses Final Report, June 2004
163
(Q48) Health plans often require you to do some paperwork. Paperwork means things like getting your ID card, having your records changed, processing forms, or other paperwork related to getting care.
In the last 6 months, did you have any experiences with paperwork for your program? 1 Yes 2 No Go to Question 50 -8 Don’t know -9 Not available
(Q49) In the last 6 months, how much of a problem, if any, did you have with
paperwork for your program? Would you say it was…[READ LIST] 1 A big problem 2 A small problem 3 Not a problem -8 Don’t know -9 Not available
(Q50) We want to know your rating of all your experience with your program. Use any number from 0 to 10 where 0 is the worst health program possible, and 10 is the best health program possible. How would you rate your health plan now?
(0-10) -8 Don’t know -9 Not available (Q51) Now, we just have a few questions about you. In general, how would you rate your overall health now?
[READ LIST] 1 Excellent 2 Very good 3 Good 4 Fair 5 Poor -8 Don’t know -9 Not available
(Q52) Have you ever SMOKED at least 100 cigarettes in your entire life?
1. Yes 2. No Go to Question 56 -8. Don’t know -9. Not Available
Adult 2001, 2003
Evaluating Florida’s Medicaid PSN Demonstration Project Patient Experience Analyses
Final Report, June 2004
164
(Q53) Do you now smoke every day, some days or not at all?
1. Every day Go to Question 55 2. Some days Go to Question 55 3. Not at all -8. Don’t know -9. Not Available
(Q54) How long has it been since you QUIT SMOKING cigarettes? INTERVIEWER – READ CHOICES
1. 6 months or less 2. More than 6 months Go to Question 56 -8. Don’t know -9. Not available
(Q55) In the last 6 months, on how many visits were you ADVISED TO QUIT smoking by a doctor or other health provider in your program? INTERVIEWER – READ CHOICES
1. None 2. 1 visit 3. 2 to 4 visits 4. 5 to 9 visits 5. 10 or more visits -7. I had no visits in the last 6 months. -8. Don’t know -9. Not Available
(Q56) What is the highest grade or level of school that you have completed?
Is it… [READ LIST] 1 8th grade or less 2 Some high school, but did not graduate 3 High school graduate or GED 4 Some college or 2-year degree 5 4-year college graduate 6 More than 4-year college degree -8 Don’t know -9 Not available
(Q57) Are you of Hispanic or Latino origin or descent?
1 Yes, Hispanic or Latino 2 No, Not Hispanic or Latino
-8 Don’t know -9 Not available

Adult 2001, 2003
Evaluating Florida’s Medicaid PSN Demonstration Project Patient Experience Analyses Final Report, June 2004
165
(Q58) What is your race? Are you… [SELECT ALL THAT APPLY]. 1 White 2 Black or African-American 3 Asian 4 Native Hawaiian or other Pacific Islander 5 American Indian or Alaska Native No answer/no more
(Q61) What language do you MAINLY speak at home? 1. English 2. Spanish 3. Other language (please specify) -8. Don’t Know -9. Not Available
ThankYou. Thank you very much for your help with this survey.

Child 2003
Evaluating Florida’s Medicaid PSN Demonstration Project Patient Experience Analyses Final Report, June 2004
167
PSN Evaluation Patient Satisfaction Survey Families With Children
(HELLO) Hello, my name is__________ and I’m calling from the University of Florida. INTERVIEWER: PRESS 1 TO CONTINUE WITH SURVEY (go to HOME) PRESS 3 TO CONTINUE IN SPANISH PRESS 5 IF ANOTHER LANGUAGE (go to LANG) (LANG) INTERVIEWER PRESS 1 IF IT SOUNDS LIKE HAITIAN CREOLE PRESS 2 IF IT SOUNDS LIKE AN ORIENTAL LANGUAGE PRESS 3 IF NOT SURE/OTHER (specify) (HOME) Is this the home of [NAME]? We are conducting research sponsored by Medicaid concerning customer satisfaction with their health plans in Florida. May I please speak with the parent or guardian of [NAME]?
1 Yes 2 No – reschedule
(PROCEED) Your child's name was selected at random from a list provided by Medicaid. All your answers will be completely confidential and of course you do not have to answer any questions you do not wish to. NOTE: THEY MAY KNOW THE PLAN AS EITHER MEDICAID, THE SOUTH FLORIDA COMMUNITY CARE NETWORK OR “THE P.S.N.” IF NECESSARY—The entire survey should take around 10 minutes.
1 – Proceed (RAGE) May I have your age?
(18-110) If less than age 18: "Thank you for your interest, but we are only talking to parents who are 18 years old or older." TERMINATE CALL -9 – Not Available
Child 2003
Evaluating Florida’s Medicaid PSN Demonstration Project Patient Experience Analyses
Final Report, June 2004
168
(RELT) How are you related to [NAME]? 1 Mother or father 2 Grandparent 3 Aunt or uncle 4 Older brother or sister 5 Other Relative 6 Legal guardian
(CAGE) And what is [NAME]'s age? (0-18) (Q1) Our records show that [NAME] is now in South Florida Community Care
Network PSN. Is that right? 1 Yes Go to Q3 2 No
-8 Don’t know -9 Not available (Q2) What is the name of your child's health plan? RECORD PLAN NAME (Q3) The next questions ask about your child's health care. Please do not include care you got when he or she stayed overnight in a hospital or times your child went for dental care visits. For the purposes of this survey, a personal doctor or nurse is the health
provider who knows your child best. This can be a general doctor, a specialist doctor, a nurse practitioner, or a physician assistant.
When your child was enrolled in this program or at any time since then, did he or she get a new personal doctor or nurse?
1 Yes 2 No Go to Question 5
-8 Don’t know -9 Not available (Q4) With the choices your child's program gave you, how much of a problem, if
any, was it to get a personal doctor or nurse for your child you are happy with? Would you say that it was….….[READ CHOICES]
1 A big problem 2 A small problem 3 Not a problem
-8 Don’t know -9 Not available
Child 2003
Evaluating Florida’s Medicaid PSN Demonstration Project Patient Experience Analyses Final Report, June 2004
169
(Q5) Do you have one person you think of as your child's personal doctor or nurse?
1 Yes 2 No Go to Question 7
-8 Don’t know -9 Not available (Q6) We want to know your rating of your child's personal doctor or nurse. Using a scale from 0 to 10 where 0 is the worst personal doctor or nurse
possible, and 10 is the best personal doctor or nurse possible. How would you rate your child's personal doctor or nurse now? (0-10)
-8 Don’t know -9 Not available (Q7) The next questions are about specialists. Specialists are doctors like
surgeons, heart doctors, allergy doctors, skin doctors, and others who specialize in one area of health care. Please do not include dental visits.
In the last 6 months, did you or a doctor think your child needed to see a
specialist? 1 Yes 2 No Go to Question 9
-8 Don’t know -9 Not available (Q8) In the last 6 months, how much of a problem, if any, was it to get a referral
to a specialist that your child needed to see? Would you say that it was….….[READ LIST]
1 A big problem 2 A small problem 3 Not a problem
-8 Don’t know -9 Not available (Q9) In the last 6 months, did your child see a specialist?
1 Yes 2 No Go to Question 12
-8 Don’t know -9 Not available (Q10) We want to know your rating of the specialist your child saw most often in
the last 6 months, including a personal doctor if he or she is a specialist.
Child 2003
Evaluating Florida’s Medicaid PSN Demonstration Project Patient Experience Analyses
Final Report, June 2004
170
Using a scale from 0 to 10 where 0 is the worst specialist possible, and 10 is the best specialist possible. How would you rate the specialist? (0-10)
-8 Don’t know -9 Not available (Q11) In the last 6 months, was the specialist your child saw most often the
same doctor as your child's personal doctor? 1 Yes 2 No
-8 Don’t know -9 Not available (Q12) In the last 6 months, did you call a doctor’s office or clinic during regular
office hours to get help or advice for your child? 1 Yes 2 No Go to Question 14
-8 Don’t know -9 Not available (Q13) In the last 6 months, when you called during regular office hours, how
often did you get the help or advice you needed for your child? Would that be never, sometimes, usually or always?
1 NEVER 2 SOMETIMES 3 USUALLY 4 ALWAYS
-8 Don’t know -9 Not available (Q14) The next questions refer to health providers. A health provider could be a
general doctor, a specialist doctor, a nurse practitioner, a physician assistant, a nurse, or anyone else you would see for health care.
In the last 6 months, did you make any appointments for your child with a doctor or other health provider for regular or routine health care?
1 Yes 2 No Go to Question 17
-8 Don’t know -9 Not available

Child 2003
Evaluating Florida’s Medicaid PSN Demonstration Project Patient Experience Analyses Final Report, June 2004
171
(Q15) In the last 6 months, how often did your child get an appointment for regular or routine health care as soon as you wanted? Would that be never, sometimes, usually or always?
1 NEVER 2 SOMETIMES 3 USUALLY 4 ALWAYS
-8 Don’t know -9 Not available (Q16) In the last 6 months, how many DAYS did you usually have to wait between making an appointment for REGULAR OR ROUTINE care for your child and actually seeing a provider? INTERVIEWER - READ CHOICES
1 Same Day 2 1 day 3 2 days 4 3days 5 4-7 days 6 8-14 days 7 15-29 days 8 30 days or longer -8. don’t know -9. not available
(Q17) In the last 6 months, did your child have an illness or injury that needed
care right away from a doctor’s office, clinic or emergency room? 1 Yes 2 No Go to Question 20
-8 Don’t know -9 Not available (Q18) In the last 6 months, when your child needed care right away for an illness
or injury, how often did you get care as soon as you wanted? Would that be never, sometimes, usually or always?
3 NEVER 4 SOMETIMES 5 USUALLY 6 ALWAYS
-8 Don’t know -9 Not available

Child 2003
Evaluating Florida’s Medicaid PSN Demonstration Project Patient Experience Analyses
Final Report, June 2004
172
(Q19) In the last 6 months, how LONG did you usually have to wait between trying to get care and actually seeing a provider for your child's ILLNESS OR INJURY? INTERVIEWER – READ CHOICES
1. same day 2. 1 day 3. 2 days 4. 3 days 5. 4-7 days 6. 8-14 days 7. 15-29 days 8. 30 days or longer -8. don’t know -9. not available
(Q20) In the last 6 months, how many times did your child go to an emergency
room?
(0-182) -8 Don’t know -9 Not available (Q21) In the last 6 months, not counting times you went to an emergency room,
how many times did your child go to a doctor’s office or clinic? Would you say…[READ LIST] 1 None Go to Question 36 2 1 time 3 2 times 4 3 times 5 4 times 6 5 to 9 times 7 10 or more times
-8 Don’t know -9 Not available (Q22) In the last 6 months, how much of a problem, if any, was it to get care for
your child that you or a doctor believed necessary? Would you say it was…[READ CHOICES]
1 A big problem 2 A small problem 3 Not a problem
-8 Don’t know -9 Not available
Child 2003
Evaluating Florida’s Medicaid PSN Demonstration Project Patient Experience Analyses Final Report, June 2004
173
(Q23) In the last 6 months, how much of a problem, if any, were delays in your child's health care while you waited for approval from your child's program? Would you say it was…[READ CHOICES]
1 A big problem 2 A small problem 3 Not a problem
-8 Don’t know -9 Not available (Q24) In the last 6 months, how often did your child wait in the doctor’s office or
clinic more than 15 minutes past your appointment time to see the person your child went to see? Would that be never, sometimes, usually or always?
1 NEVER 2 SOMETIMES 3 USUALLY 4 ALWAYS
-8 Don’t know -9 Not available (Q25) In the last 6 months, how often did office staff at your child's doctor’s office
or clinic treat you and your child with courtesy and respect?
INTERVIEWER – REPEAT SCALE IF NECESSARY
1 NEVER 2 SOMETIMES 3 USUALLY 4 ALWAYS -8 Don’t Know -9 Not Available
(Q26) In the last 6 months, how often were office staff at your child's doctor’s
office or clinic as helpful as you thought they should be?
INTERVIEWER – REPEAT SCALE IF NECESSARY
1 Never 2 Sometimes 3 Usually 4 Always -8 Don’t Know -9 Not Available
Child 2003
Evaluating Florida’s Medicaid PSN Demonstration Project Patient Experience Analyses
Final Report, June 2004
174
(Q27) In the last 6 months, how often did your child's doctors or other health providers listen carefully to you?
INTERVIEWER – REPEAT SCALE IF NECESSARY
1 Never 2 Sometimes 3 Usually 4 Always -8 Don’t Know -9 Not Available
(Q28) In the last 6 months, how often did you have a hard time SPEAKING WITH OR UNDERSTANDING your child's doctors or other health providers because you spoke different languages? INTERVIEWER – REPEAT SCALE IF NECESSARY
1 Never 2 Sometimes 3 Usually 4 Always -8 Don’t Know -9 Not Available
(Q29) In the last 6 months, how often did your child's doctors or other health
providers explain things in a way you could understand?
INTERVIEWER – REPEAT SCALE IF NECESSARY
1 Never 2 Sometimes 3 Usually 4 Always
-8 Don’t know -9 Not available
Child 2003
Evaluating Florida’s Medicaid PSN Demonstration Project Patient Experience Analyses Final Report, June 2004
175
(Q30) In the last 6 months, how often did your child's doctors or other health providers show respect for what you had to say?
INTERVIEWER – REPEAT SCALE IF NECESSARY
1 Never 2 Sometimes 3 Usually 4 Always
-8 Don’t know -9 Not available (Q31) Is your child old enough to talk with doctors about his or her health care?
1 Yes 2 No – go to Q36 -8 Don't know – go to Q36 -9 Not available – go to Q36
(Q32) In the last 6 months, how often did your child have a hard time speaking with or understanding doctors or other health providers because they spoke different languages?
1 Never 2 Sometimes 3 Usually 4 Always -8 Don’t Know -9 Not Available
(Q33) In the last 6 monhs, how often did doctors or other health providers explain things in a way your child could understand?
1 Never 2 Sometimes 3 Usually 4 Always -8 Don’t Know -9 Not Available
Child 2003
Evaluating Florida’s Medicaid PSN Demonstration Project Patient Experience Analyses
Final Report, June 2004
176
(Q34) In the last 6 months, how often did doctors or other health providers spend enough time with your child?
1 Never 2 Sometimes 3 Usually 4 Always
-8 Don’t know -9 Not available (Q35) We want to know your rating of all your child's health care in the last 6
months from all doctors and other health providers. Using a scale from 0 to 10 where 0 is the worst health care possible, and 10
is the best health care possible. How would you rate all your child's health care? (0-10)
-8 Don’t know -9 Not available (Q36) Sometimes people need an interpreter. An interpreter is someone who repeats or signs what one person says in a language used by another person. In the last 6 months, did you NEED an interpreter to help you speak with your child's doctors or other health providers?
1 Yes 2 No If Q31=1, go to Q38; if Q31 was not asked or =2, -8, -9, then go
to Q43 -8 Don’t Know If Q31=1, go to Q38; if Q31 was not asked or =2, -8, -9,
then go to Q43 -9 Not Available If Q31=1, go to Q38; if Q31 was not asked or =2, -8, -9,
then go to Q43
(Q37) In the last 6 months, when you needed an interpreter to help you speak with your child's doctors or other health providers, how often did you get one? Would that be never, sometimes, usually, or always?
1. NEVER 2. SOMETIMES 3. USUALLY 4. ALWAYS -8 Don’t know -9 Not Available
After Q 37. If Q31=1 ask Q38 else go to AGETEST

Child 2003
Evaluating Florida’s Medicaid PSN Demonstration Project Patient Experience Analyses Final Report, June 2004
177
(Q38) In the last 6 months, did your child need an interpreter to help him or her speak with doctors or other health providers?
1 Yes 2 No Go to AGETEST -8 Don’t Know -9 Not Available
(Q39) In the last 6 months, when your child needed an interpreter to help him or her speak with doctors or other health providers, how often did you get one? Would that be never, sometimes, usually, or always?
1. NEVER 2. SOMETIMES 3. USUALLY 4. ALWAYS -8 Don’t know -9 Not Available
AGE TEST: If CAGE greater or equal to 3, go to Q36 else ask REMIND (REMIND) Reminders from the doctor's office or clinic or from the health program can come to you by mail, by telephone, or in-person during a visit. After your child was born, did you get any reminders to bring him or her in for a check-up to see how he or she was doing or for shots or drops?
1 Yes 2 No -8 Don’t Know -9 Not Available
(REMIND2) Since your child was born, has he or she gone to a doctor or other
health provider for a check-up to see how she was doing or for shots or drops?
1 Yes 2 No -8 Don’t Know -9 Not Available

Child 2003
Evaluating Florida’s Medicaid PSN Demonstration Project Patient Experience Analyses
Final Report, June 2004
178
(REMIND3) Did you get an appointment for your child's first visit to a doctor or other health provider for a check-up, or for shots or drops, as soon as you wanted?
1 Yes 2 No -8 Don’t Know -9 Not Available
(Q43) The next questions ask about your experience with Medicaid, including
Medipass, the South Florida Community Care Network and others.
Do you use your current Medicaid program for all or most of your child's health care? 1 Yes 2 No -8 Don’t Know -9 Not Available
(Q44) How many months in a row has your child been in this program?
Was it ….[READ LIST] 1 Less than 3 months 2 3 up to 6 months 3 7 months up to a year 4 more than a year
-8 Don’t know -9 Not available (Q45) Did you choose your child's program or were you told which program your
child was in?
1 I chose my child's program. 2 I was told which program my child was in. -8 Don’t know -9 Not Available
(Q46) Health plans offer information about plan services in writing, by telephone,
or in person. Did you get any information ABOUT this program when your child was enrolled? 1 Yes 2 No Go to Q41 -8 Don’t Know -9 Not Available

Child 2003
Evaluating Florida’s Medicaid PSN Demonstration Project Patient Experience Analyses Final Report, June 2004
179
(Q47) How much of the information you were given before you signed your child up for the plan was correct?
INTERVIEWER – READ CHOICES IF NECESSARY 1 All of it 2 Most of it 3 Some of it 4 None of it -8 Don’t know -9 Not Available
(Q48) In the last 6 months, did you look for any information in written materials
from your child's program? 1 Yes 2 No Go to Q50
-8 Don’t know -9 Not available (Q49) In the last 6 months, how much of a problem, if any, was it to find or
understand information in the written materials? Would you say it was…[READ CHOICES]
1 A big problem 2 A small problem 3 Not a problem
-8 Don’t know -9 Not available (Q50) In the last 6 months, did you call the program’s enrollee service to get
information or help? 1 Yes 2 No Go to Question 52 -8 Don’t know -9 Not available
(Q51) In the last 6 months, how much of a problem, if any, was it to get the help
you needed when you called you child's program’s enrollee service? Would you say it was…[READ CHOICES] 1 A big problem 2 A small problem 3 Not a problem -8 Don’t know -9 Not available
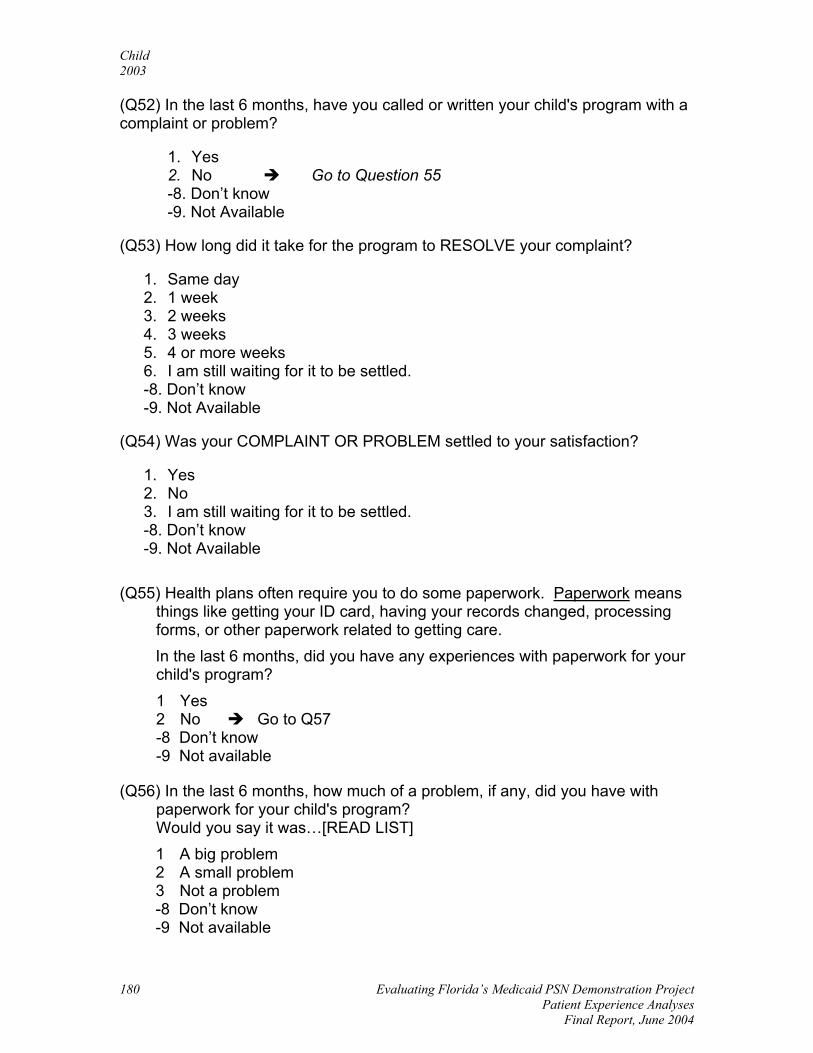
Child 2003
Evaluating Florida’s Medicaid PSN Demonstration Project Patient Experience Analyses
Final Report, June 2004
180
(Q52) In the last 6 months, have you called or written your child's program with a complaint or problem?
1. Yes 2. No Go to Question 55 -8. Don’t know -9. Not Available
(Q53) How long did it take for the program to RESOLVE your complaint?
1. Same day 2. 1 week 3. 2 weeks 4. 3 weeks 5. 4 or more weeks 6. I am still waiting for it to be settled. -8. Don’t know -9. Not Available
(Q54) Was your COMPLAINT OR PROBLEM settled to your satisfaction?
1. Yes 2. No 3. I am still waiting for it to be settled. -8. Don’t know -9. Not Available
(Q55) Health plans often require you to do some paperwork. Paperwork means
things like getting your ID card, having your records changed, processing forms, or other paperwork related to getting care.
In the last 6 months, did you have any experiences with paperwork for your child's program? 1 Yes 2 No Go to Q57 -8 Don’t know -9 Not available
(Q56) In the last 6 months, how much of a problem, if any, did you have with
paperwork for your child's program? Would you say it was…[READ LIST] 1 A big problem 2 A small problem 3 Not a problem -8 Don’t know -9 Not available

Child 2003
Evaluating Florida’s Medicaid PSN Demonstration Project Patient Experience Analyses Final Report, June 2004
181
(Q57) We want to know your rating of all your experience with your child's program.
Use any number from 0 to 10 where 0 is the worst health program possible, and 10 is the best health program possible. How would you rate your health plan now?
(0-10)
-8 Don’t know -9 Not available (Q58) In general, how would you rate your child's overall health now?
[READ LIST] 1 Excellent 2 Very good 3 Good 4 Fair 5 Poor -8 Don’t know -9 Not available
(Q59) Does your child have any kind of emotional, developmental or behavioral difficulty now for which he or she has received treatment or counseling?
1 Yes 2 No -8 Don’t Know -9 Not Available
(Q60) Is your child male or female?
1. Male 2. Female -8 Don't know -9 Not available
(Q61) Is your child of Hispanic or Latino origin or descent?
1 Yes, Hispanic or Latino 2 No, Not Hispanic or Latino
-8 Don’t know -9 Not available

Child 2003
Evaluating Florida’s Medicaid PSN Demonstration Project Patient Experience Analyses
Final Report, June 2004
182
(Q62) What is your child's race? Would you say… [SELECT ALL THAT APPLY]. 1 White 2 Black or African-American 3 Asian 4 Native Hawaiian or other Pacific Islander 5 American Indian or Alaska Native -8 No answer/no more
(RSEX) Now, we just have a few questions about you. [IF NECESSARY] Are you male or female?
1 Male 2 Female -8 Don't know -9 Not available
(Q64) What is the highest grade or level of school that you have completed? Is it… [READ LIST] 1 8th grade or less 2 Some high school, but did not graduate 3 High school graduate or GED 4 Some college or 2-year degree 5 4-year college graduate 6 More than 4-year college degree -8 Don’t know -9 Not available
(Q65) What language do you MAINLY speak at home? 1. English 2. Spanish 3. Other language (please specify) -8. Don’t Know -9. Not Available
(ThankYou) Thank you very much for your help with this survey.
Evaluating Florida’s Medicaid PSN Demonstration Project Patient Experience Analyses Final Report, June 2004
183
Comparison of 2001 to 2003 Survey Results For the adult sample, using the same instrument and methodology allowed us to make comparisons between the survey results from 2001 to 2003. Overall, the findings were stable. Only slight differences were observed, in many cases within the margin of error so that "no change" was the net result. For example, when it came to rating their "personal doctor or nurse now," the top ratings were given by 77.4% of PSN respondents in 2003, compared to 76.1% in 2001. For MediPass, the top ratings were reported by 80.0% of respondents in 2003 and 81.5% in 2001. Similar patterns were observed for ratings of "all health care" and "all their experience with the health program." Given the overall high ratings to both programs, this is good news. However, there was a shift in perceptions of specialist care. The percentage of those giving the top rating scores dropped in both programs, from 73.2% to 63.8% in the PSN and 80.2% to 72.4% in MediPass. In both programs, there was also a shift in the waiting time between trying to get care and actually seeing a provider between 2001 and 2003. For those seeking an appointment for regular or routine care, the percentage reported being seen in 3 days or less dropped from 36.2% to 27.8% for the PSN, and 65.6% to 52.6% for MediPass. For patients needing treatment for an illness or injury, the percentage who reported being seen the same day dropped from 61.5% to 44.4% for the PSN and from 65.9% to 51.3% for MediPass. The reported number of ER visits remained stable from 2001 to 2003, with the percentage of enrollees having at least one ER visit declining only slightly for the PSN (39.1% to 37.2%) and remaining unchanged for MediPass (30.3% to 30.5%). When it came to doctor's office or clinic visits, the percentage of enrollees having at least one visit had increased for both programs, and shifted so that the 2003 rates became almost identical between the PSN (81.7%, up from 71.6%) and MediPass (82.1%, up from 78.1%). However the PSN rate of those reporting 5 visits or more was the same (dropping only from 27.8% to 27.0%) while the MediPass percentage of those with 5 or more visits increased slightly from 35.6% to 41.6%. In the area of enrollee services, there were marked increases in PSN enrollees' reports that they had "no problem" getting the help they needed when calling the program's enrollee services office, rising from 52.2% to 69.8%. For MediPass, that rate declined slightly from 66.7% to 60.6%.

II. Disease Management
Programs

Evaluating Florida’s Medicaid PSN Demonstration Project Patient Experience Analyses Final Report, June 2004
187
Program Description Introduction This report describes and assesses the goals, plans, and outcomes to date of the disease state management component of the PSN project.
One of the objectives of the PSN demonstration as outlined by the 1997 Florida legislature was to improve the quality of life for Medicaid recipients living with chronic health conditions. Another objective was to achieve cost savings. Disease management programs have been implemented to accomplish both objectives. The disease management program was an attractive aspect of the PSN concept for many of the organizations that chose to participate in the PSN. Disease management is based on the premise that a small percentage of very sick patients consume the most resources. Disease management programs target patients with chronic diseases and provide intensive case management to serve their needs in a proactive manner.6 This may reduce the number of expensive visits to the emergency room and prevent disease complications. The net effect should be a cost savings, as well as better quality of life for patients. Medicaid programs seem likely to benefit from implementing such services, due to the large numbers of enrollees suffering from chronic illnesses. The SFCCN provider manual states:
The South Florida Community Care Network defines disease management as a comprehensive, integrated approach to care that focuses on both clinical and non-clinical intervention when and where they are likely to have the most impact. It is proactive and preventive in nature and engages the enrollee as a partner of the healthcare team. The SFCCN will work with providers and enrollees to improve clinical outcomes and systems efficiencies. The goal is health management and illness avoidance as well as improved adherence to your (the physician’s) treatment plan.
As outlined in the contract, the PSN was to develop and implement disease management programs for enrollees living with asthma, AIDS, diabetes, and hemophilia (although the contract acknowledged that due to the limited number of potential enrollees with hemophilia, that program might be deferred). The contract also noted that the PSN “may develop and implement additional disease management programs,” which might include cancer, sickle-cell anemia, end-stage renal disease, hypertension, and congestive heart failure. 6 Sidorov, J., Gabbay, R., Harris, R., Shull, R.D., Girolami, S., Tomcavage, J., Starkey, R., & Hughes, R. (2000) Disease management for diabetes mellitus: Impact on hemoglobin A(1C), American Journal of Managed Care, 6 (11): 1217-1226. See also Rossiter, L.F., Whitehurst-Cook, M.Y., Small, R.E., Shasky, C., Bovbjerg, V.E., Penberthy, L., Okasha, A., Green, J., Ibrahim, IA., Yang, S., & Lee, K (2000) The impact of disease management on outcomes and cost of care: A study of low income asthma patients, Inquiry, 37 (2): 188-202.
Evaluating Florida’s Medicaid PSN Demonstration Project Patient Experience Analyses
Final Report, June 2004
188
Disease management programs for diabetes and asthma were implemented in the first year of operation; additionally, a program for HIV/AIDS was implemented in March 2001 and a high-risk pregnancy program was implemented in September 2001. Although a program for hemophilia had been considered, it was ultimately decided that the minimal number of enrollees with that condition did not warrant implementation of the program. Each health system is responsible for administering the SFCCN Disease Management Program developed by a Disease Management Subcommittee that reports to the SFCCN Medical Operations Committee. Each program was required to include the following:
• Provider and recipient profiling • Specialized disease-specific physician care • Intensive care management • Provider education • Enrollee education • Clinical practice guidelines • Severity and risk assessment of the patient population • Initial screening to verify the enrollee’s diagnosis, any complications, and
the severity of the enrollee’s illness • Interventions designed to improve compliance • Interventions designed to prevent acute events
Some of the health systems that participate in the PSN had experience with some disease management initiatives, but not full-fledged programs. Thus participation in the PSN allowed them to more systematically design and fully implement comprehensive disease management programs. Each health system had strengths that they could share with the others to build a stronger program overall.
The PSN staff felt they were in a better position to do a good job of disease management than the MediPass program, because whereas the MediPass disease management programs were subcontracted to a private firms, the PSN staff has direct access to records, especially emergency room records and patients that allow more timely intervention. The PSN providers also participated in development of the disease management programs, resulting in a program that providers found to be acceptable and workable, and in which they had vested interest. It is a mark of the success of these programs that recently contracts were changed so that the same team of people who are conducting the HIV/AIDS disease management programs for the PSN will also be providing some of the same services for MediPass patients in Miami-Dade and Broward Counties. Patients are identified for inclusion in the disease management programs in several different ways:
1. The Agency identifies some. 2. The PSN does claims analysis, including pharmaceutical usage.

Evaluating Florida’s Medicaid PSN Demonstration Project Patient Experience Analyses Final Report, June 2004
189
3. The PSN works with clinic staff. 4. The PSN monitors ERs and inpatient admissions. 5. Some are self-referred. 6. Health risk assessments/physician referral.
Patients are notified of their enrollment in the program via a letter, and are considered enrolled unless they decline.

Evaluating Florida’s Medicaid PSN Demonstration Project Patient Experience Analyses
Final Report, June 2004
190
Disease State Management Programs The following are the disease state management programs that are currently in operation in the SFCCN. Asthma Intervention guidelines were developed for the various risk factors for both adult and pediatric asthma. The instrument that was selected for the initial assessment of both pediatric and adult patients was the Mini Asthma Quality of Life questionnaire. This instrument was developed by Elizabeth F. Juniper of McMaster University in Canada, and has been thoroughly tested and evaluated for validity. The questionnaire is administered to the patient if 7 years of age or older, and to the caregiver of younger children. The form is to be completed when the patient first visits the clinic, so that conversations with health providers about the patient’s disease state do not bias the answers. After six months, the enrollee is given a follow-up questionnaire. There are six measurable indicators for which the asthma program provides outcomes, for each of the three health systems. These indicators include the following:
1. Inpatient admissions – The number and percentage of disease management enrollees who are admitted to the hospital with a primary diagnosis of asthma
2. Average length of stay – The average number of hospital days for enrollees admitted with asthma related conditions
3. Readmission – Number of readmissions within 30 days with the same primary diagnosis of asthma
4. Emergency room visits – Number and percentage of asthma enrollees who are seen in the emergency room with a primary diagnosis of asthma
5. Use of an inhaled corticosteroids – Number and percentage of patients with two emergency room visits and/or one hospitalization who are on an inhaled corticosteroids
6. Rescue medications – Number and percentage of enrollees on rescue medications
Over time the disease management program should result in reduced rates for the first four indicators, and increased percentages for the last two. For better asthma control, persistent asthma sufferers should use inhaled corticosteriods daily. Patients should benefit from access to rescue medications. There is certainly interplay among these indicators, as it is expected that use of an inhaled corticosteroid will be associated with a decrease in visits to the emergency room. During the first year of the asthma program's operation, 2,447 individuals were enrolled. Of these, most (2,040) had been enrolled for more than six months. Inpatient admissions averaged 3.7 admissions per 1000 enrollee months, with enrollees who had been in the disease management program for more than 6 months having a lower rate of only 3.2 per 1000 enrollee months. The average length of stay was 3.1 days per admission and only a

Evaluating Florida’s Medicaid PSN Demonstration Project Patient Experience Analyses Final Report, June 2004
191
small number (14 patients) were re-admitted. There were 327 emergency room visits for a rate of 13.1 visits per 1000 enrollee months. About 71.1 percent of enrollees are on inhaled corticosteroids, and 32.2 percent utilize rescue medications.
Patient and family education is one of the major components of the asthma program, and all the health systems have held workshops and classes to help patients understand their disease and how they can monitor their condition and use preventive treatments. Diabetes At the initial assessment, the diabetes program uses a Risk Stratification Tool to help the care manager determine the patient’s risk level. The care manager then follows guidelines for appropriate interventions based on the patient’s risk level; those at increased risk will receive more face-to-face interaction with the care manager, and a possible referral to a nutritionist. Quality of life is assessed using the SF-12 survey instrument.
Standards of care were developed for diabetes patients as follows:
TEST/REFERRAL STANDARD OF CARE Blood Pressure Every clinic visit Weight Every clinic visit Foot Inspection Every clinic visit HgA1c Every 3 months Microalbumin – dip stick Every 6 months Urinary protein – 24 hour Once per year Eye exam Once per year Foot exam for sensation Once per year for low risk Dentist Once per year Podiatrist Nephrologist Neurologist Social Worker Nutritionist/Dietician
As needed
There are six measurable indicators for which the diabetes program provides figures, from each health system and for the SFCCN combined. These indicators include the following:
1. Inpatient admissions – The number and percentage of disease management enrollees who are admitted to the hospital with a primary or secondary diagnosis of diabetes
2. Average length of stay – The average number of hospital days for enrollees admitted with a primary or secondary diagnosis of diabetes
3. Readmission – Number of readmissions within 30 days of discharge with the same primary diagnosis [Note: It is not necessary that diabetes be the primary diagnosis here, just that the primary diagnosis (be it gangrene or renal disease, etc.) stays the same]
Evaluating Florida’s Medicaid PSN Demonstration Project Patient Experience Analyses
Final Report, June 2004
192
4. Emergency room visits – Number and percentage of diabetes enrollees who were seen in the emergency room with a primary or secondary diagnosis of diabetes
5. Average HgA1c – This is the sum of all A1c scores divided by the total number of HgA1cs performed
6. Diabetes retinal exams – Number and percentage of enrollees who have received annual comprehensive eye exams through dilated pupils to screen for retinal vascular damage
Over time the rates for the first four indicators are expected to decrease. The Hemoglobin A1c (HgA1c) is an indicator related to how well the enrollee has been controlling his or her blood sugar over the past 3 months. The HgA1c test gives a measurement of the amount of glucose that has been attached to the blood’s hemoglobin over the past 3 to 4 months; the goal is to have enrollees’ levels average less than 8, and it is expected that this figure will decrease over time. Lastly, it is hoped that the percent of enrollees receiving annual eye exams will increase. Patients often have no noticeable symptoms before major damage is done, and it takes a comprehensive eye exam, with a referral to a qualified professional, to recognize such damage. With early detection and treatment, the risk for visual impairments and blindness can be reduced. During the first year of its operation, the diabetes program had 809 enrollees, with just over half (427) being enrolled for more than 6 months. Inpatient admissions averaged 9.9 admissions per 1000 enrollee months, while the average length of stay was 5.6 days per admission and only a small number (4 patients) were re-admitted. There were 141 emergency room visits for a rate of 23.6 visits per 1000 enrollee months. The average HgA1c level was 8.21, approaching the target. There were only 21 annual retinal exams reported during the first year, but hopefully this is a problem in the reporting process rather than an indication of substandard care. HIV/AIDS Program This program became operational on March 1, 2001. The measurable indicators include the following:
1. Inpatient Admissions – The number and percentage of disease management enrollees who are admitted to the hospital with a primary or secondary diagnosis of HIV/AIDS.
2. Average Length of Inpatient Stay – The average number of hospital days for enrollees admitted with a primary or secondary diagnosis of HIV/AIDS.
3. Inpatient Re-Admissions – Number of readmissions within 30 days of discharge with the same primary diagnosis.
4. Emergency Room Usage – Number and percentage of diabetes enrollees who were seen in the emergency room with a primary or secondary diagnosis of HIV/AIDS.
5. CD4 Test Performed - Also known as T4 tests or T-cell counts, this test measures
the number of CD4 cells in the blood, and provides an indication of how much damage HIV is doing to the immune system.
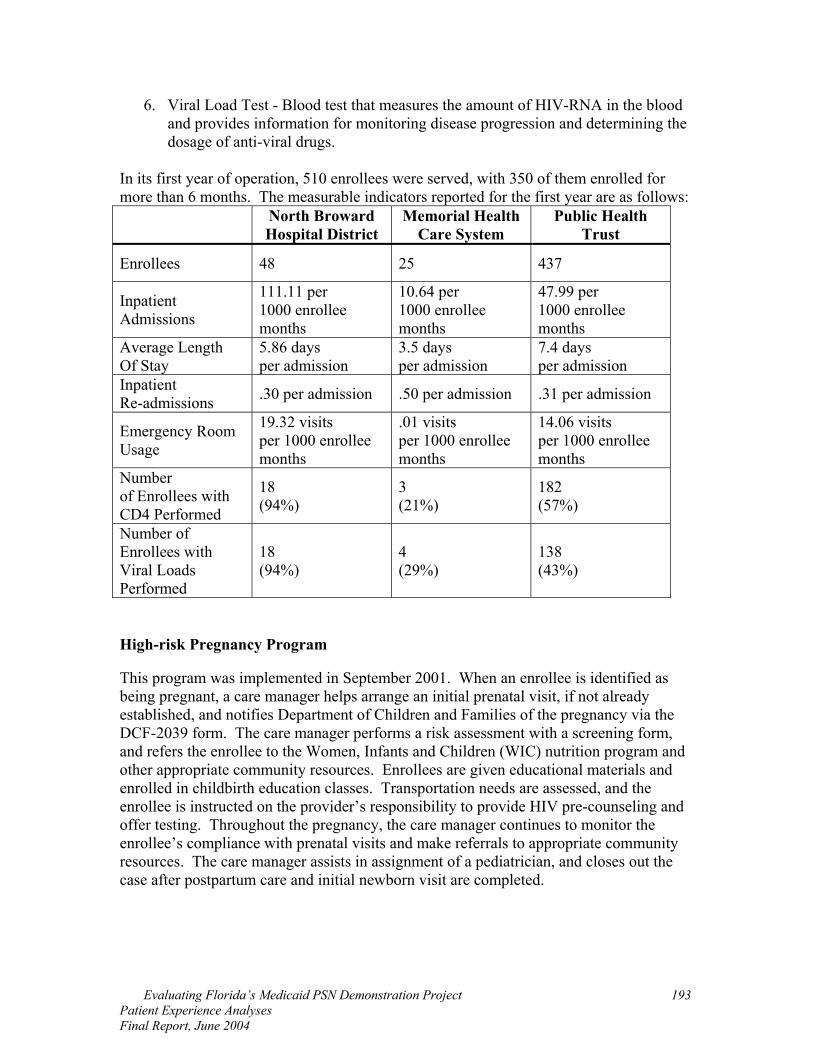
Evaluating Florida’s Medicaid PSN Demonstration Project Patient Experience Analyses Final Report, June 2004
193
6. Viral Load Test - Blood test that measures the amount of HIV-RNA in the blood and provides information for monitoring disease progression and determining the dosage of anti-viral drugs.
In its first year of operation, 510 enrollees were served, with 350 of them enrolled for more than 6 months. The measurable indicators reported for the first year are as follows: North Broward
Hospital District Memorial Health
Care System Public Health
Trust
Enrollees 48 25 437
Inpatient Admissions
111.11 per 1000 enrollee months
10.64 per 1000 enrollee months
47.99 per 1000 enrollee months
Average Length Of Stay
5.86 days per admission
3.5 days per admission
7.4 days per admission
Inpatient Re-admissions .30 per admission .50 per admission .31 per admission
Emergency Room Usage
19.32 visits per 1000 enrollee months
.01 visits per 1000 enrollee months
14.06 visits per 1000 enrollee months
Number of Enrollees with CD4 Performed
18 (94%)
3 (21%)
182 (57%)
Number of Enrollees with Viral Loads Performed
18 (94%)
4 (29%)
138 (43%)
High-risk Pregnancy Program This program was implemented in September 2001. When an enrollee is identified as being pregnant, a care manager helps arrange an initial prenatal visit, if not already established, and notifies Department of Children and Families of the pregnancy via the DCF-2039 form. The care manager performs a risk assessment with a screening form, and refers the enrollee to the Women, Infants and Children (WIC) nutrition program and other appropriate community resources. Enrollees are given educational materials and enrolled in childbirth education classes. Transportation needs are assessed, and the enrollee is instructed on the provider’s responsibility to provide HIV pre-counseling and offer testing. Throughout the pregnancy, the care manager continues to monitor the enrollee’s compliance with prenatal visits and make referrals to appropriate community resources. The care manager assists in assignment of a pediatrician, and closes out the case after postpartum care and initial newborn visit are completed.
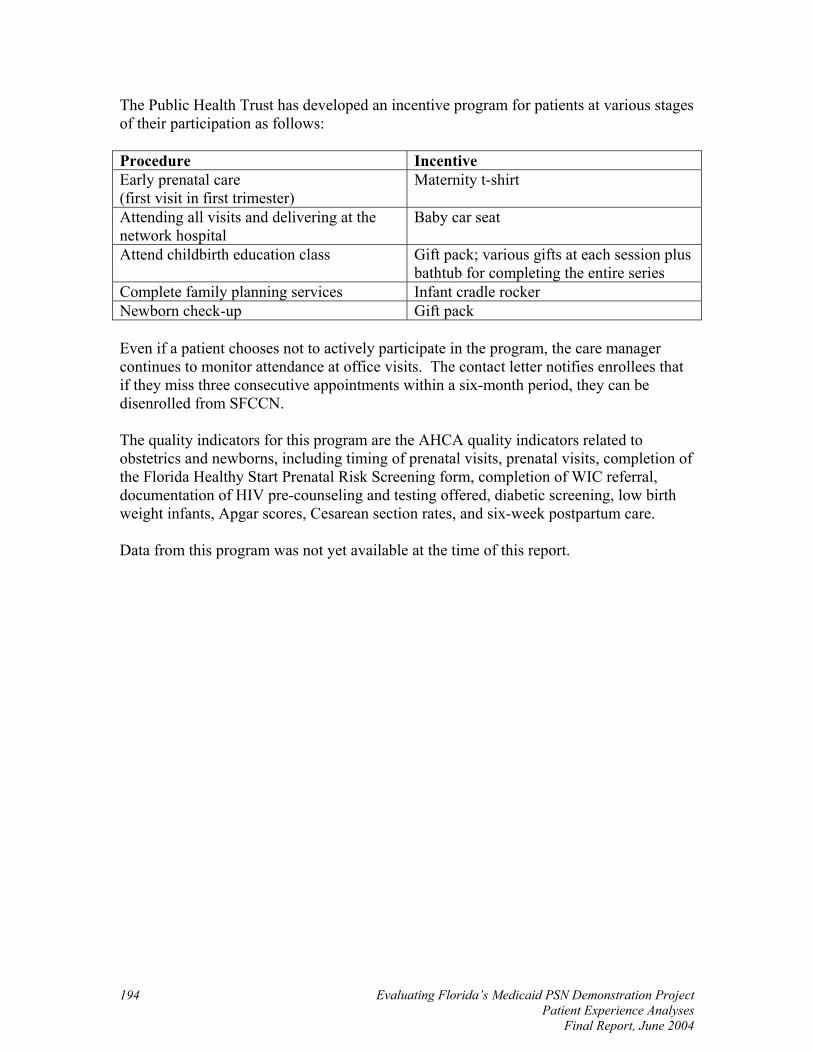
Evaluating Florida’s Medicaid PSN Demonstration Project Patient Experience Analyses
Final Report, June 2004
194
The Public Health Trust has developed an incentive program for patients at various stages of their participation as follows: Procedure Incentive Early prenatal care (first visit in first trimester)
Maternity t-shirt
Attending all visits and delivering at the network hospital
Baby car seat
Attend childbirth education class Gift pack; various gifts at each session plus bathtub for completing the entire series
Complete family planning services Infant cradle rocker Newborn check-up Gift pack Even if a patient chooses not to actively participate in the program, the care manager continues to monitor attendance at office visits. The contact letter notifies enrollees that if they miss three consecutive appointments within a six-month period, they can be disenrolled from SFCCN. The quality indicators for this program are the AHCA quality indicators related to obstetrics and newborns, including timing of prenatal visits, prenatal visits, completion of the Florida Healthy Start Prenatal Risk Screening form, completion of WIC referral, documentation of HIV pre-counseling and testing offered, diabetic screening, low birth weight infants, Apgar scores, Cesarean section rates, and six-week postpartum care. Data from this program was not yet available at the time of this report.

Evaluating Florida’s Medicaid PSN Demonstration Project Patient Experience Analyses Final Report, June 2004
195
Discussion SFCCN produced reports giving data for the measurable indicators for the respective programs at the end of each disease management program's first year of operation. While data for the first year will serve as a benchmark for future years, it should also be recognized that this initial time period reflects a process of refinement as each new program is implemented for the first time, and everyone associated with the program becomes accustomed to both the process and the reporting requirements. Beyond the reported statistics, many people in the PSN organization feel that there have been additional benefits, as expressed in our qualitative interviews with providers and PSN administrators.
Some feel that the disease management program has opened the lines of communication between hospitals and providers, and among providers. Others observed that patients in disease management programs are more likely to participate in their own care and be more receptive to change. Bonding with the care manager seems to play an important role in the efficacy of the program. In South Broward, this was the first program of its kind, and generated interest in the possibilities for further enhanced collaboration.
One of the challenges is that since the claims system feeds into disease management, errors in coding diagnoses could result in missing people. However, providers felt that the PSN disease management program gave them greater flexibility in identifying patients who should be enrolled in disease management. Other challenges include the transience of this population and difficulty communicating (only 25% have telephones).
In general, the diabetes program had a more favorable impression across interviews at different points in time and various sites; physicians seemed to think the diabetes patients received good followup, especially ensuring the patient got specialty care. Primary care providers reported good communication with care managers.
While the diabetes program has met with widespread approval, the asthma program has received more mixed reviews. While some physicians are very positive about the effectiveness, others said the asthma program had been disappointing in that it has not noticeably improved patient care, and physicians still feel they are limited in the ability to refer patients, with subspecialty referral problems a particular concern. However, it should be noted that there is a general shortage of such specialists in South Florida; even patients with private insurance may have trouble with access to specialists.
Some people noted that these disease management programs had a positive “spillover effect” that affected more than PSN enrollees. Once enrolled in the disease management programs, the people would likely be followed by care managers even if they lost Medicaid eligibility. Further, some of the educational programs are designed for and targeted to PSN disease management enrollees but open to the public.

Evaluating Florida’s Medicaid PSN Demonstration Project Patient Experience Analyses
Final Report, June 2004
196
Providers said that they would like to see the disease management programs exapanded to include the following:
• Obesity (particularly childhood obesity) • Violence prevention • Teen pregnancy (already covered in high-risk pregnancy, but some providers
felt a separate program was warranted) • Pain management
Overall, the reaction of providers was positive: “Our beds are full, so if we can manage care to keep people out of the ER and hospital, then it is a good thing,” one said. Another noted that with the case manager, “There’s been a noticeable improvement in patients’ knowledge about the disease.”

Evaluating Florida’s Medicaid PSN Demonstration Project Patient Experience Analyses Final Report, June 2004
197
Qualitative Research With Disease Management Enrollees Introduction One innovative part of the PSN demonstration has been the implementation of disease management programs for enrollees with chronic illness. In periodic interviews with PSN health care providers conducted as part of the organizational analyses, the disease management programs are often mentioned as a part of the PSN system that works well, and provides "value added" to Medicaid recipients. But a missing piece of the evaluation was the patient's point of view. When we became interested in exploring the enrollees' view of these disease management programs, the original thought was to conduct a survey. However, we found there was no rigorously tested and widely accepted survey instrument available for this type of evaluation. Moreover, with a survey, responses would be limited by the questions that are asked. Therefore, we opted to conduct qualitative research that would provide flexibility in exploring the wide range of issues that may be salient to enrollees in these programs. There were four groups of people that we hoped to reach:
• English-speaking enrollees in the asthma disease management program • Spanish-speaking enrollees in the asthma disease management program • English-speaking enrollees in the diabetes disease management program • Spanish-speaking enrollees in the diabetes disease management program
The University of Florida Survey Research Center (SRC) at the Bureau of Business and Economic Research was subcontracted to recruit the participants and moderate a small number of focus groups. Participants for focus groups were recruited using currently accepted best practices.7 Potential participants were initially contacted by telephone about two weeks prior to the scheduled date, and were taken from a list of disease management enrollees provided by the PSN. For the diabetes patients, only those over 18 were considered. For asthma patients, if the enrollee was under age 18, a parent or guardian was invited to participate in the discussion. Following the telephone contact, those who agreed to participate received a letter that gave directions to the location, contact telephone numbers, and more information about the purpose and scope of the discussion. The day before the session, the individuals received a reminder phone call. The groups were held in locations near many enrollees' home addresses, at places well known in the community and conveniently located near mass transportation. Both had bus stops immediately outside the building and a rail stop less than two blocks away. 7 Krueger, R.A., & Casey, M.A. (2000) Focus Groups: A Practical Guide for Applied Research, Sage Publications, Third Edition.
Evaluating Florida’s Medicaid PSN Demonstration Project Patient Experience Analyses
Final Report, June 2004
198
Light refreshments were provided, specifically targeted to be acceptable to a diabetic diet for that group. Participants were given a $25 WalMart gift card, and a letter again stating the purpose of the discussion and giving our contact information. Although the ideal was to conduct four focus groups, we recognized that recruiting sufficient numbers of people for the groups might not be possible due to the limited number of patients in these programs and the health status and transportation barriers some enrollees face. The contingency plan was to conduct individual qualitative interviews rather than focus groups. The initial recruitment phone script required that if someone was not able to attend a focus group, they were also asked about willingness to participate in a qualitative interview at their home. This process recruited 15 enrollees for the English Diabetes group and 12 English Asthma group, with both sessions held October 24-25, 2003. Although a few Spanish Diabetes patients had agreed to participate in the focus group, there were not sufficient numbers to make a group. Therefore, all the Spanish interviews were conducted as individual interviews, following a similar outline to the content covered in the focus groups. In total, four participants came to each of the focus groups, and an additional five interviews were conducted in Spanish. All the interviews were audiotaped and transcribed, with the Spanish interviews translated into English. The caveats associated with survey research also apply to these findings: these comments reflect the enrollees' perceptions, and may or may not be accurate. In many instances, participants would talk about their "social worker" and we were not sure whether it was a social worker or a nurse care manager. Additionally, many of their complaints had to do with their disease itself or the health system in general, and could not really be addressed by the disease management program. Yet all those issues were sometimes intertwined from the patient's point of view and must be understood in that context. This study was designed to be exploratory in nature, and findings are not generalizeable to the rest of the population. However, this was a valuable first step toward examining the issues surrounding disease management programs from the enrollees’ perspective.

Evaluating Florida’s Medicaid PSN Demonstration Project Patient Experience Analyses Final Report, June 2004
199
Major Themes Awareness of enrollment in the disease management program We found a great deal of variation in the extent to which people recognized that they were enrolled in the disease management program
• Some were very aware. They knew their care manager by name, had her contact information, and called her whenever they had questions.
• Some knew that they saw an extra nurse when they went for their visits • Some reported getting a letter "out of the blue" inviting them to a class • Some insisted that only their doctor cared for them, and there had been no letter
and was no nurse or care manager involved. Extra Assistance from Disease Management For enrollees who were aware that they were enrolled in the program, they could clearly identify "extra" or additional help that they received from the care manager, including the following:
• Nurses provided detailed information about the effect of carpeting and pets on asthma.
• One child found out about asthma camp and had a great experience. • Diabetes patients talked about help in getting shoes. • Extra help on how to use equipment. • "A little book to look up what foods are best for me." • "She always checks." • Arranged for transportation to the classes. • Called and moved up the time for an MRI so that he didn't have to wait so long. • "Tells me the best places to get things I need for a good price. Like where to find
whole wheat bread cheapest." • "I never had a social worker beside me, and now I have two. The social
worker…she knows…I mean, the hospital is my second house. I have no veins! They cannot find veins in me because I've been injected so many times. The social workers help me to avoid being hyper…stressed. And to avoid thinking things."
• One diabetes patient referred to her care manager as "a handywoman….Because she is a nurse, she's a social worker, she is the one teaching the classes. She is very nice and she teaches me a lot of things."
Difference in their lives from disease management For enrollees who were aware that they are enrolled in the program, they found the disease management program had an impact on their day-to-day lives. Some examples:
• Some of the diabetes patients reported that they had fewer emergency room visits in the last few years since participating in the disease management program.
• "I feel a whole lot better. I'm taking better care of myself." • "She is really nice. Really nice and very helpful. If I have questions, I have her
number, her cell phone number and her number at work. If I have any problems I

Evaluating Florida’s Medicaid PSN Demonstration Project Patient Experience Analyses
Final Report, June 2004
200
can call her. Before I started seeing her, though, I used to wake up in the morning with my sugar so low."
• "It's not like a monkey on my back, but they are on me. If I mention something to them it's done, I don't have to worry about it."
Classes Many participants brought up the classes as something that positively impacted their care and ability to manage their condition.
• One participant was disappointed because classes were suspended until January • "It teaches you how to use your rescue inhaler, it shows you what you call a peak
monitor…that let's me know that he is in danger and he needs to go to the hospital."
• "The meetings help remind me…I have been checking and controlling what I eat." • "The classes that I went to made me remember many things." • "Get to ask lots of questions." • "I kept denying, I'm not diabetic, no I don't need to be here. But they were very
helpful, definitely. They told me a lot of things about it. When they gave me the kit at the class and told me to start taking my blood sugar, I found out that I was a little bit more diabetic than I thought."
• Some participants noted that the classes discussed overall health (exercise, cholesterol levels) as well as their particular disease.
Written Educational Materials Enrollees said that they received a lot of written materials, brochures and pamphlets, through the disease management program.
• Some participants complained that the brochures were repetitive, that they kept giving out the same materials over and over.
• Some participants found them to be clear and understandable, but one commented, "I went to nursing school but if I hadn't been, I would be lost."
• A mom of an asthma patient said that all her information was in English; she would like materials that were translated into Haitian Creole.
• A diabetes patient said he appreciated that all materials were in three languages. • One asthma patient gets e-mails from the American lung association.

Evaluating Florida’s Medicaid PSN Demonstration Project Patient Experience Analyses Final Report, June 2004
201
Ratings of Care Overall, all participants rated their care very positively.
• One patient called their doctor "electrifying." • A Spanish speaker described their provider as, "American but great person." • When asked to rate their overall care on a scale from 1 to 10, one participant said
"28!" • A common specific complaint was a long wait at the clinic. An additional
complaint was the long wait to get an appointment (upon followup questioning, this was often with a specialist). The long days of testing at the hospital were also very exhausting
• "I think they do everything they possibly can. They make suggestions that would help you, and they call."
• "Don't change a thing…it's excellent." Changes in Care Some of the participants had been receiving Medicaid for many years, some more than 10 years. For those people in particular we tried to find out if their care had changed in the last few years since the introduction of the disease management programs.
• One mom wished they had sent the letter eight years ago when her son was first diagnosed. It would have been good to have those classes right away.
• Another woman who was diagnosed with diabetes two decades ago talked about what a shock it was and how little training she got. A nurse just came to her bed and said, "Here's your package…this is for you to inject yourself because you are a diabetic." The woman said, "I started screaming. It was like a shower bath with cold water."
• A diabetes patient for many years reported that her care manager had "straightened her out" and she hadn't needed an ER visit in more than a year.
Unmet Needs Although patients who knew they were enrolled in the program and could identify their care manager were very satisfied, patients who were unaware of their enrollment in disease management reported significant unmet needs, including the following:
• Confusion with glucose monitor. • Not told about mass transit passes for Medicaid recipients. • Don't get visits often enough (one participant reported being scared to cut their
own toenails, but knew they had to be cut.) • "A telephone number that I could call somebody and ask them to take care or do
something for me?" • Language barriers were a significant problem for some; "He talks to me in
English and Spanish, but very little. He doesn't have a nurse."
Evaluating Florida’s Medicaid PSN Demonstration Project Patient Experience Analyses
Final Report, June 2004
202
Social Support It seems clear that one of the positive functions of the classes is not just transferring information, but also providing a forum for patients and family to share their experiences and concerns. It may be that the disease management programs would be enhanced by adding a social support mechanism independent of the classes.
• "I liked the classes a lot because I get to hear of other people's experiences and things."
• One mother of an asthmatic patient said she had been contacted once about an "Asthma Moms" support group, but hadn't heard anything else and hoped it would be functioning soon.
• At the end of our formal discussion, two of the moms had a long conversation about the pros and cons of continuing with a local doctor versus moving to the larger clinic at Jackson.
Gratitude When asked what they would like to tell the people who run Medicaid about this program, many used the opportunity to express profound gratitude for the care they received.
• "They fight for the health and well being of everyone…for humanity." • "If someone that pays their own bills has a priority over me, there is nothing
wrong with that, but that's not what I've seen." • "We are having hard times now and we really appreciate it." • "I would like to thank them. I would like them to know that Medicaid is good
because they help you out if you have a problem, they always help you. If it wasn't for them, my daughter wouldn't be here right now."
Evaluating Florida’s Medicaid PSN Demonstration Project Patient Experience Analyses Final Report, June 2004
203
Appendix D Methodological Details on Recruitment Recruiting for focus groups must be done within a fairly narrow window of time, not starting too far in advance (lest people forget or be unsure about their schedule) and finishing enough days before the session to allow time for the letter to arrive. All our recruitment calls were made from two weeks to six days prior to the session. We found that some of the listings provided by the PSN were unusable due to missing information. For example, the asthma list for one of the subnetworks had 80 cases where the birth date was missing. Since this data point was essential to our recruitment strategy and IRB requirements, those individuals were not called. Additionally, we used the zip code map to prioritize our calls, first calling those who were closest to the focus group sites. The final outcome of the initial recruitment calls was as follows: 32 committed to focus group 14 agreed to in-house interview but not focus group 66 break-off or refusal 1391 no answer/answering machine/busy 10 unable: language/physical/mental 271 disconnected/number changed 203 named person not there 105 said they were not in program 349 could not reach named person In our experience, a lot of the "no answer" calls were probably disconnected. In addition to having a hard time tracking down the named individuals, we also reached a significant number of people who said they were not in the program; however, in some cases they may have been saying this as a polite way of refusing to participate.


III. Disenrollee Study

Evaluating Florida’s Medicaid PSN Demonstration Project Patient Experience Analyses Final Report, June 2004
207
Introduction The objective of this study was to examine the number and characteristics of enrollees who voluntarily chose to leave the PSN and elected another Medicaid plan instead. Disenrollment is important for two reasons. First, it can be viewed as a measure of satisfaction, since those who leave the plan are “voting with their feet.” Second, minimizing numbers of disenrollees, especially for reasons that could be controlled by the PSN through improved performance, is crucial to the continued viability of the program. For a health plan to succeed, it must have a sufficient number of enrollees to keep the infrastructure in operation. Enrollment in the PSN has come through three sources:
1. Enrollees who voluntarily moved from MediPass to PSN with their primary care provider when the provider made the decision to affiliate with the PSN.
2. New Medicaid recipients who had not expressed a plan preference and who were assigned to the PSN during a time period when mandatory assignment was functioning.
3. Those who elected to enroll in the PSN. Each of these enrollees had an opportunity for voluntary disenrollment, at the beginning of their PSN enrollment and on an annual basis. For our analysis of voluntary disenrollment, we looked primarily at one year, between July 2001 to June 2002. The time period was selected after consultation with AHCA and SFCCN, based on comparability with other evaluation efforts and avoiding the initial start-up phase. This is the first full fiscal year after the PSN's first year of operation. This study examined data provided by the state contractor that handles enrollment processes, which was Benova, Inc. during that time period. Every time an enrollee initiated a change to another Medicaid plan, the reason for changing was noted; that stated reason was used in these analyses. The advantage of this approach is that we have this information for the entire universe of voluntary disenrollees, including every individual who changed from the PSN to another Medicaid plan. Another advantage is that this stated reason was given at the time of disenrollment and has not been muddied by subsequent experiences. For example, in surveys that ask disenrollees about their reasons some weeks later, their intervening experience may color their responses. They may have actually disenrolled because they thought they would get better care elsewhere. If it turned out that the care was not better, then they may cite the location of the office as a reason for changing, even though that was a secondary concern. It should be noted that these reasons are recorded only for those who effect a change in plans and call the toll-free number for Benova. But they may get calls from persons who are not currently eligible to change plans, and those who have a complaint. The PSN

Evaluating Florida’s Medicaid PSN Demonstration Project Patient Experience Analyses
Final Report, June 2004
208
encourages enrollees who are unhappy with their care to first change providers within the PSN. This study only included beneficiaries switching from the PSN to a comparable plan. The initial data set had included a few individuals who had switched to Children’s Medical Services, but since that option is not available to most PSN enrollees, those individuals were dropped from this analysis. We also deleted some who were dually eligible for Medicaid and Medicare, and some who had either lost eligibility for Medicaid or had moved out of the plan service area. We examined the demographic characteristics of disenrollees, and the plans that disenrollees chose when they left the PSN. We also reviewed disenrollment over the entire operating life of the PSN, to see if patterns of disenrollment could be observed. For some of these analyses, we use the concept of "person-months." For each month, the plan into which an individual is enrolled is indicated. For an individual whose coverage can be followed for the entire period, his/her contribution to the coverage period would be 12 months. The sum of total months contributed by all individuals who were being followed during the coverage period is person-months, i.e. it shows how much time (months) all individuals contributed (were covered) during the specified period. Our data showed that for the target period, the number of person-months was 53,197. Disenrollment occurs to any individual at any month during the target period when he/she voluntarily decides to shift from PSN to another plan. Multiple disenrollments are possible for an individual during the target period. The total number of months in which individuals disenrolled from PSN for the entire target period gives the total person-months of disenrollment. The data showed a total of 5,083 person-months of disenrollment for the target period.

Key Findings
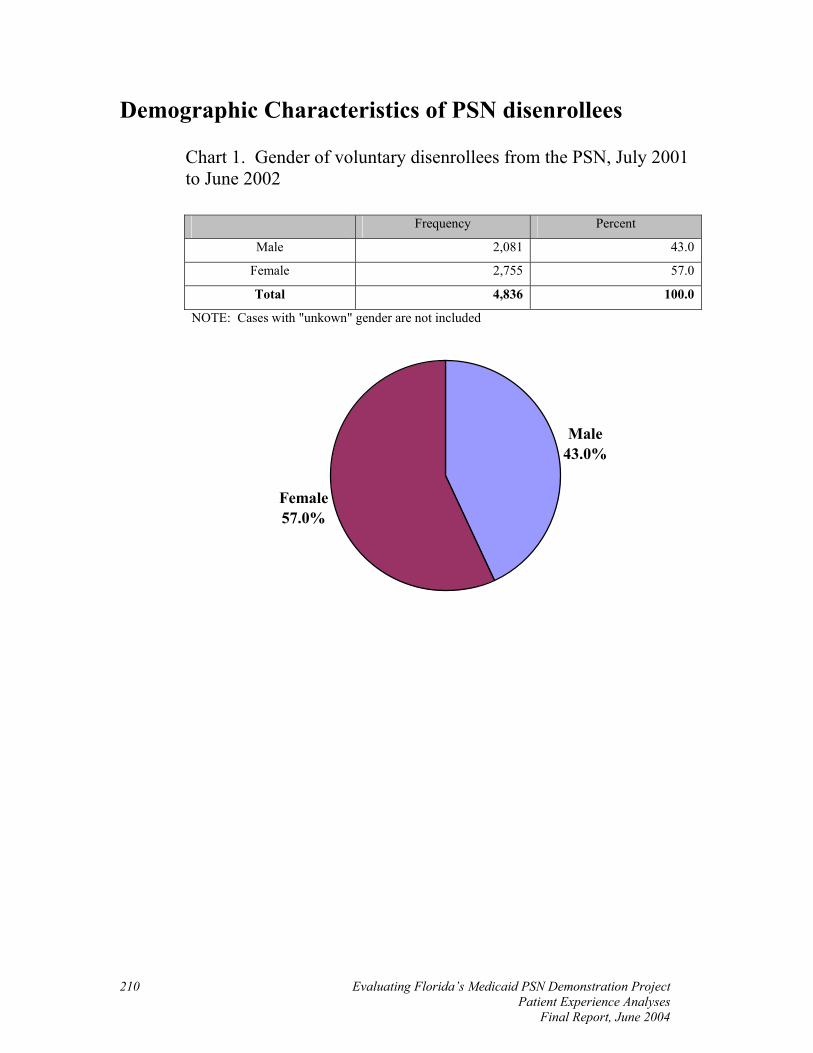
Evaluating Florida’s Medicaid PSN Demonstration Project Patient Experience Analyses
Final Report, June 2004
210
Demographic Characteristics of PSN disenrollees
Chart 1. Gender of voluntary disenrollees from the PSN, July 2001 to June 2002
Frequency Percent
Male 2,081 43.0
Female 2,755 57.0
Total 4,836 100.0
NOTE: Cases with "unkown" gender are not included
Female57.0%
Male43.0%
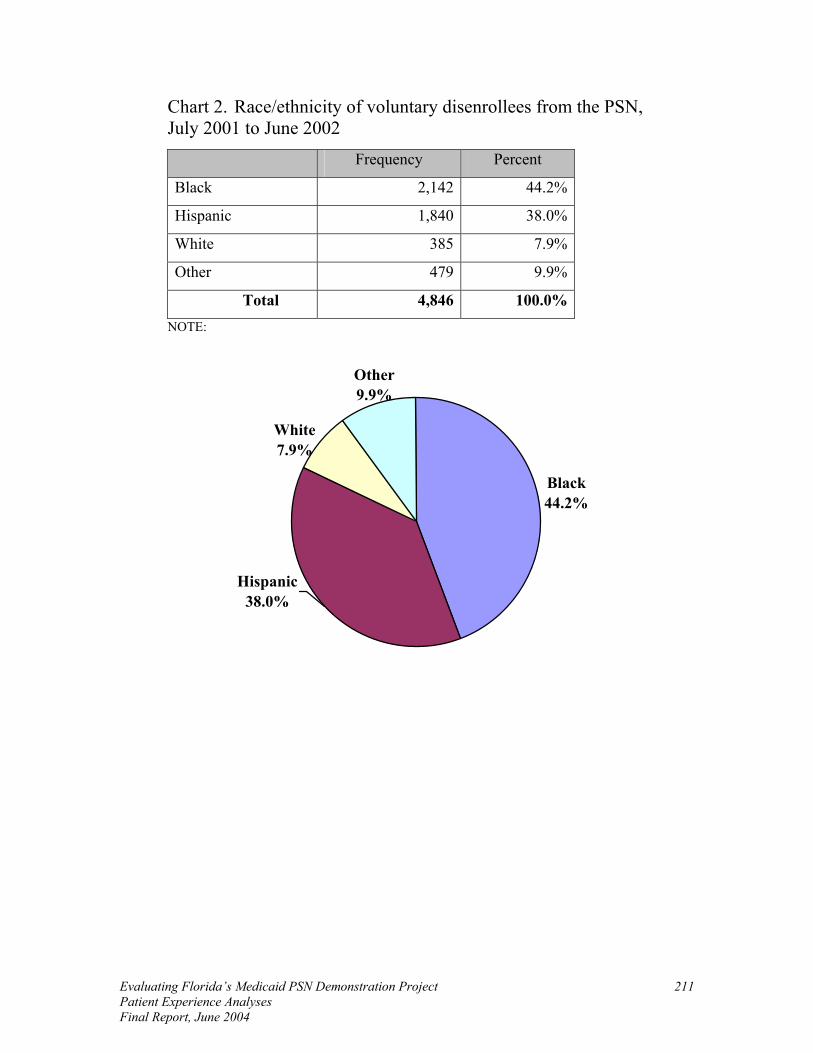
Evaluating Florida’s Medicaid PSN Demonstration Project Patient Experience Analyses Final Report, June 2004
211
Chart 2. Race/ethnicity of voluntary disenrollees from the PSN, July 2001 to June 2002
Frequency Percent
Black 2,142 44.2%
Hispanic 1,840 38.0%
White 385 7.9%
Other 479 9.9%
Total 4,846 100.0% NOTE:
Black44.2%
Other9.9%
White7.9%
Hispanic38.0%
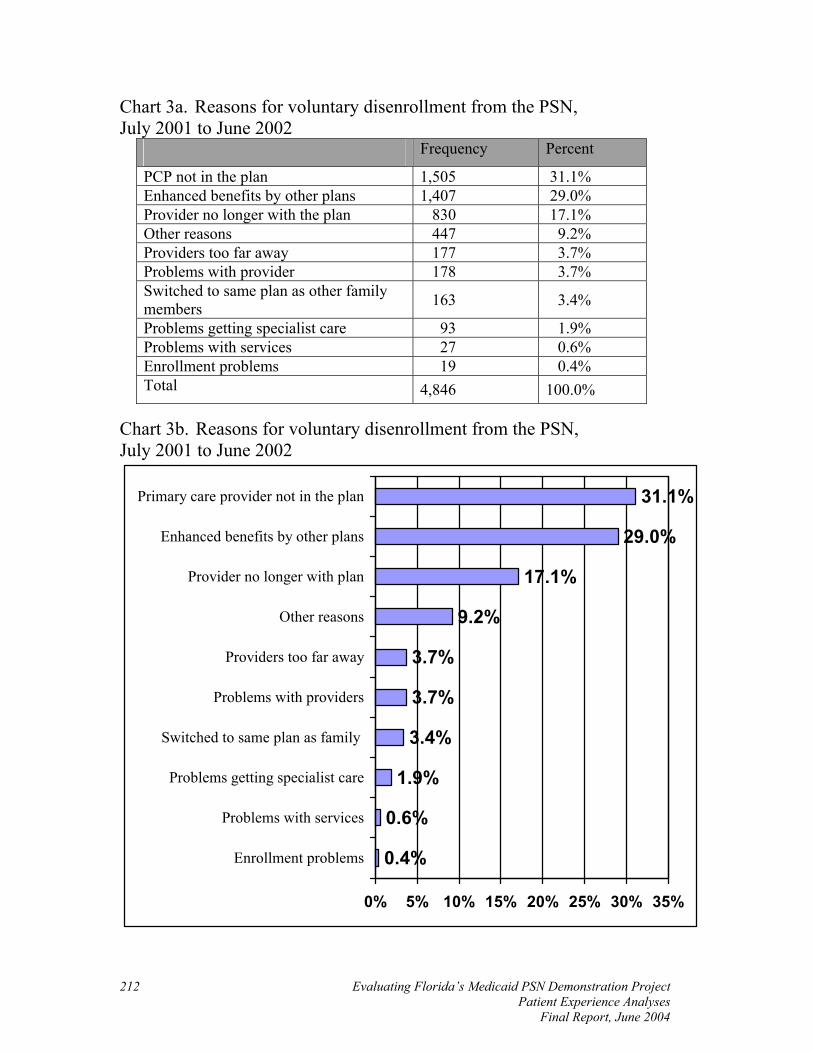
Evaluating Florida’s Medicaid PSN Demonstration Project Patient Experience Analyses
Final Report, June 2004
212
Chart 3a. Reasons for voluntary disenrollment from the PSN, July 2001 to June 2002
Frequency Percent
PCP not in the plan 1,505 31.1% Enhanced benefits by other plans 1,407 29.0% Provider no longer with the plan 830 17.1% Other reasons 447 9.2% Providers too far away 177 3.7% Problems with provider 178 3.7% Switched to same plan as other family members 163 3.4%
Problems getting specialist care 93 1.9% Problems with services 27 0.6% Enrollment problems 19 0.4% Total 4,846 100.0%
Chart 3b. Reasons for voluntary disenrollment from the PSN, July 2001 to June 2002
0.4%
0.6%
1.9%
3.4%
3.7%
3.7%
9.2%
17.1%
29.0%
31.1%
0% 5% 10% 15% 20% 25% 30% 35%
Enrollment problems
Problems with services
Problems getting specialist care
Switched to same plan as family
Problems with providers
Providers too far away
Other reasons
Provider no longer with plan
Enhanced benefits by other plans
Primary care provider not in the plan

Evaluating Florida’s Medicaid PSN Demonstration Project Patient Experience Analyses Final Report, June 2004
213
Chart 4. Reasons for Disenrollment by Race, July 2001 to June 2002
Reason White Black Hispanic Other TOTAL Primary care provider not in the Plan
131 34.0%
493 23.0%
698 37.9%
183 38.1%
1505 31.1%
Enhanced benefits 85 22.1%
861 40.2%
356 19.3%
105 21.9%
1407 29.0%
Provider no longer in Plan 85 22.1%
283 13.2%
403 21.9%
59 12.3%
830 17.1%
Other reasons 40 10.4%
225 10.5%
130 7.1%
52 10.9%
447 9.2%
Providers too far away 11 2.9%
56 2.6%
87 4.7%
23 4.8%
177 3.7%
Problems with Provider 9 2.3%
82 3.8%
65 3.5%
22 4.6%
178 3.7%
Switched to same Plan as other family members
6 1.6%
97 4.5%
60 3.3%
0 0.0%
163 3.4%
Problems getting specialist care
13 3.4%
29 1.4%
24 1.3%
27 5.6%
93 1.9%
Problems with services 4 1.0%
8 0.4%
11 0.6%
4 0.8%
27 0.6%
Enrollment Problems 1 0.3%
8 0.4%
6 0.3%
4 0.8%
19 0.4%
TOTAL 385100%
2142100%
1840100%
479100.0%
4846 100%
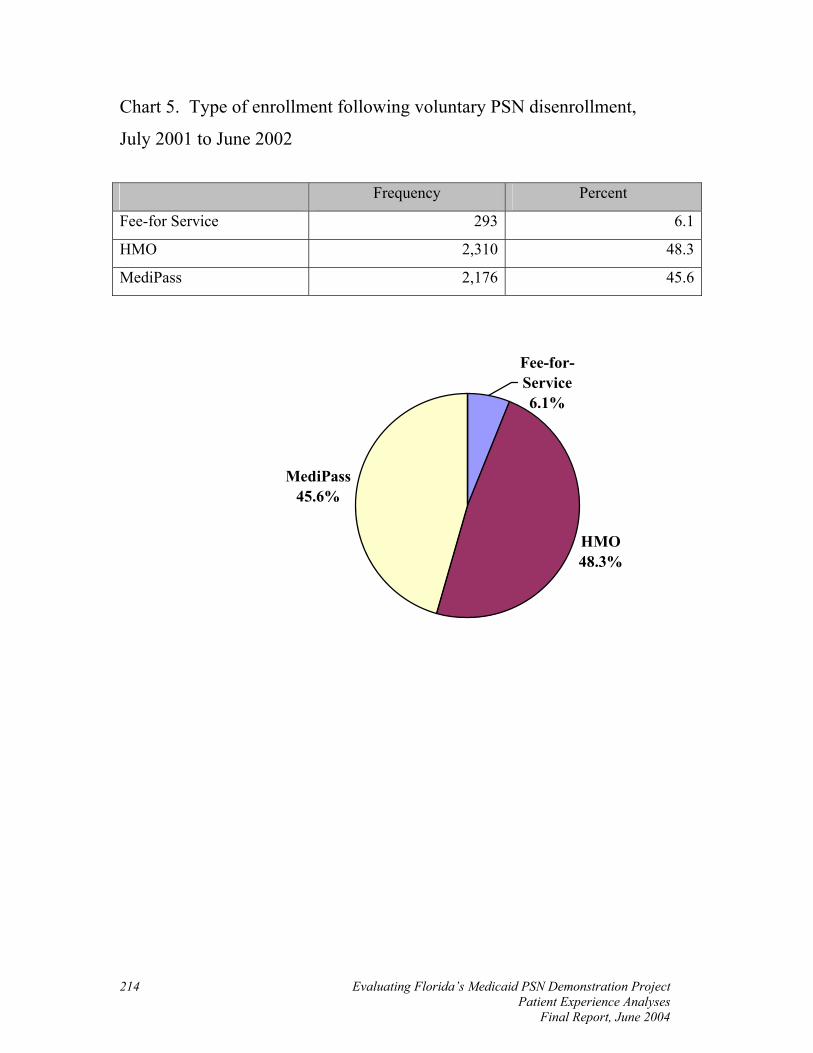
Evaluating Florida’s Medicaid PSN Demonstration Project Patient Experience Analyses
Final Report, June 2004
214
Chart 5. Type of enrollment following voluntary PSN disenrollment,
July 2001 to June 2002
Frequency Percent
Fee-for Service 293 6.1
HMO 2,310 48.3
MediPass 2,176 45.6
HMO48.3%
MediPass45.6%
Fee-for-Service6.1%

Evaluating Florida’s Medicaid PSN Demonstration Project Patient Experience Analyses Final Report, June 2004
215
Chart 6. Type of enrollment following voluntary disenrollment by race,
July 2001 to June 2002
Race Fee-for-Service HMO MediPass
Number Percent Number Percent Number Percent
Black 126 43.0 1,385 60.0 578 26.6
Hispanic 130 44.4 626 27.1 1,065 48.9
White 28 9.6 132 5.7 222 10.2
Other 9 3.1 167 7.2 311 14.3
TOTAL 293 100.0 2,310 100 2,176 100.0
0
10
20
30
40
50
60
70
Fee-for-Service HMO MediPassPlan after PSN disenrollment
Enr
olle
es (%
) BlackHispanicWhiteOther

Evaluating Florida’s Medicaid PSN Demonstration Project Patient Experience Analyses
Final Report, June 2004
216
Chart 7. Type of enrollment following voluntary disenrollment by gender,
July 2001 to June 2002
Gender Fee-for-Service HMO MediPass
Number Percent Number Percent Number Percent
Male 119 40.6 964 41.7 951 43.7
Female 174 59.4 1,346 58.3 1,225 56.3
TOTAL 293 100.0 2,310 100.0 2,176 100.0
0
10
20
30
40
50
60
Fee-for-Service HMO MediPass
Plan after PSN disenrollment
Enr
olle
es (%
)
MaleFemale
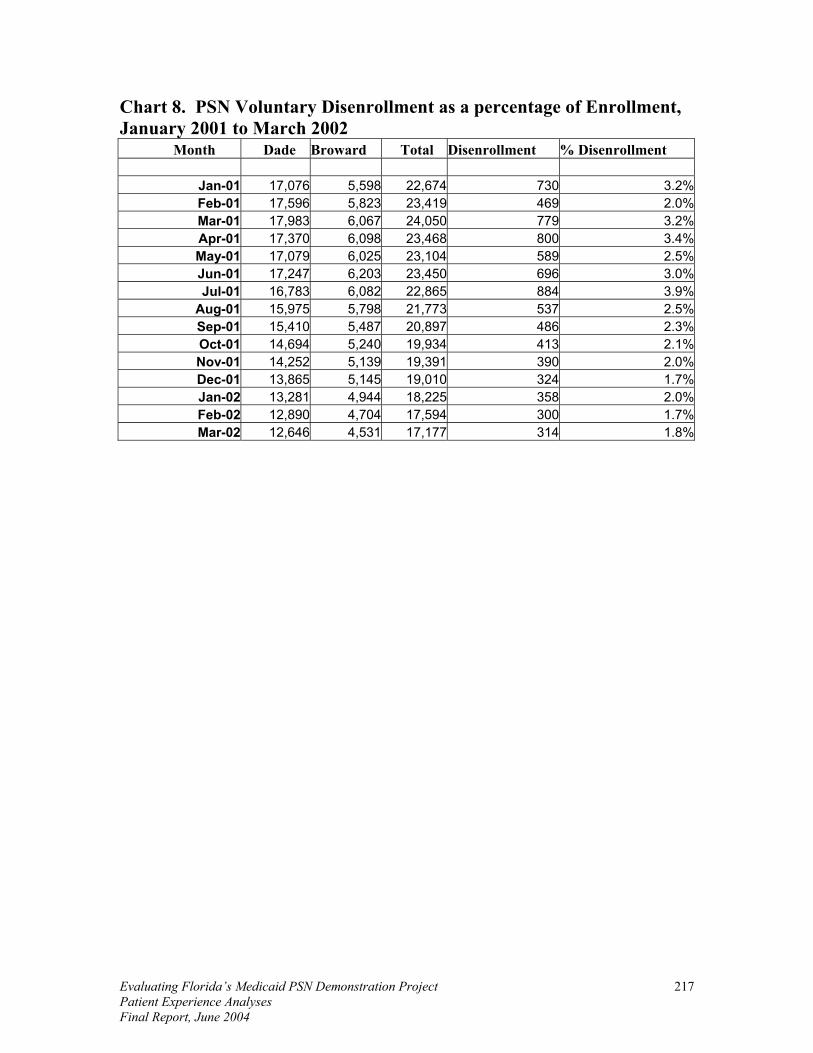
Evaluating Florida’s Medicaid PSN Demonstration Project Patient Experience Analyses Final Report, June 2004
217
Chart 8. PSN Voluntary Disenrollment as a percentage of Enrollment, January 2001 to March 2002 Month Dade Broward Total Disenrollment % Disenrollment
Jan-01 17,076 5,598 22,674 730 3.2%Feb-01 17,596 5,823 23,419 469 2.0%Mar-01 17,983 6,067 24,050 779 3.2%Apr-01 17,370 6,098 23,468 800 3.4%May-01 17,079 6,025 23,104 589 2.5%Jun-01 17,247 6,203 23,450 696 3.0%Jul-01 16,783 6,082 22,865 884 3.9%Aug-01 15,975 5,798 21,773 537 2.5%Sep-01 15,410 5,487 20,897 486 2.3%Oct-01 14,694 5,240 19,934 413 2.1%Nov-01 14,252 5,139 19,391 390 2.0%Dec-01 13,865 5,145 19,010 324 1.7%Jan-02 13,281 4,944 18,225 358 2.0%Feb-02 12,890 4,704 17,594 300 1.7%Mar-02 12,646 4,531 17,177 314 1.8%

Evaluating Florida’s Medicaid PSN Demonstration Project Patient Experience Analyses
Final Report, June 2004
218
Discussion All in all, the greatest number of voluntary disenrollments involved the primary care provider. Disenrollees indicated that they left the PSN because their PCP is not in the plan (1,505 disenrollments during the target year) or because their provider is no longer with the plan (830). Together, these reasons accounted for nearly half (48.2%) of voluntary disenrollments. In a program where providers brought their panels along to the new plan, how could this be? First, some of these were newly eligible Medicaid patients, who may have had an existing relationship with a physician and wanted to be able to continue seeing the same doctor even after Medicaid was paying the bills. This doctor may have only accepted fee-for-service Medicaid, for example, or been part of an HMO. Second, some MediPass patients were actually seeing a different doctor than their provider of record. So from their point of view, the provider of record may have changed to the PSN, but "their" doctor stayed with MediPass, and they were genuinely surprised to get the welcome letter from the PSN. In addition, there may be confusion over which doctor is “theirs,” when providers have similar last names. The results of this study clearly show that most disenrollments are not an expression of dissatisfaction with the level of care provided by the PSN. The seven stated reasons related to “problems with providers” (long waits, rude treatment, dissatisfaction with provider, etc.) combined made up only a small fraction (3.7%) of disenrollments. Of course, it is important to keep in mind that some who called with such complaints may have been ineligible to disenroll from the PSN at the time of their call, or they may have opted to first try another PSN provider. About 177 disenrollees reported that the provider's office was too far away. While this was only a small percentage of total disenrollment (3.7%), it represents a significant minority, and gives a glimpse into the life of those on Medicaid. Was it really the total distance in miles that was intimidating, or the two bus transfers that would be required in order to reach the office? Was the patient aware of free public transportation available to Medicaid recipients? For 93 disenrollees, the reason given involved access to specialist care. There was no follow-up to see whether their new plan allowed the specialist care that they felt was needed. This is an important caveat and consideration, because in South Florida there are widespread shortages of specialists that even affects people with private insurance coverage. Blacks had the highest rate of leaving the PSN for enhanced benefits in another plan; about 40.2% of Blacks gave that reason, compared to 19.3% for Hispanics, 22.1% for Non-Hispanic Whites, 21.9% for Other. About 698 Hispanics gave the disenrollment reason that their primary care provider is not in the plan, compared to 131 Non-Hispanic Whites, 493 Blacks, and 183 Other. It is
Evaluating Florida’s Medicaid PSN Demonstration Project Patient Experience Analyses Final Report, June 2004
219
unknown from this data whether reliance on their accustomed provider for Spanish language services played a part in their decision, and thus made Hispanics more likely to disenroll for this reason. However, the literature7 and our qualitative interviews with disease management enrollees suggest that Spanish-speaking Hispanics find a health care provider's Spanish-speaking ability to be essential, and even losing a bilingual nurse from the provider's office will likely make a difference in care from the patient's point of view. It is also important to keep in mind that all of these reasons are based on the enrollees’ perceptions, and may or may not have basis in reality. For example, those who thought they might get enhanced benefits might actually be disappointed upon utilizing their new plan; our limited analyses were unable to track such consequences.
7 See for example Garcia J.A., Paterniti D.A., Romano P.S., & Kravitz R.L. (2003) Patient preferences for physician characteristics in university-based primary care clinics. Ethnicity and Disease, 13(2):259-67.
Evaluating Florida’s Medicaid PSN Demonstration Project Patient Experience Analyses
Final Report, June 2004
220
Conclusions Overall, patient experience with the PSN is positive. All three approaches find favorable indicators. The patient satisfaction surveys found high levels of satisfaction with the care received. The disease management programs are providing crucial services to patients with chronic illnesses, improving their quality of life as well as eliminating the need for costly interventions. The disenrollee study shows that only a small fraction (around 2.5%) of PSN enrollees choose to voluntarily disenroll from the program, and only a small minority of those (3.7%) report problems with providers as the reason.


