Evaluating new models of care: Improvement Analytics Unit Martin Caunt, Improvement Analytics Unit Project Director, NHS England Adam Steventon, Director of Data Analytics, The Health Foundation
Transcript
Evaluating new models of care: Improvement Analytics Unit
Martin Caunt, Improvement Analytics Unit Project Director, NHS
England
Adam Steventon, Director of Data Analytics, The Health
Foundation
www.england.nhs.uk
The NHS will take decisive steps to break down
the barriers in how care is provided
England is too diverse for a ‘one size fits all’ care
model to apply everywhere. Different local health
communities will be supported by the NHS’s national
leadership to choose from amongst a small number of
radical new care delivery options
…we will expand NHS operational research, RCT
capability and other methods to promote more
rigorous ways of answering high impact questions in
health services redesign
NHS England’s programmes of work have their roots in the Five
Year Forward View
www.england.nhs.uk
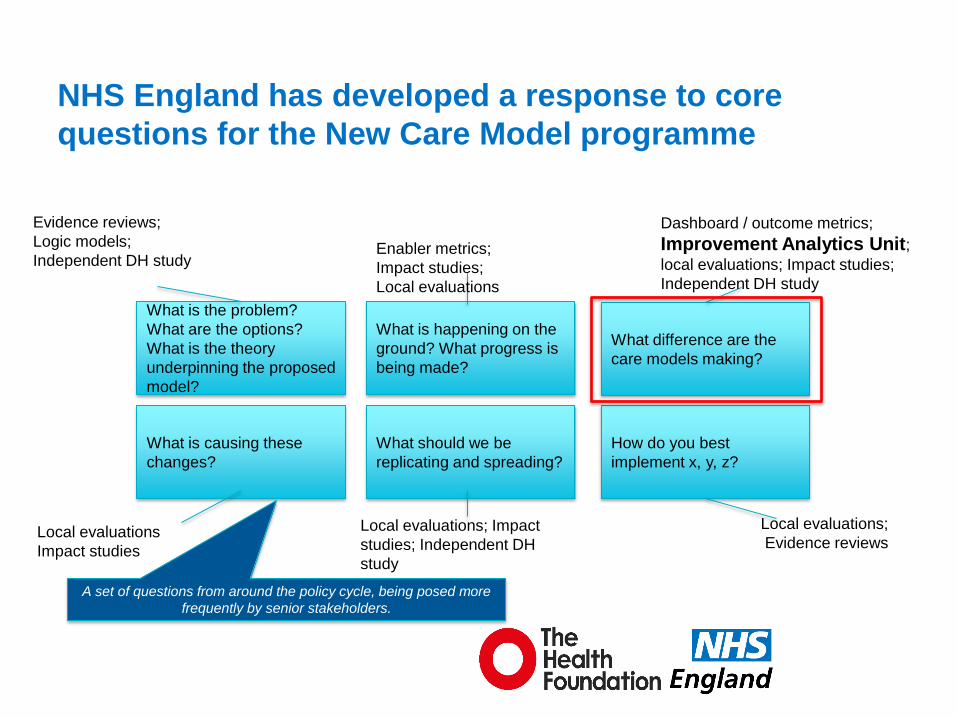
What is the problem?
What are the options?
What is the theory
underpinning the proposed
model?
What is causing these
changes?
What is happening on the
ground? What progress is
being made?
What should we be
replicating and spreading?
What difference are the
care models making?
How do you best
implement x, y, z?
Dashboard / outcome metrics;
Improvement Analytics Unit; local evaluations; Impact studies;
Independent DH study
Evidence reviews;
Logic models;
Independent DH study Enabler metrics;
Impact studies;
Local evaluations
Local evaluations
Impact studies
Local evaluations; Impact
studies; Independent DH
study
Local evaluations;
Evidence reviews
NHS England has developed a response to core
questions for the New Care Model programme
A set of questions from around the policy cycle, being posed more
frequently by senior stakeholders.
www.england.nhs.uk
• Complex interventions, with no implementation blueprint
• Understanding of impact is not sufficient
• Traditional or piloting and trialling approaches to evaluation are
not appropriate
• Data available nationally is limited in its timeliness, quality and
coverage
Significant national challenges to assessing the
impacts of innovations to the delivery of care
www.england.nhs.uk
What not to do?
www.england.nhs.uk
• Data problems
• Getting person-level data on intervention and
comparison groups is hard (but possible)
• Statistical problems
• In the absence of randomisation, the treatment
groups usually differ at baseline, meaning that a
straightforward comparison between their
outcomes is biased
6
Problems with evaluation
www.england.nhs.uk
• Regression adjustment
• Matching methods
• Propensity score matching
• Predictive risk score matching
• Genetic matching
• Doubly robust methods
• Instrumental variables
• Regression discontinuity
7
Statistical methods exist to estimate
treatment effects without randomisation
These make different
assumptions
Pick the one with the
most reasonable set
of assumptions
www.england.nhs.uk
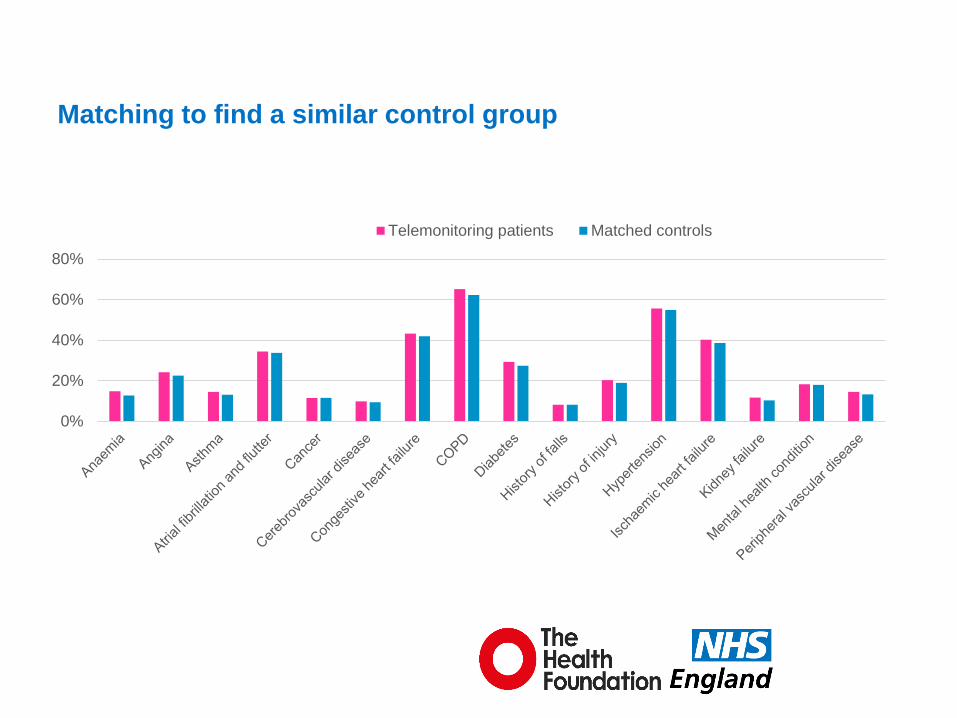
• A telemonitoring service in a large rural county
• Open to people with chronic obstructive pulmonary
disease, congestive heart failure or diabetes, and a
history of associated inpatient admission
• Controls were selected from within the county using
genetic matching, based on predictive risk score,
demographics, diagnosed health conditions and prior
hospital utilisation
• Some checks for unobserved confounding
8
A quick example
Steventon A, Ariti C, Fisher E, Bardsley M. Effect of telehealth on hospital utilisation and mortality in routine
clinical practice: a matched control cohort study in an early adopter site. BMJ Open 2016:e009221.
www.england.nhs.uk
Matching to find a similar control group
0%
20%
40%
60%
80%
Telemonitoring patients Matched controls
www.england.nhs.uk
Telemonitoring was associated with more emergency hospital
admissions than usual care in this particular study
0.0
0.5
1.0
1.5
2.0
2.5
3.0
Emergencyadmission
Admission forambulatory
care sensitivecondition
A&E visit Electiveadmission
Outpatientattendance
Death
Higher utilisation
amongst
telemonitoring
patients than
controls
Lower utilisation
amongst
telemonitoring
patients than
controls Not suggestive of
unobserved
confounding
www.england.nhs.uk
Another check for unobserved confounding
But the observed
confounders are
not nearly as
strongly
associated
To have
obscured a
reduction in
emergency
admissions, an
unobserved
confounder would
need to have
been this strongly
associated with
outcome /
treatment
www.england.nhs.uk
• Data problems
• Can be solved
• Statistical problems
• Can be solved (subject to certain assumptions)
• Can we develop teams in the NHS to apply these
methods on a regular basis to improve care?
12
Problems with evaluation
www.england.nhs.uk
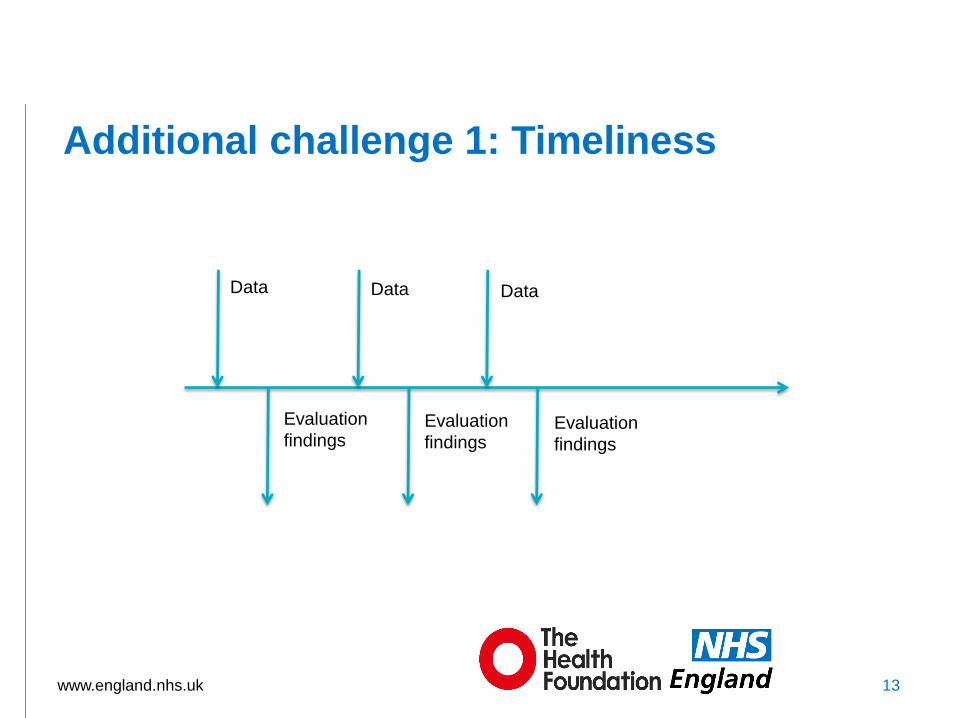
Additional challenge 1: Timeliness
13
Data Data Data
Evaluation
findings Evaluation
findings Evaluation
findings
www.england.nhs.uk 14
Continue?
Stop?
Refine the logic model?
Spread the change more widely?
Data Data Data
Evaluation
findings Evaluation
findings Evaluation
findings
Additional challenge 2: Informed decision making
www.england.nhs.uk
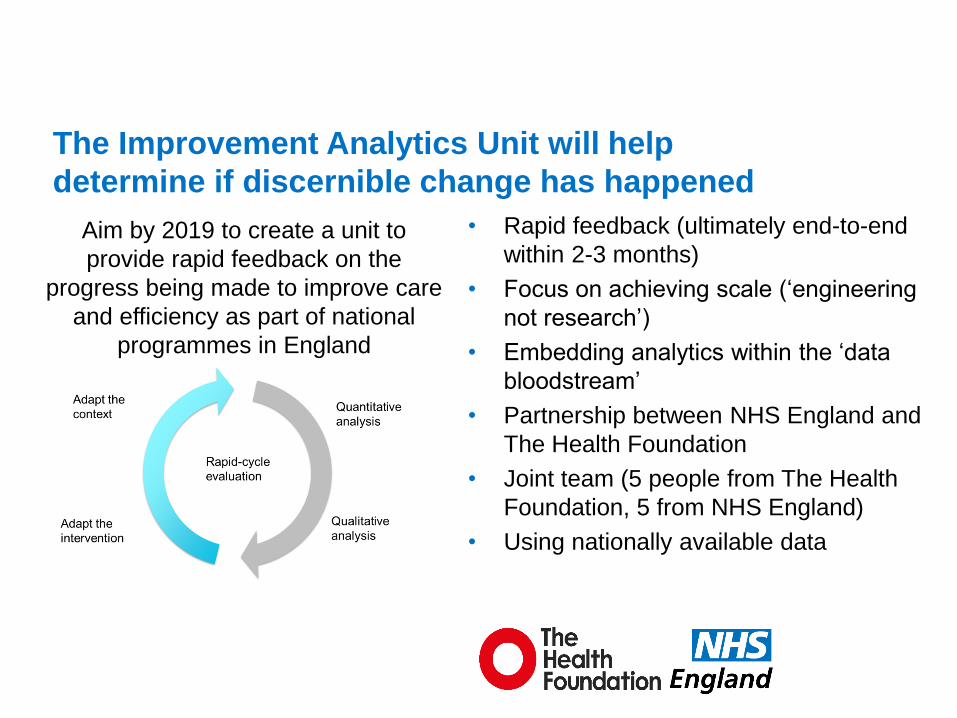
• Rapid feedback (ultimately end-to-end
within 2-3 months)
• Focus on achieving scale (‘engineering
not research’)
• Embedding analytics within the ‘data
bloodstream’
• Partnership between NHS England and
The Health Foundation
• Joint team (5 people from The Health
Foundation, 5 from NHS England)
• Using nationally available data
The Improvement Analytics Unit will help
determine if discernible change has happened
Aim by 2019 to create a unit to
provide rapid feedback on the
progress being made to improve care
and efficiency as part of national
programmes in England
www.england.nhs.uk
We are working with two pilots to inform subsequent roll
out to more local areas and programmes
www.england.nhs.uk
• Each care home having an assigned GP practice
• A named Community Matron / Senior Nurse for each care home
• Dedicated Allied Health Professional support for falls
• Community follow-up 48 hours post hospital admission
• In-reach of specialist community services/professionals including geriatrician, dietetics, heart failure and respiratory
• Regular proactive resident reviews, including medication
• Reviews of new residents within five days and a Comprehensive Geriatric Assessment (CGA) within two weeks
• Standardised long-term conditions planning and increased identification of dementia
• Explicit end of life care discussions with resident, family and carers
• Peer support for care homes staff
• Direct access to district nurse on call at weekends
• Advocacy support to residents and families including ‘worry catcher’
Source: Principia vanguard team
Working with Principia Partners in Health vanguard (MCP) to help
assess its model of enhanced support to Care Homes
www.england.nhs.uk
Working with Northumberland vanguard (PACS) to help assess the impact
of creation of their integrated primary and acute care system