Evaluating Nutrient Offset Market Dynamics in the Jordan and Falls Lake Watersheds Presented to Environmental Review Commission, the Joint Legislative Oversight Committee on Agriculture and Natural and Economic Resources, and the Fiscal Research Division of the North Carolina General Assembly March 13, 2017 1
Transcript
Evaluating Nutrient Offset Market Dynamics in the
Jordan and Falls Lake Watersheds
Presented to Environmental Review Commission, the Joint Legislative Oversight Committee on Agriculture and Natural
and Economic Resources, and the Fiscal Research Division of the North Carolina General Assembly
March 13, 2017
1
Contents Evaluating Nutrient Offset Market Dynamics in the ........................................................................................................... 1 Jordan and Falls Lake Watersheds ...................................................................................................................................... 1
Scope of Report ............................................................................................................................................................................................. 5
Falls Lake Nutrient Management Strategy ........................................................................................................................................ 6
Jordan Lake Nutrient Management Strategy .................................................................................................................................... 6
Part I: Subbasin Nutrient Offset Rate Projections .......................................................................................................... 10
Part II: Nutrient Offset Market Trends .................................................................................................................................................. 12
General Market Trends ........................................................................................................................................................................... 12
Regulatory Influence on Demand for Nutrient Offset Credits ................................................................................................ 12
Methods for Evaluating the Nutrient Offset Markets ................................................................................................................. 13
Offset Trends and Outlook in the Falls Lake Watershed .......................................................................................................... 13
Offset Trends and Outlook in the Jordan Lake Watershed ...................................................................................................... 16
Appendix I: Map of the Jordan Lake Watershed ............................................................................................................ 20
Appendix II: Map of the Falls Lake Watershed ............................................................................................................... 21
2
Executive Summary This report was developed in response to S.L. 2016-94 Section 14.13(g), which sought information about the Jordan Lake and Falls Lake nutrient management strategies. These regulatory strategies are designed to restore both lakes from their chlorophyll a impairments, an indicator of excess algae caused by nutrients (nitrogen and phosphorus). Excess algae can lead to a host of problems in lakes including fish kills, potentially toxic algae blooms, skin irritation for
swimmers, and taste and odor issues in drinking water.
For both nutrient strategies, developers are required to reduce nutrient loading caused by runoff from their development projects. After meeting applicable on-site requirements, developers often choose to meet their obligations by purchasing nutrient offset credits from a third-party provider. The nutrient offset markets created by these transactions are the primary subject of this report.
Part I evaluates the impacts, costs and benefits of setting nutrient offset rates on a subbasin-specific basis for the N.C. Division of Mitigation Services (DMS) within the Jordan and Falls Lake watersheds. To establish subbasin-specific rates for DMS nutrient offset credits a number of factors were considered, including regulations that require DMS rates to be based on the actual costs of nutrient offset projects in each rate area. For this study, DMS used a combination of project cost data, watershed conditions and other available information to provide estimated subbasin-specific rates. However, this study concludes there is no benefit to altering the current rate structure and that doing so is likely to result in some developers paying higher fees.
Part II evaluates the nutrient offset markets in the Jordan and Falls Lake watershed as a precursor to a recommendation regarding whether DMS should continue to provide nutrient offset services in these areas. Market trends in the Falls Lake watershed generally show an adequate supply of nitrogen credits available for sale from banks, but the supply of phosphorus credits from banks is limited. No regulatory changes are anticipated for the Falls Lake watershed during the next five years. DMS is presently meeting the development community’s demand for phosphorus credits, which has recently remained unmet by private banks.
The Jordan Lake watershed has three subbasins. The Upper New Hope subbasin is the primary source of nutrient offset activity in the Jordan Lake watershed, and DMS continues to routinely supply nitrogen offset credits to developers as bank supplies there are frequently exhausted. Demand for nutrient offset credits has been light in the Haw and Lower New Hope subbasins. Demand is declining throughout the watershed and is expected to be suspended entirely due to a legislative mandate to delay implementation of the Jordan Lake strategy. The status of nutrient offset requirements beyond 2019 are unclear in the Jordan Lake watershed and will be subject to reevaluation during the rules readoption process.
In addition to market dynamics, other factors should be considered when evaluating any amendment of DMS’s authority to operate a nutrient offset program in the Jordan Lake and Falls Lake watersheds. First, buffer mitigation requirements remain intact and DMS continues to meet buffer mitigation needs by installing the same type of projects that provide nutrient credits. Also, DMS generates both nitrogen and phosphorus credits simultaneously to help satisfy unmet demand when the private supply of either nutrient is at risk of exhaustion. Third, North Carolina’s bank preference regulations ensure that DMS project development and pricing do not unduly interfere with the private bank credit market. Finally, because DMS project fees are based on an actual cost method, revocation of their authority to operate in the Jordan or Falls Lake watershed is not projected to save money for the state.
Therefore, despite declining demand projections for the Jordan Lake watershed and an abundance of bank nitrogen supply in the Falls Lake watershed, the Department recommends that DMS continue to provide its services in all areas of the Jordan and Falls Lake watersheds in accordance with its credit demand projections. DMS presently has the tools to react to private market trends while providing a service that meets dual policy goals of pollution mitigation and economic development. Furthermore, DMS is capable of and has incentive to gradually satisfy its nutrient credit obligations in the Jordan Lake watershed while serving the occasional need for credits from the development community.
In light of these findings, no statutory authority regarding DMS’s provision of services is identified for repeal or amendment.
3
Introduction
Scope of Report This report was produced in response the legislative inquiries posed in S.L. 2016-94 Section 14.13(g). Generally, the nutrient offset markets described herein are governed by water quality regulations implemented by the N.C. Division of Water Resources (DWR). The N.C. Division of Mitigation Services (DMS) is a provider of nutrient offset credits in these markets. Both divisions are located within the N.C. Department of Environmental Quality (DEQ), and staff from both divisions contributed to authorship of this report.
The full text of Section 14.13(g) is as follows:
SECTION 14.13.(g) The Department of Environmental Quality shall study the following issues related to
nutrient impact fees and other water quality impact mitigation programs in Jordan Lake and Falls Lake:
(1) The impact, costs, and benefits of setting nutrient offset fees on a subbasin- or area-specific basis,
together with an estimate of the subbasin-specific nutrient offset fees for each subbasin in the Jordan Lake
and Falls Lake watersheds or area draining to a particular arm of Jordan Lake or Falls Lake.
(2) Watersheds and river basins or subbasins where private providers of mitigation services are
adequately serving existing and projected demand over the next five years, and whether (i) the continuing
provision of mitigation services by the State in those areas is necessary and (ii) statutory authority to provide
mitigation services in those areas should be totally or partially repealed.
The Department shall report no later than December 1, 2016, to the Environmental Review Commission,
the Joint Legislative Oversight Committee on Agriculture and Natural and Economic Resources, and the
Fiscal Research Division regarding the results and recommendations from its study and any suggested
legislation necessary to implement the recommendations.
Part I of this report evaluates alternative pricing structures for nutrient offset credits offered by DMS. Part II assesses trends in nutrient credit markets for the Falls and Jordan Lake watershed before evaluating whether statutory adjustments are recommended by the Department.
Background Jordan Lake and Falls Lake are located in central North Carolina and are important drinking water sources for the rapidly developing Triangle region. At this time, neither lake is meeting water quality standards for chlorophyll a. Chlorophyll a is a pigment found in algae, and excess algae can be attributed to excessive runoff of nutrients that fuel algae growth. For the purposes of this report, “nutrients” refers to nitrogen (N) and phosphorus (P) compounds critical to sustain plant life, including algae. Excess algae can lead to a host of problems in lakes, including reductions in dissolved oxygen, fish kills, potentially toxic algae blooms, skin irritation for swimmers, or taste and odor issues in drinking water.
To restore the lakes, North Carolina has implemented rules limiting the load of nutrients flowing into them. Real estate
development is among the sectors regulated because erosion and runoff from development activities, new structures and
impervious surfaces will increase nutrient loading if left unchecked. Under the Jordan Lake and Falls Lake new development
rules, developers must ensure that their site meets specific loading targets for nitrogen and phosphorus. To help meet these
targets, they can choose to purchase nutrient offset credits if it is advantageous for them to do so.
Developers can purchase nutrient offset credits from DWR-approved privately-operated mitigation banks (hereafter simply referred to as “banks”) and under certain circumstances from DMS. These third-party mitigation providers generate nutrient credits by restoring natural areas in nearby locations or implementing stormwater BMP projects, balancing out higher pollution loads being created elsewhere within the same watershed.
5
Falls Lake Nutrient Management Strategy The Falls Lake nutrient management strategy is a comprehensive set of rules designed to address excess nutrient inputs to Falls Lake that lead to algae blooms and other water quality problems. The rules require all major sources of nutrients to reduce their nitrogen and phosphorus loads to Falls Lake by 40 and 77 percent, respectively, from a 2006 baseline condition. Modeling has projected that these nutrient reductions will achieve water quality standards and restore all uses of the lake.
Nutrient sources addressed by the rules include agriculture, fertilizer application, wastewater discharges, and stormwater runoff from both new development and existing developed lands. A trading rule was also enacted, promoting the use of cost-effective management options to meet nutrient strategy goals.
In light of its substantial nutrient reduction goals, the Falls Lake strategy was designed as a phased, adaptive approach. With the exception of existing development, which is required to offset nutrient loads back to baseline levels, Stage I requires regulated sources to meet half of their nutrient reduction targets by 2021 (20 and 40 percent nitrogen and phosphorus, respectively). This interim goal seeks to restore the lower part of Falls Lake. Stage II calls for additional reductions of 40 percent N and 77 percent P from the upper watershed by 2041, with the final goal of meeting the chlorophyll a standard throughout Falls Lake.
The Falls new development rule (15A NCAC 02B .0277) requires all local governments in the Falls Lake watershed to develop and implement stormwater programs for new development activities. Under these programs, development projects must meet loading rate targets of 2.2 lbs./acre/year TN (total nitrogen) and 0.33 lbs./acre/year TP (total phosphorus). A development’s nutrient load is calculated using the development plan and the Jordan/Falls Stormwater Nutrient Load Accounting Tool. Most developments exceed the nutrient rate targets absent any stormwater treatment practices.
Developers are required to achieve a minimum of 30% or 50% of the needed nutrient reductions onsite, depending on how much acreage they disturb and the type of land use. They have the option to meet the remaining reduction needs by purchasing offsite “nutrient offsets” from banks or the N.C. Division of Mitigation Services (“DMS”). All local governments in the Falls Lake watershed adopted and began implementing local stormwater programs in July 2012. Reports documenting their development activity and nutrient load reductions are submitted to DWR annually.
Nutrient offsets in the Falls Lake watershed are also governed by 15A NCAC 02B .0282 and 15A NCAC 02B .0240. The first
rule provides Falls Lake-specific options and prerequisites for nutrient offsets, with the latter indicating statewide
geographic restrictions on trading, standards for nutrient offset project approval, and protocols for nutrient offset
transactions. Also, state and federal entities can purchase nutrient offsets when necessary pursuant to 15A NCAC 02B .0281.
Importantly, nutrient offsets generated in the Upper Falls Lake watershed can offset development anywhere within the Falls Lake watershed, including the Lower Falls Lake watershed. However, nutrient offsets generated in the lower watershed can only offset loading within that smaller area. Furthermore, real estate values are generally higher in the lower watershed, which coincides with Raleigh’s suburban outgrowth. These two factors reduce the desirability of establishing nutrient offset credits (whether from banks, DMS, or developers) in the Lower Falls Lake watershed.
Jordan Lake Nutrient Management Strategy Analogous in many ways to the Falls Lake strategy, the Jordan Lake nutrient management strategy is a comprehensive approach to restoring Jordan Lake from its present chlorophyll a impairments. Again, the nutrient sources regulated include agriculture, fertilizer application, wastewater discharges, and stormwater runoff from both new development and existing developed lands.
While the regulations described here for Jordan Lake have been in place since 2009, a series of superseding rule implementation delays instituted by the N.C. General Assembly have taken effect since that time. A more detailed description of those delays and their implications for nutrient offset demand is provided in part II of this report.
6
The Jordan Lake strategy divides the watershed into three subwatersheds for management purposes: Haw River, Upper New Hope, and Lower New Hope. Customized nitrogen and phosphorus reduction requirements are set for each subwatershed. The Lower New Hope subwatershed requires no increase in N or P loading from the 2001 baseline, the Upper New Hope subwatershed requires a 35% reduction in N and 5% reduction in P from the baseline, and the Haw subwatershed requires an 8% reduction in N and a 5% reduction in P from the baseline.
New development in the Jordan Lake watershed is subject to 15A NCAC 02B .0265. According to this rule, developers must install stormwater control measures and reduce onsite nutrient loading below 6 lbs. TN/ac/yr for most single family development and 10 lbs. TN/ac/yr for other types of development. Beyond that, developers may purchase nutrient offsets to meet the remaining loading rate requirement for their drainage basin.
TABLE 1. NEW DEVELOPMENT LOADING RATE REQUIREMENTS
Similar to Falls Lake, nutrient offsets are also governed by a Jordan Lake-specific rule (15A NCAC 02B.0273), the general trading rule (15A NCAC 02B .0240), and a rule for state and federal entities (15A NCAC 02B .0271). Pursuant to these rules, nutrient reductions must be implemented in the same drainage area as the impact (Haw, Upper New Hope, or Lower New Hope).
Nutrient offset impacts and credits in the Jordan Lake watershed are measured using delivery factor calculations, a key difference from the Falls Lake watershed. Delivery factors reflect the percentage of nutrient inputs that will reach an arm of Jordan Lake from a given location in the watershed, as instream physical and ecological processes will consume a percentage of these nutrients before they reach the lake. Delivery factors generally decrease as one moves further from the lake. This tends to make nutrient offset projects close to Jordan Lake more valuable. Similarly, development projects located close to the lake generally have higher nutrient reduction requirements as less of the nutrient load from the development project can be attenuated before reaching the lake. However, the reverse is also true. All loads and credits reported in this document for Jordan Lake are “delivered," meaning the delivery factor percentage has been applied to nitrogen and phosphorus credit calculations.
Third-party Mitigation Providers A basic understanding of the relationships between third-party providers (banks and DMS) and the development
community is helpful to effectively evaluate the market for nutrient offset credits. On-site and offsite permittee-
provided nutrient offsets are typically an option to offset environmental impacts for most types of development. Therefore, a developer’s decision to purchase credits from banks or DMS is always voluntary. However, developers often elect to use third-party mitigation for a number of reasons including convenience, cost, timing, site constraints and relative inexperience developing nutrient offset projects.
Generally, nutrient offsets can be considered a type of “mitigation,” and third-party mitigation providers supply a consolidated source of mitigation credits for the development community. This model benefits the public by transferring mitigation responsibility to entities equipped to create environmentally effective projects, and it also streamlines regulatory oversight of these projects. Buying credits from third-party providers greatly simplifies and speeds the regulatory process for the development community. Buying credits is a simple purchase transaction and is often preferable to permittee-provided mitigation, which is a 7 to 10-year process. For nutrient offsets, third-party mitigation is provided in one of two ways: buying credits from banks or from DMS (formerly the Ecosystem Enhancement Program).
Banks and DMS typically generate nutrient offset credits by installing riparian buffer restoration projects in areas
where nutrients are regulated. DMS has also installed several stormwater control measures to generate nutrient
7
offset credits. DWR is presently researching these and other nutrient reducing-practices, with their suitability for
offsetting new development to be determined on a practice-by-practice basis.
Most local government entities and all private developers that seek to purchase nutrient offsets from a third party provider in the Falls Lake or Jordan Lake watersheds must first purchase the available credits from banks within the watershed where the development project is located (G.S. §143-214.26). Purchasing nutrient credits from DMS is not a third-party option for developers until banks no longer have available credits. Three local governments, including Raleigh in the Falls Lake watershed, and all state and federal entities are exempt from this law and may seek credits directly from any third-party provider. For developers to whom the bank preference applies, accessing the DMS nutrient offset program requires written confirmation that no bank credits were available for sale in the applicable area. When more than one bank is available, the developer can choose among banks to purchase nutrient offsets. Credit pricing by banks is dictated by market conditions that include the costs to develop the credits, credit availability in the watershed and the pricing of credits by other third-party mitigation providers. DMS uses a rule-defined Actual Cost Methodology to price its credits and publishes its rates quarterly.
DMS operates four distinct in-lieu fee programs providing developers with a mitigation option for streams, wetlands, riparian buffers and nutrient offsets. Though some areas of the state have banks available as a source of third-party mitigation credits, the DMS in-lieu fee programs operate statewide and serve as a reliable source of mitigation credits when bank credits are unavailable.
As described above, DMS uses the fees paid by developers to develop and implement mitigation projects as necessary to
serve credit demand. DMS occasionally purchases mitigation credits, including nutrient offset credits, from banks as they
become available. G.S. §143-214.11(i) establishes credit purchases from existing banks as a preferred procurement strategy
for DMS. As of October 2016, DMS has purchased more than $4.5m of mitigation credits from banks statewide (for all
programs). Banks currently provide between 3-8% of DMS annual mitigation needs in the state.
Though they implement similar types of projects, there are major differences between the banking business model and the operation of DMS’s in-lieu fee program. The private bank model requires sites to meet sequential design, land conservation, installation, and annual monitoring milestones, whereby a portion of their credits are released and become available for purchase on a specific release schedule. Banks can only accept payments from developers if they already have an approved nutrient- load reducing project at least partly established. It typically takes five to seven years for a bank to get 100% of the nutrient offset credits their project would generate. The mitigation site has a service area in which the credits may be sold. Naturally, banks tend to be located where credit demand is high.
The in-lieu fee (ILF) model is very different; the ILF program sells credits to applicants and it must build credit-generating mitigation sites based on where the payments are collected. This often requires the ILF program to build many sites in many different areas even when the overall demand for credits is very low. Payment to the DMS can be collected either following the implementation of a restoration project or in advance of project implementation; no specific timeline is required for a DMS project to be established. Immediately upon installation of the project, 100% of the nutrient offset credits are available for sale to developers.
The private sector may occasionally decline to establish new banks or maintain an adequate credit supply in some service areas. The time lag between initial capital investments and generation of nutrient credits is one potential factor generally influencing the availability of banks. Banks may also determine that the credit demand in low-activity watersheds is insufficient to merit the gamble on profitability. Alternatively, uncertainty regarding nutrient strategy regulations may reduce the attractiveness of new bank investments. As a result, banks may not be established in areas where developers would benefit from an offset option. In those cases, DMS may accept nutrient offset payments, filling a potential service gap for the development community and preventing costly delays to development projects.
Riparian Buffer Regulations Affect Nutrient Offset Credits The most commonly used and cost- effective method for producing nutrient offset credits is riparian buffer restoration on
agricultural land. In areas where both riparian buffer and nutrient offset regulations exist, these projects can generate
either nutrient offset credits or riparian buffer mitigation credits through restoration of adjacent portions of
8
the riparian zone. An acre of restored buffer on agricultural land is estimated to reduce nitrogen loading by 2,273 lbs. and phosphorus loading by 146.4 lbs. over a 30-year period. Similarly, an acre of restored buffer can produce up to 43,560 credits of buffer mitigation. Thus, the supply, demand, immediate availability and cost of nutrient offset credits can be heavily influenced by the market forces affecting riparian buffer mitigation.
9
Part I: Subbasin Nutrient Offset Rate Projections DMS calculates its nutrient offset rates using the Actual Cost Method (ACM) per 15A NCAC 02R .0602 as required by Session Law 2007-438. Rates adjust as program costs change so that the rates reflect contemporary actual costs. Since the rates are posted and adjusted quarterly, the rates are predictable for the development community. Currently, DMS offers both nitrogen and phosphorus credits in all subbasins of the Jordan Lake and the Falls Lake watersheds.
TABLE 2. PRESENT NUTRIENT OFFSET FEES FROM DMS
Watershed Nitrogen rate per pound Phosphorus rate per pound Jordan Lake $125.22 $382.41
Falls Lake $12.21 $167.14
The ACM uses all of the program’s costs (project and administrative costs) to calculate the rates for each area served by the program. As applicable, DMS also purchases nutrient credits from banks and includes these data in the calculations. At present, DMS has five rate areas for nutrient offset:
• Falls Lake • Neuse 03020201 (centered in Wake and Johnston Counties) • Neuse 03020202-03020203-03020204 (all remaining Neuse areas) • Jordan Lake • Tar-Pamlico.
The initial rate for an area (with fewer than two projects) is set to the highest rate in the DMS nutrient program until two projects are available to provide actual cost data for the rate calculation. For example, the current phosphorus rate in the Jordan is set to the highest rate in the program (currently the Tar-Pamlico basin rate) as there are less than two projects in the Jordan due to low demand.
Under NCAC 15A 02R .0602, establishing separate rates for each subbasin does not initially change the rates:
TABLE 3. PROJECTED INITIAL DMS NUTRIENT OFFSET RATES BY SUBBASIN UNDER EXISTING RULES
Subbasin Initial rate per lb. N Initial rate per lb. P Jordan Lake- Haw $125.22 $382.41
Jordan Lake- Upper New Hope $125.22 $382.41
Jordan Lake- Lower New Hope $125.22 $382.41
Upper Falls Lake $12.21 $167.14 Lower Falls Lake $12.21 $167.14
However, over time, these initial rates could be expected to change depending on the regional differences
in supply and demand and the regulations that specify where the nutrient offset project must be located:
• Since impacts in the Lower Falls Lake may be mitigated in either the Lower or Upper Falls watershed, nutrient credits rates would not be expected to change in the Falls Lake subbasins.
• Lower New Hope nutrient rates would be expected to increase as bank credit supply is nonexistent and new projects are difficult and expensive to implement in these areas.
• Also since the Lower New Hope credit demand is very low, the region would likely have the highest rate in the program for a long time since there is not enough demand to drive development of two projects with nitrogen and phosphorus credits in the near term.
• Upper New Hope nitrogen nutrient rates would be expected to remain near present levels as the current rates are based on actual projects located in this subbasin. The phosphorus rates are currently based on the highest cost in the program but as demand is very low, these high rates appear to be near the expected actual cost of providing phosphorus in this region.
10
• Jordan Lake Haw region nutrient rates could become less expensive than current rates if demand were to increase. Currently bank credits are typically available and the supply of potential projects appears good. However, the current Haw region credit demand is very low. Since a project requires many developer payments to break even, low demand can result in higher rates when the collections are insufficient to fund the cost of a single project.
The rates listed below are strictly estimates generated using best available project cost data and estimated
administrative costs. Definitive rates are not available given the current level of project cost information in
these areas. Furthermore, the actual rates charged in the Jordan Lake watershed can vary significantly based on
the delivery factors applied at the nutrient offset project sites. TABLE 4. ESTIMATED SUBBASIN-BASED NUTRIENT RATES
Watershed Estimated rate per lb. N Estimated rate per lb. P Jordan Lake- Haw $18.34 $323.79
Jordan Lake- Upper New Hope $125.22 $385.00
Jordan Lake- Lower New Hope $150.00 $462.00
Upper Falls Lake $12.21 $167.14
Lower Falls Lake $12.21 $167.14
A serious negative impact of this regional rate structure is the disincentive for project investment and the potential “stranding” of unsold credits in the Jordan subbasins. If DMS implemented new projects where there is very low demand and potentially no future demand for nutrient credit, the economic consequences of this approach could be extremely high price points and potentially unsold credits.
Implications of an alternative subbasin rate structure are varied and have no foreseen benefits. Setting rates on a subbasin basis, that is, three rate areas for Jordan and two for Falls Lake, would likely eventually result in higher fees in all of the subbasins with the exception of the Haw. In addition, unnecessary production of credits in areas where demand is projected to be low is incongruent with the DMS’s mission to provide cost-effective mitigation alternatives to its customers.
11
Part II: Nutrient Offset Market Trends
General Market Trends Three primary factors may affect demand for nutrient offset credits in the Jordan and Falls Lake watersheds: real estate development trends, the emergence of cost-effective alternatives to nutrient offsets, and the regulatory environment governing nutrient offsets.
Comprehensive real estate market evaluations and projections are beyond the scope of this report. However, for planning purposes we expect robust commercial and residential land development activities to continue throughout the Jordan and Falls Lake watersheds, particularly in urban areas including Durham, western Wake County, Chatham County and portions of the Triad.
Second, developers are soon likely to have expanded options to reduce nutrient runoff at the development site. These expanded options may make onsite nutrient reduction more financially or practically desirable than purchasing nutrient offset credits. Specifically, practices under development include variants to conventional stormwater BMPs that will better accommodate site constraints by allowing variations in practice design specifications. For example, a stormwater practice may be oversized on a new development site, offering extra nutrient reductions on site and reducing demand for offsets from banks or DMS. Draft guidelines for the expanded stormwater BMP toolbox have been released and are expected to be approved for new development purposes in 2017.
Finally, the regulatory environment governing nutrient offset requirements has an important impact on the supply and demand for nutrient credits. A description of these regulatory influences and history of implementation are provided in more detail below.
Regulatory Influence on Demand for Nutrient Offset Credits In the Falls Lake watershed, the new development rule has been in place since 2010 with no legislative or regulatory adjustments. An external evaluation of the efficacy of the Falls Lake rules is underway by the N.C. Policy Collaboratory and is not scheduled for conclusion until Dec. 31, 2020. Further, S.L. 2016-94 bars the promulgation of amended rules in the Falls Lake watershed until Oct. 15, 2022. Therefore, no legislative or regulatory changes are projected for the Falls Lake watershed and demand for nutrient offset credits is expected to continue.
Implementation of the new development rule in the Jordan Lake watershed has a more complex history. The Jordan Lake new development rule was approved in 2009. In 2012, S.L. 2012-201 granted approximately two additional years (through August 2014) for local governments to implement or revise their local stormwater program, including the passage of related ordinances. That same year, several local governments in the Upper New Hope watershed commenced early and voluntary implementation of the new development rules through their ordinances.
In 2013 a three-year implementation delay for the Jordan Lake rules was put into effect (S.L. 2013-395) and in 2015 a second three-year delay was instituted (S.L. 2015-241). In 2016, a bar on further state- level development rule implementation was instituted pursuant to S.L. 2016-94 until the Jordan Lake nutrient strategy rules are readopted. Despite these state-level implementation delays, some local governments have continued to implement nutrient offset requirements pursuant to their local ordinances and other state and federal authorities, including federal NPDES stormwater permits and state watershed water supply rules.
S.L. 2016-94 §14.13(f) specifically directed that, in the Jordan Lake watershed, “cities and counties shall not enforce
Development Stormwater rules1 through any ordinance, code, standard, committed element, condition, or contractual
obligation imposed by, agreed upon, or accepted by a county or city.” This provision invokes a complicated suite of legal considerations for some local governments as they seek to remain in compliance with all applicable local, state, and federal environmental authorities. Barring additional regulatory changes, the Department expects future demand
1 “For the purposes of this subdivision, “Development Stormwater Rule” shall mean 15A NCAC 2B .0265 (Stormwater Management for New Development) and 15A NCAC 2B .0266 (Stormwater Management for Existing Development), or equivalent or more stringent ordinance, code, standard, or committed element related to nutrient-loading targets in the Jordan Lake watershed.” S.L. 2016-94 §14.13(f).
12
for nutrient offsets to diminish and eventually cease in the Jordan Lake watershed until the Jordan Lake strategy is readopted. However, the timing of this projected trend remains uncertain and may depend in part on procedures governing ordinance amendments and federal stormwater permit renewals.
As the demand for nutrient credits winds down, DMS’s ability to take payments provides an important backstop for developers seeking credits during this transitional period, particularly if private investment in banks ceases. Importantly, however, the Jordan riparian buffer protection rules remain in place, and some demand for buffer mitigation projects will continue to exist.
Methods for Evaluating the Nutrient Offset Markets A combination of methods was used to evaluate nutrient offset market trends. It is necessary to evaluate nutrient offset transactions for both banks and for DMS to get an accurate picture of credit supply and demand in the Jordan and Fall Lake watersheds.
Banks record nutrient offset transactions on a ledger and submit them to DWR, which routinely audits them to ensure accuracy, compliance and accountability. For this report, bank ledgers from 2010 to present were evaluated to take annual snapshots of credit availability, credits sold, and number of transactions. As necessary, multiple banks were aggregated together to provide basin-specific insights. The outstanding supply (in months) of nutrient credits from banks was also estimated by dividing the number of credits remaining at the end of a given year by the number of
credits sold during that year.2 This calculation is analogous to those commonly seen in real estate, where the supply of
homes for sale in an area is also described in temporal terms. While this approach provides insights sufficient to address the questions posed for this report, it does not directly relate the considerable intra-annual variability in credit supply and demand.
DMS maintains a consolidated database of transactions in addition to ledgers, which facilitates finer scale and up-to-date evaluations of the metrics described above. A key enhancement is the availability of financial records associated with each transaction, providing insights regarding the value of the market. Also, because DMS can accept payment before installing nutrient offset projects, credit supply constraints are eliminated so long as DMS is willing to accept payments and is able to implement suitable mitigation projects within the applicable area.
This report provides data on both supply and demand with respect to bank credits and DMS. By statutory design, when DMS is accessed by private developers, it indicates that there are no remaining bank credits serving the area. Therefore, when a transaction like this occurs, it provides conclusive evidence that private banks are not adequately serving existing demand at that time.
Offset Trends and Outlook in the Falls Lake Watershed Upper Falls Developers in the Upper Falls watershed may only purchase credits generated in the Upper Falls watershed. Since 2012, developer demand from the upper watershed has generally been increasing. The banks’ supply of phosphorus has generally been declining, while the banks’ supply of nitrogen credits has been increasing. Presently, four banks are active in the upper watershed.
2 This estimate is limited in several ways, as it does not account for projected new private sector credits generated nor for changes in market dynamics. Further, if calculated in real time (versus an annual snapshot), this ratio would fluctuate significantly throughout the year and fall to zero routinely in some markets. January-June sales are doubled for a 2016 estimate.
13
FIGURE 1. NUTRIENT CREDIT TRANSACTION VOLUME IN THE UPPER FALLS LAKE WATERSHED (AVAILABLE TO SERVE UPPER FALLS DEVELOPMENT DEMAND)
Tran
sact
ion
s
25
20
15
10
5
0
2010
2011
2012
2013
2014
2015
2016*
Banks- N 0
0
6
19
21
20
13
DMS- N 8
12
17
0
0
0
0
Banks- P 0
0
6
15
15
21
14
DMS- P 0
7
8
0
0
0
5
FIGURE 2. UPPER FALLS NUTRIENT CREDIT SALES BY YEAR
14,000 1,200
12,000 1,000
(lb
s.) 10,000
800
(lb
s.)
8,000
cred
it
600
cred
it
6,000
400 N
4,000 P
2,000 200
0 2010 2011 2012 2013 2014 2015 2016*
0
Banks- N 0 0 3,501 4,569 8,620 12,036 5,071
DMS- N 4,214 4,818 4,120 0 0 0 0
Banks- P 0 0 198 563 608 1,134 1,024
DMS- P 0 178 168 0 0 0 233
FIGURE 3. OUTSTANDING SUPPLY OF BANK NUTRIENT CREDITS IN THE UPPER FALLS WATERSHED
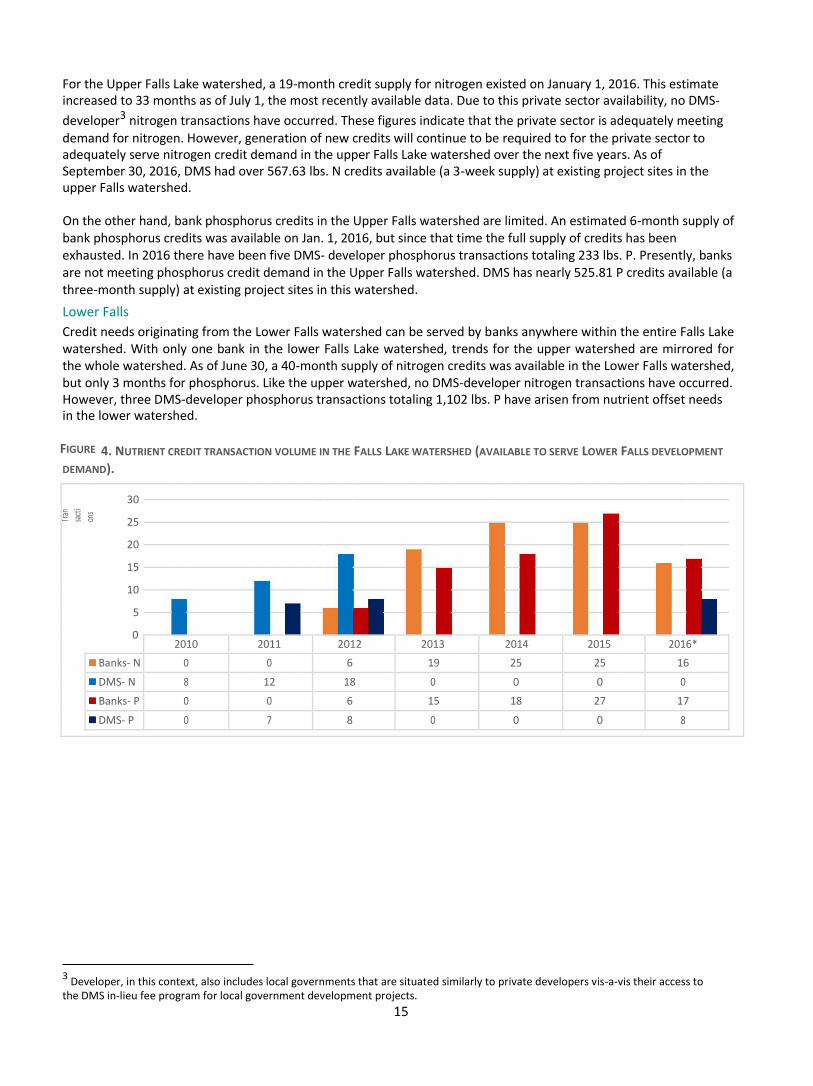
For the Upper Falls Lake watershed, a 19-month credit supply for nitrogen existed on January 1, 2016. This estimate increased to 33 months as of July 1, the most recently available data. Due to this private sector availability, no DMS-
developer3 nitrogen transactions have occurred. These figures indicate that the private sector is adequately meeting
demand for nitrogen. However, generation of new credits will continue to be required to for the private sector to adequately serve nitrogen credit demand in the upper Falls Lake watershed over the next five years. As of September 30, 2016, DMS had over 567.63 lbs. N credits available (a 3-week supply) at existing project sites in the upper Falls watershed. On the other hand, bank phosphorus credits in the Upper Falls watershed are limited. An estimated 6-month supply of bank phosphorus credits was available on Jan. 1, 2016, but since that time the full supply of credits has been exhausted. In 2016 there have been five DMS- developer phosphorus transactions totaling 233 lbs. P. Presently, banks are not meeting phosphorus credit demand in the Upper Falls watershed. DMS has nearly 525.81 P credits available (a three-month supply) at existing project sites in this watershed. Lower Falls Credit needs originating from the Lower Falls watershed can be served by banks anywhere within the entire Falls Lake watershed. With only one bank in the lower Falls Lake watershed, trends for the upper watershed are mirrored for the whole watershed. As of June 30, a 40-month supply of nitrogen credits was available in the Lower Falls watershed, but only 3 months for phosphorus. Like the upper watershed, no DMS-developer nitrogen transactions have occurred. However, three DMS-developer phosphorus transactions totaling 1,102 lbs. P have arisen from nutrient offset needs in the lower watershed.
4. NUTRIENT CREDIT TRANSACTION VOLUME IN THE FALLS LAKE WATERSHED (AVAILABLE TO SERVE LOWER FALLS DEVELOPMENT
DEMAND).
30
Tran
sact
ion
s
25
20
15
10
5
0
2010
2011
2012
2013
2014
2015
2016*
Banks- N 0
0
6
19
25
25
16
DMS- N 8
12
18
0
0
0
0
Banks- P 0
0
6
15
18
27
17
DMS- P 0
7
8
0
0
0
8
3
Developer, in this context, also includes local governments that are situated similarly to private developers vis-a-vis their access to the DMS in-lieu fee program for local government development projects.
15
FIGURE
FIGURE 5. FALLS WATERSHED NUTRIENT CREDIT SALES BY YEAR
14,000 2,500
12,000 2,000
(lb
s.) 10,000
(lb
s.)
8,000 1,500
N c
red
it
P c
red
it
6,000 1,000
4,000 500
2,000
0 2010 2011 2012 2013 2014 2015 2016*
0
Banks- N 0 0 3,501 11,708 9,763 13,114 6,583
DMS- N 4,214 4,818 4,171 0 0 0 0
Banks- P 0 0 198 1,023 983 1,907 1,133
DMS- P 0 178 168 0 0 0 1,335
FIGURE 6. OUTSTANDING SUPPLY OF BANK NUTRIENT CREDITS IN THE FALLS LAKE WATERSHED
Falls Summary Bank trends in the Falls Lake watershed generally show an abundance of nitrogen credits available for sale, but their supply of phosphorus credits is limited. No regulatory changes are anticipated for the Falls Lake watershed during the next five years. DMS is presently serving the development community by meeting its demand for phosphorus credits, which has recently remained unmet by banks.
Offset Trends and Outlook in the Jordan Lake Watershed Upper New Hope Historically, nearly all of the demand for nutrient offset credits in the Jordan Lake watershed has been in the Upper New Hope basin. Many local governments in this subbasin voluntarily adopted the Jordan stormwater rules into their ordinances in 2012. Furthermore, Upper New Hope has the most stringent nutrient targets for new development and is also the location of many growing urban and suburban municipalities. Three banks presently serve the Upper New Hope watershed, with one additional bank exhausting all credits in early 2016.
Nutrient transactions between banks and developers peaked in 2013 and have declined considerably since that time. Banks have met all developer phosphorus offset demand since 2010. Nitrogen offsets, on the other hand, have routinely been in short supply until recently.
DMS- developer nitrogen transactions have occurred frequently in the Upper New Hope basin since 2013. Since that time,
79 transactions have taken place for a total of 35,366 lbs. N. The total monetary value of these transactions exceeds
$2.9m. DMS-developer transactions have slowed considerably in 2016. Despite the existing bank preference 16
requirement, nearly twice as many nitrogen credits have been provided by DMS than by banks, indicating a
general inability for private banks to fully serve developer demand for nitrogen offsets.
FIGURE 7. UPPER NEW HOPE NUTRIENT CREDIT SALES BY YEAR
20,000 250
(lb
s.) 18,000
(lb
s.)
16,000 200
14,000
cred
it
cred
it
12,000 150
10,000
N
P
8,000
100
Del
iver
ed
Del
iver
ed
6,000
4,000 50
2,000
0 2010 2011 2012 2013 2014 2015 2016*
0
DMS N 0 0 0 577 16,573 17,169 1,047
bank N 481 489 1,197 13,057 2,004 486 355
bank P 0 3 32 196 90 168 20
FIGURE 8. OUTSTANDING SUPPLY OF BANK NUTRIENT CREDITS IN THE UPPER NEW HOPE WATERSHED
Lower New Hope The Lower New Hope basin is the smallest of the three Jordan Lake management units, and a significant portion of its land is owned by the Army Corps of Engineers. Presently, no banks exist here. Two DMS-developer transactions for nitrogen and one for phosphorus have occurred in the Lower New Hope basin since 2013. Due to the absence of banks in the Lower New Hope basin, DMS remains the only option for developers seeking offsets there. Haw A single bank is active in the Haw basin, with credits generated beginning in 2014. Transactions in this basin are uncommon (1 for nitrogen, 0 for phosphorus since 2010) and existing bank nutrient offset credits are presently plentiful for both nitrogen and phosphorus. Jordan Summary Developer demand for nutrient offset credits has been light to nonexistent in two of the Jordan Lake watershed’s subbasins. One DMS-developer transaction has occurred for phosphorus in the Jordan Lake watershed, and no DMS-developer nutrient transactions have occurred to date in the Haw subbasin.
17
The Upper New Hope subbasin is the primary source of nutrient offset activity in the Jordan Lake watershed. DMS continues to routinely supply nitrogen offset credits to developers as bank supplies are periodically exhausted. However, demand is declining and is expected to eventually halt due to legislative delays to the Jordan Lake strategy. The status of nutrient offset requirements beyond 2019 are unclear in the Jordan Lake watershed, and will be subject to reevaluation during the rules readoption process.
FIGURE 9. NUTRIENT CREDIT TRANSACTION VOLUME IN THE JORDAN LAKE WATERSHED
40
Tran
sa
ctio
ns
30
10 20
0
2010 2011 2012
2013
2014
2015
2016*
Banks- UNH N 2 8 9
31
23
2
2
DMS- UNH N 0 0 0
3
29
40
7
Banks- UNH P 0 3 3
16
11
8
0
DMS- LNH N 0 0 0
1
1
0
0
DMS- LNH P 0 0 0
0
1
0
0
Banks- Haw N 0 0 0
0
0
1
0
Conclusions The legislation guiding this report seeks an evaluation of the nutrient credit market as a precursor to a recommendation of whether DMS’s services are required in the Jordan and Falls Lake watershed. Generally, this market analysis indicates availability of bank nitrogen credits in the Falls watershed. It also indicates that demand for nutrient offsets in the Jordan Lake watershed may soon cease until the Jordan Lake strategy is readopted several years from now. Such findings, absent further context, might imply that DMS’s authority to operate in these markets could be rescinded with little downside.
However, other factors weigh against this recommendation. In both watersheds, buffer mitigation requirements remain
intact and DMS continues to meet buffer mitigation needs by installing the same type of projects that provide nutrient
credits. Further, the generation of N and P credits are not easily separated. So long as the private supply of either nutrient
is at risk of exhaustion, DMS would generate both types of credits to help satisfy unmet demand.
North Carolina’s bank preference policies ensure that DMS project development and pricing do not unduly interfere with the private credit market. When bank credits are available, developers must negotiate with banks to determine an appropriate price, with developers retaining an option to reduce nutrient runoff themselves if no agreement can be reached.
Because DMS project fees are collected based on an actual cost method, revocation of their authority to operate in the Jordan or Falls Lake watershed is not projected to incur a cost savings for the state. In fact, if improperly executed, it could incur additional costs for federal, state, and local governments that could lose their option to seek credits directly from DMS.
Instead of negatively influencing the private credit market, DMS enhances it by providing a backstop function. DMS has the tools to respond to the private market while providing a service that meets dual policy goals of pollution reduction and economic development. A sophisticated planning staff, flexibility to respond to credit demand and collect toward future projects, and the preference to purchase nutrient offset credits from banks allows DMS to continually adapt to trends in markets across the state. Furthermore, DMS staff has developed strong interagency relationships that
18
facilitate the program’s ability to respond to a dynamic regulatory environment. Thus, in the Jordan Lake watershed specifically, DMS is uniquely situated to wind down their nutrient offset positions while attenuating the impacts of abrupt and complex regulatory changes for developers.
In summary, limitation of DMS’s authority to operate in these watersheds appears to demonstrate little benefit to the state, the development community, or to privately-operated nutrient offset banks. In contrast, significant costs and delays could be incurred by developers and government agencies (including the state) if a revocation of DMS’s authority resulted in significant market distortions. Even without adjustments to its statutory or regulatory authority, DMS is capable of and has incentive to gradually satisfy its outstanding nutrient credit obligations in the Jordan Lake watershed while serving the occasional need for credits from developers.
19
Appendix I: Map of the Jordan Lake Watershed
Legend: Haw subbasin: light green Upper New Hope subbasin: dark green Lower New Hope subbasin: turquoise Jordan Lake: blue
20
Appendix II: Map of the Falls Lake Watershed
Legend: Upper Falls subbasin: light green Lower Falls subbasin: purple Falls Lake: blue