62
Evaluating Outcomes of Prevention Programs FRIENDS National Resource Center for Community Based Child Abuse Prevention A Service of the Children’s Bureau www.friendsnrc.org
| Date post: | 25-Dec-2015 |
| Category: |
Documents |
| Upload: | jesse-parker |
| View: | 214 times |
| Download: | 0 times |
Evaluating Outcomes of Prevention
Programs
FRIENDS National Resource Center for Community Based Child Abuse Prevention
A Service of the Children’s Bureau
www.friendsnrc.org

Overview of the Day
• Review of Logic Models: a template for planning, evaluating, and reporting
• Using data to develop and maintain a CQI environment
• Administering the Protective Factors Survey (PFS)
• Identifying other methods for measuring outcomes
• Managing and reporting on outcomes
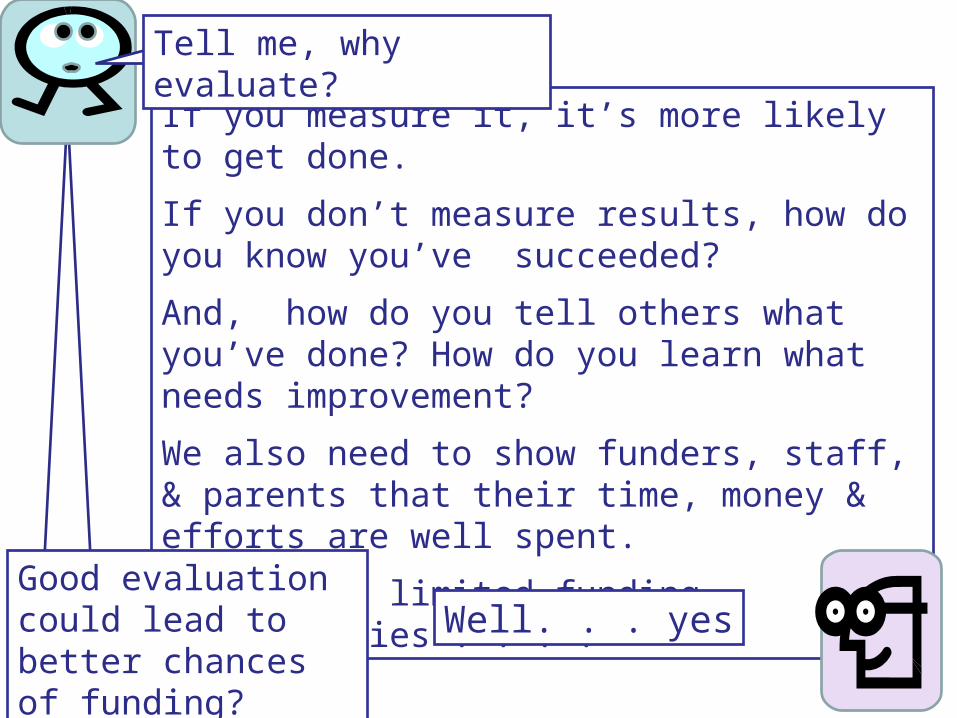
If you measure it, it’s more likely to get done.
If you don’t measure results, how do you know you’ve succeeded?
And, how do you tell others what you’ve done? How do you learn what needs improvement?
We also need to show funders, staff, & parents that their time, money & efforts are well spent.
Plus, with limited funding opportunities . . . .
Tell me, why evaluate?
Good evaluation could lead to better chances of funding?
Well. . . yes

Evidence-based and evidence-
informed programs require
evaluation
I’m convinced. . . How do I get
started?
It all begins with a logic model . . .

What is that fancy one-paged chart?
It’s all of that and more!
Friends, it’s a Logic Model!
Is it a program map? A tool for planning evaluation? A report template? Is it a requirement for grant applications?
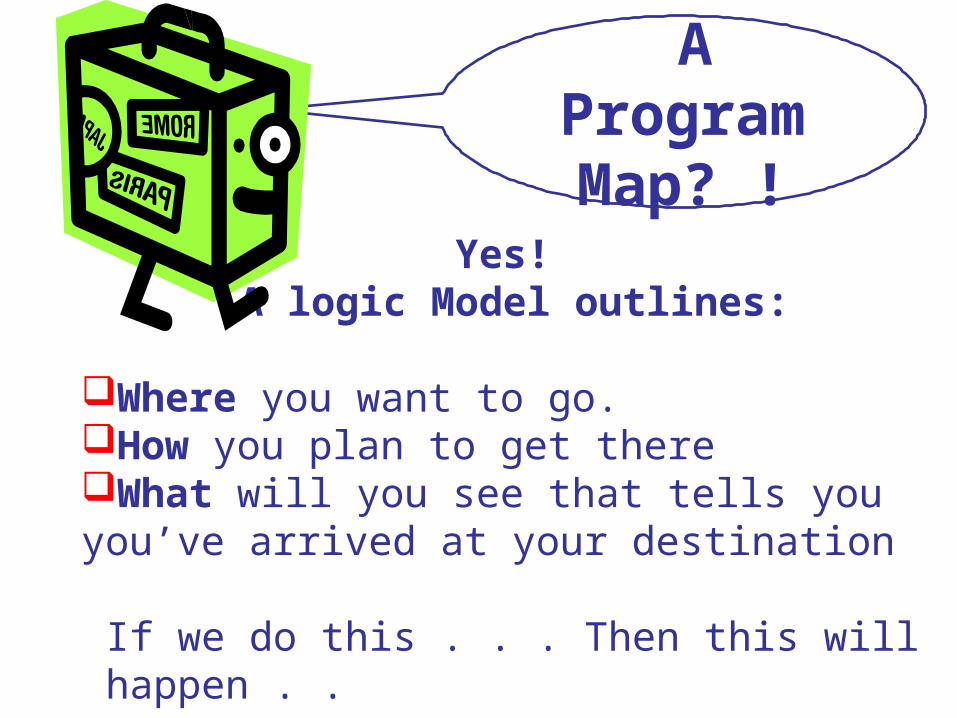
Yes! A logic Model outlines:
Where you want to go. How you plan to get there What will you see that tells you you’ve arrived at your destination
If we do this . . . Then this will happen . . .
A Program Map? !

Yes! A logic model can specify the tools that will be used to measure to what degree you achieved your desired outcomes
A tool for planning
evaluations?

Yes!
When you’re ready to report on your services, pull out your logic model and use it as a template to organize your report.
A report template?
Yes! Most grant applications are asking for a logic model as part of the proposal.
Don’t leave home without one.
A requirement for grant
applications?
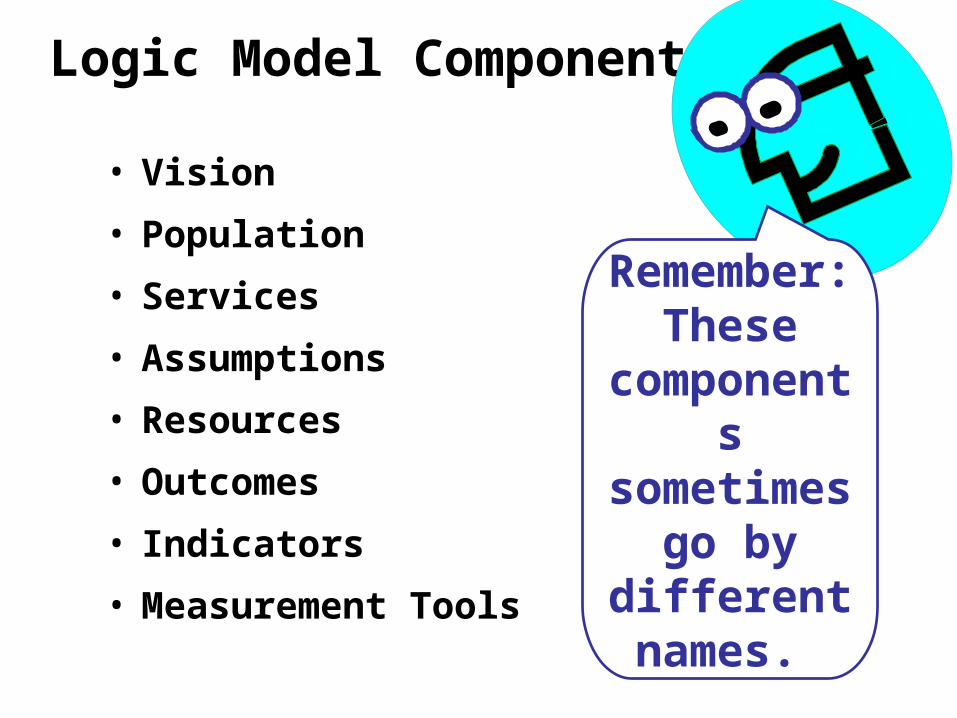
Logic Model Components
• Vision
• Population
• Services
• Assumptions
• Resources
• Outcomes
• Indicators
• Measurement Tools
Remember: These compone
nts sometime
s go by different names.

A broad statement of well-being; the long-term impact on social, economic or environmental conditions.
Examples: * Children &Youth are Nurtured, Safe & Engaged
* Families are Strong & Connected
* Communities are Caring and Responsive
* From Pathways to the Prevention of Child Abuse & Neglect, Pathways Mapping Initiative , Schorr, & Marchand, 2007
http://www.dss.cahwnet.gov/CDSSWEB/entres/pdf/Pathway.pdf
Vision (Goal, impact, long-term outcome)

Population (consumers, participants,
audience)
• Who are your participants? • What are their characteristics and
demographics?• What are their needs?• How do you know?
– Needs assessments– Focus groups
Services (outputs, Activities)
• Based on the needs assessment of your target population-– What services are you providing/will you
provide?(You will revisit this section as you
move further in your logic model)
– What will they look like?– How frequently will they occur?

Assumptions (theory of change, research base)
•What assumptions are you making that suggest your services will be successful?
•Services should be based on what is known to be effective.
•Your research into assumptions should result in understanding the degree to which you are providing evidence-based services.

Assumptions, continued
If uncertain of the empirical foundations of your approach, now is the time to stop and investigate what works. This link will help get you started:
http://www.childwelfare.gov/preventing/programs/whatworks/index.cfm
The FRIENDS website has additional guidelines on Evidence-Based Practices. Please check the site regularly http://www.friendsnrc.org

Services • Twelve 1 hour parenting education sessions using
the ”Safe Homes” curriculum. • Access to concrete materials (such as fencing, stair
gates, car seats, etc.)
Assumptions
Two evaluations of the Safe Homes curriculum (Fisher, 2000, Hale & Carter, 2003), each conducted over a 3-year period, found that children of parents who had participated in the program were 50% less likely to experience preventable injuries than children in comparison groups.
Resources (inputs)
Do you have the infrastructure needed?• Based on the services you identify, –What resources do you need?– If you don’t have them, can you get them?
The Implementation Plan worksheet on the FRIENDS web-site can help.
http://www.friendsnrc.org/download/dtappendices.pdf
page 45
Movement towards or attainment of a change in attitude, belief, behavior.
Ask yourself: “If you conduct your program’s activities, and succeed with participants, what do they believe, know, have or do as a result?
Outcomes (Goals, objectives)
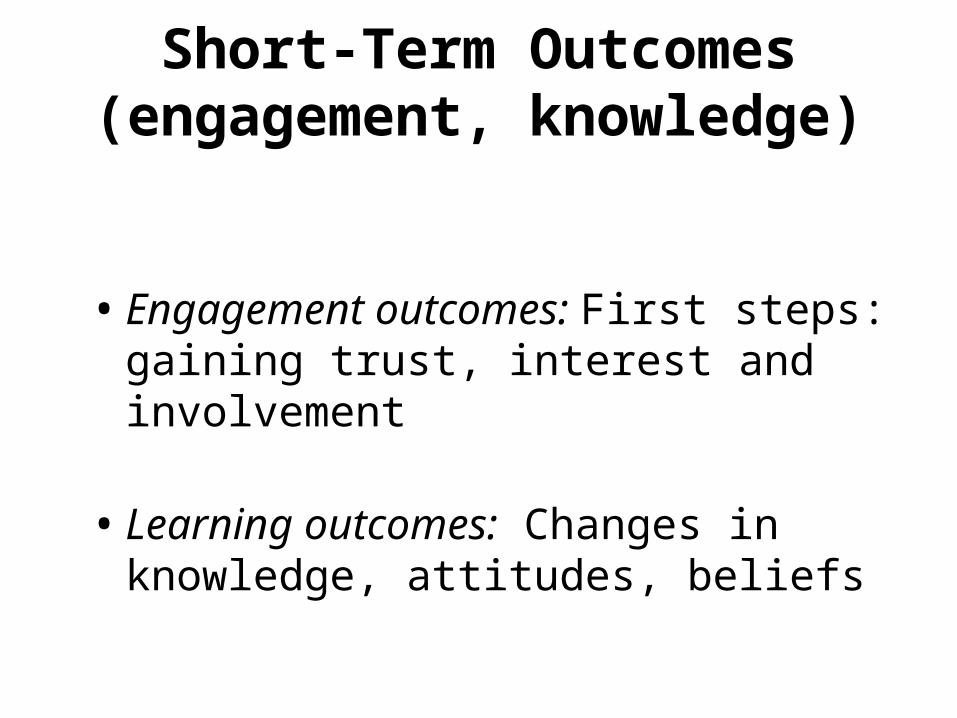
•Engagement outcomes: First steps: gaining trust, interest and involvement
•Learning outcomes: Changes in knowledge, attitudes, beliefs
Short-Term Outcomes(engagement, knowledge)

Intermediate• Moving from learning to action
• Practicing and refining new skills
• Adopting or changing behaviors
Intermediate Outcomes(practice)

Long-Term Outcomes(integration)
Long-term• When participants have integrated new
behaviors into their lives over time.
• Consistently practicing new skills and behaviors
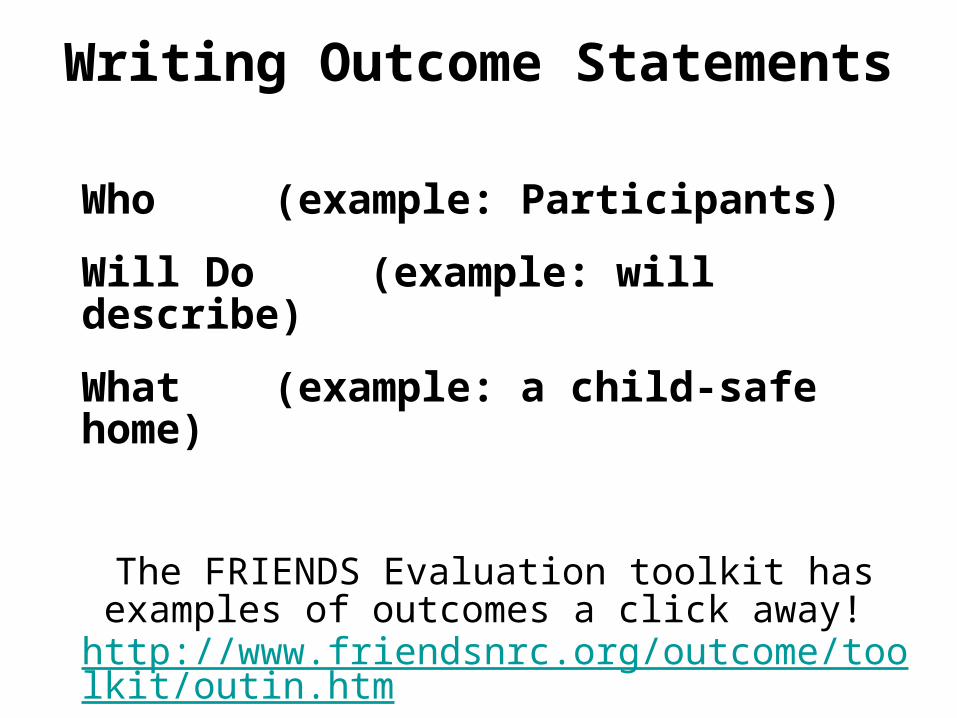
Who (example: Participants)
Will Do (example: will describe)
What (example: a child-safe home)
The FRIENDS Evaluation toolkit has examples of outcomes a click away!
http://www.friendsnrc.org/outcome/toolkit/outin.htm
Writing Outcome Statements


• Short-term: Participants demonstrate knowledge of how to appropriately supervise their children.
• Intermediate: Participants provide appropriate supervision of their children.
• Long-term: Participants provide appropriate supervision according to the changing needs of the children as they grow and develop.
Formatting Outcomes

Desired Change
Evidence of Change
Outcomes need indicators

• Indicators are specific signs needed to track progress
• Indicators answer the question: What would I see or hear that would tell me that the outcome was being achieved?
• Can spell out a level of achievement to attain in #’s or %’s
Indicators (performance indicators)

Participants appropriately manage child behavior.
Participants encourage positive
behaviors
Participants set realistic, age-appropriate household
rules.
Participants consistently enforce
their household rules.Participants enforce rules
without coercion or physical punishment
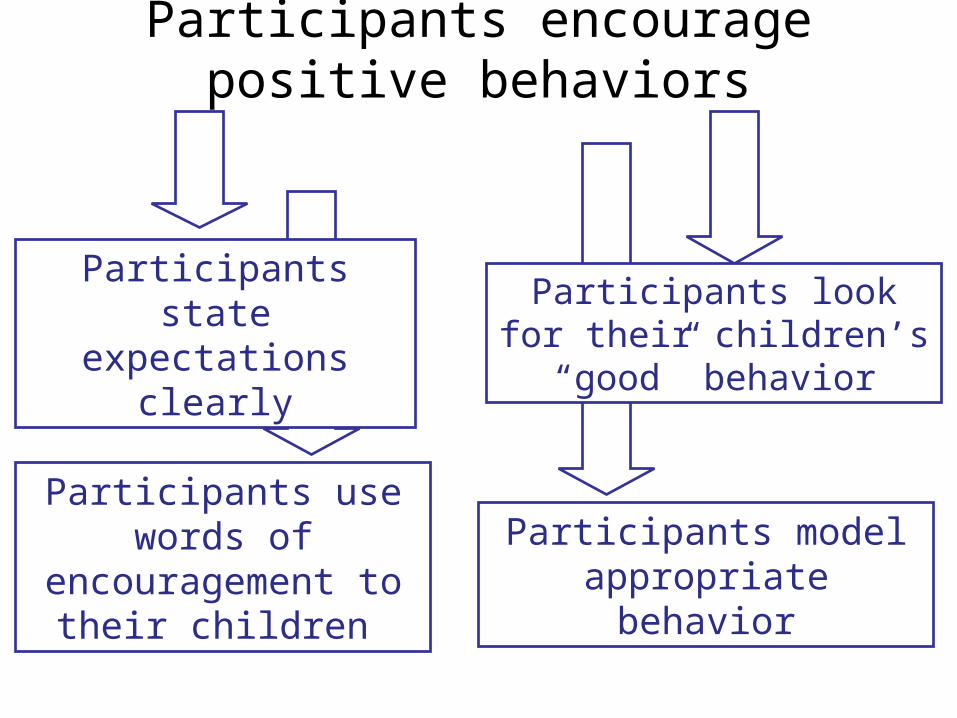
Participants encourage positive behaviors
Participants state expectations clearly
Participants look for their children’s “good” behavior
Participants use words of
encouragement to their children
Participants model appropriate behavior

Setting Benchmarks
• You may need to identify performance targets (benchmarks) for each indicator).
• If possible, set benchmarks based on earlier evaluations.
• If you need to set benchmarks before you provide service, consult with peers to set realistic benchmarks and adjust them based on your evaluation findings.
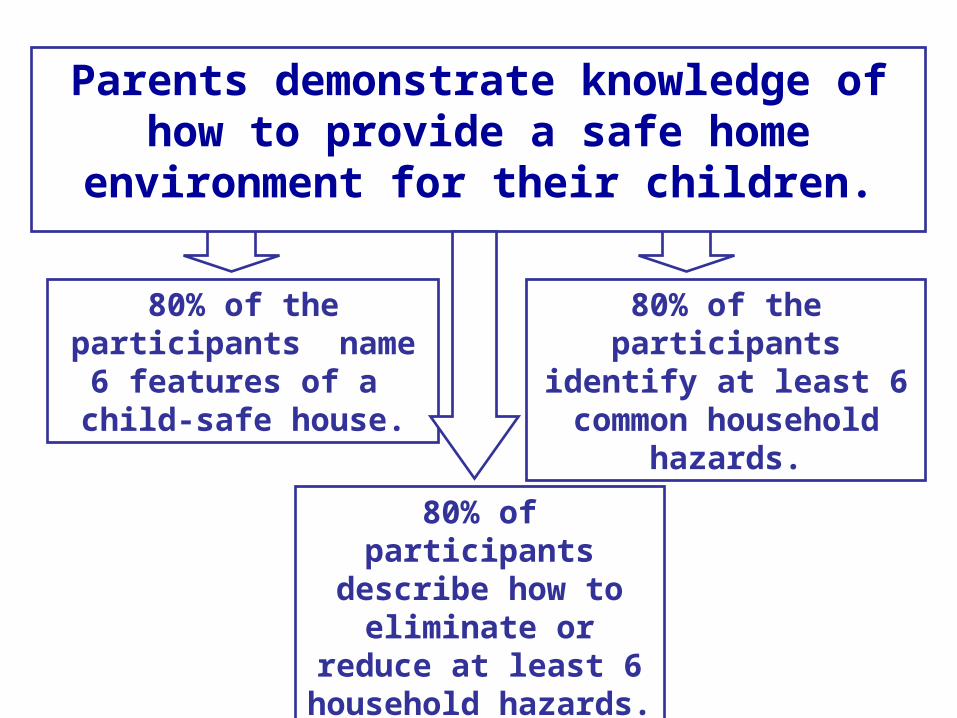
Parents demonstrate knowledge of how to provide a safe home
environment for their children.
80% of the participants name 6 features of a
child-safe house.
80% of the participants identify at least 6
common household hazards.
80% of participants describe how to
eliminate or reduce at least 6 household
hazards.
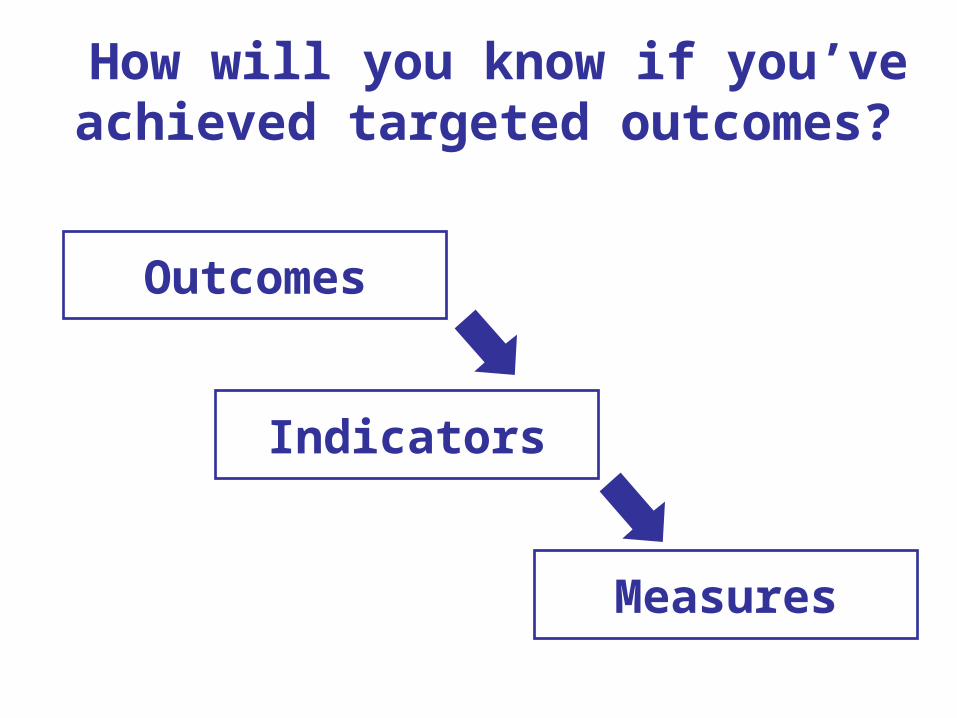
Measures
Indicators
Outcomes
How will you know if you’ve achieved targeted outcomes?

OutcomeStudent is proficient in 4th grade math.
One Indicator: Student knows multiplication tables up to 12
One Measure:Student scores 90% in the Tedious Tables in the Nuts about Numbers
text book
Measurement Tools “test” whether the indicator was
achieved.

Participants foster their infant’s social/emotional development
Parents correctly identify their infants verbal and non-verbal cues
Subscale 3 on the NCAST PCI Feeding and Teaching Scales.
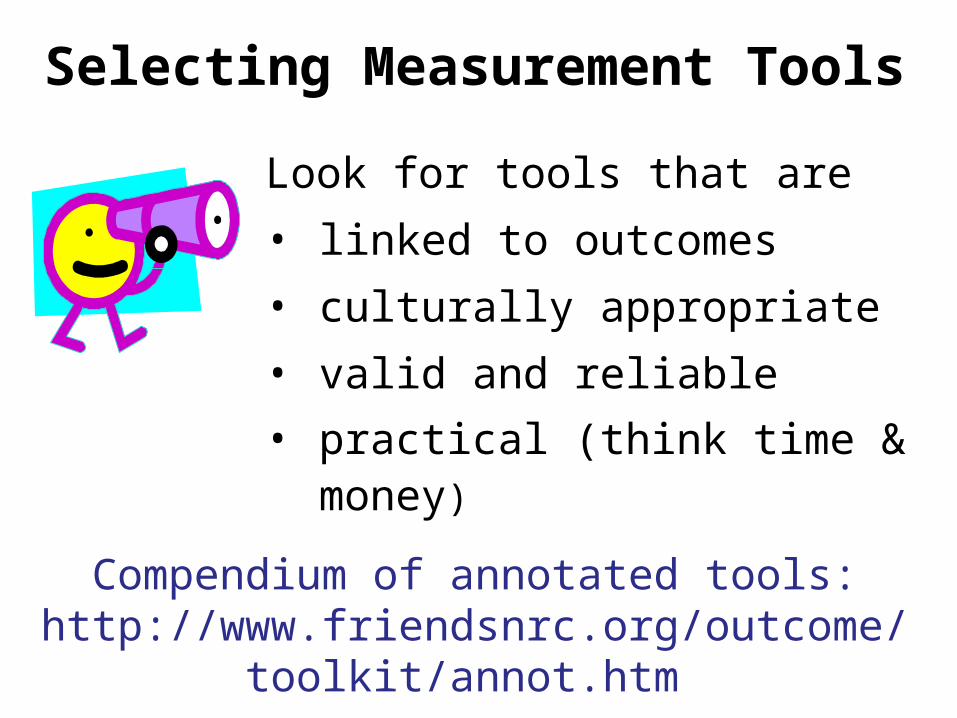
Selecting Measurement Tools
Look for tools that are
• linked to outcomes
• culturally appropriate
• valid and reliable
• practical (think time & money)
Compendium of annotated tools: http://www.friendsnrc.org/outcome/toolki
t/annot.htm

Children receiving a dental check-up
Parents who attended a parent/teacher conference
Mothers who received pre-natal care
Number of fathers who maintained regular contact with their children
Simple Counts & Checklists

Is your home safe for children? Bathroom:
All medications are kept out of reach and sight of
my children.
Chemicals I use for cleaning sinks, toilets and
floors are inaccessible to children.
Example Counts and Checklists
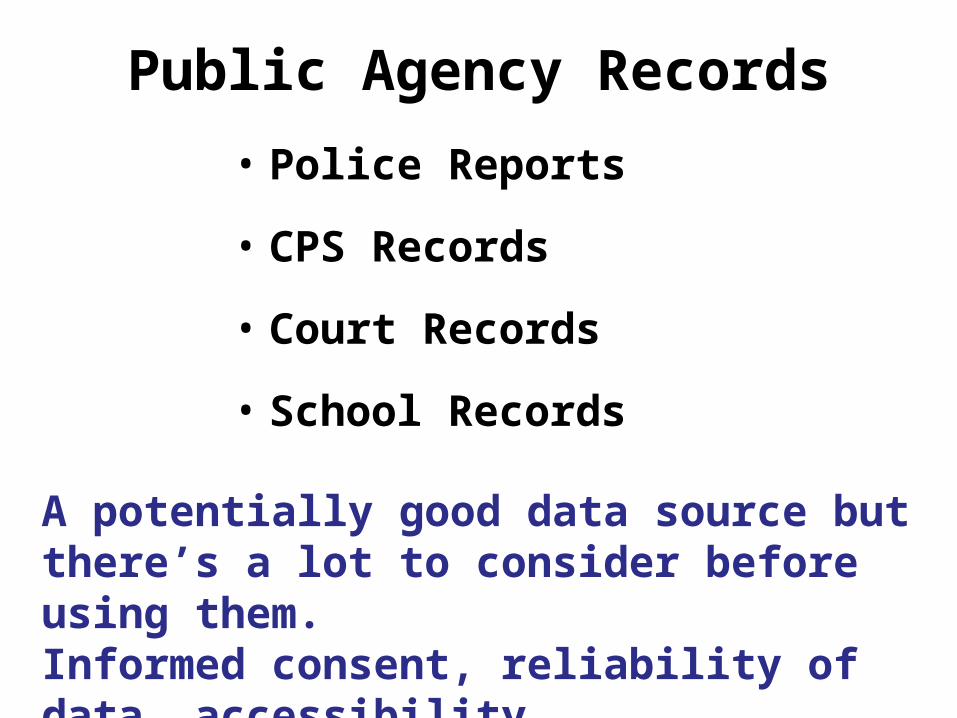
Public Agency Records
• Police Reports
• CPS Records
• Court Records
• School Records
A potentially good data source but there’s a lot to consider before using them. Informed consent, reliability of data, accessibility . . .

You may choose to construct your own tools
This should be undertaken very cautiously. Check out the FRIENDS Evaluation Toolkit for information.
friendsnrc.org

Qualitative Data
Captures information that evaluation tools can’t always capture. Can be gathered through Surveys, interviews, focus groups, key informants, case notes, observations
For more information: FRIENDS Guide to Qualitative Evaluation:
http://www.friendsnrc.org/download/outcomeresources/qualitativedata.pdf
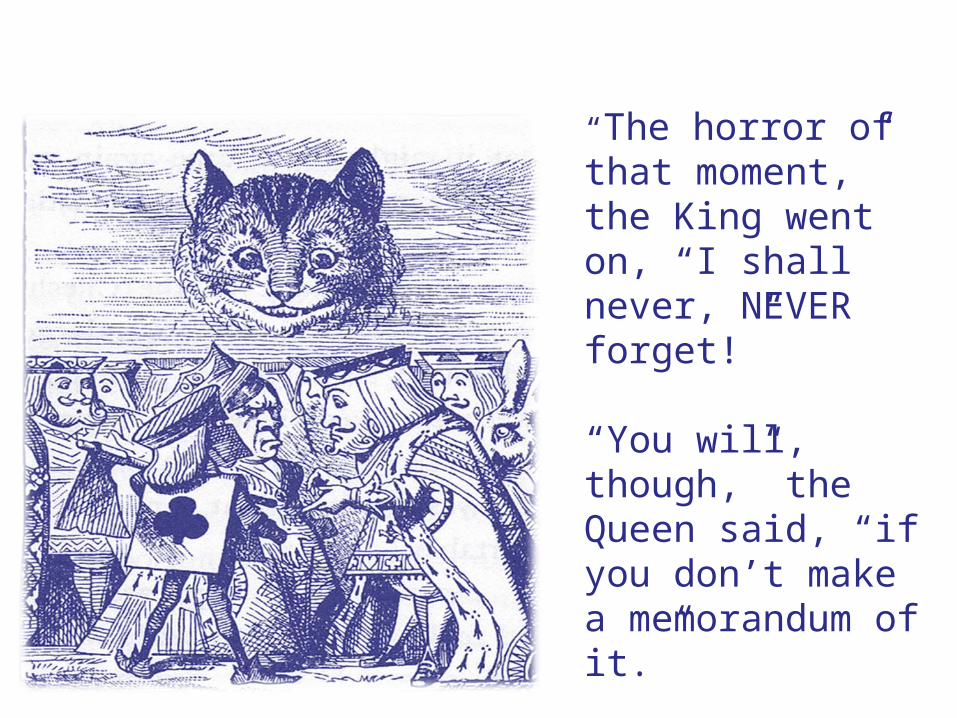
“The horror of that moment,” the King went on, “I shall never, NEVER forget!”
“You will, though,” the Queen said, “if you don’t make a memorandum of it.”
Lewis Carroll, Through the
Looking Glass
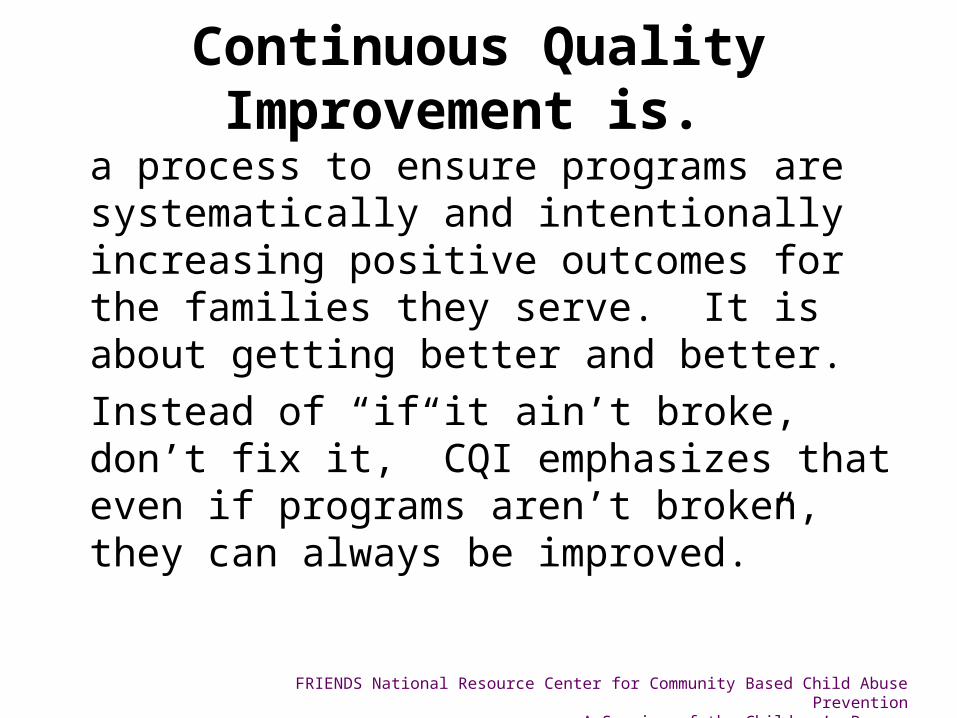
Continuous Quality Improvement is.
a process to ensure programs are systematically and intentionally increasing positive outcomes for the families they serve. It is about getting better and better.
Instead of “if it ain’t broke, don’t fix it,” CQI emphasizes that even if programs aren’t broken, they can always be improved.”
FRIENDS National Resource Center for Community Based Child Abuse PreventionA Service of the Children’s Bureau

Plan, Do, Study, Act Cycle
PLAN services that are responsive to consumer needs &
desires evidence based or evidence
informed mapped in a logic model
Develop a manualPlan your evaluation methods
FRIENDS National Resource Center for Community Based Child Abuse PreventionA Service of the Children’s Bureau

Do
Provide services–Hire, train and supervise staff–Document activities–Monitor fidelity–Collect data
–formally–informally
FRIENDS National Resource Center for Community Based Child Abuse PreventionA Service of the Children’s Bureau

StudyStudy your data
•formally, in the course of staff supervision, full staff meetings, board meetings, and
•informally, through daily discussions with staff and participants; self-assessment of job performance, observation of day-to-day participant progress and satisfaction.
FRIENDS National Resource Center for Community Based Child Abuse PreventionA Service of the Children’s Bureau

Act
Act by adjusting practices•formally, at the agency level by adopting new practices, programs, policies and procedures based on findings
•informally, by making personal adjustments to improve job performance
Plan, Do, Study, Act may begin as a linear process but soon all steps are happening all the time.

What Drives CQI?S
afe
En
vir
on
men
t• System Wide• Consumer Involvement• Logic Model • Manual• Staff• Evaluation• Data Driven Decision
Making

CQI Self Assessment Tool
• What CQI activities are occurring in your agency?
• How you would like to strengthen the atmosphere of CQI in your agency?
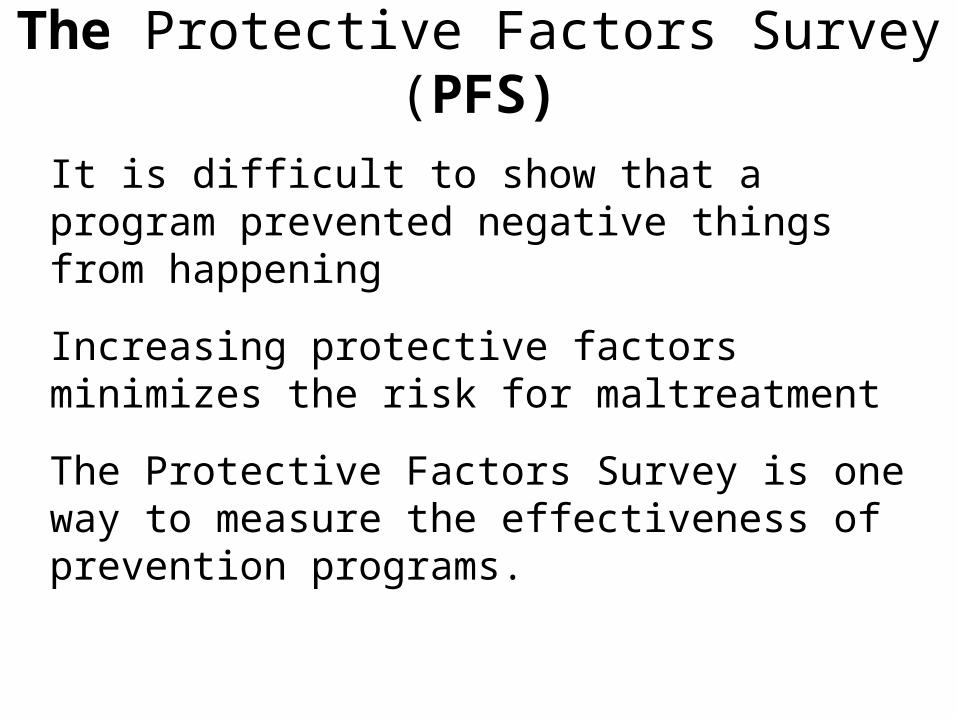
The Protective Factors Survey (PFS)
It is difficult to show that a program prevented negative things from happening
Increasing protective factors minimizes the risk for maltreatment
The Protective Factors Survey is one way to measure the effectiveness of prevention programs.

Protective Factors
•There is no single cause of child maltreatment.
•a number of risk factors or attributes commonly associated with maltreatment.
•a number of protective factors to reduce the occurrence of child maltreatment.
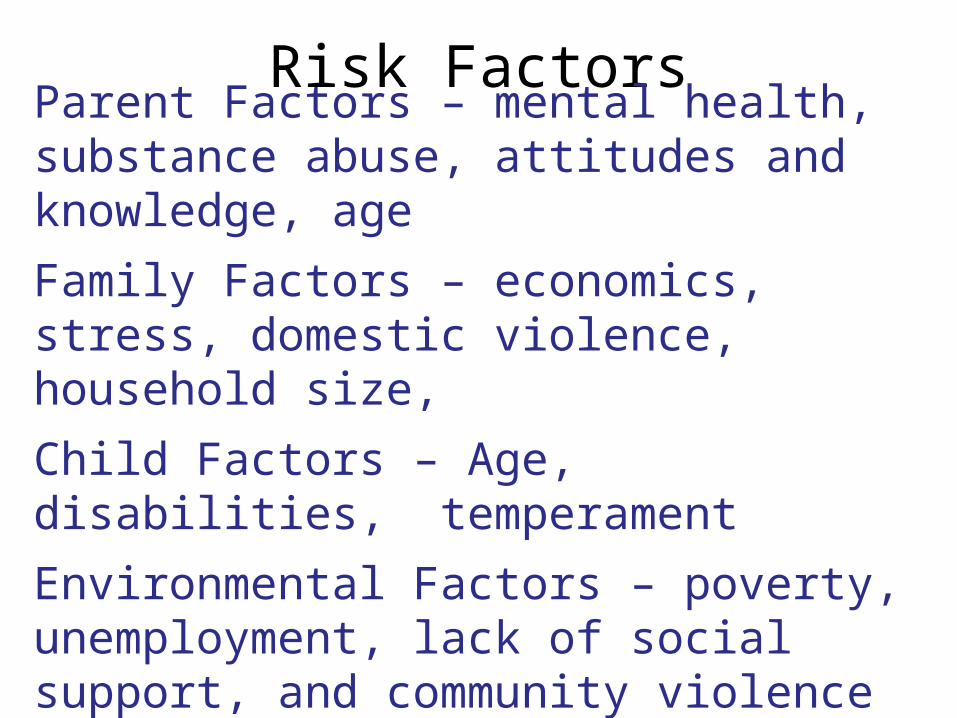
Risk FactorsParent Factors – mental health, substance abuse, attitudes and knowledge, age
Family Factors – economics, stress, domestic violence, household size,
Child Factors – Age, disabilities, temperament
Environmental Factors – poverty, unemployment, lack of social support, and community violence

Understanding the Risk Factors
Even though certain factors are present where maltreatment occurs, this does not mean that the presence of these factors will always result in child abuse and neglect.
Most people living in poverty do not harm their children.

Protective Factors
Factors that can protect families and promote resilience.
A Protective Factors framework focuses on prevention strategies based on building strengths with families rather than exclusively on risks and deficits.

Strengthening Families & the PFS
CBCAP/PSF
Parental ResilienceFamily Functioning/Resiliency
Social Connections Social Emotional Support
Parenting KnowledgeKnowledge of Parenting/ Child Development
Concrete Support in Times of Need
Concrete Support
Social & Emotional Competence of Children
Nurturing and Attachment
CSSP

The relationship between the PFS & other measures
• All four subscales of the PFS were:
– significantly negatively correlated with child abuse potential and stress
– significantly positively related to optimism and the adaptive coping strategy of positive reframing
• All subscales except Concrete Support were significantly negatively related to depression and positively related to positive affect
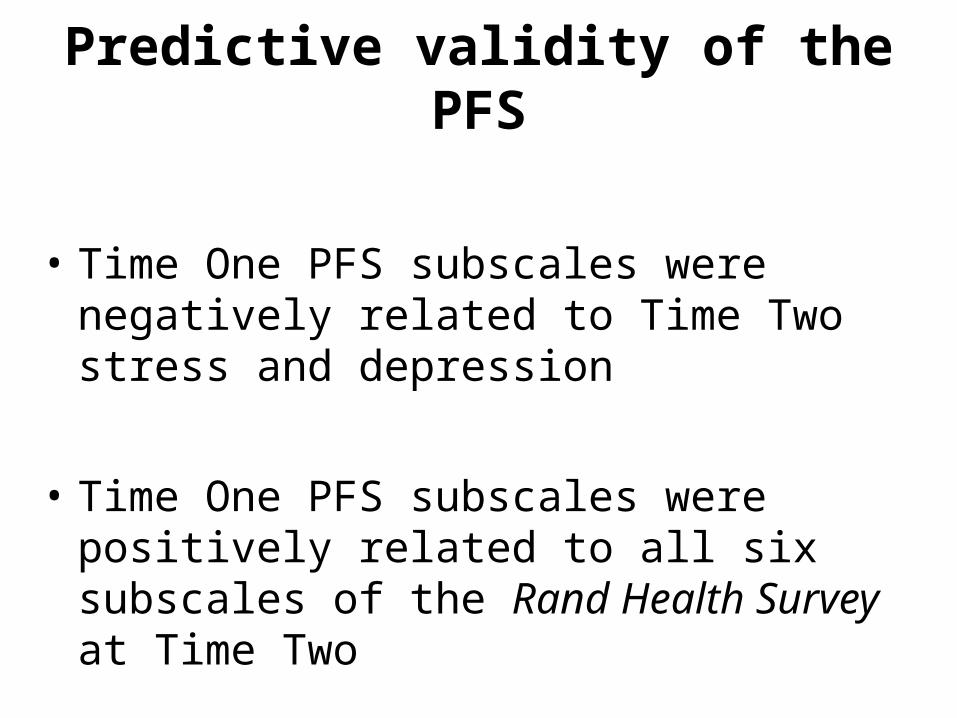
Predictive validity of the PFS
• Time One PFS subscales were negatively related to Time Two stress and depression
• Time One PFS subscales were positively related to all six subscales of the Rand Health Survey at Time Two
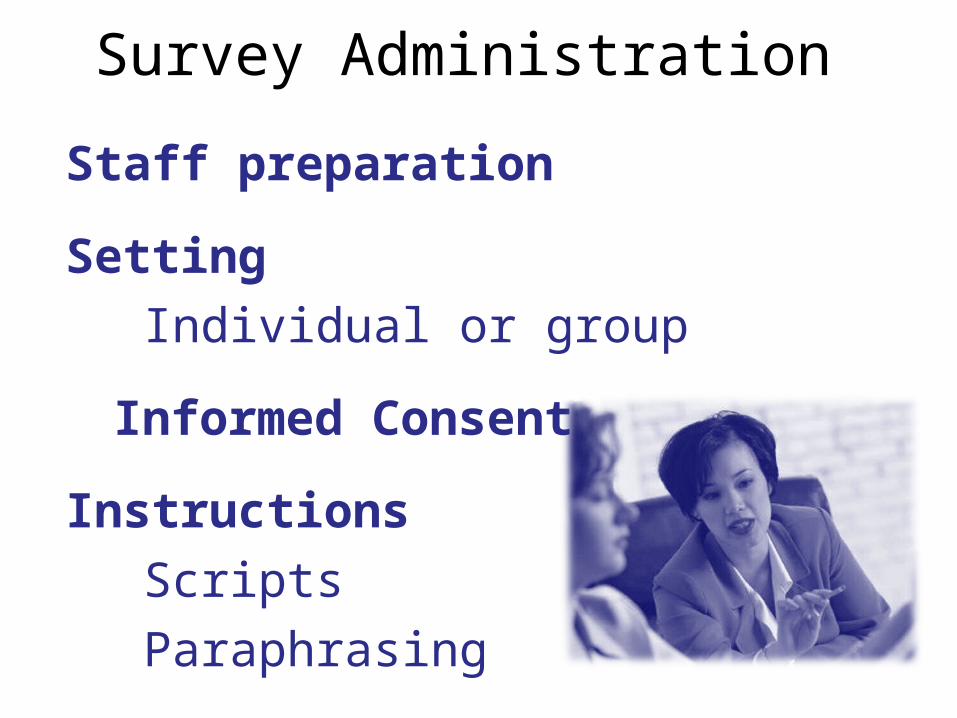
Survey Administration
Staff preparation
SettingIndividual or group
Informed Consent
Instructions ScriptsParaphrasing

Data Management
Enter data
Store raw data in secure location
Destroy surveys within prescribed time frames
FRIENDS PSF Database
Resources
• Survey materials– Training manual, PFS technical
information handout, survey, reports all available at www.friendsnrc.org
– FRIENDS database

How can I find other evaluation tools?
The FRIENDS Evaluation Toolkit and Logic Model Builder includes a compendium of evaluation tools.
Access it at: http://www.friendsnrc.org/outcome/toolkit/annot.htm
Reporting on Outcomes
The report should include:
•Executive Summary
•Body of the Report
– Use your logic model as a map for developing this major section of the report
•Conclusion

The Body of the Report
Population Targeted/Population Served
Services Planned/Services Provided (include info on Implementation & Fidelity)
Assumptions/Underlying theory
Outcomes Projected
Evaluation Methodology
Outcome Achievement
Analysis of Results
Future Planning

Contact Information
Casandra FirmanTraining and Technical Assistance Coordinator
FRIENDS National Resource Center for Community Based Child Abuse Prevention
(360) 769-7167 [email protected]
FRIENDS National Resource Center for Community Based Child Abuse Prevention
A Service of the Children’s Bureau


