28
Evaluating the Benefits of the SPP EHV Buildout Moving forward on policy for funding 765 KV Larry Holloway CAWG Meeting February 25, 2009
| Date post: | 14-Dec-2015 |
| Category: |
Documents |
| Upload: | noelle-isbell |
| View: | 216 times |
| Download: | 0 times |

Evaluating the Benefits of the SPP EHV Buildout
Moving forward on policy for funding 765 KV
Larry HollowayCAWG Meeting February 25, 2009

Benefits Beyond Adjusted Production Cost
• Already Discussed– Line loss benefits– Additional reliability benefits– Reductions in capacity margin and reserves– Increased options for different futures
• What we haven’t discussed is a way to use the wind resources we are attempting to reach to help solve cost problems

What are the cost problems?
• Many benefits go to tier one entities that do not have to fund the investment– SPP and others have attempted to minimize this by
not evaluating benefits and costs of “export legs” of the EHV buildout
– “rebalancing these costs leads to large rate impacts for some entities soley based upon location in a zone and past construction decisions.
• Is there a way to justify access to the wind resources and fund investment for this access?

NREL Wind Maps
• SPP Maps for all states except Louisiana
• Western regions of SPP have superior wind resources (class 4 or better)
• Eastern regions of SPP have lesser wind resources (class 3 at best)
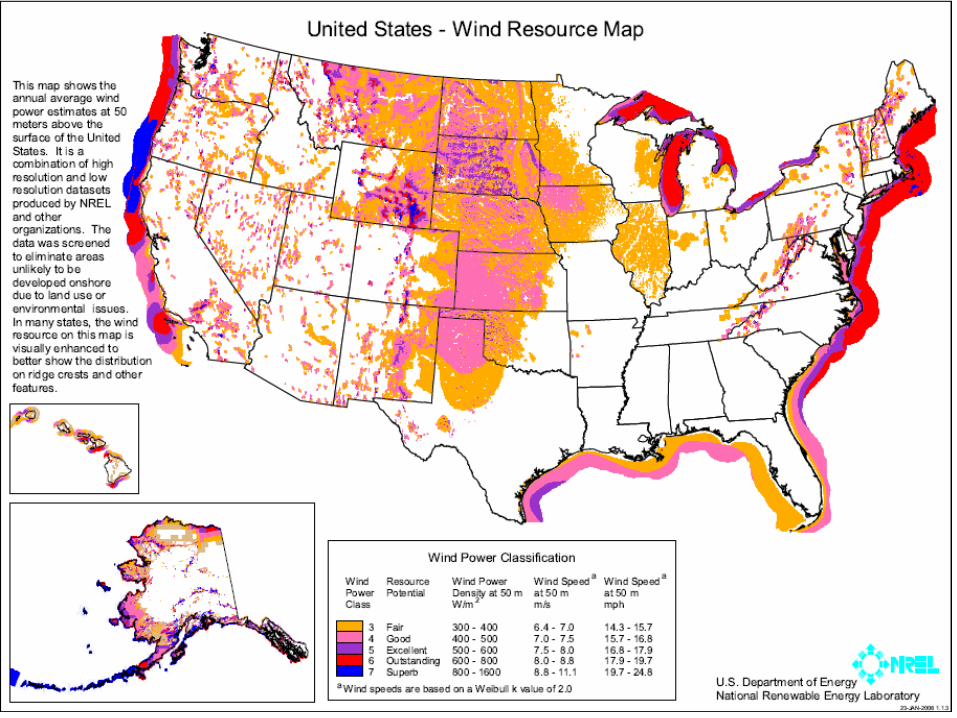


What does this show?
• Wind Resources are significantly located in the Western regions of SPP
• Very limited wind resources in Missouri, Arkansas, and eastern SPP portions of Texas, Kansas, Oklahoma– Eastern Nebraska and Kansas have some
class 4 wind resources

What difference does wind class make?
Wind Class Low High Average
3 300 400 3504 400 500 4505 500 600 550
Wind Power Density at 50 Meters in W/m2

Capacity Factor vs Wind Class
Ave Class 3 Capacity Factor
Ave Class 4 Capacity Factor
Ave Class 5 Capacity Factor
20.0% 25.7% 31.4%22.5% 28.9% 35.4%25.0% 32.1% 39.3%27.5% 35.4% 43.2%30.0% 38.6% 47.1%32.5% 41.8% 51.1%
Comparison of Capacity Factors for Identical Equipment

Production of Same Wind Equipment at Different Wind
Classes
Ave Class 3 Capacity Factor Class 3 Class 4 Class 5
20.0% 1,752 2,253 2,75322.5% 1,971 2,534 3,09725.0% 2,190 2,816 3,44127.5% 2,409 3,097 3,78630.0% 2,628 3,379 4,13032.5% 2,847 3,660 4,474
Annual MWH produced per MW rating of same wind Equipment at different Ave Class wind energy densities

Basic Equations
• Cc = installed capital costs of wind generation in $/kw
• Cr = Charge Rate (carrying charge - %)– Pretax ROR + Depreciation
• Om = O&M costs in $/MWH
• Tc = Production Tax Credit in $/MWH
• H = Om – Tc
• CF = Capacity Factor - %
• AC = Annual Costs in $/KW of installed capacity

Basic Equations (cont)
• AC = Cc Cr + HCF ( 8760 )
1000
Then
• AC = Cc Cr + 8.76 HCF

What Is Location Worth?
• Assume 2 wind units, same installed costs, variable O&M, PTC, and carrying costs – The only difference is average wind speed or capacity
factor
Then,
• AC1 = Cc Cr + 8.76 HCF1
• AC2 = Cc Cr + 8.76 HCF2
– Therefore
• AC1 - AC2 = 8.76 H(CF1 - CF2)

Example Used in Analysis of Wind Generation Costs
• Cc Cr - Overall annual fixed costs of $326.40 per KW installed nameplate capacity– 12% pretax ROR– 5% depreciation (twenty years)– Results in 17% carrying charge– $1920/KW of installed nameplate capacity
• May 2008 DOE EERE publication
• Om - $9/MWH average O&M costs• Tc - $20/MWH PTC
thenH = -$11/MWH, therefore,• AC1 - AC2 = 8.76 H(CF1 - CF2), goes to• AC1 - AC2 = -96.36(CF1 - CF2)

Annual Cost per MWH of New Wind Generation Based on Wind Class Average
Ave Class 3 Capacity Factor Class 3 Class 4 Class 5
20.0% $175.30 $133.90 $107.5622.5% $154.60 $117.80 $94.3825.0% $138.04 $104.92 $83.8427.5% $124.49 $94.38 $75.2230.0% $113.20 $85.60 $68.0432.5% $103.65 $78.17 $61.96
Overall Cost per MWH (assuming $1920/KW installed costs, 17% depreciation and pretax ROR, $20/MWH PTC and $9/MWH O&M)

How much is the increase worth?
Ave Class 3 Capacity Factor
Class 3 increases to Class 4
Class 3 increases to
Class 5
Class 4 increases to
Class 5
20.0% $5,506 $11,013 $5,50622.5% $6,195 $12,389 $6,19525.0% $6,883 $13,766 $6,88327.5% $7,571 $15,142 $7,57130.0% $8,259 $16,519 $8,25932.5% $8,948 $17,895 $8,948
Annual Cost Savings per MW rating for the same wind facility by increasing wind class

How much transmission investment is justified to access better wind resources?
Ave Class 3 Capacity Factor
Class 3 increases to Class 4
Class 3 increases to
Class 5
Class 4 increases to
Class 5
20.0% $30,590 $61,181 $30,59022.5% $34,414 $68,829 $34,41425.0% $38,238 $76,476 $38,23827.5% $42,062 $84,124 $42,06230.0% $45,886 $91,771 $45,88632.5% $49,710 $99,419 $49,710
Additional transmission investment justified per MW rating of the same wind facility by increasing class of wind captured (assume
18% annual charge rate for the transmission)

How much transmission investment is justified to access better wind resources?
Ave Class 3 Capacity Factor
5,000 MW of Wind Added
10,000 MW of Wind Added
15,000 MW of Wind Added
20,000 MW of Wind Added
20.0% $152,952,381 $305,904,762 $458,857,143 $611,809,52422.5% $172,071,429 $344,142,857 $516,214,286 $688,285,71425.0% $191,190,476 $382,380,952 $573,571,429 $764,761,90527.5% $210,309,524 $420,619,048 $630,928,571 $841,238,09530.0% $229,428,571 $458,857,143 $688,285,714 $917,714,28632.5% $248,547,619 $497,095,238 $745,642,857 $994,190,476
Additional transmission investment funding capable based upon total MW of Wind enabled by increasing class of wind captured by 1 class ( 3 to 4 for example)

How much transmission investment is justified to access better wind resources?
(cont)
Ave Class 3 Capacity Factor
5,000 MW of Wind Added
10,000 MW of Wind Added
15,000 MW of Wind Added
20,000 MW of Wind Added
20.0% $305,904,762 $611,809,524 $917,714,286 $1,223,619,04822.5% $344,142,857 $688,285,714 $1,032,428,571 $1,376,571,42925.0% $382,380,952 $764,761,905 $1,147,142,857 $1,529,523,81027.5% $420,619,048 $841,238,095 $1,261,857,143 $1,682,476,19030.0% $458,857,143 $917,714,286 $1,376,571,429 $1,835,428,57132.5% $497,095,238 $994,190,476 $1,491,285,714 $1,988,380,952
Additional transmission investment funding capable based upon total MW of Wind enabled by increasing class of wind captured by 2 classes ( 3 to 5 for example)

Base Case AssumptionMoving from East to West Increases
Capacity Factor by Around 50%
Ave Class 3 Capacity Factor
Annual MWH Produced Annual Costs Cost Savings
Additional Transmission Investment
30.0% 2,628 $297,49245.0% 3,942 $283,038 $14,454 $80,300
20,000 MW $1,606,000,000
Base Case is to Increase CF from 30% in Eastern Portions of SPP to 45% in Western Portions of SPP - Evaluate per MW rating of Wind Generation
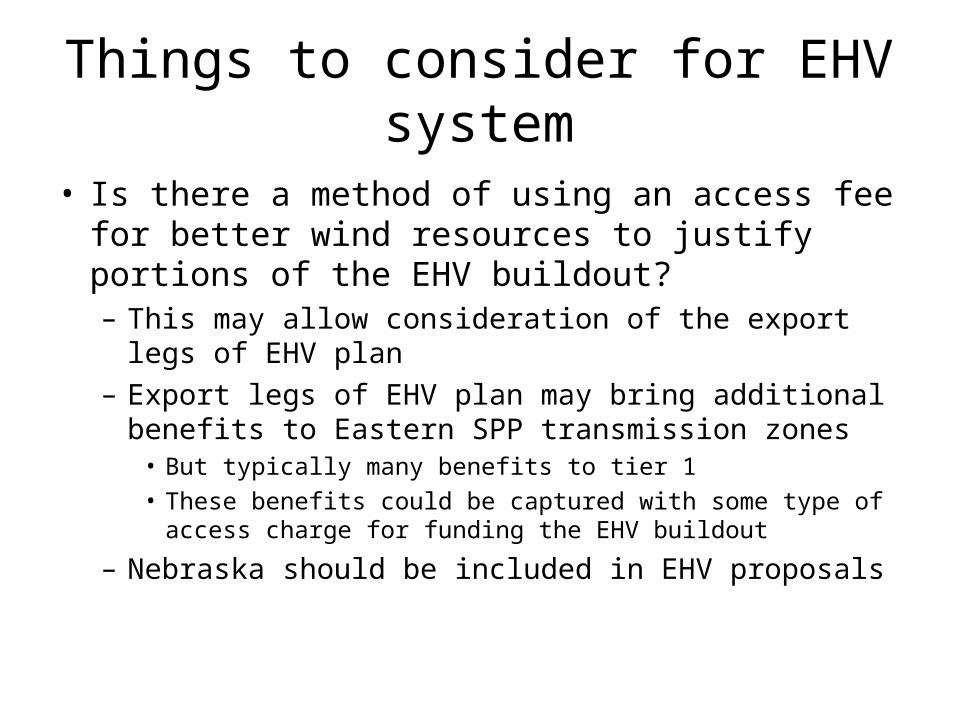
Things to consider for EHV system
• Is there a method of using an access fee for better wind resources to justify portions of the EHV buildout?– This may allow consideration of the export legs of
EHV plan – Export legs of EHV plan may bring additional benefits
to Eastern SPP transmission zones• But typically many benefits to tier 1 • These benefits could be captured with some type of access
charge for funding the EHV buildout
– Nebraska should be included in EHV proposals

Wind Access Fee
• Is there a way to charge a wind access fee that would be equitable for both regional customers and customers outside SPP?– For example could the wind access fee be a credit to
zones already paying an SPP regional EHV rate?– Could the export revenue be used to lower costs and
justify expansion?– Could “reservations” be used to justify EHV expansion
(such as an export capacity auction?)


