Evaluating the effect of periodic disinfectant type transitions on the corrosion rate of common distribution system metals
Angela B. Rodriguez, Steven J. Duranceau*University of Central Florida, 4000 Central Florida Blvd., P.O. Box: 162450, Orlando, FL 32816-2450, USA, Tel. +1 407 823 1440; Fax: +1 407 823 3315; email: [email protected] (S.J. Duranceau), Tel. +1 407 346 0997; email: [email protected] (A.B. Rodriguez)
Received 14 July 2019; Accepted 21 August 2019
a b s t r a c tAn investigation was conducted to determine the impact on copper, lead, and mild steel corrosion rates in two potable distribution systems wherein the disinfectant had been modified to either free chlorine or combined chlorine. Corrosion racks built of PVC pipe were installed at two different water system locations, programmed to simulate home diurnal water demand, and equipped with mild steel, copper, and lead solder coupon and probes. Daily linear polarization resistance (LPR) measurements were collected together with water quality analyses to evaluate the effect chang-ing disinfectant type had on corrosion rates. Corroded copper and lead solder coupons were sent for weight loss analysis post-study to corroborate the LPR findings, while the corroded mild steel coupons were analyzed using a scanning electron microscope (SEM) and energy-dispersive X-ray spectroscopy (EDX). The study found that changing disinfectant type had little to no effect on the corrosion rate of both copper and lead solder. In comparison, mild steel corrosion rates increased each time the disinfectant type was changed within both systems evaluated. For the free chlorine sys-tem, the corrosion rate of mild steel returned to normal once the disinfectant type was changed back to the baseline condition. For the chloramine system, the corrosion rate increase observed in mild steel was positively correlated to the amount of total chlorine residual in the water. Furthermore, there appeared to be a threshold total chlorine concentration for corrosion rates to return to baseline after the disinfectant type was returned to the baseline condition. SEM/EDX analysis of the tuber-culation layers formed on the surfaces of the mild steel coupons also indicated morphological and elemental differences between the two water systems evaluated. The results of this work revealed that additional investigation is required to better understand how corrosion layer films are affected by changing water quality, particularly with respect to chloramine systems that practice regular free chlorine maintenance cycles to control nitrification.
Corrosion is the result of electrochemical reactions within metal water pipes [1]. Theoretically modeled by electro-chemical cells, corrosion occurs when an electrolyte solution
creates a path for electrons to flow from the anode to the cathode. In electrochemical cells, the anode corrodes while the cathode is protected and the determinant for which metal becomes the anode and cathode is each metal’s nobility, measured by their voltage potential [2]. The metal with the
A.B. Rodriguez, S.J. Duranceau / Desalination and Water Treatment 170 (2019) 11–2312
smaller, or more negative, voltage potential is considered less noble, and thus becomes the anode in an electrochem-ical cell.
There are many different types of corrosion, each of which is categorized by the cause of the metal’s deteriora-tion (Fig. 1) [1]. In most potable water systems, corrosion can typically be found near dissimilar metal joints, anaer-obic/aerobic zones developed by particulate deposition or microbial growth, and sections of pipe that are used for electrical grounding purposes [2]. When corrosion is left unchecked, utilities can experience a wide range of com-plaints including: (1) stains on clothes and fixtures, (2) taste and odor issues, (3) pressure loss and hot water problems, and (4) elevated heavy metal content in tap water.
While most corrosion-related complaints are often con-sidered esthetic, elevated levels of heavy metals such as lead and copper can pose a significant threat to public health and welfare. For this reason, the Environmental Protection Agency (EPA) introduced The Lead & Copper Rule (LCR) in 1991 to reduce the public’s exposure to these metals via the water supply [3]. The LCR established action levels for lead and copper in water supplies, with the action level for lead set to 15 ppb and for copper set to 1.3 ppm [4].
While metal corrosion cannot be avoided, it can be con-trolled through various means. Some of the most common corrosion control pathways include: (1) careful selection of pipe and connection materials, (2) adequate buffering capacity and dissolved oxygen levels, (3) basic/alkaline pH levels, (4) reduce the growth of algae and fungi, and (5) corrosion inhibitor addition [1]. To maintain corrosion control efforts without significantly impacting water rates, it is important to determine which control pathway is opti-mal for a utility. To accomplish this, corrosion studies are typically conducted.
There are two types of corrosion studies, one uses the electrochemical technique and the other the gravimet-ric technique [2]. The electrochemical technique provides
instantaneous corrosion rates using metal probes connected to a data logger that measures linear polarization resistance (LPR) to determine corrosion in mils per year (mpy), or milli inch per year. The gravimetric technique, also known as the “cook and look method” calculates corrosion in mpy through pre- and post- weight analysis of a metal coupon. Regardless of the technique employed for the corrosion study, they are typically conducted in either a beaker setting or looped PVC pipe setting. Common water system metals, such as mild (carbon) steel, lead solder, and copper alloys are used in potable water corrosions studies. Along with corrosion rates, water quality parameters such as alkalinity, pH, sulfate, conductivity, and temperature are also typically monitored.
Recent studies have focused on pipeline (no disinfection) and distribution system (disinfected) corrosion mechanisms. Groundwater pipelines have displayed thin and hollow iron corrosion scales, while surface water pipelines have displayed thick and dense iron corrosion scales [5]. Batch reactor type corrosion studies have shown that monochlo-ramine disinfected water exhibits lower dissolved lead concentrations than free chlorine disinfected water, with the monochloramine corrosion pathway theorized to be the reaction between lead oxide and an intermediate monochlo-ramine decay species [6]. A similar study found that the concentration of dissolved iron decreased when the disin-fectant was changed from free chlorine to monochloramine [7]. The lower dissolved metal ion concentrations associated with monochloramine disinfection over free chlorine disin-fection are typically attributed to the lower redox potential of the monochloramine species. The lower redox potential slows down corrosion rates, but this also slows down the passivation of the metal surface via the formation of the corrosion scale. In general, the recent studies have shown that water quality changes can chemically destabilize estab-lished pipeline corrosion scales and cause both dissolved and particulate metal release into the water stream [8].
2. Project background
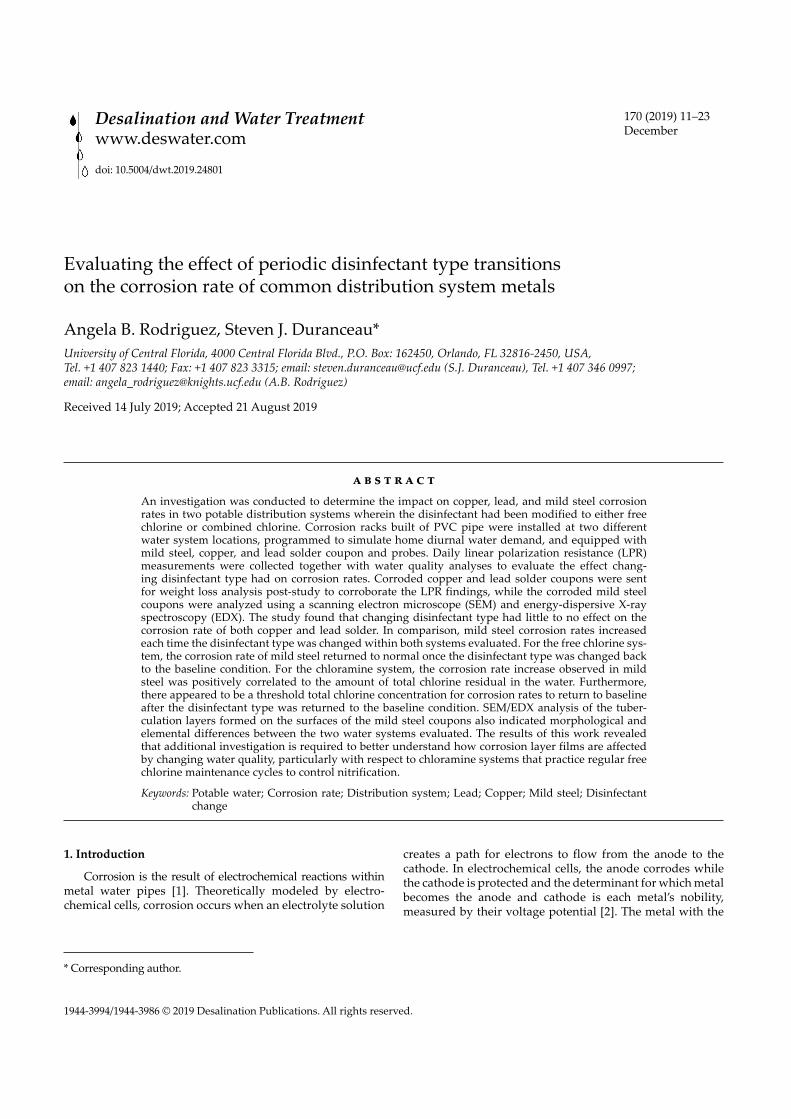
The University of Central Florida (UCF) has been work-ing with the county of Maui department of water supply (DWS) since 2012 on two interconnected water systems located on the slopes of Mount Haleakala (Fig. 2). The high-est elevation water system obtains its source water from the Waikaimoi rainforest watershed, treats the water at the Olinda water treatment plant (WTP), and distributes the produced drinking water through the Upper Kula system. The mid-elevation water system obtains its source water from the Pi’iholo forest watershed, treats the water at the Pi’iholo WTP, and distributes the produced drinking water through the Lower Kula system. These two systems exhibit different source and finished water quality, and the Upper Kula system is disinfected with chloramines while the Lower Kula system is disinfected with free chlorine.
The Waikamoi rainforest surface water supply can be characterized as a low alkalinity, high organic acid con-taining water. Typically, the raw water has a pH of approx-imately 5.4 pH units, a true color range between 55 and 90 color units, and approximately 3 mg/L as CaCO3 of alka-linity. The water is treated by the Olinda WTP, a 3.0 MGD Fig. 1. Types of corrosion.
13A.B. Rodriguez, S.J. Duranceau / Desalination and Water Treatment 170 (2019) 11–23
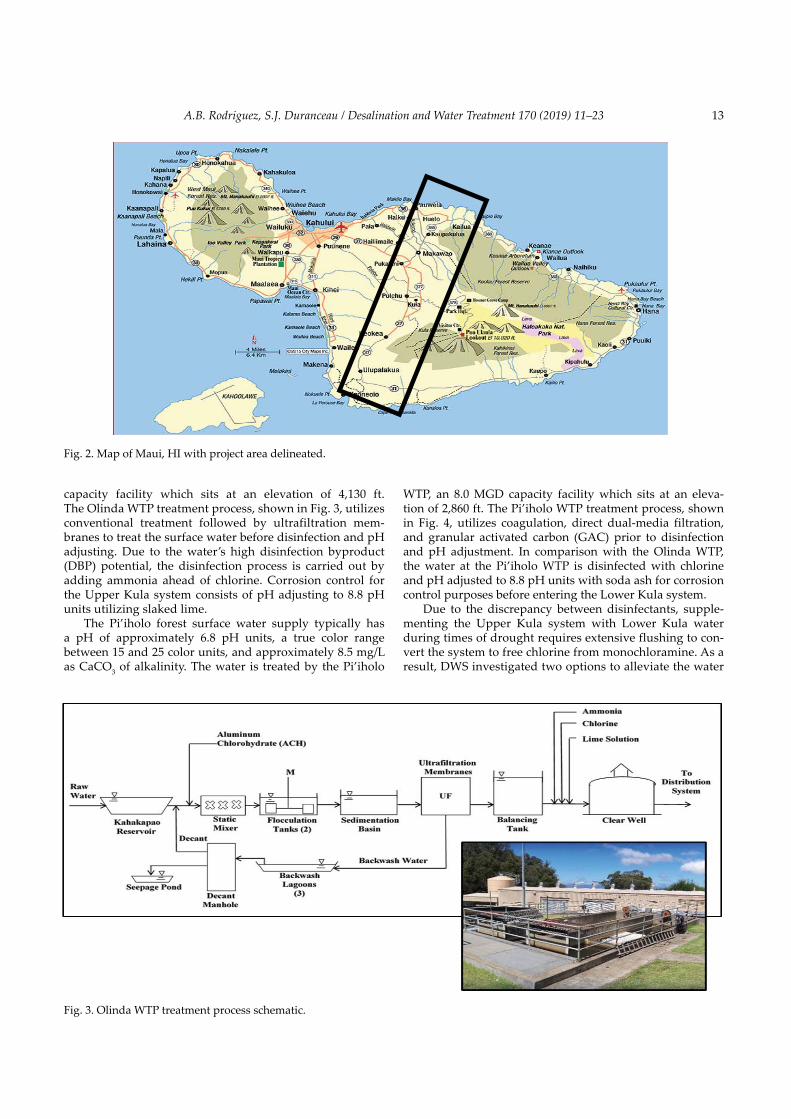
capacity facility which sits at an elevation of 4,130 ft. The Olinda WTP treatment process, shown in Fig. 3, utilizes conventional treatment followed by ultrafiltration mem-branes to treat the surface water before disinfection and pH adjusting. Due to the water’s high disinfection byproduct (DBP) potential, the disinfection process is carried out by adding ammonia ahead of chlorine. Corrosion control for the Upper Kula system consists of pH adjusting to 8.8 pH units utilizing slaked lime.
The Pi’iholo forest surface water supply typically has a pH of approximately 6.8 pH units, a true color range between 15 and 25 color units, and approximately 8.5 mg/L as CaCO3 of alkalinity. The water is treated by the Pi’iholo
WTP, an 8.0 MGD capacity facility which sits at an eleva-tion of 2,860 ft. The Pi’iholo WTP treatment process, shown in Fig. 4, utilizes coagulation, direct dual-media filtration, and granular activated carbon (GAC) prior to disinfection and pH adjustment. In comparison with the Olinda WTP, the water at the Pi’iholo WTP is disinfected with chlorine and pH adjusted to 8.8 pH units with soda ash for corrosion control purposes before entering the Lower Kula system.
Due to the discrepancy between disinfectants, supple-menting the Upper Kula system with Lower Kula water during times of drought requires extensive flushing to con-vert the system to free chlorine from monochloramine. As a result, DWS investigated two options to alleviate the water
Fig. 2. Map of Maui, HI with project area delineated.
Fig. 3. Olinda WTP treatment process schematic.
A.B. Rodriguez, S.J. Duranceau / Desalination and Water Treatment 170 (2019) 11–2314
sharing problem during drought: (1) find a cost-effective way to control DBP formation in the Upper Kula system and convert to free chlorine disinfection, or (2) implement a chloramination station along the line connecting both systems to turn chlorinated Lower Kula water being sent to Upper Kula to chloramines prior to blending. With this in mind, DWS decided to be proactive and investigate the potential corrosion control impacts of changing the Olinda WTP disinfectant to chlorine and/or creating a chloramina-tion station in the connection between Upper and Lower Kula. UCF was tasked by DWS with conducting a corrosion study for the Olinda WTP and the Lower Kula system to determine baseline corrosion rates, the effect of disinfectant type and pH adjustment chemical on corrosion rates, and identify possible effects the change could have on compli-ance with the LCR.
3. Materials and methods
Two corrosion racks were built to determine the effect on corrosion rates if Pi’iholo water was switched to chlora-mines from chlorine and if Olinda water was switched to chlorine from chloramines. The study was comprised of six general phases (Fig. 5) which included a baseline phase and stabilization phases in between experimental test con-ditions. The baseline phase, which is standard for UCF cor-rosions studies, aims at pre-corroding the metal coupons and probes prior to beginning the study to better simulate an aged distribution system. The stabilization phase in between experimental conditions were included to deter-mine whether changes in corrosion rates when water quality changed were reversible or irreversible.
Both corrosion racks were in operation 6 h/d, in 3 h blocks to simulate a home’s water demand. Thus, water in the corrosion racks was flowing from 6:00 AM to 9:00 AM and 1:30 PM to 4:30 PM, and the water was idle within the
racks the rest of the time. The three metals investigated were mild steel (C1010) to simulate water mains, cartridge brass (CDA230) to simulate home copper pipes, and a 50:50 tin/lead (50/50 tin/lead) mix to simulate lead solder. Both metal probes for the electrochemical method and metal coupons for the gravimetric method were incorporated into the study corrosion racks. Pictures of virgin mild steel (a), cartridge brass (b), and 50:50 tin/lead (c) probes, and their respective coupons (d) can be seen in Fig. 6.
The Olinda WTP corrosion rack (Fig. 7) was located within the Olinda WTP and used to investigate the effect on corrosion rates if the Olinda finished water was switched from chloramines to chlorine. The Harry Fields corrosion rack (Fig. 7) was located in the Lower Kula distribution sys-tem and used to investigate the effect on corrosion rates if the Pi’iholo finished water was switched from chlorine to chloramines. Each corrosion rack was equipped with total-izers, flowmeters, and an automatic water flow on/off timer.
For the Olinda corrosion rack, one vertical PVC loop for the coupons and one horizontal PVC loop for the probes was installed along with the chemical feed system. At the Harry Fields corrosion rack, the Olinda corrosion rack set-up was duplicated to obtain a control and test side, with the test side being equipped with a chemical feed system. In addition, the Harry Fields corrosion rack’s test side was equipped with a GAC system to remove free chlorine residual from the water. This was necessary to maintain proper ammonia to chlorine ratios when investigating the conversion from chlorine to chloramine as the residual at the distribution site was found to fluctuate daily by 1 mg/L. Due to site constraints, pH adjustment chemical corrosion rate impacts were determined using the computer modeling software.
The Olinda corrosion rack and Harry Fields corrosion rack were in operation from 5/17/17 to 7/30/18 and 7/26/17 to 7/26/18, respectively. During the study, daily LPR (using a data logger and the metal probes) and water quality
Fig. 4. Pi’iholo WTP treatment process schematic.
15A.B. Rodriguez, S.J. Duranceau / Desalination and Water Treatment 170 (2019) 11–23
measurements were obtained and recorded at each corro-sion rack. The water quality parameters that were monitored throughout the duration of the study included pH and dis-infectant residual concentrations, among others. Photos of the coupons and probes were taken at the beginning and
end of the corrosion study. The cartridge brass and 50:50 tin/lead coupons from both corrosion racks were sent to a com-mercial lab for cleaning and weight loss analysis (Metal Samples Co., Munford, Alabama, USA). The mild steel coupons from both corrosion racks were analyzed using a
Fig. 5. Corrosion study phases.
b
c
a d
Fig. 6. Virgin metal probes (left) and coupons (right).
Fig. 7. Olinda (left) & Harry Fields (right) corrosion racks.
A.B. Rodriguez, S.J. Duranceau / Desalination and Water Treatment 170 (2019) 11–2316
scanning electron microscope (SEM) with energy-disper-sive X-ray spectroscopy (EDX) to investigate the surface morphology and elemental characteristics of the developed corrosion layer (UCF Materials Characterization Facility, Orlando, Florida, USA). For the remainder of the paper, the cartridge brass coupons and probes will be referred to as copper and 50:50 tin/lead coupons and probes will be referred to as lead solder.
4. Results and discussion
The purpose of this corrosion study was to investigate the effect changing disinfectants had on distribution sys-tem metals. To achieve this goal, metal coupons and probes were subjected to both chlorine and chloramine disinfec-tant residual concentrations in cycles. For the Olinda WTP corrosion rack, the coupons and probes were acclimated to chloramine disinfection before going through periodic transitions to chlorine disinfection. For the Harry Fields corrosion rack, the coupons and probes were acclimated to chlorine disinfection before going through periodic transi-tions to chloramine disinfection.
Upon completion, photos of the coupons and probes at both corrosion racks were taken. As shown in Table 1, at both corrosion rack locations, mild steel coupons and probes formed significant tuberculation layers. In contrast, copper and lead solder coupons and probes formed little to no layer, with the exception of the Olinda WTP copper coupon and probe. Upon exposure of the copper coupons and probes to air, the metal did turn slightly green from the oxidation of the copper corrosion layer at both corrosion rack sites. In addition, the slight differences in the structure of the tuberculation layer in the mild steel coupon from the Olinda WTP corrosion rack and the mild steel coupons from the Harry Fields corrosion rack can be noticed in the pho-tos. Based on the results, the probable corrosion pathways for this study were pitting/crevice corrosion of copper and a mixture of tuberculation and microbe-induced corrosion of mild steel.
4.1. LPR findings
For the Olinda WTP corrosion rack, baseline corrosion rates were established after approximately 120 d for the three metals studied. In addition to the unusually long time for a baseline to develop, the unusual shape of the copper baseline corrosion rate curve is believed to be attributed to the high organic acid content of the Olinda WTP finished water. It is believed that an organic layer formed around the copper probe and insulated the metal initially from the water’s corrosivity. While this layer seems to have slowly been removed, it appears to have also aided in passivating the metal surface (along with common corrosion layer pro-cesses) to establish a baseline corrosion rate. This observa-tion has been noted by others, where natural organic matter has been shown to inhibit the growth of the passivating layers and rather promotes the formation of amorphous hydrated surface films [9,10]. Average baseline corrosion rates were calculated to be 1.5 mpy for mild steel, 0.3 mpy for copper, and 0.4 mpy for lead solder for the chloramine system.
In total, four conversions to free chlorine cycles were con-ducted throughout the study at the Olinda WTP corrosion rack. The free chlorine conversion cycles lasted on average 19 d each. The post-disinfectant conversion cycles baseline took approximately 95 d to be established. The baseline took longer than expected to establish because the excessive tuberculation on the mild steel probes caused faulty readings and required the probe to be cleaned.
Changing disinfectant did not cause a change in the measured corrosion rates for the copper and lead solder metal probes. In comparison, the mild steel probe measured corrosion rate at least doubled each time the disinfectant type was switched to chlorine. The increased mild steel cor-rosion rate seemed to always be at or below the total chlo-rine residual concentration measurements. Although the mild steel corrosion rate returned to baseline levels after each conversion back to chloramine, the last disinfectant change cycle found that the corrosion rate did not return to baseline after the probes were exposed to approximately 5 mg/L of total chlorine residual. A new mild steel baseline, approximately 2.5 times higher than the original baseline, seemed to be reached but cannot be confirmed as the exces-sive tuberculation on the probe was causing interference with the LPR readings. The mild steel probe was removed, cleaned, and re-inserted and the corrosion rate measured for several days and found that the corrosion rate returned to the original baseline rate. The LPR data for the Olinda WTP corrosion study can be found in Fig. 8 for mild steel and Fig. 9 for copper and lead solder.
For the Harry Fields corrosion rack, baseline corrosion rates were established after approximately 90 d for the three metals studied. In comparison with the Olinda WTP corro-sion rack results, a traditional shape for the copper base-line corrosion curve was observed. This was attributed to the lower organic acid content of the Pi’iholo WTP finished water. The mild steel baseline corrosion curve at the Harry Fields corrosion rack was found to be more erratic than the Olinda WTP corrosion rack. This behavior is thought to be related to the daily free chlorine residual concentration fluc-tuations at the Harry Fields site. Average baseline corrosion rates were calculated to be 1.8 mpy for mild steel, 0.4 mpy for copper, and 0.2 mpy for lead solder for the chlorine system.
In total, five conversions to monochloramine cycles were conducted throughout the study at the Harry Fields corro-sion rack. The monochloramine conversion cycles lasted on average 19 d each. The fifth monochloramine conversion cycle, which included soda ash addition, lasted approxi-mately 32 d. The post-disinfectant conversion cycles baseline took approximately 21 d to be established.
Changing disinfectant did not cause a change in the mea-sured corrosion rates for the copper and lead solder metal probes. In comparison, the mild steel probe measured corro-sion rate increased by approximately 0.45 mpy each time the disinfectant type was switched to chloramine. Although the measured mild steel corrosion rate increased when the dis-infectant was changed to chloramine, it returned to baseline levels after each conversion back to chlorine. The addition of soda to boost the pH to 8.8 during monochloramine conver-sion did not impact the increase in corrosion rate due to the change in disinfectant, nor the ability to return to baseline
17A.B. Rodriguez, S.J. Duranceau / Desalination and Water Treatment 170 (2019) 11–23
Table 1Corroded probes and coupons photographs
Corrosion Rack Metal Coupon Probe
Olinda WTP
Mild Steel
Copper
Lead Solder
Harry FieldsControl
Mild Steel
Copper
Lead Solder
Harry FieldsTest
MildSteel
Copper
Lead Solder
A.B. Rodriguez, S.J. Duranceau / Desalination and Water Treatment 170 (2019) 11–2318
corrosion rate level. Comparing the Harry Fields corrosion rack LPR data with the Olinda corrosion rack LPR data, on average, mild steel was 0.3 mpy higher, copper was 0.1 mpy higher, and lead solder was 0.2 mpy lower. The LPR data for the Harry Fields corrosion study can be found in Fig. 10 for mild steel and Fig. 11 for copper and lead solder.
4.2. Computer model findings
To complete the pH adjustment phase of the corrosion study, the RTW computer model (Tetra Tech, Pasadena, CA) was utilized. The model is used to calculate the Langelier saturation index (LSI) based on seven water quality parame-ters: pH, temperature, alkalinity, calcium concentration, chlo-ride concentration, sulfate concentration, and total dissolved
solids. A slightly positive LSI is desired as it means the right conditions exist for calcium carbonate to precipitate out of solution [2]. This precipitation is desired in water systems as it can form a passivating layer within a pipe and protects the material from corrosion. For corrosion control purposes, both negative LSI values and large positive LSI values are not desired [1].
Given the Olinda WTP finished water is already at pH 8.8, average Upper Kula water quality parameters were used to simulate chlorination station within the distribu-tion system for the Olinda WTP corrosion study. The RTW model found that to achieve a pH of 8.8 in the system, either 0.35 mg/L of soda ash or 0.12 mg/L of slaked lime could be added. The addition of either pH adjustment chemical only slightly improved the calculated LSI value (–1.08 to –0.90),
0
1
2
3
4
5
6
7
8
9
0 50 100 150 200 250 300 350 400 450
laudiseR tnatcefnisi
D & )yp
m( etaR noisorro
C(m
g/L)
Runtime (days)
Start Stop Free Cl2 Total Cl2 Monochloramine Mild Steel B
Fig. 8. Olinda mild steel LPR measurements.
Fig. 9. Olinda cartridge brass (left) and lead solder (right) LPR measurements.
19A.B. Rodriguez, S.J. Duranceau / Desalination and Water Treatment 170 (2019) 11–23
but still remained slightly negative and thus corrosive to metal components in the water system. For the Harry Fields corrosion study, average lower Kula water quality parame-ters were used to simulate a chloramination station within the distribution system. The RTW model found that to achieve a pH of 8.8 in the system, either 1.4 mg/L of soda ash or 0.49 mg/L of slaked lime could be added. The addition of either pH adjustment chemical only slightly improved the calculated LSI value (–1.31 to –0.87 and –1.31 to –0.81, respectively), but still remained slightly negative and thus corrosive to metal components in the water system. While the water in both systems is corrosive, the corrosion rack results found that copper and lead solder corrosion levels are low. The results from the modeling software indicate that further alkalinity adjustments for corrosion control are
not feasible for both water systems and alternative corrosion control methods should be explored to rein-in mild steel corrosion if desired.
4.3. Weight loss findings
The copper and lead solder coupons were sent to a com-mercial lab for weight loss and pitting analysis to corroborate the LPR findings. Corrosion rates in mpy can be calculated using metal coupons by factoring in weight loss, metal den-sity, surface area, exposure time, and a conversation factor. Weight loss analysis includes pre-clean and post-clean weigh-ing, comparison of the post-clean weight and virgin metal weight, and pitting analysis. The pre-clean and post-clean weighing results correlated with the findings from the
0
1
2
3
4
5
6
7
8
9
0 50 100 150 200 250 300 350 400 450
laudiseR tnatcefnisi
D & )yp
m( etaR noisorro
C(m
g/L)
Runtime (days)
Start Stop Free Cl2 Total Cl2 Monochloramine Mild Steel B
Fig. 10. Harry fields mild steel LPR measurements.
Fig. 11. Harry fields cartridge brass (left) and lead solder (right) LPR measurements.
A.B. Rodriguez, S.J. Duranceau / Desalination and Water Treatment 170 (2019) 11–2320
pictures that tuberculation was not found on the copper and lead solder coupons.
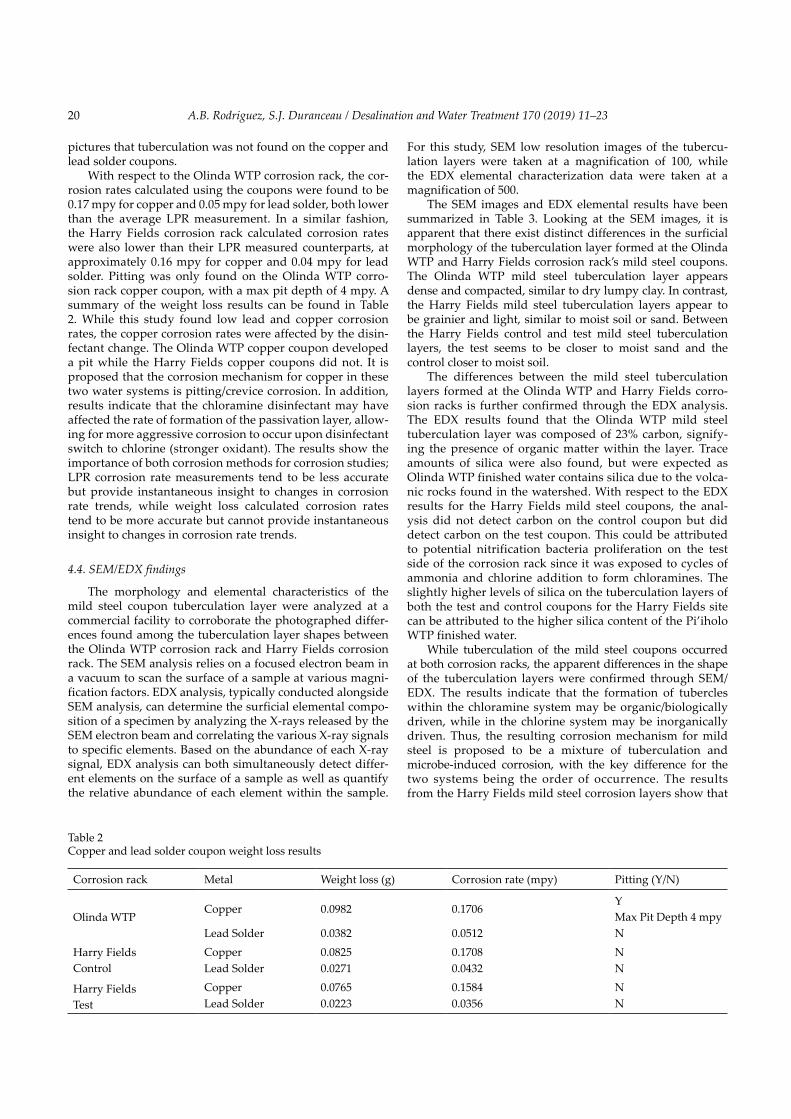
With respect to the Olinda WTP corrosion rack, the cor-rosion rates calculated using the coupons were found to be 0.17 mpy for copper and 0.05 mpy for lead solder, both lower than the average LPR measurement. In a similar fashion, the Harry Fields corrosion rack calculated corrosion rates were also lower than their LPR measured counterparts, at approximately 0.16 mpy for copper and 0.04 mpy for lead solder. Pitting was only found on the Olinda WTP corro-sion rack copper coupon, with a max pit depth of 4 mpy. A summary of the weight loss results can be found in Table 2. While this study found low lead and copper corrosion rates, the copper corrosion rates were affected by the disin-fectant change. The Olinda WTP copper coupon developed a pit while the Harry Fields copper coupons did not. It is proposed that the corrosion mechanism for copper in these two water systems is pitting/crevice corrosion. In addition, results indicate that the chloramine disinfectant may have affected the rate of formation of the passivation layer, allow-ing for more aggressive corrosion to occur upon disinfectant switch to chlorine (stronger oxidant). The results show the importance of both corrosion methods for corrosion studies; LPR corrosion rate measurements tend to be less accurate but provide instantaneous insight to changes in corrosion rate trends, while weight loss calculated corrosion rates tend to be more accurate but cannot provide instantaneous insight to changes in corrosion rate trends.
4.4. SEM/EDX findings
The morphology and elemental characteristics of the mild steel coupon tuberculation layer were analyzed at a commercial facility to corroborate the photographed differ-ences found among the tuberculation layer shapes between the Olinda WTP corrosion rack and Harry Fields corrosion rack. The SEM analysis relies on a focused electron beam in a vacuum to scan the surface of a sample at various magni-fication factors. EDX analysis, typically conducted alongside SEM analysis, can determine the surficial elemental compo-sition of a specimen by analyzing the X-rays released by the SEM electron beam and correlating the various X-ray signals to specific elements. Based on the abundance of each X-ray signal, EDX analysis can both simultaneously detect differ-ent elements on the surface of a sample as well as quantify the relative abundance of each element within the sample.
For this study, SEM low resolution images of the tubercu-lation layers were taken at a magnification of 100, while the EDX elemental characterization data were taken at a magnification of 500.
The SEM images and EDX elemental results have been summarized in Table 3. Looking at the SEM images, it is apparent that there exist distinct differences in the surficial morphology of the tuberculation layer formed at the Olinda WTP and Harry Fields corrosion rack’s mild steel coupons. The Olinda WTP mild steel tuberculation layer appears dense and compacted, similar to dry lumpy clay. In contrast, the Harry Fields mild steel tuberculation layers appear to be grainier and light, similar to moist soil or sand. Between the Harry Fields control and test mild steel tuberculation layers, the test seems to be closer to moist sand and the control closer to moist soil.
The differences between the mild steel tuberculation layers formed at the Olinda WTP and Harry Fields corro-sion racks is further confirmed through the EDX analysis. The EDX results found that the Olinda WTP mild steel tuberculation layer was composed of 23% carbon, signify-ing the presence of organic matter within the layer. Trace amounts of silica were also found, but were expected as Olinda WTP finished water contains silica due to the volca-nic rocks found in the watershed. With respect to the EDX results for the Harry Fields mild steel coupons, the anal-ysis did not detect carbon on the control coupon but did detect carbon on the test coupon. This could be attributed to potential nitrification bacteria proliferation on the test side of the corrosion rack since it was exposed to cycles of ammonia and chlorine addition to form chloramines. The slightly higher levels of silica on the tuberculation layers of both the test and control coupons for the Harry Fields site can be attributed to the higher silica content of the Pi’iholo WTP finished water.
While tuberculation of the mild steel coupons occurred at both corrosion racks, the apparent differences in the shape of the tuberculation layers were confirmed through SEM/EDX. The results indicate that the formation of tubercles within the chloramine system may be organic/biologically driven, while in the chlorine system may be inorganically driven. Thus, the resulting corrosion mechanism for mild steel is proposed to be a mixture of tuberculation and microbe-induced corrosion, with the key difference for the two systems being the order of occurrence. The results from the Harry Fields mild steel corrosion layers show that
Table 2Copper and lead solder coupon weight loss results
Corrosion rack Metal Weight loss (g) Corrosion rate (mpy) Pitting (Y/N)
Olinda WTPCopper 0.0982 0.1706
YMax Pit Depth 4 mpy
Lead Solder 0.0382 0.0512 N
Harry FieldsControl
Copper 0.0825 0.1708 NLead Solder 0.0271 0.0432 N
Harry FieldsTest
Copper 0.0765 0.1584 NLead Solder 0.0223 0.0356 N
21A.B. Rodriguez, S.J. Duranceau / Desalination and Water Treatment 170 (2019) 11–23
under a free chlorine environment, the primary mecha-nism is tuberculation (inorganic scale). Upon disinfectant switch, the previously mostly inorganic scale became influ-enced by microbe-induced corrosion due to the introduction of ammonia. Yet, since the original scale was primarily inor-ganic the resulting corrosion layer was a sturdy scale with porous areas “colonized” by biofilm proliferation. During
disinfectant switches, the increase in corrosion rates was hypothesized to be due to the microbe-induced corrosion as opposed to the tuberculation corrosion for this system.
In comparison, the Olinda WTP mild steep corrosion mechanism was primarily microbe-induced corrosion, which created a softer less porous corrosion scale. Although a sample was not obtained, it is theorized that the disinfectant
A.B. Rodriguez, S.J. Duranceau / Desalination and Water Treatment 170 (2019) 11–2322
swit ches to free chlorine would partially degrade the corro-sion scale formed, potentially creating pores and thus increas-ing the corrosion rate observed. In both cases, the respective layers usually reestablished themselves fairly quickly (corro-sion rates returned to baseline), and no increase in turbidity was measured throughout the test. Nevertheless, microbe- induced corrosion layers were found to be less resilient to disinfectant changes at maintaining a passivating scale on the metal surface to control corrosion (total chlorine exposure threshold of 5 mg/L).
5. Conclusion
Corrosion control is an important aspect of water treat-ment as it can lead to a plethora of complaints and even human health impacts if not properly addressed. Corrosion studies are a means for utilities to test corrosion control methods at a small scale to determine the optimal option for their specific needs. UCF conducted a corrosion study to determine the effect of disinfectant change on corro-sion rates of common distribution system metals within a chlorine and chloramine water system for DWS. Two corrosion racks were built to test the effect on corrosion rates for (1) metals acclimated to chlorine disinfection and changed to chloramines, (2) metals acclimated to chlora-mine disinfection and changed to chlorine, and (3) the abil-ity of alkalinity adjustment to mitigate possible changes to corrosion rates.
For the chloramine system (Olinda WTP corrosion study), average baseline measured corrosion rates were 1.5 mpy for mild steel, 0.3 mpy for copper, and 0.4 mpy for lead solder. Conversion to chlorine disinfection did not have an effect on copper and lead solder corrosion rates, but did increase the mild steel corrosion rate significantly. The increase in the mild steel corrosion rate under chlorine disinfection was positively correlated to the total chlorine residual con-centration. The threshold total chlorine residual concentra-tion past which mild steel corrosion rates did not return to baseline after switching back to chloramines was 5.0 mg/L as Cl2. In addition, the unusual copper baseline corrosion curve shape was theorized to be due to high organic acid content forming a protective layer on the metal surface. The weight-loss based calculated corrosion rates for the copper and lead solder coupons were found to be lower than the LPR mea-surements. The SEM/EDX analysis of the tuberculation layer on the mild steel coupon found that its structure and appear-ance could be attributed to organic/biological influences.
For the chlorine system (Harry Fields corrosion study), average baseline measured corrosion rates were 1.8 mpy for mild steel, 0.4 mpy for copper, and 0.2 mpy for lead solder. Conversion to chloramine disinfection did not have an effect on copper and lead solder corrosion rates, but did increase the mild steel corrosion rate by approxi-mately 0.45 mpy. The increase in the mild steel corrosion rate under chloramine disinfection was not permanent, and baseline corrosion rates were measured after each switch back to chlorine. This observation has been noted by others [11]. The weight-loss based calculated corrosion rates for the copper and lead solder coupons were found to be lower than the LPR measurements. The SEM/EDX analysis of the tuberculation layer on the control mild steel coupon found
that its structure and appearance could be attributed to inorganic influences, while the test mild steel coupon could have been biologically altered due to the introduction of ammonia and potential nitrification to that side of the cor-rosion rack.
The findings from this study not only shed light on the morphological and elemental differences of tuberculation layers from a chlorine and chloramine system but also elu-cidates the sensitivity of corrosion rates to changes in disin-fectant type. This is particularly important for chloramine systems which practice regular chlorine maintenance cycles to control nitrification in their distribution systems. As was shown in this study, sometimes a change in disinfectant type can cause a permanent and negative corrosion rate change, with the threshold parameter, for this case, being the total chlorine residual concentration the metal was exposed to.
Acknowledgements
This research would have not been possible without the support and commitment of the dedicated individuals and organizations involved. The authors would like to express our sincere gratitude to the County of Maui Department of Water Supply for funding this work (Project No. 16208168) through their consultant Brown & Caldwell. They would also like to gratefully acknowledge the assistance and efforts of the UCF Drinking Water Research Group, the Pi’iholo water treatment plant operations staff, the staff at Metals Samples Co., and Dr. Kirk Scammon and the team at the UCF Materials Characterization Facility. This mate-rial is based upon work supported by the National Science Foundation Graduate Research Fellowship under Grant No. 1144246. Any opinion, findings, and conclusions or rec-ommendations expressed in this material are those of the authors(s) and do not necessarily reflect the views of the National Science Foundation, nor of the funding agency supporting this work.
References[1] M. Schock, D. Lytle, “Internal Corrosion and Deposition
Control,” in Water Quality & Treatment: A Handbook on Drinking Water, 6th ed., J.K. Edzwald, Ed., New York, McGraw-Hill, 2011, pp. 20.1–20.83.
[2] J. Crittenden, R. Trussel, D. Hand, K. Howe, G. Tchobanoglous, “Internal Corrosion of Water Conduits,” in MWH Water Treatment Principles and Design, 3rd ed., Hoboken, John Wiley & Sons, Inc., 2012, pp. 1699–1803.
[3] USEPA, “Lead and Copper Rule,” 15 March 2017. [Online]. Available at: https://www.epa.gov/dwreginfo/lead-and-copper- rule.
[4] USEPA, “Lead and Copper Rule: A Quick Reference Guide,” 15 June 2008. [Online]. Available at: https://nepis.epa.gov/Exe/ZyPDF.cgi?Dockey=60001N8P.txt.
[5] F. Yang, B. Shi, J. Gu, D. Wang, M. Yang, Morphological and physicochemical characteristics of iron corrosion scales formed under different water source histories in a drinking water distribution system, Water Res., 46 (2012) 5423–5433.
[6] Y. Xie, D.E. Giammar, Effects of flow and water chemistry on lead release rates from pipe scales, Water Res., 45 (2011) 6525–6534.
[7] H. Wang, C. Hu, X. Hu, M. Yang, J. Qu, Effects of disinfectant and biofilm on the corrosion of cast iron pipes in a reclaimed water distribution system, Water Res., 46 (2012) 1070–1078.
23A.B. Rodriguez, S.J. Duranceau / Desalination and Water Treatment 170 (2019) 11–23
[8] G. Liu, Y. Zhang, W.-J. Knibbe, C. Feng, W. Liu, G. Medema, W. van der Meer, Potential impacts of changing supply-water quality on drinking water distribution: A review, Water Res., 116 (2017) 135–148.
[9] A. Broo, B. Berghult, T. Hedberg, Drinking water distribution - The effect of natural organic matter (NOM) on the corrosion of iron and copper, Water Sci. Technol., 40 (1999) 17–24.
[10] G. Korshin, J. Ferguson, A. Lancaster, Influence of natural organic matter on the corrosion of leaded brass in potable water, Corrosion Sci., 42 (2000) 53–66.
[11] M. LeChevallier, C. Lowry, R. Lee, G. Gibbon, Examining the relationship between iron corrosion and the disinfection of biofilm bacteria, J. AWWA, 85 (1993) 111–123.