Page 1
EVALUATINGTHEEFFECTSOFCOVERCROPSONNITROGENCYCLINGINTHE
CENTRALSANDS
by
KathrynAnneIvancic
Athesissubmittedinpartialfulfillmentof
therequirementsforthedegreeof
MasterofScience
SoilScienceandAgroecology
atthe
UNIVERSITYOFWISCONSIN-MADISON
2016
Page 3
Approvedby:
_________________________________
Dr.MatthewD.RuarkAssociateProfessor,DepartmentofSoilScience
Date:____________________________________
Page 5
i
AcknowledgementsIwouldliketothankmyadvisor,Dr.MatthewRuark,forhisdirectionand
commitmenttothisprojectandmygraduateschoollearningexperience.He
spenttirelesshoursteachingmehowtocriticallythinkaboutdata,write
scientifically,andpresentthisimportantresearchstorytotheworld.Iamso
appreciativeforhisguidance,pushingmeeverydaytobeabetterscientist.
Iwouldalsoliketothankmycommitteemembers,Drs.ErinSilvaand
FranciscoArriaga.Theirattentiontodetailanduniqueareasofexpertise
challengedmetolookbeyondthetraditionalscopeofmyresearch.Thankyouto
myprofessorsinSoilScience,Statistics,Agronomy,andAgroecologyforteaching
metheprinciplesofinterdisciplinaryscientificlearningandtoPeterCrumpfor
hisstatisticalexpertiseandguidance.Thankyoutomyamazinglabmatesand
especiallytoourlabscientist,JaimieWest,forherguidanceandbrainpower.
Also,withouttheamazingfieldcrew’sattentiontodetailandbrutestrengthin
bothyearsofthisstudy,Iwouldstillbecollectingandsortingdata.Thankyouto
MackNaber,CaraArgus,TeganMcgillivray,RyanCurtin,CodyCalkins,Calvin
Doiron,RitaArgus,LauraSchulz,MeganChawner,andJohnFrame.
Thankyou,mostofall,tomyfriendsandfamily.Theycontinuetobemy
biggestfansnomatterwhatnewchallengeIface.Theykeepmegroundedwith
comedicreliefandperspectivethroughoutthisentirelifejourney;Iamso
grateful.
Page 7
iii
TableofContentsAcknowledgements....................................................................................................................................................i
Chapter1:Introduction...........................................................................................................................................1
Chapter2:EvaluatingtheEffectofCoverCropsonSweetCornYield................................................6
Abstract.....................................................................................................................................................................6
Introduction.............................................................................................................................................................7
MaterialsandMethods.......................................................................................................................................9
ResultsandDiscussion....................................................................................................................................14
Conclusion.............................................................................................................................................................21
TablesandFigures.............................................................................................................................................24
SASCode.................................................................................................................................................................30
Bibliography.........................................................................................................................................................32
Chapter3:OatCoverCropGrowthandInfluenceonNetNitrogenMineralizationinSandySoil....................................................................................................................................................................35
Abstract..................................................................................................................................................................35
Introduction..........................................................................................................................................................36
MaterialsandMethods....................................................................................................................................38
Results.....................................................................................................................................................................46
Discussion..............................................................................................................................................................50
Conclusion.............................................................................................................................................................57
TablesandFigures.............................................................................................................................................60
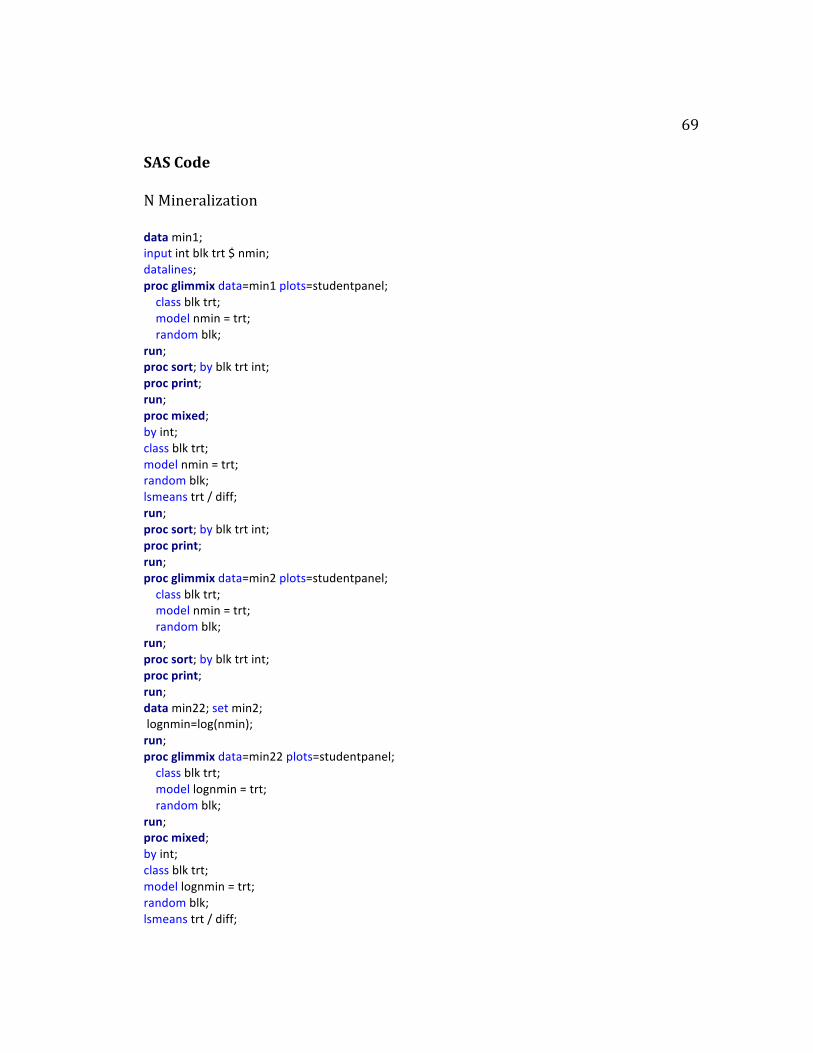
SASCode.................................................................................................................................................................69
Bibliography.........................................................................................................................................................73
Chapter4:OverallConclusionsandFutureWork....................................................................................79
Page 9
1Chapter1:Introduction
TheCentralSandsofWisconsinisoneoftheleadingvegetableproduction
centersintheU.S.Thestateisthehighestproducerofsnapbeansandthird
highestproducerofpotatoes,andalsorankedthirdforprocessingsweetcornin
theU.S.(WI2016AgriculturalStatistics).Theregion’ssandysoils,loworganic
matter,andclaycontentrequirepivotirrigationandnutrientinputsfor
productiveyields.Thiscombinationofporoussandysoilandhighinputscan
resultinnutrientleachingintolocalandnationalwaters.RecommendedNrates
foroptimalyieldproductioninsandysoilsinWisconsinis67kgNha-1forsnap
beans,280kgNha-1forpotatoes,and168kgNha-1forsweetcorn.
Recommendationsarenotuniformacrossstates,however,forexamplefor
optimalsweetcornproductioninMichiganthestaterecommendationis134kgN
ha-1andinMinnesotatherecommendationis146kgNha-1,botharelowerthan
Wisconsin’srecommendation(Warnckeetal.,2005;RosenandEliason,2005).
Agriculturalproductioncontributesatleast90%ofnitratecontamination
toWisconsin’sgroundwater(Shaw,1994)andnitratecontaminationhasbecome
thetopgroundwatercontaminantinthestate(WIgroundwaterCoordinating
Council,2015).Nitrate-Nisawater-solubleformofnitrogenthatisregulatedin
drinkingwaterat10mgL-1nitrate-NbytheU.S.EnvironmentalProtection
Agencyat(USEPA,1992).Nitratecontaminationismostdangerousforinfants,
Page 10
2whereinexposureover10mgL-1cancauseMethemoglobinemiaor“bluebaby
syndrome”,leadingtoareductioninthechild’sbloodoxygenlevels.Travelling
beyondregionalboundaries,nitratecontaminationisariskfornational
waterwaysaswell.
CentralSands’drainagefeedsintothesurfacewatersoftheMississippi
RiverBasin,impactingecosystemshundredsofmilesaway.Nitrogenloading
fromagriculturalproductionisestimatedtoprovideatleast65%ofthetotalN
contributingtooxygendepletionandhypoxicconditionsintheGulfofMexico
(Justicetal.1995;BurkartandJames1999;Goolsbyetal.1999).In2105the
hypoxiczoneintheGulfofMexicowasthesizeofConnecticutandRhodeIsland
combined(16,760squarekilometers),threetimeslargerthanthe2001approved
EPAtaskforcegoal(5,000squarekilometers)(LouisianaMarineConsortium,
2015).AsnitratecontaminationgrowsintheGulf,researchersworktoreduce
impactandoptimizenutrientmanagementpracticesinagriculturalsystems.
Biologicalcontrolofnutrientcyclingwithcovercropshasthepotentialto
reduceNrateandleachingwhilemaintainingoptimalyieldsinagricultural
systems.LeguminouscovercropscontainhighamountsofN,havelowC:N,and
releasefixedNquickly.Typicalreleaseof50%oflegumeNoccurswithinfour
weeksofterminationandreleasesoftherestbyapproximately10weeks(Stute
andPosner1995;LupwayiandSoon2015).ThisrelativelyquickreleaseofNcan
betakenupbythecropandreduceNrate.Additionally,legumecovercropscan
Page 11
3impactsoilmicroclimates,reducingsoilheatandmoisturestress(Thiessen
Martensetal.2001).Infine-texturedsoils,clayparticlesandorganicmatterbind
tosoilnitratemineralizedfromlegumecovercrops,reducingleachingpotential
(KraftandStites2003).Oncourse-texturedsandysoils,legumecovercropsare
notboundinthesoilprofileandhavegreaterpotentialforNlossbeyondtheroot
zonebeforecashcropuptake(Cherretal.,2006;Parretal.,2011).IntheCentral
Sands,Westetal.(2016)measurednoNcreditfromspringplantedfieldpea.
Alsoonasandysoil,Cherretal.(2006)documentednoreductioninoptimalN
rateafterthreedifferentlegumecovercrops.Speedydecompositionof
leguminouscovercropsdependsgreatlyonclimaticconditionsandcovercrop
nutrientcomposition;speciesselectionisspecifictoeachenvironment.
GrasscovercropshavehigherC:NandlowerNcontentthanlegumes,
requiringsoilNfordecomposition,potentiallycompetingwithcashcropN
uptakeandmineralizingmoreslowlythanlegumes(Snappetal.,2005;Kasparet
al.,2012).However,intheCentralSandsBundyandAndraski(2005)measured
sweetcornyieldbenefitandreductionineconomicoptimumNratefromfall
plantedryecovercrop.Similarly,Gentileetal.(2009)measuredachangeinN
transformationwiththecombineduseofNfertilizerandhighC:Norganic
residues.GrasscovercropsarealsousedforreductionofresidualsoilNleaching
followingcashcropharvest.Ameta-analysisofnon-leguminouscovercrop
studiesreporteda70%reductioninleachingpotentialwithgrasscovercrops
Page 12
4comparedtofallow(Tonittoetal.,2006).However,leachingreductionpotential
iscloselyrelatedtosoiltypeandbiomassproduction(Kasparetal.,2012).Inthe
CentralSandsgrasscovercropsaremostcommonlyusedtocombatwind
erosion,however,covercropvarietyandclimaticconditionshavepotentialto
altersoilNtransformations.
UnderstandingtherateatwhichcovercroporganicNmineralizesinto
plantavailablenitrogeniscriticalforoptimizingNefficiencyandminimizing
losses.Ntransformationsvaryaccordingtoenvironmentalconditions,microbial
community,moisturecontentandflow,soilmicroclimate,andmanagement
practicesthatarenotrepresentedinthelaboratorysetting(BinkleyandHart,
1989).Therefore,in-situNmineralizationmeasurementtechniquesarearguably
morereliablethanlaboratory.Variousin-situmethodshavebeenusedto
quantifyNtransformations,advancingwithtime.Eno(1960)usedburiedresin
bags,foramoreprecisetechniquethatcombinedburiedresinbagsandPVC
columns,DiStefanoandGholz(1986)andBryeetal.(2002)quantifiedsoil
volumeandwithmineralizationmeasurements.Gentileetal.(2009)usedthe15N
tracermethodtodocumentNimmobilizationincombined,highcarbonto
nitrogenratioorganicresiduesandmineralNfertilizertreatments.Inthisstudy
weusedamodifiedversionoftheburiedresinbaginPVCcolumnprocedureof
Bryeetal.(2002).Thismethodismorecosteffectivethanthe15Ntracermethod
andsoilcolumnvolumeallowsforfield-scalequantificationofmineralization.
Page 13
5ThroughquantificationofNmineralizationafteroatcovercropinsandysoilsand
sweetcornyieldimpactfollowingoatandlegumecovercrops,welearnofthe
potentialforbiologicalNcontrolthroughcovercroppingintheCentralSands
region.
Tofurtherunderstandcovercropimpactonsweetcornproductionthis
studyquantifiedmineralizationofspringplantedoatinsandysoilandevaluated
springplantedoatandlegumecovercroppotentialforsweetcornnitrogen
credit.Specificstudyobjectiveswereto:(i)quantifyspring-plantedcovercrop
growthandNuptake,(ii)determinetheeffectofoatcovercropandNfertilizer
onin-situN-mineralizationandseasonalPAN,(iii)determinetheeffectofspring
plantedcovercropsonsweetcornyield.
Page 14
6Chapter2:EvaluatingtheEffectofCoverCropsonSweetCornYield
Abstract
Spring-plantedcovercropsintheupperMidwesternUnitedStates(U.S.)
mayprovideanitrogenbenefittosubsequentsweetcorncropsinfieldswhere
latefall-harvestedcropslimittheuseoffall-plantedcovercrops.Theobjectives
ofthisstudyweretomeasurespring-plantedcovercropgrowthandnitrogen(N)
uptakeandsubsequenteffectonsweetcorn(ZeamaysL.)yield.Conductedacross
twogrowingseasonsattheUniversityofWisconsinHancockAgricultural
ResearchStationintheCentralSandsregionofWisconsin,theexperimental
designwasarandomizedcompleteblock,split-plotdesignwithfivecovercrop
whole-plottreatments(chicklingvetch(Viciavillosa),berseemclover(Trifolium
alexandrinum),oat(Avenasativa)+berseemclover,oat,andnocover)andsix
split–plotN-ratetreatments(0,56,112,168,224and280kg-Nha-1).Covercrop
biomassandNuptakevariedgreatlybetweenseasons,mostlikelydueto
differencesinaccumulationofgrowingdegreedaysinthespring.Inbothstudy
years,covercropsdidnotaffecttheagronomicoptimalNrate(AONR)forsweet
corn.Thesefindingssuggestthatregardlessofcovercropbiomassproduction,N
fromspring-plantedcovercropsisnotavailableforsweetcorncropuptakein
thisregiononitsirrigatedsandysoils.
Page 15
7Introduction
WisconsinisthethirdlargestsweetcornproducingstateintheU.S.
(Wisconsin2014AgriculturalStatistics),withthemajorityofthestate’ssweet
cornproductionproducedunderpivotirrigationinthesandysoilsoftheCentral
Sandregion.Inthisregion,therecommendednitrogenapplicationrateforsweet
cornproductionis168kgNha-1forirrigatedsandswithlessthan2%soil
organicmatter(LaboskiandPeters,2012).Thismanagementsystem,with
significantquantitiesofreadily-mineralizableNonhighlyleachingsoils,
contributes,atleastpartially,toelevatednitrateconcentrationsintheregion’s
groundwater(Kraftetal.,2003).Onsandysoils,covercropscanbeusedtoboth
reduceNleaching(Snappetal.,2005)andsupplyNtothecashcrop,allowingfor
thepotentialmitigationofNleachingfromthesesystemswhileretainingNfor
thecashcrop,loweringeconomicallyoptimalNratesinthesesystems(Bundy
andAndraski,2005).
Withcashcropsoccupyingfieldsforthemajorityofthegrowingseason,
covercropstendtobelimitedtograsses(typicallycerealrye(Secalecereale)or
oat)plantedinlatefalltominimizewinderosion.Infieldswherecashcropsare
notharvesteduntillateOctober,suchasfieldcorn(Zeamays)orsoybeans
(Glycinemax),farmersarelimitedtoplantingspring-seededcovercrops.Sweet
cornisa90-daycropandcanbeplantedfromearlyMaythroughearlyJuly.For
thesweetcornplantedlaterinthegrowingseason(JuneandJuly),thereisan
Page 16
8opportunityforaspring(MarchorApril)plantingofacovercrop,whichallows
adequatetimeforcovercropstoestablishandserveasasupplementalNsource
duetoeithersequestrationofexistingNsoilresourcesorfixationofatmospheric
Nbylegumes.
Pastresearchonnitrogenuptakeofcashcropsfollowingspring-planted
legumeandgrasscovercropsintheCentralSandshasreportedvaryingN
benefitsforsweetcornproducedfollowingcovercropintegration(Westetal.,
2016;AndraskiandBundy,2005).Investigatingthepotentialbenefitsoffieldpea
(Pisumsativum)asaspring-seededcovercropprecedingsweetcorninthe
CentralSands,Westetal.(2016)andJohnsonetal.(2012)determinednoto
minimalNbenefitfromfieldpeainthissystem.Incontrast,AndraskiandBundy
(2005)determinedanNcreditintwooutofthreefieldseasonsfromfall-planted
oatforfieldcornintheCentralSands.Therefore,basedonthesethreeregionally-
basedstudies,fall-plantedgrasscovercropsaremorelikelytoprovideanN
creditcomparedtospring-plantedlegumes.
Althoughtheaforementionedstudiesprovideabasistobegintoderive
covercroprecommendationsforthisregion,severalmanagementvariables
requirefurtherinvestigation.Beyondfieldpea,otherlegumecovercropshave
notbeentestedforpotentialbiomassproductionorNcontributiontothecash
cropproductionseason.Additionally,covercropterminationmethodsand
subsequenteffectsonNuptakebythecashcrophavenotbeenstudied.Westet
Page 17
9al.(2016)andJohnsonetal.(2012)bothterminatedthefieldpeacovercrop
throughmechanicaltillageand/orcultivation.Theseaggressivetermination
techniques,incorporatingresidueintothesoil,mayhavehastenedthe
mineralizationofNpresentinthecovercropbiomass.Thus,optimalcovercrop
managementpracticesforcroppingsystemsoftheCentralSandsremaintobe
determined,particularlyasrelatedtoselectionofspring-plantedspecies(grasses
andlegumes)andterminationmethod(chemicalversusmechanical).Thegoalof
thestudywastodeterminethenitrogencreditofspring-plantedgrassand
legumecovercropsforsweetcornonirrigatedsand.Specificstudyobjectives
wereto:(i)measurespring-plantedcovercropgrowthandNuptakeand(ii)
determinetheimpactofspringplantedcovercropsonsweetcornyield.
MaterialsandMethods
SiteDescriptionandExperimentalDesign
Atwo-yearstudywasconductedin2014and2015attheUniversityof
Wisconsin,HancockAgriculturalResearchStation(HARS)(latitude:44°8’23”N;
longitude:89°31’23”W;elevation:328m)onandoverhead-irrigatedPlainfield
loamysandsoil(mixed,mesicTypicUdipsamments).The2012fallsoiltestfor
the2014fieldindicated6.5pH,0.9%organicmatter(OM),89mgphosphorus(P)
kg-1,and66mgpotassium(K)kg-1.The2013fallsoiltestforthe2015field
indicated6.5pH,0.9%OM,121mgPkg-1,and85mgKkg-1.Theexperimental
designwasarandomizedcompleteblocksplit-plot,replicatedfourtimes.Whole
Page 18
10plottreatments(7.3mx27.4m)werespring-plantedoat(OAT),chicklingvetch
(CV),berseemclover(BC),oat+berseem(O+B)cloverandnocovercrop
(NONE).Splitplottreatments(4.6mx7.3m,sixcornrowswide)consistedof
urea-Nfertilizerapplications:0,56,112,168,224,and280kg-Nha-1.
Theexperimentin2014followedtwoyearsoffieldcornandinfall2013,
thefieldreceivedasingletillagepasswithaTurbo-Till®,(GreatPlains
Manufacturing,Inc.;Salina,Kansas)fieldcultivatorat20cmdepth.Inspring
2014,thefieldreceivedseedbedpreparationwiththreepassesoftheTurbo-
Till®,followedbyonepasswitha20cmBrillion™(LandollCorporation;
Marysville,Kansas)soilfinisher.Instudyyear2015,theexperimentfolloweda
soybean-potatorotation,withnotillageinfall2014.Covercropseedbed
preparationin2015consistedofonepasswiththeTurbo-Till®fieldcultivatorat
20cmdepthand112kgha-1potash(0-0-60).
CovercropwasdrillseededwiththeOliver-Superior No. 64® Grain Drill on21
April2014andon16April2015.Seedingrateswere134kgha-1foroat(variety
notstatedin2014,‘Saber’in2015),67kgha-1forchicklingvetch(‘ACGreenfix’),
13kgha-1forberseemclover(varietynotstatedin2014;‘Balady1’in2015),and
thecombinedtreatmentwas67kgha-1foroatand11kgha-1berseemclover.
Chicklingvetchwasinoculatedwith‘N-DureTM’(Verdesian;Cary,NorthCarolina)
andberseemwithNitragin®Gold(Novozymes;RiverFalls,Wisconsin).Cover
Page 19
11cropseedswereobtainedfromAlbertLeaSeed(AlbertLea,Minnesota)both
yearsofthestudy.
Covercropwasterminatedon10June2014withCreditExtra®(Nufarm
AmericasInc.;Alsip,Illinois;activeingredient(a.i.)2.3%glyphosate,mixedwith
nonionic80/20surfactant,andammoniumsulfate(AMS,21-0-0-24S,1.2Lha-1)).
Chicklingvetchplotswerealsotreatedwith2,4DAmine4,(LovelandProducts
Inc.;Greenley,Colorado,a.i.46.5%dimethylaminesaltof2,4-Dichloro-
phenoxyaceticacid)andParallel®PlusHerbicide(MakhteshimAganofNorth
America,Inc.;Raleigh,NorthCarolina,a.i.atrazine2-chloro-4-ethylamino-6-
isopropylamino-s-triazineandmetolachlor2-chloro-N-acetamide)on16June
2014.Chicklingvetchplotsreceivedtheirlastherbicidetreatmenton31July
2014ofLaudis®(BayerCropScienceLP;ResearchTrianglePark,NorthCarolina,
a.i.34.5%tembotrione2-cyclohexanedionemixedwithAMSandmethylated
seedoil)on31July2014.Inthe2015season,allcovercropswereterminated12
June2015withanapplicationofMadDogPlus®(LovelandProductsInc.;
Greenley,Colorado,a.i.41%glyphosatemixedwith,nonionic80/20surfactant,
andAMS).TheoatcovercropstandrequiredsurfacecultivationwithanM&W®
10'Dyna-Drive®(AlamoGroupInc.;Seguin,TX)on16June2015andasecond
herbicideapplication[Parallel®(Atrazine)(1.6Lha-1)]on19June2015for
completecovercroptermination.
Page 20
12
Sweetcorn(‘DMC21-84’,DelMonteFoodsHybridYellowSweetCorn
Seed)wasplantedon13June2014and19June2015withaJohnDeereMax
EmergeTM(Deere&Company;Olathe,Kansas)2four-rowplanterataseeding
densityof24,500plantsha-1.Sixrowswereplantedperplotat28.5cmrow
spacingandstarterfertilizer(10-20-20-4S-2Ca+micronutrients)wasappliedat
planting(224kgha-1).Urea-Nfertilizerwashandappliedat56kg-Nha-1during
theV4sweetcorngrowthstageand56kg-Nha-1,112kgha-1,168kg-Nha-1,and
224kg-Nha-1attheV8growthstage.Fertilizerwasirrigatedwithin24hoursof
applicationin2014andonthesamedayofapplicationin2015.Irrigation,
insecticide,andherbicidewereappliedtothesweetcornasneeded.
SampleCollectionandAnalysis
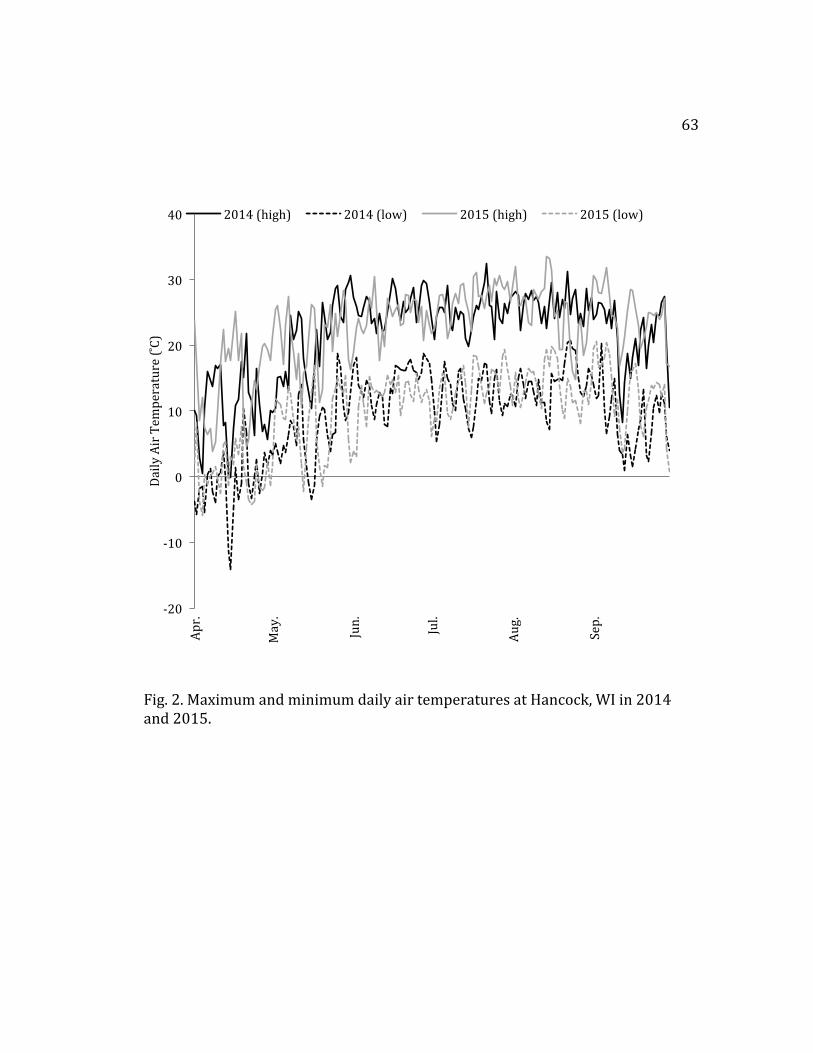
Precipitationanddailyairtemperatures(maximumandminimum)
measurementswererecordedatHARS(HancockResearchStation-UWExtension
AGWeather)andwereusedtocalculategrowingdegreedayaccumulationfor
boththecovercropandsweetcorngrowingseasonsandwerecalculatedas:
GrowingDegreeDays°C(GDD)=[(T°C(DailyMAX)+T°C(DailyMIN))/2]/TBASE
Whereifthedailymaximumtemperature>30°wassetequalto30°andifthe
dailyminimumtemperature<10°wassetequalto10°.TBASEisthebase
temperaturefortheorganism,wheresweetcornTBASE=10°andoatTBASE=5.5°.
Covercropstandcountsandabovegroundbiomass(AGB)werecollected
on10June2014and19June2015,withthreesamplescollectedperwholeplot
Page 21
13froma0.37m2areain2014anda0.14m2areain2015.Covercropbiomass
samplesweredriedina60°Cforced-airdryerforoneweek,mechanicallyground
usinga0.5mmsieve,andstoredinplasticvialsuntilanalysis.Nitrogencontentof
covercropbiomasswasdeterminedbyre-dryingsamplesforatleast24hours
priortoanalysis,withtotalcarbon(C)andtotalnitrogendeterminedusingflash
combustion(ThermoFisherScientificFlashEA1112NCAnalyzer,ThermoFisher
ScientificInc.,Waltham,MA).Sweetcornwasharvestedatmaturity(90DAPin
2014and89DAPin2015)on11September2014and11September2015.Yield
wasdeterminedasbothfreshweightyield(Mgha-1)andearyield(asthousand
earsperhectare)byharvestingmarketableearsinrowsthreeandfourofeach
six-rowplot.Earswerecountedandimmediatelyweighed(unhusked)inthefield
forfreshweightyieldcalculation.
StatisticalAnalysis
StatisticalanalysiswascompletedusingSAS(StatisticalAnalysisSystem,
version9.2,SASInstitute,Cary,NC).Covercropbiomass,Cyield,Nyield,andC:N
ratiowereanalyzedbyyearusingProcMIXED,withblocksasarandomeffect.
Forsweetcornyields,eachstudyyearwasevaluatedseparatelyandanalysisof
variance(ANOVA)wasconductedtodeterminesignificanteffectsofcovercrop
andN-rate(ProcMIXED)withblocks(covercroptreatment)asrandomeffects.
TodetermineagronomicoptimalNrate(AONR)bycovercroptreatmentbyyear
Nresponsedatawerefittolinear,linear-plateau,quadratic,andquadratic-
Page 22
14plateauusingProcREGandProcNLIN.TheNrateresponsedatawerevisually
inspectedandthemodelwiththelargestcoefficientofdetermination(R2)value
wasreported.TheAONRistheminimumrecommendedNratenecessaryto
achievethemaximumyield.
ResultsandDiscussion
Covercrops
Themonthlyairtemperaturesduringthe2014covercropgrowingseason
were1to3˚Cabove30-yearnormaltemperatures(citationfor30-yraverage?)
averaging5˚C(1˚Cabovethe30-yearnormal)inApril,14˚C(3˚Cabovethe30-
yearnormal)inMay,and20˚C(2˚Cabovethe30-yearnormal)inJune.Cover
cropswerenotirrigatedandtotalprecipitationwas196mmfromcovercrop
seedingtoterminationin2014.
In2015,themonthlytemperaturesduringtheoatgrowingseasonwereat
or4˚Cabove30-yearnormaltemperatures,averaging8˚CinApril(atthe30-year
normal),15˚C(4˚Cabovethe30-yearnormal)inMay,and18˚C(4˚Cabovethe
30-yearnormal)inJune.CovercropGDDwerehigherin2015comparedto2014;
however,thedifferencebetweenyearlyGDDnarrowedbycovercrop
termination.Totalprecipitationthroughoutthe2015oatgrowingseasonwas
191mm.
Covercropgrowth,biomassproduction,andNuptakevariedgreatly
betweenseasons,withmorebiomassandNuptakemeasuredin2015.Compared
Page 23
15to2014,legumecovercrop(berseemcloverandchicklingvetch)AGBwas12-14
timesgreaterin2015.The2014chicklingvetchproduction(258kgha-1,12kgN
ha-1)wasbelowtheexpectedAGBandwithinexpectedN-uptakerange(339to
4000kgha-1and6to161kgNha-1)(ThiessenMartenetal.,2001;Boumanetal.,
1993;Buechietal.,2015;Rinnofneretal.,2008),whileproductionin2015(3717
kgha-1,134kgNha-1)wasclosetothegreatestvaluespreviouslyreported.The
C:Nratiosofchicklingvetchweresimilarbothyearsofthisstudy(9in2014and
12in2015)andtopreviouslyreportedvalues(Buechietal.,2015;Rinnofneret
al.,2008).BerseemcloverAGBproductionandNuptakein2014(71kgha-1and
3kgNha-1)waslowerthanmeasuredberseemandothercloverspeciesinthe
literature(500to200kgha-1)(Fakharietal.2015;Parretal.2011;Readetal.
2011).BerseemcloverAGBproductionin2015(891kgha-1)andC:N(17)were
withintherangeofvaluesreportedinotherpublishedstudies;howeverNuptake
waslowerthanexpected(20kgNha-1)(Fakharietal.2015;Marstorpand
Kirchmann,1991;Parretal.2011;Readetal.2011;Snappetal.2005).Berseem
clover’spoorbiomassproductionandN-uptakeinbothgrowingseasonssuggests
thatAprilthroughMayplantingdatescouplewithaJuneterminationdatemay
notallowfortheadequategrowthintheCentralSandsregionofWisconsin.
Oatandcombinedoat/berseemcloverproduction,alsovariedgreatly
betweenseasons.OatAGBin2014(272kgha-1)was21timeslowercomparedto
2015(5824kgha-1)(Table1)andcombinedtreatment(oat+berseemclover)
Page 24
16AGBwas17timesgreaterthan2015.Oatbiomassinboth2014and2015was
withinrangeofotherstudiesintheregion,from7to91kgNha-1andC:N
between15and33(AndraskiandBundy,2005;Contrera-GoveaandAlbrecht,
2005).Tovaryingmagnitudes,oatAGBvariabilityhasbeendocumentedinother
upperMidwesterncroppingstudies.InaWisconsin-basedstudy,Andraskiand
Bundy(2005)noted5-folddifferencesinoatbiomass(590kgha-1to3010kgha-
1)betweenyearsfortheirfallplantedandwinterkilledcovercrop.Alsoin
Wisconsin,Contreras-GoveaandAlbrecht(2005)measuredspring-plantedoat
biomasswithameanweightof7700kgha-1following77daysofgrowth(mid-
ApriltolateOctober).Pro-rated,thisvaluescorrespondswiththebiomass
accumulationduringthe2015fieldseasonofthisstudy(100kgAGBha-1day-1).
Combinedoatandberseemclovertreatmentinboth2014and2015had
thegreatestAGB(333kgha-1in2014and5864kgha-1in2015)andNuptake(9
kgNha-1in2014and140kgNha-1in2015)ofallcovercrops,fallingwithinthe
rangeofreportedvaluesforcombinedgrassandlegumeAGBmeasurementsin
publishedliterature(177to6175kgha-1and60kgNha-1to115kgNha-1)(T.
Rinnofneretal.2008;Parretal.2011).
Sweetcorn
Meanmonthlyairtemperaturesduringthe2014sweetcorngrowing
seasondeviatedfrom-5to2°Caroundthe30-yearnormaltemperatures,
averaging20°CinJune(2°Cabovethe30-yearnormal),19°CinJuly(1°Cbelow
Page 25
17the30-yearnormal),20°CinAugust(2°Cbelowthe30-yearnormal),and15°Cin
August(5°Cbelowthe30-yearnormal).GDDwerehigherthanthosein2015,
accumulating891GDDin2014.Totalaccumulatedwater(precipitation272mm
+irrigation276mm)throughoutthesweetcorngrowingseasonwas548mm.
Inthe2015sweetcorngrowingseasonmeanmonthlyairtemperatures
deviated-3to1°Caroundthe30-yearnormaltemperatures,averaging18°Cin
June(atthe30-yearnormal),21°CinJuly(1°Cabovethe30-yearnormal),19°C
inAugust(3°Cbelowthe30-yearnormal),and18°CinAugust(2°Cbelowthe30-
yearnormal).TotalaccumulatedGDDwere845in2015andtotalaccumulated
water(precipitation264mm+irrigation256mm)throughoutthe2015sweet
corngrowingseasonwas519mm.
Sweetcornyieldswereevaluatedseparatelybetweenearyield(1000ear
ha-1)andfreshweightyield(Mgha-1)inboth2014and2015andwere
standardizedtothesameplantdensity(9,720plantsha-1)).Analysisofvariance
showsthatappliednitrogenratesignificantlyimpactedsweetcornyieldinboth
2014and2015(p<0.05).Therewasaninteractioneffectbetweencovercrop
treatmentandNrateinstudyyear2014(p<0.05)(Table2).
In2014,sweetcornearyieldresponsestoincreasingNapplicationson
BC,CV,andNONEtreatmentswerequadratic(Figure1),withAONRsatornear
thehighestNrateusedinthisstudy(280kgNha-1).Sweetcornearyield
responsesin2014toOATandO+Bwerelinear(Figure2).Inthesameyear,
Page 26
18sweetcornfreshweightyieldresponsestoalltreatmentswerelinear,butwith
CVandNONEplateauingatNratesof171and148kgNha-1(Figures1&2).In
2015,sweetcornearyieldresponsestoallcovercroptreatmentswerequadratic,
withAONRsof215,216,221,259,and269kgNha-1forNONE,OAT,OAT+B,CV,
andBC,respectively(Figures3&4).Sweetcornfreshweightyieldresponsesto
Nin2015werelinearto121,136,138,and138kgNha-1forNONE,OAT,OAT+B,
andBC,respectively.SweetcornfreshweightyieldresponsetoNfollowingCVin
2015wasquadratic(AONR=280kgNha-1)(Figure3).Inboth2014and2015,
regardlessofbiomassaccumulationdifferences,neitheryearsawanNcredit
fromthecovercropandN-ratetreatments.Inbothstudyyears,eachtreatment
combinationhadahigherAONRascomparedtothecontrol;therefore,
mineralizedNfromthecovercropsdidnotaffectsweetcornyieldregardlessofN
rate.Inspiteofcovercropseasonalproductiondifferences,covercropsdidnot
provideanitrogenbenefitforsweetcornyield.
Yieldresponsetocovercropsinbothyearshadacoefficientof
determination(R2)above0.5exceptforthe2014chicklingvetchtreatment(ear
yieldR2=0.39andfreshweightyieldR2=0.66),whichwascausedbyhigher
sweetcornyieldin0kgNha-1treatmentsacrossallblocks,comparedto56kgN
ha-1.In2014,chicklingvetchrequiredtwoadditionalherbicideapplicationsafter
sweetcornplanting;thisextrabiomassaccumulationwasnotmeasuredthough
itispossiblethatitcompetedwithsweetcorngrowthorcontributedtoan
Page 27
19unmeasuredinteractionthatreducedyields.Inordertodetermineamore
realisticagronomicoptimalNrateandastrongerrelationshipbetweenchickling
vetchtreatmentandyieldresponse,regressionanalysiswascompletedasecond
time,removing0kgNha-1datapointsfromtheanalysis.Quadratic(R2=0.92)
andlinear-plateau(R2=0.93)modelswerefittothefreshweightyielddataand
adjustedagronomicoptimalNratesof217kgNha-1(freshweightyield=13Mg
ha-1)and77kgNha-1(freshweightyield=11Mgha-1)weredetermined.Sweet
cornearyielddatawith0kgNha-1datapointsremovedwasalsofittoquadratic
(R2=0.83)andlinear-plateau(R2=0.82)models,determiningadjusted
agronomicoptimalNratesof226kgNha-1(earyield=49,000earsha-1)and126
kgNha-1(earyield=45,000earsha-1).Uponremovalofthe0-Ndatapoints,the
newlyadjusted2014chicklingvetchagronomicoptimalNratesfluctuatedabove
andbelowthenocovertreatments’(AONR=148kgNha-1at10Mgha-1fresh
weightyieldandAONR=279kgNha-1at44,000earsha-1).Agronomicoptimum
Nrateforfreshweightyielddeterminedbylinear-plateauregressionwaslower
thanthecontrol,howeverwithsimilarR2valuesquadraticregressionofthesame
datadeterminedagreateragronomicoptimalNrate.Regardingregressionofthe
earyielddata,bothregressionmodelsdeterminedloweragronomicoptimumN
ratevaluesthanthecontrol.ThisinconsistencyinagronomicoptimumNrate
acrossregressionanalysiscouldbeattributedtothevariablemeanvaluesforN-
rates168kgNha-1(12Mgha-1&48,000earsha-1),224kgNha-1(11Mgha-1&
Page 28
2038,000earsha-1),and280kgNha-1(12Mgha-1&50,000earsha-1)inthe2014
chicklingvetchtreatment.Variabilityinthe2014chicklingvetchdatasetis
responsibleforlowR2values(quadraticregression)andispotentiallybetter
describedbyhigherorderpolynomialregression(fourthorderR2=0.99&AONR
=151kgNha-1),accountingforthedataset’sabnormalpeaksandvalleys.
Thesefindingsareconsistentwithpreviousworkcomparingsweetcorn
yieldbenefitofleguminouscovercropsinsandysoils.Johnsonetal.(2012)
measuredminimalNbenefitfromspring-plantedfieldpeacovercropinthe
CentralSandsandWestetal.(2016)reportednonitrogencreditfromspring-
plantedfieldpeaalsointheCentralSands.Inthewarm-temperateenvironment
ofFlorida,Cherretal.(2007)documentednosweetcornyieldbenefitfromfall-
plantedwhitevetchinsandysoil.Parretal.(2011)alsodeterminednoNcredit
fromlegumes(berseemclover,redclover,orcrimsonclover)onsandysoilsof
NorthCarolina.Thus,ourfindingsagreewithotherstudiesonleguminouscover
crops,suggestingrapidmineralizationinsandysoilandsubsequentleachingof
plantavailableNbeyondtherootzonepreventNbenefittosweetcorncrop.
WedidnotdetermineanNcreditwithoatcovercrop,buthigheryields
wereobtainedathigherNratescomparedtonocovercropTheNbenefitsof
grasscovercropsandcombinedgrass+legumecovercroptreatmentsarenot
clearlydefinedintheliterature.AndraskiandBundy(2005)measureda
reductionineconomicoptimumNrateintwooutofthreestudyyearsfollowing
Page 29
21fall-plantedoatcovercropinsandysoil.Alsoinsandysoils,Parretal.(2011)
measurednoNbenefitofcombinedgrassandlegumebiculturecovercrop
treatments;howeverSainjuetal.(2005)didmeasureanNbenefitfrombiculture
acovercroptreatmenttothesubsequentcrop.Onasiltloam,Stuteetal.(1995)
documentedanNbenefitfromanoat/legume-cornrotation.Thus,priorstudies
donotclearlycorroborateourfindings:thatspring-plantedoatcovercrop
providedzeroN-credittothesubsequentsweetcorncrop,butdidprovideayield
benefitathigherN-rates.
Conclusion
Legumeandgrassspring-plantedcovercroptreatmentsdidnotreduce
optimalNrateforsweetcornproductioninsandysoil,regardlessofbiomass
producedduringthecovercropgrowingseason.However,slightgainsinsweet
cornyieldwereobtainedfollowingacovercropathigherratesofappliedN.
Berseemclover,asasinglespeciesorpartofacovercropmix,isnot
recommendedasacovercropinthissystembecauseoflowproductivity.
Chicklingvetchmayalsobeproblematicwhengrownasaspring-sowncover
cropintheCentralSands,asterminationrequiredadditionalchemical
applicationsormechanicaltillageascomparedtotheothercovercropstrialed.
Theexisting,underlyingconcernoffarmersregardingtheintegrationofspring-
seededcovercropsintothecroppingsystemsoftheCentralSandswasrealizedin
in2014,wherecovercropgrowthwasslowandlittlebiomasswasproduced.Itis
Page 30
22notclearthatgrowerswillbeabletoobtainaconsistentcovercropwhenspring
seedinginthisregion.
Whilethisstudyfocusedontheroleofspring-seededcovercropson
nitrogenavailabilitytothesubsequentcashcrop,italsoprovidesgreater
understandingofthebroaderimpactsofcovercropsplantedinthisregionfor
otherecosystemservices,specificallymitigationoftheimpactsofwinderosion.If
possiblewithintheseasonconstraintsofthetypicalcroprotationsinCentral
Wisconsin,farmerswillestablishfallplantedcovercrops,oftencerealrye,infield
cornandsoybean,allowingforadequatecovertoreliablycontrolwinderosionin
thespring.Concernsexistthathigheramountsofbiomassfromagrasscover
cropmayleadtoareductioninavailableNtothesubsequentcashcrops.
However,thisstudydemonstratedthatlargeamountsofbiomassfromagrass
covercropinthespringdisplayednonegativeeffectsonyieldoroptimumNrate.
Thus,theuseofcovercropsintegratingthemultifunctionalstrategyofa
conservationmanagementpracticewillnotaffectproductionofsweetcornin
thisregion.ThefutureofNmanagementresearchinthesesystemsshouldfocus
onimprovednitrogenuseefficiencythroughin-seasonNapplication,working
towardsoptimalNratereductions.
Page 32
24TablesandFigures
TABLE1CovercropdrymatterbiomassandnitrogenuptakeatHancockAgriculturalResearchStationin2014and2015.Covercropsabbreviationsare:BC=berseemclover,CV=chicklingvetch,O+B=oatandberseemclover,andOAT=oat.
2014 2015
CoverCrop
PlantPop.a Biomass Total
CTotalN C:N Plant
Pop. Biomass TotalC
TotalN C:N
1000plantsha-1
kgha-1 kgCha-1
kgNha-1 %
1000plantsha-1
kgha-1 kgCha-1
kgNha-1 %
BC 1,050 71
(17)b31(8)
3(0.8)
11(0.6) 3,250 891
(678)353(273)
20(16)
17(1.4)
CV 260 258
(82)108(96)
12(3)
9(0.3) 2,090 3717
(850)1567(369)
134(24)
12(0.6)
O+B
1,920(O)970(B)
333(85)
137(36) 9(3) 15
(1.2)
8,820(O)3,070(B)
5864(1842)
2430(774)
140(59)
18(3)
OAT 4,690 272
(40)112(14)
6(0.6)
18(0.7) 13,310 5824
(845)2419(331)
119(30)
20(4)
aTargetplantpopulationwas4,409,000plantsha-1forBC,3,274,000plantsha-1forCV,2,015,000+3,674,000plantsha-1forO+Brespectively,and4,030,000plantsha-1forOAT.bNumberinparenthesisindicatesstandarddeviation.
Page 33
25TABLE2SweetcornfreshyieldANOVAresultsasaffectedbycovercropandNrateatHancockAgriculturalResearchStationin2014and2015.Analysisconductedbyyear. MeanYield
2014 2015
Treatment Mgha-1 1000Earsha-1 Mgha-1 1000Earsha-1CoverCrop BerseemClover 7.45a 30.9a 14.7a 46.0aChicklingVetch 8.47a 35.3a 15.7a 47.1aOat+BerseemClover 6.77a 30.0a 14.3a 44.4aOat 5.48a 25.6a 14.1a 47.0aNoCover 6.36a 26.5a 13.2a 43.0aNrate,kgha-1 0 1.85a 11.2a 1.67a 7.09a56 1.44a 8.02a 6.76b 26.0b
112 6.30a 27.5b 18.0c 55.8c168 10.1b 40.6c 19.3c 58.3c224 10.8b 41.6c 19.2c 60.8c
280 11.5b 48.5c 22.0c 64.1c
Sourceofvariation Pvalue
CoverCrop 0.0005 0.0785 0.3022 0.3459Nrate <.0001 <.0001 <.0001 <.0001CoverCrop*Nrate 0.0235 0.0039 0.6263 0.4413
Page 34
26
FIGURE1SweetcornagronomicoptimalNrate(AONR)asdeterminedbyregressionmodelingfollowingeachcovercroptreatment(berseemclover(BC),chicklingvetch(CV),nocovercrop(NONE))andnitrogen(N)ratereportedasearyield(1000earsha-1)(top)andfreshweightyield(Mgha-1)(bottom),Hancock,WI,2014.
0
10
20
30
40
50
60
0 56 112 168 224 280
EarYield(1000earsha-1 )
BCCV
BC:y=-0.394x2+294x+1461
R2=0.95 AONR:280
NONE:y=-0.608x2+339x+-2820
R2=0.95 AONR:279
CV:y=0.208x2+37.4x+24254 R2=0.39 AONR:280
0
2
4
6
8
10
12
14
16
0 56 112 168 224 280
FreshWeightYield(M
gha
-1)
NRate(kgNha-1)
BCCV
BC:y=0.160+0.053xR2=0.96AONR:280
CV:y=3.34+0.047xR2=0.66AONR:171
NONE:y=-0.895+0.073xR2=0.91y=9.93ifx≥148
Page 35
27FIGURE2SweetcornagronomicoptimalNrate(AONR)asdeterminedbyregressionmodelingfollowingeachcovercroptreatment(berseemclover(BC),chicklingvetch(CV),nocovercrop(NONE))andnitrogen(N)ratereportedasearyield(1000earsha-1)(top)andfreshweightyield(Mgha-1)(bottom),Hancock,WI,2014.
0
10
20
30
40
50
60
0 56 112 168 224 280
EarYield(1000earsha-1 )
OATOBNONE
NONE:y=-0.608x2+339x+-2820 R2=0.95 AONR:279
OAT:y=730+160x R2=0.93 AONR:280
OB:y=7350+157x R2=0.93 AONR:280
0
2
4
6
8
10
12
14
0 56 112 168 224 280
FreshWeightYield(M
gha
-1)
NRate(kgNha-1)
OATOBNONE
NONE:y=-0.895+0.073xR2=0.91y=9.93ifx≥148
OB:y=-0.000006x2+0.046x+0.479 R2=0.95 AONR:280
OAT:y=-0.00001x2+0.044x+-.431 R2=0.93 AONR:280
Page 36
28FIGURE3SweetcornagronomicoptimalNrate(AONR)asdeterminedbyregressionmodelingfollowingeachcovercroptreatment(berseemclover(BC),chicklingvetch(CV),nocovercrop(NONE))andnitrogen(N)ratereportedasearyield(1000earsha-1)(top)andfreshweightyield(Mgha-1)(bottom),Hancock,WI,2015.
0
10
20
30
40
50
60
70
80
0 56 112 168 224 280EarYield(1000earsha-1 )
BCCV
NONE:y=-1.27x2+546x+2761R2=0.88AONR:215
BC:y=-0.873x2+470x+5151 R2=0.94 AONR:269
CV:y=-0.919x2+477x+6747 R2=0.96 AONR:259
0
5
10
15
20
25
30
0 56 112 168 224 280
FreshWeightYield(M
gha
-1)
NRate(kgNha-1)
BCCV
NONE:y=-0.215+0.152xR2=0.97y=18.8ifx≥121
BC:y=0.567+0.146x R2=0.94 y=21ifx≥138
CV:y=-0.0002x2+0.140x+2.00 R2=0.91 AONR:280
Page 37
29FIGURE4SweetcornagronomicoptimalNrate(AONR)asdeterminedbyregressionmodelingfollowingeachcovercroptreatment(berseemclover(BC),chicklingvetch(CV),nocovercrop(NONE))andnitrogen(N)ratereportedasearyield(1000earsha-1)(top)andfreshweightyield(Mgha-1)(bottom),Hancock,WI,2015.
0
5
10
15
20
25
0 56 112 168 224 280
FreshWeightYield(M
gha
-1)
NRate(kgNha-1)
OATOBNONE
OAT:y=1.66+0.135x R2=0.94 y=20ifx≥136
OB:y=0.356+0.138x R2=0.97 y=19ifx≥138
NONE:y=-0.234+0.167x R2=0.97 y=19.8ifx≥121
0
10
20
30
40
50
60
70
0 56 112 168 224 280
EarYield(1000earsha-1 )
OATOBNONE
OAT:y=-1.10x2+475x+13100 R2=0.97 AONR:216
OB:y=-1.18x2+527x+2936 R2=0.96 AONR:221
NONE:y=-1.27x2+546x+2761 R2=0.88 AONR:215
Page 38
30
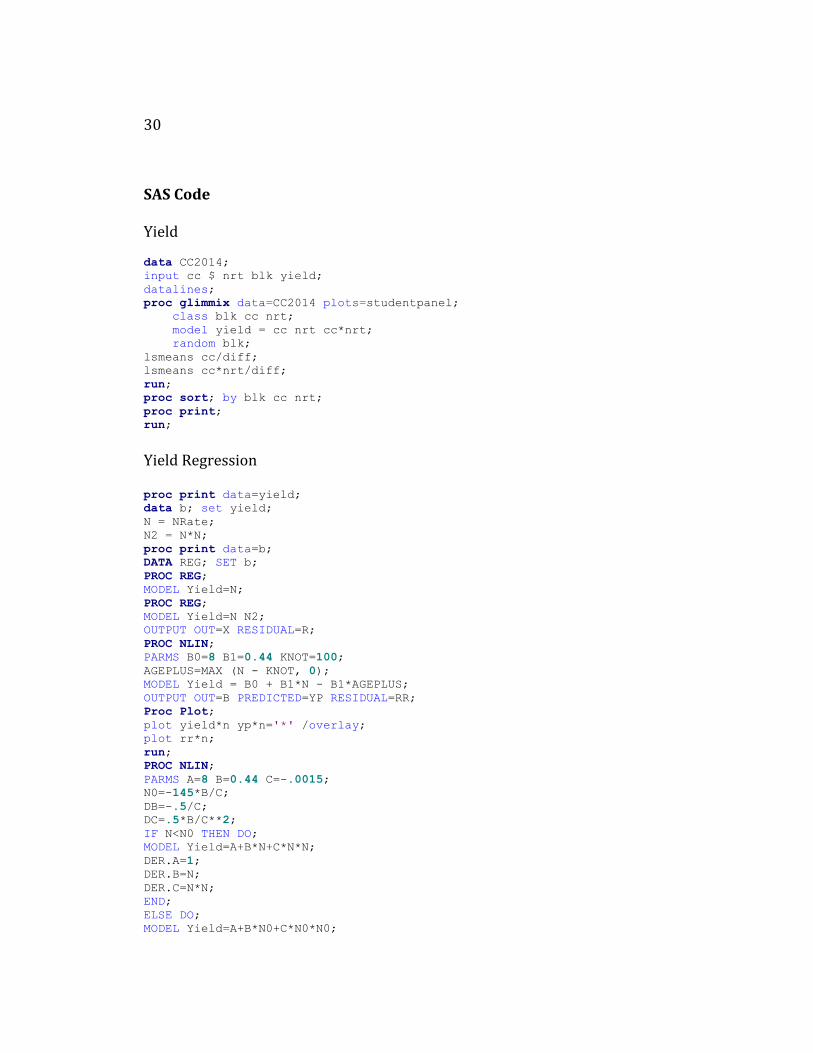
SASCodeYield data CC2014; input cc $ nrt blk yield; datalines; proc glimmix data=CC2014 plots=studentpanel; class blk cc nrt; model yield = cc nrt cc*nrt; random blk; lsmeans cc/diff; lsmeans cc*nrt/diff; run; proc sort; by blk cc nrt; proc print; run;
YieldRegressionproc print data=yield; data b; set yield; N = NRate; N2 = N*N; proc print data=b; DATA REG; SET b; PROC REG; MODEL Yield=N; PROC REG; MODEL Yield=N N2; OUTPUT OUT=X RESIDUAL=R; PROC NLIN; PARMS B0=8 B1=0.44 KNOT=100; AGEPLUS=MAX (N - KNOT, 0); MODEL Yield = B0 + B1*N - B1*AGEPLUS; OUTPUT OUT=B PREDICTED=YP RESIDUAL=RR; Proc Plot; plot yield*n yp*n='*' /overlay; plot rr*n; run; PROC NLIN; PARMS A=8 B=0.44 C=-.0015; N0=-145*B/C; DB=-.5/C; DC=.5*B/C**2; IF N<N0 THEN DO; MODEL Yield=A+B*N+C*N*N; DER.A=1; DER.B=N; DER.C=N*N; END; ELSE DO; MODEL Yield=A+B*N0+C*N0*N0;
Page 39
31DER.A=1; DER.B=N0+B*DB+ 2*C*N0*DB; DER.C= B*DC+N0*N0+2*C*N0*DC; END; IF _OBS_=1 & _ITER_>0 THEN DO; PLATEAU=A+B*N0+C*N0*N0; PUT N0=PLATEAU=; end; OUTPUT OUT=b predicted=grainyldp residual=gyresid; proc plot; plot Yield*N grainyldp*N='*' / overlay vpos=35; plot gyresid*n; run;
Page 40
32BibliographyAndraski,T.W.,andL.G.Bundy.2005.“CoverCropEffectsonCornYield
ResponsetoNitrogenonanIrrigatedSandySoil.”AgronomyJournal97(4):1239–44.doi:10.2134/agronj2005.0052.
Bero,NicholasJ.,MatthewD.Ruark,andBirlLowery.2016.“BromideandChlorideTracerApplicationtoDetermineSufficiencyofPlotSizeandWellDepthPlacementtoCapturePreferentialFlowandSoluteLeaching.”Geoderma262(January):94–100.doi:10.1016/j.geoderma.2015.08.001.
Bouman,O.T.,J.Looman,A.E.Slinkard,andLdBailey.n.d.“PRODUCTIVITYOF4ANNUALLEGUMESASGREENMANUREINDRYLANDCROPPINGSYSTEMS.”AgronomyJournal85(5):1035–43.
Buechi,Lucie,Claude-AlainGebhard,FrankLiebisch,SokratSinaj,HansRamseier,andRaphaelCharles.2015.“AccumulationofBiologicallyFixedNitrogenbyLegumesCultivatedasCoverCropsinSwitzerland.”PlantandSoil393(1-2):163–75.doi:10.1007/s11104-015-2476-7.
Cherr,C.M.,J.M.S.Scholberg,R.McSorley,andO.S.Mbuya.2007.“GrowthandYieldofSweetCornFollowingGreenManureinaWarmTemperateEnvironmentonSandySoil.”JournalofAgronomy&CropScience193(1):1–9.doi:10.1111/j.1439-037X.2006.00236.x.
Contreras-Govea,FranciscoE.,andKennethA.Albrecht.2006.“ForageProductionandNutritiveValueofOatinAutumnandEarlySummer.”CropScience46(6):2382–86.
Fakhari,Rasoul,HassanKhanzade,RuhangizMammadova,AhmadTobeh,andSajadMoharramnezhad.2015.“EffectsofInterseedingCoverCropsandSplitNitrogenApplicationonWeedSuppressioninForageMaize.”AlbanianJournalofAgriculturalSciences14(3):278–85.
Hesterman,Ob,CcSheaffer,DkBarnes,WeLueschen,andJhFord.1986.“AlfalfaDry-MatterandNitrogen-Production,andFertilizerNitrogenResponseinLegume-CornRotations.”AgronomyJournal78(1):19–23.
Isse,A.A.,AngusF.MacKenzie,andKatrineStewart.1999.“CoverCropsandNutrientRetentionforSubsequentSweetCornProduction.”AgronomyJournal91(6):934–39.doi:10.2134/agronj1999.916934x.
Johnson,HeidiJ.,JedB.Colquhoun,andAlvinJ.Bussan.2012.“TheFeasibilityofOrganicNutrientManagementinLarge-ScaleSweetCornProductionforProcessing.”HortTechnology22(1):25–36.
Lupwayi,NewtonZ.,andYoongK.Soon.2015.“CarbonandNitrogenReleasefromLegumeCropResiduesforThreeSubsequentCrops.”SoilScienceSocietyofAmericaJournal79(6):1650.doi:10.2136/sssaj2015.05.0198.
Marstorp,H.,andH.Kirchmann.1991.“CarbonandNitrogenMineralizationandCropUptakeofNitrogenfrom6GreenManureLegumesDecomposinginSoil.”ActaAgriculturaeScandinavica41(3):243–52.
Page 41
33“NutrientGuidlinesWI.”2016.AccessedApril9.
http://learningstore.uwex.edu/assets/pdfs/A2809.pdf.Parr,M.,J.M.Grossman,S.C.Reberg-Horton,C.Brinton,andC.Crozier.2011.
“NitrogenDeliveryfromLegumeCoverCropsinNo-TillOrganicCornProduction.”AgronomyJournal103(6):1578–90.
Rinnofner,T.,J.K.Friedel,R.deKruijff,G.Pietsch,andB.Freyer.2008.“EffectofCatchCropsonNDynamicsandFollowingCropsinOrganicFarming.”AgronomyforSustainableDevelopment28(4):551–58.doi:10.1051/agro:2008028.
Sainju,UpendraM.,WayneF.Whitehead,andBharatP.Singh.2005.“BicultureLegume-CerealCoverCropsforEnhancedBiomassYieldandCarbonandNitrogen.”AgronomyJournal97(5):1403–12.
Snapp,S.S.,S.M.Swinton,andR.Labarta.2005.“EvaluatingCoverCropsforBenefits,CostsandPerformancewithinCroppingSystemNiches.”ReviewandInterpretation97(1):322–32.
Stute,J.K.,andJ.L.Posner.1995.“LegumeCoverCropsasaNitrogenSourceforCorninanOat-CornRotation.”Jpa8(3):385.doi:10.2134/jpa1995.0385.
ThiessenMartens,JoanneR.,JeffW.Hoeppner,andMartinH.Entz.2001.“LegumeCoverCropswithWinterCerealsinSouthernManitoba:Establishment,Productivity,andMicroclimateEffects.”AgronomyJournal93(5):1086–96.doi:10.2134/agronj2001.9351086x.
“UWExtensionAGWeather.”2016.HancockResearchStation,UniversityofWisconsin-Madison.March5.http://agwx.soils.wisc.edu/uwex_agwx/awon.
West,J.R.,M.D.Ruark,A.J.Bussan,J.B.Colquhoun,andE.M.Silva.2016.“NitrogenandWeedManagementforOrganicSweetCornProductiononLoamySand.”AgronomyJournal108(2):758–69.doi:10.2134/agronj2015.0393.
“WisconsinAnnualStatisticsBulletin”2016.AccessedApril11.http://www.nass.usda.gov/Statistics_by_State/Wisconsin/Publications/Annual_Statistical_Bulletin/bulletin2014_web.pdf.
Page 43
35Chapter3:OatCoverCropGrowthandInfluenceonNetNitrogenMineralizationinSandySoilAbstract
CovercropsarewidelyusedintheCentralSandsregionofWisconsin,but
theireffectonseasonalNcyclingisnotwellquantified.Theobjectivesofthis
studyweretoquantifyspring-plantedoat(Avenasativa)covercropgrowthand
N-uptake,determinetheeffectofoatcovercropandNfertilizeronin-situ
mineralizationandseasonalplantavailablenitrogen(PAN),anddeterminethe
effectofspringplantedoatcovercropsonsweetcorn(ZeamaysL.)Nuptake.The
studywasconductedacrosstwogrowingseasonsattheHancockAgricultural
ResearchStationintheCentralSandsofWisconsinandtheexperimentaldesign
wasarandomizedcompleteblock,split-plotdesignwithtwowhole-plot
treatments(oatandnocover)andtwosplit–plotN-ratetreatments(0and168
kg-Nha-1).In-situmineralizationcolumnswithanionandcationresinswereused
tomeasureseasonalmineralizationratesevery30daysduringthegrowing
season.OatbiomassandNuptakevariedgreatlybetweenyears(272kgha-1and
6kgNha-1in2014and5824kgha-1and119kgNha-1in2015,respectively),but
therewasnoeffectoftheoatcovercroponNmineralizationorsweetcornN
uptakeineitheryear.However,oatcovercropdidimpactsoilnitrateand
ammoniumwhenmeasuredatapproximately10-dayintervals.Thein-situ
mineralizationmethodprovidedvalueswithinrangeofotherstudies,butwasnot
Page 44
36quantitativebasedonNbudgets.Thesefindingssuggestthatoatcovercropsdo
notappeartomeaningfullyeffecttheNcycleinthisregion.
Introduction
TheWisconsinCentralSandsregionischaracterizedbysandysoilsand
productionofvegetablecropsforthelocalvegetableprocessingeconomy.The
region’ssoiliscomprisedof90%course-texturedsand,glacialoutwashfromthe
WisconsinglaciationthatalteredtheNorthAmericanlandscapemostrecently
25,000yearsago(WisconsinGeological&NaturalHistorySurvey »IceAge
Geology).Giventheregion’ssandysoilandlowsoilorganicmatter,agricultural
productivityrequireshighinputsofirrigatedwaterandnutrients.IntheCentral
Sands,thecombinationofnitrogenapplicationandfrequentirrigationonsandy
soilcanresultinnitrate-Ngroundwaterloadingof77%oftotalfertilizerN
applied(KraftandStites,2003).Thisnitrate-Ncanleachintolocal,regional,and
eventuallynationalwaters,whichcancausehypoxiainaquaticecosystems(Justic
etal.,1995;BurkartandJames,1999).
TheCentralSandslandscapeiscomprisedofexpansiveplainsand
producersintheregionusegrasscovercropstoreducewinderosionaftercrop
harvest.However,farmersmaybeunabletoestablishcovercropsinthefall
followingcornorsoybean(Glycinemax)harvest.Spring-plantedcovercropsare
anoptionprecedinglate-summerplantedcropssuchassweetcorn,whichcanbe
plantedaslateasmid-July,buttheeffectsontheNcycleofspring-plantedgrass
Page 45
37covercropsarenotwellquantified.Onsandysoil,grasscoversappeartobemore
likelytoprovideanNbenefitcomparedtolegumesaspreviousworkonfieldpea
(Pisumsativum),chicklingvetch(Viciavillosa),andberseemclover(Trifolium
alexandrinum)inthisregionhaveshownnoNcredit(Johnsonetal.,2012,West
etal.,2016,Ivancicetal.,Chapter2).Spring-seededlegumecoversresultinlow
biomassproductionandtheirlowC:Nratiobiomassappearstodecomposeand
mineralizetooquicklyandleachoutoftherootzonepriortouptakebysweet
corn(Westetal.,2016).Incontrast,grasscovercropshavebeenshownto
provideNbenefitsinthisregionintheformofeconomicoptimumnitrogenrates
(EONR).AndraskiandBundy(2005)documentedareductioninEONRofsweet
cornfollowingfall-plantedoatcovercropintwoofthreeyears.Theauthorsalso
comparedthegrowthandN-uptakeacrossthreefall-plantedgrasscovercrops,
oat,ryeandtriticale,beforesweetcornplantinganddeterminedthatoatresulted
inthegreatestabovegroundbiomassandN-uptake.Dependingonthegrowth
andC:Nratioofanoatcovercropwhenterminated,anNcreditmaybeprovided
orimmobilizationofappliedNmayoccur.InthesandysoilsofMachanga,Kenya,
Chivengeetal.(2009)quantifiedNcyclingofcombinedtreatmentsofhighC:N
ratio(60to208)plantresiduesandNfertilizer,measuringNimmobilizationand
reducedleachingwithacombinedapplication.
Mineralizationandothernitrogentransformationsvaryaccordingto
moisturecontent,microbialcommunity,soilmicroclimate,andmanagement
Page 46
38practicesthatarenoteasilyrepresentedinalaboratorysetting(Binkleyand
Hart,1989).Itisarguedthatduetotheseenvironmentalvariances,in-situfield
experimentsprovidemoreaccuratemineralizationmeasurementsthan
laboratory.Variousin-situmethodshavebeenusedtoquantifyN
transformations,advancingwithtime.Eno(1960)usedburiedresinbags,
DiStefanoandGholz(1986)andBryeetal.(2002)combinedresinbagswithPVC
columnsforamoreprecisetechniquethatquantifiedsoilvolumewith
mineralizationmeasurements.Forthisstudy,weusedthecombinedsoilcolumn
andionicresintechniquetomeasurein-situmineralization.Thismethodusesa
knownsoilvolumeasausefultoolforquantifyingfield-scalemineralization.
Thisstudyquantifiedmineralizationofspring-plantedoatinasweetcorn
croppingsystemintheCentralSandstobetterunderstandoatcovercropeffect
onNcycling.Specificstudyobjectiveswereto:(i)quantifyspring-plantedoat
covercropgrowthandNuptake,(ii)determinetheeffectofoatcovercropandN
fertilizeronin-situN-mineralizationandseasonalPAN,and(iii)determinethe
effectofspringplantedoatcovercropsonsweetcornNuptake.
MaterialsandMethods
SiteDescriptionandExperimentalDesign
Atwo-yearstudywasconductedin2014and2015attheUniversityof
Wisconsin,HancockAgriculturalResearchStation(HARS)(latitude:44°8’23”N;
longitude:89°31’23”W;elevation:328m)onanoverhead-irrigatedPlainfield
Page 47
39loamysandsoil(mixed,mesicTypicUdipsamments).Theexperimentaldesign
wasarandomizedcompleteblock,split-plotdesignwithtwowhole-plot
treatments(oatandnocover)andtwosplit–plotN-ratetreatments(0and168
kg-Nha-1),replicatedfourtimes.Thisstudywasconductedwithinselect
treatmentsofalargerstudy(describedinChapter2)andincludetheoat(OAT)
andnocovercrop(NONE)withoutNandwith168kgNha-1(OAT+Nand
NONE+N)treatments.Oatcovercropwasdrillseededon21April2014
andon16April2015at134kgha-1andterminatedon10June2014withan
applicationofCreditExtra®,(NufarmAmericasInc.;Alsip,Illinois)[active
ingredient(a.i.)2.3%glyphosate,mixedwithnonionic80/20surfactantand
ammoniumsulfate(AMS,21-0-0-24S)].Covercropterminationbeganon12June
2015withanapplicationofMadDogPlus®(LovelandProductsInc.;Greenley,
Colorado)[a.i.41%glyphosate,mixedwithN-(phosphonomethyl)glycine,
nonionic80/20surfactant,andAMS]andrequiredsurfacecultivationwithan
M&W®10'Dyna-Drive®(AlamoGroupInc.;Seguin,TX).On16June2015,a
secondherbicideapplicationofParallel®(AdamaUSA;Raleigh,NC)[ai.84%
metolachlor:2-chloro-N-(2-ethyl-6-methylphenyl)-N-(2-methoxy-1-methylethyl)
acetamide]wasappliedon19June2015forcompletecovercroptermination.
Theoatvarietywasnotstatedin2014andwasSaberin2015.Sweetcorn(Del
MonteFoodsHybridYellowSweetCornSeed,varietyDMC21-84)wasplantedon
13June2014and19June2015withaJohnDeereMaxEmergeTM(Deere&
Page 48
40Company;Olathe,Kansas)four-rowplanterataseedingdensityof24,500plants
ha-1andharvestedbyhand11September2014and11September2015.
Fertilizerapplicationtocornwassplitbetweentwo,56kg-Nha-1duringV-4
(between0-30days)and112kg-Nha-1duringV-8(between30-60days)
growingstages.Equivalentquantitiesofurea-Nfertilizer(sixureaprillsforthe
56kgNha-1applicationrateand12prillsforthe112kgNha-1applicationrate)
wereappliedtoeachabovegroundsoilcoreareainordertoensureuniform
application.
PlantCollectionandAnalysis
Precipitationanddailyairtemperatures(maximumandminimum)
measurementswererecordedatHARSandwereusedtocalculategrowing
degreedayaccumulationforboththecovercropandsweetcorngrowingseasons
andwerecalculatedas:
GrowingDegreeDays°C(GDD)=[(T°C(DailyMAX)+T°C(DailyMIN))/2]/TBASE
Whereifthedailymaximumtemperature>30°wassetequalto30°andifthe
dailyminimumtemperature<10°wassetequalto10°.Thebasetemperature
(TBASE)foreachplantwassweetcornTBASE=10°andoatTBASE=5.5°.Data
collectedfromHARSdailytemperaturecollectionstation(HancockAgricultural
ResearchStation,2016;Table1).
Abovegroundbiomass(AGB)wascollectedon10June2014and19June
2015;threesampleswerecollectedperwholeplotfroma0.37m2areain2014
Page 49
41anda0.14m2areain2015.Sweetcornwasharvestedandsubsampledon11
September2014and11September2015.Randomlyselectedsubsamplesofsix
earsandsixstalkswerecollectedfromoutsideoftheharvestrows(3and4)from
rows1,2,5,and6acrossalltreatments.Covercrops,ears,andstalkswere
weighedseparatelyinthefield.Stalkswerechoppedandonesubsamplewas
collectedperplot.Earswerecutinto2.5cmmedallionsandonesubsamplewas
collectedperear,totalingsixmedallionsubsamplesperplot.Covercropbiomass
samples,earsubsamples,andstalksubsamplesweredriedina60°Cforced-air
dryerforoneweek,re-weighedfordryweight,andmechanicallygroundusinga
0.5mmsieveandstoredinplasticvialsuntilanalysis.Nitrogencontentofcover
cropandsweetcornbiomasswasdeterminedbyre-dryingsamplesforatleast
24hourspriortoanalysisandtotalcarbonandtotalnitrogenanalysisusinga
flashcombustionprocedure(ThermoFisherScientificFlashEA1112NC
Analyzer,ThermoFisherScientificInc.,Waltman,MA).
In-situMineralizationColumnsandSoilSampleCollectionandAnalysis
Nitrogenmineralizationratesweremeasuredusingin-situincubation
coresandion-exchangeresinsachetssimilartothosedescribedbyBryeetal.
(2002).Coreswereconstructedofpolyvinylchloridepipes(30.5cmindepthand
20cmindiameter).Onthedayofplanting,twocoreswereinsertedineachplot
byhand(physicallyforcedinusingamallet),onebetweenrowstwoandthree
andthesecondcorebetweenrowsfourandfiveineachplot.Coreswereplaced
Page 50
42approximately0.6minfromthesouthendofeachplotandmovedapproximately
0.6mfurthernorthwitheachnewinstallation.Afterinsertion,coreswere
carefullyexcavatedwithshovels;attentionwaspaidtoremovingthecore
withoutdisturbingthesoilwithin.Onceremoved,coreswereinverted,5cmof
thesoilwereremovedfromthebaseandaresinsachetwascurledinitsplace
coveringthecore’sentiresurfacearea.ResinsachetsweremadeofL’eggsUltra
SheerPantyhose(HanesbrandsInc.,WinstonSalem,NorthCarolina),sizelarge,
cutatthethigh,filledwith30gofRexyn300(H-OH)ion-exchangeresinbeads
andsecuredwithaknot.Aftersachetinsertion,theremainingspacebetweenthe
sachetandthebaseofthecorewasfilledwithsoil,coveredwitha23cmx23cm
squaremeshandziptiedaroundthebaseinordertosecurethesoilandresin
sachetwithinthecore.Thecorewastheninsertedbackintotheholefromwhich
itcame.Soilcoreswereincubatedin-situforthree30-dayintervals(0-30,30-60,
and60-90days)throughoutthesweetcorngrowingseason.
Soilwassampledfromtheareaoutsideofthecoreonthefirstdayof
incubationtodetermineinitialNO3-NandNH4-Nconcentrations.Soilwas
extractedbycombining1.5g(±0.05)ofsoilwith15mlof2MKCLand
mechanicallyoscillatingthesamplesfor15minutes.Sampleswerethenfiltered
andtheextractantwasanalyzedforNO3-Nusingavanadiumchloridereactionas
describedbyDoaneandHorwath(2003)andforNH4-Nusingacolormetric
BerthelotmethodasdescribedinHood-Nowontyetal.(2010).After30-daysof
Page 51
43incubation,coreswereexcavatedandthesoilwithineachcorewasextracted.
Thesoilcoresampleswereweighedinthefieldandsubsampledforsoilmoisture
determinationforbulkdensitycalculations.Soilmoisturesubsampleswere
placedinaluminumtinsanddriedina105°Covenfor24hours.
Resinsachetswereimmediatelystoredoniceafterincubationand
extractedwithinaweek.Onceinthelaboratory,resinwasremovedfromthe
nylonsachetandweighed.Resinwasplacedinscintillationvialswith40mL2M
KCLandmechanicallyoscillatedfor60minutes(Wolf,2010).Extractantwas
filteredandsenttotheUniversityofWisconsin,MadisonSoilandPlantAnalysis
LaboratoryforNO3-NandNH4-NanalysisbyflowinjectiononaLachat
QuickChem8000.Onthesamedayofsoilcolumnremovalnewsoilcolumnswith
freshresinsachetswereinserted.
Soilsampleswerecollectedoutsideoftheincubatedcoreseverytendays
throughoutthesweetcorngrowingseasonandanalyzedforNH4-NandNO3-N
concentrations.In2014thetensamplingtimepoints(TP1toTP10)were:13
June,23June,2July,10July,21July,31July,8August,18August,29August,and
14September.In2015the9samplingpoints(TP1toTP9)were:19June,30
June,9July,17July,29July,6August,17August,26August,and11September.
Samplesweretakentoa30cmdepthatapproximately30cmonthenorth,south
andeithereastorwestsidesofeachsoilcore,dependinguponsoilcolumn
placementwithintheplot.Sampleswerenottakenbetweenharvestrowsthree
Page 52
44andfour.Samplesweredriedinaforcedairdrierforatleastoneweekand
groundtopassthrougha2mmsieve.SoilsampleswereanalyzedforNO3-Nand
NH4-NusingtheDoaneandHorwath(2003)andHood-Nowontyetal.(2010)
procedures,asdescribedabove.
CalculationsandStatisticalAnalysis
ThetotalamountofNtakenupbyplantsthroughoutthegrowingseason
wascalculatedasTotalNuptake(TNU)usingthesummationofplant-availableN
concentrationinthesweetcornearsandsweetcornstalks.
TNU=NEAR+NSTALK
Partialnutrientbalance(PNB)istheamountofNthatispresumablylost
totheenvironment,andiscalculatedhereasaratioofNremoved(ear)overthe
amountofNapplied.
PNB=NEAR/NAPPLIED
TheNuptakeefficiency(NUE)ofurea-Nforsweetcornproductionwas
calculatedperunitNappliedasthedifferencebetweenTNU(Applied-N)and
TNU(Control)overtheovertotalNapplied.
NUE=(TNU(Applied-N)–TNU(Control))/Applied-N
Netmineralizationcalculationswereconductedforeachyearand30-day
timeperiod.SimilartoNoe(2011),wesummedthedifferencesbetweenstarting
andendingNO3-NandNH4-Nconcentrationsofincubatedsoilsandaddedending
resinNO3-NandNH4-Nconcentrations.
Page 53
45
Analysisofvariance(ANOVA)wasconductedtodeterminetheeffectof
covercropandNrateonNmineralization,sweetcornNuptake,PNB,andNUE.
Forsimplicity,statisticalanalysiswasconductedwithfourmainplottreatments
(NONE,NONE+N,OAT,andOAT+N).ProcMixedwasusedwithblockasarandom
effectandtimeperiodsandstudyyearswereanalyzedseparately.SoilNdata
werelogtransformedinordertosatisfythehomogeneityofvariancestatistical
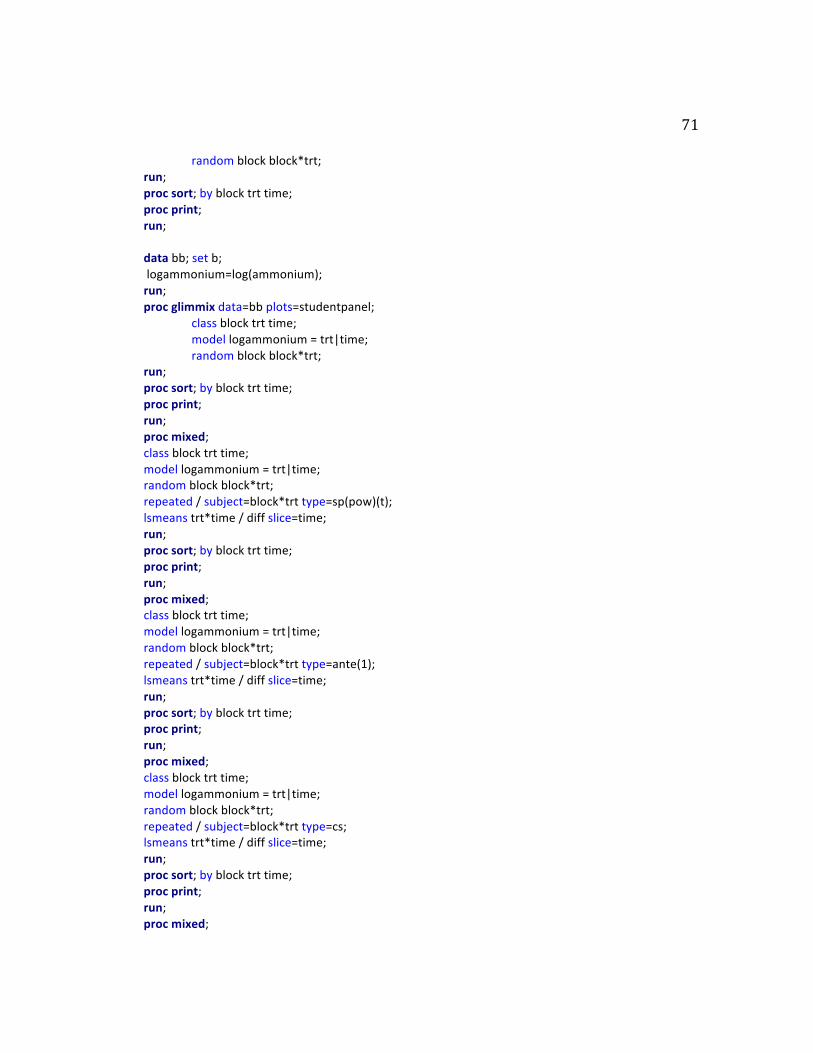
assumptionandanalyzedwithProcMIXEDwithblockasarandomeffectand
REPEATED=samplingtimeandSUBJECT=block×treatment.Modeltype
(compoundsymmetry=CS,heterogeneousCS=CSH,antedependence=
ANTE(1),orspatialcovariancepower=SP(POW))wasdeterminedbythelowest
akaikeandbayesianinformationcriterionscores.The2014datawereevaluated
usingSP(POW)modeltypeandthe2015datasetswereevaluatedusingtypeCSH
forNH4-Ndata,typeCSforNO3-N,andtypeANTE(1)forPAN.Meancomparisons
wereconductedusingLSMEANSforallanalyses,exceptfornitrate,ammonium,
andPANwhereLSMEANSwasusedwithSLICEtoidentifysignificanttreatment
effectsateachsamplingtime.AllstatisticswereconductedinSAS(Statistical
AnalysisSystem,version9.2,SASInstitute,Cary,NC)andNmineralization
treatmentsignificanceisreportedatthealpha=0.10significancelevelandsoilN
andsweetcornN-uptake,PNB,andNUEtreatmentsignificanceisreportedat
alpha=0.05significancelevel.
Page 54
46Results
OatTemperature,Precipitation,andSeasonalGrowth
Themonthlyairtemperaturesduringthe2014oatgrowingseasonwere1
to3˚Cabove30-yearnormaltemperatures,averaging5˚C(1˚Cabovethe30-year
normal)inApril,14˚C(3˚Cabovethe30-yearnormal)inMay,and20˚C(2˚C
abovethe30-yearnormal)inJune(Table1andFig.2).Covercropswerenot
irrigatedandtotalprecipitationwas196mmfromcovercropseedingto
terminationin2014(Fig.1).
OatGDDwerehigherin2015comparedto2014(Fig.3).In2015,the
monthlytemperaturesduringtheoatgrowingseasonwereator4˚Cabove30-
yearnormaltemperatures,averaging8˚CinApril(atthe30-yearnormal),15˚C(4
˚Cabovethe30-yearnormal)inMay,and18˚C(4˚Cabovethe30-yearnormal)in
June(Table1).Totalprecipitationthroughoutthe2015oatgrowingseasonwas
191mm(Fig.1&Fig.2).
OattotalAGB(5824kgha-1)was183%greaterin2015than2014.
Accordingly,2015totalCwas2,419kg-Cha-1,182%greaterthan2014,andtotal
Nwas119kg-Nha-1,180%greaterthan2014(Table2).Covercropbiomass
variedgreatly(272kgha-1in2014and5,824kgha-1in2015)betweenstudy
years.
Mineralization
Page 55
47
Meanmonthlyairtemperaturesduringthe2014sweetcorngrowing
seasonandmineralizationcoreincubationdeviatedfrom-5to2°Caroundthe30-
yearnormaltemperatures,averaging20°CinJune(2°Cabovethe30-year
normal),19°CinJuly(1°Cbelowthe30-yearnormal),20°CinAugust(2°Cbelow
the30-yearnormal),and15°CinSeptember(5°Cbelowthe30-yearnormal)
(Table1).Totalaccumulatedwater(precipitation271mm,irrigation314mm)
throughoutthesweetcorngrowingseasonwas585mm(Fig.1,Fig.2).The2014
growingseasonaccumulated891GDDin2014(Fig.3).NetNmineralization
duringthefirst30daysofthe2014sweetcorngrowingseasonwere13and16
kgha-1intheOATandNONEand25and27kgha-1intheN-appliedtreatments
(OAT+NandNONE+N),respectively.Mineralizationwithinthe0-30dayinterval
wassignificantlygreaterintheNONE+NandOAT+Ntreatmentscomparedtothe
NONEandOATtreatments(Fig.4).Mineralizationinthe30-60daytimeperiod
was38and49kgha-1inOATandNONEand81and101kgha-1inOAT+Nand
NONE+N,respectively.Therewasnosignificanttreatmentdifferencebetween
covercroptreatmentsandtheircontrols(e.g.OATvs.NONEandOAT+Nvs.
NONE+N).Duringthe60-90daytimeperiod,mineralizationwas4and6kgha-1
inNONEandOAT,respectively,andwas31kgha-1inbothNONE+NandOAT+N.
Mineralizationpatternremainedthesameduringthistimeperiod,therewasno
significanttreatmentdifferencebetweenthecovercroptreatments(OAT+Nand
OAT)andtheircontrols(NONE+NandNONE)(Fig.4).
Page 56
48
Inthe2015sweetcorngrowingseasonandmineralizationcore
incubation,meanmonthlyairtemperaturesdeviated-3to1°Caroundthe30-
yearnormaltemperatures,averaging18°CinJune(atthe30-yearnormal),21°C
inJuly(1°Cabovethe30-yearnormal),19°CinAugust(3°Cbelowthe30-year
normal),and18°CinSeptember(2°Cbelowthe30-yearnormal)(Table1).Total
accumulatedGDDswere845in2015andtotalaccumulatedwater(precipitation
263mm,irrigation312mm)throughoutthe2015sweetcorngrowingseason
was575mm(Fig.1,Fig.3).Mineralizationvaluesin2015duringthe0-30day
timeperiodwere3and12kgha-1inNONEandOATand31and40kgha-1in
NONE+NandOAT+N,respectively.Therewasnosignificantdifferencebetween
covercroptreatmentscomparedtotheircontrols(NONEandNONE+N)(Fig.5).
Duringthe30-60daygrowingperiodmineralizationwas12and17kgha-1in
NONEandOATand35and40kgha-1inNONE+NandOAT+N,respectively.There
wasnosignificanttreatmentdifferencebetweencovercroptreatments(OAT+N
andOAT)andtheirnocovercontrols(NONE+NandNONE).Duringthe60-90day
timeperiodnetmineralizationwas3and25kgha-1inOATandNONEand-7and
7kgha-1intheOAT+NandNONE+Ntreatments,respectively.TheOAT+N
treatmentduring60-90daysdisplayednegativenetnitrogenmineralization;
howeverthestandarderroris8.6andoverlapszero,suggestingthatthemeanis
notdifferentthanzero.In2015,throughouttheentire90-daygrowingseason
mineralizationpatternsremainedthesameamongsttreatments.
Page 57
49SweetCornN-Uptake
The2014sweetcornstalkNuptakewassignificantlygreaterinNONE+N
comparedtoNONEandOAT,whileearNwasgreaterinNONE+NandOAT+N
comparedtoNONEandOAT.TheTNUinNONE+NwasgreaterthaninNONE.
TherewerenotreatmentdifferencesforPNBbuttheNUEofNONE+Nwas
significantlygreaterNthanOAT+N(Table3).In2015,stalkNuptakewas
significantlygreaterintheNONE+NtreatmentcomparedtoNONE,whileearN
uptakewassignificantlygreaterintheN-appliedtreatmentscomparedtoall
others.TheTNUwassignificantlylowerintheNONEtreatmentcomparedto
NONE+NandOAT+NandOAThadsignificantlylessTNUcomparedtoNONE+N.
In2015,therewasnosignificanttreatmentdifferenceinPNB,andNUEwas
significantlygreaterinNONE+NcomparedtoOAT+N(Table3).
SoilNH4-NandNO3-N
AnalysisofsoilNH4-NandNO3-Ninboth2014and2015wasconducted
onlog-transformeddata.In2014OATNH4-Nwassignificantlygreaterthan
NONEintimepoint3,buttherelativedifferencebetweenthehighestandlowest
valuewasonly0.4mgkg-1andNhadnotbeenappliedatthattimepoint.In2014,
NONEhadsignificantlygreaterNO3-NcontentthanOATatTP7andTP10and
OAT+NhadsignificantlygreaterNO3-NcontentthanNONE+NatTP7andTP8.
Thissuggeststhattheremaybedifferentmineralizationpatternsofoatbiomass
lateinthegrowingseasondependingonthepresenceorabsenceofNfertilizer.
Page 58
50TreatmentsignificancewasalsodeterminedforNO3-NatTP3andTP4andfor
PANatTP2,TP5,TP7,andTP10,howeverthesetreatmentsdifferenceswereonly
betweenN-appliedtreatmentsandno-Ntreatments.
In2015theonlysignificantdifferencebetweenanoattreatmentandano
covercroptreatmentwasmeasuredatTP1,whereNONEhadsignificantly
greaterNH4-NthanOAT.Alsoin2015,thereweresignificanttreatment
differencesforNO3-NatTP7andforPANatTP4,TP7,andTP9,butonly
representdifferencesbetweenN-appliedtreatmentsandno-Ntreatments(Fig.
7).
Discussion
OatBiomass
Oatcovercropgrowth,biomassproduction,andNuptakeare
substantiallydifferentbetweenseasons.Coolertemperaturesduringthe2014
oatgrowingseasonreducedgerminationandledtolowerbiomassin2014(272
kgha-1)adifferenceof21timeslowerproductioncomparedto2015(5824kgha-
1)(Table2).OatAGBvariabilityhasbeendocumentedinothernorthernMidwest
croppingstudies,howeveratdifferingmagnitudes.Inasix-yearstudynearAmes,
Iowa,fall-plantedandwinter-killedoatbiomassproductionincreased22times
fromthelowestproduction(70kgha-1)tothehighest(1540kgha-1)(Kasparet
al.2012).Similartoourstudy,greaterbiomasswasassociatedwithwarmer
temperaturesduringtheoatgrowingseason(Kasparetal.2012).InaCentral
Page 59
51Sands-basedstudy,AndraskiandBundy(2005)alsonotedoatbiomass
variabilityintheirfallplantedandwinterkilledcovercrop,howeverthe
differencewas5-foldbetweenyears,590kgha-1to3010kgha-1.Alsoin
Wisconsin,Contreras-GoveaandAlbrecht(2005)measuredspring-plantedoat
biomasswithameanweightof7700kgha-1following77daysofgrowth(mid-
ApriltolateOctober).Pro-rated,Contrera-GoveaandAlbrecht(2005)reported
thesamebiomassaccumulationaswedidinour2015fieldseason(100kgAGB
ha-1day-1).
OatC:Ndidnotdisplaylargedifferencesbetweenyears,thoughthese
valueswerelowercomparedtootheroatstudies.Ourstudy’sC:Nvaluesaremost
similartothosecitedinAndraskiandBundy(2005).AlsointheCentralSands,
thisstudymeasuredC:Nbetween15and33(1570kgha-1AGB)after
approximately12weeksofgrowth(August–November).HigherC:Nratioshave
beenreportedwithgreaterbiomassproduction.Radicettietal.(2016)
documentedC:Nof47(5680kgAGBha-1)andBaggsetal.(2000)measuredC:N
of38(140kgNha-1inAGB).AsimilarC:N(24.8)wasmeasuredbyKumaretal.
(2009),howevertheyproducedgreaterAGB(9700kgAGBha-1)onasiltloam
comparedtoourstudyandAndraskiandBundy’s(2005).Spatially,thethree
studieswerecompletedinsimilarclimatesandlatitudes,N44˚intheCentral
SandsofWisconsinandN42˚attheKumaretal.(2009)studysite,inNewYork.
However,plantingdatesdifferedbetweenthestudies,AndraskiandBundy
Page 60
52(2005)andKumaretal.(2009)bothplantedoatinthefallaftercashcropharvest
andourstudywasspringplanted.Additionally,Kumaretal.(2009)moldboard
plowed,disked,andfertilizedtheirfieldswith51kgha-1ofNjustbeforecover
cropplanting,thisfieldmanagementwaspotentiallyresponsibleforimproving
oatyield.Inourstudyin2015residualsoilNconcentrationswerelikelyhigher
priortooatplantingduetothepreviousseason’spotatocrop.Additionally,our
2015oatcovercropwasterminatedatthestartofreproductivegrowth,
potentiallycontributingtolowC:N.
MineralizationandSoilNH4-NandNO3-N
Ascomparedtoothermineralizationstudiesutilizingasimilarin-situsoil
columnandion-exchangeresinprocedure,ourseasonalmineralizationratesfall
withintherangeofreportedvalues.Wuetal.(2007)measuredmineralizationin
acorncroppingsysteminsandysoilbetween51to75kgNha-130days-1.The
authorscompletedthisstudyinOntario,Canadaandalsodocumenteda
mineralizationpeakduringthe30-60daytimeperiod.Inanothersandysoil
covercroppingstudy,O’Conelletal.(2015)documentedmineralizationingrass
andlegumecovercroppingsystemsonasandyloambetween-70and155kgN
ha-130days-1.Bryeetal.(2002)documentedmineralizationfrom-20to59kgN
ha-130days-1inasiltloamno-tillcorncroppingsystem.Withsimilarcourse-
texturedsoils,forestecosystemshavelowermineralizationcomparedtoour
measurementsortheotherreferencedcroppingsystems’,measuring0.6to4.6kg
Page 61
53Nha-130days-1(Wilhelmetal.,2013)and4.2kgNha-130days-1(Raisonet
al.,1987).Ourstudy’snetmineralizationwasgreaterthanthosemeasuredin
forestecosystemsand,whileonthelowendoftherange,comparedtoother
similarcroppingsystem’sstudies.
SoilNO3-NandNH4-Nfindingswereincongruencewith2014and2015
netmineralizationfindingsbetweenN-appliedtreatmentsandno-Ntreatments;
howeversignificantdifferencebetweentreatmentsatapproximately10-day
intervalsin2014wouldsuggestthatoatcovercropdidimpactmineralizationon
anarrowertimescalethanwasdetectablewiththein-situmethod.Specificallyin
2014atTP7(56daysafterplanting)therewasgreaterNO3-NinOAT+N
comparedtoNONE+NwhileatthesametimetheNONEtreatmenthadgreater
NO3-NthanOAT.ThismaysuggestaprimingeffectoftheNfertilizeron
decompositionandmineralizationofoatbiomasslaterinthegrowingseason.
ThiseffectcanalsobeseenatTP8,whereOAT+NhadgreaterNO3-Ncomparedto
NONE+N,andatTP10,whereNONEhadgreaterNO3-NcomparedtoOAT.Results
fromthein-situmineralizationcolumnsduring60-90daysin2014didnotresult
intreatmentdifferencesbetweenanyoatandnocovercroptreatments(Figure
4).
SweetCornNUptake
OatcovercropdidnotsignificantlyincreasesweetcornNuptake.The
onlysignificanttreatmentdifferenceintotalNuptakebetweencovercrop
Page 62
54treatmentandtheircontrolswasinthe2014OATtreatmentcomparedtothe
NONEtreatment.Thisdifferencewasnotseeninthe2014mineralizationdata
howeveritwaspresentinthesoilNdata.In2014and2015therewasno
statisticalsignificancebetweenpartialnutrientbalance(PNB)treatmentsand
theircontrols,therefore,whiletheamountofNthatwasunaccountedforinthe
2015PNBwaslowerintheOAT+Ntreatmentscomparedtothecontrol,the
reductionwasnotsignificantenoughtoimpactseason-longN-losspatterns.The
Nuptakeefficiency(NUE)of2015NONE+Nwassignificantlygreaterthanthe
control,meaningthattheoatnegativelyimpactedfertilizerNuptakeincorn
comparedtotheNONE+Ntreatment.Theoattreatmentdidnothaveasignificant
enoughimpactonmineralizationtosynchronizeplantavailableNwithplant
growthneedsanddidnotprovideanNcredit(seeChapter2).Inafallplanted
grasscovercropstudyonsandysoilOlesenetal.(2009)measuredlowerNUEin
wintercerealsoncoursesandysoilascomparedtoaloamysandorsandyloam
soil.ThesefindingsarealsosimilartoWestetal.(2016),whereinnosweetcorn
NcreditwasmeasuredfromspringplantedfieldpeaintheCentralSands.
AssessingtheQuantitativePrecisionoftheIn-situMethod
Thein-situsoilcoreandresinbeadmineralizationmethodmaylack
quantitativeprecision.Wesummedtherelativedifferencebetweentreatmentsin
soilcolumnNandtherelativedifferencebetweentreatmentsinresinN(leached
N)andsubtracteditfromtotalNapplied,calculatingover101kgNha-1as
Page 63
55unaccountedforinthenocovertreatmentsand91kgNha-1intheoattreatments
in2014.In2015,143kgha-1wasunaccountedforinthenocovertreatmentsand
142kgNha-1intheoattreatments.Inbothfieldseasonsafractionofthe
fertilizer-Nisaccountedfor,thisdiscrepancyhasalsobeenpresentedinother
mineralizationandmassbalancestudies.In1991Errebhietal.(1998)
documentedamassbalancediscrepancyrangingfrom-36to85kgNha-1ina
sandyloampotatocroppingsystem.Inthisstudytheycalculatedthedifference
betweentotalNin(initialsoilN,fertilizerN,irrigationN,mineralizedN)minus
totalNout(plantN,leachedN,finalsoilN).Saffingaetal.(1977)inaCentral
Sands-basedpotatostudycalculatedamassbalancedifferencebetween-20to95
kgNha-1ofNapplied(fertilizerNandirrigationN)minusNoutofthesoilprofile
(leachateandplantuptake).
ThemajordifferencesinNmineralizationbetweenyearscanbeattributed
tolargedifferencesintheamountofNcapturedontheresins.Weanalyzedthe
amountofappliedNthatwasleachedoutofthesoilcolumnbycalculatingthe
relativedifferencebetweenN-appliedtreatments(NONE+NandOAT+N)and
theircontrols(NONEandOAT)ontheresin.In2014,theyearwithlowbiomass,
theNONE+Ntreatmenthad33%oftotalNappliedcapturedontheresin,56kgN
ha-1.TheOAT+Ntreatmentin2014had30%oftotalNappliedcapturedonthe
resin,50kgNha-1.In2015,theyearwithgreaterbiomass,NONE+Ntreatment
onlyhad1%ofthetotalNappliedcapturedintheresins,2kgNha-1.TheOAT+N
Page 64
56treatmentonlyhad3%ofthetotalNappliedcapturedontheresinN,leaching5
kgha-1.Similarleachingstudiesconductedinirrigatedsandysoilcropping
systemsfoundarangeofvalueshigherthanourleachingvalues,howeverwithin
range.Thefollowingstudiescalculatedleachingonsandysoilsinirrigatedpotato
croppingsystems;Venetereaetal.(2011)documented21.1kgNha-1,Zvomuyaet
al.(2003)80kg-Nha-1,andDelgadoetal.(2001)94kgNha-1.
Denitrification,immobilization,andvolatilizationarethreepotential
causesofimprecisequantificationofsoilN.Highratesofdenitrificationare
unlikelyinthesesandysoils(StrongandFillery,2002).Nitrogenimmobilization
wasmeasuredinourstudyandwasonlypresentin2015at5kgNha-1.
GroundwaterNO3-N(18mgL-1NO3-N,approximately52kgNha-1)(Bundyand
Andraski,2005)appliedthroughirrigationwasnotaccountedforinthesepost-
evaluations,includingthemwouldlowerNuptake.Theotherpotentialcauseof
nitrogenlosscouldbeattributedtoammoniavolatilization.Thismaybe
responsibleforaportionoflostN,howevervolatilizationwasminimizedthrough
postfertilizerirrigationandaverageureavolatilizationrangesbetween3–40%
oftotalNapplied.Holcombetal.(2011)measured15–40%lossonsandysoil,
Rawluketal.(2001)measured20–26%lossonaclayloam,andThapaetal.
(2015)measured3–4%lossonasiltloam.In2014thefertilizerwasirrigated
within4hoursofapplication,however,in2015,theyearwithgreatercolumnN
unaccountedfor,ureawasirrigatedwithin24hoursoffertilizationandcouldbe
Page 65
57responsibleforsomeNlossthroughammoniagas.Giventhattheleachedvalues
inbothyearsaresimilartothoseintheliterature,itisunlikelythattheremaining
fertilizerNbalancewasleachedthroughthesoilprofileanduncapturedbythe
in-situresinandsoilcolumnmethod.Plantuptakewasnotafactorhereeither;
methoddesignexcludedrootsfromthesoilcolumn.
TheunaccountedforNinthesoilcolumnandresincouldbetheresultof
lackofprecisioninthein-situcolumnmethod.Soilcolumnprocedureswerethe
samebetweenbothstudyyearsandresinsachetinsertionwascompletedbythe
leadscientistsonthisproject,KateIvancicandMatthewRuark,andthe
laboratory’sseniortechnician,MackNaber.Perhapsadditionaldesignchanges
canbefurtherrefinedinthefutureinordertoimproveconsistencyinresinN
captured.TheseimperfectsoilNbudgetsindicatethatthein-situsoilcolumnand
resinbeadprocedureisnottherighttoolforprecisequantificationofnutrients;
howeveritisavaluabletoolusefulforcapturingmineralizationtreatment
differencesandtrendsovertime.
Conclusion
Spring-plantedoatswereineffectiveatalteringnitrogencyclingona
seasonal(30day)scaleintheCentralSands.Overa10-daytimescale,soilNH4
andNO3displayedsmallchangesinNcyclingpatterns,suggestingthatoatdoes
impactmineralizationinthesesystems,howeverthetransformationistoorapid
toimpactseasonal-scale(30day)netmineralizationusinganin-situ
Page 66
58mineralizationcolumn.Thein-situmethodprovidedmineralizationtrends
consistentwiththesoilNmeasurementsandothermineralizationstudies,
howeveriswasnotausefultoolforquantitativeNbudgetcalculation.While
therewasnoapparentNcreditoftheoat,itisimportanttonotethattheoatdid
notslowdownmineralizationinanymeaningfulwayregardlessofbiomass
amount.Thus,theuseofgrasscovercropsforwinderosioncontrolintheCentral
SandsofWisconsinwillhavelittleeffectonthenitrogencycle.Futureeffortsto
improveNuseefficiencyinthisregionwillneedtocomethroughin-season
managementofN.
Page 68
60TablesandFiguresTable1.MeanmonthlyairtemperatureatHancock,WI2014and2015.Meansforairtemperaturefor2014and2015arepresentedasdeviationsfrommean30-yearnormaltemperatures(1985-2015).
AirTemperature Deviationfrommean
Month 30-yrnormal 2014 2015˚C
Jan. -8 -6 -1Feb. -6 -7 -7Mar. -3 -1 3Apr. 4 1 4May. 11 3 4Jun. 18 2 0Jul. 20 -1 1Aug. 22 -2 -3Sep. 20 -5 -2Oct. 12 -4 -1Nov. 4 -7 -4Dec. -3 -1 3
Table2.Oatcovercropbiomassandnitrogenuptake.Alldataarepresentedonadry-matterbasis.Year Biomass TotalC TotalN C:N kgha-1 kgCha-1 kgNha-1 %
2014 272(40)+ 112(14) 6(0.6) 18(0.7)2015 5824(845) 2419(331) 119(30) 20(4)
+Numberinparenthesisindicatesstandarddeviation.
Page 69
61Table3.Nitrogenuptakeinsweetcornstalkandearin2014and2015.Concentrationsdeterminedunderfourtreatments(NONE,NONE+N,OAT,OAT+N).Nitrogentreatmentswere0kgNha-1and168kgNha-1.FertilizerappliedduringV4andV8growthstages56kgha-1(between0-30days)and112kgha-1(between30-60days),respectively.Partialnutrientbalance(PNB)andNuptakeefficiency(NUE)werecalculatedforeachcovercroptreatmentseparately.Withineachcolumnforeachstatisticallysignificanttreatmentfactor,meansfollowedbythesameletterarenotsignificantlydifferent(α=0.05).
2014 2015Treatment Stalk
NEarN
TNU PNB NUE StalkN
EarN
TNU PNB NUE
kgNha-1 kgNha-1NONE 29b 0.4b 29c 42b 2c 45c NONE+N 51a 30a 82a 0.2 0.3a 119a 50a 169a 0.7 0.7aOAT 39ab 11b 50b 76ab 9b 85bc OAT+N 51a 26a 78a 0.2 0.2a 90a 59a 149a
b0.4 0.4b
Page 70
62
Fig.1.WeeklyaccumulatedrateofprecipitationandirrigationforsweetcorngrowingseasonatHancockWI,2014and2015.Planting24April2014and17April2015forcovercropand13June2014and19June2015forsweetcorn.Termination10June2014and16June2015forcovercropand11September2014and11September2015forsweetcornharvest.
0
20
40
60
80
100
120
Apr May Jun Jul Aug Sep
Water(m
m)
0
20
40
60
80
100
120Water(m
m)
Precipitation(weeklytotal)
Irrigation(weeklytotal)
TotalPrecipitationOatGrowingSeasonApril13–June18=191mmofprecipitationSweetCornGrowingSeason(Precipitation+Irrigation)0-30days=72+100mm30-60days=52+112mm60-90days=139+100mm
2014
2015
TotalPrecipitationOatGrowingSeasonApril21–June17=196mmofprecipitationSweetCornGrowingSeason(Precipitation+Irrigation)0-30days=98+100mm30-60days=33+113mm60-90days=141+101mm
Page 71
63
Fig.2.MaximumandminimumdailyairtemperaturesatHancock,WIin2014and2015.
-20
-10
0
10
20
30
40Apr.
May.
Jun.
Jul.
Aug.
Sep.
DailyAirTem
perature(̊C)
2014(high) 2014(low) 2015(high) 2015(low)
Page 72
64
Fig.3.Accumulatedgrowingdegreedaysduringthecovercropandsweetcorngrowingseasons2014&2015,calculatedusingmodifiedmethod.Covercropplanting(OAT)24April2014and17April2015andtermination10June2014and16June2015.Sweetcornplanting(SC)13June2014and19June2015andharvest14September2014and11September2015.
0
100
200
300
400
500
600
700
800
900
1000GrowingDegreeDays
2014:OAT
2015:OAT
2014:SC
2015:SC
May.Jun.Jul.Aug.Sep.
Page 73
65
Fig.4.Nitrogenmineralizationin30dayincrements(0-30,30-60,and60-90)underfourtreatments(NONE,NONE+N,OAT,OAT+N)attheHancockAgriculturalExperimentStationin2014.Nitrogentreatmentswere0kgNha-1and168kgNha-1.FertilizerappliedduringV4andV8growthstages56kgha-1(between0-30days)and112kgha-1(between30-60days),respectively.ANOVAcompletedacrosstreatmentswithintimeperiods,columnswiththesameletterarenotsignificantlydifferent(P<0.1).
-5
15
35
55
75
95
115
NitrogenMineralization
(kgha
-130days-1)
0-30days
30-60days
60-90days
NONE NONE+N OAT OAT+N
a
ab
a
b
a
a
b
b
a
b
a
b
Page 74
66
Fig.5.Nitrogenmineralizationin30dayincrements(0-30,30-60,60-90)underfourtreatments(NONE,NONE+N,OAT,OAT+N)attheHancockAgriculturalExperimentStationin2015.Nitrogentreatmentswere0kgNha-1and168kgNha-1.FertilizerappliedduringV4andV8growthstages56kgha-1(between0-30days)and112kgha-1(between30-60days),respectively.ANOVAcompletedacrosstreatmentswithintimeperiods,columnswiththesameletterarenotsignificantlydifferent(P<0.1).
-15
-5
5
15
25
35
45
NitrogenMineralization
(kgha
-130days-1)
0-30days
30-60days60-90days
a
a
b
b
ab
b
c
a ab
ab
bc
a
NONE OAT OAT+NNONE+N
Page 75
67
Fig.6.Soilammonium-N,nitrate-N,andplantavailablenitrogen(PAN)concentrationscollectedapproximatelyevery10daysthroughoutthesweetcorngrowingseasonattheHancockAgriculturalResearchStationin2014.Treatmentincludenocovercrop(NONE),nocovercropwith168kgha-1ofN(NONE+N),oatcovercrop(OAT),andoatcovercropwith168kgha-1ofN(OAT+N).ArrowsindicatetimingoffertilizerapplicationsattheV4(56kg-Nha-1)andV8(112kg-Nha-1)growthstages.Timepointsareevery9–13daysstartingon13Juneandthelasttimepointwasatsweetcornharvest(11September).
1 2 3 4 5 6 7 8 9 10
NO3-N
*
*
* *
*
*
0
2
4
6
8
10
12
14
16
18
20
22
1 2 3 4 5 6 7 8 9 10
NitrogenConcentration(mgkg
-1) NH4-N
*
*
* *
1 2 3 4 5 6 7 8 9 10
NONE
NONE+N
OAT
OAT+NPAN
TimePoint
Page 76
68
Fig.7.Soilammonium-N,nitrate-N,andplantavailablenitrogen(PAN)concentrationscollectedapproximatelyevery10daysthroughoutthesweetcorngrowingseasonattheHancockAgriculturalResearchStationin2015.Treatmentincludenocovercrop(NONE),nocovercropwith168kgha-1ofN(NONE+N),oatcovercrop(OAT),andoatcovercropwith168kgha-1ofN(OAT+N).ArrowsindicatetimingoffertilizerapplicationsattheV4(56kg-Nha-1)andV8(112kg-Nha-1)growthstages.Timepointsareevery9–13daysstartingon19Juneandthelasttimepointwasatsweetcornharvest(11September2015).
*
9
1 2 3 4 5 6 7 8 9
NO3- N
*
0
2
4
6
8
10
12
14
16
1 2 3 4 5 6 7 8 9
Nitrogen
Con
centratio
n(m
gkg
-1)
NH4-N
*
*
*
1 2 3 4 5 6 7 8 9
PAN
NONE
NONE+N
OAT
OAT+N
TimePoint
Page 77
69SASCodeNMineralizationdatamin1;inputintblktrt$nmin;datalines;procglimmixdata=min1plots=studentpanel;classblktrt;modelnmin=trt;randomblk;run;procsort;byblktrtint;procprint;run;procmixed;byint;classblktrt;modelnmin=trt;randomblk;lsmeanstrt/diff;run;procsort;byblktrtint;procprint;run;procglimmixdata=min2plots=studentpanel;classblktrt;modelnmin=trt;randomblk;run;procsort;byblktrtint;procprint;run;datamin22;setmin2;lognmin=log(nmin);run;procglimmixdata=min22plots=studentpanel;classblktrt;modellognmin=trt;randomblk;run;procmixed;byint;classblktrt;modellognmin=trt;randomblk;lsmeanstrt/diff;
Page 78
70run;procsort;byblktrtint;procprint;run;SweetCornBiomassprocglimmixdata=ear15plots=studentpanel; classtrtblk; modelear=trt; randomblk;procprint;run;dataear151;setear15;logear=log(ear);run;procglimmixdata=ear151plots=studentpanel; classtrtblk; modellogear=trt; randomblk;run;procglmdata=ear151;classtrtblk;modelear=trt; randomblk;meanstrt/LSDLINESalpha=0.1;lsmeanstrt/PDIFFadjust=Tukeyalpha=0.1;run;procmixeddata=ear151;classtrtblk;modelear=trt; randomblk;lsmeanstrt/PDIFFadjust=Tukeyalpha=0.1;odsoutputdiffs=ppplsmeans=mmm;odslistingexcludediffslsmeans;run;%include'z:Kate\pdmix800.sas';%pdmix800(ppp,mmm,alpha=.1,sort=yes);run;SoilNO3andNO4procglimmixdata=bplots=studentpanel; classblocktrttime; modelammonium=trt|time;
Page 79
71 randomblockblock*trt;run;procsort;byblocktrttime;procprint;run;databb;setb;logammonium=log(ammonium);run;procglimmixdata=bbplots=studentpanel; classblocktrttime; modellogammonium=trt|time; randomblockblock*trt;run;procsort;byblocktrttime;procprint;run;procmixed;classblocktrttime;modellogammonium=trt|time;randomblockblock*trt;repeated/subject=block*trttype=sp(pow)(t);lsmeanstrt*time/diffslice=time;run;procsort;byblocktrttime;procprint;run;procmixed;classblocktrttime;modellogammonium=trt|time;randomblockblock*trt;repeated/subject=block*trttype=ante(1);lsmeanstrt*time/diffslice=time;run;procsort;byblocktrttime;procprint;run;procmixed;classblocktrttime;modellogammonium=trt|time;randomblockblock*trt;repeated/subject=block*trttype=cs;lsmeanstrt*time/diffslice=time;run;procsort;byblocktrttime;procprint;run;procmixed;
Page 80
72classblocktrttime;modellogammonium=trt|time;randomblockblock*trt;repeated/subject=block*trttype=csh;lsmeanstrt*time/diffslice=time;run;procsort;byblocktrttime;procprint;run;
Page 81
73BibliographyAndraski,T.W.,andL.G.Bundy.2005.“CoverCropEffectsonCornYield
ResponsetoNitrogenonanIrrigatedSandySoil.”AgronomyJournal97(4):1239–44.doi:10.2134/agronj2005.0052.
Baggs,E.M.,C.A.Watson,andR.M.Rees.2000.“TheFateofNitrogenfromIncorporatedCoverCropandGreenManureResidues.”NutrientCyclinginAgroecosystems56(2):153–63.doi:10.1023/A:1009825606341.
Bero,NicholasJ.,MatthewD.Ruark,andBirlLowery.2016.“BromideandChlorideTracerApplicationtoDetermineSufficiencyofPlotSizeandWellDepthPlacementtoCapturePreferentialFlowandSoluteLeaching.”Geoderma262(January):94–100.doi:10.1016/j.geoderma.2015.08.001.
Binkley,D.,andS.C.Hart.1989.“TheComponentsofNitrogenAvailabilityAssessmentsinForestSoils.”AdvancesinSoilScience10:57–112.
Brye,KristoforR.,JohnM.Norman,andErikV.Nordheim.2002.“RefinementstoanIn-SituSoilCoreTechniqueforMeasuringNetNitrogenMineralizationinMoist,FertilizedAgriculturalSoil.”AgronomyJournal94(4):864–69.doi:10.2134/agronj2002.0864.
“WisconsinAnnualStatisticsBulletin”2016.AccessedApril11.http://www.nass.usda.gov/Statistics_by_State/Wisconsin/Publications/Annual_Statistical_Bulletin/bulletin2014_web.pdf.
Bundy,LarryG.,andToddW.Andraski.2005.“RecoveryofFertilizerNitrogeninCropResiduesandCoverCropsonanIrrigatedSandySoil.”SoilScienceSocietyofAmericaJournal69(3):640–48.
Burkart,MichaelR.,andDavidE.James.1999.“Agricultural-NitrogenContributionstoHypoxiaintheGulfofMexico.”JournalofEnvironmentalQuality28(3):850–59.doi:10.2134/jeq1999.00472425002800030016x.
Cherr,C.M.,J.M.S.Scholberg,andR.McSorley.2006.“GreenManureasNitrogenSourceforSweetCorninaWarm-TemperateEnvironment.”AgronomyJournal98(5):1173–80.doi:10.2134/agronj2005.0036.
Chivenge,P.,B.Vanlauwe,R.Gentile,H.Wangechi,D.Mugendi,C.vanKessel,andJ.Six.2009.“OrganicandMineralInputManagementtoEnhanceCropProductivityinCentralKenya.”AgronomyJournal101(5):1266–75.doi:10.2134/agronj2008.0188x.
Contreras-Govea,FranciscoE.,andKennethA.Albrecht.2006.“ForageProductionandNutritiveValueofOatinAutumnandEarlySummer.”CropScience46(6):2382–86.
Delgado,JorgeA.,RonaldR.Riggenbach,RichardT.Sparks,MerlinA.Dillon,LawrenceM.Kawanabe,andRandallJ.Ristau.2001.“EvaluationofNitrate-NitrogenTransportinaPotato–BarleyRotation.”SoilScienceSocietyofAmericaJournal65(3):878.doi:10.2136/sssaj2001.653878x.
Distefano,Jf,andHlGholz.1986.“AProposedUseofIon-ExchangeResinstoMeasureNitrogenMineralizationandNitrificationinIntactSoilCores.”
Page 82
74
CommunicationsinSoilScienceandPlantAnalysis17(9):989–98.doi:10.1080/00103628609367767.
Doane,T.A.,andW.R.Horwath.2003.“SpectrophotometricDeterminationofNitratewithaSingleReagent.”AnalyticalLetters36(12):2713–22.doi:10.1081/AL-120024647.
DrinkingWater;MaximumContaminantLevelGoalsandNationalPrimartyDrinkingWaterRegulationsforLeadandCopper;FinalRule,59RulesandRegulations125-33860-33864(FederalRegister1994).Print.
Duffy,M.,&Jodi,C.(n.d.).EnterpriseBudget,SweetCorn.IowaStateUniversity;UniversityExtension.RetrievedApril16,2016,fromhttp://www.agmrc.org/media/cms/budgetsheets_sweetcorn2FINAL_697315E3311E0.pdf
Eno,CharlesF.1960.“NitrateProductionintheFieldbyIncubatingtheSoilinPolyethyleneBags.”SoilSciSocAmerProc24((4)):277–79.
Errebhi,M.,C.J.Rosen,S.C.Gupta,andD.E.Birong.1998.“PotatoYieldResponseandNitrateLeachingasInfluencedbyNitrogenManagement.”AgronomyJournal90(1):10–15.
Gentile,R.,B.Vanlauwe,C.vanKessel,andJ.Six.2009.“ManagingNAvailabilityandLossesbyCombiningFertilizer-NwithDifferentQualityResiduesinKenya.”Agriculture,Ecosystems&Environment131(3–4):308–14.doi:10.1016/j.agee.2009.02.003.
Goolsby,DonaldA.,WilliamA.Battaglin,GregoryB.Lawrence,RichardS.Artz,BrentT.Aulenbach,RichardP.Hooper,DennisR.Keeney,andGaryJ.Stensland.1999.FluxandSourcesofNutrientsintheMississippi–AtchafalayaRiverBasin:Topic3ReportfortheIntegratedAssessmentonHypoxiaintheGulfofMexico.NOAACoastalOceanProgramDecisionAnalysisSeriesNo.17.NOAACoastalOceanProgram,SilverSpring,MD.130pp.
“HancockAgriculturalResearchStation.”2016.AccessedMay31.http://hancock.ars.wisc.edu/.
Holcomb,JessC.,DanM.Sullivan,DonaldA.Horneck,andGeorgeH.Clough.2011.“EffectofIrrigationRateonAmmoniaVolatilization.”SoilScienceSocietyofAmericaJournal75(6):2341–47.
Hood-Nowotny,Rebecca,NinaHinko-NajeraUmana,ErichInselbacher,PetraOswald-Lachouani,andWolfgangWanek.2010.“AlternativeMethodsforMeasuringInorganic,Organic,andTotalDissolvedNitrogeninSoil.”SoilScienceSocietyofAmericaJournal74(3):1018–27.doi:10.2136/sssaj2009.0389.
Johnson,HeidiJ.,JedB.Colquhoun,AlvinJ.Bussan,andCarrieA.M.Laboski.2012.“EstimatingNitrogenMineralizationofCompostedPoultryManure,OrganicFertilizers,andGreenManureCropsforOrganicSweetCornProductiononaSandySoilUnderLaboratoryConditions.”HortTechnology
Page 83
75
22(1):37–43.Justic,D.,NnRabalais,andReTurner.1995.“StoichiometricNutrientBalanceand
OriginofCoastalEutrophication.”MarinePollutionBulletin30(1):41–46.doi:10.1016/0025-326X(94)00105-I.
Kaspar,T.C.,D.B.Jaynes,T.B.Parkin,T.B.Moorman,andJ.W.Singer.2012.“EffectivenessofOatandRyeCoverCropsinReducingNitrateLossesinDrainageWater.”AgriculturalWaterManagement110(July):25–33.doi:10.1016/j.agwat.2012.03.010.
Kraft,G.J.,andW.Stites.2003.“NitrateImpactsonGroundwaterfromIrrigated-VegetableSystemsinaHumidNorth-CentralUSSandPlain.”AgricultureEcosystems&Environment100(1):63–74.doi:10.1016/S0167-8809(03)00172-5.
Kumar,Virender,DanielC.Brainard,andRobinR.Bellinder.2009.“EffectsofSpring-SownCoverCropsonEstablishmentandGrowthofHairyGalinsoga(GalinsogaCiliata)andFourVegetableCrops.”HortScience44(3):730–36.
Lupwayi,NewtonZ.,andYoongK.Soon.2015.“CarbonandNitrogenReleasefromLegumeCropResiduesforThreeSubsequentCrops.”SoilScienceSocietyofAmericaJournal79(6):1650.doi:10.2136/sssaj2015.05.0198.
O’Connell,S.,W.Shi,J.M.Grossman,G.D.Hoyt,K.L.Fager,andN.G.Creamer.2015.“Short-TermNitrogenMineralizationfromWarm-SeasonCoverCropsinOrganicFarmingSystems.”PlantandSoil396(1-2):353–67.doi:10.1007/s11104-015-2594-2.
Olesen,JorgenE.,MargretheAskegaard,andIlseA.Rasmussen.2009.“WinterCerealYieldsasAffectedbyAnimalManureandGreenManureinOrganicArableFarming.”EuropeanJournalofAgronomy30(2):119–28.doi:10.1016/j.eja.2008.08.002.
Parr,M.,J.M.Grossman,S.C.Reberg-Horton,C.Brinton,andC.Crozier.2011.“NitrogenDeliveryfromLegumeCoverCropsinNo-TillOrganicCornProduction.”AgronomyJournal103(6):1578–90.
Rabalais,Nancy,andGeneTurner.“HYPOXIAPRESSRELEASE"LOUISIANAUNIVERSITIESMARINECONSORTIUM,4Aug.2014.Web.16Apr.2016.
Radicetti,Emanuele,RobertoMancinelli,RobertoMoscetti,andEnioCampiglia.2016.“ManagementofWinterCoverCropResiduesunderDifferentTillageConditionsAffectsNitrogenUtilizationEfficiencyandYieldofEggplant(SolanumMelanogenaL.)inMediterraneanEnvironment.”SoilandTillageResearch155(January):329–38.doi:10.1016/j.still.2015.09.004.
Raison,R.J.,M.J.Connell,andP.K.Khanna.1987.“MethodologyforStudyingFluxesofSoilMineral-NinSitu.”SoilBiologyandBiochemistry19(5):521–30.doi:10.1016/0038-0717(87)90094-0.
Page 84
76Rawluk,C.D.L.,CAGrant,andGJRacz.2001.“AmmoniaVolatilizationfromSoils
FertilizedwithUreaandVaryingRatesofUreaseInhibitorNBPT.”CanadianJournalofSoilScience81(2):239–46.doi:10.4141/S00-052.
Rosen,C.andEliason,R.2005."NutrientManagementforCommercialFruit&VegetableCropsinMinnesota.”2016.AccessedApril13.http://www.extension.umn.edu/garden/fruit-vegetable/nutrient-management-for-commercial-fruit-and-vegetables-in-mn/docs/5886_full.pdf.
Saffigna,P.G.,D.R.Keeney,andC.B.Tanner.1977.“Nitrogen,Chloride,andWaterBalancewithIrrigatedRussetBurbankPotatoesinaSandySoil1.”AgronomyJournal69(2):251.doi:10.2134/agronj1977.00021962006900020014x.
Sainju,U.M,B.PSingh,andW.FWhitehead.2002.“Long-TermEffectsofTillage,CoverCrops,andNitrogenFertilizationonOrganicCarbonandNitrogenConcentrationsinSandyLoamSoilsinGeorgia,USA.”SoilandTillageResearch63(3–4):167–79.doi:10.1016/S0167-1987(01)00244-6.
Saxton,A.M.1998.AMacroforConvertingMeanSeparationOutputtoLetterGroupingsinPROCMIXED.Cary:SasInstInc.
Shaw,B.1994."NitrateinWisconsin'sGroundwater:StrategiesandChallenges"Nitrogenconferenceproceedings.2016.AccessedApril13.http://www.uwsp.edu/cnr-ap/watershed/Documents/nitrogen_conferenceproceedings.pdf.
Snapp,S.S.,S.M.Swinton,andR.Labarta.2005.“EvaluatingCoverCropsforBenefits,CostsandPerformancewithinCroppingSystemNiches.”ReviewandInterpretation97(1):322–32.
Strong,D.T,andI.R.PFillery.2002.“DenitrificationResponsetoNitrateConcentrationsinSandySoils.”SoilBiologyandBiochemistry34(7):945–54.doi:10.1016/S0038-0717(02)00026-3.
Stute,J.K.,andJ.L.Posner.1995.“LegumeCoverCropsasaNitrogenSourceforCorninanOat-CornRotation.”Jpa8(3):385.doi:10.2134/jpa1995.0385.
Thapa,Resham,AmitavaChatterjee,JaneM.F.Johnson,andRakeshAwale.2015.“StabilizedNitrogenFertilizersandApplicationRateInfluenceNitrogenLossesunderRainfedSpringWheat.”AgronomyJournal107(5):1885.doi:10.2134/agronj15.0081.
ThiessenMartens,JoanneR.,JeffW.Hoeppner,andMartinH.Entz.2001.“LegumeCoverCropswithWinterCerealsinSouthernManitoba:Establishment,Productivity,andMicroclimateEffects.”AgronomyJournal93(5):1086–96.doi:10.2134/agronj2001.9351086x.
Tonitto,C.,M.B.David,andL.E.Drinkwater.2006.“ReplacingBareFallowswithCoverCropsinFertilizer-IntensiveCroppingSystems:AMeta-AnalysisofCropYieldandNDynamics.”AgricultureEcosystems&Environment112(1):58–72.doi:10.1016/j.agee.2005.07.003.
Page 85
77Venterea,RodneyT.,CharlesR.Hyatt,andCarlJ.Rosen.2011.“Fertilizer
ManagementEffectsonNitrateLeachingandIndirectNitrousOxideEmissionsinIrrigatedPotatoProduction.”JournalofEnvironmentalQuality40(4):1103–12.
Vyn,TonyJ.,JohnG.Faber,andKenJ.Janovicek.2000.“CoverCropEffectsonNitrogenAvailabilitytoCornFollowingWheat.”AgronomyJournal92(5):915–24.doi:10.2134/agronj2000.925915x.
Warncke,Darryl,JonDahl,LeeJacobs,andCarrieLaboski.2004.ExtensionBulletinE2904."NutrientRecommendationsforVegetableCropsinMichigan"VegCrops--E-2934.pdf.”n.d.
West,J.R.,M.D.Ruark,A.J.Bussan,J.B.Colquhoun,andE.M.Silva.2016.“NitrogenandWeedManagementforOrganicSweetCornProductiononLoamySand.”AgronomyJournal108(2):758–69.doi:10.2134/agronj2015.0393.
Wilhelm,Kelly,BrittneyRathsack,andJamesBockheim.2013.“EffectsofTimberHarvestIntensityonMacronutrientCyclinginOak-DominatedStandsonSandySoilsofNorthwestWisconsin.”ForestEcologyandManagement291(March):1–12.doi:10.1016/j.foreco.2012.10.047.
“WisconsinGeological&NaturalHistorySurvey »IceAgeGeology.”2016.AccessedMay25.https://wgnhs.uwex.edu/wisconsin-geology/ice-age/.
“WisconsinGroundwaterCoordinatingCouncil.”2016.AccessedApril12.http://dnr.wi.gov/topic/groundwater/documents/GCC/GwQuality/Nitrate.pdf.
Wu,Tian-Yun,B.L.Ma,andB.C.Liang.2007.“QuantificationofSeasonalSoilNitrogenMineralizationforCornProductioninEasternCanada.”NutrientCyclinginAgroecosystems81(3):279–90.doi:10.1007/s10705-007-9163-x.
Zvomuya,Francis,CarlJ.Rosen,andMichaelP.Russelle.2003.“NitrateLeachingandNitrogenRecoveryFollowingApplicationofPolyolefin-CoatedUreatoPotato.”JournalofEnvironmentalQuality32(2):480–89.doi:10.2134/jeq2003.0480.
Page 87
79Chapter4:OverallConclusionsandFutureWork
ThefindingsofthisstudydemonstratenoNbenefitfromspringplanted
covercropsonirrigatedsandysoil.Ourresultsalsoshowtherapid
mineralizationandNlosspotentialinthesesystems,framingfutureN
managementfocusaroundin-seasonapplication.Mineralizationofoatcover
cropswasnotsignificantlydifferentfromnocovercroptreatmentsona30-day
scaleandourfindingssuggestthatenvironmentalconditionsandvariable
biomassaccumulationbetweenyearscanspeedmineralizationtofewerthan10-
daycycles.Additionally,legumeandoatcovercropcombinationsgavezeroN
credittothesubsequentsweetcorncrop.Thesefindingsreiteratethenarrow
timeframeinirrigatedsandysoilsystemswhereinbothcovercropNis
mineralizedandsweetcornplantuptakeisgreatest.
Asevidentfromourfindings,mineralizationinfieldconditionsis
challengingtopredict.Fluctuationsinsoilmicrobialpopulationsinresponseto
soilmoisture,temperature,organicmattercomposition,pH,andresidualsoil
nutrientsarejustaportionofthefactorsimpactingmineralization.Measuring
theentirebiologicalprocessingpictureisnearlyimpossibleinthese
environments,andthenaturalprocessesarejustonepartofthesolution.The
socialaspectofNmanagementalsoneedstobeconsideredfortruly
comprehensivenutrientmanagementrecommendations.
Page 88
80
Optimizingyieldswhileminimizingnutrientlossisagoalforall
producers.However,withchangesinproductionrecommendationscome
questionsofeconomicviability,socialresponsibility,humanhealth,policy
implicationsandahostofotherconsiderationsimpactedinthiscomplexsystem.
Thebroader,agroecologicalimplicationsofthisstudyhavenotbeenfully
exploredandwarrantfurtherinvestigation.Applicationofthesefindingsand
considerationoftheirsocialandlandscapeimpactsiscritical.
Reductionofnitrateleachinganditsimpactongroundwaterisa
multifacetedissue.WisconsinisatopvegetableproducerintheU.S.andnutrient
managementrecommendationsplayacrucialroleinnationalwaterquality.
Recommendationdeterminationshouldbemadebyateamofmultidisciplinary
expertsratherthanafewenvironmentalscientists.Understandingthebiological
processingbehindNmanagementisjustoneofmanyfactors.Inordertoensure
thehealthofournation’swatersandthelivelihoodsthatdependonthem,policy
andmanagementrecommendationsshouldconsiderenvironmentalandsocial
impacts,alike.