Proef ingediend met het oog op het behalen van de graad van Master in de Geneeskunde Evaluating the structural effects of High Frequency spinal cord stimulation over time in patients with Failed Back Surgery Syndrome: A voxel-based morphometric study FÉLIX BUYCK 2019-2020 Promotor: Prof. Dr. M. Moens Co-promotor: Dr. L. Goudman Begeleider: S. De Groote Department of Neurosurgery Geneeskunde & Farmacie
Transcript
Proef ingediend met het oog op het behalen van de graad van Master in de Geneeskunde
Evaluating the structural effects of High Frequency spinal cord stimulation over time in patients with Failed Back Surgery Syndrome:
A voxel-based morphometric study
FÉLIX BUYCK 2019-2020
Promotor: Prof. Dr. M. Moens Co-promotor: Dr. L. Goudman Begeleider: S. De Groote Department of Neurosurgery
Geneeskunde & Farmacie
I
Contents
List of Figures .......................................................................................................................................... II
List of Tables ............................................................................................................................................ II
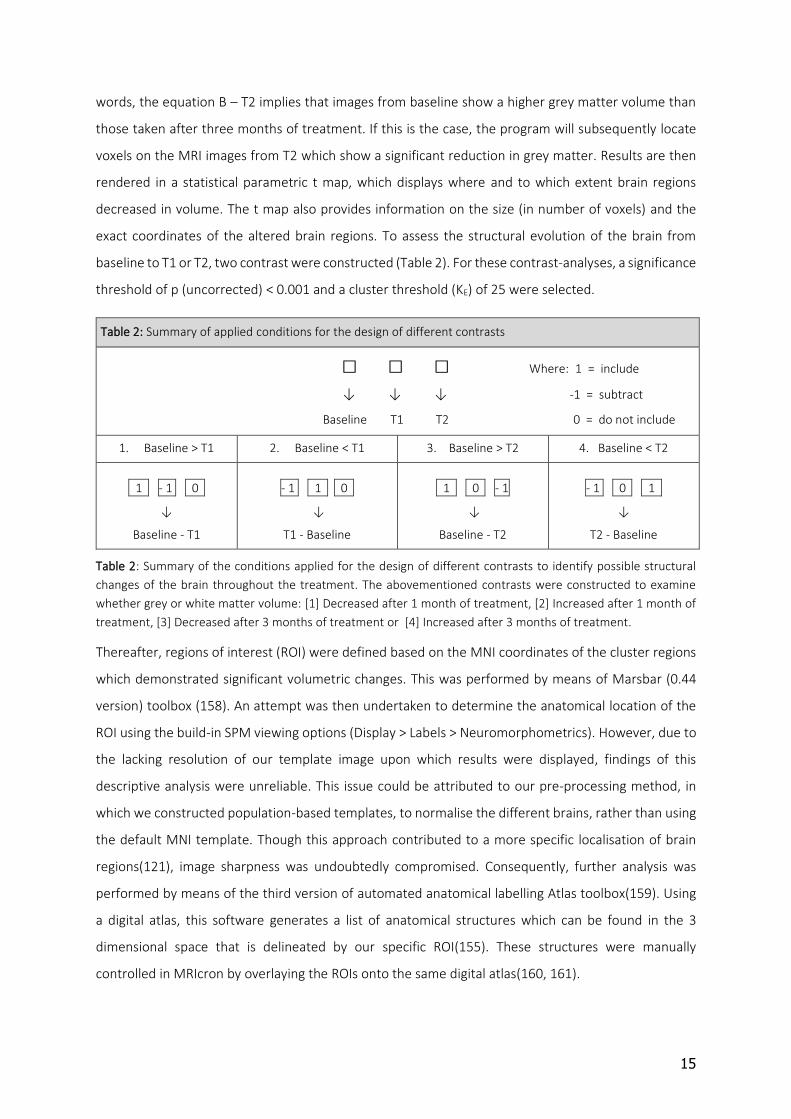
Table 2: Summary of the conditions applied for the design of different contrasts to identify possible structural
changes of the brain throughout the treatment. The abovementioned contrasts were constructed to examine
whether grey or white matter volume: [1] Decreased after 1 month of treatment, [2] Increased after 1 month of
treatment, [3] Decreased after 3 months of treatment or [4] Increased after 3 months of treatment.
Thereafter, regions of interest (ROI) were defined based on the MNI coordinates of the cluster regions
which demonstrated significant volumetric changes. This was performed by means of Marsbar (0.44
version) toolbox (158). An attempt was then undertaken to determine the anatomical location of the
ROI using the build-in SPM viewing options (Display > Labels > Neuromorphometrics). However, due to
the lacking resolution of our template image upon which results were displayed, findings of this
descriptive analysis were unreliable. This issue could be attributed to our pre-processing method, in
which we constructed population-based templates, to normalise the different brains, rather than using
the default MNI template. Though this approach contributed to a more specific localisation of brain
regions(121), image sharpness was undoubtedly compromised. Consequently, further analysis was
performed by means of the third version of automated anatomical labelling Atlas toolbox(159). Using
a digital atlas, this software generates a list of anatomical structures which can be found in the 3
dimensional space that is delineated by our specific ROI(155). These structures were manually
controlled in MRIcron by overlaying the ROIs onto the same digital atlas(160, 161).
16
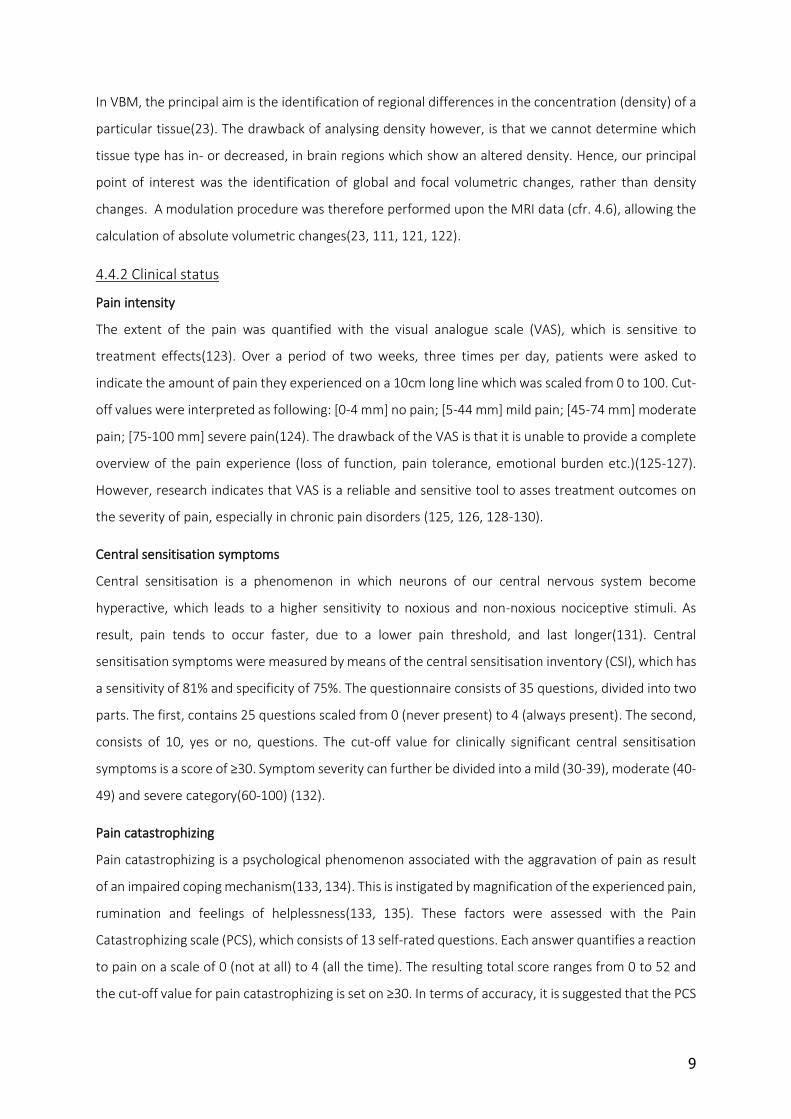
Finally, structural alterations were determined using the “get_totals” algorithm, which extracted
absolute volumes separately from all segmented MRI images. This was performed to assess volume on
whole-brain level, for grey and white matter, as well as on a regional level for our ROIs(152, 162). Grey
and white matter volumes were calculated separately for baseline, T1 and T2. Increases or decreases
in volume were then identified by subtracting the average baseline volume by the average T1 or T2
volume. Whole-brain volumes were calculated by summation of the total grey and white matter
volumes. In order to estimate the regional volumetric alterations, the Marsbar toolbox was applied to
create a mask of the brain regions which showed structural changes. This image is a 3-dimensional
outline of a ROI, which conceals the brain regions outside this domain. Grey matter volumes of ROIs
were subsequently calculated by selecting the pre-processed grey matter images in addition to one of
the masks we just created. In this manner, the algorithm would exclusively extract the volume from the
region which was delineated by the mask. Just like whole brain volumes, the procedure was performed
for baseline, T1 and T2 separately. Structural changes were then quantified by subtracting the average
baseline volume of our ROI’s from the average volumes of T1 or T2.
4.8 Statistical analysis
The evolution of the brain volume and clinical status were assessed by means of the statistical package
for the social sciences software (IBM SPSS for Windows, version 25, SPSS Inc., Chicago, Illinois, USA).
Given that our patient population was small-scaled, a non-parametrical statistical approach was
adopted for the following analyses(163). In first instance, a Friedmann test was executed on the total
volume of grey and white matter, whole-brain volumes and subsequently on our ROI’s. As such, we
assessed if any significant volumetric changes had occurred on global or focal scale. Thereafter, post-
hoc testing (Wilcoxon Signed Ranks test) was performed upon the brain volumes which showed a
significant evolution. The same procedure was applied for the clinical parameters.
A third point of focus was the correlation between the (significant) morphological alterations and the
clinical evolution of the patient. This relationship was computed in R Studio(164) by means of the
rmcorr package (165) for repeated measures correlation(166). This calculated the within-person
association of paired variables, which had been simultaneously measured on two or more occasions for
multiple subjects(166). As this approach assesses how variables evolve together over the course of
time, a temporal aspect is integrated within the correlation factor (rrm)(167). A Bonferroni correction
was applied for multiple testing in the repeated measures analysis.
17
5. Results
5.1 Participants
As mentioned earlier, 11 patients with a median age of 54.7 [Interquartile range (Q1-Q3) 51.5-57] were
recruited for this study, all of which were suffering from FBSS (Table 3). The median number of years
of pain sufferance prior to the implantation was 3 years [Q1-Q3: 2-5.5]. Patients explicitly designated
their back pain as the principle source of burden. Based on the DN4 questionnaire, we found that in 9
out of 11 cases a neuropathic component was involved in the chronic pain syndrome. All patients had
already undergone at least 1 surgical intervention of the spine. The median number of previous
operations in our population was 2 [Q1-Q3: 1-2.5], none of which had provided significant long-term
pain relief. Following the 4-week trial therapy, all patients reported a pain reduction of at least 50%.
Consequently, patients were re-scheduled for operation to implant the definitive 10kHz SCS (Senza
rechargeable system, Nevro Corp., RedwoodCity, CA, USA).
Table 3: Patient characteristics
Patient Sex Age at implantation Pain duration (years) N° surgeries DN4 score
1 F 57 14 3 6
2 F 56 5 2 4
3 M 67 1 1 5
4 M 57 1 1 6
5 F 46 5 3 4
6 F 53 3 1 5
7 F 46 3 1 8
8 F 56 3 2 5
9 F 59 6 5 2
10 F 50 1 1 8
11 F 55 8 2 2
Median 54.7 3 2 5
Q1-Q3: 51.5 – 57 2 – 5.5 1 – 2.5 4 – 6
Table 3: Patient characteristics; Pain duration is expressed in number of years. The douleur neuropathique en 4
questions (DN4) was applied to measure the neuropathic component of the lower back pain.
5.2 Clinical Results
In response to the definitive 10kHz SCS treatment, the patients’ reported outcome measurements
displayed a progressive clinical improvement over the course of time. More specifically, the PCS
( 2=6.00, p=0.05) as well as the average back ( 2=9.53, p=0.009) and leg pain ( 2=6.20, p=0.045)
intensity score appeared to have significantly improved. In contrast, no significant improvement was
18
observed in central sensitisations symptoms. We did also not observe any significant changes in
subjective reporting nor in the objective measurement of our patient’s sleep quality.
In terms of the PCS score (Fig. 7), a statistically significant decrease was observed after 1 month of
treatment (Z=-2.62, p=0.009) compared to baseline. At baseline the median score consisted of 36/52
[Q1-Q3: 20-43.5], which then decreased to 17/52 [Q1-Q3: 13-33] after 1 month of 10kHz SCS. No
further significant improvement was seen in the following two months of treatment however, where
the median score increased to 31/52 [Q1-Q3: 14-37.75]. In terms of pain intensity, a statistically
significant decrease was observed in the VAS for both back and leg pain (Fig. 7) after 1 and 3 months of
SCS. The greatest improvement was seen in back pain (B-T1: Z = -2.6, p = 0.009 | B-T2: Z = -2.6, p =
0.009). At baseline the median VAS score was 5.98 [Q1-Q3: 5.13-7.12], 4.27 [Q1-Q3: 3.37-4.38] after 1
month of SCS and 3.42 [Q1-Q3: 2.74-4.29] after 3 months of SCS. As for leg pain, the intensity mostly
decreased after 1 month (B-T2: Z = -2.09, p = 0.037). At baseline the median score was 5.85 [Q1-Q3:
3.82-6.75], 3.5 [Q1-Q3: 2.46-5.16] after 1 month of SCS and 4.21 [Q1-Q3: 3.63-5] after 3 months of SCS.
Figure 7: Boxplots display the evolution of, respectively, the PCS, the average VAS score for back and leg pain. The
average was calculated from the VAS score which was repeatedly collected over periods of 2 weeks. (*) Indicates
a statistically significant decrease in the PCS or VAS score relative to the baseline measurement. The black line
within the blue beam indicates the median PCS score and the median of the average VAS score at respectively
baseline, T1 and T2.
5.3 VBM Results
In terms of global volumetric measurements, no significant changes were observed in total grey matter
(p = 0.178), white matter (p = 0.529) nor in whole brain volume (p = 0.148) after 1 and 3 months of
treatment with 10kHz SCS. On a regional level, no significant in- or decrease was seen in white matter.
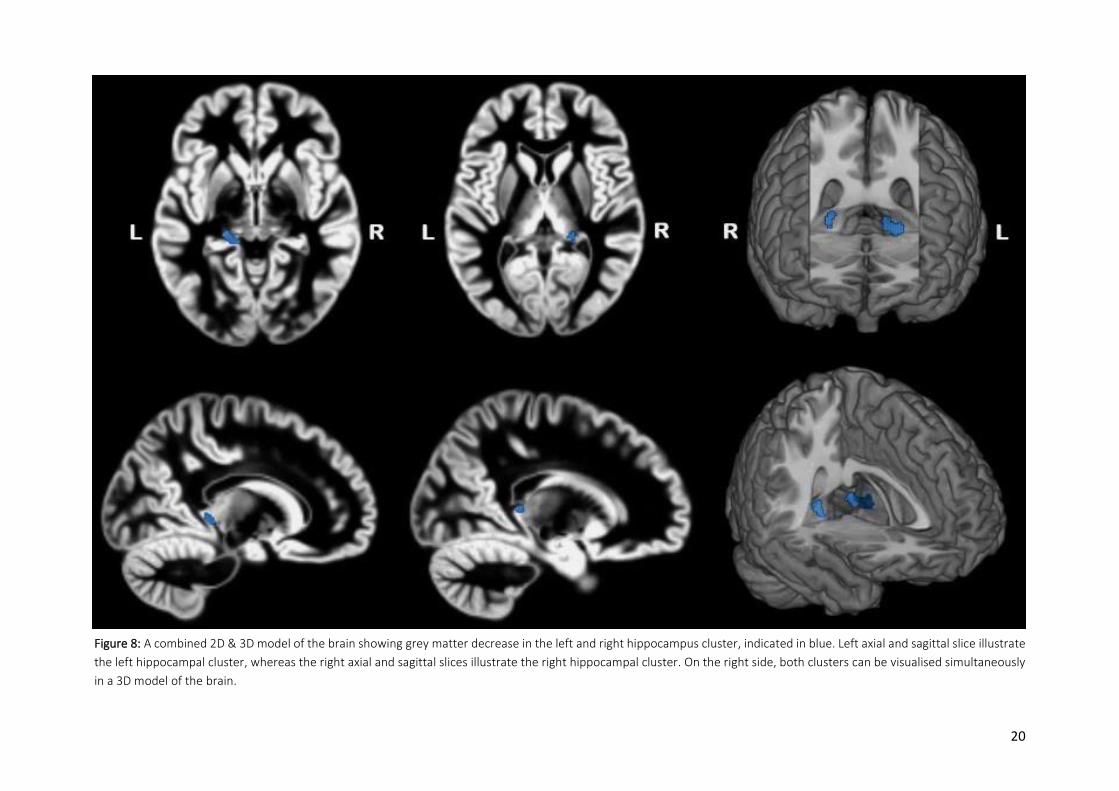
In terms of grey matter however, a significant decrease in volume was observed after 3 months of
treatment compared to baseline (Table 5). The highest voxel changes (Table 4) were located in the left
and right hippocampus (Fig. 8), which respectively comprised 43,56% and 55,77% of our ROI according
to the aal3 labelling procedure. The volume of our left ROI consisted of 0.133mL (Q1-Q3: 0.127-
* * *
* *
19
0.137mL) at baseline, 0.122mL (Q1-Q3: 0.114-0.127mL) at T1 and 0.120mL (Q1-Q3: 0.117-0.126mL) at
T2. The right ROI consisted of 0.055mL (Q1-Q3: 0.051-0.057mL) at baseline, 0.052mL (Q1-Q3: 0.048-
0.055mL) at T1 and 0.049mL (Q1-Q3: 0.047-0.052mL) at T2.
Table 4: Summary of global volumetric changes
B T1 T2
Median TGMV:
Q1-Q3:
611.28mL
586.61– 655.52 mL
616.01mL
594.52-656.86 mL
611.87mL
586.37-657.89 mL
Median TWMV:
Q1-Q3:
420.34mL
397.45-440.43 mL
411.55mL
392.35-449.5 mL
427.44mL
395.19-463.23 mL
Median WBV:
Q1-Q3:
1022mL
1001.57–1083.79 mL
1026.53mL
986.42-1135.62 mL
1031.58mL
999.5-1129.26 mL
Table 4: Summary of the evolution of the median total grey matter volume (TGMV), total white matter volume
(TWMV) and median whole brain volume (WBV). The latter one is the sum of TGM and TWM. For each variable
the corresponding interquartile range of the measurements from that specific timepoint are specified. No
significant changes in global brain volumes were observed after 1 and 3 months of SCS.
Table 5: VBM results
Brain region Hemisphere MNI coordinates (mm)
X Y Z
Number of
voxels
T-value P-value
(uncorrected)
Baseline >T1 - - - - - - -
Baseline < T1 - - - - - - -
Baseline > T2
Hippocampus Left -12 -38 -2 101 4.40 P<0.001
Hippocampus Right 20 -36 6 52 3.83 P<0.001
Baseline < T2 - - - - - - -
Table 5: Results of VBM analysis for grey matter. Displayed above are two clusters of voxels which significantly
decreased in volume from B to T2. More precisely, the left and right hippocampus.
20
Figure 8: A combined 2D & 3D model of the brain showing grey matter decrease in the left and right hippocampus cluster, indicated in blue. Left axial and sagittal slice illustrate
the left hippocampal cluster, whereas the right axial and sagittal slices illustrate the right hippocampal cluster. On the right side, both clusters can be visualised simultaneously
in a 3D model of the brain.
21
5.4 Correlation between structural & clinical data
A significant correlation was observed over time between the volumetric change in our patient’s left
and right ROI and the improvement in back pain score. For the former, the correlation consisted of rrm=
Similarly, when looking at the evolution of, respectively, the left (Fig. 9A, right) and right (Fig. 9B, right)
ROI and the back pain score, a similar trend is observed in both parameters.
Figure 9: The left diagram displays the repeated measures correlation between the hippocampal volume and the
average score for back pain over two weeks. Each colour corresponds to one of the eleven patients and contains
three coordinates [1] VolumeB ; Average VASB [2] VolumeT1 ; Average VAST1 [3] VolumeT2 ; Average VAST2. Each
dotted line represents the interpolation line of the variables of that patient. The right pane shows the evolution
of the hippocampal volume and VAS score for back pain. Blue dots represent hippocampal volumes of all 11
patients, whereas red dots represent the average back pain score. The blue and red line are the interpolation line
of, respectively, the hippocampal volume and average back pain score.
A Left hippocampus
B Right hippocampus
22
6. Discussion
High-Frequency Spinal Cord Stimulation
Spinal cord stimulation was developed in 1967 by Shealy et al. to treat refractive pain resulting from
cancer(72, 73). The idea behind this novel therapy was primarily based upon the gate control theory of
Melzack et al. (7, 12, 67, 72). This innovation offered an important improvement of patient’s quality of
life compared to previous treatment options (primarily oral analgesics)(7). However, the downside of
the therapy was that patients had to endure a constant tingling sensation resulting from the
paraesthesia, necessary to mask the pain. Moreover, a diminishing efficacy was observed over time in
certain patients due to factors such as a poor maintenance of the therapeutic levels and inconsistent
delivery of paraesthesia(69, 168). These limitations led to the development of newer technologies and
modalities of SCS over the past decades.
As a result, sub-threshold SCS emerged on the market. Although multiple modalities are available in
this matter, all share the same principle, being paraesthesia-free pain alleviation. In this study we
analysed 10kHz SCS. Although the focus was primarily set on the supra-spinal effects of this treatment,
clinical effects did remain an important factor in order to explore and clarify effects of 10kHz SCS. Our
clinical findings support the idea that 10kHz SCS can reduce pain in patients suffering from FBSS.
Patients showed high response rates on short notice in terms of pain reduction in which they displayed
a statistically significant reduction in back and leg pain intensity. These findings are in accordance with
recent studies by Kapural et al., Al-kaisy et al., Di Benedetto et al. and De Andres et al., which imply that
10kHz SCS can effectively reduce chronic back pain in patients suffering from failed back surgery
syndrome(66, 169). Interestingly, leg pain intensity as well as the pain catastrophizing score display an
increase after the initial significant reduction. In both cases however, values remain lower than those
prior to treatment with 10kHz SCS. Moreover, we cannot exclude the possibility that pain intensity as
well as pain-related psychological phenomena, such as pain catastrophizing, will gradually decline of
time. The treatment of chronic low back pain is after all a life-long process.
Despite that a pain-free condition is unattainable, even after several years of SCS, much progress has
been made in this treatment. Several studies comparing patients receiving 10kHz SCS to patients
receiving conventional SCS, suggest that the former is associated with higher response rates for back
and leg pain as well as a higher decrease in the usage of opioid analgesics(7, 11, 66, 67, 69, 75, 168).
These observations stand in line with the SENZA RCT and its follow-up study, which suggest that the
10kHz modality delivers superior results compared to conventional SCS(170, 171). The suggested
benefit of 10kHz SCS has recently been supported by a study of Strauss et al., which performed a real-
world multicentre retrospective review on the efficacy of 10kHz SCS in 1660 patients(172). However,
23
studies by De Andres et al. and Russo et al. were unable to find significant differences in clinical
effectiveness between 10kHz and conventional SCS(66, 77). Although opinions regarding the added
benefit of 10kHz over conventional SCS remain variable, it appears that 10kHz SCS could have the
benefit of improving general life quality. This is due to a higher sleep quality, lower functional
impediment and higher satisfaction resulting from the absence of paraesthesia(7, 11, 169, 172, 173).
Down below or high up there? The spinal & supra-spinal effects
The gate control theory, upon which the first SCS therapy was based, describes the existence of an
endogenous mechanism involving inhibitory interneurons located in the dorsal horn of the spinal cord,
which could block the transmission of nociceptive signalling to the brain. These interneurons make
synaptic connections with large diameter αβ fibres, which stimulate the interneurons and convey
vibratory sensation. Synaptic connections are also made with small diameter Aδ and C fibres, which
both inhibit the interneuron and convey nociceptive stimuli(74). Based on this theory, Shea et al.
believed it was possible to reduce pain by electrically stimulating the dorsal horn of the spine. As such,
the subsequent activation of large diameter Aβ fibres would result in the inhibition of pain transmission
to the brain via small-diameter Aδ and C fibres and simultaneously the induction of paraesthesia(11,
12, 58, 62, 67-70, 75-82).
Presently, this mechanism of action is challenged with the rise of new devices and stimulation
modalities, such as 10kHz SCS. These innovations present function and limitations which cannot be
attributed to the gate control theory(12, 70, 77, 78, 80). 10kHz SCS for instance, does not produce
paraesthesia, which implies that pain alleviation is not related to the size of the area covered by
paraesthesia. Furthermore, when the electrical stimulation is ceased, a temporary continuation of pain
alleviation can be observed. 10kHz SCS, nor any other type of SCS is unable to reduce acute nociceptive
pain. For these reasons, it is believed that the pain-relieving mechanism of 10kHz SCS, as well as other
modalities, rely upon different (more complex) mechanisms.
An initial working hypothesis was postulated at the 2016 Neuromodulation scientific congress in San
Fransisco(68, 70), which suggested 10kHz SCS: [1] induces a fast-acting reversible blockage of the neural
depolarisation, thus impeding the nerve conduction. [2] disrupts signalling patterns of neural clusters
which fire simultaneously. [3] induces individual nerve cell signalling through temporal summation of
electrical stimuli. Similarly, in a study by Arle et al., a differential blockade theory is brought forward as
potential mechanism of action. Authors suggest that like so, 10kHz SCS preferentially inhibits large
diameter fibres, yet activates medium and small diameter fibres in such manner to inhibit signalling
from wide dynamic range neurons(78). However, both hypotheses have been challenged by a study of
Song et al., which suggests 10kHz stimulation is unable to alter neural activity of the dorsal horn and
24
therefore unable to generate any conduction block(174). However, it should be noted that this study
presents an important pitfall. Namely, 10kHz SCS of the dorsal horn was only maintained for a period
of 2 hours. We believe this could have important implications on the measured effects at the level of
the dorsal horn. After all, research indicates that the maximal effectiveness of 10kHz stimulation is only
reached after several days(69, 70, 174). Moreover, a study by McMahon et al. observed a significant
reduction in C fibre induced evoked potentials after sub-threshold 10kHz SCS(62, 70, 175). This suggest
that 10kHz SCS could modulate the activity of dorsal horn fibres, independently of action potentials.
Although studies have mainly focused on segmental effects of 10kHz SCS, little is known about the
supra-spinal mechanisms. Considering the experience of pain is (in part) modulated on cerebral
level(10, 14, 16, 18, 35, 176) it seems unlikely that the pain reduction, resulting from 10kHz SCS, can be
attributed to segmental effects alone(69, 70, 77, 80, 151). Moreover, research suggests that the
development of chronic pain might partly result from dysregulation of cerebral processes involved in
sensory, emotional and cognitive processing of pain(10, 14, 16, 26, 27, 33, 38, 41). Therefore, we have
reason to believe that the proposed spinal effects of 10kHz SCS might be complemented by supra-spinal
mechanisms to induce the observed pain reduction. This idea is supported by different
neuroradiological studies, which observed changes in neural activity of the brain in patients receiving
SCS(83, 85, 94-100). For instance, a study by Moens et al. found that the thalamic activity as well as its
functional connectivity with the rostral & caudal cingulate cortex and the insula had decreased(96).
Interestingly, in a study by De Groote et al., increased functional connectivity was seen between
structures of the salience network and the fronto-parietal network as well as the central executive
network in patients receiving 10kHz SCS(85). These findings suggest that SCS may exert its function by
modulation of networks which connect brain regions involved in the cognitive, affective or sensory
processing of pain(70, 99). Up until present however, no other studies have evaluated the pre- and
postoperative supra-spinal effects of 10kHz SCS. To our knowledge, this is the first MRI-based study to
have explored the morphological effects on a supra-spinal level of 10kHz SCS treatment in patients
suffering from failed back surgery syndrome. Our study therefore offers new information which could
help further clarification of current hypothesises and/or identification of new mechanisms of action.
The second potential supraspinal mechanism by which SCS may contribute to pain reduction is thought
to engage through action of descending neurohumoral pathways upon the dorsal horn. This has been
suggested by studies which observed significant changes in the concentration of stimulating and
inhibiting neurotransmitter such as serotonine, norepinephrine or aminobutyric acid (GABA), in
patients responding to SCS(62, 70, 80, 82, 94). This was however not further analysed in this study.
25
Does our brain forget the pain?
As mentioned earlier, there has been a growing amount of research in the field of neuroplasticity over
the past years, especially in the context of chronic pain disorders. Like so, studies have provided
evidence showing that the brain endures structural and functional changes as result of a prolonged
exposure to pain. However, there is an important inconsistency in reported findings between different
studies. For instance some studies reported an increase in grey matter volume of the thalamus in
patients suffering from chronic pain, whereas others have observed the opposite(4, 29, 30, 32).
Furthermore, there is an important heterogeneity in the reported brain regions that show an altered
morphometry or structure. This inter-study variability is likely due to sample size differences, clinical or
demographic variability, and differences in image acquisition or processing (22, 26, 30, 177).
Nonetheless, neuroplastic changes of certain brain regions are consistent across different studies. The
hippocampus for instance appears to be one of the few regions that tends to increase in volume due
to chronic pain(3, 36, 40, 101, 176, 178). Other brain areas which endure structural alterations as result
of chronic low back pain include regions such as the pre-frontal cortex, pre- and post-central gyrus,
middle cingulate gyrus, insula and thalamus(4, 8, 26-29, 32).
On the other hand, our study observed decreases of the grey matter volume in the hippocampus
bilaterally in patients receiving spinal cord treatment after just 3 months. This stands in line with the
study by Luchtmann et al. which observed a decreased hippocampal volume after microsurgical lumbar
discectomy in patients suffering from chronic low back pain(156). These findings suggest that chronic
pain treatment could reverse the previously occurred neuroplastic changes resulting from an altered
cerebral function(85, 102, 156). Moreover, this emphasizes the importance of the hippocampal
formation in the modulation of pain. This suspicion is supported by other research which has shown
important similarities between chronic pain and the learning mechanism that is coordinated by the
hippocampus(36, 179-188). Essentially, chronic pain is believed to be associated with maladaptive
plasticity of the hippocampus which gives rise to the persistence of pain-related memories and/or
inability of their extinction(3, 26, 27, 31, 36, 101, 156, 176, 182-185). Ultimately, structural and
functional alterations would result in the common comorbidities seen in chronic pain disorders such as
cognitive impairment, deterioration of long-and short term-memory and the inability to extinct pain
memories(179, 182, 184, 186, 187).
Other than its function in learning mechanisms and memory, recent studies also suggest that the
hippocampal formation could be involved in the modulation of pain(178, 179, 184, 185, 189). One way
of doing so is by influencing our behavioural response to pain, together with the amygdala, by
amplifying certain nociceptive aversive signals(101, 182, 189, 190). As such, our brain would be able to
26
favour behaviour that incites withdrawal from an aversive stimulus(3, 189). Functional magnetic
resonance studies also revealed the involvement of the hippocampus in the contextual and emotional
processing of pain(17, 183-185, 187, 189). In this manner, the hippocampus could affect the pain
perception as well as the consolidation of the pain memory(179, 182, 187, 189, 190). Lastly, the
experience of an aversive event as well as sensitivity to pain appears to be influenced by the anticipation
on pain via the hippocampus(182, 184, 189-192).
Based on these findings, it is possible that the observed decrease in grey matter volume in our patient´s
brain could be associated with the eradication of certain pain-related memories. As such we believe
10kHz SCS could stimulate the normalisation of the neurophysiological functioning of the pain
neuromatrix. By means of this mechanism, the reduction in central sensitisation could allow segmental
effects to reduce pain more effectively. Moreover, as proposed in a study by De Groote et al., pain
reduction might result from a decline in the affective component of pain processing(85, 156).
Strengths & limitations
One of the strengths of this study is the usage of the DARTEL protocol for the normalisation of our
anatomical images. The application of this algorithm yields a higher accuracy in pre-processing than the
standard protocol in terms of inter-subject registration because deformations fields, necessary for
spatial normalisation are re-calculated multiple times(110, 121, 193-195). Moreover, DARTEL-
normalised images ensure a higher specificity for volumetric analysis, as templates are based upon
study-specific data(196). On the contrary, the default MNI template is based on an average image of
152 MRI scans of healthy subjects(197). Thus, if we had used the default settings for the normalisation
procedure, the calculated deformation field would have likely concealed volumetric alterations. This
results from the fact that patients who suffer from chronic pain disorders often endure structural
cerebral changes. The DARTEL template already included such morphological characteristics.
Therefore, our patient’s MRI images only necessitated smaller deformations for normalisation into the
common stereotactic space. As such, important structural features could be preserved. Summarised,
these factors have contributed to the validity of the VBM results, which are therefore less likely to have
resulted from machine imperfections or detection flaws. We also believe that the short-term
assessment on multiple occasions ensured a more elaborate insight into the supra-spinal effects.
Likewise, this has also helped us to obtain more information about the temporal aspect of the
neuroplasticity occurring after 10kHz SCS.
Some might argue that an important limitation of this study was the small sample size as well as its
short time frame. However, no studies have yet been published, which evaluated the structural effects
of 10kHz SCS treatment in FBSS patients. Therefore, our study can be considered a pilot study, which
27
sets the foundation for future, larger, studies. A second limitation of our study is that the identified
ROI’s were not FWE (family-wise error rate) corrected, which implies that there is a higher chance of
obtaining significant results by chance due to multiple testing rather than actual alteration of
volume(198). Hence, strict p values were applied to our SPM results to minimize this risk. Another
limitation was that the automated labelling procedure was unable to label 15 to 19% of our ROI´s. This
is likely related to the fact that the labelling procedure uses an atlas which is based upon a normalized
high-resolution T1 MRI image of a single (healthy) individual(199). Therefore, there might be a discrete
mismatch in the anatomical location of our clusters between the digital atlas and our patients’ brain.
Ideally, this labelling procedure should have been performed by means of a digital atlas which was
developed with images from our own subjects. This would determine the anatomical location of our
ROI in a much more precise way than our current approach. However, this would demand much more
time and expertise, which was unattainable for this sort of work. Thus, to ensure an optimal accuracy
of the labelling procedure, we controlled the anatomical location on MRIcron (with the same atlas) as
well as an Sectional Anatomical Atlas of Depreitere et al.(200). Lastly, an important limitation of this
study is that we are unable to determine whether the observed supra-spinal effects result from either
direct or indirect treatment effects. In other words, we cannot exclude the possibility that
morphological alterations are the consequence and not the cause of the pain alleviation. (34).
Moreover, the associated reduction of pain medication might also have influenced our findings.
However, it would be senseless to oblige patients to maintain the usage of oral analgesics during
treatment in order to try and neutralise this effect.
28
7. Conclusion
Chronic back pain is a complex cognitive-affective syndrome, which drastically affects a patient’s quality
of life as result of the physical and psychological deterioration they endure. Today, the most common
approach to chronic pain treatment is the application of oral analgesics. Interventional treatments may
also be carried out in some instances, if the underlying cause of the back pain is thought to be related
to an organic or structural defect. However, both therapeutic approaches only provide a limited amount
of pain relief and often fail to guarantee a substantial improvement of the patient’s quality of life on a
long-term basis. As a result, the management of chronic pain remains a challenging task for clinicians
as well as for the patients themselves.
Spinal cord stimulation has proven to be an interesting alternative to the former options for treating
refractive pain. This is particularly true for novel SCS modalities such as 10kHz SCS, which has
significantly contributed to the quality of this therapy by the establishment of paraesthesia-free
stimulation. Despite its success however, we still do not fully comprehend the exact mechanisms by
which this treatment relieves pain. Although studies have mainly focused on segmental effects of 10kHz
SCS, little is known about the supra-spinal mechanisms. Thus, the goal of this study was to objectify the
impact of 10kHz SCS on the brain from a structural perspective.
In summary, our findings demonstrate that 10kHz spinal cord stimulation in patients suffering from
FBSS can induce significant structural alterations to the brain after just 3 months of treatment. More
precisely, a decrease in the left and right hippocampal volume. Statistical analysis further revealed a
negative correlation between the observed volumetric decrease and the experienced back pain
intensity. This suggest that these supra-spinal effects might contribute to the pain-relieving effect of
10kHz SCS. However, such assumption should not be taken for granted, as our findings do not provide
the necessary evidence allowing to determine the nature of this correlation. In other words, the
observed alteration of the hippocampal volume might be the cause of pain alleviation after delivery of
sub-threshold electrical impulses to the spine. On the other hand, the reduction of the hippocampal
volume may also be the consequence of the clinical effect itself.
Quite evidently, further research is required to estimate the role of this supra-spinal mechanism in the
clinical effects of spinal cord stimulation on chronic back pain. Moreover, future studies will also need
to explore the existence of other potential supra-spinal sites of action. Regarding the latter, suggestions
include structures such as the thalamus, insula, cingulate gyrus etc. These brain areas have frequently
been discussed in functional imaging studies and may potentially unveil novel paths upon which we
may act to treat chronic back pain.
29
8. Acknowledgement
I would like to thank Prof. Moens as well as Dr. Lisa Goudman and Sander De Groote for their
constructive judgement. Their support and guidance during my work were indispensable. I also express
my sincere appreciation towards my family for reviewing my work and their endless encouragement.
30
9. References 1. O'Brien T, Breivik H. The impact of chronic pain-European
patients' perspective over 12 months. Scand J Pain. 2012;3(1):23-9.
2. Van Buyten JP. Neurostimulation for chronic neuropathic back pain in failed back surgery syndrome. J Pain Symptom Manage. 2006;31(4 Suppl):S25-9.
3. Nees F, Ruttorf M, Fuchs X, Rance M, Beyer N. Volumetric brain correlates of approach-avoidance behavior and their relation to chronic back pain. Brain Imaging Behav. 2019.
4. Ivo R, Nicklas A, Dargel J, Sobottke R, Delank KS, Eysel P, et al. Brain structural and psychometric alterations in chronic low back pain. Eur Spine J. 2013;22(9):1958-64.
5. Breivik H, Collett B, Ventafridda V, Cohen R, Gallacher D. Survey of chronic pain in Europe: prevalence, impact on daily life, and treatment. Eur J Pain. 2006;10(4):287-333.
6. Grider JS, Manchikanti L, Carayannopoulos A, Sharma ML, Balog CC, Harned ME, et al. Effectiveness of Spinal Cord Stimulation in Chronic Spinal Pain: A Systematic Review. Pain Physician. 2016;19(1):E33-54.
7. Al-Kaisy A, Van Buyten JP, Amirdelfan K, Gliner B, Caraway D, Subbaroyan J, et al. Opioid-sparing effects of 10 kHz spinal cord stimulation: a review of clinical evidence. Ann N Y Acad Sci. 2019.
8. Fritz HC, McAuley JH, Wittfeld K, Hegenscheid K, Schmidt CO, Langner S, et al. Chronic Back Pain Is Associated With Decreased Prefrontal and Anterior Insular Gray Matter: Results From a Population-Based Cohort Study. J Pain. 2016;17(1):111-8.
9. Meucci RD, Fassa AG, Faria NM. Prevalence of chronic low back pain: systematic review. Rev Saude Publica. 2015;49:1.
10. Ng SK, Urquhart DM, Fitzgerald PB, Cicuttini FM, Hussain SM, Fitzgibbon BM. The Relationship Between Structural and Functional Brain Changes and Altered Emotion and Cognition in Chronic Low Back Pain Brain Changes: A Systematic Review of MRI and fMRI Studies. Clin J Pain. 2018;34(3):237-61.
11. Head J, Mazza J, Sabourin V, Turpin J, Hoelscher C, Wu C, et al. Waves of Pain Relief: A Systematic Review of Clinical Trials in Spinal Cord Stimulation Waveforms for the Treatment of Chronic Neuropathic Low Back and Leg Pain. World Neurosurg. 2019;131:264-74.e3.
12. Schmidt GL. The Use of Spinal Cord Stimulation/Neuromodulation in the Management of Chronic Pain. J Am Acad Orthop Surg. 2019;27(9):e401-e7.
13. Treede RD, Rief W, Barke A, Aziz Q, Bennett MI, Benoliel R, et al. Chronic pain as a symptom or a disease: the IASP Classification of Chronic Pain for the International Classification of Diseases (ICD-11). Pain. 2019;160(1):19-27.
14. Apkarian AV, Bushnell MC, Treede RD, Zubieta JK. Human brain mechanisms of pain perception and regulation in health and disease. Eur J Pain. 2005;9(4):463-84.
15. Mouraux A, Iannetti GD. The search for pain biomarkers in the human brain. Brain. 2018;141(12):3290-307.
16. Knudsen L, Petersen GL, Norskov KN, Vase L, Finnerup N, Jensen TS, et al. Review of neuroimaging studies related to pain modulation. Scand J Pain. 2018;2(3):108-20.
17. Borsook D, Becerra L, Hargreaves R. Biomarkers for chronic pain and analgesia. Part 2: how, where, and what to look for using functional imaging. Discov Med. 2011;11(58):209-19.
18. Martucci KT, Ng P, Mackey S. Neuroimaging chronic pain: what have we learned and where are we going? Future Neurol. 2014;9(6):615-26.
19. Grothe M, Lotze M, Langner S, Dressel A. The role of global and regional gray matter volume decrease in multiple sclerosis. J Neurol. 2016;263(6):1137-45.
20. Lansley J, Mataix-Cols D, Grau M, Radua J, Sastre-Garriga J. Localized grey matter atrophy in multiple sclerosis: a meta-analysis of voxel-based morphometry studies and associations with functional disability. Neurosci Biobehav Rev. 2013;37(5):819-30.
21. Lin CH, Chen CM, Lu MK, Tsai CH, Chiou JC, Liao JR, et al. VBM Reveals Brain Volume Differences between Parkinson's Disease and Essential Tremor Patients. Front Hum Neurosci. 2013;7:247.
22. Radua J, Grau M, van den Heuvel OA, Thiebaut de Schotten M, Stein DJ, Canales-Rodriguez EJ, et al. Multimodal voxel-based meta-analysis of white matter abnormalities in obsessive-compulsive disorder. Neuropsychopharmacology. 2014;39(7):1547-57.
23. Mechelli A, Price C, Friston K, Ashburner J. Voxel-Based Morphometry of the Human Brain: Methods and Applications2005; 1(1). Available from: https://www.fil.ion.ucl.ac.uk/spm/doc/papers/am_vbmreview.pdf.
24. Scarpazza C, Simone MSD. Voxel-based morphometry: current perspectives. Neuroscience and Neuroeconomics. 2019;5:19-35.
25. Fonseka TM, MacQueen GM, Kennedy SH. Neuroimaging biomarkers as predictors of treatment outcome in Major Depressive Disorder. J Affect Disord. 2018;233:21-35.
26. Yuan C, Shi H, Pan P, Dai Z, Zhong J, Ma H, et al. Gray Matter Abnormalities Associated With Chronic Back Pain: A Meta-Analysis of Voxel-based Morphometric Studies. Clin J Pain. 2017;33(11):983-90.
27. Mao C, Wei L, Zhang Q, Liao X, Yang X, Zhang M. Differences in brain structure in patients with distinct sites of chronic pain: A voxel-based morphometric analysis. Neural Regen Res. 2013;8(32):2981-90.
28. Ung H, Brown JE, Johnson KA, Younger J, Hush J, Mackey S. Multivariate classification of structural MRI data detects chronic low back pain. Cereb Cortex. 2014;24(4):1037-44.
29. Schmidt-Wilcke T, Leinisch E, Ganssbauer S, Draganski B, Bogdahn U, Altmeppen J, et al. Affective components and intensity of pain correlate with structural differences in gray matter in chronic back pain patients. Pain. 2006;125(1-2):89-97.
30. Pan PL, Zhong JG, Shang HF, Zhu YL, Xiao PR, Dai ZY, et al. Quantitative meta-analysis of grey matter anomalies in neuropathic pain. Eur J Pain. 2015;19(9):1224-31.
31. Baliki MN, Schnitzer TJ, Bauer WR, Apkarian AV. Brain morphological signatures for chronic pain. PLoS One. 2011;6(10):e26010.
32. Apkarian AV, Sosa Y, Sonty S, Levy RM, Harden RN, Parrish TB, et al. Chronic back pain is associated with decreased prefrontal and thalamic gray matter density. J Neurosci. 2004;24(46):10410-5.
33. Kregel J, Meeus M, Malfliet A, Dolphens M, Danneels L, Nijs J, et al. Structural and functional brain abnormalities in chronic low back pain: A systematic review. Semin Arthritis Rheum. 2015;45(2):229-37.
34. Rodriguez-Raecke R, Niemeier A, Ihle K, Ruether W, May A. Brain gray matter decrease in chronic pain is the
consequence and not the cause of pain. J Neurosci. 2009;29(44):13746-50.
35. Sinding C, Gransjoen AM, Schlumberger G, Grushka M, Frasnelli J, Singh PB. Grey matter changes of the pain matrix in patients with burning mouth syndrome. Eur J Neurosci. 2016;43(8):997-1005.
36. Khan SA, Keaser ML, Meiller TF, Seminowicz DA. Altered structure and function in the hippocampus and medial prefrontal cortex in patients with burning mouth syndrome. Pain. 2014;155(8):1472-80.
37. Liao X, Mao C, Wang Y, Zhang Q, Cao D, Seminowicz DA, et al. Brain gray matter alterations in Chinese patients with chronic knee osteoarthritis pain based on voxel-based morphometry. Medicine (Baltimore). 2018;97(12):e0145.
38. Buckalew N, Haut MW, Morrow L, Weiner D. Chronic pain is associated with brain volume loss in older adults: preliminary evidence. Pain Med. 2008;9(2):240-8.
39. Valet M, Gundel H, Sprenger T, Sorg C, Muhlau M, Zimmer C, et al. Patients with pain disorder show gray-matter loss in pain-processing structures: a voxel-based morphometric study. Psychosom Med. 2009;71(1):49-56.
40. Luchtmann M, Firsching R. Central plasticity resulting from chronic low back pain in degenerative disorders of the spine. Neural Regen Res. 2015;10(8):1234-6.
41. Ruscheweyh R, Deppe M, Lohmann H, Stehling C, Floel A, Ringelstein EB, et al. Pain is associated with regional grey matter reduction in the general population. Pain. 2011;152(4):904-11.
42. Whitten CE, Donovan M, Cristobal K. Treating chronic pain: new knowledge, more choices. Perm J. 2005;9(4):9-18.
43. Hofmeister M, Memedovich A, Brown S, Saini M, Dowsett LE, Lorenzetti DL, et al. Effectiveness of Neurostimulation Technologies for the Management of Chronic Pain: A Systematic Review. Neuromodulation. 2019.
44. Chung JW, Zeng Y, Wong TK. Drug therapy for the treatment of chronic nonspecific low back pain: systematic review and meta-analysis. Pain Physician. 2013;16(6):E685-704.
45. Martell BA, O'Connor PG, Kerns RD, Becker WC, Morales KH, Kosten TR, et al. Systematic review: opioid treatment for chronic back pain: prevalence, efficacy, and association with addiction. Ann Intern Med. 2007;146(2):116-27.
46. Enthoven WT, Roelofs PD, Deyo RA, van Tulder MW, Koes BW. Non-steroidal anti-inflammatory drugs for chronic low back pain. Cochrane Database Syst Rev. 2016;2:Cd012087.
47. Chou R, Huffman LH. Medications for acute and chronic low back pain: a review of the evidence for an American Pain Society/American College of Physicians clinical practice guideline. Ann Intern Med. 2007;147(7):505-14.
48. Abdel Shaheed C, Maher CG, Williams KA, Day R, McLachlan AJ. Efficacy, Tolerability, and Dose-Dependent Effects of Opioid Analgesics for Low Back Pain: A Systematic Review and Meta-analysis. JAMA Intern Med. 2016;176(7):958-68.
49. Hylands-White N, Duarte RV, Raphael JH. An overview of treatment approaches for chronic pain management. Rheumatol Int. 2017;37(1):29-42.
50. Foster NE, Anema JR, Cherkin D, Chou R, Cohen SP, Gross DP, et al. Prevention and treatment of low back pain: evidence, challenges, and promising directions. Lancet. 2018;391(10137):2368-83.
51. Chaparro LE, Furlan AD, Deshpande A, Mailis-Gagnon A, Atlas S, Turk DC. Opioids compared to placebo or other treatments for chronic low-back pain. Cochrane Database Syst Rev. 2013(8):Cd004959.
52. Kuritzky L, Samraj GP. Nonsteroidal anti-inflammatory drugs in the treatment of low back pain. J Pain Res. 2012;5:579-90.
53. Busse JW, Schandelmaier S, Kamaleldin M, Hsu S, Riva JJ, Vandvik PO, et al. Opioids for chronic non-cancer pain: a protocol for a systematic review of randomized controlled trials. Syst Rev. 2013;2:66.
54. Morales A, Yong RJ, Kaye AD, Urman RD. Spinal Cord Stimulation: Comparing Traditional Low-frequency Tonic Waveforms to Novel High Frequency and Burst Stimulation for the Treatment of Chronic Low Back Pain. Curr Pain Headache Rep. 2019;23(4):25.
55. Deshpande A, Furlan A, Mailis-Gagnon A, Atlas S, Turk D. Opioids for chronic low-back pain. Cochrane Database Syst Rev. 2007(3):Cd004959.
56. Kalso E, Edwards JE, Moore RA, McQuay HJ. Opioids in chronic non-cancer pain: systematic review of efficacy and safety. Pain. 2004;112(3):372-80.
57. Koes BW, Scholten RJ, Mens JM, Bouter LM. Efficacy of non-steroidal anti-inflammatory drugs for low back pain: a systematic review of randomised clinical trials. Ann Rheum Dis. 1997;56(4):214-23.
58. Deer TR, Jain S, Hunter C, Chakravarthy K. Neurostimulation for Intractable Chronic Pain. Brain Sci. 2019;9(2).
59. Knezevic NN, Mandalia S, Raasch J, Knezevic I, Candido KD. Treatment of chronic low back pain - new approaches on the horizon. J Pain Res. 2017;10:1111-23.
60. Manchikanti L, Falco FJ, Singh V, Benyamin RM, Racz GB, Helm S, 2nd, et al. An update of comprehensive evidence-based guidelines for interventional techniques in chronic spinal pain. Part I: introduction and general considerations. Pain Physician. 2013;16(2 Suppl):S1-48.
61. Manchikanti L, Abdi S, Atluri S, Benyamin RM, Boswell MV, Buenaventura RM, et al. An update of comprehensive evidence-based guidelines for interventional techniques in chronic spinal pain. Part II: guidance and recommendations. Pain Physician. 2013;16(2 Suppl):S49-283.
62. Sivanesan E, Maher DP, Raja SN, Linderoth B, Guan Y. Supraspinal Mechanisms of Spinal Cord Stimulation for Modulation of Pain: Five Decades of Research and Prospects for the Future. Anesthesiology. 2019;130(4):651-65.
63. Vannemreddy P, Slavin KV. Spinal cord stimulation: Current applications for treatment of chronic pain. Anesth Essays Res. 2011;5(1):20-7.
64. Deer TR, Mekhail N, Provenzano D, Pope J, Krames E, Leong M, et al. The appropriate use of neurostimulation of the spinal cord and peripheral nervous system for the treatment of chronic pain and ischemic diseases: the Neuromodulation Appropriateness Consensus Committee. Neuromodulation. 2014;17(6):515-50; discussion 50.
65. Orlando M, Nichols T, Mandybur G. Mayfield Brain & Spine: Spinal Cord Stimulation2019. Available from: https://d3djccaurgtij4.cloudfront.net/pe-spinal-cord-stimulation.pdf.
66. NICE. Senza spinal cord stimulationsystem for delivering HF10 therapy to treat chronic neuropathic pain: National Institute for Health and Care Excellence; 2019 [Available from: https://www.nice.org.uk/guidance/mtg41/resources/senza-spinal-cord-stimulation-system-for-delivering-hf10-therapy-to-treat-chronic-neuropathic-pain-pdf-64372050739141.
67. Rock AK, Truong H, Park YL, Pilitsis JG. Spinal Cord Stimulation. Neurosurg Clin N Am. 2019;30(2):169-94.
68. Linderoth B, Foreman RD. Conventional and Novel Spinal Stimulation Algorithms: Hypothetical Mechanisms of Action and Comments on Outcomes. Neuromodulation. 2017;20(6):525-33.
69. Maheshwari A, Pope JE, Deer TR, Falowski S. Advanced methods of spinal stimulation in the treatment of chronic pain: pulse trains, waveforms, frequencies, targets, and feedback loops. Expert Rev Med Devices. 2019;16(2):95-106.
70. Caylor J, Reddy R, Yin S, Cui C, Huang M, Huang C, et al. Spinal cord stimulation in chronic pain: evidence and theory for mechanisms of action. Bioelectron Med. 2019;5.
71. Xu J, Liu A, Cheng J. New advancements in spinal cord stimulation for chronic pain management. Curr Opin Anaesthesiol. 2017;30(6):710-7.
72. Shealy CN, Taslitz N, Mortimer JT, Becker DP. Electrical inhibition of pain: experimental evaluation. Anesth Analg. 1967;46(3):299-305.
73. Shealy CN, Mortimer JT, Reswick JB. Electrical inhibition of pain by stimulation of the dorsal columns: preliminary clinical report. Anesth Analg. 1967;46(4):489-91.
74. Melzack R, Wall PD. Pain mechanisms: a new theory. Science. 1965;150(3699):971-9.
75. Sclafani J, Leong M, Desai MJ, Mehta N, Sayed D, Singh JR. Conventional versus High-Frequency Neuromodulation in the Treatment of Low Back Pain Following Spine Surgery. Pm r. 2019;11(12):1346-53.
76. Rapcan R, Mlaka J, Venglarcik M, Vinklerova V, Gajdos M, Illes R. High-frequency - Spinal Cord Stimulation. Bratisl Lek Listy. 2015;116(6):354-6.
77. Levy R, Deer TR, Poree L, Rosen SM, Kapural L, Amirdelfan K, et al. Multicenter, Randomized, Double-Blind Study Protocol Using Human Spinal Cord Recording Comparing Safety, Efficacy, and Neurophysiological Responses Between Patients Being Treated With Evoked Compound Action Potential-Controlled Closed-Loop Spinal Cord Stimulation or Open-Loop Spinal Cord Stimulation (the Evoke Study). Neuromodulation. 2019;22(3):317-26.
78. Arle JE, Mei L, Carlson KW, Shils JL. High-Frequency Stimulation of Dorsal Column Axons: Potential Underlying Mechanism of Paresthesia-Free Neuropathic Pain Relief. Neuromodulation. 2016;19(4):385-97.
79. Ahmed S, Yearwood T, De Ridder D, Vanneste S. Burst and high frequency stimulation: underlying mechanism of action. Expert Rev Med Devices. 2018;15(1):61-70.
80. Sankarasubramanian V, Harte SE, Chiravuri S, Harris RE, Brummett CM, Patil PG, et al. Objective Measures to Characterize the Physiological Effects of Spinal Cord Stimulation in Neuropathic Pain: A Literature Review. Neuromodulation. 2019;22(2):127-48.
81. Jensen MP, Brownstone RM. Mechanisms of spinal cord stimulation for the treatment of pain: Still in the dark after 50 years. Eur J Pain. 2018.
82. Vallejo R, Bradley K, Kapural L. Spinal Cord Stimulation in Chronic Pain: Mode of Action. Spine (Phila Pa 1976). 2017;42 Suppl 14:S53-s60.
83. Bentley LD, Duarte RV, Furlong PL, Ashford RL, Raphael JH. Brain activity modifications following spinal cord stimulation for chronic neuropathic pain: A systematic review. Eur J Pain. 2016;20(4):499-511.
85. De Groote S, Goudman L, Peeters R, Linderoth B, Vanschuerbeek P, Sunaert S, et al. Magnetic Resonance Imaging Exploration of the Human Brain During 10 kHz Spinal Cord Stimulation for Failed Back Surgery Syndrome: A Resting State Functional Magnetic Resonance Imaging Study. Neuromodulation. 2019.
86. Barchini J, Tchachaghian S, Shamaa F, Jabbur SJ, Meyerson BA, Song Z, et al. Spinal segmental and supraspinal mechanisms underlying the pain-relieving effects of spinal cord stimulation: an experimental study in a rat model of neuropathy. Neuroscience. 2012;215:196-208.
87. Song Z, Ansah OB, Meyerson BA, Pertovaara A, Linderoth B. Exploration of supraspinal mechanisms in effects of spinal cord stimulation: role of the locus coeruleus. Neuroscience. 2013;253:426-34.
88. Linderoth B, Foreman RD. Physiology of spinal cord stimulation: review and update. Neuromodulation. 1999;2(3):150-64.
89. Schlaier JR, Eichhammer P, Langguth B, Doenitz C, Binder H, Hajak G, et al. Effects of spinal cord stimulation on cortical excitability in patients with chronic neuropathic pain: a pilot study. Eur J Pain. 2007;11(8):863-8.
90. Treede RD. Gain control mechanisms in the nociceptive system. Pain. 2016;157(6):1199-204.
91. Santana MB, Halje P, Simplício H, Richter U, Freire MAM, Petersson P, et al. Spinal cord stimulation alleviates motor deficits in a primate model of Parkinson disease. Neuron. 2014;84(4):716-22.
92. Abboud H, Hill E, Siddiqui J, Serra A, Walter B. Neuromodulation in multiple sclerosis. Mult Scler. 2017;23(13):1663-76.
93. Yadav AP, Nicolelis MAL. Electrical stimulation of the dorsal columns of the spinal cord for Parkinson's disease. Mov Disord. 2017;32(6):820-32.
94. Moens M, Mariën P, Brouns R, Poelaert J, De Smedt A, Buyl R, et al. Spinal cord stimulation modulates cerebral neurobiology: a proton magnetic resonance spectroscopy study. Neuroradiology. 2013;55(8):1039-47.
95. De Groote S, De Jaeger M, Van Schuerbeek P, Sunaert S, Peeters R, Loeckx D, et al. Functional magnetic resonance imaging: cerebral function alterations in subthreshold and suprathreshold spinal cord stimulation. J Pain Res. 2018;11:2517-26.
96. Moens M, Sunaert S, Marien P, Brouns R, De Smedt A, Droogmans S, et al. Spinal cord stimulation modulates cerebral function: an fMRI study. Neuroradiology. 2012;54(12):1399-407.
97. Nagamachi S, Fujita S, Nishii R, Futami S, Wakamatsu H, Yano T, et al. Alteration of regional cerebral blood flow in patients with chronic pain--evaluation before and after epidural spinal cord stimulation. Ann Nucl Med. 2006;20(4):303-10.
98. Kishima H, Saitoh Y, Oshino S, Hosomi K, Ali M, Maruo T, et al. Modulation of neuronal activity after spinal cord stimulation for neuropathic pain; H(2)15O PET study. Neuroimage. 2010;49(3):2564-9.
99. Goudman L, Brouns R, De Groote S, De Jaeger M, Huysmans E, Forget P, et al. Association Between Spinal Cord Stimulation and Top-Down Nociceptive Inhibition in People With Failed Back Surgery Syndrome: A Cohort Study. Phys Ther. 2019;99(7):915-23.
100. Sufianov AA, Shapkin AG, Sufianova GZ, Elishev VG, Barashin DA, Berdichevskii VB, et al. Functional and metabolic changes in the brain in neuropathic pain syndrome against the background of chronic epidural
33
electrostimulation of the spinal cord. Bull Exp Biol Med. 2014;157(4):462-5.
101. Maleki N, Becerra L, Brawn J, McEwen B, Burstein R, Borsook D. Common hippocampal structural and functional changes in migraine. Brain Struct Funct. 2013;218(4):903-12.
102. Seminowicz DA, Wideman TH, Naso L, Hatami-Khoroushahi Z, Fallatah S, Ware MA, et al. Effective treatment of chronic low back pain in humans reverses abnormal brain anatomy and function. J Neurosci. 2011;31(20):7540-50.
103. Hamm-Faber TE, Gultuna I, van Gorp EJ, Aukes H. High-Dose Spinal Cord Stimulation for Treatment of Chronic Low Back Pain and Leg Pain in Patients With FBSS, 12-Month Results: A Prospective Pilot Study. Neuromodulation. 2019.
104. Orhurhu VJ, Chu R, Gill J. Failed Back Surgery Syndrome. StatPearls. Treasure Island (FL): StatPearls Publishing
Bruxelle J, et al. Comparison of pain syndromes associated with nervous or somatic lesions and development of a new neuropathic pain diagnostic questionnaire (DN4). Pain. 2005;114(1-2):29-36.
106. Timmerman H, Steegers MAH, Huygen F, Goeman JJ, van Dasselaar NT, Schenkels MJ, et al. Investigating the validity of the DN4 in a consecutive population of patients with chronic pain. PLoS One. 2017;12(11):e0187961.
107. World Medical Association Declaration of Helsinki: ethical principles for medical research involving human subjects. Jama. 2013;310(20):2191-4.
108. Garcia K, Wray JK, Kumar S. Spinal Cord Stimulation. StatPearls. Treasure Island (FL): StatPearls Publishing
113. Yasuda CL, Betting LE, Cendes F. Voxel-based morphometry and epilepsy. Expert Rev Neurother. 2010;10(6):975-84.
114. Palaniyappan L, Maayan N, Bergman H, Davenport C, Adams CE, Soares-Weiser K. Voxel-based morphometry for separation of schizophrenia from other types of psychosis in first episode psychosis. Cochrane Database Syst Rev. 2015(8):Cd011021.
115. Mueller S, Keeser D, Reiser MF, Teipel S, Meindl T. Functional and structural MR imaging in neuropsychiatric disorders, part 2: application in schizophrenia and autism. AJNR Am J Neuroradiol. 2012;33(11):2033-7.
116. Pan PL, Shi HC, Zhong JG, Xiao PR, Shen Y, Wu LJ, et al. Gray matter atrophy in Parkinson's disease with dementia: evidence from meta-analysis of voxel-based morphometry studies. Neurol Sci. 2013;34(5):613-9.
117. Pavese N, Brooks DJ. Imaging neurodegeneration in Parkinson's disease. Biochim Biophys Acta. 2009;1792(7):722-9.
118. Lai TH, Wang SJ. Neuroimaging Findings in Patients with Medication Overuse Headache. Curr Pain Headache Rep. 2018;22(1):1.
119. Yang Q, Wang Z, Yang L, Xu Y, Chen LM. Cortical thickness and functional connectivity abnormality in chronic headache and low back pain patients. Hum Brain Mapp. 2017;38(4):1815-32.
120. Gerber AJ, Peterson BS. What is an image? J Am Acad Child Adolesc Psychiatry. 2008;47(3):245-8.
121. Kurth F, Gaser C, Luders E. A 12-step user guide for analyzing voxel-wise gray matter asymmetries in statistical parametric mapping (SPM). Nat Protoc. 2015;10(2):293-304.
122. Radua J, Canales-Rodriguez EJ, Pomarol-Clotet E, Salvador R. Validity of modulation and optimal settings for advanced voxel-based morphometry. Neuroimage. 2014;86:81-90.
123. Haefeli M, Elfering A. Pain assessment. Eur Spine J. 2006;15 Suppl 1(Suppl 1):S17-24.
124. Jensen MP, Chen C, Brugger AM. Interpretation of visual analog scale ratings and change scores: a reanalysis of two clinical trials of postoperative pain. J Pain. 2003;4(7):407-14.
125. Karcioglu O, Topacoglu H, Dikme O. A systematic review of the pain scales in adults: Which to use? Am J Emerg Med. 2018;36(4):707-14.
126. Chiarotto A, Maxwell LJ, Ostelo RW, Boers M, Tugwell P, Terwee CB. Measurement Properties of Visual Analogue Scale, Numeric Rating Scale, and Pain Severity Subscale of the Brief Pain Inventory in Patients With Low Back Pain: A Systematic Review. J Pain. 2019;20(3):245-63.
127. Sedaghat AR. Understanding the Minimal Clinically Important Difference (MCID) of Patient-Reported Outcome Measures. Otolaryngol Head Neck Surg. 2019;161(4):551-60.
128. Carlsson AM. Assessment of chronic pain. I. Aspects of the reliability and validity of the visual analogue scale. Pain. 1983;16(1):87-101.
129. Paul-Dauphin A, Guillemin F, Virion JM, Briancon S. Bias and precision in visual analogue scales: a randomized controlled trial. Am J Epidemiol. 1999;150(10):1117-27.
130. Hjermstad MJ, Fayers PM, Haugen DF, Caraceni A, Hanks GW, Loge JH, et al. Studies comparing Numerical Rating Scales, Verbal Rating Scales, and Visual Analogue Scales for assessment of pain intensity in adults: a systematic literature review. J Pain Symptom Manage. 2011;41(6):1073-93.
131. Arendt-Nielsen L, Morlion B, Perrot S, Dahan A, Dickenson A, Kress HG, et al. Assessment and manifestation of central sensitisation across different chronic pain conditions. Eur J Pain. 2018;22(2):216-41.
132. Neblett R, Hartzell MM, Mayer TG, Cohen H, Gatchel RJ. Establishing Clinically Relevant Severity Levels for the Central Sensitization Inventory. Pain Pract. 2017;17(2):166-75.
133. Leung L. Pain catastrophizing: an updated review. Indian J Psychol Med. 2012;34(3):204-17.
134. Quartana PJ, Campbell CM, Edwards RR. Pain catastrophizing: a critical review. Expert Rev Neurother. 2009;9(5):745-58.
135. Darnall BD, Sturgeon JA, Cook KF, Taub CJ, Roy A, Burns JW, et al. Development and Validation of a Daily Pain Catastrophizing Scale. J Pain. 2017;18(9):1139-49.
136. Osman A, Barrios FX, Kopper BA, Hauptmann W, Jones J, O'Neill E. Factor structure, reliability, and validity of the
137. Cheng ST, Chen PP, Chow YF, Chung JWY, Law ACB, Lee JSW, et al. The Pain Catastrophizing Scale-short form: psychometric properties and threshold for identifying high-risk individuals. Int Psychogeriatr. 2019:1-10.
138. Sullivan M. PCS Manual 2009 [Available from: https://sullivan-painresearch.mcgill.ca/pdf/pcs/PCSManual_English.pdf.
139. Buysse DJ, Reynolds CF, 3rd, Monk TH, Berman SR, Kupfer DJ. The Pittsburgh Sleep Quality Index: a new instrument for psychiatric practice and research. Psychiatry Res. 1989;28(2):193-213.
140. Mccollum S. NASA: Actiwatch Spectrum System [Available from: https://www.nasa.gov/mission_pages/station/research/experiments/explorer/Investigation.html?#id=838.
141. Shrivastava D, Jung S, Saadat M, Sirohi R, Crewson K. How to interpret the results of a sleep study. J Community Hosp Intern Med Perspect. 2014;4(5):24983.
142. Mantua J, Gravel N, Spencer RM. Reliability of Sleep Measures from Four Personal Health Monitoring Devices Compared to Research-Based Actigraphy and Polysomnography. Sensors (Basel). 2016;16(5).
143. Simopoulos TT, Gill JS. Magnetic resonance imaging of the lumbar spine in a patient with a spinal cord stimulator. Pain Physician. 2013;16(3):E295-300.
144. Rubino S, Adepoju A, Kumar V, Prusik J, Murphy N, Owusu-Sarpong S, et al. MRI Conditionality in Patients with Spinal Cord Stimulation Devices. Stereotact Funct Neurosurg. 2016;94(4):254-8.
145. Manfield J, Bartlett R, Park N. Safety and Utility of Spinal Magnetic Resonance Imaging in Patients with High-Frequency Spinal Cord Stimulators: A Prospective Single-Centre Study. Stereotact Funct Neurosurg. 97. Switzerland: The Author(s). Published by S. Karger AG, Basel.; 2019. p. 272-7.
146. Shellock FG, Audet-Griffin AJ. Evaluation of magnetic resonance imaging issues for a wirelessly powered lead used for epidural, spinal cord stimulation. Neuromodulation. 2014;17(4):334-9; discussion 9.
147. Walsh KM, Machado AG, Krishnaney AA. Spinal cord stimulation: a review of the safety literature and proposal for perioperative evaluation and management. Spine J. 2015;15(8):1864-9.
148. Moens M, Droogmans S, Spapen H, De Smedt A, Brouns R, Van Schuerbeek P, et al. Feasibility of cerebral magnetic resonance imaging in patients with externalised spinal cord stimulator. Clin Neurol Neurosurg. 2012;114(2):135-41.
149. De Andres J, Martinez-Sanjuan V, Fabregat-Cid G, Asensio-Samper JM, Sanchis-Lopez N, Villanueva-Perez V. MRI-compatible spinal cord stimulator device and related changes in patient safety and imaging artifacts. Pain Med. 2014;15(10):1815-9.
150. Nevro Corp . 4040 Campbell Avenue SMP, CA 94025 USA. Nevro ® Senza ® Spinal Cord Stimulation System 1.5 Tesla Magnetic Resonance Imaging (MRI ) Guidelines 2013 [Available from: https://s21.q4cdn.com/478267292/files/doc_downloads/manuals/europe/mri/10935-Rev-A-ENG-Nevro-Senza-SCS-MRI-Guidelines.pdf.
151. De Groote S, Goudman L, Peeters R, Linderoth B, Van Schuerbeek P, Sunaert S, et al. The influence of High Dose Spinal Cord Stimulation on the descending pain
modulatory system in patients with failed back surgery syndrome. Neuroimage Clin. 2019;24:102087.
152. De Groote S, Goudman L, Van Schuerbeek P, Peeters R, Sunaert S, Linderoth B, et al. Abstract from Benelux Neuromodulation Society 2019 Scientific Meeting: Voxel-based morphometry of the human brain during Spinal Cord Stimulation in patients with Failed Back Surgery Syndrome. 2019.
153. Ashburner J. Computational anatomy with the SPM software. Magn Reson Imaging. 2009;27(8):1163-74.
154. Whitwell JL. Voxel-based morphometry: an automated technique for assessing structural changes in the brain. J Neurosci. 2009;29(31):9661-4.
155. Tzourio-Mazoyer N, Landeau B, Papathanassiou D, Crivello F, Etard O, Delcroix N, et al. Automated anatomical labeling of activations in SPM using a macroscopic anatomical parcellation of the MNI MRI single-subject brain. Neuroimage. 2002;15(1):273-89.
156. Luchtmann M, Baecke S, Steinecke Y, Bernarding J, Tempelmann C, Ragert P, et al. Changes in gray matter volume after microsurgical lumbar discectomy: a longitudinal analysis. Front Hum Neurosci. 2015;9:12.
157. Luchtmann M, Steinecke Y, Baecke S, Lützkendorf R, Bernarding J, Kohl J, et al. Structural brain alterations in patients with lumbar disc herniation: a preliminary study. PLoS One. 2014;9(3):e90816.
158. MarsBaR region of interest toolbox for SPM [Available from: http://marsbar.sourceforge.net/.
159. Neurofunctional Imaging Group - Université de Bordeaux: AAL / AAL2 / AAL3 2019 [Available from: http://www.gin.cnrs.fr/en/tools/aal/.
160. NITRC: MRIcron: Tool/Resource Info: .zip posted by Chris Rorden on Dec 27, 2012; 2019 [Available from: https://www.nitrc.org/projects/mricron.
161. Rolls ET, Huang CC, Lin CP, Feng J, Joliot M. Automated anatomical labelling atlas 3. Neuroimage. 2019:116189.
162. Ridgeway G. Get_Totals Script [Available from: http://www0.cs.ucl.ac.uk/staff/g.ridgway/vbm/get_totals.m.
163. Kim HY. Statistical notes for clinical researchers: Nonparametric statistical methods: 1. Nonparametric methods for comparing two groups. Restor Dent Endod. 2014;39(3):235-9.
164. RStudio Team (2019), version 1.2.5001. RStudio: Integrated Development for R. RStudio, Inc., Boston 2020 [Available from: https://rstudio.com/.
167. Stawski RS, Sliwinski MJ, Hofer SM. Between-person and within-person associations among processing speed, attention switching, and working memory in younger and older adults. Exp Aging Res. 2013;39(2):194-214.
168. Viswanath O, Urits I, Bouley E, Peck JM, Thompson W, Kaye AD. Evolving Spinal Cord Stimulation Technologies and Clinical Implications in Chronic Pain Management. Curr Pain Headache Rep. 2019;23(6):39.
169. DiBenedetto DJ, Wawrzyniak KM, Schatman ME, Kulich RJ, Finkelman M. 10 kHz spinal cord stimulation: a retrospective analysis of real-world data from a community-based, interdisciplinary pain facility. J Pain Res. 2018;11:2929-41.
170. Kapural L, Yu C, Doust MW, Gliner BE, Vallejo R, Sitzman BT, et al. Novel 10-kHz High-frequency Therapy (HF10
Therapy) Is Superior to Traditional Low-frequency Spinal Cord Stimulation for the Treatment of Chronic Back and Leg Pain: The SENZA-RCT Randomized Controlled Trial. Anesthesiology. 2015;123(4):851-60.
171. Amirdelfan K, Yu C, Doust MW, Gliner BE, Morgan DM, Kapural L, et al. Long-term quality of life improvement for chronic intractable back and leg pain patients using spinal cord stimulation: 12-month results from the SENZA-RCT. Qual Life Res. 2018;27(8):2035-44.
172. Stauss T, El Majdoub F, Sayed D, Surges G, Rosenberg WS, Kapural L, et al. A multicenter real-world review of 10 kHz SCS outcomes for treatment of chronic trunk and/or limb pain. Ann Clin Transl Neurol. 2019;6(3):496-507.
173. Ghosh PE, Simopolous TT. A review of the Senza System: a novel, high frequency 10 kHz (HF10), paresthesia free spinal cord stimulator. Pain Manag. 2019;9(3):225-31.
174. Song Z, Viisanen H, Meyerson BA, Pertovaara A, Linderoth B. Efficacy of kilohertz-frequency and conventional spinal cord stimulation in rat models of different pain conditions. Neuromodulation. 2014;17(3):226-34; discussion 34-5.
175. Abstracts from the 21st Annual Meeting of the North American Neuromodulation Society, Las Vegas, NV, USA January 11‐14, 2018. Neuromodulation: Technology at the Neural Interface. (21):e1-e149.
176. Smallwood RF, Laird AR, Ramage AE, Parkinson AL, Lewis J, Clauw DJ, et al. Structural brain anomalies and chronic pain: a quantitative meta-analysis of gray matter volume. J Pain. 2013;14(7):663-75.
177. Radua J, Mataix-Cols D. Voxel-wise meta-analysis of grey matter changes in obsessive-compulsive disorder. Br J Psychiatry. 2009;195(5):393-402.
178. Bishop JH, Shpaner M, Kubicki A, Clements S, Watts R, Naylor MR. Structural network differences in chronic muskuloskeletal pain: Beyond fractional anisotropy. Neuroimage. 2018;182:441-55.
179. McCarberg B, Peppin J. Pain Pathways and Nervous System Plasticity: Learning and Memory in Pain. Pain Medicine. 2019.
180. Price TJ, Inyang KE. Commonalities between pain and memory mechanisms and their meaning for understanding chronic pain. Prog Mol Biol Transl Sci. 2015;131:409-34.
181. Apkarian AV, Mutso AA, Centeno MV, Kan L, Wu M, Levinstein M, et al. Role of adult hippocampal neurogenesis in persistent pain. Pain. 2016;157(2):418-28.
182. Mutso AA, Petre B, Huang L, Baliki MN, Torbey S, Herrmann KM, et al. Reorganization of hippocampal functional connectivity with transition to chronic back pain. J Neurophysiol. 2014;111(5):1065-76.
183. Mutso AA, Radzicki D, Baliki MN, Huang L, Banisadr G, Centeno MV, et al. Abnormalities in hippocampal functioning with persistent pain. J Neurosci. 2012;32(17):5747-56.
184. Thompson JM, Neugebauer V. Cortico-limbic pain mechanisms. Neurosci Lett. 2019;702:15-23.
185. Chong CD, Dumkrieger GM, Schwedt TJ. Structural Co-Variance Patterns in Migraine: A Cross-Sectional Study
Exploring the Role of the Hippocampus. Headache. 2017;57(10):1522-31.
186. Berger SE, Vachon-Presseau É, Abdullah TB, Baria AT, Schnitzer TJ, Apkarian AV. Hippocampal morphology mediates biased memories of chronic pain. Neuroimage. 2018;166:86-98.
187. McEwen BS. Plasticity of the hippocampus: adaptation to chronic stress and allostatic load. Ann N Y Acad Sci. 2001;933:265-77.
188. Liu MG, Chen J. Roles of the hippocampal formation in pain information processing. Neurosci Bull. 2009;25(5):237-66.
189. Ziv M, Tomer R, Defrin R, Hendler T. Individual sensitivity to pain expectancy is related to differential activation of the hippocampus and amygdala. Hum Brain Mapp. 2010;31(2):326-38.
190. Gondo M, Moriguchi Y, Kodama N, Sato N, Sudo N, Kubo C, et al. Daily physical complaints and hippocampal function: an fMRI study of pain modulation by anxiety. Neuroimage. 2012;63(3):1011-9.
191. Greenwald JD, Shafritz KM. An Integrative Neuroscience Framework for the Treatment of Chronic Pain: From Cellular Alterations to Behavior. Front Integr Neurosci. 2018;12:18.
192. Ploghaus A, Narain C, Beckmann CF, Clare S, Bantick S, Wise R, et al. Exacerbation of pain by anxiety is associated with activity in a hippocampal network. J Neurosci. 2001;21(24):9896-903.
193. Keller SS, Wilke M, Wieshmann UC, Sluming VA, Roberts N. Comparison of standard and optimized voxel-based morphometry for analysis of brain changes associated with temporal lobe epilepsy. Neuroimage. 2004;23(3):860-8.
194. Good CD, Johnsrude IS, Ashburner J, Henson RN, Friston KJ, Frackowiak RS. A voxel-based morphometric study of ageing in 465 normal adult human brains. Neuroimage. 2001;14(1 Pt 1):21-36.
196. Mak HK, Zhang Z, Yau KK, Zhang L, Chan Q, Chu LW. Efficacy of voxel-based morphometry with DARTEL and standard registration as imaging biomarkers in Alzheimer's disease patients and cognitively normal older adults at 3.0 Tesla MR imaging. J Alzheimers Dis. 2011;23(4):655-64.
197. Mandal PK, Mahajan R, Dinov ID. Structural brain atlases: design, rationale, and applications in normal and pathological cohorts. J Alzheimers Dis. 2012;31 Suppl 3(0 3):S169-88.
198. Goldman M. Statistics for Bioinformatics. 2008 [cited 25/10/2019]. Springer, [cited 25/10/2019]. Available from: https://www.stat.berkeley.edu/~mgoldman/Section0402.pdf.
199. AAL3 User guide, edited by GIN (E5, IMN UMR 5293, CEA-CNRS-Université de Bordeaux) 2019 [Available from: http://www.gin.cnrs.fr/wp-content/uploads/aal3-user-guide-gin-imn.pdf.
200. Depreitere B, Plets C, Van Loon J, Geens P. Sectional Anatomy of the Human Brain. 1st edition ed. Leuven: Acco; 2008.