Graduate Theses, Dissertations, and Problem Reports
2020
Evaluating Use and Preference for Performance Feedback to Evaluating Use and Preference for Performance Feedback to
Teach Instructional Strategies Teach Instructional Strategies
Natalie Jones Shuler West Virginia University, [email protected]
Follow this and additional works at: https://researchrepository.wvu.edu/etd
Part of the Applied Behavior Analysis Commons
Recommended Citation Recommended Citation Shuler, Natalie Jones, "Evaluating Use and Preference for Performance Feedback to Teach Instructional Strategies" (2020). Graduate Theses, Dissertations, and Problem Reports. 7587. https://researchrepository.wvu.edu/etd/7587
This Dissertation is protected by copyright and/or related rights. It has been brought to you by the The Research Repository @ WVU with permission from the rights-holder(s). You are free to use this Dissertation in any way that is permitted by the copyright and related rights legislation that applies to your use. For other uses you must obtain permission from the rights-holder(s) directly, unless additional rights are indicated by a Creative Commons license in the record and/ or on the work itself. This Dissertation has been accepted for inclusion in WVU Graduate Theses, Dissertations, and Problem Reports collection by an authorized administrator of The Research Repository @ WVU. For more information, please contact [email protected].
Evaluating Use and Preference for Performance Feedback to Teach Instructional
Strategies
Natalie J. Shuler, M.S.
Dissertation submitted to the Eberly College of Arts and Sciences
at West Virginia University in partial fulfillment of the requirements for the degree of
Doctor of Philosophy in Psychology
Claire St. Peter, Ph.D., Chair
Kathryn Kestner, Ph.D.
Michael Perone, Ph.D.
Christina Duncan, Ph.D.
John Stewart, Ph.D.
Department of Psychology
Morgantown, West Virginia
2020
Keywords: Classroom Management, Equine-Assisted Activities and Therapies, Feedback, Instructional Strategies, Performance Feedback, Staff training
Copyright 2020 Natalie Shuler
ABSTRACT
Evaluating Use and Preference for Performance Feedback to Teach Instructional Strategies
Natalie Jones Shuler
Written and graphical feedback may be useful tools for supporting instructors because they require fewer scheduled meetings and provide instructors with permanent performance records. Although written and graphical feedback have been effective at improving some skills (e.g., use of praise), little is known about efficacy across a wider array of skills or about teacher preferences for these feedback types. Study 1 evaluated use of written and graphical feedback to increase opportunities to respond (OTRs) provided by three instructors of equine-assisted activities and therapies. Feedback increased OTRs for all three instructors. Additionally, all instructors showed untaught increases in praise when receiving feedback for OTRs. Study 2 evaluated instructor preferences for no feedback, written feedback, graphical feedback, and a combination of written and graphical feedback. Instructors almost exclusively preferred written and graphical feedback.
EVALUATING FEEDBACK TO TEACH INSTRUCTIONAL STRATEGIES iii
Acknowledgements
I would like to acknowledge the Eberly College of Arts and Sciences and the Department of Psychology at West Virginia University for financially supporting this project through Doctoral Research Awards. Thank you to my advisor, Claire St. Peter, for her guidance through each stage of the process, as well as each member of my dissertation committee for their invaluable contributions to this project. I am grateful for the many lab members who assisted with data collection for these studies, Stephanie Jones, Catherine Williams, Sarah Bradtke, Sydney Hull, and Alexis Humphries. I am appreciative of the schools and facilities that served as my gracious hosts during this research, as well. Lastly, I cannot say thank you enough to the family and friends that have supported me throughout this process. My husband, parents, and pets have provided companionship and advice every step of the way and I could not have finished my degree without them.
EVALUATING FEEDBACK TO TEACH INSTRUCTIONAL STRATEGIES iv
TABLE OF CONTENTS
INTRODUCTION............................................................................................................. 1
STUDY 1 .......................................................................................................................... 10
METHOD ......................................................................................................................... 10 RESULTS AND DISCUSSION .............................................................................................. 18
STUDY 2 ......................................................................................................................... 26
METHOD ......................................................................................................................... 26 RESULTS AND DISCUSSION ............................................................................................. 35
GENERAL DISCUSSION ............................................................................................. 44
REFERENCES ................................................................................................................ 49
TABLES AND FIGURES .............................................................................................. 58
TABLE 1 .......................................................................................................................... 58 TABLE 2 .......................................................................................................................... 59 TABLE 3 .......................................................................................................................... 60 TABLE 4 .......................................................................................................................... 61 TABLE 5 .......................................................................................................................... 62 TABLE 6 .......................................................................................................................... 63 TABLE 7 .......................................................................................................................... 64 FIGURE 1......................................................................................................................... 65 FIGURE 2......................................................................................................................... 66 FIGURE 3......................................................................................................................... 67 FIGURE 4......................................................................................................................... 68 FIGURE 5......................................................................................................................... 69 FIGURE 6......................................................................................................................... 70
APPENDICES ................................................................................................................. 71
APPENDIX A ................................................................................................................... 71 APPENDIX B ................................................................................................................... 73 APPENDIX C ................................................................................................................... 74 APPENDIX D ................................................................................................................... 75 APPENDIX E .................................................................................................................... 78 APPENDIX F .................................................................................................................... 81 APPENDIX G ................................................................................................................... 83 APPENDIX H ................................................................................................................... 84 APPENDIX I ..................................................................................................................... 88 APPENDIX J ..................................................................................................................... 91 APPENDIX K ................................................................................................................... 92 APPENDIX L .................................................................................................................... 93 APPENDIX M ................................................................................................................... 95
EVALUATING FEEDBACK TO TEACH INSTRUCTIONAL STRATEGIES 1
Evaluating Use and Preference for Performance Feedback to Teach Instructional Strategies
Use of evidence-based instructional strategies may help instructors establish optimal
learning environments. Evidence-based strategies like effective instructional design, responding
to the needs of students, and handling disciplinary situations (Emmer & Stough, 2001) improve
student engagement and minimize challenging behavior (Simonsen et al., 2008). Although some
instructional strategies may require substantial effort from the instructor (like preparation of
additional materials or rearranging the classroom), other strategies can be incorporated with little
to no additional preparation (like providing labeled praise or increasing the number of
opportunities to respond [OTRs] provided). Instructors could deploy these low-effort strategies
to improve student outcomes, while minimizing extra burdens on the instructor.
Praise is defined as a positive statement by the instructor that is provided when a desired
behavior occurs (Simonsen et al., 2008). Praise statements are often divided into two distinct
categories: generic and behavior-specific praise, the latter of which is also termed labeled praise
(Jenkins et al., 2015). Labeled praise may be more beneficial to students than generic praise
because it may help students to discriminate between behavior that does and does not result in
praise (Floress et al., 2018; Hulac & Briesch, 2017). Use of labeled-praise has both behavioral
and academic impacts, including decreasing challenging behavior (Stormont et al., 2007),
increasing frequency of correct responses (Sutherland & Wehby, 2001), and increasing on-task
behavior (Caldarella et al., 2020; Sutherland et al., 2000).
Frequent provision of praise is included as a national board standard for classroom
teachers (e.g., National Board for Professional Teaching Standards, 2001) and a recommended
practice in other instructional activities. Scholars have recommended a minimum of six praise
statements per 15 min (Sutherland et al., 2000) and suggested using 60 labeled-praise statements
EVALUATING FEEDBACK TO TEACH INSTRUCTIONAL STRATEGIES 2
per 15 min to improve student outcomes (Kranak et al., 2017). However, many instructors praise
less than once per 15 min overall (Floress et al., 2018; Scott et al., 2011).
Like praise, increasing OTRs can improve student success. An OTR is defined as any
instructor behavior that solicits a student response and may be followed by feedback (Macsuga-
Gage & Simonsen, 2015). OTRs may be presented in several ways, including vocal questions,
response cards (Davis & O’Neill, 2004), or choral responding (Kamps et al., 1994). Providing
high-rate OTRs yields similar behavioral outcomes as praise, including decreasing challenging
behavior (Haydon et al., 2010), increasing on-task behavior (Carnine, 1976), and increasing
correct responses for the targeted skill (Fien et al., 2015). Improved student outcomes occur
when rates of OTRs exceed three per min (Macsuga-Gage & Simonsen, 2015). However, many
teachers provide OTRs less than twice per min in practice (Englert, 1983; Stichter et al., 2009;
Van Acker et al., 1996).
If OTRs and praise are such powerful tools, why do instructors use them so infrequently?
One possibility is that instructors are not being taught about these tools. Pre-service teachers
report completing few courses and receiving minimal instruction related to instructional or
behavior-management strategies during training programs (Begeny & Martens, 2006). A lack of
pre-service training may explain why many instructors report feeling underprepared to deal with
challenging behavior (Reinke et al., 2011). Given the lack of pre-service training and the
disparities between recommendations and observed teacher behavior, it may be necessary to
identify ways to increase use of evidence-based instructional strategies during ongoing
instruction.
Improving use of one strategy may have generative positive effects on related strategies.
For example, instructors who provide more OTRs also tend to provide praise more frequently
EVALUATING FEEDBACK TO TEACH INSTRUCTIONAL STRATEGIES 3
(Van Acker et al., 1996). Sutherland et al. (2002) identified a statistically significant positive
correlation between the frequencies with which 20 classroom instructors used OTRs and
provided praise. However, neither Van Acker et al. (1996) nor Sutherland et al. (2002)
demonstrated concomitant changes in OTRs and praise, they merely correlated use of those
strategies by certain teachers. Therefore, it is possible that these studies capture a difference
between highly engaged and less engaged instructors. Alternatively, it may be the case that
instructors who provide more OTRs have more salient opportunities to praise student responses.
Sequential analyses of instructor’s OTRs and praise suggest that praise occurs after OTRs
significantly more often than would be predicted by chance (Sutherland et al., 2000). This
sequential relation suggests that improving teachers’ OTRs may result in concomitant, but
untaught, increases in praise. However, the extent to which there is a true functional relation
between use of OTRs and praise remains unclear.
The possible functional relation between OTRs and praise is further muddled because
some research has suggested functional independence of these two skills. For example, Simonsen
et al. (2010) evaluated teachers’ acquisition of three classroom-management strategies, including
OTRs and praise, in a multiple-baseline-across-responses design. When praise increased
following feedback, there was no clear corresponding increase in OTRs for any of the
instructors. However, it may be possible that the relation is not bidirectional; increasing OTRs
might increase rates of praise, even though increasing rates of praise does not appear to affect
OTRs. Thus, further research is needed on the impact of increasing OTRs on labeled praise
during instruction.
Performance feedback presents a promising means of increasing the frequency of OTRs
and praise by instructors (Colvin et al., 2009). Performance feedback is defined as information
EVALUATING FEEDBACK TO TEACH INSTRUCTIONAL STRATEGIES 4
regarding the quality or quantity of past performance (Arco & Birnbrauer, 1990). Performance
feedback improves a variety of skills across multiple settings and types of feedback (Alvero et
al., 2001). There is sufficient evidence to classify providing performance feedback as an
evidence-based practice for training classroom instructors (Fallon et al., 2015). Previous
applications of performance feedback in schools typically consist of four components: (a)
presenting data on past performance, (b) praising correct performance or improvements, (c)
providing corrective feedback for skills implemented incorrectly or inconsistently, and (d)
suggesting strategies that can be used to change behavior (Noell et al., 2000). Performance
feedback has been provided to instructors on a variety of instructional strategies, including both
labeled praise and OTRs.
Rates of labeled praise have increased following a variety of types of feedback
(Cavanaugh, 2013). Feedback may include information that are delivered vocally (e.g., Cossairt
et al., 1973), written or typed (e.g., Hemmeter et al., 2011), or shown in a graphical display (e.g.,
Reinke et al., 2007). For example, Hemmeter et al. (2011) used written feedback delivered via
electronic mail to increase rates of praise for four instructors. Alternatively, Reinke et al. (2007)
provided a graph depicting the rate of labeled praise to the teacher used each day. Some
researchers have used multiple types of feedback in combination to increase rates of praise (e.g.,
Mesa et al., 2005; Myers et al., 2011; Simonsen et al., 2010). For example, Mesa et al. (2005)
effectively increased rates of praise for two teachers by providing both graphical feedback and
written qualitative suggestions for improvement.
In contrast to praise, there have been few evaluations of feedback to increase OTRs
provided during instruction. Some of these studies have included feedback delivered as part of a
larger training package (e.g., with didactic instruction; Cooper et al., 2018; Sutherland & Wehby,
EVALUATING FEEDBACK TO TEACH INSTRUCTIONAL STRATEGIES 5
2001) rather than feedback in isolation. Although packages including feedback have increased
OTR rates, results of studies evaluating feedback in isolation are inconsistent (Cavanaugh,
2013). For example, Simonsen et al. provided a combination of vocal, written, and graphical
feedback to increase use of OTRs for three teachers. Although the feedback delivered might be
considered robust (i.e., due to the inclusion of many components), minimal change in OTRs
occurred. However, the measurement system used during this study (observers simply indicated
whether the behavior occurred or not during pre-determined intervals) was relatively weak. It is
possible that the measurement system used during this study simply did not capture the change in
OTRs. In one successful application of performance feedback alone to increase OTRs, Cuticelli
et al. (2016) provided feedback during daily 5-10 min meetings with each instructor. During the
meeting, the researcher provided three pieces of feedback: graphed data on previous
performance, a discussion of barriers to performance, and identification of strategies for future
success. Although feedback increased OTRs for five of six teachers relative to baseline, none of
the teachers consistently provided the recommended three OTRs per min (Macsuga-Gage &
Simonsen, 2015). Because Cuticelli et al. did not include any positive feedback (e.g., praise or
acknowledgement of teacher success), it is possible that teachers had difficulty discriminating
between successful and lackluster performance. Perhaps efficacy of the feedback procedures
could be improved by addition of this component.
Meetings between the trainer and instructor to review feedback (like those used by
Cuticelli et al. [2016]) may be a potential barrier to widespread adoption of feedback. Although
such meetings are commonly reported in feedback studies (e.g., Fallon et al., 2015), many
components of feedback easily could be provided without requiring regular meetings. Written
and graphical feedback, both of which can be delivered nonvocally, have been used successfully
EVALUATING FEEDBACK TO TEACH INSTRUCTIONAL STRATEGIES 6
both separately and in combination across a variety of skills (Alvero et al., 2001). Both written
and graphical feedback also provide a permanent product of the feedback. Providing feedback
documents may be useful because instructors can monitor their performance over time, review
the feedback if desired, or consume feedback when is convenient or seems most helpful to them.
For example, it is possible that feedback may be more effective when reviewed immediately
prior to the next instructional session, rather than after teaching (Aljadeff-Abergel et al., 2017).
However, there may also be some limitations to written and graphical feedback,
particularly when used without accompanying meetings. First, regular meetings to deliver vocal
feedback may provide the instructor with an opportunity to ask questions or engage in a nuanced
discussion regarding their performance. Second, it is possible that regular meetings with the
trainer provide accountability that the instructor needs to review the feedback sufficiently and
modify their use of instructional strategies. Lastly, it is unclear how the delay between behavior
and receipt or review of the feedback may influence the efficacy of feedback.
Ultimately, any form of feedback can be effective only if the consumer is willing to use
it. Therefore, in addition to evaluating efficacy, researchers should determine which feedback
types are socially valid. Social validity is a subjective measure of social significance of the
intervention goal, appropriateness of the procedures used, or importance of the effects (Wolf,
1978). Wolf describes the phenomenon well when he states “If participants don’t like the
treatment, then they may avoid it, or run away, or complain loudly. And thus, society will be less
likely to use our technology, no matter how potentially effective and efficient it may be” (Wolf,
1978, p. 206). Social validity is so important that some ethics codes require its consideration
(e.g., Behavior Analyst Certification Board, 2014).
EVALUATING FEEDBACK TO TEACH INSTRUCTIONAL STRATEGIES 7
Social validity is often evaluated through questionnaires. However, challenges may arise
when using questionnaires to compare social validity across staff-training procedures, like
feedback. First, most empirically validated social-validity questionnaires (e.g., Behavior
Intervention Rating Scale; Elliot & Von-Brock Treuting, 1991; Treatment Acceptability Rating
Form; Reimers & Wacker, 1988) were developed to evaluate client interventions rather than
staff-training procedures (Common & Lane, 2017). Second, subjective measures, like
questionnaire responses, may not correspond with objective measures of preference. For
example, an individual may respond inaccurately on a questionnaire if they view criticism of the
procedures as socially unacceptable (Barton et al., 2014). Lastly, social-validity questionnaires
often include multiple questions regarding a single procedure. Thus, questionnaires may not
provide sufficient information to compare the social validity of one procedure relative to another.
Strohmeier et al. (2014) surveyed special educators in an attempt to compare the social
validity of online trainings, performance feedback delivered vocally, and incentives for
performing well. The educators ranked each method in order of perceived efficacy, as well as
answered one question about the social validity of each of training method. The special educators
perceived performance feedback as more effective than the other training methods and rated
performance feedback as socially valid. However, questions about each training method differed
slightly complicating comparisons of social validity across procedures. For example, the
question about performance feedback asked participants to indicate how feedback would be
perceived in their classroom, whereas the question regarding online training modules solicited
information on how likely the participant would be to complete the trainings.
To avoid some of the challenges associated with questionnaires, social validity can be
evaluated by providing the participant with choices between various training procedures. For
EVALUATING FEEDBACK TO TEACH INSTRUCTIONAL STRATEGIES 8
example, in a concurrent-chain assessment, the participant is presented with a choice between
different procedures (e.g., feedback types). The participant selects which procedure they would
like to experience, then directly experiences the selected option. This process is repeated until a
clear preference (i.e., consistent choice) or lack of preference is demonstrated.
Across two evaluations, Luck et al. (2018) used a concurrent-chain assessment to
evaluate instructor preferences for written feedback in isolation, vocal feedback in isolation, and
vocal feedback with video review. During each evaluation, researchers first demonstrated that
each type of feedback was effective by teaching a behavioral skill using that form of feedback,
then provided repeated choices of which feedback type the participant would like to receive
using a concurrent-chain assessment. After completing the concurrent-chain assessment, the
researchers provided each participant with a social-validity questionnaire with six questions
specific to each feedback type and had the participants rank the feedback types in order of
preference.
Preferences for feedback type varied across participants during Luck et al. (2018). When
presented with a choice between written and vocal feedback in isolation or no feedback during
the first study, three participants selected primarily vocal feedback, one selected primarily
written feedback, and two alternated between feedback types. However, when presented with a
choice between written feedback, vocal feedback, vocal feedback with video review, or no
feedback during the second study, all six participants selected vocal feedback during most
opportunities.
Preferences varied across time for individual participants, as well. Results obtained by
Luck et al. (2018) suggest several interesting idiosyncrasies about participant preferences for
feedback type that warrant further investigation. Generally, there was a lack of correspondence
EVALUATING FEEDBACK TO TEACH INSTRUCTIONAL STRATEGIES 9
between teachers’ selected feedback type and their ratings on the questionnaire. For example,
three participants ranked vocal feedback with video review as most preferred yet chose to receive
vocal feedback in isolation. In addition, several teachers indicated on social-validity
questionnaires that they preferred to receive multiple types of feedback (e.g., both vocal and
video-based feedback) but chose to receive a single feedback type during the concurrent-chain
assessment. However, three of six participants in this study displayed changes in preference
(i.e., consistent selections) over time. It is possible that discrepancies between which feedback
type was ranked as most preferred and which was selected could be accounted for by shifts in
preference.
There are some limitations to the procedures used by Luck et al. (2018) that should be
considered. First, each type of feedback in this study had previously been used to teach a specific
skill. Thus, it is possible that participants’ preferences for a given feedback type were influenced
by preferences for the skill that it was previously used to teach. Second, this evaluation occurred
in a controlled research setting with few competing contingencies rather than the naturalistic
environment, which may reduce the generalizability of the results. For example, participants in a
controlled setting may select a type of feedback based on perceived efficacy of the feedback.
However, other aspects of the feedback (e.g., efficiency) may be more important when
considering the classroom context in which the procedure would ultimately be used.
Further research is needed on instructor preference for various types of feedback. These
studies should be conducted in naturalistic settings (e.g., classrooms), given that aspects of these
environments may influence choice. To evaluate preference as the primary dependent measure,
researchers should also avoid possible threats to internal validity associated with using each
feedback type to teach different behavioral procedures. By further controlling for participants’
EVALUATING FEEDBACK TO TEACH INSTRUCTIONAL STRATEGIES 10
history with each type of feedback, we can also evaluate whether preferences shift after being
exposed to a type of feedback. Additionally, studies should further evaluate preferences for types
of feedback that do not require scheduled meetings.
The overall aim of the current studies is to evaluate the efficacy and social validity of
written and graphical feedback about instructors’ use of praise and OTRs. Study 1 evaluated the
efficacy of written and graphical feedback to increase instructors’ use of OTRs. Although written
and graphical feedback have improved skills like praise (Alvero et al., 2001), increasing OTRs
may be more difficult than increasing praise (Simonsen et al., 2010). A secondary purpose of
Study 1 was to examine the relation between OTRs and rates of labeled praise during instruction.
We achieved this aim by measuring the extent to which increasing OTRs produced concomitant
increases in rates of praise.
Study 2 evaluated teacher preferences for written and graphical feedback, in the context
of typical classroom situations, and extended the previous literature by removing confounds
between feedback type and skills that were taught (Luck et al., 2018). Study 2 also extended the
literature by evaluating preference with a larger sample of teachers and assessing changes in
preference over a longer period of time. Study 2 replicated Luck et al. (2018) by evaluating the
extent to which stated preferences for feedback type aligned with behavioral selections.
Study 1 Method
Study 1 was an evaluation of the efficacy of written and graphical feedback to increase
instructors’ use of OTRs, and the extent to which increasing OTRs resulted in concomitant
increases in labeled praise. We completed Study 1 at a Professional Association of Therapeutic
Horsemanship (PATH) International accredited facility that provided equine-assisted activities
and therapies (EAAT). Each lesson at the PATH facility consisted of one instructor working with
EVALUATING FEEDBACK TO TEACH INSTRUCTIONAL STRATEGIES 11
one to three learners to practice communication and horsemanship skills. Learners in this context
are likely to benefit from evidence-based instructional strategies like those used in traditional
classrooms. However, initial training for EAAT instructors typically consists of mentorship from
a previously certified individual and may include variable amounts of support related to
behavior-management techniques (PATH, 2019); no formal experiences with instructional
strategies are required. Increasing praise as a behavior-management strategy was particularly
important for the PATH-certified instructors because the latest standards distributed by PATH
(2019) recommend providing frequent praise to riders during lessons.
Participants
We recruited participants by distributing flyers at the PATH facility. Prior to
participating, each instructor completed an initial appointment. During this appointment, the
experimenter reviewed an informed-consent document with the instructor and answered any
questions. The consent document included risks and benefits of participating in the study, as well
as definitions of OTRs and praise, and recommendations of how often to use each instructional
strategy (based on classroom studies, Macsuga-Gage & Simonsen, 2015; Kranak et al., 2017).
The instructor was asked to sign the consent document and complete a demographics
questionnaire (see Appendix A). The demographics questionnaire included four questions
regarding general demographics (i.e., age, gender, ethnicity, and education) and nine questions
about teaching experience (e.g., population served, supervision responsibilities, and perceived
value of praise).
Three therapeutic-riding instructors participated in this study. All three instructors were
certified by the Professional Association of Therapeutic Horsemanship (PATH) to provide
therapeutic-riding instruction to individuals of all ages. All instructors were Caucasian females
EVALUATING FEEDBACK TO TEACH INSTRUCTIONAL STRATEGIES 12
who had earned a master’s degree. Tamera was 25 years old with one year of teaching
experience. She reported providing feedback on a quarterly basis to volunteers at the therapeutic-
riding center. Lucy was 34 years old and had five years of teaching experience. She reported
providing feedback to volunteers on a weekly basis. Hope was 59 years old and had 13 years of
teaching experience. She reported providing feedback to volunteers and others on a weekly basis.
All instructors strongly agreed with the statement “Providing praise frequently is important to
learner success.”
Materials
Materials included paper datasheets, a portable printer, and a laptop computer equipped
with Microsoft® Word and GraphPad® Prism (i.e., graphing software). Feedback was prepared
using Microsoft® Word and was printed immediately following the observation using the
portable printer.
Dependent Measures and Data Collection
Trained observers collected data using paper datasheets during each observed lesson. The
datasheet was divided into sections where the observer tallied each instance of OTRs, labeled
praise, and generic praise (see Appendix B). The data were summarized as rates by dividing the
total number of instances of behavior by the lesson duration in min. We defined an OTR as a
verbal directive to the rider specifying or implying a rider response. In EAAT, an OTR may
consist of instruction related to body positioning (e.g., “push your heels toward the ground”) or
specifying a skill to practice (e.g., “weave between the two poles”). We defined praise as a
positive statement delivered to the rider. Praise was considered labeled if it stated the behavior to
which the praise referred to and generic if it did not. For example, the statement “good job sitting
up straight,” was considered labeled praise. The statement “good job” was considered generic
EVALUATING FEEDBACK TO TEACH INSTRUCTIONAL STRATEGIES 13
praise. We scored each instruction and praise statement separately, even if they occurred in
bursts (e.g., multiple positive statements grouped together or repeated instructions).
Experimental Design
We demonstrated experimental control using a concurrent multiple-baseline design
across instructors. We staggered implementation of the intervention across instructors by at least
two sessions, in accordance with recommendations about quality single-case research design
(Kratochwill et al., 2013). We analyzed the data using visual-inspection techniques.
Procedures
We observed one to four regularly scheduled EAAT lessons for each instructor
approximately one day per week. Lessons occurred in either an indoor or outdoor arena. The
indoor arena was 25 by 37 meters and the outdoor arena was 24 by 24 meters. The lesson
location was determined by the instructor based on weather conditions that day. Each lesson was
approximately 30 min in duration.
Baseline. During baseline, we observed the lesson but did not provide any feedback on
the instructors’ use of OTRs, labeled praise, or generic praise. Instructors would have been
excluded if they consistently provided OTRs at or above the frequency recommended for
classrooms (i.e., at least 3/min; Macsuga-Gage & Simonsen, 2015) or labeled praise at the
frequency associated with improved behavioral outcomes (i.e., at least 4/min; Kranak et al.,
2017) during baseline, but this did not occur. We continued baseline until (1) at least five lessons
had been observed, (2) there was no increasing trend in OTRs for at least three consecutive
lessons (except for Lucy, due to experimenter error), and (3) there had been at least two lessons
since intervening for any other instructor.
EVALUATING FEEDBACK TO TEACH INSTRUCTIONAL STRATEGIES 14
Feedback on OTRs. After each lesson, the experimenter provided written and graphical
feedback on the instructor’s use of OTRs (see Appendix C for an example). No feedback was
provided on rates of praise. The feedback included four components: a) labeled praise for an
OTR that occurred or an increase in rate of OTRs, b) a suggestion for increasing OTR usage, c) a
line graph depicting the rate of OTRs across all lessons, and d) a brief narrative to orient the
instructor to the graph. We selected these feedback components to be consistent with previous
uses of performance feedback to teach instructional strategies (e.g., Noell et al., 2000). Within 15
min of completing the observation, the experimenter approached the instructor, handed her a
copy of the printed document, and made a closing statement that did not specify what was
included on the document (e.g., “Thanks for letting me observe, have a good day.”). A second
copy of the information sheet was kept by the experimenter and used for completion of the
procedural-fidelity checklist (see below). Although the experimenter did not solicit questions
from the instructor, the experimenter responded to any questions asked.
We continued to provide feedback on OTRs until the instructor provided OTRs at the
recommended rate of 3/min (Macsuga-Gage & Simonsen, 2015) for at least three consecutive
lessons or until five consecutive lessons occurred with minimal change in OTR rate. If an
instructor conducted five consecutive lessons with minimal change in OTR rate and did not
provide the recommended three OTRs per min, we planned to provide vocal and graphical
feedback because those feedback types increased OTRs and labeled praise in other studies
(Colvin et al., 2009; Cuticelli et al.,2016). However, no instructors met these criteria.
Feedback frames. Given that feedback was prepared quickly following the observation,
the experimenter selected feedback statements from a list of pre-determined feedback frames
(see Appendices D and E for the frames used for OTRs and praise, respectively). To develop the
EVALUATING FEEDBACK TO TEACH INSTRUCTIONAL STRATEGIES 15
feedback frames, we observed classroom teachers and EAAT instructors to identify content areas
in which feedback may be appropriate for each skill. Feedback on use of OTRs focused on rate,
distribution, content, and strategies used to provide OTRs during single and group lessons.
Feedback on use of praise focused on rate, distribution, specificity, style and tone, and content of
the praise statements. We then drafted lists of praise statements and suggestions for improvement
to use as the basis for feedback following therapeutic-riding lessons, and asked the Executive
Director and Director of Development from the PATH facility (neither of whom participated in
the study) to provide feedback on the clarity, helpfulness, and acceptability of the statements. We
edited the feedback frames based on the experts’ recommendations prior to use.
Feedback on labeled praise (Hope only). Once rates of OTRs were increased and stable
for each instructor, we evaluated changes in labeled praise. To determine whether labeled praise
increased when feedback was provided on OTRs, we compared the mean frequency of labeled
praise before and after instructors received feedback on OTRs. We determined that feedback
would be provided on praise only if the frequency of labeled praise did not double following
feedback on OTRs. When comparing average rates of praise across baseline and OTR-feedback
phases, frequency of praise doubled for each instructor. However, the frequency of praise for
Hope was elevated relative to baseline but highly variable (M = 0.25/min, SD = 0.23). Therefore,
we provided Hope with feedback about praise statements.
During the praise-feedback phase, written and graphical feedback was provided on use of
labeled praise within 15 min of completing the observation. We included the same components
of feedback as used to increase OTRs (i.e., graphical display of rates and description of graph,
praise for use, and suggestion for improvement). No feedback was provided on OTRs. After
approximately 11 sessions, Hope provided labeled praise approximately six times per 15 min
EVALUATING FEEDBACK TO TEACH INSTRUCTIONAL STRATEGIES 16
(i.e., consistent with recommended minimums; Sutherland et al., 2000). At this time, Hope stated
that she did not think increasing praise beyond that point was appropriate and opted to consider
this goal met.
Maintenance. Two maintenance observations were completed for each instructor.
Maintenance observations were identical to baseline (i.e., no feedback was provided).
Maintenance observations were scheduled for two and four weeks following the final feedback
session. However, due to inclement weather and instructor cancellations, maintenance
observations for Lucy and Tamera did not occur on schedule. Maintenance observations
occurred approximately two and seven weeks following the final feedback session for Lucy and
six and seven weeks for Tamera.
Social validity. After completing the final maintenance observations, we provided each
instructor with a social-validity questionnaire to assess the extent to which the feedback provided
was perceived to be acceptable, effective, and efficient (see Appendix F). The social-validity
questionnaire was administered vocally by an experimenter who never provided feedback to the
instructor to increase the likelihood that instructors would feel comfortable sharing negative
feedback about the procedures used. The instructor was asked to respond to nine statements
using a 6-point Likert-type scale indicating degree of agreement with the statement. A response
of 1 indicated strong disagreement with the statement and a response of 6 indicated strong
agreement with the statement. For eight of the questions, a higher score indicated greater social
validity. A single item was reverse scored, such that a lower score indicated greater social
validity. Additionally, we included questions allowing the instructor to indicate how often they
carefully read the feedback after the lesson, reviewed past feedback, and two open-ended
questions regarding the instructors’ most- and least-preferred aspects of the procedure.
EVALUATING FEEDBACK TO TEACH INSTRUCTIONAL STRATEGIES 17
Interobserver Agreement (IOA) and Procedural Fidelity
Training for observers consisted of reviewing the operational definitions with a
previously trained observer and collecting practice data during therapeutic-riding lessons. For
some observers, the first training lesson observed included vocally identifying each instance of
an OTR or praise statement. Then, the observer scored lessons independently (i.e., with no
experimenter input during the lesson) until they scored a lesson with IOA of at least 80% for
each behavior when compared to a trained observer. We calculated IOA by dividing the smaller
observed value by the larger observed value and converting to a percentage by multiplying by
100.
Throughout the study, an independent secondary observer collected data on 51% of all
sessions. IOA data were collected during 52% of sessions for Hope. Mean agreement was 91%
(range, 76% - 100%) for OTRs, 86% (range, 71% - 100%) for generic praise, and 74% (range,
0% - 100%) for labeled praise; the single observation with IOA of 0% was due to one observer
scoring one response and the other scoring zero responses. IOA data were collected during 54%
of sessions for Lucy. Mean agreement was 90% (range, 72% - 100%) for OTRs, 89% (range, 0%
- 100%) for generic praise, and 76% (range, 0% - 100%) for labeled praise. As with Hope, low
agreement for generic praise occurred for a single observation in which one observer scored one
response and the other scored zero. Low agreement for labeled praise occurred due to two
observations in which one observer scored zero responses and the other indicated that one or two
responses occurred. Thus, despite the large range in IOA coefficients, overall counts obtained by
the independent observers did not markedly differ. IOA were collected during 41% of sessions
for Tamera. Mean agreement was 89% (range, 72% - 89%) for OTRs, 87% (range, 77% - 96%)
for generic praise, and 95% (range, 82% - 100%) for labeled praise.
EVALUATING FEEDBACK TO TEACH INSTRUCTIONAL STRATEGIES 18
We collected data on procedural fidelity during 53% of all feedback sessions. Procedural-
fidelity data were collected using a checklist of experimenter behavior and were completed by an
independent observer (i.e., not the experimenter). During feedback phases, correct
implementation consisted of four steps: (a) providing no vocal feedback during or after the
observation, (b) providing the information sheet within 15 min of the end of the lesson, (c)
making no statement that specified what was included on the information sheet, and (d)
including the appropriate feedback components on the information sheet. The fidelity observer
scored implementation of each of these components as either correct or incorrect. Procedural-
fidelity coefficients were calculated by dividing the total number of components implemented
correctly by the total number of components observed and multiplying by 100. Mean procedural
fidelity across sessions was 99% (range, 75% - 100%).
Results and Discussion Study 1
Figure 1 displays OTRs per min for each instructor. The x-axis shows consecutive
observations across instructors (resulting in the first observation of Lucy, which was the third
observation of the study, to appear at an x-axis value of 3). The dotted horizontal lines indicate
the recommended rate of OTRs (i.e., at least 3/min; MacSuga-Gage & Simonsen, 2015).
The top graph depicts OTRs for Hope. During baseline, Hope provided an average of
2.98 OTRs per min (SD = 1.11). However, the rate of OTRs varied greatly across lessons, and
Hope did not provide the recommended three or more OTRs per min with consistency. The mean
rate of OTRs increased and variability decreased after feedback was provided. On average, Hope
provided 4.86 OTRs per min (SD = 0.86) during the feedback phase. Hope continued to provide
the recommended three or more OTRs per min during the praise-feedback (M = 4.88/min, SD =
1.29) and maintenance phases (M = 4.67/min, SD = 1.08) respectively.
EVALUATING FEEDBACK TO TEACH INSTRUCTIONAL STRATEGIES 19
The middle graph depicts OTRs for Lucy. Similar to Hope, the frequency of OTRs Lucy
provided varied greatly across observed lessons. During baseline, Lucy provided an average of
1.92 OTRs per min (SD = 0.76). Although the first four observations did not show a consistent
increasing trend in OTRs, there was an increase in OTRs during the fifth observed lesson (3.67
OTRs/min). Due to experimenter error, feedback on use of OTRs was provided following this
lesson. Although Lucy provided the recommended rate of OTRs consistently during the first five
observed lessons, we continued monitoring OTRs due to the error made in progressing to the
OTR-feedback phase. After feedback on OTRs was provided, Lucy provided at least three OTRs
per min during 78.5% of lessons. On average, Lucy provided 4.00 OTRs per min (SD = 1.48)
during the OTR-feedback phase. During maintenance observations, Lucy provided 3.84 OTRs
per min (SD = 1.08) on average.
The bottom graph depicts OTRs for Tamera. During baseline, Tamera provided fewer
than the recommended three OTRs per min during eight of nine lessons. On average, Tamera
provided 1.99 OTRs per min (SD = 0.76). After feedback on use of OTRs began, Tamera
immediately and consistently began to provide at least three OTRs per min. On average, Tamera
provided 4.31 OTRs per min (SD = 0.80) during the OTR-feedback phase. Although Tamera
consistently provided recommended rates of OTRs, we continued the OTR-feedback phase for
eight consecutive lessons because we had observed slight decreases in OTRs after repeated
exposure to feedback for both Hope and Lucy. OTRs remained high during Tamera’s
maintenance observations (M = 4.82/min, SD = 0.07).
The present findings extend the previous literature in several ways. First, previous
evaluations of feedback to increase OTRs have yielded mixed results but have included
limitations, such as indirect measures of OTRs (Stichter et al., 2006) or increases that did not
EVALUATING FEEDBACK TO TEACH INSTRUCTIONAL STRATEGIES 20
meet the recommended levels of OTRs (Cuticelli et al., 2016). The results obtained in this study
contribute to the existing literature suggesting that performance feedback increases OTRs (e.g.,
Cuticelli et al., 2016). Second, the present study used written and graphical feedback to increase
OTRs. Previously, Cuticelli et al. (2016) provided both vocal and graphical feedback during brief
meetings with the teacher. Taken in combination, these data indicate that graphical feedback
contributes to increases in rates of OTRs. However, we avoided requiring scheduled meetings to
receive feedback by using graphical feedback in combination with written feedback, instead of
vocal feedback. Using written feedback may create similar behavior change without requiring
valuable instructor time. Third, unlike previous studies (e.g., Cuticelli et al., 2016; Stichter et al.,
2006), rates of OTRs increased to at least 3/min for all instructors in this study. One possible
explanation for the increase to recommended levels is that aspects of the feedback procedures
used during this study (e.g., inclusion of written feedback) were particularly effective at
increasing rates of OTRs. Last, the current study extends the existing performance-feedback
literature by evaluating the use of written and graphical feedback in a novel context. To our
knowledge, this is the first behavior-analytic evaluation of performance feedback for instructors
of EAAT. Studies identifying effective training strategies, like performance feedback, may be
important because training for EAAT instructors consists of supervision by a previously certified
individual rather than didactic instruction (PATH, 2019).
One limitation of the EAAT context was lack of control over the overall frequency of
performance feedback due to variability in instructor and rider schedules. Cancellations due to
sickness, weather, and holidays sometimes resulted in long periods elapsing between
observations, which resulted in days between feedback. For example, Tamera experienced a 10-
week period without feedback between the 6th and 7th instances of feedback (observations 75
EVALUATING FEEDBACK TO TEACH INSTRUCTIONAL STRATEGIES 21
and 76 on Figures 1 and 2). Although OTRs were slightly lower during Lesson 76 than Lesson
75, the large delay to feedback did not appear to substantially affect performance. These data
suggest that the feedback provided in this study was relatively robust, as past literature suggests
that effects of feedback are most pronounced when feedback is provided either daily or weekly
(Alvero et al., 2001).
An additional aim of this study was to evaluate possible increases in praise when
feedback was provided only for OTRs. Figure 2 displays labeled-praise statements (right graphs)
and combined praise statements (both labeled and generic praise; left graphs) per min for each
instructor. The top left graph depicts labeled praise for Hope. During baseline, Hope provided an
average of 0.10 labeled-praise statements per min (approximately once per 10 min; SD = 0.07).
At the start of the OTR-Feedback phase, there was an increase in the frequency of labeled praise.
However, the initial increase in labeled praise was transient and rates declined across the next six
observations before becoming highly variable. Although the average rate of labeled praise
differed from baseline, rates varied greatly across observations (M = 0.25/min, SD = 0.23). Based
on the large amount of variability, we provided Hope with explicit feedback on use of labeled
praise. When feedback was provided on praise, the frequency with which Hope provided labeled
praise increased slightly and was more consistent (M = 0.33/min, SD = 0.18). However, after
approximately 11 lessons, the frequency of labeled praise stabilized at approximately 0.34
labeled-praise statements per min (approximately once per 3 min). After these lessons, Hope
commented to the experimenter that she did not feel that the recommended rate of praise (i.e.,
4/min; Kranak et al., 2017) was appropriate for her learners. The experimenter asked Hope if she
would like to continue to work on this goal and Hope opted to consider this goal met. Increases
in labeled praise maintained during maintenance observations (M = 0.46/min, SD = 0.09).
EVALUATING FEEDBACK TO TEACH INSTRUCTIONAL STRATEGIES 22
The middle left graph depicts Lucy’s labeled praise. During baseline, Lucy provided 0.11
labeled-praise statements per min (SD = 0.11). There was an increase in labeled-praise
statements during the fifth observed lesson, similar to OTRs. During this lesson, Lucy provided
0.30 labeled-praise statements per min. During the OTR-feedback phase, Lucy also provided
more labeled praise on average (M = 0.24/min, SD = 0.15) relative to baseline. The use of
labeled praise increased gradually across the phase. Similar to Hope, rates of labeled praise
statements stabilized at approximately 0.3 labeled-praise statements per min and maintained
during two- and seven-week maintenance observations (M = 0.41/min, SD = 0.06).
The bottom left graph depicts labeled praise per min for Tamera. Tamera also
consistently provided few labeled-praise statements (M = 0.16/min, SD = 0.09) during baseline.
After feedback on OTRs had been provided for two lessons, Tamera began providing labeled
praise with increased frequency. On average, Tamera provided 0.48 (SD = 0.31 labeled-praise
statements per min during the OTR-feedback phase. Labeled praise remained high during
Tamera’s maintenance observations (M = 0.77/min, SD = 0.32), despite these observations
occurring six and seven weeks after the final lesson with feedback.
Analyses of combined praise data yield somewhat similar patterns of responding for each
instructor. Note that combined praise includes both labeled and generic praise. Thus, data
included in the left graphs contribute to a those displayed in the right graphs. Hope provided an
average of 0.99 praise statements per min (SD = 0.61) during baseline. Average praise statements
increased after Hope received feedback on OTRs (M = 1.59/min, SD = 0.57). Relative to labeled
praise, combined praise was less variable for Hope during OTR feedback. We provided Hope
with feedback on praise despite initial increases in labeled praise because there was substantial
variability in the frequency of labeled praise she provided. Notably, there was slightly less
EVALUATING FEEDBACK TO TEACH INSTRUCTIONAL STRATEGIES 23
variability in combined praise than labeled praise for Hope. During the praise-feedback phase,
Hope provided an average of 2.26 praise statements per min (SD = 0.72). During maintenance
observations, combined praise decreased slightly (M = 1.69/min, SD = 0.16). Lucy provided an
average of 0.46 praise statements per min (SD = 0.34) during baseline. During the OTR-feedback
phase, the rate of praise statements increased (M = 1.09/min, SD = 0.42). Lucy continued to
provide increased rates of combined praise during maintenance observations (M = 1.17/min, SD
= 0.23). Similarly, Tamera provided an average of 0.89 praise statements during baseline (SD =
0.18). During the OTR-feedback phase, Tamera provided an average of 1.40 praise statements
per min (SD = 0.58). Tamera provided praise with increased frequency during maintenance
observations, as well (M = 2.49, SD = 0.62).
Mean rates of labeled praise at least doubled relative to baseline, even though feedback
was provided only on use of OTRs. These data suggest that there may be a functional relation
between use of OTRs and praise. Although this is consistent with previous studies (Sutherland &
Wehby, 2001; Van Acker et al., 1996), these studies have demonstrated a correlation between
OTRs and praise based on individual observations of multiple teachers. Given the possibility that
these studies captured differences between highly engaged and less-engaged teachers, we
extended the previous literature by collecting multiple observations OTRs and praise as feedback
was provided on OTRs alone.
However, these data contrast the results obtained by Simonsen et al. (2010), which
suggested functional independence of praise and OTRs. However, Simonsen et al. (2010)
provided each instructor with feedback on their use of praise prior to OTRs. Thus, it is possible
that increasing OTRs creates concomitant increases in praise (e.g., praising correct responses to
the OTR) but the opposite does not occur. The data obtained in this study may support this idea,
EVALUATING FEEDBACK TO TEACH INSTRUCTIONAL STRATEGIES 24
given that there were larger increases in labeled praise relative to combined praise. It is possible
that this occurred because instructors provided praise for specific rider behaviors that occurred
following an OTR. Taken together, these data suggest that the relation between OTRs and praise
is not bidirectional.
However, extra-experimental factors may have influenced rates of labeled praise in the
current evaluation. When using a multiple-baseline design, a clear demonstration of experimental
control would include changes in behavior when and only when the independent variable is
introduced (Perone & Hursh, 2013). For Lucy and Tamera, the increase in labeled praise did not
occur immediately once feedback was provided for OTRs and rates of OTRs increased. Instead,
rates of praise increased at fairly similar times for both instructors, and at about the same time
that we began providing Hope with feedback for labeled praise. Thus, it seems possible that
Hope or another facility staff member may have made a statement about labeled praise that
influenced behavior for Lucy and Tamera. Future studies could avoid this potential confound by
ensuring independence of the instructors (e.g., recruiting instructors from different facilities who
do not know each other).
Although mean rates of labeled praise doubled for all instructors, none of the instructors
provided four praise statements per min (the recommended rate to improve student outcomes;
Kranak et al., 2017) during any observation. Although instructors did not provide four praise
statements per min, rates of praise were consistent with the minimum rate of praise that is
recommended for classrooms (six praise statements per 15 min [0.4/min]; Sutherland et al.,
2000). Rates of praise for instructors in this study stabilized between 0.3 and 0.5 labeled praise
statements per min. Combined rates of generic and specific praise exceeded the recommendation
of 0.4/min, occurring approximately once per min for each instructor.
EVALUATING FEEDBACK TO TEACH INSTRUCTIONAL STRATEGIES 25
However, recommendations of how often to use praise have been developed based on
student outcomes in traditional classrooms (e.g., on task for students with Autism Spectrum
Disorders or emotional and behavioral disorders by Kranak et al. [2017] and Sutherland et al.
[2000] respectively). Recommendations regarding rates of OTRs were determined based on a
systematic review of the education literature (Macsuga-Gage & Simonsen, 2015). It is unclear
whether the recommended rates of OTRs and praise in classrooms align with what would benefit
learners during EAAT or other novel instructional contexts. Learners with intellectual and
developmental disabilities may process speech differently (Boddaert et al., 2004). It seems
possible that these learners may benefit from fewer verbal statements (e.g., OTRs and praise). In
fact, Hope’s main concern was that providing labeled praise at the recommended rate would be
too quick for her learners to process. Researchers should further investigate the necessary and
sufficient conditions to produce optimal behavioral outcomes across learners and instructional
settings (e.g., Haydon et al., 2010; Stormont et al., 2007).
Table 1 shows instructors’ responses to the Likert-type questions on the social-validity
questionnaire. Instructors responded using a six-point scale, with one indicating lower social
validity and six indicating greater social validity (except for item 5, which was reversed).
Instructors consistently reported strong agreement with the following items: liking written and
graphical feedback, liking the recommendations included, valuing labeled praise included in
feedback, recommending that others receive written and graphical feedback, and that they would
use written and graphical feedback to train others. Instructors reported lesser agreement to the
following questions: efficacy of written and graphical feedback (M = 4.67, range, 4 - 5),
efficiency of feedback (M = 5.33, range, 5 - 6), and improvements in learner engagement due to
the strategy (M = 5.33, range, 4 - 6). Instructors indicated strong disagreement with the statement
EVALUATING FEEDBACK TO TEACH INSTRUCTIONAL STRATEGIES 26
“Written and graphical feedback was harmful to my performance”. Instructors indicated that they
carefully read their feedback sheet after all lessons (Hope and Lucy) or most lessons (Tamera)
and that they re-read or reviewed their feedback sheet following most lessons (Hope), few
lessons (Lucy), or some lessons (Tamera). During open-ended questions, each instructor
commented that the data regarding use of OTRs was most valuable to her. Instructors
commented that they would have preferred some discussion of the feedback (Hope) or that some
recommendations did not seem feasible (Lucy). See Appendix G for instructor responses to
open-ended questions on the social-validity questionnaire. These data align with previous
studies, in which instructors have indicated that performance feedback is a socially acceptable
training method (Strohmeier et al., 2014).
Study 2 Method
Consideration of trainee preferences is particularly important when multiple training
methods are effective. Although performance feedback is generally considered an effective and
socially valid training procedure (Strohmeier et al., 2014), little is known about teachers’
preferences for specific types of feedback. Previous research included confounds that
complicated an analysis of preference as the dependent variable (Luck et al., 2018). Therefore,
the purpose of Study 2 was to evaluate teachers’ preferences for three forms of feedback: written,
graphical, and a combination of written and graphical. Study 2 extended the existing literature by
including a larger sample of teachers than previous studies and removing confounds associated
with correlating forms of feedback with training for different skills. Like previous evaluations of
preference for feedback, we assessed possible changes in preference over repeated exposures. As
a secondary aim, we evaluated the extent to which verbal statements of preference for a feedback
type aligned with the type of feedback that the teacher chose to receive.
EVALUATING FEEDBACK TO TEACH INSTRUCTIONAL STRATEGIES 27
Participants
Participants for this study were recruited by distributing flyers to elementary-school
instructors within a public-school district in Appalachia. Instructors attended an initial
appointment that was identical to the appointment described in Study 1 (i.e., informed-consent
and demographics questionnaire). Instructors earned up to $75 for completing the study.
Instructors received $5 for the initial appointment, $5 for each choice session (i.e., 12
appointments), and a $10 bonus for completing the study. Instructors were paid after they had
completed the study.
Fifteen teachers or paraprofessionals participated in this study (see Table 2 for a complete
list of instructor demographics). Instructors were between 22 and 64 years of age (M = 42.2). All
instructors were Caucasian and 14 of 15 identified as female. Instructors had an average of 13
years of teaching experience (range, 2 - 30 years). One instructor had obtained a high-school
diploma, five instructors had obtained a bachelor’s degree, and nine instructors had obtained a
master’s degree. Instructors included four general educators, four special educators, two music
teachers, and five paraprofessionals. Eleven instructors provided worked in in a traditional
classroom and six instructors worked in an alternative-education setting. All instructors served
students in kindergarten through sixth grade. Some instructors reported providing feedback to
student teachers, paraprofessionals, and volunteers. Four teachers reported providing feedback
daily, one weekly, three monthly, and one yearly. Six teachers reported that they did not provide
feedback to others. When presented with the statement “providing praise frequently is important
to learner success,” 12 instructors reported strong agreement. However, two instructors reported
strong disagreement with this statement and one instructor reported slight disagreement.
Setting and Materials
EVALUATING FEEDBACK TO TEACH INSTRUCTIONAL STRATEGIES 28
Sessions took place in each instructor’s classroom. Materials included a laptop computer
equipped with Microsoft® Word, Behavior Logger (data-collection software) and GraphPad
Prism (i.e., graphing software), as well as a portable printer to prepare and provide feedback
immediately following each observation.
Feedback types
Instructors were provided with feedback on their rates of praise using one of four
feedback types (no feedback, written feedback, graphical feedback, or a combination of written
and graphical feedback) each day. The components included in the feedback necessarily differed
across feedback types. See Appendix H for an example of each feedback type. All feedback was
provided on a piece of letter-sized paper that included a statement at the top thanking the
instructor for letting the experimenter observe. Although the experimenter did not solicit
questions from the instructor, she responded to any questions asked.
No feedback. When no feedback was provided, the instructor was given a sheet of paper
with the thank-you statement and the words “no feedback” printed at the top.
Written feedback. When written feedback was provided, the instructor received a
printed sheet of paper labeled “Written Feedback Only” that included a bulleted list containing a
labeled-praise statement for an instance or pattern of praise observed during that session and a
suggestion for improving use of praise.
Similar to Study 1, written-feedback statements were taken from a list of pre-determined
feedback frames. See Appendix I for frames used when providing feedback during Study 2.
Experimenters drafted a proposed list of frames for providing feedback on use of praise in
classrooms and solicited feedback on these frames from four individuals with a combined 72
years of experience in schools, including two general educators, one special educator, and one
EVALUATING FEEDBACK TO TEACH INSTRUCTIONAL STRATEGIES 29
school principal with experience in both general and special education. Each expert reviewed the
drafted list of frames and edited or provided feedback on the clarity, helpfulness, and
acceptability of the feedback frames. We edited the feedback frames based on the experts’
recommendations before using the frames for the study.
Graphical feedback. When graphical feedback was provided, the instructor received a
printed sheet of paper labeled “Graphical Feedback Only” that included a line graph depicting
generic and labeled praise statements per min separately across all observations and a brief
narrative to orient the instructor to the graph.
Written and graphical feedback. When written and graphical feedback was provided,
the instructor received a printed sheet of paper labeled “Written and Graphical Feedback” that
included each component of both written and graphical feedback (i.e., graphical depiction of
responding, brief narrative describing the graph, labeled praise for responding, and a suggestion
for improvement).
Procedures
Sessions occurred at the same time each school day when teacher-led instruction was
scheduled to occur. We observed at the same time each day to help ensure that instruction,
students, and subject matter would remain consistent across observations. Sessions consisted of a
15-min observation of the instructor’s use of praise statements. Within 10 min of completing the
observation, the experimenter provided the instructor with feedback on use of generic- and
labeled- praise statements. Generally, the experimenter handed the feedback to the instructor but
if the instructor requested that the experimenter place the feedback somewhere else, she
complied.
EVALUATING FEEDBACK TO TEACH INSTRUCTIONAL STRATEGIES 30
Forced exposure sessions. During the first four sessions, instructors were provided with
each feedback type in a set order. The instructor received no feedback (Session 1), written
feedback (Session 2), graphical feedback (Session 3), and then written and graphical feedback
(Session 4). This order allowed for completion of at least three sessions prior to providing the
instructor with a graphical display of their performance. By completing at least three sessions
prior to providing graphical feedback, we ensured that the graph included sufficient data to be
useful (e.g., able to evaluate trend over time).
Ranking by preference. After instructors had been exposed to each feedback type (after
Session 4), the experimenter provided a form for the instructor to rank the feedback types in
order of preference (see Appendix J). The form included the question “Which would you prefer
to receive?” and included instructions to rank each option in order of preference, with one
indicating the most preferred and four indicating the least preferred feedback type. The feedback
options included no feedback, written feedback, graphical feedback, and written and graphical
feedback.
Modified concurrent-chain assessment. Across the next 12 days, we completed a
modified concurrent-chain assessment. Prior to beginning the assessment, the researcher
informed the instructor “Next, you will get to choose which type of feedback you would like to
receive. Each day for 12 days, we will present you with a sheet of paper with the names of four
options. The options will include written feedback, graphical feedback, written and graphical
feedback, and no feedback. We may present the choice while you are engaged in instruction, so
we ask that you circle the name of the type of feedback that you would like to receive that day.
After we observe, you will receive feedback on use of labeled praise using the type of feedback
that you selected.”
EVALUATING FEEDBACK TO TEACH INSTRUCTIONAL STRATEGIES 31
At the start of each session, the experimenter showed the instructor a white, letter-sized
sheet of paper with the question “Which would you prefer to receive today?” printed at the top
and the remainder divided into quadrants. Each quadrant included the name of a choice (i.e., no
feedback, written feedback, graphical feedback, and written and graphical feedback) printed in
Arial size 48-point font (see Appendix K). Similar to Luck et al. (2018), we included no
feedback as a control option. We developed 12 different layouts. Across these 12 layouts, each
feedback type was positioned in each quadrant of the paper twice. Prior to each session, the
layout that was presented was randomly selected without replacement of the previously used
layouts. We used different layouts to ensure that instructor selections were determined by the
type of feedback rather than a particular location on the paper.
The instructor selected which feedback type to receive by circling the name. We chose to
have the instructor circle the feedback type because it created a permanent product of the
selection for each day and because it was a response that could be completed even while
instruction was ongoing. After the instructor selected, we began a 15-min observation of the
instructor’s rate of praise statements. Within 10 min of completing the observation, the
experimenter provided feedback on the instructor’s use of generic- and labeled- praise statements
using the format that the instructor selected. For example, if the instructor selected graphical
feedback, the experimenter would hand the instructor an information sheet that included a
graphical display of the rates of generic and labeled praise, as well as a brief narrative labeling
the axes of the graph.
Social validity. After completing the concurrent-chain assessment, a social-validity
questionnaire was administered vocally by an experimenter who never provided feedback to the
teacher. There were four versions of the social-validity questionnaire, one specific to each
EVALUATING FEEDBACK TO TEACH INSTRUCTIONAL STRATEGIES 32
feedback type (e.g., written and graphical feedback; see Appendix L). Each instructor completed
the version of the questionnaire that was specific to the type of feedback that they selected most
often during the concurrent-chain assessment. Each questionnaire consisted of six statements that
were specific to the type of feedback selected. These questions required the instructor to respond
using a 6-point Likert-type scale indicating degree of agreement with the statement, where a
response of 1 indicated strong disagreement and a response of 6 indicated strong agreement with
the statement. For five of the statements, a higher score indicated greater social validity. For one
of the statements, a higher score indicated lower social validity. Experimenters also asked
instructors open-ended questions about what they liked most and least about each type of
feedback and whether they would have preferred to receive another type of feedback.
Measures and Data Collection
There were two primary dependent measures of instructor preference: ranks and
selections. Ranks were obtained from the ranking sheet that instructors completed after exposure
to each type of feedback. Rank scores ranged from one to four, where one indicated most
preferred and four indicated least preferred. Selections were analyzed by summing the total
number of times that the instructor selected each feedback type using the instructor’s circled
responses during the modified concurrent-chain assessment.
Secondary measures included demographic information, responses on the social-validity
questionnaire, and data regarding use of generic- and labeled- praise statements. Data on
demographic information and social-validity measures consisted of instructor responses to
questionnaires. Social-validity scores consisted of the raw score indicated in response to the
Likert-type questions, except for the single item which was reverse scored. For this item, the
score was defined as the inverse of the instructor’s response.
EVALUATING FEEDBACK TO TEACH INSTRUCTIONAL STRATEGIES 33
Rates of generic and labeled praise were used to provide teachers with feedback and to
correlate teacher performance with selections for feedback types. To collect these data, trained
observers used Behavior Logger data-collection software. Behavior Logger allows the
observer to record overall session time, the total number of instances of behavior, and a time
stamp for each instance. We summarized data for generic and labeled praise as a rate, by
dividing the total number of statements of each type by the observation duration in min.
Data Analysis
We analyzed preference for each feedback type during the concurrent-chain assessment
using visual inspection of graphed data. The data were graphed on a cumulative record, which
included a separate data path for each type of feedback. For each session, the type of feedback
that was selected was incremented by one and the other feedback types remained unchanged,
such that each data path indicated the total number of times that the feedback type had been
selected at that point in the assessment. We summarized the outcomes of the concurrent-chain
assessment as the total number of sessions in which each type of feedback was selected. We
examined shifts in preference over time using visual inspection by examining changes in the
slope of each data path across time. Additionally, we used a linear regression to evaluate change
in generic- and labeled-praise rates over time.
IOA and Procedural Fidelity
A second independent observer collected data on rates of praise during 40% of
observations. We calculated partial agreement using the Behavior Logger software. Partial
agreement was calculated by dividing each observation into 10-s intervals and comparing the
number of instances each observer scored during that interval. Then, an agreement coefficient
was calculated for each interval by dividing the smaller number of observed instances by the
EVALUATING FEEDBACK TO TEACH INSTRUCTIONAL STRATEGIES 34
larger number of observed instances. The program calculated the average agreement across each
interval in an observation and converted to a percentage by multiplying by 100. We calculated
average agreement across sessions by summing the average agreement of each session and
dividing by the total number of sessions with IOA. Average agreement across sessions for
labeled praise was 92% (range, 72% - 100%). Average agreement across sessions for generic
praise was 91% (range, 74% - 100%). See Table 3 for IOA data for each instructor.
Observers were trained using sample videos of classroom teachers providing instruction.
The untrained observer received the operational definitions of generic and labeled praise and
reviewed them with the experimenter. The experimenter and the observer watched a single video
while vocally identifying each instance of an OTR or praise statement. Then, the observer began
scoring videos independently (i.e., with no experimenter input during the session) until they
scored three consecutive videos with IOA of at least 90% for each behavior when compared to a
trained observer.
An independent observer also collected data on procedural fidelity using a checklist
during 39% of sessions. Measures of procedural fidelity included (a) presenting a novel version
of the choice paper, (b) ending the observation after 15 min (+/- 5 s), (c) providing no vocal
feedback during the observation, (d) providing feedback within 10 min of the end of the
observation, (e) making no statement that specified what was included on the sheet, (f) providing
feedback using the type selected by the teacher, and (g) including the appropriate components on
the information sheet. We summarized procedural fidelity as a percentage of components
implemented correctly aggregated across concurrent-chain sessions for each instructor. Mean
procedural fidelity across sessions was 99% (range, 86% - 100%). See Table 4 for procedural-
fidelity data for each instructor.
EVALUATING FEEDBACK TO TEACH INSTRUCTIONAL STRATEGIES 35
Results and Discussion Study 2
When presented with a choice between no feedback, written feedback, graphical
feedback, or written and graphical feedback in combination, instructors overwhelmingly
preferred the combination of written and graphical feedback. Figure 3 depicts cumulative
selections during each choice session of the concurrent-chain assessment. Each graph depicts
selections for a single instructor with each data path displaying selections for a single type of
feedback. Of the 15 instructors, 13 selected written and graphical feedback most of the time
when given the opportunity. For the other two instructors (Cody and Kacey), written feedback
was most frequently selected. It is possible that trainers who are considering use of one of these
feedback types should select a combination of written and graphical feedback to increase social
validity.
The present study addressed limitations of previous concurrent-chain evaluations of
feedback (e.g., Luck et al., 2018) in multiple ways. First, the present study occurred in
instructors’ classrooms, rather than contrived settings. By evaluating preferences in the
classroom, we can ensure that environmental constraints (e.g., classroom disruption, lack of
time) are similar to those that might impact feedback outside of the experimental context.
Second, previous studies have evaluated the efficacy of feedback types prior to measuring
preference. Completing an initial evaluation of efficacy establishes a history with each feedback
type, and often includes pairing a particular form of feedback with a specific skill. Given that
both written and graphical feedback have been effective in a variety of contexts (Alvero et al.,
2001), we omitted an initial evaluation of efficacy and avoided this confound.
Although the present study extended previous literature by monitoring shifts in
preference across a longer period, instructors in this study showed minimal shifts in preference
EVALUATING FEEDBACK TO TEACH INSTRUCTIONAL STRATEGIES 36
across time. Ten of the instructors selected exclusively to receive both written and graphical
feedback (i.e., Scarlett, Katie, Jackie, Kelly, Wendy, Delilah, Paula, Bridget, Winnie, and
Jacoba). Three additional instructors (i.e., Remi, Rachel, and Tanisha) chose to receive both
types of feedback during a majority, but not all, sessions. Remi chose to receive no feedback
during Session 9. Rachel selected graphical feedback only during Sessions 5, 7, and 8 and
written feedback only during Session 10. Lastly, Tanisha selected written feedback only during
Session 3 and graphical feedback only during Sessions 6 and 11. In contrast, Cody and Kacey
selected written feedback during most sessions. However, neither instructor selected exclusively
written feedback. Cody chose to receive both written and graphical feedback during Sessions 9
and 10. Kacey chose to receive both written and graphical feedback during Sessions 3, 5, and 11.
Even instructors who selected a different feedback type for one or two sessions reverted back to
their most frequent selection during subsequent sessions. Because instructors selected relatively
consistently, it may be sufficient to allow trainees to select which type of feedback they would
like to receive prior to only their first feedback session.
These data demonstrate a clear preference for written and graphical feedback, but it is
impossible to determine if this preference is related to the specific types of feedback or a
preference for multiple types rather than a single type. A preference for multiple types of
feedback would be consistent with teachers’ reports in previous studies (Luck et al., 2018).
Notably, however, teachers included in Luck et al. (2018) did not consistently choose combined
types of feedback, despite indicating that such combinations were their preference.
It is possible that the order in which participants in this study were exposed to feedback
types influenced selection. During the forced exposure sessions, participants were provided with
each type of feedback in a set order (i.e., no feedback, written feedback, graphical feedback, then
EVALUATING FEEDBACK TO TEACH INSTRUCTIONAL STRATEGIES 37
a combination of written and graphical feedback). We did this to ensure that graphical feedback,
when provided, included sufficient data to evaluate trend over time (i.e., at least three data
points). However, participants almost exclusively selected the option that they were exposed to
most recently. Thus, it is possible that exposing participants to each feedback type in a set order
confounded an analysis of preference. Future research should consider including additional
baseline sessions to ensure the quality of graphical feedback without requiring exposure to
feedback types in a set order.
Another possible explanation for the uniformity of teacher preferences in this study is the
difference in information that is available with each feedback type. Instructors could learn about
the rate and distribution of praise from graphical feedback but could not gain the same
information using written feedback. In contrast, written feedback may have provided information
about style, tone, or content that was valuable to the instructor but is not available through
graphical feedback. Instructors who selected a combination of written and graphical feedback
received all available information. It is unclear whether teacher preferences would have been the
same if the content of the feedback available had been redundant across feedback types.
Table 5 depicts instructors’ ranked preferences of feedback type from the ranking form
completed immediately before the start of choice sessions. Of the 15 instructors, 12 nominated
that receiving a combination of written and graphical feedback was most preferred. When these
instructors were asked to indicate their second-most preferred type of feedback, responses were
idiosyncratic across instructors (i.e., six indicated written and the other six indicated graphical).
Although Cody and Jacoba both ranked written feedback alone as most preferred, each of these
instructors indicated that a combination of feedback types would be their next highest preferred.
All instructors, except Wendy, indicated that no feedback was their least preferred option.
EVALUATING FEEDBACK TO TEACH INSTRUCTIONAL STRATEGIES 38
Wendy ranked no feedback as most preferred, followed by graphical, written and graphical in
combination, and written feedback as least preferred.
To evaluate correspondence between rankings and selections during the concurrent-chain
assessment, Figure 4 displays number of selections for each feedback type across rankings
(where one indicates the feedback type ranked highest preferred). For each instructor, the display
includes four data points (i.e., one for each type of feedback, denoted by symbols). Bars indicate
the average number of selections for each ranking. On average, instructors selected their highest
ranked feedback type during nine sessions, second highest during two sessions, and third highest
during one session. The top ranked feedback type and feedback type selected most often during
the concurrent-chain assessment corresponded for 12 of 15 instructors. Exceptions to that
included Wendy, Kacey, and Jacoba. Wendy ranked no feedback as high preferred but selected a
combination of written and graphical feedback (i.e., both) during all 12 choice sessions. Kacey
indicated both written and graphical feedback was preferred but selected written feedback only
during nine choice sessions. Jacoba indicated written feedback was most preferred but selected
both written and graphical feedback during all 12 trials.
Self-reported preference (i.e., rankings) did appear to correspond with behavioral
measures of preference (i.e., selections) for most instructors, which is consistent with previous
studies (Luck et al., 2018). In particular, these data suggest that self-reported and behavioral
measures correspond for most- and least-preferred feedback types. Twelve instructors selected
the feedback type ranked highest preferred most often. Fourteen instructors never selected the
feedback type ranked least preferred. It is unclear whether rankings and selections correspond for
moderately preferred options due to the relatively low number of varied selections. Instructors
who selected a variety of options did not consistently choose one of the options that they
EVALUATING FEEDBACK TO TEACH INSTRUCTIONAL STRATEGIES 39
indicated was higher preferred. Rachel, who ranked graphical feedback second, selected
graphical feedback more than other non-preferred alternatives. In contrast, Tanisha ranked
written feedback as second-most preferred but selected it less often than graphical feedback.
Similar patterns of correspondence have been demonstrated with other strategies for
assessing preference, like vocal and picture-based assessments (Northup et al., 1996) or varied
procedures (DeLeon & Iwata, 1996) for individuals with disabilities. In these studies, different
assessment types tend to identify the same highest and lowest preferred activities, but not the
same preference hierarchies for moderately preferred activities. Collectively, these prior studies
and the current results suggest that having teachers self-report their preferences is likely
sufficient when trainers need to determine only the most-preferred option. However, if it is
important for the trainer to establish a hierarchy of which options are most and least preferred,
behavioral measures may be warranted. Additionally, correspondence does not occur for all
participants. Some risk remains that the feedback type that the participant indicates that they
prefer will not match what they would have selected.
Although the primary focus of this evaluation was preference for feedback type, we
completed an additional analysis of change in praise over time. We analyzed generic, labeled,
and combined (i.e., both generic and labeled) praise. We used linear regression to evaluate trend
and variability across sessions for each behavior. Figure 5 depicts rates of generic and labeled
praise across sessions for each instructor. Figure 6 depicts rates of combined praise across
sessions. Note the difference in axes across the graphs in Figure 5 as each graph is scaled to fit
data for the specific instructor. In Figure 6, the axes are equated to highlight the variability in
overall rates of praise across instructors. Figure 6 also includes information about the setting of
each instructor (i.e., general education, special education, music, or alternative education) to
EVALUATING FEEDBACK TO TEACH INSTRUCTIONAL STRATEGIES 40
further facilitate comparisons. Each graph also includes the linear-regression line for each type of
praise across sessions. Rates of praise varied substantially both within and across instructors.
Across instructors, average rates of labeled praise ranged from 0.18 and 2.78 statements per min.
Average combined praise for each instructor ranged from 0.56 to 3.56 statements per min. Rates
of praise for each instructor varied greatly across sessions (e.g., Tanisha, Jacoba, and Paula), as
well. For example, Tanisha, who had the overall highest rates of praise provided relatively less
labeled praise during Sessions 1, 2, and 4.
Table 6 shows the slope and R2 values for each instructor’s generic, labeled, and
combined praise. Positive slope values indicate an increase in praise across sessions. Labeled,
generic, and combined praise increased for three instructors (i.e., Kelly, Tanisha, Winnie). Given
that the written feedback provided during this study targeted an increase in labeled praise, we
may not expect to see changes in generic praise over time. Seven instructors (i.e., Scarlett, Katie,
Jackie, Rachel, Delilah, Paula, and Bridget) showed increases in labeled praise across sessions
and provided increased praise overall. Cody showed no increases in combined praise because
generic praise increased as labeled praise decreased. The other four instructors (i.e., Wendy,
Remi, Jacoba, and Kacey) showed decreases in combined praise across sessions. Notably,
changes in praise across time were quite subtle for some participants. For example, based on the
slope of labeled praise for Tanisha (whose use of praise increased the most over time, we would
expect to see praise increase by 1/min across approximately six school days. In contrast, we
would anticipate an increase in labeled praise by 1/min for Delilah across approximately five
months of school.
Although evaluating changes over time does not necessarily correspond to feedback
efficacy, five instructors in this study did not provide increased praise throughout the study. Most
EVALUATING FEEDBACK TO TEACH INSTRUCTIONAL STRATEGIES 41
previous studies have included an evaluation of efficacy prior to assessing preference (e.g., Luck
et al., 2017). We omitted an initial evaluation of efficacy because focusing on preference alone
allowed us to control instructor history with each feedback type. Additionally, the lack of
increases in praise for instructors in this study contrasts outcomes of previous evaluations in
which variations of written or graphical feedback have been used to increase praise (e.g.,
Hemmeter et al., 2011; Mesa et al., 2005).
There are a few possible explanations for why instructors in this study did not increase
use of praise over time. First, it is possible that knowledge of study aims may have influenced
use of praise. Instructors were informed during the consent process that preference for feedback
type was the primary dependent measure, which may have reduced motivation to change praise.
Second, instructors were informed of recommendations related to praise during the consent
process. It is possible that praise was provided more frequently, even during the first session of
this study, due to knowledge of recommended practices. Last, although we utilized similar types
of feedback as previous evaluations (Hemmeter et al., 2011; Mesa et al., 2005) and included
components of feedback recommended in schools (Noell et al., 2000), we did not directly
replicate the feedback procedures used in previous studies. It is possible that some aspect of the
feedback provided in this study compromised efficacy. However, the procedures used in this
study did not allow for a clear evaluation of feedback efficacy. In any case, it is possible that
perceived importance of feedback efficacy may influence preferences for feedback type.
Table 7 shows instructor responses to each Likert-type item on the social-validity
questionnaire. Instructors responded using a six-point scale, with one indicating lower social
validity and six indicating higher social validity for all items except one (the extent to which
feedback was harmful). Each instructor was provided with a questionnaire that was specific to
EVALUATING FEEDBACK TO TEACH INSTRUCTIONAL STRATEGIES 42
the type of feedback that they selected most often during the concurrent-chain assessment (i.e.,
both written and graphical feedback for all instructors except Cody and Kacey). On average,
instructors who selected written and graphical feedback reported that they liked the feedback (M
= 5.69, range, 4 - 6), perceived it as effective (M = 5.46, range, 5 - 6), perceived it as efficient (M
= 5.85, range, 4 - 6), would recommend its use (M = 5.62, range, 4 - 6), and would use it
themselves (M = 5.38, range, 4 - 6). Instructors reported disagreeing that written and graphical
feedback was harmful to their performance (M = 1.08, range, 1 - 2). On average, the two
instructors who selected written feedback alone reported that they liked the feedback (M = 5.50,
range, 5 - 6), perceived it as effective (M = 5.00, range, 4 - 6), would recommend its use (M =
5.50, range, 5 - 6), and would use it themselves (M = 5.00, range, 4 - 6). Both instructors
reported agreeing that the feedback was efficient and strongly disagreeing that written and
graphical feedback was harmful to their performance. Instructors generally indicated that both
written and graphical feedback in combination and written feedback alone were socially valid.
Although we improved upon the limitations of some past studies (e.g., Strohmeier et al., 2014)
by including matched questions across each training strategy, it is challenging to draw
comparisons across these data given that few instructors selected a type of feedback other than
written and graphical.
The social-validity interview also included open-ended questions regarding each
feedback type. When instructors who selected written and graphical feedback were asked which
portions of the feedback they attended to most, responses were mixed. Eight instructors indicated
that they attended to written feedback more, nominating that they appreciated having specific
suggestions for how to improve. Five instructors indicated that they attended most to graphical
feedback, because it was “quicker to consume” and they liked “seeing progress over time”. To
EVALUATING FEEDBACK TO TEACH INSTRUCTIONAL STRATEGIES 43
account for preferences for unavailable forms of feedback, we asked instructors during the
social-validity questionnaire if they would have preferred to receive feedback using another
method. Four instructors indicated that they would have preferred to receive vocal feedback
either in lieu of or addition to written and graphical feedback. Generally, instructors reported
valuing written feedback because it provided a tangible suggestion for how to improve and
valuing graphical feedback because they could monitor changes in praise over time. Some
instructors reported that graphical feedback was challenging to consume at first and did not
account for challenges that were ongoing in the classroom during the observation. For questions
specific to the least acceptable aspects of each feedback type in isolation (i.e., written feedback
or graphical feedback only) instructors often referred to the omission of information that could
be obtained through including both feedback types. See Appendix M for transcribed instructor
responses to each open-ended question.
Given that instructors in Study 2 almost exclusively selected written and graphical
feedback in combination, these data provide little information about what accounts for teacher
preferences and which aspects of each feedback type teachers prefer. It is unclear what
differentiates instructors who selected written feedback alone from those who selected both types
of feedback. It is possible that challenges interpreting the graphs contributed to a preference for
written feedback or a combination of feedback types; both Cody and Kacey mentioned
difficulties understanding the graphs during the open-ended questions of the social-validity
interview. Future research should consider requiring instructors who prefer combined forms of
feedback to choose from individual feedback types, as well (i.e., a “restricted operants” analysis,
Ortiz & Carr [2000]).
EVALUATING FEEDBACK TO TEACH INSTRUCTIONAL STRATEGIES 44
One limitation of this evaluation is that instructors were required to select between four
specific options. It is unclear whether instructors would have continued to select written and
graphical feedback when presented with other options. To illustrate this point, the single
instructor who indicated that she would prefer to receive no feedback (Wendy) stated during the
ranking process that she did not like these options and would rather receive feedback vocally.
Kelly, Delilah, Winnie, and Kacey also noted that they would have preferred to receive vocal
feedback either along with or instead of written and graphical feedback.
Although written and graphical feedback may seem beneficial in busy settings like
classrooms, it is possible that vocal feedback may be more socially valid. A preference for vocal
feedback is consistent with results obtained by Luck et al. (2018), for whom instructors opted to
receive vocal feedback over written feedback in a controlled setting. We chose to exclude vocal
feedback from our evaluation based on the feasibility (and possible lack of social validity) of
requiring busy teachers to meet with us daily. However, it is possible that teachers value vocal
feedback enough to make the required meeting time worthwhile. Future studies should continue
to evaluate the relative preference for diverse modalities of feedback delivery.
General Discussion
The present studies evaluated the efficacy and social validity of using written and
graphical feedback to increase rates of OTRs and praise. During Study 1, we demonstrated that
written and graphical feedback increased rates of OTRs for instructors of EAAT. For our
instructors, providing feedback on OTRs doubled rates of praise, although increases were less
consistent for praise than OTRs. During Study 2, we evaluated teacher preferences for written
and graphical feedback during ongoing classroom instruction. A majority of instructors indicated
EVALUATING FEEDBACK TO TEACH INSTRUCTIONAL STRATEGIES 45
a preference for written and graphical feedback through both rankings and the concurrent-chain
assessment.
We chose to evaluate written and graphical feedback because these feedback types
require few time commitments from the recipient and provide a permanent record of
performance. Written or graphical feedback may be beneficial in classrooms or therapeutic-
riding centers because instructors have limited time to receive feedback or schedule meetings.
Given these time constraints, however, feedback may not be consumed immediately following
the observation. For example, during Study 1, instructors completed between one and three
lessons per day. Some of these lessons were scheduled without intervening time to consume
feedback; instructors were not always able to read the feedback sheet prior to completing their
next lesson.
It is challenging to speculate about how delays between performance and receiving
feedback influences feedback efficacy, in part because it is unclear how feedback functions.
Feedback may serve multiple functions: as a reminder of how to perform (i.e., an antecedent), as
a reinforcer for correct performance (i.e., a consequence), or as a form of goal setting (Alvero et
al., 2001). Feedback may be more effective when presented as an antecedent than as a
consequence (Aljadeff-Abergel et al., 2017). However, the function(s) that feedback serves for
any individual remains unclear, particularly for written or graphical feedback, which could easily
serve any of these three functions because both forms involve a permanent product that could be
reviewed at any time. Identifying the function(s) of written and graphical feedback would permit
the development of procedures to enhance feedback efficacy.
The current highlight the generality of written and graphical feedback. There was
considerable variability in the context in which the instructors delivered instruction, both across
EVALUATING FEEDBACK TO TEACH INSTRUCTIONAL STRATEGIES 46
instructors and observations. During Study 1, observations spanned several lessons each week.
Each of these lessons included different learners, who practiced a variety of skills. It is possible
that these variables influenced the consistency with which instructors provided OTRs or praise.
During Study 2, although we observed during the same class period each day, no two
observations were identical. It is possible that the number of students, type of instruction being
provided, or student behavior varied greatly across observations. For example, these teachers
were sometimes required to assist with the challenging behavior of other students while
providing ongoing instruction (e.g., Observation 14 for Rachel and Observation 5 for Tanisha).
In settings that vary greatly on a daily basis, identifying feedback types that retain robust effects
despite variability is of particular importance. Combined written and graphical feedback is
promising in this regard.
The efficacy of combined written and graphical feedback may depend on the specific
content included in the feedback. Unfortunately, there is not yet a clear empirical basis for
choosing content. In the current studies, graphical feedback included a) displaying data for
multiple categories of behavior, b) simplifying the graph by omitting indicators of extenuating
circumstances, like number of students present or student crises, and c) scaling graphical
displays to fit goal-level performance rather than current performance. We decided to use line
graphs because they are common across settings (Tufte, 2001) and thus may be familiar to
instructors. It is possible that another graphical display (e.g., bar graphs) may have been easier to
understand or more socially valid. A few responses on the social-validity questionnaire suggest
that our decisions may have impacted the efficacy and social validity of the feedback. For
example, Cody stated that he “had a hard time understanding” the graphical feedback, Rachel
EVALUATING FEEDBACK TO TEACH INSTRUCTIONAL STRATEGIES 47
stated that she “wished the graph showed that she was attending to crisis.” Future studies should
evaluate both comprehension and social validity of different types of graphical displays.
Similar decisions were made about how to present written feedback. Written feedback
was provided using pre-determined frames during these studies to ensure that the feedback
provided was consistent across instructors, prepared in a timely manner, and rated by supervisors
as being appropriate. Despite preparing many frames to apply to diverse situations, it is possible
that providing truly individualized feedback would have seemed more appropriate or natural to
our instructors. Comments on the social validity questionnaires alluded to the potentially rigid
structure of the frames. For example, instructors sometimes commented that the written feedback
was “too picky” or that “some suggestions did not seem feasible.” Further research should
determine components and structures of feedback that are socially valid, consumable, and
informative for instructors.
One additional consideration that arose throughout these studies was the social validity of
goals related to OTRs and praise. Social validity applies to not only the methods used, but also to
the goals and importance of effects (Wolf, 1978). Although increasing OTRs and labeled praise
may seem relatively low effort, performing each strategy at the recommended frequency (i.e., at
least 3 OTRs/min; Macsuga-Gage & Simonsen, 2015; 4 labeled-praise statements/min; Kranak et
al., 2017) requires high engagement and instructional planning. It is possible that requiring
teachers to consistently provide OTRs and labeled praise frequently enough to comply with
recommendations may not be socially valid.
Whether an instructor chooses to provide at least three OTRs per min may be heavily
influenced by the instructional context. For example, Hope (Study 1), worked primarily with
students diagnosed with Autism Spectrum Disorders. Hope expressed concerns that these
EVALUATING FEEDBACK TO TEACH INSTRUCTIONAL STRATEGIES 48
learners may feel overwhelmed by frequent instructions or questions. In another example, OTRs
delivered in traditional classrooms may differ across the type of instruction being provided.
Instructors may perceive high rates of OTRs as more appropriate when practicing skills one-on-
one with a student than providing direct instruction to a large group of students. Because the
current recommendations are based on review of a diverse literature base (Macsuga-Gage &
Simonsen, 2015), it is challenging to determine how contextual variables influence ideal rates of
OTRs.
At least five instructors across both studies expressed similar concerns with providing
labeled praise four times per min (i.e., Hope, Cody, Jackie, Wendy, and Tanisha). Instructors
commented that the recommendation seemed impractical and disruptive to instruction. In
particular, Hope nominated concerns that providing praise at that frequency would hinder learner
success. Across the 18 instructors included in Studies 1 and 2, only Tanisha consistently
provided the recommended four labeled-praise statements per min (Kranak et al., 2017). Tanisha
was teaching using Direct Instruction, a structured teaching strategy that includes scripted
lessons and high-rate OTRs. In addition, it is unclear how recommendations related to praise
should be applied across both generic and labeled praise. Although labeled praise may provide
the learner with additional information about desired behavior, it may not be necessary if praise
immediately followed an instruction or OTR. It may be worthwhile to provide generic praise in
these contexts, allowing for an overall increase in praise. Additional research is needed to
determine whether and under what conditions recommendations related to high rates of praise
and OTRs are socially acceptable.
In summary, the outcomes of this study suggest that written and graphical feedback is an
effective strategy to increase use of OTRs and praise. In particular, this study highlights the
EVALUATING FEEDBACK TO TEACH INSTRUCTIONAL STRATEGIES 49
generality of written and graphical feedback for use across diverse settings. However, despite
potential benefits of written and graphical feedback, like avoiding regularly scheduled meetings,
it remains possible that other types of feedback may be more socially valid. Trainers should
consider preferences of the individual when selecting feedback type.
EVALUATING FEEDBACK TO TEACH INSTRUCTIONAL STRATEGIES 50
References
Aljadeff-Abergel, E., Peterson, S., Wiskirchen, R., Hagen, K., & Cole, M. (2017). Evaluating the
temporal location of feedback: Providing feedback following performance vs. prior to
performance. Journal of Organizational Behavior Management, 37(2), 171-195.
http://dx.doi.org/10.1080/01608061.2017.1309332
Alvero, A., Bucklin, B. R., & Austin, J. (2001). An objective review of the effectiveness and
essential characteristics of performance feedback in organizational settings (1985-1998).
Journal of Organizational Behavior Management, 21(1), 3–29.
https://doi.org/10.1300/J075v21n01_02
Arco, L., & Birnbrauer, J. (1990). Performance feedback and maintenance of staff behavior in
residential settings. Behavioral Residential Treatment, 5(3), 207–217.
https://doi.org/10.1002/bin.2360050307
Barton, E., Meaden-Kaplansky, H., & Ledford, J. (2014) Independent variables, fidelity, and
social validity. In Gast, D., Ledford, J. (Ed.), Single case research methodology:
Applications in special education and behavioral sciences. (3rd ed., pp. 377-396).
Routledge.
Begeny, J. C., & Martens, B. K. (2006). Assessing pre-service teachers’ training in empirically-
validated behavioral instruction practices. School Psychology Quarterly, 21(3), 262–285.
https://doi.org/10.1521/scpq.2006.21.3.262
Behavior Analyst Certification Board. (2014). Professional and ethical compliance code for
behavior analysts. Littleton, CO. https://www.bacb.com/wp-content/uploads/BACB-
Compliance-Code-english_181218.pdf
EVALUATING FEEDBACK TO TEACH INSTRUCTIONAL STRATEGIES 51
Boddaert, N., Chabane, N., Beline, P., Bourgeois, M., Royer, V., Barthelemy, C., Mouren-
Simeoni, M., Phillipe, A., Brunelle, F., Samson, Y., & Zilbovicius, M. (2004). Perception
of complex sounds in Autism: abnormal auditory cortical processing in children. The
American Journal of Psychiatry, 161(11), 2117-2120.
https://doi.org/10.1176/appi.ajp.161.11.2117
Caldarella, P., Larsen, R. A., Williams, L., Downs, K. R., Wills, H. P., & Wehby, J. H. (2020).
Effects of teachers' praise-to-reprimand ratios on elementary students' on-task behavior.
Educational Psychology, https://doi.org/10.1080/01443410.2020.1711872
Carnine, D. W. (1976). Effects of two teacher-presentation rates on off-task behavior, answering
correctly, and participation. Journal of Applied Behavior Analysis, 9(2), 199–206.
https://doi.org/10.1901/jaba.1976.9-199
Cavanaugh, B. (2013). Performance feedback and teachers’ use of praise and opportunities to
respond: A review of the literature. Education and Treatment of Children, 36(1), 111–
136. https://doi.org/10.1353/etc.2013.0001
Colvin, G., Flannery, K. B., Sugai, G., & Monegan, J. (2009). Using observational data to
provide performance feedback to teachers: A high school case study. Preventing School
Failure: Alternative Education for Children and Youth, 53(2), 95–104.
https://doi.org/10.3200/psfl.53.2.95-104
Common, E., & Lane, K. (2017). Social validity assessment. In Luiselli, J. (Ed.) Applied
behavior analysis advanced guidebook (pp. 73-92). London: Elsevier Inc.
Cooper, J. T., Whitney, T., & Lingo, A. S. (2018). Using immediate feedback to increase
opportunities to respond in a general education classroom. Rural Special Education
Quarterly, 37(1), 52–60. https://doi.org/10.1177/8756870517747121
EVALUATING FEEDBACK TO TEACH INSTRUCTIONAL STRATEGIES 52
Cossairt, A., Hall, R., & Hopkins, B. (1973). The effects of experimenter’s instructions,
feedback, and praise on teacher praise and student attending behavior. Journal of Applied
Behavior Analysis, 6(1), 89-100. https://doi.org/10.1901/jaba.1973.6-89
Cuticelli, M., Collier-Meek, M., & Coyne, M. (2016). Increasing the quality of tier 1 reading
instruction: using performance feedback to increase opportunities to respond during
implementation of a core reading program. Psychology in the Schools, 53(1), 89–105.
https://doi.org/10.1002/pits.21884
Davis, L. L., & O’Neill, R. E. (2004). Use of response cards with a group of students with
learning disabilities including those for whom English is a second language. Journal of
Applied Behavior Analysis, 37(2), 219–222. https://doi.org/10.1901/jaba.2004.37-219
DeLeon, I., & Iwata, B. (1996). Evaluation of a multiple-stimulus presentation format for
assessing reinforcer preferences. Journal of Applied Behavior Analysis, 29(4),
https://doi.org/10.1901/jaba.1996.29-519
Emmer, E. T., & Stough, L. M. (2001). Classroom management: A critical part of educational
psychology, with implications for teacher education. Educational Psychologist, 36(2),
103–112. https://doi.org/10.1207/S15326985EP3602_5
Englert, C. S. (1983). Measuring special education teacher effectiveness. Exceptional Children,
50(3), 247–254. https://doi.org/10.1177/001440298305000308
Elliot, S. & Von Brock Treuting, M. (1991). Development and validation of a pretreatment
acceptability and effectiveness measure. Journal of School Psychology, 29(1), 43-51.
https://doi.org/10.1016/0022-4405(91)90014-I
Fallon, L. M., Collier-Meek, M., Maggin, Da., Sanetti, L., & Johnson, A. (2015). Is performance
feedback for educators an evidence-based practice? A systematic review and evaluation
EVALUATING FEEDBACK TO TEACH INSTRUCTIONAL STRATEGIES 53
based on single-case research. Exceptional Children, 81(2), 227–246.
https://doi.org/10.1177/0014402914551738
Fien, H., Smith, J. L. M., Smolkowski, K., Baker, S. K., Nelson, N. J., & Chaparro, E. (2015).
An examination of the efficacy of a multitiered intervention on early reading outcomes
for first grade students at risk for reading difficulties. Journal of Learning Disabilities,
48(6), 602–621. https://doi.org/10.1177/0022219414521664
Floress, M. T., Jenkins, L. N., Reinke, W. M., & McKown, L. (2018). General education
teachers’ natural rates of praise: A preliminary investigation. Behavioral Disorders,
43(4), 411–422. https://doi.org/10.1177/0198742917709472
Haydon, T., Conroy, M. A., Scott, T. M., Sindelar, P. T., Barber, B. R., & Orlando, A. M.
(2010). A comparison of three types of opportunities to respond on student academic and
social behaviors. Journal of Emotional and Behavioral Disorders, 18(1), 27–40.
https://doi.org/10.1177/1063426609333448
Hemmeter, M. L., Snyder, P., Kinder, K., & Artman, K. (2011). Impact of performance feedback
delivered via electronic mail on preschool teachers’ use of descriptive praise. Early
Childhood Research Quarterly, 26(1), 96–109.
https://doi.org/10.1016/j.ecresq.2010.05.004
Hulac, D., & Briesch, A. (2017). Evidence-based strategies for effective classroom management.
New York: The Guilford Press.
Jenkins, L. N., Floress, M., & Reinke, W. (2015). Rates and types of teacher praise: A review
and future directions. Psychology in the Schools, 52(5), 463–476.
https://doi.org/10.1002/pits.21835
EVALUATING FEEDBACK TO TEACH INSTRUCTIONAL STRATEGIES 54
Kamps, D., Dugan, E., Leonard, B., & Daoust, P. (1994). Enhanced small group instruction
using choral responding and student interaction for children with autism and
developmental disabilities. American Journal of Mental Retardation, 99(1), 60–73.
Kranak, M. P., Alber-Morgan, S. R., & Sawyer, M. R. (2017). A parametric analysis of specific
praise rates on the on-task behavior of elementary students with autism. Education and
Training in Autism and Developmental Disabilities, 52(4), 453–464.
Kratochwill, T. R., Hitchcock, J. H., Horner, R. H., Levin, J. R., Odom, S. L., Rindskoph, D. M.,
& Shadish, W. R. (2013). Single-case intervention research design standards. Remedial
and Special Education, 34(1), 26–38. https://doi.org/10.1177/0741932512452794
Luck, K. M., Lerman, D. C., Wu, W.-L., Dupuis, D. L., & Hussein, L. A. (2018). A comparison
of written, vocal, and video feedback when training teachers. Journal of Behavioral
Education, 27(1), 124–144. https://doi.org/10.1007/s10864-017-9279-2
Macsuga-Gage, A. S., & Simonsen, B. (2015). Examining the effects of teacher-directed
opportunities to respond on student outcomes: A systematic review of the literature.
Education and Treatment of Children, 38(2), 35-59.
https://doi.org/10.1353/etc.2015.0009
Mesa, J., Lewis-Palmer, T., & Reinke, W. (2005). Providing teachers with performance feedback
on praise to reduce student problem behavior. Beyond Behavior, 15(1), 3–7.
Myers, D., Simonsen, B., & Sugai, G. (2011). Increasing teachers’ use of praise with a response-
to-intervention approach. Education and Treatment of Children, 34(4), 35-59.
https://doi.org/10.1177/1098300717693568
EVALUATING FEEDBACK TO TEACH INSTRUCTIONAL STRATEGIES 55
National Board for Professional Teaching Standards (2001). Early adolescence through young
adulthood/art standards. Retrieved from: https://www.nbpts.org/standards-five-core-
propositions/
Noell, G., Witt, J., LaFleur, L., Mortenson, B., Ranier, D., & LeVelle, J. (2000). Increasing
intervention implementation in general education following consultation: a comparison of
two follow-up strategies. Journal of Applied Behavior Analysis, 33(3), 271–284.
https://doi.org/10.1901/jaba.2000.33-271
Northup, J., George, T., Jones, K., Broussard, C., & Vollmer, T. (1996). A comparison of
reinforcer assessment methods: the utility of verbal and pictorial choice procedures.
Journal of Applied Behavior Analysis, 29(2), 201-212.
https://doi.org/10.1901/jaba.1996.29-201
Ortiz, K. R., & Carr, J. E. (2000). Multiple-stimulus preference assessments: A comparison of
free-operant and restricted-operant formats. Behavioral Interventions, 15(4), 345-353.
https://doi.org/10.1002/1099-078X(200010/12)15:4<345::AID-BIN69>3.0.CO;2-K
Perone, M., & Hursh, D. (2013). Single-case experimental designs. In G. J. Madden, W.V. Dube,
T. D. Hackenberg, G. P. Hanley, & K. A. Lattal (Eds.) APA Handbooks in Psychology®.
APA Handbook of Behavior Analysis (pp. 107-126). American Psychological
Association. https://doi.org/10.1037/13937-005
Professional Association of Therapeutic Horsemanship International (2019). Instructor
education guide. https://fontevacustomer-
15cf09b5446.force.com/CPBase__item?id=a13f4000003OMvnAAG
Reimers, T. M., & Wacker, D. P. (1988). Parents’ ratings of the acceptability of behavioral
treatment recommendations made in an outpatient clinic: A preliminary analysis of the
EVALUATING FEEDBACK TO TEACH INSTRUCTIONAL STRATEGIES 56
influence of treatment effectiveness. Behavioral Disorders, 14(1), 7-15.
https://doi.org/10.1177/019874298801400104
Reinke, W. M., Lewis-Palmer, T., & Martin, E. (2007). The effect of visual performance
feedback on teacher use of behavior-specific praise. Behavior Modification, 31(3), 247-
263. https://doi.org/10.1177/0145445506288967
Reinke, W. M., Stormont, M., Herman, K. C., Puri, R., & Goel, N. (2011). Supporting children’s
mental health in schools: Teacher perceptions of needs, roles, and barriers. School
Psychology Quarterly, 26(1), 1–13. https://doi.org/10.1037/a0022714
Scott, T. M., Alter, P. J., & Hirn, R. G. (2011). An examination of typical classroom context and
instruction for students with and without behavioral disorders. Education and Treatment
of Children, 34(4), 619–641. https://doi.org/10.1353/etc.2011.0039
Simonsen, B., Fairbanks, S., Briesch, A., Myers, D., & Sugai, G. (2008). Evidence-based
practices in classroom management: considerations for research to practice. Education
and Treatment of Children, 31(1), 351–380. https://doi.org/10.1353/etc.0.0007
Simonsen, B., Myers, D., & DeLuca, C. (2010). Teaching teachers to use prompts, opportunities
to respond, and specific praise. Teacher Education and Special Education, 33(4), 300–
318. https://doi.org/10.1177/0888406409359905
Stichter, J. P., Lewis, T. J., Whittaker, T. A., Richter, M., Johnson, N. W., & Bradley, L. (2006).
Assessing antecedent variables: the effects of instructional variables on student outcomes
through in-service and peer coaching professional development models. Education and
Treatment of Children, 29(4), 665-692.
Stichter, J. P., Lewis, T. J., Whittaker, T. A., Richter, M., Johnson, N. W., & Trussell, R. P.
(2009). Assessing teacher use of opportunities comparisons among high- and low-risk
EVALUATING FEEDBACK TO TEACH INSTRUCTIONAL STRATEGIES 57
elementary schools. Journal of Positive Behavior Interventions, 11(2), 68–81.
https://doi.org/10.1177/1098300708326597
Stormont, M. A., Smith, S. C., & Lewis, T. J. (2007). Teacher implementation of precorrection
and praise statements in Head Start classrooms as a component of a program-wide system
of positive behavior support. Journal of Behavioral Education, 16(3), 280–290.
https://doi.org/10.1007/s10864-007-9040-3
Strohmeier, C., Mulé, C., & Luiselli, J. K. (2014). Social validity assessment of training methods
to improve treatment integrity of special education service providers. Behavior Analysis
in Practice, 7(1), 15–20. https://doi.org/10.1007/s40617-014-0004-5
Sutherland, K., & Wehby, J. H. (2001). Exploring the relationship between increased
opportunities to respond to academic requests and the academic and behavioral outcomes
of students with EBD. Remedial and Special Education, 22(2), 113–121.
https://doi.org/10.1177/074193250102200205
Sutherland, K., Wehby, J., & Copeland, S. (2000). Effect of varying rates of behavior-specific
praise on the on-task behavior of students with EBD. Journal of Emotional and
Behavioral Disorders, 8(1), 2–8. https://doi.org/10.1177/106342660000800101
Sutherland, K. S., Wehby, J. H., & Yoder, P. J. (2002). Examination of the relationship between
teacher praise and opportunities for students with EBD to respond to academic requests.
Journal of Emotional and Behavioral Disorders, 10(1), 5–13.
https://doi.org/10.1177/106342660201000102
Tufte, E. (2001). The visual display of quantitative information (2nd ed.). Cheshire, CT:
Graphics Press.
EVALUATING FEEDBACK TO TEACH INSTRUCTIONAL STRATEGIES 58
Van Acker, R., Grant, S., & Henry, D. (1996). Teacher and Student Behavior as a Function of
Risk for Aggression. Education and Treatment of Children, 19(3), 316–334.
Wolf, M. M. (1978). Social validity: The case for subjective measurement or how applied
behavior analysis is finding its heart. Journal of Applied Behavior Analysis, 11(2), 203–
214. https://doi.org/10.1901/jaba.1978.11-203
EVALUATING FEEDBACK TO TEACH INSTRUCTIONAL STRATEGIES 59
Table 1
Study 1 Instructor’s Responses to Social-Validity Questionnaire
Instructors Questions Hope Lucy Tamera 1. I liked written and graphical feedback. 6 6 6 2. I liked the recommendations included in this feedback. 6 6 6 3. I valued the labeled praise statements included in this
feedback. 6 6 6
4. Written and graphical feedback effectively taught me the instructional strategy.
5 4 5
5. Written and graphical feedback was harmful to my performance. (reverse scored)
1 1 1
6. Written and graphical feedback was an efficient way to teach me the strategy.
5 6 5
7. I would recommend that others receive written and graphical feedback.
6 6 6
8. I would use written and graphical feedback when teaching other staff.
6 6 6
9. Use of the strategies that I was taught increased student or learner engagement.
4 6 6
10. How often did you carefully read your feedback sheet? All All Most 11. How often did you review or re-read past feedback sheets? Most Few Some
Note. For questions 1 through 9, a score of 1 indicates strong disagreement and six indicates strong agreement. For questions 10 and 11, scores indicate frequency (i.e., all, most, some, few, or none.
EVALUATING FEEDBACK TO TEACH INSTRUCTIONAL STRATEGIES 60
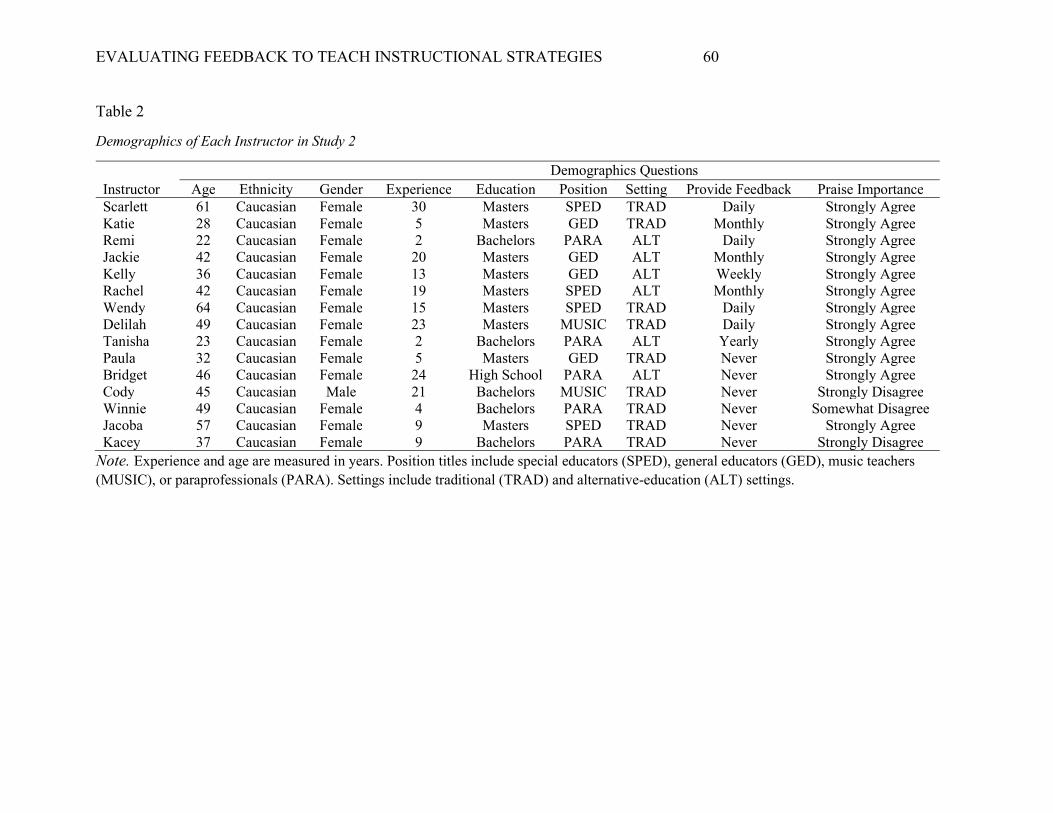
Table 2
Demographics of Each Instructor in Study 2
Demographics Questions Instructor Age Ethnicity Gender Experience Education Position Setting Provide Feedback Praise Importance Scarlett 61 Caucasian Female 30 Masters SPED TRAD Daily Strongly Agree Katie 28 Caucasian Female 5 Masters GED TRAD Monthly Strongly Agree Remi 22 Caucasian Female 2 Bachelors PARA ALT Daily Strongly Agree Jackie 42 Caucasian Female 20 Masters GED ALT Monthly Strongly Agree Kelly 36 Caucasian Female 13 Masters GED ALT Weekly Strongly Agree Rachel 42 Caucasian Female 19 Masters SPED ALT Monthly Strongly Agree Wendy 64 Caucasian Female 15 Masters SPED TRAD Daily Strongly Agree Delilah 49 Caucasian Female 23 Masters MUSIC TRAD Daily Strongly Agree Tanisha 23 Caucasian Female 2 Bachelors PARA ALT Yearly Strongly Agree Paula 32 Caucasian Female 5 Masters GED TRAD Never Strongly Agree Bridget 46 Caucasian Female 24 High School PARA ALT Never Strongly Agree Cody 45 Caucasian Male 21 Bachelors MUSIC TRAD Never Strongly Disagree Winnie 49 Caucasian Female 4 Bachelors PARA TRAD Never Somewhat Disagree Jacoba 57 Caucasian Female 9 Masters SPED TRAD Never Strongly Agree Kacey 37 Caucasian Female 9 Bachelors PARA TRAD Never Strongly Disagree
Note. Experience and age are measured in years. Position titles include special educators (SPED), general educators (GED), music teachers (MUSIC), or paraprofessionals (PARA). Settings include traditional (TRAD) and alternative-education (ALT) settings.
EVALUATING FEEDBACK TO TEACH INSTRUCTIONAL STRATEGIES 61
Table 3
Interobserver Agreement (IOA) for Each Instructor in Study 2
Percent Observations
Generic Labeled Instructors Mean Min Max Mean Min Max Scarlett 31 88 80 94 89 72 99 Katie 31 88 80 94 94 88 97 Remi 38 92 86 98 90 85 96 Jackie 44 87 77 93 89 81 96 Kelly 38 89 87 93 88 78 94 Rachel 63 88 78 95 85 74 100 Wendy 44 91 85 95 94 81 99 Delilah 38 90 83 92 96 92 99 Tanisha 38 86 74 98 85 66 98 Paula 38 92 87 100 96 91 100 Bridget 38 93 89 98 93 89 97 Cody 38 95 88 100 99 98 100 Winnie 38 92 87 97 91 87 96 Jacoba 38 91 80 99 98 91 95 Kacey 44 94 90 97 95 89 99
EVALUATING FEEDBACK TO TEACH INSTRUCTIONAL STRATEGIES 62
Table 4
Procedural Fidelity for Each Instructor in Study 2
Percent Observations
Procedural Fidelity Instructors Mean Min Max Scarlett 31 97 86 100 Katie 38 97 86 100 Remi 38 100 100 100 Jackie 38 100 100 100 Kelly 38 98 86 100 Rachel 56 100 100 100 Wendy 38 100 100 100 Delilah 38 100 100 100 Tanisha 38 100 100 100 Paula 38 98 83 100 Bridget 38 100 100 100 Cody 38 100 100 100 Winnie 38 100 100 100 Jacoba 38 98 86 100 Kacey 44 98 86 100
EVALUATING FEEDBACK TO TEACH INSTRUCTIONAL STRATEGIES 63
Table 5
Feedback Rankings for Each Instructor
Feedback Rankings
Instructors Both Written Graphical None
Scarlett 1 3 2 4
Katie 1 2 3 4
Remi 1 3 2 4
Jackie 1 3 2 4
Kelly 1 3 2 4
Rachel 1 3 2 4
Wendy 3 4 2 1
Delilah 1 2 3 4
Tanisha 1 2 3 4
Paula 1 2 3 4
Bridget 1 2 3 4
Cody 2 1 3 4
Winnie 1 3 2 4
Jacoba 2 1 3 4
Kacey 1 2 3 4
Note. A ranking of 1 indicates highest preferred feedback type and 4 indicates least preferred.
EVALUATING FEEDBACK TO TEACH INSTRUCTIONAL STRATEGIES 64
Table 6
Slope and R2 Values for Generic and Labeled Praise for Each Instructor in Study 2
Slope R2 Value Instructors Generic Labeled Combined Generic Labeled Combined Scarlett -0.04 0.07 0.03 0.19 0.59 0.08 Katie -0.01 0.12 0.11 0.04 0.69 0.48 Remi -0.04 -0.04 -0.09 0.29 0.09 0.17 Jackie -0.02 0.04 0.03 0.03 0.09 0.02 Kelly 0.01 0.07 0.09 0.02 0.36 0.24 Rachel -0.01 0.06 0.05 0.03 0.15 0.06 Wendy -0.09 0.08 -0.01 0.34 0.27 0.00 Delilah 0.00 0.01 0.01 0.02 0.03 0.05 Tanisha 0.03 0.16 0.19 0.17 0.33 0.33 Paula 0.00 0.01 0.01 0.01 0.04 0.02 Bridget 0.00 0.02 0.02 0.00 0.18 0.05 Cody 0.02 0.00 0.00 0.27 0.03 0.00 Winnie 0.06 0.05 0.11 0.41 0.36 0.53 Jacoba -0.01 -0.01 -0.02 0.11 0.02 0.10 Kacey -0.02 -0.02 -0.05 0.10 0.14 0.12
Note. Positive slopes indicate an increase in praise across sessions and negative values indicate a decrease in praise across sessions.
EVALUATING FEEDBACK TO TEACH INSTRUCTIONAL STRATEGIES 65
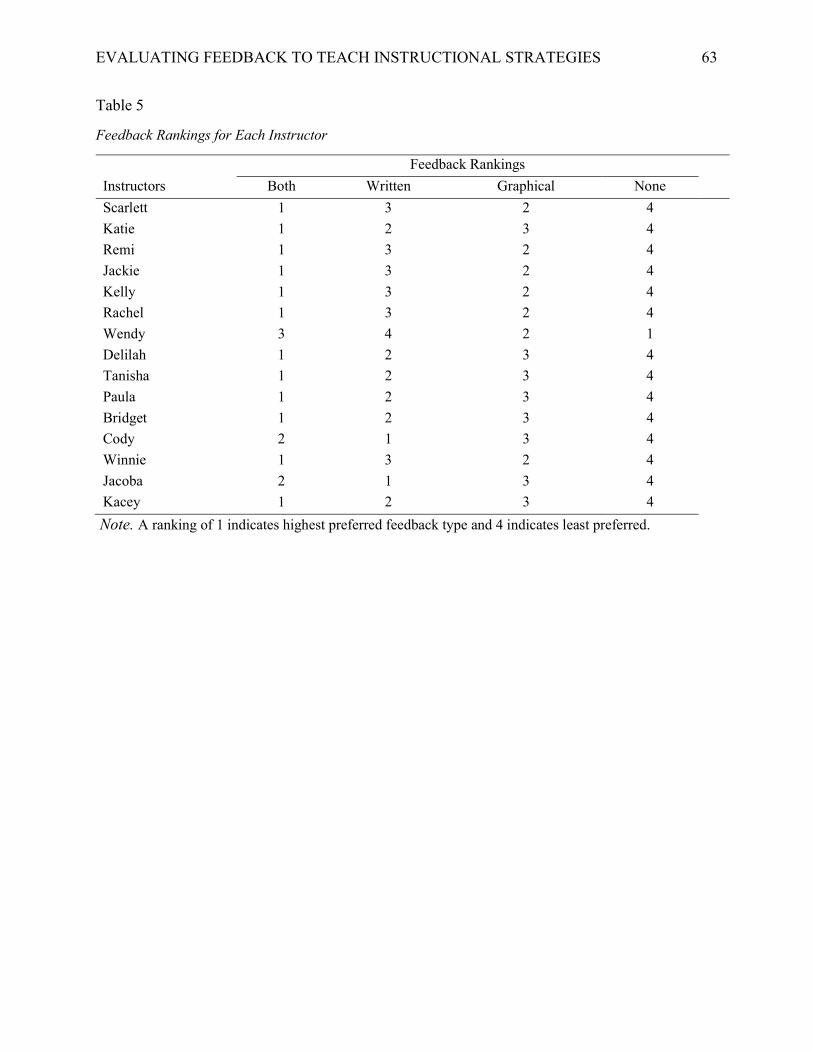
Table 7
Study 2 Instructor Responses to Likert-Type Questions of Social Validity
Questionnaire Responses Instructor Selected Like Effective Harmful Efficient Recommend Use Scarlett Both 6 5 1 6 6 5 Katie Both 5 6 2 6 6 5 Remi Both 5 5 1 6 6 6 Jackie Both 6 6 1 6 6 5 Kelly Both 6 5 1 6 6 5 Rachel Both 6 6 1 6 6 6 Wendy Both 4 6 1 4 4 4 Delilah Both 6 6 1 6 6 6 Tanisha Both 6 5 1 6 6 6 Paula Both 6 5 1 6 6 6 Bridget Both 6 6 1 6 6 6 Cody Written 6 4 1 5 6 6 Winnie Both 6 5 1 6 4 5 Jacoba Both 6 5 1 6 5 5 Kacey Written 5 6 1 5 5 4
Note. Each instructor received a questionnaire associated with the type of feedback they selected most often during the concurrent-chain assessment. One indicates strong disagreement and six indicates strong agreement. Higher values indicate greater social validity, with the exception of “harmful”.
EVALUATING FEEDBACK TO TEACH INSTRUCTIONAL STRATEGIES 66
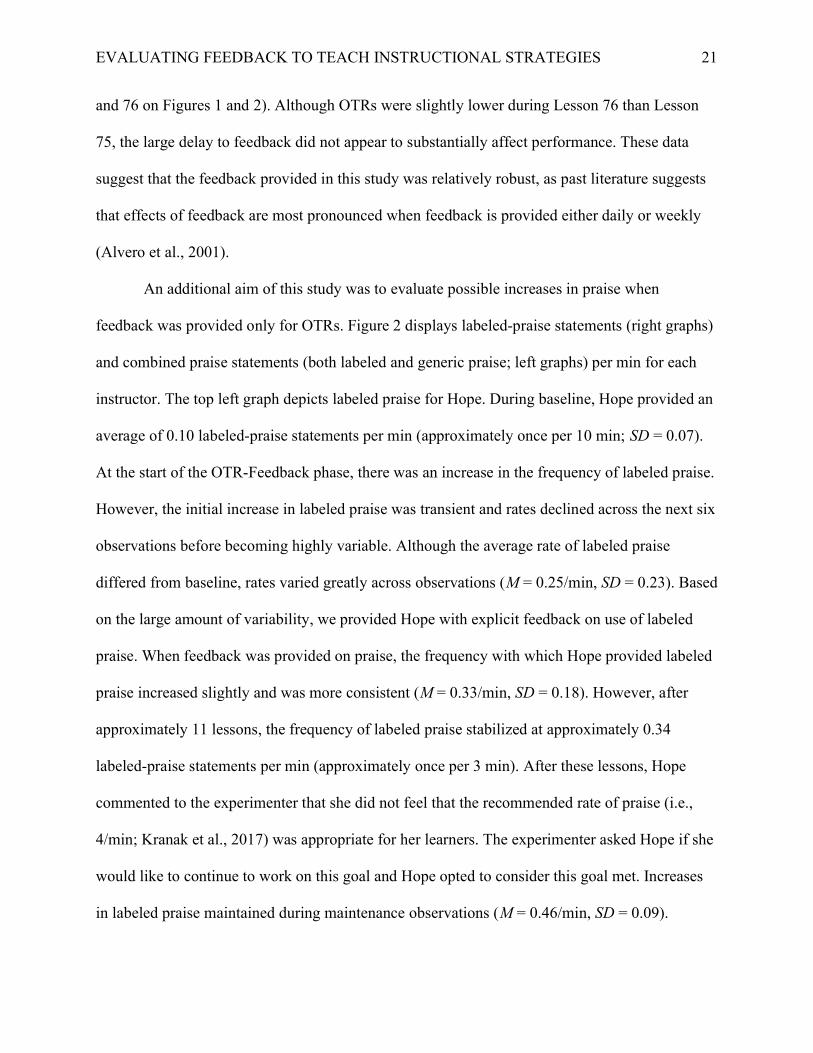
Figure 1
Opportunities to Respond per Min for Instructors of Study 1.
Note. Includes responding during baseline (BSL), feedback on opportunities to respond (OTR FB), feedback on labeled praise (PRAISE FB) and maintenance (MAIN). The dotted horizontal line indicates the recommended three OTRs per min. Solid vertical lines indicate when feedback began for OTRs, dashed vertical lines indicate when feedback began for another instructional strategy, and dotted vertical lines indicate follow up.
2
4
6
8
Hope
2
4
6
8
Lucy
10 20 30 40 50 60 70
2
4
6
8
Tamera
OP
PO
RT
UN
ITIE
S T
O R
ES
PO
ND
(O
TR
s) P
ER
MIN
LESSONS OBSERVED
BSL OTR FB PRAISE FB
MAIN
EVALUATING FEEDBACK TO TEACH INSTRUCTIONAL STRATEGIES 67
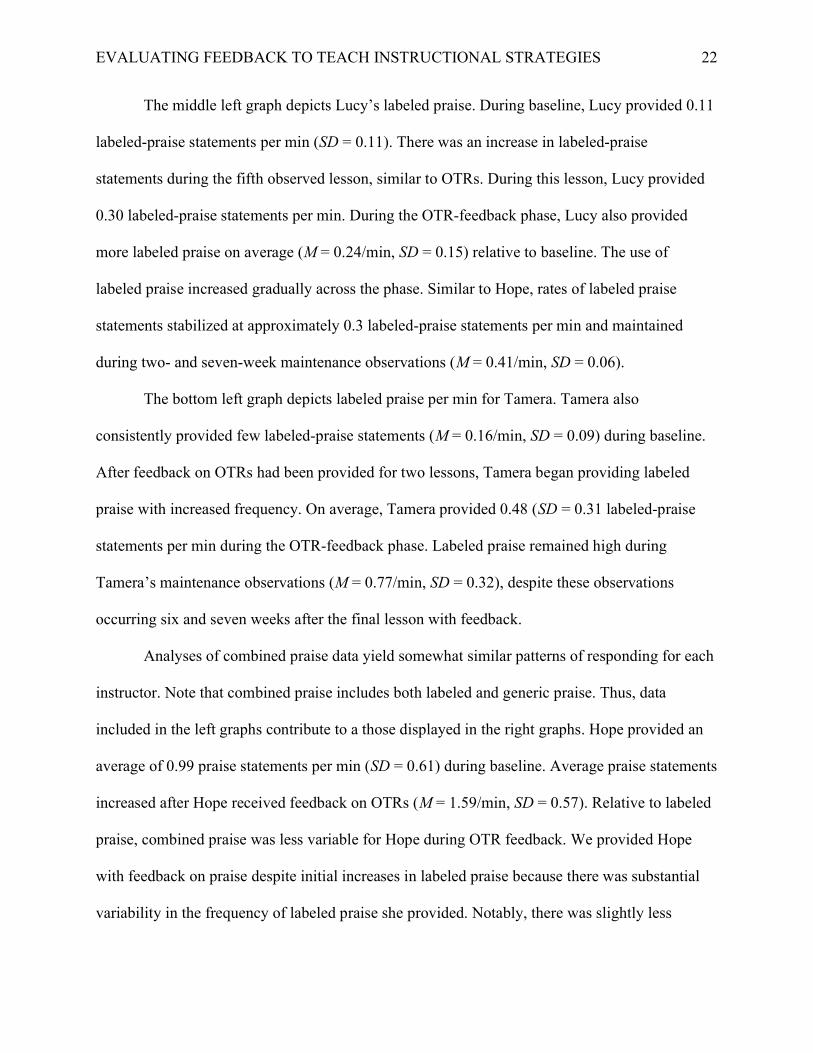
Figure 2
Labeled and Combined Praise per Min for Each Instructor of Study 1
Note. Includes responding during baseline (BSL), feedback on opportunities to respond (OTR FB), feedback on labeled praise (PRAISE FB) and maintenance (MAIN). Dashed vertical lines indicate when feedback began for OTRs and dotted vertical lines indicate follow up.
0.5
1.0
1.5
Hope
1
2
3
4
0.5
1.0
1.5
Lucy
1
2
3
4
10 20 30 40 50 60 70
0.5
1.0
1.5
Tamera
10 20 30 40 50 60 70
1
2
3
4
LESSONS OBSERVED
LAB
ELE
D P
RA
ISE
PE
R M
IN
CO
MB
INE
D P
RA
ISE
PE
R M
IN
BSL OTR FB PRAISE FB
MAIN BSL OTR FB PRAISE FB
MAIN
EVALUATING FEEDBACK TO TEACH INSTRUCTIONAL STRATEGIES 68
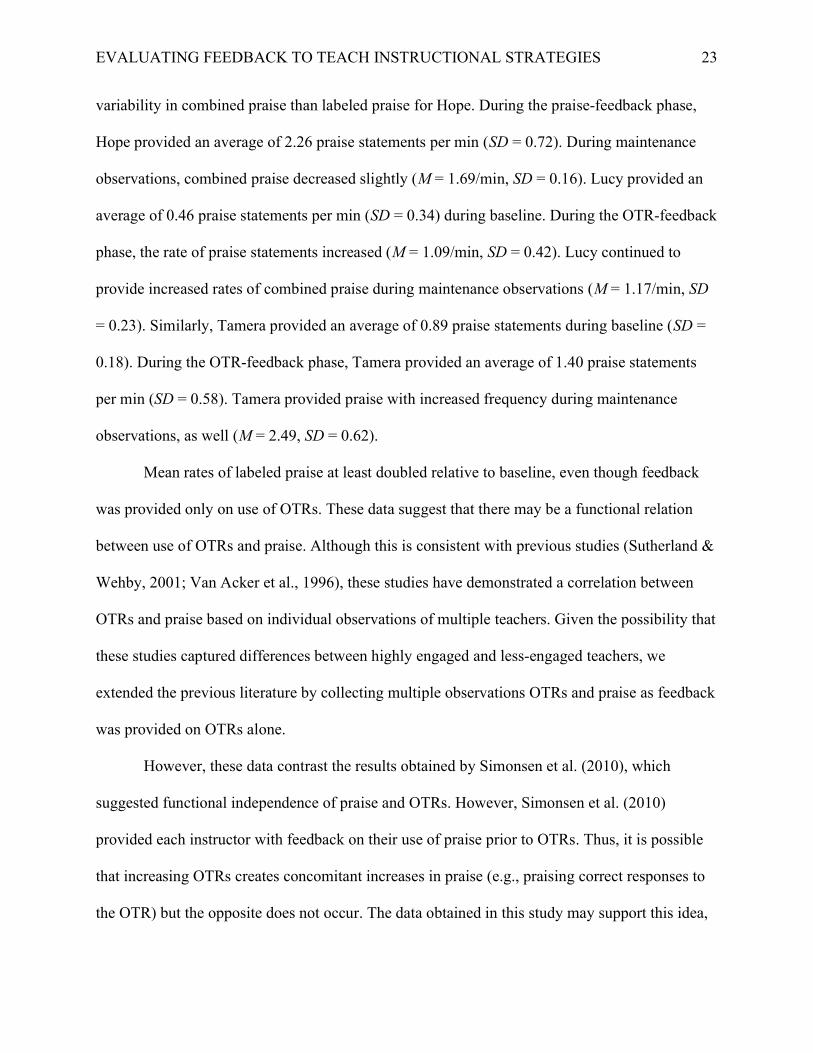
Figure 3
Cumulative Selections During the Concurrent-Chain Assessment
Note. Each data path depicts a single feedback type (i.e., both written and graphical, written, graphical, and no feedback).
EVALUATING FEEDBACK TO TEACH INSTRUCTIONAL STRATEGIES 69
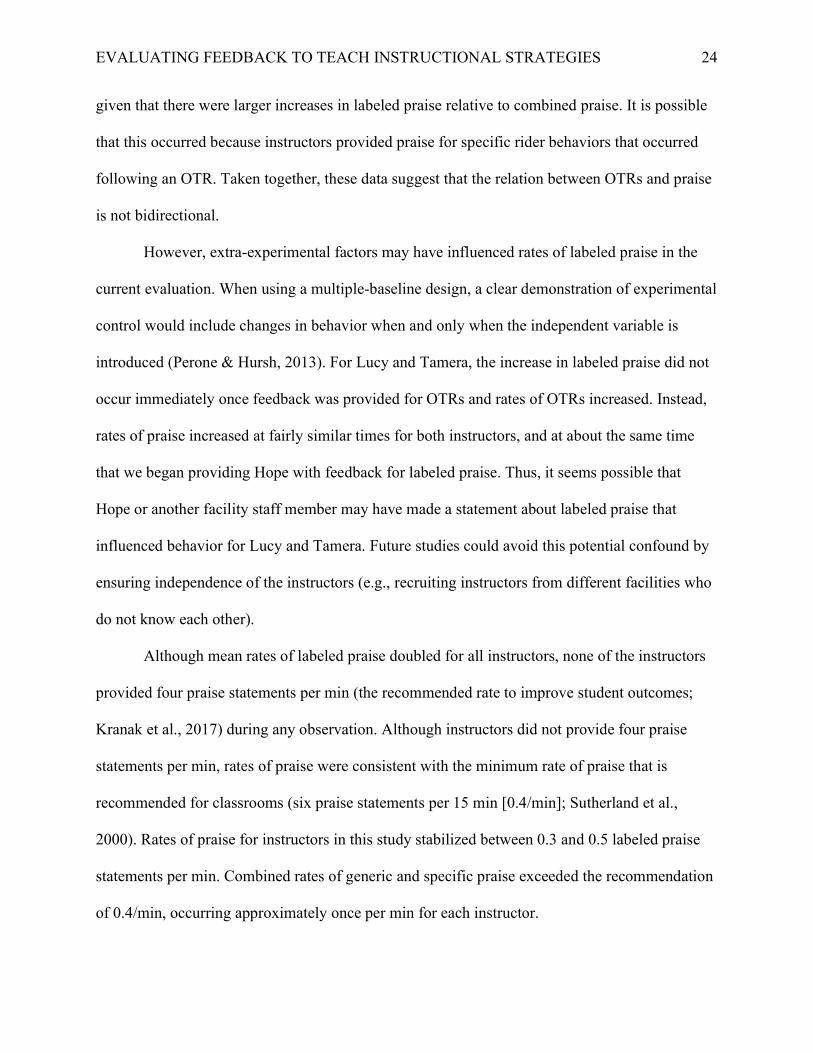
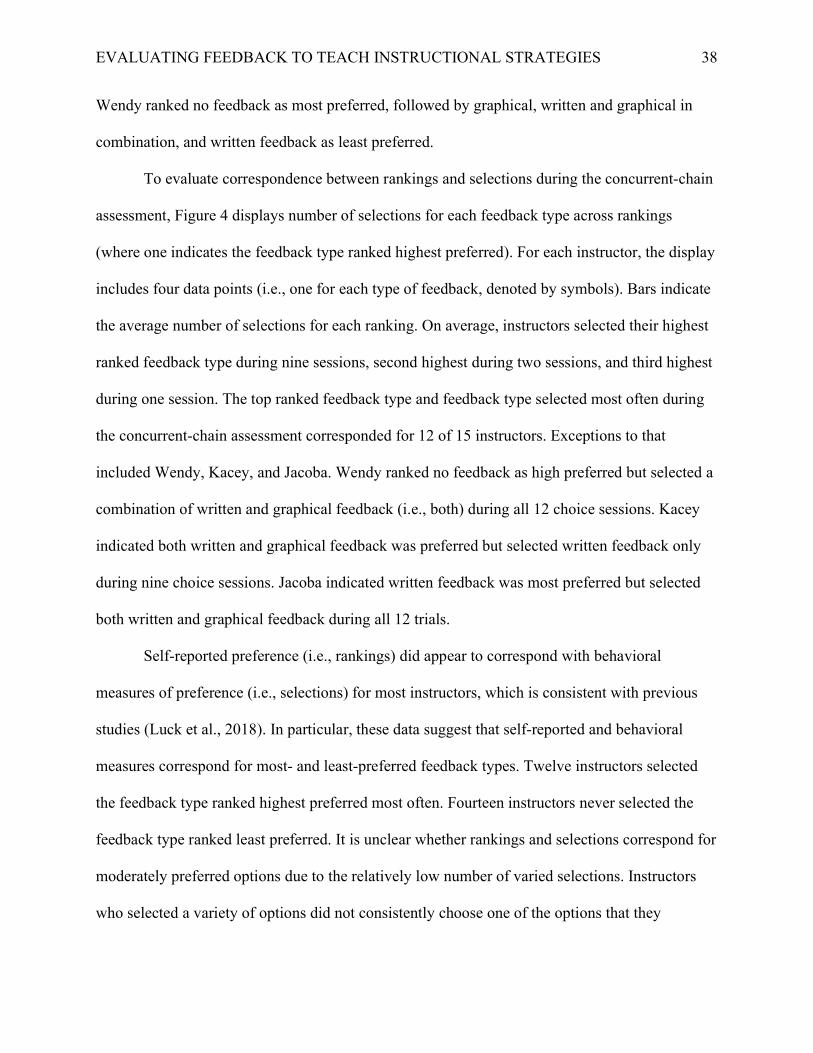
Figure 4
Selections for Each Feedback Type Across Rankings of Preference
Note. Depicts rankings and selections of each feedback type for each instructor (i.e., four data points for each instructor). Bars indicate average number of selections for each ranking.
1 2 3 4
2
4
6
8
10
12
RANK (1 = PREFERRED)
CO
UN
T S
EL
EC
TIO
NS
Both
Graphical
Written
None
EVALUATING FEEDBACK TO TEACH INSTRUCTIONAL STRATEGIES 70
Figure 5
Generic and Labeled Praise Per Min for each Study 2 Instructor
Note. Each graph includes a line of best fit for both generic and labeled praise. Note the differences in scale of the y-axis across instructors.
0.5
1.0
1.5
2.0Scarlett
1
2
3
Jackie
1
2
3
Remi
0.5
1.0
Paula
2 4 6 8 10 12 14 16
0.5
1.0
1.5
2.0
Winnie
1
2
3
Katie
1
2
3
Kelly
0.5
1.0
1.5
Delilah
0.5
1.0
Cody
2 4 6 8 10 12 14 16
0.5
1.0
1.5
KaceyLabeled Praise
Generic Praise
Generic Praise
Labeled Praise
1
2
3Wendy
1
2
3
4
Rachel
1
2
3
4
5
Tanisha
0.5
1.0
1.5
2.0
Bridget
2 4 6 8 10 12 14 16
0.5
1.0Jacoba
PR
AIS
E P
ER
MIN
SESSIONS
EVALUATING FEEDBACK TO TEACH INSTRUCTIONAL STRATEGIES 71
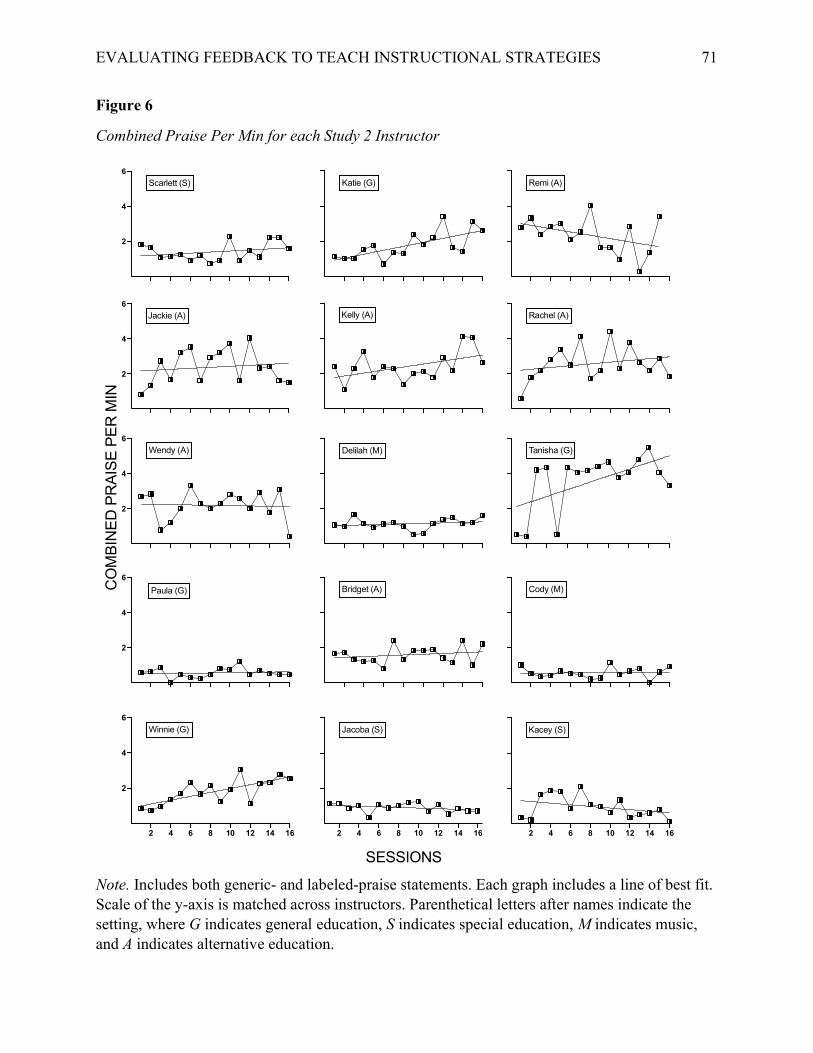
Figure 6
Combined Praise Per Min for each Study 2 Instructor
Note. Includes both generic- and labeled-praise statements. Each graph includes a line of best fit. Scale of the y-axis is matched across instructors. Parenthetical letters after names indicate the setting, where G indicates general education, S indicates special education, M indicates music, and A indicates alternative education.
2
4
6
Scarlett (S)
2
4
6
Jackie (A)
Remi (A)
2
4
6
Paula (G)
2 4 6 8 10 12 14 16
2
4
6
Winnie (G)
Katie (G)
Kelly (A)
Delilah (M)
Cody (M)
2 4 6 8 10 12 14 16
Kacey (S)
2
4
6
Wendy (A)
Rachel (A)
Tanisha (G)
Bridget (A)
2 4 6 8 10 12 14 16
Jacoba (S)
CO
MB
INE
D P
RA
ISE
PE
R M
IN
SESSIONS
EVALUATING FEEDBACK TO TEACH INSTRUCTIONAL STRATEGIES 72
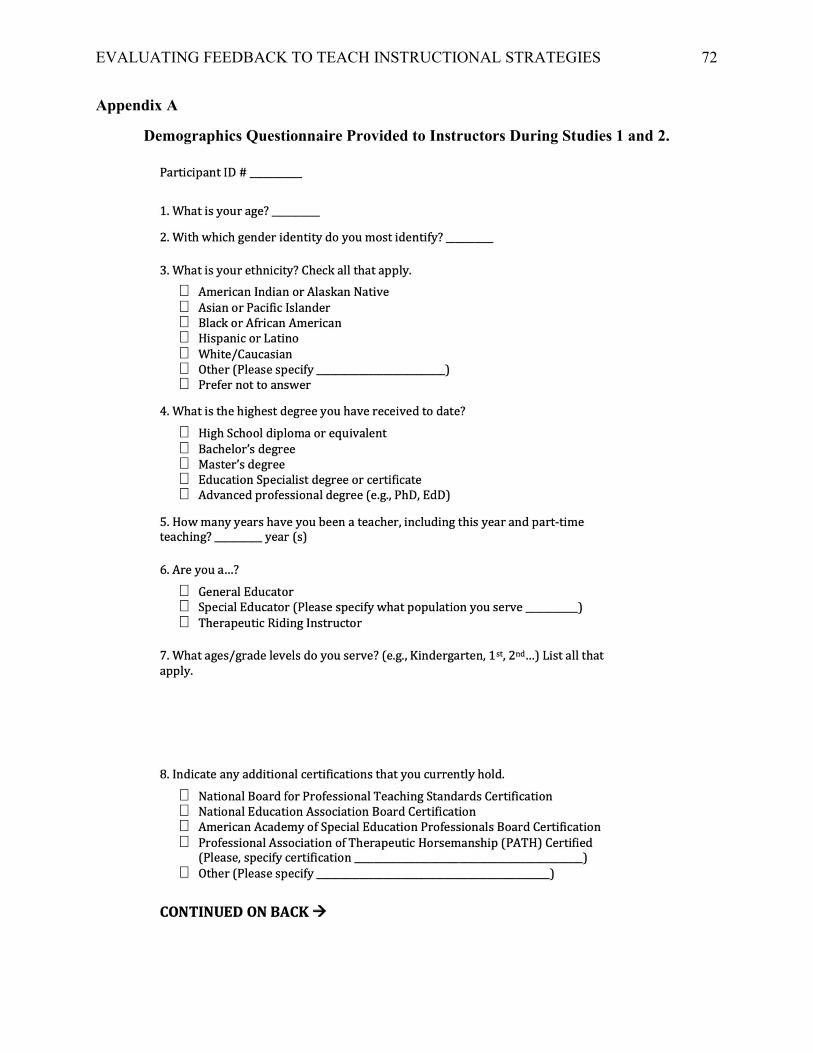
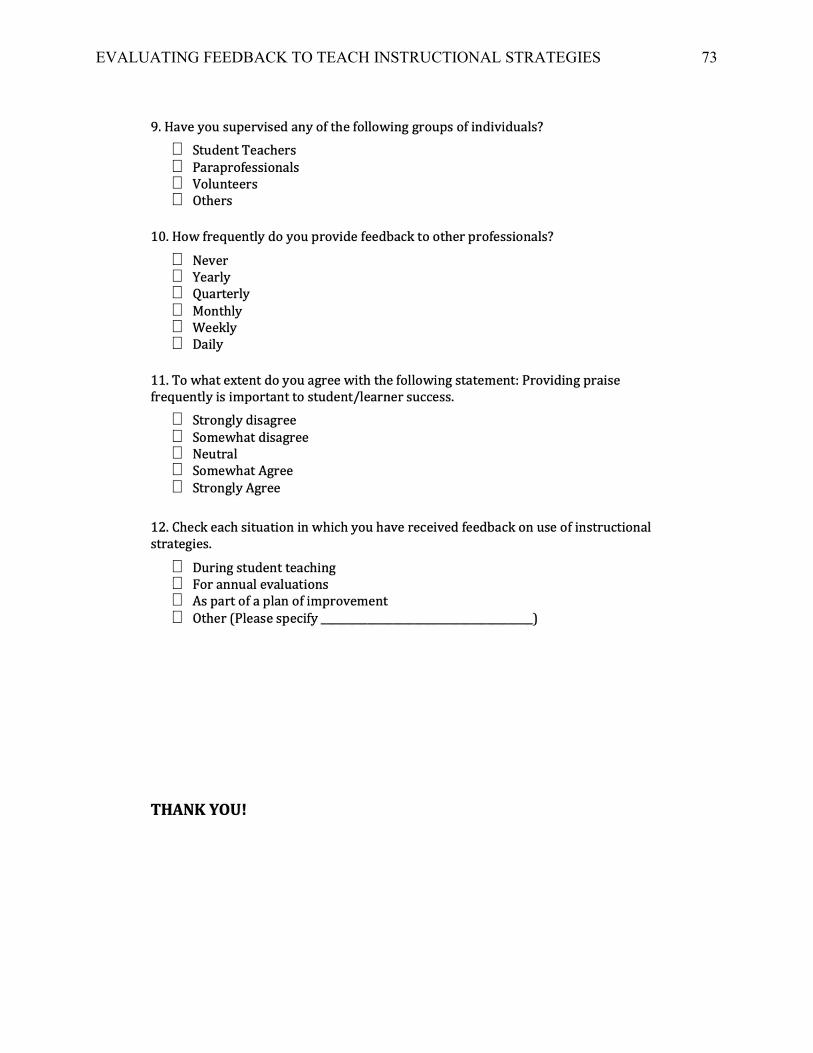
Appendix A
Demographics Questionnaire Provided to Instructors During Studies 1 and 2.
EVALUATING FEEDBACK TO TEACH INSTRUCTIONAL STRATEGIES 74
Appendix B
Paper Datasheet Used to Collect Data During Study 1.
EVALUATING FEEDBACK TO TEACH INSTRUCTIONAL STRATEGIES 75
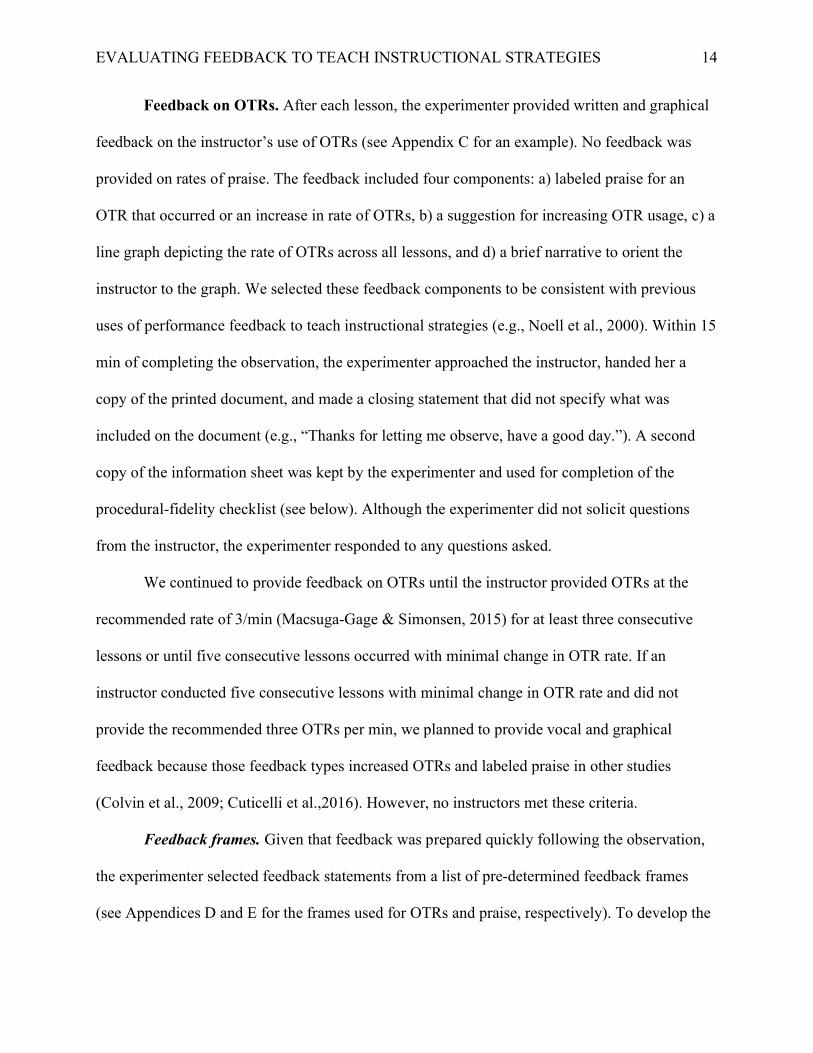
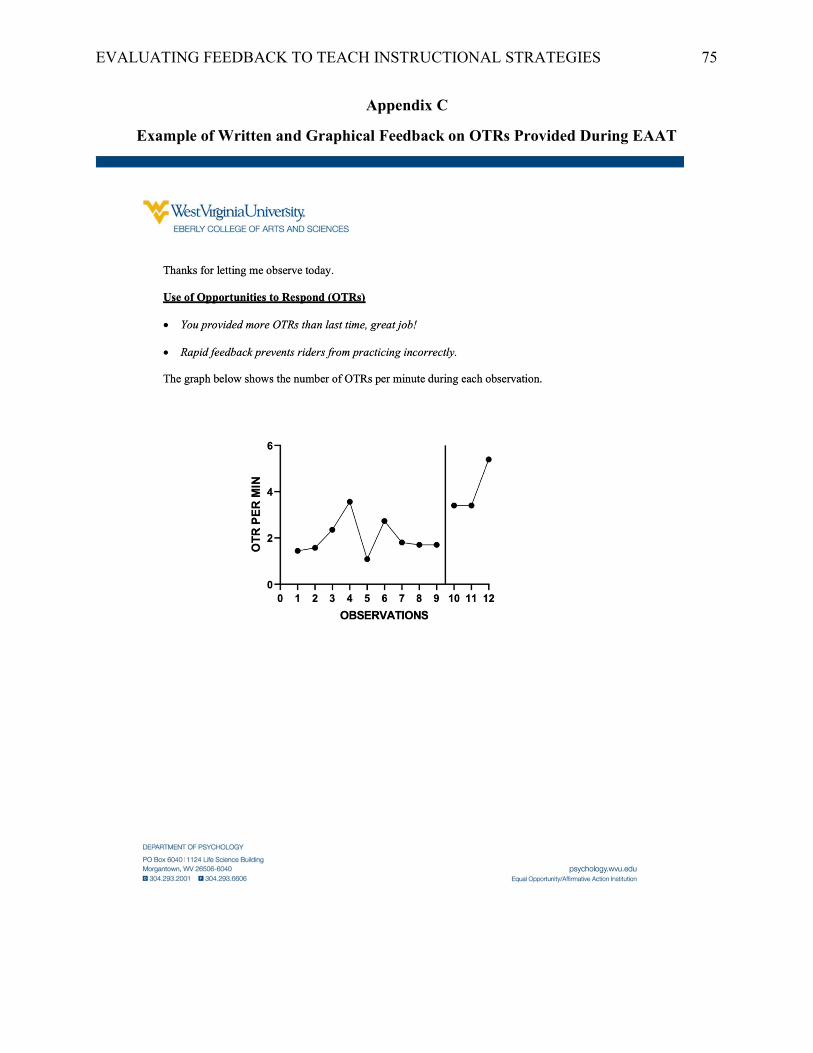
Appendix C
Example of Written and Graphical Feedback on OTRs Provided During EAAT
EVALUATING FEEDBACK TO TEACH INSTRUCTIONAL STRATEGIES 76
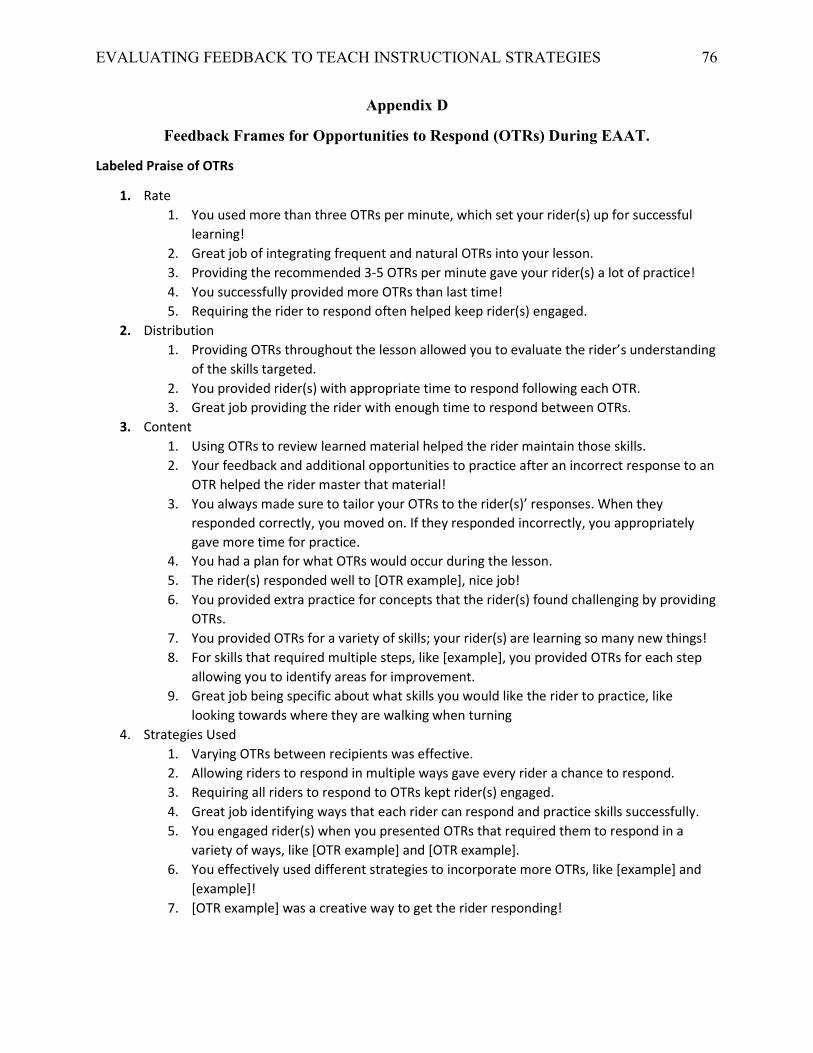
Appendix D
Feedback Frames for Opportunities to Respond (OTRs) During EAAT.
Labeled Praise of OTRs
1. Rate 1. You used more than three OTRs per minute, which set your rider(s) up for successful
learning! 2. Great job of integrating frequent and natural OTRs into your lesson. 3. Providing the recommended 3-5 OTRs per minute gave your rider(s) a lot of practice! 4. You successfully provided more OTRs than last time! 5. Requiring the rider to respond often helped keep rider(s) engaged.
2. Distribution 1. Providing OTRs throughout the lesson allowed you to evaluate the rider’s understanding
of the skills targeted. 2. You provided rider(s) with appropriate time to respond following each OTR. 3. Great job providing the rider with enough time to respond between OTRs.
3. Content 1. Using OTRs to review learned material helped the rider maintain those skills. 2. Your feedback and additional opportunities to practice after an incorrect response to an
OTR helped the rider master that material! 3. You always made sure to tailor your OTRs to the rider(s)’ responses. When they
responded correctly, you moved on. If they responded incorrectly, you appropriately gave more time for practice.
4. You had a plan for what OTRs would occur during the lesson. 5. The rider(s) responded well to [OTR example], nice job! 6. You provided extra practice for concepts that the rider(s) found challenging by providing
OTRs. 7. You provided OTRs for a variety of skills; your rider(s) are learning so many new things! 8. For skills that required multiple steps, like [example], you provided OTRs for each step
allowing you to identify areas for improvement. 9. Great job being specific about what skills you would like the rider to practice, like
looking towards where they are walking when turning 4. Strategies Used
1. Varying OTRs between recipients was effective. 2. Allowing riders to respond in multiple ways gave every rider a chance to respond. 3. Requiring all riders to respond to OTRs kept rider(s) engaged. 4. Great job identifying ways that each rider can respond and practice skills successfully. 5. You engaged rider(s) when you presented OTRs that required them to respond in a
variety of ways, like [OTR example] and [OTR example]. 6. You effectively used different strategies to incorporate more OTRs, like [example] and
[example]! 7. [OTR example] was a creative way to get the rider responding!
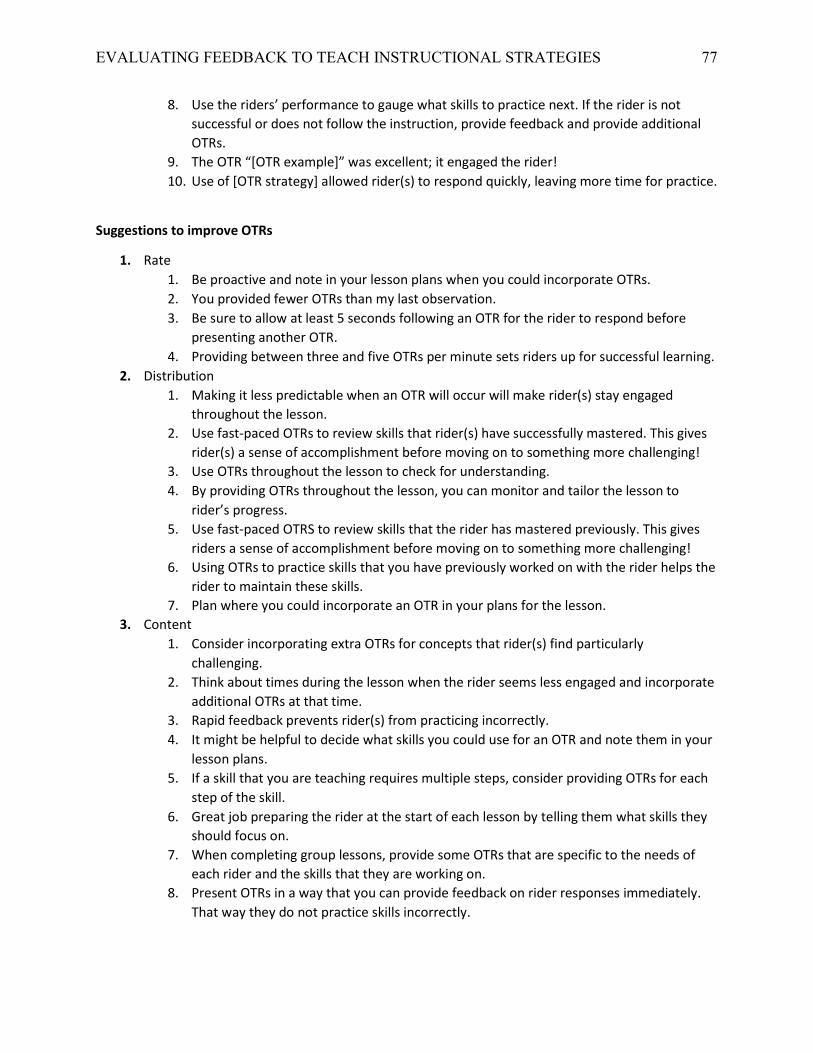
EVALUATING FEEDBACK TO TEACH INSTRUCTIONAL STRATEGIES 77
8. Use the riders’ performance to gauge what skills to practice next. If the rider is not successful or does not follow the instruction, provide feedback and provide additional OTRs.
9. The OTR “[OTR example]” was excellent; it engaged the rider! 10. Use of [OTR strategy] allowed rider(s) to respond quickly, leaving more time for practice.
Suggestions to improve OTRs
1. Rate 1. Be proactive and note in your lesson plans when you could incorporate OTRs. 2. You provided fewer OTRs than my last observation. 3. Be sure to allow at least 5 seconds following an OTR for the rider to respond before
presenting another OTR. 4. Providing between three and five OTRs per minute sets riders up for successful learning.
2. Distribution 1. Making it less predictable when an OTR will occur will make rider(s) stay engaged
throughout the lesson. 2. Use fast-paced OTRs to review skills that rider(s) have successfully mastered. This gives
rider(s) a sense of accomplishment before moving on to something more challenging! 3. Use OTRs throughout the lesson to check for understanding. 4. By providing OTRs throughout the lesson, you can monitor and tailor the lesson to
rider’s progress. 5. Use fast-paced OTRS to review skills that the rider has mastered previously. This gives
riders a sense of accomplishment before moving on to something more challenging! 6. Using OTRs to practice skills that you have previously worked on with the rider helps the
rider to maintain these skills. 7. Plan where you could incorporate an OTR in your plans for the lesson.
3. Content 1. Consider incorporating extra OTRs for concepts that rider(s) find particularly
challenging. 2. Think about times during the lesson when the rider seems less engaged and incorporate
additional OTRs at that time. 3. Rapid feedback prevents rider(s) from practicing incorrectly. 4. It might be helpful to decide what skills you could use for an OTR and note them in your
lesson plans. 5. If a skill that you are teaching requires multiple steps, consider providing OTRs for each
step of the skill. 6. Great job preparing the rider at the start of each lesson by telling them what skills they
should focus on. 7. When completing group lessons, provide some OTRs that are specific to the needs of
each rider and the skills that they are working on. 8. Present OTRs in a way that you can provide feedback on rider responses immediately.
That way they do not practice skills incorrectly.
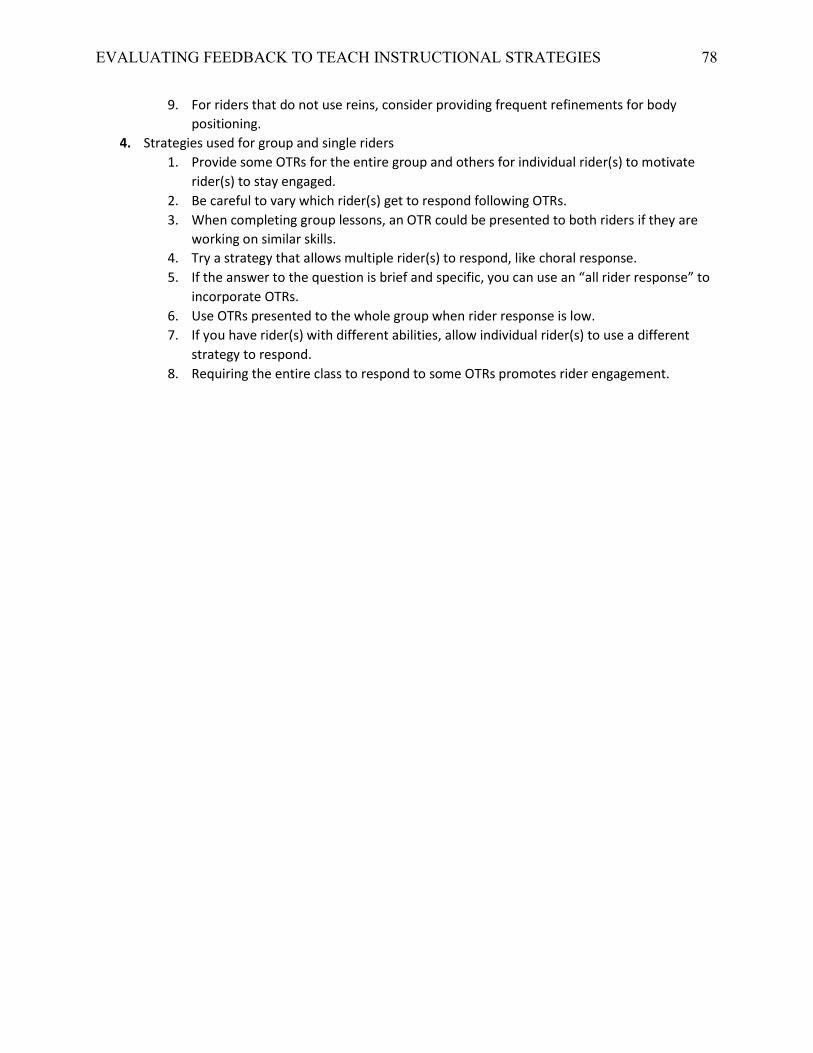
EVALUATING FEEDBACK TO TEACH INSTRUCTIONAL STRATEGIES 78
9. For riders that do not use reins, consider providing frequent refinements for body positioning.
4. Strategies used for group and single riders 1. Provide some OTRs for the entire group and others for individual rider(s) to motivate
rider(s) to stay engaged. 2. Be careful to vary which rider(s) get to respond following OTRs. 3. When completing group lessons, an OTR could be presented to both riders if they are
working on similar skills. 4. Try a strategy that allows multiple rider(s) to respond, like choral response. 5. If the answer to the question is brief and specific, you can use an “all rider response” to
incorporate OTRs. 6. Use OTRs presented to the whole group when rider response is low. 7. If you have rider(s) with different abilities, allow individual rider(s) to use a different
strategy to respond. 8. Requiring the entire class to respond to some OTRs promotes rider engagement.
EVALUATING FEEDBACK TO TEACH INSTRUCTIONAL STRATEGIES 79
Appendix E
Feedback Frames for Labeled Praise During EAAT (Study 1).
Labeled Praise for Use of Praise
1. Rate 1. You created an encouraging atmosphere by using labeled praise more than once per
minute. You did that for the past [number] lessons! 2. You provided four labeled-praise statements per minute today! This rate of praise
improves rider outcomes. 3. You provided praise more often than my last observation, great work!
2. Distribution 1. You provided praise quickly after the rider responded. 2. Excellent job providing praise across the lesson, rather than providing several praises in
a burst. 3. Great job providing praise to each rider during this lesson. 4. You provided praise for both riding behaviors and other things, like paying attention,
which may help the rider develop additional skills. 5. Providing praise frequently kept the rider’s momentum going! 6. You boosted rider morale by providing praise frequently during activities that were
more challenging. 3. Specificity
1. Wonderful job providing more behavior-specific or labeled praise statements than generic ones!
2. You provided more labeled praise than generic praise during this lesson, making the appropriate behavior clear to riders.
3. Good job providing specific praise! 4. Style and Tone
1. Your praise is valuable to riders because it is so sincere. 2. You provided enthusiastic praise; your riders value that enthusiasm! 3. Nice work varying the way that you provided praise, rather than repeating similar
phrases. 4. Excellent work tailoring your praise to the rider’s preferences, by [example]. 5. Your praise is clear and concise, making it easy to understand what behavior you prefer.
5. Content 1. You provide praise for each rider based on ability. This helps riders to identify their skills
and celebrate personal successes! 2. You provided praise for both correct riding behavior and other things, good work. 3. You appropriately praised riders for doing things that often require correction, like
[example; using an inside voice while playing]. 4. You provided praise for a variety of behaviors, which reinforces those positive behavior
choices. 5. The riders did so well at [behavior]. That was a great time to provide praise. 6. You consistently provided praise after riders follow an instruction; this may help riders
comply more often in the future.
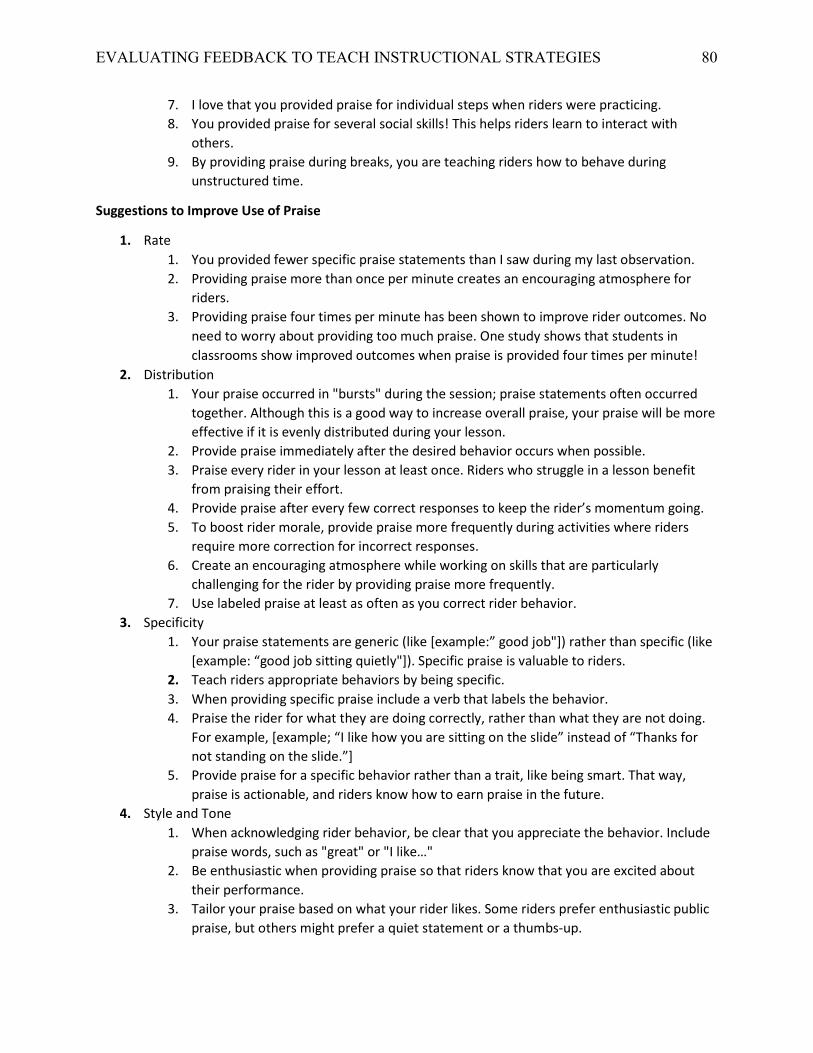
EVALUATING FEEDBACK TO TEACH INSTRUCTIONAL STRATEGIES 80
7. I love that you provided praise for individual steps when riders were practicing. 8. You provided praise for several social skills! This helps riders learn to interact with
others. 9. By providing praise during breaks, you are teaching riders how to behave during
unstructured time.
Suggestions to Improve Use of Praise
1. Rate 1. You provided fewer specific praise statements than I saw during my last observation. 2. Providing praise more than once per minute creates an encouraging atmosphere for
riders. 3. Providing praise four times per minute has been shown to improve rider outcomes. No
need to worry about providing too much praise. One study shows that students in classrooms show improved outcomes when praise is provided four times per minute!
2. Distribution 1. Your praise occurred in "bursts" during the session; praise statements often occurred
together. Although this is a good way to increase overall praise, your praise will be more effective if it is evenly distributed during your lesson.
2. Provide praise immediately after the desired behavior occurs when possible. 3. Praise every rider in your lesson at least once. Riders who struggle in a lesson benefit
from praising their effort. 4. Provide praise after every few correct responses to keep the rider’s momentum going. 5. To boost rider morale, provide praise more frequently during activities where riders
require more correction for incorrect responses. 6. Create an encouraging atmosphere while working on skills that are particularly
challenging for the rider by providing praise more frequently. 7. Use labeled praise at least as often as you correct rider behavior.
3. Specificity 1. Your praise statements are generic (like [example:” good job"]) rather than specific (like
[example: “good job sitting quietly"]). Specific praise is valuable to riders. 2. Teach riders appropriate behaviors by being specific. 3. When providing specific praise include a verb that labels the behavior. 4. Praise the rider for what they are doing correctly, rather than what they are not doing.
For example, [example; “I like how you are sitting on the slide” instead of “Thanks for not standing on the slide.”]
5. Provide praise for a specific behavior rather than a trait, like being smart. That way, praise is actionable, and riders know how to earn praise in the future.
4. Style and Tone 1. When acknowledging rider behavior, be clear that you appreciate the behavior. Include
praise words, such as "great" or "I like…" 2. Be enthusiastic when providing praise so that riders know that you are excited about
their performance. 3. Tailor your praise based on what your rider likes. Some riders prefer enthusiastic public
praise, but others might prefer a quiet statement or a thumbs-up.
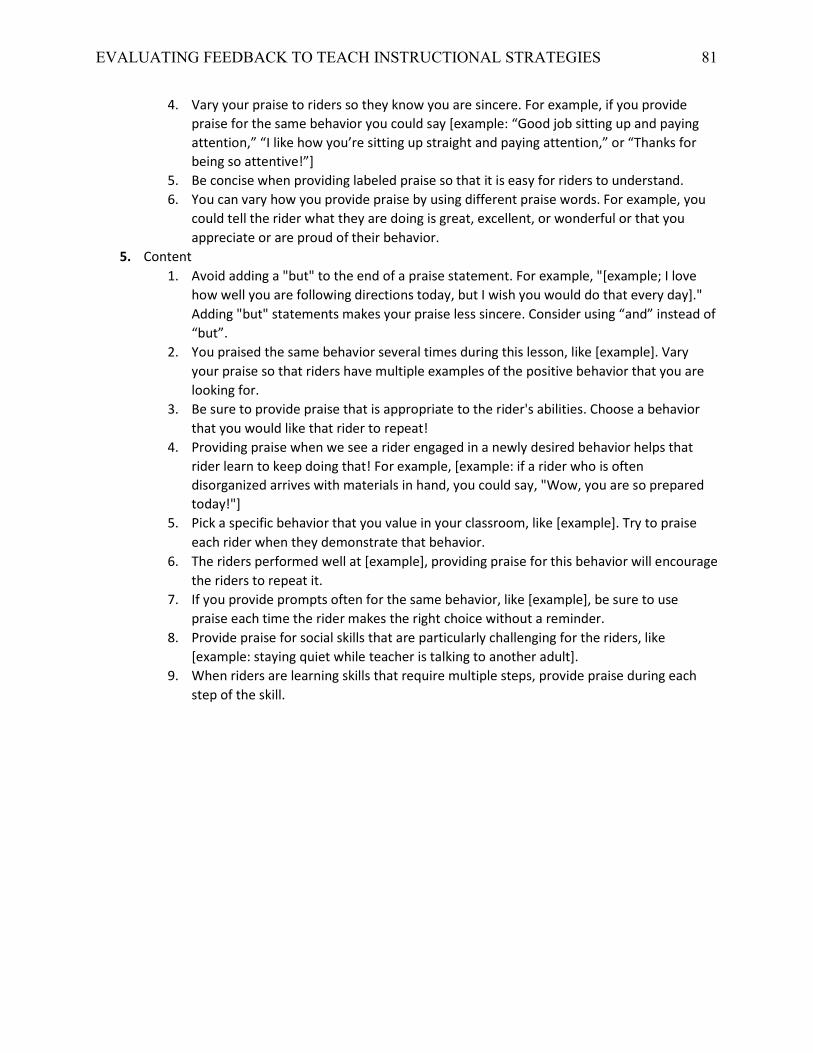
EVALUATING FEEDBACK TO TEACH INSTRUCTIONAL STRATEGIES 81
4. Vary your praise to riders so they know you are sincere. For example, if you provide praise for the same behavior you could say [example: “Good job sitting up and paying attention,” “I like how you’re sitting up straight and paying attention,” or “Thanks for being so attentive!”]
5. Be concise when providing labeled praise so that it is easy for riders to understand. 6. You can vary how you provide praise by using different praise words. For example, you
could tell the rider what they are doing is great, excellent, or wonderful or that you appreciate or are proud of their behavior.
5. Content 1. Avoid adding a "but" to the end of a praise statement. For example, "[example; I love
how well you are following directions today, but I wish you would do that every day]." Adding "but" statements makes your praise less sincere. Consider using “and” instead of “but”.
2. You praised the same behavior several times during this lesson, like [example]. Vary your praise so that riders have multiple examples of the positive behavior that you are looking for.
3. Be sure to provide praise that is appropriate to the rider's abilities. Choose a behavior that you would like that rider to repeat!
4. Providing praise when we see a rider engaged in a newly desired behavior helps that rider learn to keep doing that! For example, [example: if a rider who is often disorganized arrives with materials in hand, you could say, "Wow, you are so prepared today!"]
5. Pick a specific behavior that you value in your classroom, like [example]. Try to praise each rider when they demonstrate that behavior.
6. The riders performed well at [example], providing praise for this behavior will encourage the riders to repeat it.
7. If you provide prompts often for the same behavior, like [example], be sure to use praise each time the rider makes the right choice without a reminder.
8. Provide praise for social skills that are particularly challenging for the riders, like [example: staying quiet while teacher is talking to another adult].
9. When riders are learning skills that require multiple steps, provide praise during each step of the skill.
EVALUATING FEEDBACK TO TEACH INSTRUCTIONAL STRATEGIES 82
Appendix F
Social-validity Questionnaire Provided to Instructors in Study 1
EVALUATING FEEDBACK TO TEACH INSTRUCTIONAL STRATEGIES 84
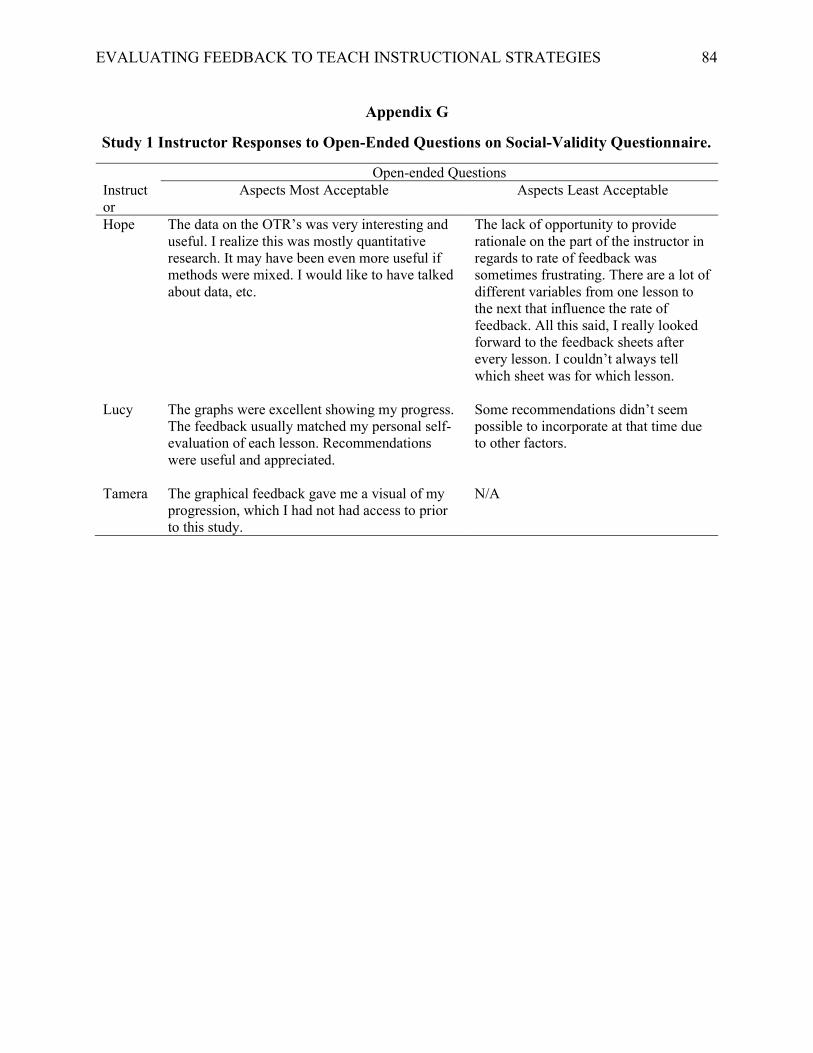
Appendix G
Study 1 Instructor Responses to Open-Ended Questions on Social-Validity Questionnaire.
Open-ended Questions Instructor
Aspects Most Acceptable Aspects Least Acceptable
Hope The data on the OTR’s was very interesting and useful. I realize this was mostly quantitative research. It may have been even more useful if methods were mixed. I would like to have talked about data, etc.
The lack of opportunity to provide rationale on the part of the instructor in regards to rate of feedback was sometimes frustrating. There are a lot of different variables from one lesson to the next that influence the rate of feedback. All this said, I really looked forward to the feedback sheets after every lesson. I couldn’t always tell which sheet was for which lesson.
Lucy The graphs were excellent showing my progress. The feedback usually matched my personal self-evaluation of each lesson. Recommendations were useful and appreciated.
Some recommendations didn’t seem possible to incorporate at that time due to other factors.
Tamera The graphical feedback gave me a visual of my progression, which I had not had access to prior to this study.
N/A
EVALUATING FEEDBACK TO TEACH INSTRUCTIONAL STRATEGIES 85
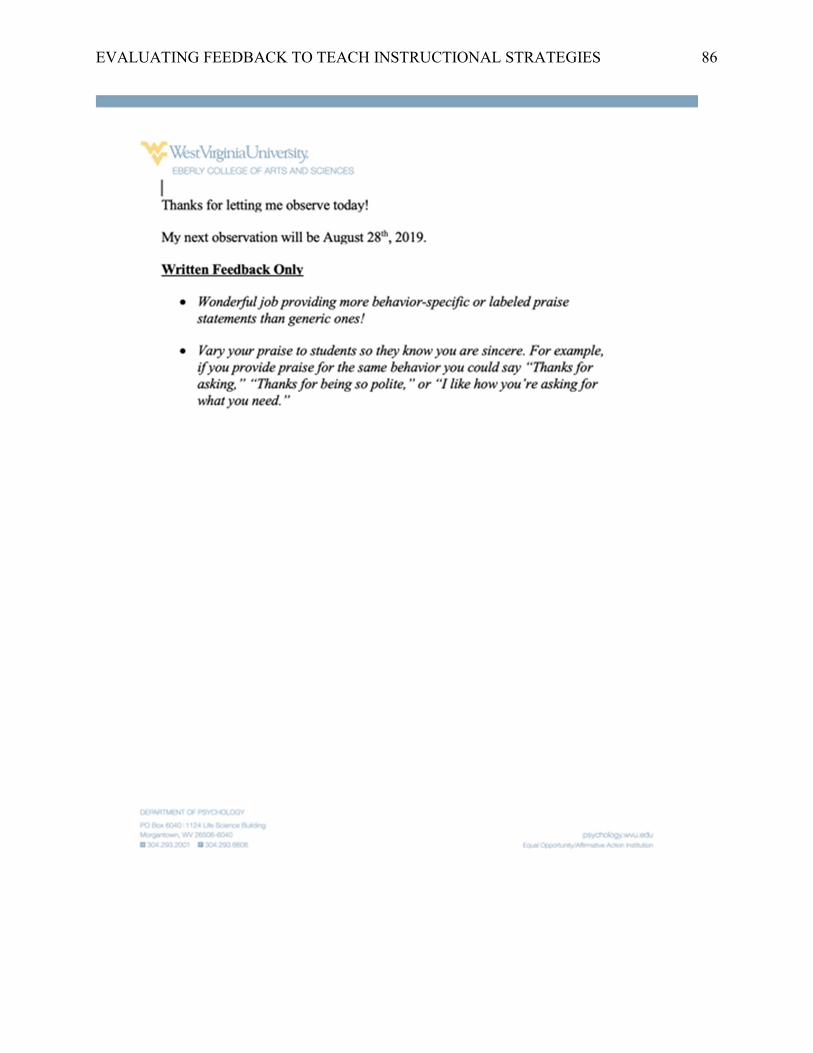
Appendix H
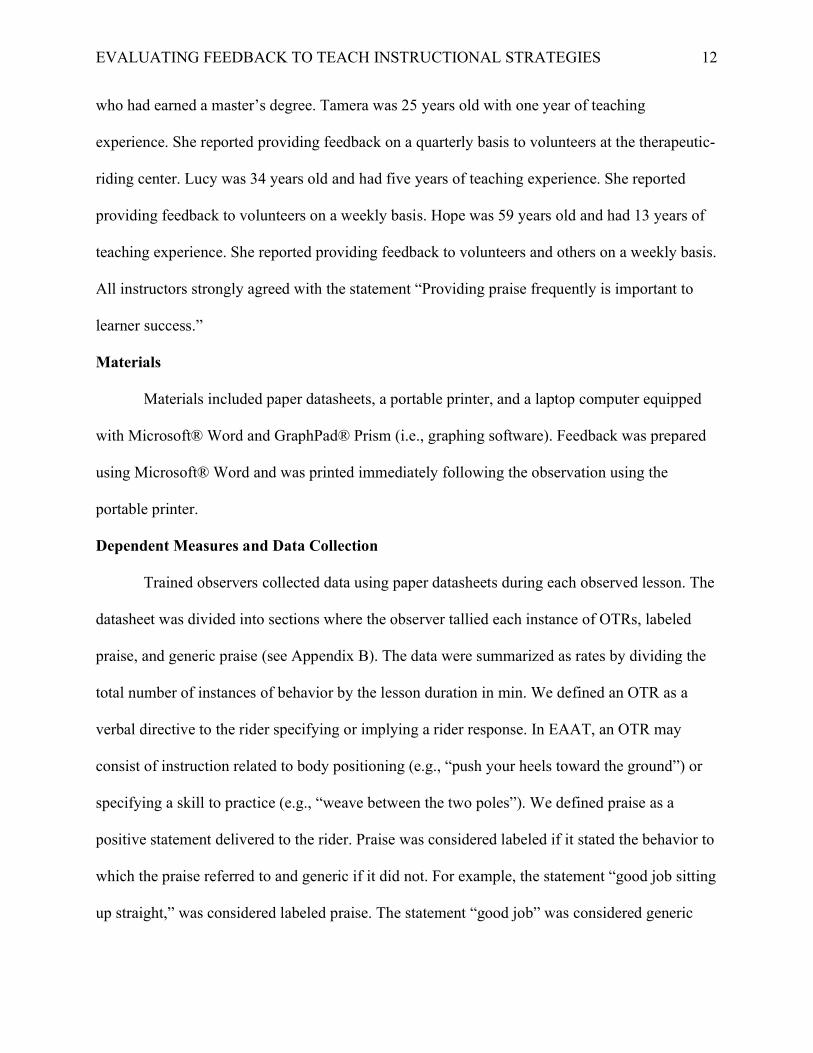
Example of Each Type of Feedback Provided to Instructors During Study 2
EVALUATING FEEDBACK TO TEACH INSTRUCTIONAL STRATEGIES 89
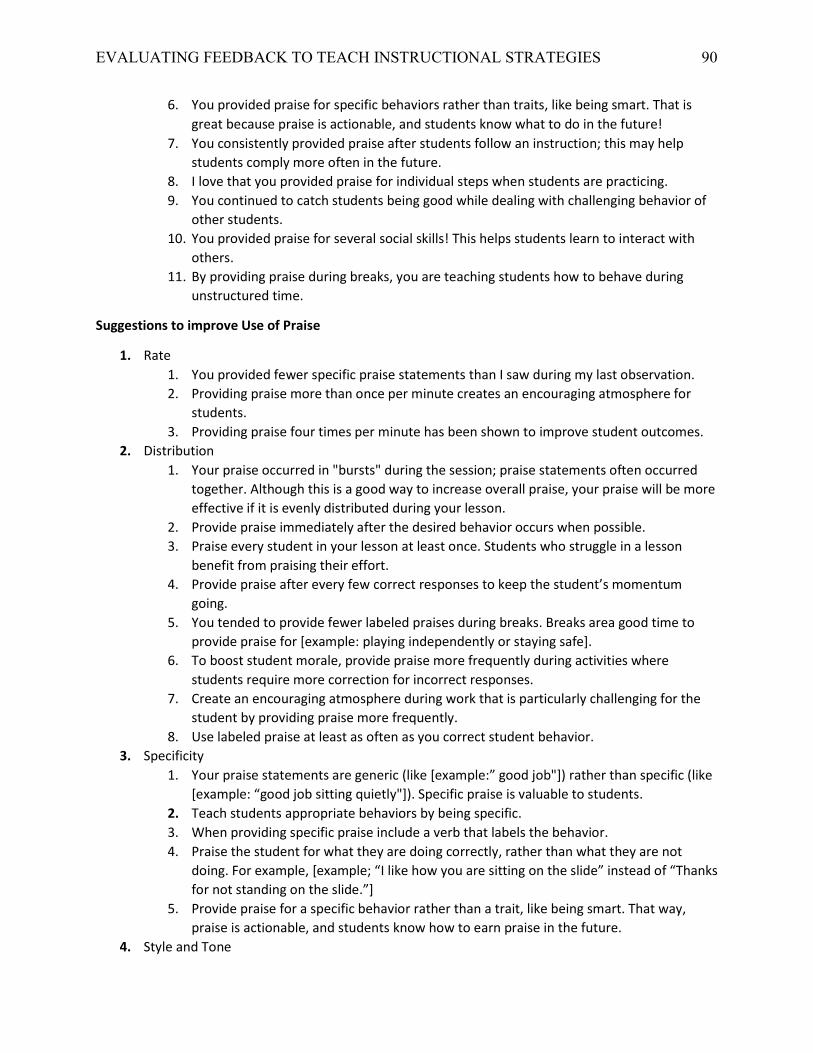
Appendix I
Feedback Frames for Praise During Study 2 (Classroom)
Labeled Praise on Use of Praise
1. Rate 1. You created an encouraging atmosphere by using labeled praise more than once per
minute. You did that for the past [number] lessons! 2. You provided four labeled-praise statements per minute today! This rate of praise
improves student outcomes. 3. You provided praise more often than my last observation, great work!
2. Distribution 1. You provided praise quickly after the student responded. 2. Excellent job providing praise across the lesson, rather than providing several praises in
a burst. 3. Great job providing praise to several different students during this observation. 4. You provided praise during both work and break times, making it clear to students how
to behave in different situations. 5. Providing praise frequently during academic activities kept the student’s momentum
going! 6. You boosted student morale by providing praise frequently during activities that were
more challenging for students. 3. Specificity
1. Wonderful job providing more behavior-specific or labeled praise statements than generic ones!
2. You provided more labeled praise than generic praise during this lesson, making the appropriate behavior clear to students.
3. Good job providing specific praise! 4. Style and Tone
1. Your praise is valuable to students because it is so sincere. 2. You provided enthusiastic praise; your students value that enthusiasm! 3. Nice work varying the way that you provided praise, rather than repeating similar
phrases. 4. Excellent work tailoring your praise to each student’s preferences. 5. Your praise is clear and concise, making it easy to understand what behavior you desire.
5. Content 1. You provided praise for each student based on ability. You helped students to identify
their skills and celebrate personal successes! 2. You provided praise for both correct academic responding and appropriate student
behavior, good work. 3. You appropriately praised students for doing things that often require correction, like
[example; using an inside voice while playing]. 4. You provided praise for a variety of behaviors, which reinforces those positive behavior
choices. 5. The students did so well at [behavior]. That was a great time to provide praise!
EVALUATING FEEDBACK TO TEACH INSTRUCTIONAL STRATEGIES 90
6. You provided praise for specific behaviors rather than traits, like being smart. That is great because praise is actionable, and students know what to do in the future!
7. You consistently provided praise after students follow an instruction; this may help students comply more often in the future.
8. I love that you provided praise for individual steps when students are practicing. 9. You continued to catch students being good while dealing with challenging behavior of
other students. 10. You provided praise for several social skills! This helps students learn to interact with
others. 11. By providing praise during breaks, you are teaching students how to behave during
unstructured time.
Suggestions to improve Use of Praise
1. Rate 1. You provided fewer specific praise statements than I saw during my last observation. 2. Providing praise more than once per minute creates an encouraging atmosphere for
students. 3. Providing praise four times per minute has been shown to improve student outcomes.
2. Distribution 1. Your praise occurred in "bursts" during the session; praise statements often occurred
together. Although this is a good way to increase overall praise, your praise will be more effective if it is evenly distributed during your lesson.
2. Provide praise immediately after the desired behavior occurs when possible. 3. Praise every student in your lesson at least once. Students who struggle in a lesson
benefit from praising their effort. 4. Provide praise after every few correct responses to keep the student’s momentum
going. 5. You tended to provide fewer labeled praises during breaks. Breaks area good time to
provide praise for [example: playing independently or staying safe]. 6. To boost student morale, provide praise more frequently during activities where
students require more correction for incorrect responses. 7. Create an encouraging atmosphere during work that is particularly challenging for the
student by providing praise more frequently. 8. Use labeled praise at least as often as you correct student behavior.
3. Specificity 1. Your praise statements are generic (like [example:” good job"]) rather than specific (like
[example: “good job sitting quietly"]). Specific praise is valuable to students. 2. Teach students appropriate behaviors by being specific. 3. When providing specific praise include a verb that labels the behavior. 4. Praise the student for what they are doing correctly, rather than what they are not
doing. For example, [example; “I like how you are sitting on the slide” instead of “Thanks for not standing on the slide.”]
5. Provide praise for a specific behavior rather than a trait, like being smart. That way, praise is actionable, and students know how to earn praise in the future.
4. Style and Tone
EVALUATING FEEDBACK TO TEACH INSTRUCTIONAL STRATEGIES 91
1. When acknowledging student behavior, be clear that you appreciate the behavior. Include praise words, such as "great" or "I like…"
2. Be enthusiastic when providing praise so that students know that you are excited about their performance.
3. Tailor your praise based on what your student likes. Some students prefer enthusiastic public praise, but others might prefer a quiet statement or a thumbs-up.
4. Vary your praise to students so they know you are sincere. For example, if you provide praise for the same behavior you could say [example: “Good job sitting up and paying attention,” “I like how you’re sitting up straight and paying attention,” or “Thanks for being so attentive!”]
5. Be concise when providing labeled praise so that it is easy for students to understand. 6. You can vary how you provide praise by using different praise words. For example, you
could tell the student what they are doing is great, excellent, or wonderful or that you appreciate or are proud of their behavior.
5. Content 1. Avoid adding a "but" to the end of a praise statement. For example, "[example; I love
how well you are following directions today, but I wish you would do that every day]." Adding "but" statements makes your praise less sincere. Consider using “and” instead of “but”.
2. You praised primarily academic responses. Provide praise for appropriate behavior in addition to correct academic responding. For example, you could say, [example: "I love how quietly you are sitting!"]
3. You praised the same behavior several times during this lesson, like [example]. Vary your praise so that students have multiple examples of the positive behavior that you are looking for.
4. Be sure to provide praise that is appropriate to the student's abilities. Choose a behavior that you would like that student to repeat!
5. Providing praise when we see a student engaged in a newly desired behavior helps that student learn to keep doing that! For example, [example: if a student who is often disorganized arrives with materials in hand, you could say, "Wow, you are so prepared today!"]
6. Pick a specific behavior that you value in your classroom, like [example]. Try to praise each student when they demonstrate that behavior.
7. The students performed well at [example], providing praise for this behavior will encourage the students to repeat it.
8. If you provide prompts often for the same behavior, like [example], be sure to use praise each time the student makes the right choice without a reminder.
9. Provide praise for social skills that are particularly challenging for the students, like [example: staying quiet while teacher is talking to another adult].
10. When students are learning skills that require multiple steps, provide praise during each step of the skill.
EVALUATING FEEDBACK TO TEACH INSTRUCTIONAL STRATEGIES 92
Appendix J
Ranking Sheet Provided After Exposure to Each Feedback Type During Study 2
EVALUATING FEEDBACK TO TEACH INSTRUCTIONAL STRATEGIES 93
Appendix K
Example of Stimulus Card Used in Concurrent-Chain Assessment
Note. This example depicts one of twelve possible variations of the stimulus, with each variation
including the names of each feedback type in different quadrants. The stimulus would be printed
on a standard sheet of paper (i.e., 8.5 by 11.5 in).
EVALUATING FEEDBACK TO TEACH INSTRUCTIONAL STRATEGIES 94
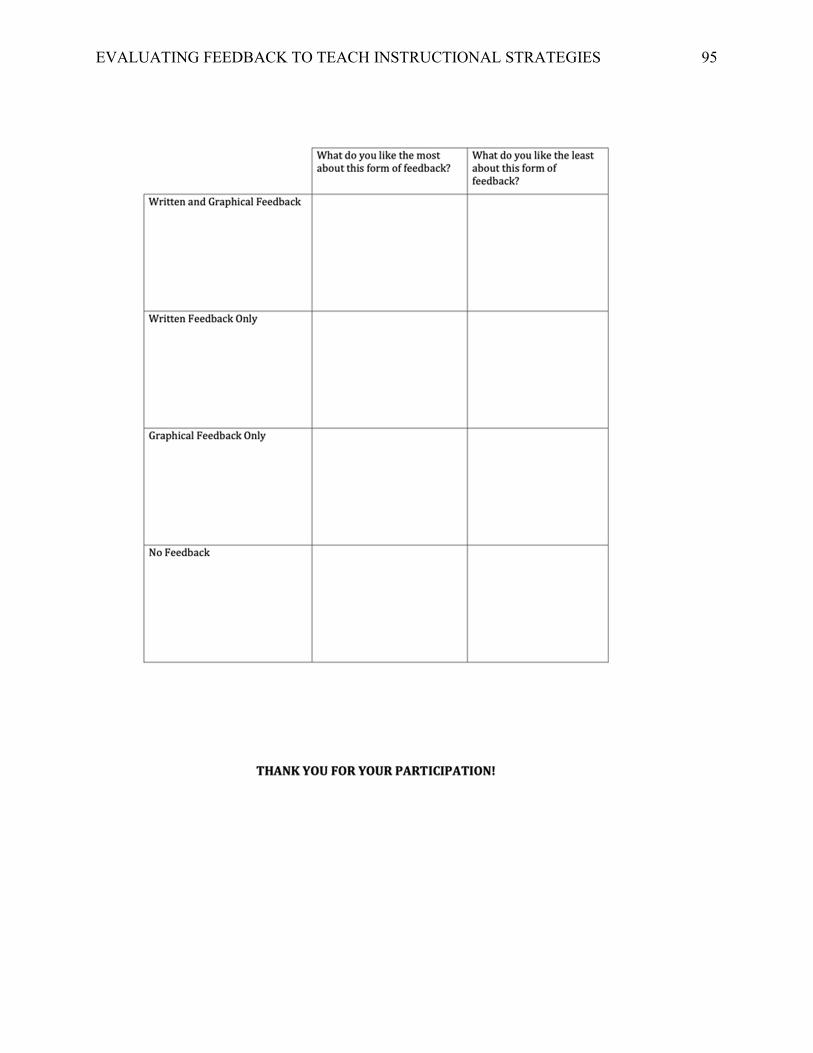
Appendix L
Social-validity questionnaire provided during Study 2.
Note. The form provided will be specific to the type of feedback that the instructor selected most during the concurrent-chain assessment. Displayed here is the form for written and graphical feedback.
EVALUATING FEEDBACK TO TEACH INSTRUCTIONAL STRATEGIES 96
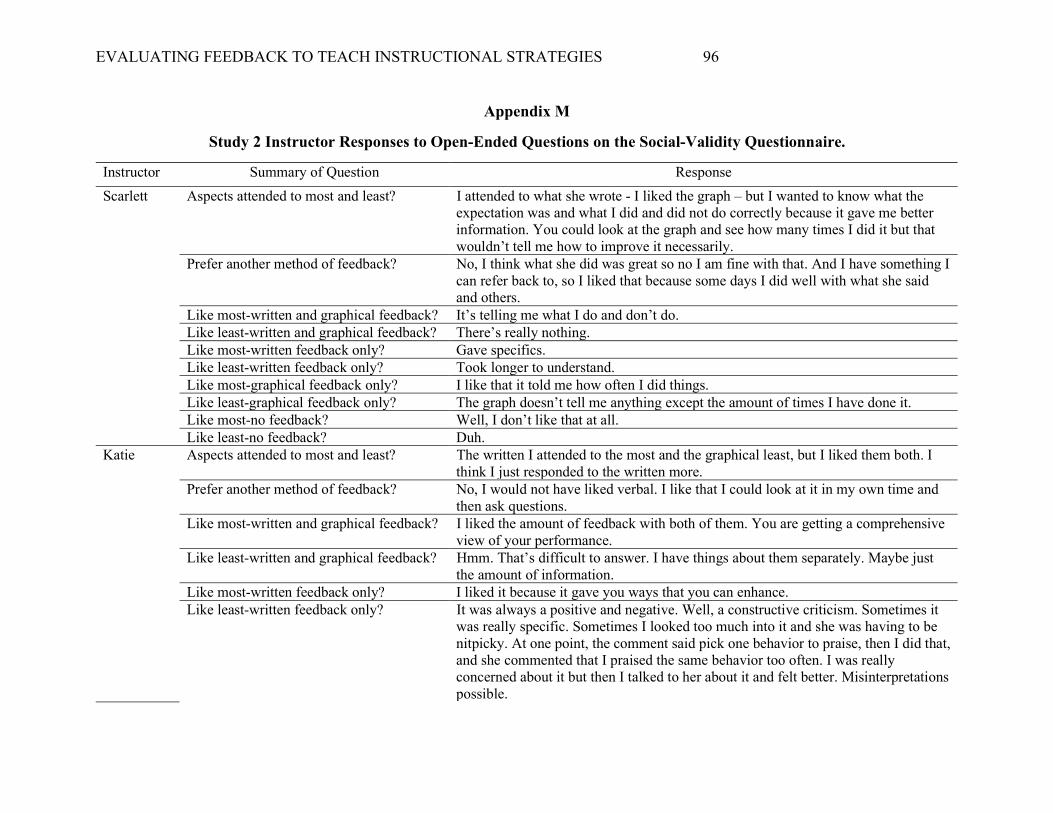
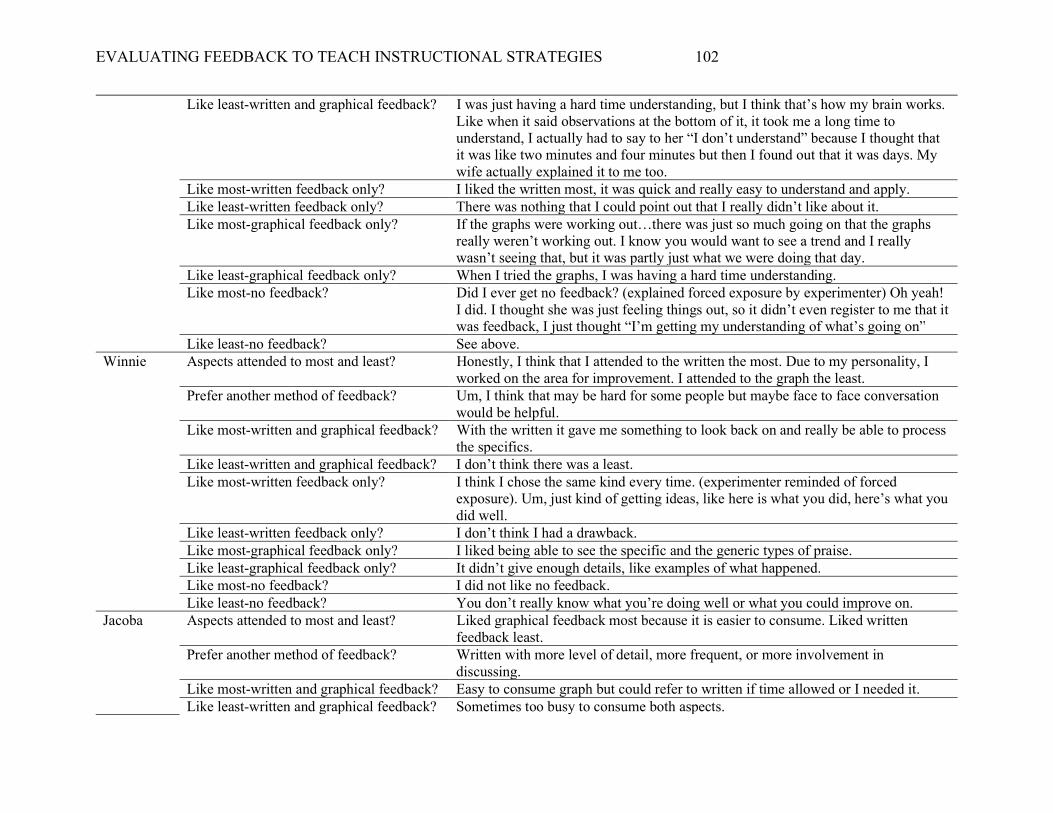
Appendix M
Study 2 Instructor Responses to Open-Ended Questions on the Social-Validity Questionnaire.
Instructor Summary of Question Response
Scarlett Aspects attended to most and least? I attended to what she wrote - I liked the graph – but I wanted to know what the expectation was and what I did and did not do correctly because it gave me better information. You could look at the graph and see how many times I did it but that wouldn’t tell me how to improve it necessarily.
Prefer another method of feedback? No, I think what she did was great so no I am fine with that. And I have something I can refer back to, so I liked that because some days I did well with what she said and others.
Like most-written and graphical feedback? It’s telling me what I do and don’t do. Like least-written and graphical feedback? There’s really nothing. Like most-written feedback only? Gave specifics. Like least-written feedback only? Took longer to understand. Like most-graphical feedback only? I like that it told me how often I did things. Like least-graphical feedback only? The graph doesn’t tell me anything except the amount of times I have done it. Like most-no feedback? Well, I don’t like that at all. Like least-no feedback? Duh.
Katie Aspects attended to most and least? The written I attended to the most and the graphical least, but I liked them both. I think I just responded to the written more.
Prefer another method of feedback? No, I would not have liked verbal. I like that I could look at it in my own time and then ask questions.
Like most-written and graphical feedback? I liked the amount of feedback with both of them. You are getting a comprehensive view of your performance.
Like least-written and graphical feedback? Hmm. That’s difficult to answer. I have things about them separately. Maybe just the amount of information.
Like most-written feedback only? I liked it because it gave you ways that you can enhance. Like least-written feedback only? It was always a positive and negative. Well, a constructive criticism. Sometimes it
was really specific. Sometimes I looked too much into it and she was having to be nitpicky. At one point, the comment said pick one behavior to praise, then I did that, and she commented that I praised the same behavior too often. I was really concerned about it but then I talked to her about it and felt better. Misinterpretations possible.
EVALUATING FEEDBACK TO TEACH INSTRUCTIONAL STRATEGIES 97
Like most-graphical feedback only? You could see over time your trend which was helpful. I liked to see the overall trend.
Like least-graphical feedback only? I noticed that on days when attendance was down there would be less labeled praise. Maybe reflect how many students were there each day because on the graph the next day it looks awesome but there were more opportunities. Like write things that could affect that.
Like most-no feedback? I’d never choose no feedback, so I don’t think it really applies. Like least-no feedback? See above.
Remi Aspects attended to most and least? I think I attended to the graphs most because I could see clearly what my scores were and how they compared to the last time that I was observed. I didn’t attend to the written as much, but it was good to see those and get those specifics that the observer had in mind that I could change.
Prefer another method of feedback? No Like most-written and graphical feedback? I liked that it was concise and that it was visual, I guess, so that I could see my
performance over time, not just written. Like least-written and graphical feedback? Hmm, the least I would say if I didn’t do so well, having that still on the chart was
kind of discouraging like to see that it was lower. Might prefer fewer data points at a time?
Like most-written feedback only? I liked that written was specific. Like least-written feedback only? I don’t think I really had any issues with it. Like most-graphical feedback only? To have a visual of how it was. Like least-graphical feedback only? Other than the fact that it was all the data points, I don’t think I had anything. Like most-no feedback? I did not like. Like least-no feedback? I had no idea how I was doing; it was hard to base how I was doing, and I didn’t
feel like I could get any better without feedback. Jackie Aspects attended to most and least? I attended to the graph the most because it was easiest to quickly see what was
what. The written the least because I preferred the graph and could reference it quicker.
Prefer another method of feedback? Nuh-uh. Like most-written and graphical feedback? Quick reference. Also gave me suggestions on what to do for the next time or what
to work on. Like least-written and graphical feedback? Can I say nothing? Like most-written feedback only? The same as before, I like that it gave me suggestions of what to do the next time. Like least-written feedback only? It wasn’t as quick as a reference. Like most-graphical feedback only? It was easy for me to see the result and understand it fast. Like least-graphical feedback only? There weren’t really any suggestions of what to do.
EVALUATING FEEDBACK TO TEACH INSTRUCTIONAL STRATEGIES 98
Like most-no feedback? I don’t like no feedback. Like least-no feedback? I prefer to know what to do differently.
Kelly Aspects attended to most and least? I probably attended to the graphical part the most, but I can’t say anything the least because I read the written every time, but I definitely looked at the graph first.
Prefer another method of feedback? Even immediate feedback like right after just her telling me I would have been fine with, but if she could have given me the graph after that would be nice.
Like most-written and graphical feedback? I like that the most because the written gives me ideas for the future and the graph had some, I think for me to see my performance go up across minutes and think about what aspects of the environment are changing. I think it’s reinforcing to me.
Like least-written and graphical feedback? To be honest with you, there wasn’t anything I didn’t like. I mean I wish I could have that all the time.
Like most-written feedback only? The feedback allows me to know what I am doing well as well as what I can do differently to make it better
Like least-written feedback only? There wasn’t anything I disliked about it. Like most-graphical feedback only? The benefit is seeing each day where I was at. So, if things are going differently,
then I could bump it up for the rest of the day after she was gone. Like least-graphical feedback only? There wasn’t anything I disliked about it. Like most-no feedback? I prefer feedback in any form to no feedback. Did not really like anything about it.
It leaves me wanting. Like least-no feedback? I disliked not having things to help me improve.
Rachel Aspects attended to most and least? I think the combination, but I guess more so the written just to look for any extra tips that she provided. I mean really, I looked at both of them, just as a means to double check. The graphs tended to fluctuate but I think that’s because of what was going on in here.
Prefer another method of feedback? No, I liked that. I think I mainly picked written and graphical, even though she would move it around on her little paper. I went for different ones, but I preferred written and graphical. I like that I had it in writing to refer back to so that was useful.
Like most-written and graphical feedback? Just to see it over time and get the extra tips. Like least-written and graphical feedback? There wasn’t anything about it. Like most-written feedback only? Just to get the extra tips, she had some useful strategies in there. They were brief but
informative. Like least-written feedback only? I couldn’t compare it to other days, like oh yesterday I was on but today I was
slacking a little. Like most-graphical feedback only? Just to see how things transpired over time. I liked that I could use it as a mean to
compare different days.
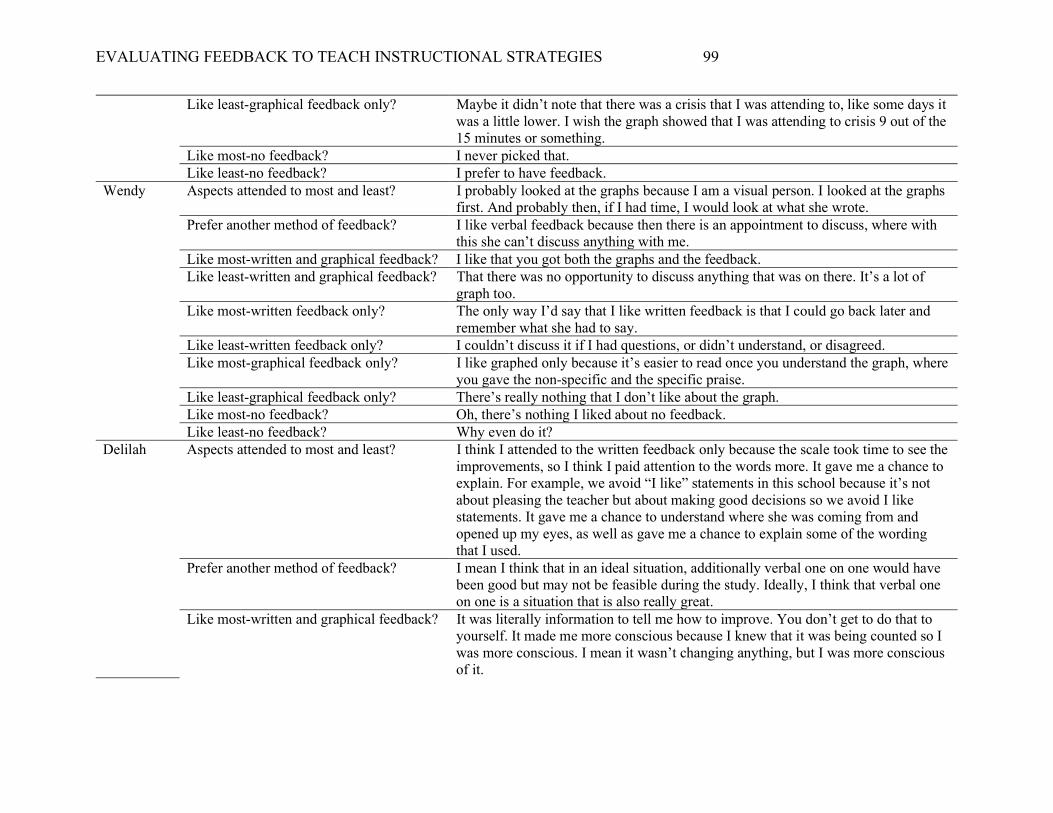
EVALUATING FEEDBACK TO TEACH INSTRUCTIONAL STRATEGIES 99
Like least-graphical feedback only? Maybe it didn’t note that there was a crisis that I was attending to, like some days it was a little lower. I wish the graph showed that I was attending to crisis 9 out of the 15 minutes or something.
Like most-no feedback? I never picked that. Like least-no feedback? I prefer to have feedback.
Wendy Aspects attended to most and least? I probably looked at the graphs because I am a visual person. I looked at the graphs first. And probably then, if I had time, I would look at what she wrote.
Prefer another method of feedback? I like verbal feedback because then there is an appointment to discuss, where with this she can’t discuss anything with me.
Like most-written and graphical feedback? I like that you got both the graphs and the feedback. Like least-written and graphical feedback? That there was no opportunity to discuss anything that was on there. It’s a lot of
graph too. Like most-written feedback only? The only way I’d say that I like written feedback is that I could go back later and
remember what she had to say. Like least-written feedback only? I couldn’t discuss it if I had questions, or didn’t understand, or disagreed. Like most-graphical feedback only? I like graphed only because it’s easier to read once you understand the graph, where
you gave the non-specific and the specific praise. Like least-graphical feedback only? There’s really nothing that I don’t like about the graph. Like most-no feedback? Oh, there’s nothing I liked about no feedback. Like least-no feedback? Why even do it?
Delilah Aspects attended to most and least? I think I attended to the written feedback only because the scale took time to see the improvements, so I think I paid attention to the words more. It gave me a chance to explain. For example, we avoid “I like” statements in this school because it’s not about pleasing the teacher but about making good decisions so we avoid I like statements. It gave me a chance to understand where she was coming from and opened up my eyes, as well as gave me a chance to explain some of the wording that I used.
Prefer another method of feedback? I mean I think that in an ideal situation, additionally verbal one on one would have been good but may not be feasible during the study. Ideally, I think that verbal one on one is a situation that is also really great.
Like most-written and graphical feedback? It was literally information to tell me how to improve. You don’t get to do that to yourself. It made me more conscious because I knew that it was being counted so I was more conscious. I mean it wasn’t changing anything, but I was more conscious of it.
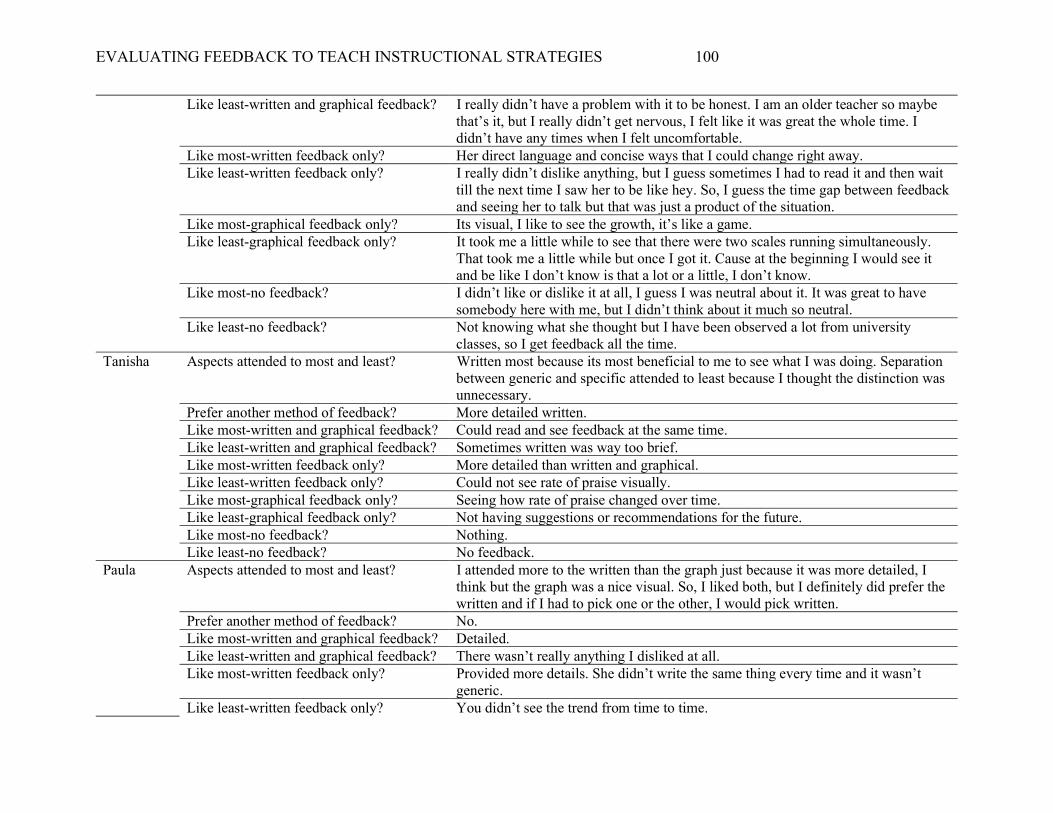
EVALUATING FEEDBACK TO TEACH INSTRUCTIONAL STRATEGIES 100
Like least-written and graphical feedback? I really didn’t have a problem with it to be honest. I am an older teacher so maybe that’s it, but I really didn’t get nervous, I felt like it was great the whole time. I didn’t have any times when I felt uncomfortable.
Like most-written feedback only? Her direct language and concise ways that I could change right away. Like least-written feedback only? I really didn’t dislike anything, but I guess sometimes I had to read it and then wait
till the next time I saw her to be like hey. So, I guess the time gap between feedback and seeing her to talk but that was just a product of the situation.
Like most-graphical feedback only? Its visual, I like to see the growth, it’s like a game. Like least-graphical feedback only? It took me a little while to see that there were two scales running simultaneously.
That took me a little while but once I got it. Cause at the beginning I would see it and be like I don’t know is that a lot or a little, I don’t know.
Like most-no feedback? I didn’t like or dislike it at all, I guess I was neutral about it. It was great to have somebody here with me, but I didn’t think about it much so neutral.
Like least-no feedback? Not knowing what she thought but I have been observed a lot from university classes, so I get feedback all the time.
Tanisha Aspects attended to most and least? Written most because its most beneficial to me to see what I was doing. Separation between generic and specific attended to least because I thought the distinction was unnecessary.
Prefer another method of feedback? More detailed written. Like most-written and graphical feedback? Could read and see feedback at the same time. Like least-written and graphical feedback? Sometimes written was way too brief. Like most-written feedback only? More detailed than written and graphical. Like least-written feedback only? Could not see rate of praise visually. Like most-graphical feedback only? Seeing how rate of praise changed over time. Like least-graphical feedback only? Not having suggestions or recommendations for the future. Like most-no feedback? Nothing. Like least-no feedback? No feedback.
Paula Aspects attended to most and least? I attended more to the written than the graph just because it was more detailed, I think but the graph was a nice visual. So, I liked both, but I definitely did prefer the written and if I had to pick one or the other, I would pick written.
Prefer another method of feedback? No. Like most-written and graphical feedback? Detailed. Like least-written and graphical feedback? There wasn’t really anything I disliked at all. Like most-written feedback only? Provided more details. She didn’t write the same thing every time and it wasn’t
generic. Like least-written feedback only? You didn’t see the trend from time to time.
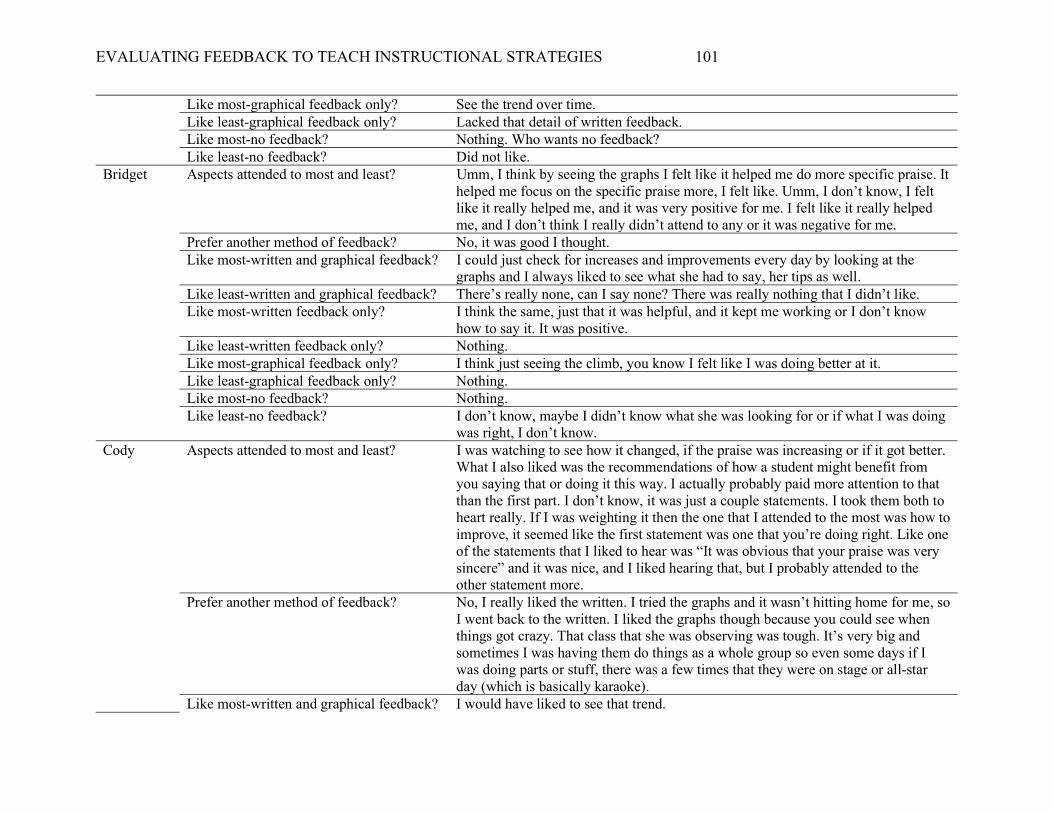
EVALUATING FEEDBACK TO TEACH INSTRUCTIONAL STRATEGIES 101
Like most-graphical feedback only? See the trend over time. Like least-graphical feedback only? Lacked that detail of written feedback. Like most-no feedback? Nothing. Who wants no feedback? Like least-no feedback? Did not like.
Bridget Aspects attended to most and least? Umm, I think by seeing the graphs I felt like it helped me do more specific praise. It helped me focus on the specific praise more, I felt like. Umm, I don’t know, I felt like it really helped me, and it was very positive for me. I felt like it really helped me, and I don’t think I really didn’t attend to any or it was negative for me.
Prefer another method of feedback? No, it was good I thought. Like most-written and graphical feedback? I could just check for increases and improvements every day by looking at the
graphs and I always liked to see what she had to say, her tips as well. Like least-written and graphical feedback? There’s really none, can I say none? There was really nothing that I didn’t like. Like most-written feedback only? I think the same, just that it was helpful, and it kept me working or I don’t know
how to say it. It was positive. Like least-written feedback only? Nothing. Like most-graphical feedback only? I think just seeing the climb, you know I felt like I was doing better at it. Like least-graphical feedback only? Nothing. Like most-no feedback? Nothing. Like least-no feedback? I don’t know, maybe I didn’t know what she was looking for or if what I was doing
was right, I don’t know. Cody Aspects attended to most and least? I was watching to see how it changed, if the praise was increasing or if it got better.
What I also liked was the recommendations of how a student might benefit from you saying that or doing it this way. I actually probably paid more attention to that than the first part. I don’t know, it was just a couple statements. I took them both to heart really. If I was weighting it then the one that I attended to the most was how to improve, it seemed like the first statement was one that you’re doing right. Like one of the statements that I liked to hear was “It was obvious that your praise was very sincere” and it was nice, and I liked hearing that, but I probably attended to the other statement more.
Prefer another method of feedback? No, I really liked the written. I tried the graphs and it wasn’t hitting home for me, so I went back to the written. I liked the graphs though because you could see when things got crazy. That class that she was observing was tough. It’s very big and sometimes I was having them do things as a whole group so even some days if I was doing parts or stuff, there was a few times that they were on stage or all-star day (which is basically karaoke).
Like most-written and graphical feedback? I would have liked to see that trend.
EVALUATING FEEDBACK TO TEACH INSTRUCTIONAL STRATEGIES 102
Like least-written and graphical feedback? I was just having a hard time understanding, but I think that’s how my brain works. Like when it said observations at the bottom of it, it took me a long time to understand, I actually had to say to her “I don’t understand” because I thought that it was like two minutes and four minutes but then I found out that it was days. My wife actually explained it to me too.
Like most-written feedback only? I liked the written most, it was quick and really easy to understand and apply. Like least-written feedback only? There was nothing that I could point out that I really didn’t like about it. Like most-graphical feedback only? If the graphs were working out…there was just so much going on that the graphs
really weren’t working out. I know you would want to see a trend and I really wasn’t seeing that, but it was partly just what we were doing that day.
Like least-graphical feedback only? When I tried the graphs, I was having a hard time understanding. Like most-no feedback? Did I ever get no feedback? (explained forced exposure by experimenter) Oh yeah!
I did. I thought she was just feeling things out, so it didn’t even register to me that it was feedback, I just thought “I’m getting my understanding of what’s going on”
Like least-no feedback? See above. Winnie Aspects attended to most and least? Honestly, I think that I attended to the written the most. Due to my personality, I
worked on the area for improvement. I attended to the graph the least. Prefer another method of feedback? Um, I think that may be hard for some people but maybe face to face conversation
would be helpful. Like most-written and graphical feedback? With the written it gave me something to look back on and really be able to process
the specifics. Like least-written and graphical feedback? I don’t think there was a least. Like most-written feedback only? I think I chose the same kind every time. (experimenter reminded of forced
exposure). Um, just kind of getting ideas, like here is what you did, here’s what you did well.
Like least-written feedback only? I don’t think I had a drawback. Like most-graphical feedback only? I liked being able to see the specific and the generic types of praise. Like least-graphical feedback only? It didn’t give enough details, like examples of what happened. Like most-no feedback? I did not like no feedback. Like least-no feedback? You don’t really know what you’re doing well or what you could improve on.
Jacoba Aspects attended to most and least? Liked graphical feedback most because it is easier to consume. Liked written feedback least.
Prefer another method of feedback? Written with more level of detail, more frequent, or more involvement in discussing.
Like most-written and graphical feedback? Easy to consume graph but could refer to written if time allowed or I needed it. Like least-written and graphical feedback? Sometimes too busy to consume both aspects.
EVALUATING FEEDBACK TO TEACH INSTRUCTIONAL STRATEGIES 103
Like most-written feedback only? Descriptive, could save for later and refer back. Like least-written feedback only? Don’t like to read, not an immediate answer. Like most-graphical feedback only? Could see movement, good days and bad days. Like least-graphical feedback only? No verbal examples provided. Like most-no feedback? Nothing Like least-no feedback? It gives me nothing.
Kacey Aspects attended to most and least? Liked written most, graphical did not mean much to me and I didn’t need it. Prefer another method of feedback? Verbal and written. Like most-written and graphical feedback? Specific with the written and included suggestions to improve. Like least-written and graphical feedback? Realized graphical did not mean much. Like most-written feedback only? Encouragement and areas of improvement. Did not sound condescending. Like least-written feedback only? Just written, would have liked verbal. Like most-graphical feedback only? Nice to see how much you are doing at one time, great for some but not for me. Like least-graphical feedback only? Did not register for me. No areas for improvement. Like most-no feedback? No effect, did not notice. Like least-no feedback? No effect, did not notice.