EVALUATION AND CHARACTERISATION OF THE
THERMAL GRILL APPARATUS FOR SPINAL CORD
INJURY PATIENTS
by
Diane Kostka
A thesis submitted in conformity with the requirements for the
degree of Master of Health Science in Clinical Engineering
Graduate Department of Institute of Biomaterials and Biomedical Engineering
University of Toronto
©Copyright by Diane Kostka 2011
Evaluation and Characterisation of the Thermal Grill apparatus for Spinal Cord Injury patients | 2011
ii
Evaluation and Characterisation of the Thermal Grill apparatus for
Spinal Cord Injury patients.
Diane Kostka
Master of Health Science in Clinical Engineering
Institute of Biomaterials and Biomedical Engineering
University of Toronto
2011
Abstract
Patients suffering from central neuropathic pain have thermal sensory deficits within the painful
area. Prior research proposed that the loss of thermal sensation in regions of central neuropathic
pain may reflect similar central nervous system interaction between warm and cold sensory
inputs that underlie the Thermal Grill Illusion (TGI) in which burning pain is felt while reduced
warm/cold sensations are reported.
This work presents a portable and reliable device that was used to systematically evaluate the
characteristics of the TGI in healthy individuals. The results suggest that the spatial distribution
of the warm and cool stimuli significantly affected the quality of perceived TGI. Additionally,
simultaneous tactile and thermal stimulation was shown to be significantly less painful than
thermal stimulation alone. A high correlation was also seen in the subject‘s TG intensity scores
and their cold pain threshold. These results are useful for future TGI studies for central
neuropathic pain.
Evaluation and Characterisation of the Thermal Grill apparatus for Spinal Cord Injury patients | 2011
iii
Acknowledgements
I am deeply grateful to Dr. Milos Popovic for giving me the confidence to explore my research
interests and the guidance to avoid getting lost in my exploration. Dr. Popovic was a fabulous
advisor: cheery, perceptive, and mindful of the things that truly matter.
I am very grateful to my co-supervisor Dr. Judith Hunter. With her enthusiasm, inspiration, and
great efforts to explain things clearly and simply, she helped peak my interest in the study of
pain. Dr. Jonathan Dostrovsky‘s guidance and attention to my work consistently led me along the
correct path, and he threw enough research questions my way to allow me to consider my
research from many angles. I would also like to thank Dr. Carnahan Heather for taking the time
to sit on my advisory committee and for providing a fresh perspective on my research.
I am indebted to my many student colleagues at REL for providing a stimulating and fun
environment in which to learn and grow. I am especially grateful to Helen Zhang and Noel Wu
for their research help, insightful advice and time.
I am truly grateful to my parents for their endless help, understanding and support through the
last two years. Finally, Gaurav Jain for his constant support, enthusiasm and feedback, and
without whom this document would not have been possible.
Evaluation and Characterisation of the Thermal Grill apparatus for Spinal Cord Injury patients | 2011
iv
Table of Contents
Glossary ........................................................................................................................................ ix
Chapter 1:Introduction .................................................................................................................1
1.1 Motivation ..............................................................................................................................1
1.2 Hypothesized cause of CNP ...................................................................................................3
1.3 Roadmap of the Thesis ...........................................................................................................3
Chapter 2: Background .................................................................................................................5
2.1 Central Neuropathic Pain .......................................................................................................5
2.2 Central Neuropathic Pain and Spinal Cord Injury .................................................................6
2.3 Psychophysical Testing ..........................................................................................................7
2.4 Thermal Grill Illusion – Etiology ...........................................................................................9
2.5 TGI and Central Neuropathic Pain ......................................................................................11
2.6 Research Problem .................................................................................................................13
2.6.1 Thermal Grill Devices ...................................................................................................13
2.6.2 Research Methodology ..................................................................................................14
Chapter 3: Research Objective ...................................................................................................17
3.1 Objective ..............................................................................................................................17
3.2 Hypotheses ...........................................................................................................................18
Chapter 4: Methodology..............................................................................................................19
4.1 Thermal Grill Apparatus .....................................................................................................19
4.1.1 Hardware Design ...........................................................................................................20
4.1.2 Software Design ............................................................................................................24
Evaluation and Characterisation of the Thermal Grill apparatus for Spinal Cord Injury patients | 2011
v
4.2 Subjects ................................................................................................................................28
4.3 Experimental Procedure .......................................................................................................29
4.3.1 Pre-Testing ....................................................................................................................30
4.3.2 Participant Feedback .....................................................................................................30
4.3.3 Determination of Thermal Thresholds ..........................................................................31
4.3.3.1 Uniform thermal stimulus .......................................................................................31
4.3.3.2 Thermal grill stimulus .............................................................................................32
4.3.4 Evaluation of optimal grill configurations ....................................................................32
4.3.5 Evaluation of dynamic thermal grill .............................................................................33
4.4 Order of Presentation ...........................................................................................................34
Chapter 5: Results........................................................................................................................35
5.1 Subjects ................................................................................................................................35
5.2 Thermal Thresholds – Spatial Characteristics ......................................................................35
5.3 Pain Elicited by the TG ........................................................................................................36
5.4 Static vs. Dynamic thermal testing Intensity ratings ............................................................37
5.5 Grill Configurations and TG intensity rating .......................................................................38
5.6 Thermal Quality and Characteristics of the TGI ..................................................................41
5.7 Thermal Thresholds and the TGI .........................................................................................44
5.8 Variance in Response ...........................................................................................................44
Chapter 6: Discussion ..................................................................................................................46
6.1 TGI as a Painful Experience .................................................................................................46
6.2 TG perception during Static vs. Dynamic Grill testing ........................................................47
6.3 Spatial Characteristics of the TG .........................................................................................48
6.4 Temporal Characteristics of the TG .....................................................................................49
6.5 TGI and Thermal Thresholds ...............................................................................................50
Evaluation and Characterisation of the Thermal Grill apparatus for Spinal Cord Injury patients | 2011
vi
6.6 The Stability of the TGI .......................................................................................................51
6.7 Important methodological issues ..........................................................................................51
6.8 Using the TG as a Research Tool .........................................................................................52
6.9 Limitations of this Study ......................................................................................................53
Chapter 7: Conclusions ...............................................................................................................55
References .....................................................................................................................................56
Appendices ....................................................................................................................................62
A. Screenshots of the User Interface ..........................................................................................62
B. Experiment Procedure Forms ................................................................................................63
C. Thermal Grill User Manual ...................................................................................................64
D. Study Script ...........................................................................................................................76
Evaluation and Characterisation of the Thermal Grill apparatus for Spinal Cord Injury patients | 2011
vii
List of Figures
2.1 Mechanism of the Thermal Grill Illusion ................................................................................11
2.2 Thermal Grill Stimulation Patterns ..........................................................................................16
4.1 Isometric 3-D view of the Thermal Grill device .....................................................................21
4.2 Mechanical Drawing of the thermal grill device ....................................................................21
4.3 Disturbance rejection ratio of device ......................................................................................23
4.4 Body site tested using the TG device ......................................................................................29
4.5 Spatial configurations of the Peltier elements ........................................................................32
4.6 Static and Dynamic testing procedure ....................................................................................33
5.1 Thermal thresholds on the forearm ..........................................................................................36
5.2 Graphs of the continuous unpleasantness rating in response to the five thermal stimuli
applied in (a) dynamic and (b) static mode ...........................................................................38
5.3 Percentage of ‗Burning‘ descriptors used between uniform and TG configurations ...............39
5.4 Box plots indicating VAS ratings between different configurations ......................................40
5.5 Progression of the perceived thermal quality of the TGS ........................................................43
5.5 Scatter plot of CPT vs. maximum VAS score of the TGS.......................................................44
A.1 Screenshots of User Interface ................................................................................................62
B.1 Participant feedback form ......................................................................................................63
Evaluation and Characterisation of the Thermal Grill apparatus for Spinal Cord Injury patients | 2011
viii
List of Tables
2.1 Comparative chart showing previous thermal grill devices used in research ..........................13
4.1 Accuracy of ramp rates ............................................................................................................24
4.2 Order of presentation of stimuli ...............................................................................................34
5.1 Descriptors chosen to describe the three thermal grill stimuli .................................................41
Evaluation and Characterisation of the Thermal Grill apparatus for Spinal Cord Injury patients | 2011
ix
Glossary
List of Abbreviations
CDT Cold Detection Threshold
CNP Central Neuropathic Pain
CNS Central Nervous System
CPT Cold Pain Threshold
HPC Heat Pinch Cold cells
HPT Heat Pain Threshold
NRS Numerical Rating Scale
PT Pain Threshold
SCI Spinal Cord Injury
SD Standard Deviation
TG Thermal Grill
TGI Thermal Grill Illusion
TGS Thermal Grill Stimulus
VAS Visual Analog Scale
WDT Warm Detection Threshold
Evaluation and Characterisation of the Thermal Grill apparatus for Spinal Cord Injury patients | 2011
x
List of Parameters
k thermal conductivity ( Watt/(mK) )
F variance of the group means / mean of the within group variances
p probability of obtaining a test statistic at least as extreme as the one that was
observed
2
discrepancy between the expected and observed number of times each outcome
occurs
Evaluation and Characterisation of the Thermal Grill apparatus for Spinal Cord Injury patients | 2011
1
Chapter 1
Introduction
“…despite the severity of chronic pain, often you have almost nothing to show for it
physically. And that makes treating pain really subjective.”
- Melanie Thernstrom ―The Pain Chronicles‖, August 2010
1.1 Motivation
The capacity to experience pain has a protective role. By contrast persistent pain
syndromes, as is often seen in spinal cord injury (SCI) patients offers no biological
advantage and often produces drastic impairments in the daily routine and quality of life
of these individuals [1]. This pain is frequently more debilitating than major motor
impairments, such as the inability to stand, walk, sit and grasp. It often leads to
depression, which in severe cases results in suicide [2].
The chronic pain syndromes develop within months following the SCI. As the pain
occurs due to the injury to the central nervous system this type of pain is referred to as
central neuropathic pain (CNP). On average, close to 30% of individuals with SCI
develop CNP following the injury. Typical clinical manifestations of CNP are sensory
loss and spontaneous pain such as burning, spontaneous and stimulus-evoked pain [3].
The functional impact of CNP following SCI is profound and is demonstrated by a study
which reported that 37% of the individuals with SCI who suffer from CNP would trade
pain relief for any chance of regaining motor function [4].
Evaluation and Characterisation of the Thermal Grill apparatus for Spinal Cord Injury patients | 2011
2
Currently, there is no treatment to prevent the development of neuropathic pain, nor to
adequately, predictably and specifically control established neuropathic pain. The aim of
treatment, thus far, is often just to help the patient cope by means of psychological or
occupational therapy, rather than eliminate the pain. Medications include opioids,
anticonvulsants, and adjuvants targeted at the CNS. However, the success of these
treatments is greatly limited by side effects, such as dizziness, sedation, coordination
problems, and dose dependence. Furthermore, opioids commonly result in only a 20-30%
reduction in pain intensity [5].
The development and validation of diagnostic clinical tools in the form of questionnaires
has undoubtedly been one of the most active and productive aspects of clinical research
on CNP in the last decade. However, these questionnaires fail to identify about 10 – 20%
of patients with clinically diagnosed neuropathic pain [6]. More importantly, these tools
provide little information about the causal lesion or disease and offer no framework for
the clinical management of pain and the assessment of the effects of various treatment
options [7, 8].
Etiology alone or the distribution and nature of the pain symptoms provide minimal
information on the mechanisms responsible for CNP [9]. Animal studies have identified a
number of nervous system abnormalities that produce symptoms similar to CNP in
humans. Unfortunately, it is difficult to translate the findings from animal studies into
simple tests that can be used in humans to identify the specific mechanism(s) that
produce each individual's CNP [10]. Hence, progress in management of CNP is
contingent on targeting underlying mechanism(s) of CNP in each individual, i.e.,
―mechanism-based‖ diagnosis and treatment.
Evaluation and Characterisation of the Thermal Grill apparatus for Spinal Cord Injury patients | 2011
3
1.2 Hypothesised cause of CNP
Research into the mechanism of neuropathic pain showed a distinct loss of thermal
sensibility in regions of neuropathic pain but failed to explain the reason behind this.
Craig [11] using non-invasive methods of psychophysical analysis, proposed that the
thermal sensation in regions of central neuropathic pain (CNP) may reflect similar central
nervous system (CNS) interaction between warm and cold sensory inputs that underlie
Thermal Grill Illusion (TGI). The TGI is a perception of burning pain in response to a
thermal stimulus in which innocuous cool (20°C) and innocuous warm (40°C) stimuli are
presented simultaneously, in an interlaced pattern. Craig hypothesized that the burning
pain felt by central pain patients is caused by the loss of cool inputs, which consequently
releases (or disinhibits) integrated polymodal nociceptive activity in the lamina I
pathways [12]. He further used evidence from neuro-imaging and animal studies to
support this ―thermosensory disinhibition‖ hypothesis. Additionally, it was shown that
the mechanisms underlying the TGI were pharmacologically distinguishable from those
underlying noxious thermal pain [13]. Based on the validity of his hypothesis, Craig
proposed the use of the Thermal Grill (TG) as an investigative tool to study the
mechanisms of central neuropathic pain and theorized that any agent that could be used to
block the TGI can in turn be used for alleviating neuropathic pain and that the absence of
the TGI would act as a diagnostic for CNP [14].
However, hitherto there is no standardized TG device or testing protocol to study CNP.
Thus, the purpose of this thesis is to aid in the development of a standardized TG and to
investigate the effects of different spatial and temporal configurations of the TG on the
perception of the TGI.
1.3 Roadmap of the Thesis
This document consists of seven chapters. Chapter 1 provides an overview of the
motivation and hypothesis behind the study. Chapter 2 contains relevant background
Evaluation and Characterisation of the Thermal Grill apparatus for Spinal Cord Injury patients | 2011
4
information for the study: aetiology of central neuropathic pain and the thermal grill
illusions as well as prior art. Chapter 3 describes the main objective of this research
study. Chapter 4 provides a detailed description of the study‘s methodology. It details the
apparatus design, involved design decisions, subjects and experimental design. Chapter 5
summarizes the experimental results and Chapter 6 discusses these results. Finally,
Chapter 7 concludes this study while highlighting the key findings.
Evaluation and Characterisation of the Thermal Grill apparatus for Spinal Cord Injury patients | 2011
5
Chapter 2
Background
2.1 Central Neuropathic Pain
According to the International Association for the Study of Pain, central neuropathic pain
(CNP) is defined as ―pain caused by a lesion or disease of the central somatosensory
nervous system‖ [15]. This includes all pain due to any lesion along the neuraxis
including: the dorsal horn, the ascending pathways throughout the spinal cord and brain
stem, the thalamus, the subcortical white matter, and the cerebral cortex.
The CNP symptoms can be divided into two broad categories based upon their
dependency on peripheral stimuli: 1) spontaneous pain - which occurs independently of
peripheral stimuli, may be persistent, and may be described as numbing, burning, cutting,
piercing or electric-like pain [16] and; 2) peripherally evoked pain - which occurs in
response to either normally non-noxious or noxious stimuli. Hyperalgesia, a stimulus-
dependent (evoked) pain, is an exaggerated response to a painful stimulus; allodynia, is
defined as pain evoked by a stimulus that is normally not considered painful [16]. An
example of hyperalgesia is when a small pinprick results in a sharp, stabbing pain. An
example of allodynia is when something as innocuous as the light touch of clothing is
painful and unbearable.
Identifying and diagnosing the specifics of someone's neuropathic pain requires a
thorough examination, including a history, physical and neurological evaluations [17]. A
history allows the physician to begin to pinpoint which parts of the body are affected
and what parts of the nervous system may be involved. In a neurological exam, the
investigator observes the response to various types of stimuli such as: light touch, cold,
Evaluation and Characterisation of the Thermal Grill apparatus for Spinal Cord Injury patients | 2011
6
heat, pressure and pin pricks. The response to stimulation of various body locations is
mapped out to determine the nature of the neurological deficits.
Currently neuropathic pain is treated mainly with medications. Anticonvulsants (seizure
medicines), antidepressants and anti-arrhythmics are categories of drugs commonly used
to combat neuropathic pain [18]. A completely different class of drugs, namely opioids
(or narcotics), are sometimes prescribed for CNP. Because of side effects as well as
perceived possible addiction issues, their use is still somewhat controversial. Patients
also often go through an intensive psychotherapy program to address issues of
despondency, depression and despair that may arise secondary to the long-lasting impact
of CNP [18].
2.2 Central Neuropathic Pain and Spinal Cord Injury
Among various medical diagnostic groups, the greatest prevalence of CNP is in those
with SCI [5]. Siddall et. al.[3] classified the types of pain seen after SCI. Within the
neuropathic group he classified the clinical presentation into three categories based on
location of the symptoms as follows; 1) above-level pain, which occurs at regions cranial
to the injury site; 2) at-level pain, which occurs in regions near the SCI, where pain is
often characterized as stabbing or is stimulus-independent; and 3) below-level pain,
which is localized to regions distal to the injury site and is often classified as a stimulus
independent, continuous burning pain [5]. CNP is either at-level or below-level
neuropathic pain. Classification of these pains can be further refined according to the
structure or pathology.
Historically, CNP has been classified only descriptively by the above mentioned
symptoms and CNS injury site/pathology, without a clear understanding of the specific
mechanisms underlying each person's pain [19]. However, animal studies have revealed
that multiple molecular and cellular nervous system mechanisms underlie each pain
symptom and many different mechanisms can produce the same pain symptom. A
Evaluation and Characterisation of the Thermal Grill apparatus for Spinal Cord Injury patients | 2011
7
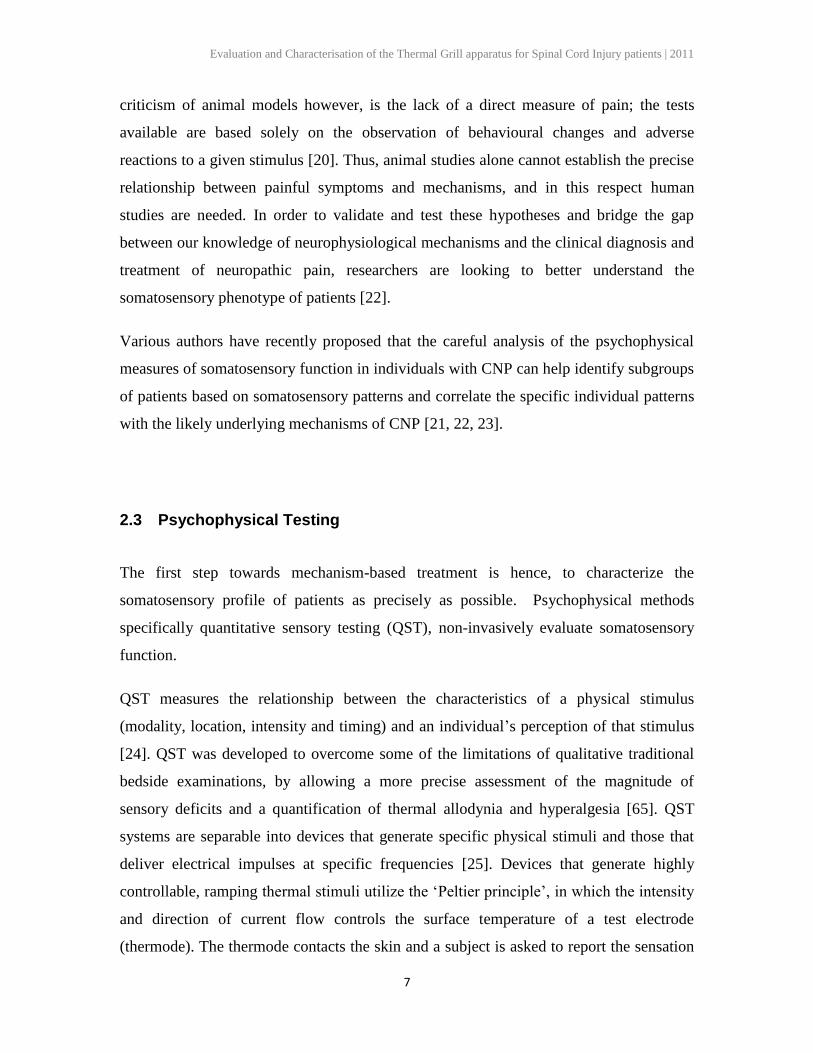
criticism of animal models however, is the lack of a direct measure of pain; the tests
available are based solely on the observation of behavioural changes and adverse
reactions to a given stimulus [20]. Thus, animal studies alone cannot establish the precise
relationship between painful symptoms and mechanisms, and in this respect human
studies are needed. In order to validate and test these hypotheses and bridge the gap
between our knowledge of neurophysiological mechanisms and the clinical diagnosis and
treatment of neuropathic pain, researchers are looking to better understand the
somatosensory phenotype of patients [22].
Various authors have recently proposed that the careful analysis of the psychophysical
measures of somatosensory function in individuals with CNP can help identify subgroups
of patients based on somatosensory patterns and correlate the specific individual patterns
with the likely underlying mechanisms of CNP [21, 22, 23].
2.3 Psychophysical Testing
The first step towards mechanism-based treatment is hence, to characterize the
somatosensory profile of patients as precisely as possible. Psychophysical methods
specifically quantitative sensory testing (QST), non-invasively evaluate somatosensory
function.
QST measures the relationship between the characteristics of a physical stimulus
(modality, location, intensity and timing) and an individual‘s perception of that stimulus
[24]. QST was developed to overcome some of the limitations of qualitative traditional
bedside examinations, by allowing a more precise assessment of the magnitude of
sensory deficits and a quantification of thermal allodynia and hyperalgesia [65]. QST
systems are separable into devices that generate specific physical stimuli and those that
deliver electrical impulses at specific frequencies [25]. Devices that generate highly
controllable, ramping thermal stimuli utilize the ‗Peltier principle‘, in which the intensity
and direction of current flow controls the surface temperature of a test electrode
(thermode). The thermode contacts the skin and a subject is asked to report the sensation
Evaluation and Characterisation of the Thermal Grill apparatus for Spinal Cord Injury patients | 2011
8
of temperature change or heat/cold pain. A technical challenge for QST is to deliver a
sensory stimulus and determine accurate and reproducible sensory thresholds in a
reasonable amount of time [24]. Tests for pain sensation have the additional challenge of
minimizing the number and duration of stimuli that are unpleasant to the patient.
Rolke et al. (2006) established a standardized protocol and age- and gender-matched
absolute and relative QST reference values from healthy subjects, across different body
parts. Recently, Backonja et al. (2009) using thermal QST tools, proposed a new
standardized protocol for the psychophysical testing of patients with NP. This protocol,
although an important first step towards the individualized characterization of
somatosensory profiles, is limited to the testing of sensory thresholds to a single type of
stimulus (for example warm, cold, or touch). Threshold testing of patients with SCI
revealed that CNP was only present in areas with impaired or absent heat pain sensibility
[26, 27], and was confined to areas of maximal thermal deficit [28]. Although Rolke‘s
protocol identified that the loss of thermosensation was a significant correlate of CNP, it
did not adequately characterize the relationship between the observed thermosensory
deficits and CNP.
Craig [14] used the Thermal Grill Illusion (TGI) as a psychophysical method to
understand the interaction between innocuous cold and warm cutaneous sensory inputs.
The TGI is an illusion of heat pain, that is often burning in nature, when a person‘s skin is
in contact with interlaced innocuous cool (20°C) and innocuous warm (40°C) stimuli
[29]. Craig proposed that the loss of thermal sensation in regions of CNP may reflect
similar CNS interaction between warm and cold sensory inputs that underlie the TGI..
The following section shall provide an in depth look at the hypothesized mechanism of
the TGI.
Evaluation and Characterisation of the Thermal Grill apparatus for Spinal Cord Injury patients | 2011
9
2.4 Thermal Grill Illusion
As described by Defrin [26], several hypotheses have been developed in an attempt to
explain the neural mechanisms that define different pain qualities. An early theory,
namely the ―pattern theory of pain‖, states that pain is signalled via non-specific channels
concerned with the conduction of both nociceptive and non-nociceptive events, and is
dependent on the degree of excitation of these channels [30, 31]. However, the
identification of specific receptor organs for detecting noxious stimuli in 1968 [32], led
scientists to discard this theory. A contradictory view, which was introduced by Muller,
and is better known as the ―labelled-line code‖, maintains that pain is processed via
dedicated pathways and that the excitation of a specific sensory receptor elicits the same
amount of pain regardless of the stimulus energy [33]. However, this view was
contradicted by the observation that neither damage nor stimulation of somatosensory
cortices affects pain, and that clinical stimulation of somatosensory thalamus can
alleviate chronic pain. A third view, proposed by Wall and McMahon (1986), states that
the perception of pain is due to the central integration of sensory information, including
information derived from the response of nociceptors. Work carried out by Defrin et al.
(2002), further supported this latter theory by showing that the quality of thermal pain is
determined by integration of information conveyed simultaneously by both dedicated
pain pathways and a non-nociceptive thermal pathway. In this perspective, an imbalance
or lesion in the thermosensory systems may contribute to CNP after SCI. Craig further
proposed that pain could be considered a ‗homeostatic emotion‘ and an aspect of
interoception or the physiological condition of the body [35].
The ascending neural activity that represents all physiological conditions of the body is
conveyed by the lamina-I spinothalamocortical pathway. Lamina-I, the most superficial
layer of the spinal dorsal horn, is the only neural region that receives monosynaptic input
from small-diameter (Aδ and C) primary afferent fibres [35], which innervate essentially
all tissues of the body. The Aδ- and C-type primary afferent fibers that are relayed by
lamina-I, transmit homeostatic information — specifically ‗pain and temperature‘
sensations — from all tissues.
Evaluation and Characterisation of the Thermal Grill apparatus for Spinal Cord Injury patients | 2011
10
There are two classes of neurons that signal sharp pain and burning pain, that selectively
receive inputs from Aδ-nociceptors and polymodal C-nociceptors (HPC), respectively. In
addition, there are two types of thermoreceptive lamina-I cell that respond selectively to
cooling or warming [36, 37].
Research indicates that the summated activation of lamina 1 HPC cells (noxious heat,
pinch and cold) causes a conscious perception of pain in humans and signal burning pain
at low temperatures (<15 ºC). The lamina-I (COOL) cells that are sensitive to cooling
respond predominantly to Aδ-fibre input and have ongoing discharge at normal skin
temperature that is inhibited by warming. They display a linearly increasing response at
temperatures below a neutral skin temperature (~34ºC) and reach a plateau at cold
temperatures in the noxious range (<15 ºC) [38].
Craig (2002) proposed that the illusion of thermal grill-induced burning pain, could be
explained by the relative activity between the spinothalamic thermal and nociceptive
channels (refer to Figure 2.1). The burning sensation caused by polymodal C-nociceptor
activation of HPC cells, is normally masked centrally by the cold sensitive Aδ-fibre
activation of COOL cells. When the activity of cooling receptors is reduced due to the
presence of interlaced warm stimuli in receptive field (as is the case in the TG stimulus),
the HPC activity that is evoked by cooling is disinhibited centrally and causes a burning
sensation at these temperatures that is normally felt only at noxious cold temperatures
[39]. The effect of the thermal grill stimulus is a relative balance of HPC and COOL cell
activity that is similar to the relative activation seen in response to a noxious cold
stimulus of ~10ºC; the equivalence of which has been verified psychophysically [12, 40].
Evaluation and Characterisation of the Thermal Grill apparatus for Spinal Cord Injury patients | 2011
11
Figure 2.1 Mechanism of the Thermal Grill Illusion. The burning pain sensation caused by
polymodal C-nociceptors (HPC), which are sensitive to noxious heat as well as to noxious cold, is
normally masked centrally by the activity of A -fibre thermoreceptors that are responsible for
cooling. When the activity of cooling receptors is reduced due to the presence of interlaced warm
stimuli, the HPC is disinhibited centrally and causes a burning sensation or the TGI (Figure
adapted from [14]).
2.5 TGI and Central Neuropathic Pain
Craig and Bushnell (1994) were the first to investigate the TGI in the context of the study
of pain, particularly CNP [14]. Craig speculated that the unmasking mechanism
underlying the TGI mirrors the patho-physiology of some neuropathic pain patients. A
majority of patients suffering from neuropathic pain due to SCI have dysfunctional
thermal sensibilities in which a dramatic loss of warm/cool temperature sensation is seen
in regions of ongoing pain [12]. Craig observed that this characteristic closely mimicked
the TGI, in which reduced warm/cool sensations are reported.
Based on electro-physiological recordings of spinal dorsal horn neurons in animals and
neuro-imaging (fMRI) studies in humans, Craig proposed the "thermosensory
disinhibition" hypothesis to explain the TGI and the burning pain. Namely, Craig
Evaluation and Characterisation of the Thermal Grill apparatus for Spinal Cord Injury patients | 2011
12
suggested that: 1) the paradoxical burning induced by the TG was due to the reduction of
the inhibition normally exerted by cold afferents on the nociceptive pathways in the
central nervous system; 2) in certain individuals, CNP may similarly reflect imbalanced
integration of pain and temperature; and 3) the TGI can be used to evaluate the
presence/absence of the central nervous system mechanism for cold-inhibition of pain.
A preliminary study of subjects with CNP, as a consequence of multiple sclerosis, further
supported Craig‘s hypothesis [41]. The patient in this study reported less pain in response
to the TGS than to the cool component (20 °C) itself. Furthermore, a study carried out on
a patient with complex regional pain syndrome-I (CRPS I) reported that the patient
experienced an intolerable burning sensation on her affected hand when it was placed on
the TG [42]. A study carried out by Kern et al. (2008) provided evidence that the central
mechanism underlying the TGI is pharmacologically distinguishable from the neural
mechanisms underlying both innocuous thermal sensations and noxious thermal
sensations. Kern found that the administration of morphine (known to suppress the
activity of lamina-I nociceptive neurons) produced correlated reductions in the pain
intensity reported in response to the TGS. If the hypothesis that the fundamental
dysfunction in CNP is the same mechanism that underlies the TGI holds true, then
any agent that blocks the TGI could be efficacious for alleviating CNP, and the
absence of the TGI effect would be diagnostic for CNP .
Craig further proposed the use of the TG as an investigative tool to examine the
mechanisms of pain. The TG has potential for further studying and understanding the
interactions between the thermal and nociceptive pathways. In particular, the TGI
imitates symptoms of CNP in healthy volunteers. Kern et al. (2008) similarly discussed
the potential of using the TG as a tool to uncover the physiological mechanisms and
impacts of analgesics on CNP.
Despite its potential value for studying pain mechanisms in humans, there are only few
studies that evaluated the psychophysical properties of the TGI or its application as an
investigative tool for patients with CNP [12, 43, 44, 45]. Furthermore, based on the above
evidence, it can be concluded that a standardised TG device is needed to advance
Evaluation and Characterisation of the Thermal Grill apparatus for Spinal Cord Injury patients | 2011
13
research in this area. The lack of research on the TGI may be attributed to the fact that
there is no commercially available or standardized TG device or standardized research
methodology [14].
2.6 Research Problem
2.6.1 Thermal Grill Devices
Existing TGs were created purely on an ad hoc basis for research purposes on healthy
subjects and vary in terms of design, size of thermal actuators, rates of temperature
change, range of temperatures and materials that couples skin and the thermal actuator, as
depicted in Table 2.1 [19, 43, 44, 45, 46, 47]. The existing diversity makes it difficult to
compare data obtained from different researchers and can negatively affect the results and
conclusions drawn from the studies.
Researcher Number of
Actuators
Actuator size Surface
Material
Sensation
produced
Manufacturer
Green [43] 4 x 4 0.64 cm2
Copper plate Non-painful heat
at mild temp
Pierce Laboratory
Bouhassira
[45]
1 x 6 (bars) 1.2 x 16 cm
(3 per bar)
Copper plate Painful sensation Seicer (France)
Defrin [26] 1 x 6 (pair
of)
3 x 3 cm Aluminum
plate
Painful sensation TSA 2001 –
Medoc
Fruhstorfer
[46]
1 x 6 35 x 8 x 0.8mm Bronze plate Non-painful heat In-house design
Leung [44] 1 x 10 0.75 x 10 cm Copper tubes Painful sensation In-house design
Alston [47] 2 cylinders 7.5 x 12 cm
0.5 mm (diam)
Brass
cylinders
Non-painful heat In-house design
Craig [19] 1 x 15
(bars)
20 x 14 cm Silver plate Painful sensation In-house design
Table 2.1 Comparative chart showing some of the previous thermal grill devices used in research.
A high degree of variation is seen in both the grill layout and actuator size.
Evaluation and Characterisation of the Thermal Grill apparatus for Spinal Cord Injury patients | 2011
14
2.6.2 Research Methodology
Leung et al. (2005) tested various combinations of innocuous temperatures (18/42°C,
20/40°C, 22/38°C, 24/36°C) in order to evaluate the potential of using the TG as a
research tool. They found that the subjects reported the most painful sensation for the
20/40°C and 18/42°C combinations. Bouhassira et al. (2005) showed that the frequency
and intensity of the painful sensation produced by the TG was directly related to the
magnitude of the difference in temperatures between the warm and cool bars. The
combination of increasingly colder temperature to a given warm temperature was shown
to induce similar effects as combining increasingly warmer temperature to a given cold
temperature. These results suggested that pain can be the result of a simple addition of
non-noxious warm and cold signals. Studies conducted by Li et al. (2009) using a 6x1
array TG, demonstrated that the occurrence of the TGI did not display a significant
dependence on gender. Research conducted by Dranga et al. (2008) in our laboratory,
investigated the effect of stimulus duration on the perception of the TGI. Dranga found
that at the 5 sec time point, the continuous pain ratings in response to the TGS were
significantly higher than those in response to the warm and cool stimuli alone [49]. Also,
at the 60 sec mark, the pain reported in response to the TGS was significantly higher than
that reported in response to the uniform stimuli.
To date, research on the TGI with relation to CNP has shown little consistency in terms
of methodology. Prior psychophysical testing of the TGI was limited to the distal upper
extremity, i.e., the palm and/or forearm. However, CNP can occur in any area of the
body, thus necessitating that the TG be adaptable for applications to any surface of the
body [21].
Li et al. (2009) using a thermal stimulation apparatus composed of six hollow brass bars
perfused with warm or cold water, tested twenty-one different stimuli applied to a group
of 19 healthy subjects on the glabrous skin of the palm and fingers. By using various
combinations of warm and cold bars and by alternating the number of bars in contact
with the skin, they showed that neither the distance between adjacent warm (40±1° C)
Evaluation and Characterisation of the Thermal Grill apparatus for Spinal Cord Injury patients | 2011
15
and cold (20±1° C) bars, nor the number of the stimulation bars (2 – 6) notably affected
the occurrence of the TGI.
Previous studies have also shown a huge variation in the method of application of the TG
stimulus. The original animal studies conducted by Craig (1994) used a dynamic
protocol; the temperature of the grill was varied to a set-point temperature while the
participant made contact with the grill. However, subsequent studies in humans have each
used different skin contact times and methods of application of TG such as: a) 3sec
(dynamic – The subject places his/her hand on the TG, at which point the grill was held at
an adaptation temperature for a period of 5min before being warmed/cooled at a rate of
±2.0º/s to a target temperature. After the target temperatures were reached in all
actuators, the desired temperatures were held for 3sec. The subject‘s skin was in
continuous contact with the thermal actuators) [43], b) 10sec (static – The subject‘s skin
contacted the actuators after they had been heated or cooled to the target temperature.
The fingers remained in contact with the grill for the entire duration of the 10sec long
experiment) [44] and c) 30 sec (static - The subject‘s skin contacted the actuators after
they had been heated or cooled to the target temperature, and stayed in contact with the
grill for the entire duration of the 30sec) [45]. Green and Pope (2003) reported that the
TGI is optimally perceived when thermal ramping and stimulation occur as the actuators
rest against the skin for the entire stimulation period (dynamic condition), i.e. no
simultaneous tactile contact, and TGI is infact greatly reduced by simultaneous cutaneous
tactile inputs i.e. contact suppression occurring when the subject places their hand on the
grill simultaneously as they first experience the TG stimulus (static condition).
Additionally, both Leung and Bouhassira (2005) noted that while using static testing
conditions, the quality and intensity of the sensation could change during the TG stimulus
and infact decreased with time.
As the TGI illusion can be simply produced by the simultaneous application of warm and
cool stimuli, a number of different patterns of these warm and cool stimuli can be
imagined, that can invoke the TGI. Figure 2.2 demonstrates this fact with the case of the
3x2 array TG used in this thesis.
Evaluation and Characterisation of the Thermal Grill apparatus for Spinal Cord Injury patients | 2011
16
Figure 2.2 Thermal Grill stimulation patterns. Six possible temperature configurations that
can be produced using a 3x2 TG array.
No research has been carried out to date, that examined the effect of different temperature
patterns on the TGI. Preliminary research carried out in our laboratory has shown that the
spatial distribution of warm and cool stimuli can significantly affect the perceived
intensity of the TGI [50].
Evaluation and Characterisation of the Thermal Grill apparatus for Spinal Cord Injury patients | 2011
17
Chapter 3
Research Objective
3.1 Objective
The goal of this thesis was to design the user interface and data acquisition system of a
prototype thermal grill device and to use it to further describe the TGI amongst healthy
subjects, while investigating the physiological factors which underlie this phenomenon.
In light of this goal, the following paragraphs outline the research objectives.
An important feature of the TG device was the ability to control the individual stimulus
elements and hence produce various thermal stimulus patterns. An aim of this thesis was
to explore this feature and help determine the best thermal element pattern and spacing
that could be used to elicit the TGI.
To evaluate the ramping functionality of the TG, a pilot study was designed to study the
effect of static vs. dynamic grill testing (i.e. w/o and w/ ramping) on the TGI.
This thesis also aimed to compare an individual‘s thermal thresholds using one vs. six
thermal actuators and hence investigate the relation between thermal thresholds and
stimulation area. A further objective was to design a pilot study to explore the relation
between the measured thermal thresholds and a subject‘s TG intensity ratings, using the
same stimulation area.
An objective of this thesis was to minimize any subject bias towards reporting the TGI as
painful, hence the study had to be designed such that subjects were, at no point instructed
that the sensation they would experience would be ‗painful‘. Rather subjects were simply
told to expect a unique sensation to the TG configurations and to rate the level of
Evaluation and Characterisation of the Thermal Grill apparatus for Spinal Cord Injury patients | 2011
18
unpleasantness. This is in contrast with prior research [11, 12, 27, 43, 62] that asked
subjects to specifically report and rate their sensations of pain.
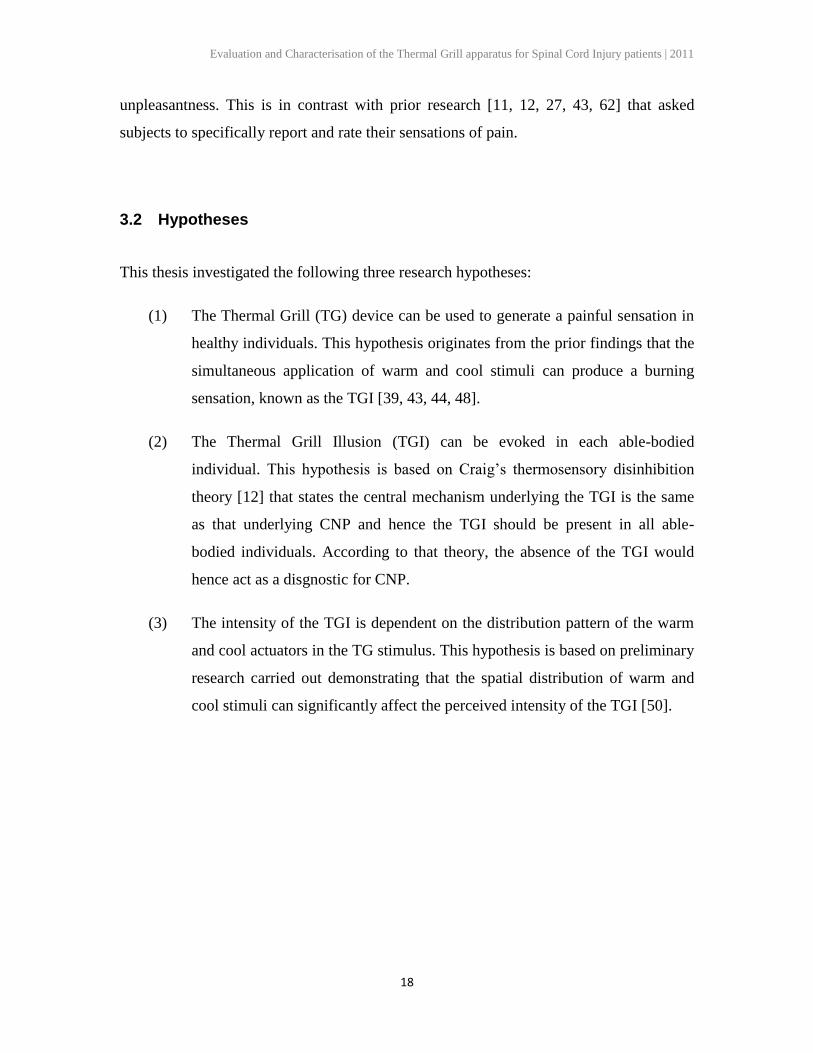
3.2 Hypotheses
This thesis investigated the following three research hypotheses:
(1) The Thermal Grill (TG) device can be used to generate a painful sensation in
healthy individuals. This hypothesis originates from the prior findings that the
simultaneous application of warm and cool stimuli can produce a burning
sensation, known as the TGI [39, 43, 44, 48].
(2) The Thermal Grill Illusion (TGI) can be evoked in each able-bodied
individual. This hypothesis is based on Craig‘s thermosensory disinhibition
theory [12] that states the central mechanism underlying the TGI is the same
as that underlying CNP and hence the TGI should be present in all able-
bodied individuals. According to that theory, the absence of the TGI would
hence act as a disgnostic for CNP.
(3) The intensity of the TGI is dependent on the distribution pattern of the warm
and cool actuators in the TG stimulus. This hypothesis is based on preliminary
research carried out demonstrating that the spatial distribution of warm and
cool stimuli can significantly affect the perceived intensity of the TGI [50].
Evaluation and Characterisation of the Thermal Grill apparatus for Spinal Cord Injury patients | 2011
19
Chapter 4
Methodology
This section will begin with a detailed overview of the Rehabilitation Engineering
Laboratory TG prototype, followed by a description of the experimentation protocol to be
used in order to meet each of the project objectives.
4.1 Thermal Grill Apparatus
To address the need for a standardized thermal grill, a custom designed prototype was
created by an external contractor (Oven Industries; Mechanicsburg, Philadelphia) in
affiliation with the Rehabilitation Engineering Laboratory (REL), to further study the
effects of the TGI. Oven Industries was primarily in charge of the mechanical design and
construction of the device, as well as the preliminary design of the control system for the
grill.
The major contributions made in the thesis towards the design of the TG device are
highlighted below:
(1) Creation of the requirements for the hardware design of the TG and the
subsequent testing of the device prototype to ensure that requirements were
met.
(2) Design of the user interface to facilitate easy use for users with little to no
technical background.
(3) Partial design of the control system to ensure reliable temperature control,
data acquisition, and recording of the subject‘s response.
Evaluation and Characterisation of the Thermal Grill apparatus for Spinal Cord Injury patients | 2011
20
4.1.1 Hardware Design
Requirements: The grill must contain a minimum of 6 individual square contact-
thermodes arranged in a 3x2 matrix to allow for testing of different temperature
patterns/configurations. Each element must be individually controlled to allow for a range
of stimuli between 0 to 50°C and must be capable of achieving a ramp rate of at least
1°C/s. Contact thermodes which will be in touch with the skin, should be composed of a
material that allows for maximal heat transfer and should not exceed 60mm x 60mm. The
spacing between the thermodes should be such so as to allow for no temperature leakage.
Each thermal element must be monitored by a thermistor for continuous temperature
feedback of the thermode-skin interface (resolution 0.6°C).
Methodology: Research shows that thermal detection thresholds and thermal pain
thresholds vary inversely with the amplitude and the duration of the stimulus, hence
making it important to maintain a constant thermode size in any comparative studies of
thermal thresholds [36]. Additionally, the ramp rate achievable by the peltier element is
dependent on the power rating and therefore the size of the element. Hence, a trade off
had to be made between the size and achievable ramp rates in order to meet the desired
specifications.
Recent studies conducted by Pavlakovic et al. also revealed that the choice of the material
that couples the skin and the thermal actuator, and hence the heat transfer capacity of the
coupling material, can highly influence a person‘s thermal sensory detection and thermal
pain detection thresholds [51]. Materials with high thermal conductivities (such as
aluminum: kAl = 250, copper: kCu = 401, and silver: kAg = 429) tend to transfer heat/cold
throughout their surface more evenly and more rapidly [52]. Table 2.1 displays the
coupling materials used for TG devices to date.
Auditory noise produced by the thermal stimulation device has also been shown to
significantly raise the heat pain and cold pain thresholds of the subject [53]. Hence, a
water circulating cooling unit, as opposed to a fan cooled unit, was chosen for the device
to minimize auditory noise.
Evaluation and Characterisation of the Thermal Grill apparatus for Spinal Cord Injury patients | 2011
21
Implementation: The TG device consists of a matrix of six thermal actuators or
thermoelectric modules (TEM), each measuring 50mm x 50mm (Figure 4.1). The
direction of current flow between the two surfaces of the TEM dictates its action as a heat
generator or a heat sink. Each TEM is individually capped by an aluminum tile
measuring 50.8mm x 50.8mm x 5mm.
Figure 4.1 Isometric 3-D view of the Thermal Grill Device used in this study (a) top view and
(b) bottom view
The thermal tiles are arranged in a 3x2 grid, thermally isolated from each other with an
inter-tile gap of 1.02mm, allowing for a 61cm2 flat testing platform (Figure 4.2). The tiles
are placed atop of a water-circulating heat sink to ensure rapid temperature shifts, thus
allowing an operating surface temperature between 0 to 50°C.
Figure 4.2 Mechanical drawing of the Thermal Grill device developed by Oven Industries in
collaboration with REL.A1, A2, B1, B2, C1 and C2 represent the array tiles.
Evaluation and Characterisation of the Thermal Grill apparatus for Spinal Cord Injury patients | 2011
22
Each array tile is individually monitored by a class ―T‖, 15 kΩ thermistor (TS-67, Oven
Industries, USA) embedded in the aluminum cap, 1.9cm below the surface of the grill, for
continuous temperature feedback of the tile-skin interface (resolution ±0.5°C). This
temperature measurement is then used by a closed-loop proportional-derivative-integral
(PID) controller to regulate tile temperature in real-time [54]. The tiles have dedicated
controllers enabling the experimenter to define a programmable temperature profile for
ramping or a steady-state temperature for each tile individually.
The box housing the array tiles has connectors allowing for easy connect/disconnect from
the cooling unit and control modules.
Evaluation: The device was evaluated in terms of its: a) accuracy of thermistor readings;
b) disturbance rejection to touch, i.e., heat perturbation; and c) accuracy of ramp rates.
To assess the accuracy of the thermistor readings, the individual tiles were set to a range
of temperatures from 0 - 50°C and the thermistor readings of the individual tiles were
compared to those obtained using an external thermocouple monitoring device (Omega
HH21A monitor with Thermocouple MQSS series exposed probe - 0.25mm diameter,
Omega Technologies, Stanford, USA). The temperature was measured on the surface of
the tile both at the centre of the tile and on the perimeter. The accuracy of the TG‘s
thermistor readings at both locations (tile centre and perimeter) were found to be within
the range of ±0.2°C; well within the specified limits.
The disturbance rejection of the system is a measure of how well the system overcomes
perturbation caused by skin contact with the thermal tiles. A tile temperature of 0°C
would ensure the maximum temperature differential between the tile surface and the
user‘s skin (32-36°C), and is thus used to measure the worst case disturbance rejection
behaviour of the system. Figure 4.3 demonstrates that at a set-point temperature of 0°C,
contact of the subject‘s forearm with the tile surface causes a 0.4°C spike in temperature
for a period of 10 sec before returning to steady state temperature. This falls well within
Evaluation and Characterisation of the Thermal Grill apparatus for Spinal Cord Injury patients | 2011
23
the requirements for the TG to control temperature within ±1° C (i.e., (40±1° C) and
(20±1° C)).
Figure 4.3 Disturbance rejection of the device at 0°C. At a set-point temperature of 0C, tactile
contact with the tile surface causes a 0.4C spike in temperature for a period of 10 sec. Red arrow
indicates the time when the contact with the tile occured.
The accuracy of ramp rate was verified by measuring the time taken by the tiles to reach
and stabilise at the set temperature using a given ramp rate. The device was found to
function well under ramp rates of 0.5 to 4°C/s. At higher ramp rates (approximately 5 -
15°C/s), an overshoot in reaching the desired temperature was seen as the PID controller
had to increase the current flow to the peltiers. For the purpose of this thesis, only ramp
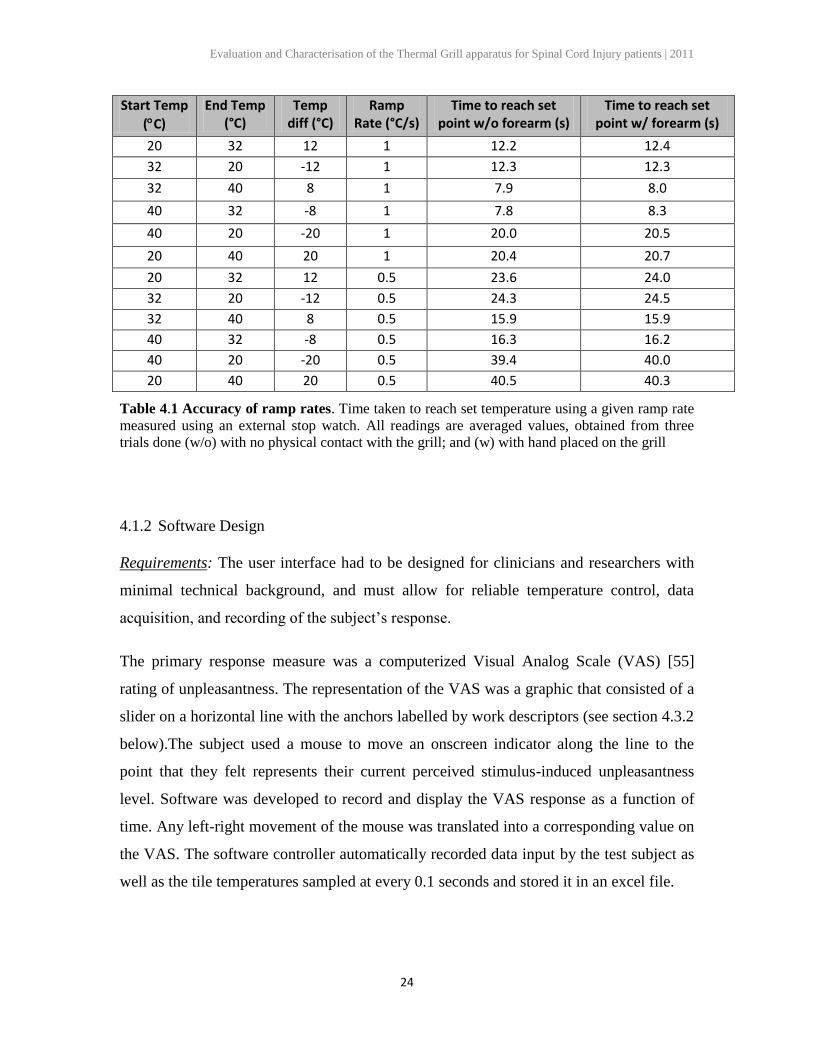
rates of 0.5 and 1.0°C/s were used. Table 4.1 demonstrates the measured accuracy of
these ramp rates.
Evaluation and Characterisation of the Thermal Grill apparatus for Spinal Cord Injury patients | 2011
24
Start Temp
(C)
End Temp (°C)
Temp diff (°C)
Ramp Rate (°C/s)
Time to reach set point w/o forearm (s)
Time to reach set point w/ forearm (s)
20 32 12 1 12.2 12.4
32 20 -12 1 12.3 12.3
32 40 8 1 7.9 8.0
40 32 -8 1 7.8 8.3
40 20 -20 1 20.0 20.5
20 40 20 1 20.4 20.7
20 32 12 0.5 23.6 24.0
32 20 -12 0.5 24.3 24.5
32 40 8 0.5 15.9 15.9
40 32 -8 0.5 16.3 16.2
40 20 -20 0.5 39.4 40.0
20 40 20 0.5 40.5 40.3
Table 4.1 Accuracy of ramp rates. Time taken to reach set temperature using a given ramp rate
measured using an external stop watch. All readings are averaged values, obtained from three
trials done (w/o) with no physical contact with the grill; and (w) with hand placed on the grill
4.1.2 Software Design
Requirements: The user interface had to be designed for clinicians and researchers with
minimal technical background, and must allow for reliable temperature control, data
acquisition, and recording of the subject‘s response.
The primary response measure was a computerized Visual Analog Scale (VAS) [55]
rating of unpleasantness. The representation of the VAS was a graphic that consisted of a
slider on a horizontal line with the anchors labelled by work descriptors (see section 4.3.2
below).The subject used a mouse to move an onscreen indicator along the line to the
point that they felt represents their current perceived stimulus-induced unpleasantness
level. Software was developed to record and display the VAS response as a function of
time. Any left-right movement of the mouse was translated into a corresponding value on
the VAS. The software controller automatically recorded data input by the test subject as
well as the tile temperatures sampled at every 0.1 seconds and stored it in an excel file.
Evaluation and Characterisation of the Thermal Grill apparatus for Spinal Cord Injury patients | 2011
25
Additionally checks were required to be placed within the software to ensure the safety of
the subject being tested and to prevent any overshoot in temperature beyond threshold
limits.
A further requirement of the interface design was that the subject should have no prior
knowledge of the grill configuration that he/she is being tested with, in order to remove
any form of bias from the feedback.
Methodology: The user interface was designed by taking the following facets of user
interaction into account [56]:
Functionality Design – The functionality as far as relevant to the user, including
actions and objects required by the system to accomplish the goals of the project and
satisfy the potential needs of the users.
Dialog Design – Structure of the interface without any reference to presentational
aspects i.e. the navigational structure and dynamic behaviour of the interface. Dialog
design aspects such as suitability of design for the specified task, self-descriptiveness,
conformity with user expectations, etc.
Presentation Design – The actual representation of the user interface including details
such as layout, colors, sizes, and typefaces.
To increase usability, the functionality and hence design requirements of the system
needed to be well defined in order to support the TG experiment methodology tasks in
the most optimal manner. Checks had to be put in, to ensure patient safety where
appropriate. Besides defining the major components of the user interface in terms of
functionality, the dynamics of the user interface (i.e. user interaction with the system)
needed to be specified as well. For example, clicking on the screen to indicate a pain
threshold had to stop the temperature ramping of the thermode and bring the thermode
back to adaptation temperature.
The design had to take into consideration all aspects of the user‘s interaction with the
system including the amount of mental strain that the design has on the user. Pre-set
Evaluation and Characterisation of the Thermal Grill apparatus for Spinal Cord Injury patients | 2011
26
configurations and choices pertaining to the task at hand were included in the interface to
reduce the amount of mental load on the user [56].
Implementation: The user interface and data acquisition system of the device were
designed using LabView software (National Instruments ™, v 9.0 (2009), Texas, USA).
The display was split so that the subject was only allowed to see his VAS rating while the
research coordinator had display of the temperature control, data acquisition, real time
temperature and the subject‘s feedback. Additionally the grill configurations were tested
in a randomised order. This ensured that the user had no prior knowledge of the grill
configuration being chosen by the research coordinator for testing.
The user interface was divided into three modes of testing: Static, Dynamic and
Threshold Testing, that mimicked the modes of testing commonly used by clinicians and
researchers for TGI studies.
The Method of Limits methodology [57] was used for sensory threshold testing. The
temperature of the TG tiles was simultaneously increased/decreased at a constant,
researcher defined, ramp rate. The subject was instructed to terminate the ramp by
clicking down at any point of the screen, at the moment the requested sensation was
perceived. This simple push-button response by the subject was also recorded by the
computer and completed each cycle of the examination.
For TG testing, i.e. static and dynamic grill modes, pre-set grill configurations were
delivered, upon the researcher‘s choice. Both the ramp rate and the trial duration were
also defined by the researcher. There were two modes of application, termed ―static‖ and
―dynamic‖. For the current study ―static mode‖ was defined as follows: the thermal
actuators were set to a predetermined temperature configuration before stimulus
application. While the actuator was in contact with the subject, temperatures remained
constant. In contrast, the ―dynamic mode‖ was defined as follows: the thermal actuators
set to the reference adaptation temperature (30°C), and then applied to the subject.
Temperature change from adaption temperature to target temperature was initiated after
Evaluation and Characterisation of the Thermal Grill apparatus for Spinal Cord Injury patients | 2011
27
contact with the skin. Temperatures then remained constant after the target temperature
was achieved.
A LED indicator was turned on to indicate when the subject should place his/her forearm
on the TG when testing in the dynamic or threshold testing mode.
The TG thermodes could be selectively powered on/off thus providing the option to use
the grill in different configurations, for example as a 2 x 3 array or a 2 x 2 array.
A computerised VAS scale displayed on the subject‘s screen, allowed for real-time
capture of the subject‘s response to the TG stimulus. The subject‘s response was also
simultaneously displayed on the researcher coordinator‘s screen. Time stamped data was
automatically stored in a user defined excel file every 0.1 seconds. The user interface
(UI) was programmed to have the VAS scale automatically zeroed at the start of the
experiment. This helped eliminate the initial spike in VAS recording that may arise if the
mouse was not properly zeroed (i.e., far left of the screen).
Continuous graphical and numerical feedback of the thermodes temperatures was
displayed to the research coordinator in real time to allow proper monitoring of the
device (refer to Appendix A).
An adaptation temperature of 30°C was pre-programmed into the grill. Before each trial,
the grill automatically defaulted to this adaptation temperature for a period of 10 sec, thus
ensuring that the subject‘s skin was kept at the same temperature before each thermal
stimulus.
Evaluation: The device was evaluated in terms of: a) the time lag between user response
and data acquisition; and b) the response time to subject feedback.
The lag in the data acquisition system was defined as the delay from the point at which
the user clicks the mouse to the capturing of data (tile temperature values) by the data
acquisition system. Since the mouse used was a USB connected device, this lag was the
summation of the Windows USB polling lag (8ms) and the Data Acquisition system
Evaluation and Characterisation of the Thermal Grill apparatus for Spinal Cord Injury patients | 2011
28
sampling rate (100msec) [58]. This lag could be considered negligible for the purpose of
this study as it was significantly below the average user response time (2.0 ± 0.5 sec)
[48].
To ensure that the grill temperature did not exceed the subject‘s pain threshold during
testing, the response time of the software to subject’s feedback during thermal testing was
monitored by an external timer. This was measured as the time between the subject
clicking down on the mouse to indicate a threshold and the instant temperature ramping
stopped and the tiles returned to adaptation temperature. This interval was calculated to
be ±0.1 s and the maximal temperature increase/decrease after the threshold indication,
was measured to be 0.2°C. Please refer to Appendix C, Thermal Grill User Manual, for a
detailed overview of the device operation and user interface.
4.2 Subjects
Eighteen participants were recruited through advertisements posted throughout the St.
George campus of the University of Toronto. Candidates were screened by telephone to
assess eligibility. Individuals were included if they were male, between 20-40 years of
age, generally healthy, and fluent English-speakers. Participants were asked to refrain
from consuming caffeinated products for 3 hours before testing. Exclusion criteria
included individuals suffering from or having previously suffered from any of the
following diseases or symptoms:
Systemic or neurological disease
Psychiatric disorders
History of diabetes or any other disease that can affect the peripheral nerve
function
History of chronic pain
Any skin disease, hypersensitivity or contact allergies
Experiencing any pain prior to the experiment.
Evaluation and Characterisation of the Thermal Grill apparatus for Spinal Cord Injury patients | 2011
29
4.3 Experimental Procedure
To maintain consistency between subjects and between multiple experimental runs,
testing was performed in a quiet room with the temperature maintained at 23 ± 1°C.
Further, to limit inter-subject variability in data, only the forearm of the non-dominant
side of the subject was used for testing, as demonstrated in Figure 4.4. Dominance was
determined by the Edinburgh Laterality Quotient score [67] a measurement scale used to
assess the dominance of a person's right or left hand in everyday activities. The choice of
non-dominant side for testing was dictated by the fact that this allowed the subjects to use
their dominant hand to indicate their response to testing. The participants were instructed
to place their anterior forearm in contact with the TG.
Figure 4.4 Body site tested using the TG device. The non-dominant anterior forearm, was used
for testing.
During all experiments, the participant was asked to apply only enough pressure to ensure
full contact with the TG tiles. Before each stimulus, the tile was set back to the adaptation
temperature (30°C).
Participation entailed a single testing session, which lasted approximately two hours with
twenty 30sec test conditions as follows: a warm stimulus (all tiles set to 40°C - Figure
4.5.a); a cool stimulus (all tiles set to 20°C –Figure 4.5.b); and the thermal grill
configurations (patterns of tiles set to interlaced temperatures of 40 and 20°C– Figures
4.5.c, 4.5.d and 4.5.e). The order of presentation of the test conditions was randomly
assigned based on a computer generated sequence.
Evaluation and Characterisation of the Thermal Grill apparatus for Spinal Cord Injury patients | 2011
30
The duration of stimulation was chosen based on pilot experiments conducted by
Bouhassira et al. (2005) which indicated that for forearm stimulation a duration of upto
20 – 30 seconds (depending on the combinations of temperatures), was necessary for
stabilization of the sensation.
The choice of temperatures was based on the results from past studies, which indicated
that the combination of 20 and 40°C effectively elicited a painful TGI amongst most of
the participants [12, 44, 45, 59]. Additionally, these temperatures are outside the range of
nociceptor activation and were thus appropriate for TG testing.
4.3.1 Pre-Testing
Prior to the experiment, each participant was asked to read, understand, and sign a
consent form. Participants were informed that the purpose of the study was ―to evaluate
the range of responses to the TGI amongst a group of healthy individuals‖. Participants
were not informed about the quality of the sensation that they would experience ensuring
no pre-disposition to reporting a painful sensation. The research coordinator then
explained the procedure of the experiment and the different testing conditions that would
be used. Please refer to Appendix D for the detailed study script.
4.3.2 Participant Feedback
A computer-driven visual analog scale (VAS) (see section 4.1.2) was used to
continuously sample the participant‘s current perceived unpleasantness of the TG thermal
stimulus. Participants were requested to move a linear, mouse-driven scale, displayed on
the monitor, to register their unpleasantness rating; with the leftmost point being
described as ‗not unpleasant‘ (VAS value of 0) and the rightmost point described as
‗most unpleasant‘ (VAS value of 10). To ensure the validity of the VAS across
Evaluation and Characterisation of the Thermal Grill apparatus for Spinal Cord Injury patients | 2011
31
individuals, subjects were asked to relate the anchor points to ‗the least unpleasant
sensation imaginable‘ and ‗the most unpleasant imaginable‘.
During stimulus application, the participants were asked to verbally report on the primary
sensation felt at 10sec and 30 sec intervals (Figure 4.6) from the instant that the stimulus
was initiated.
At the end of a trial for each test condition, participants were asked to pick a word(s) out
of a list of descriptors (refer to Appendix B) that best described the overall sensation
evoked by the grill.
4.3.3 Determination of Thermal Thresholds
4.3.3.1 Uniform thermal stimulus
Thermal threshold testing was conducted on the subject‘s forearm in the following order:
cold detection threshold (CDT), warm detection threshold (WDT), cold pain threshold
(CPT), and heat pain threshold (HPT). The method of limits protocol described by
Yarnitsky et al (1995) was used to determine thermal thresholds.
Two sizes of stimulus applications were used; one tile, or all six tiles. In this procedure,
the temperature of one or all six TG tiles were first maintained at adaptation temperature
(30°C) and were then decreased/increased at a rate of 1°C/s for cold and heat pain
thresholds (CPT and HPT) respectively, and by 0.5°C/s for cold and warm detection
threshold (CDT and WDT). The participant was asked to signal the reach of a threshold
by clicking on a computer mouse, at which point the temperature on the tiles stopped
ramping, reversed the direction of temperature change, and returned to the pre-configured
adaptation temperature.
Three trials were run to measure each of the thresholds, with a minimum inter-trial
interval of 30sec between the determination of detection thresholds and 60sec between
the determination of pain thresholds (PTs).
Evaluation and Characterisation of the Thermal Grill apparatus for Spinal Cord Injury patients | 2011
32
4.3.3.1 Thermal grill stimulus
The threshold testing protocol when all six tiles were active in grill mode (i.e. interlaced
warm and cool configurations) required the participant to click on three separate buttons
on the screen to indicate their CDT, WDT and PTs. Three consecutive trials were run for
each of the three grill stimulus configurations. The results from the consecutive runs for
each configuration were averaged together to determine the thresholds for that
configuration.
4.3.4 Evaluation of optimal grill configurations
In order to identify the optimal stimulation pattern of the TG, individual tiles were set to
warm or cool temperatures in various patterns.
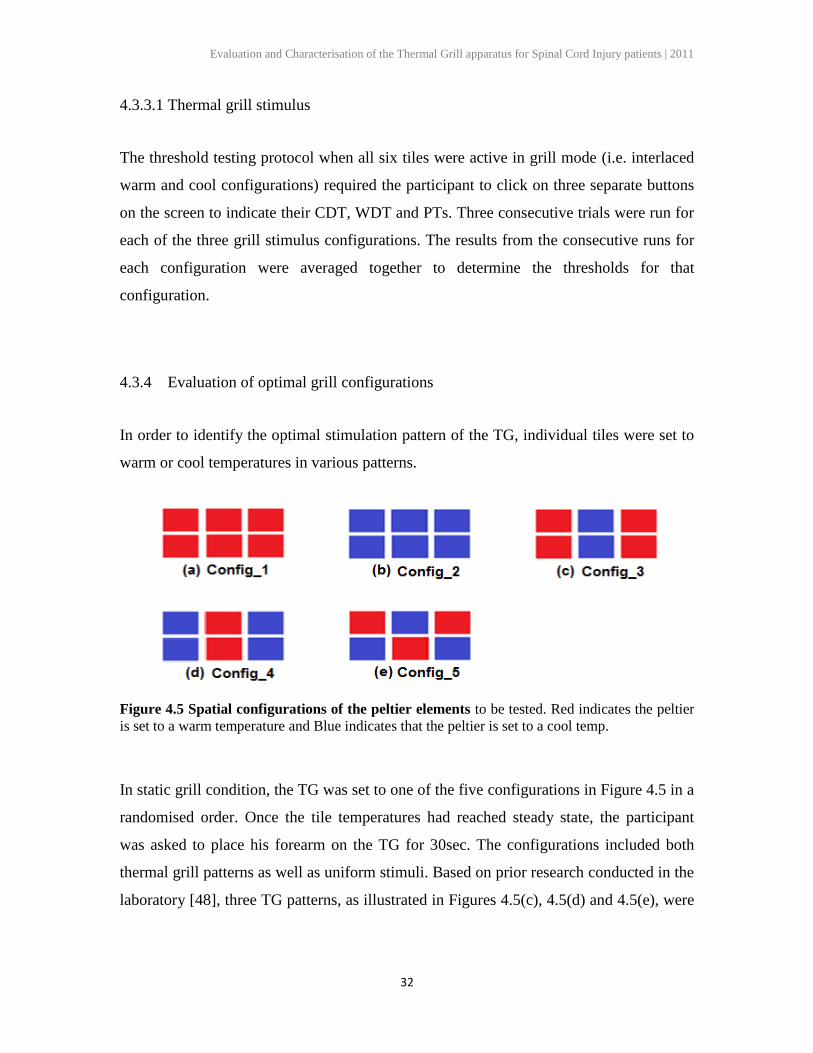
Figure 4.5 Spatial configurations of the peltier elements to be tested. Red indicates the peltier
is set to a warm temperature and Blue indicates that the peltier is set to a cool temp.
In static grill condition, the TG was set to one of the five configurations in Figure 4.5 in a
randomised order. Once the tile temperatures had reached steady state, the participant
was asked to place his forearm on the TG for 30sec. The configurations included both
thermal grill patterns as well as uniform stimuli. Based on prior research conducted in the
laboratory [48], three TG patterns, as illustrated in Figures 4.5(c), 4.5(d) and 4.5(e), were
Evaluation and Characterisation of the Thermal Grill apparatus for Spinal Cord Injury patients | 2011
33
chosen to be tested in order to determine the best thermal element pattern that can be used
to elicit the TGI.
Each of the above thermal configurations was run twice. During the first run, the
participant was asked to provide his verbal feedback on the thermal grill sensation.
During the second run, the participant was asked to use the online VAS to continuously
rate the intensity of unpleasantness he was experiencing in response to the stimulus. This
breakup of the experimentation methodology in two separate runs allowed the participant
to devote his complete attention to the continuous VAS rating by eliminating the
simultaneous need for verbal descriptors. At the end of each VAS run, the participant was
asked to pick his overall sensation from a list of descriptors. Figure 4.6 represents the
order of presentation of stimuli during static and dynamic testing trials.
Figure 4.6 Static and Dynamic testing procedure. Each TG configuration was tested twice. In
the first run the subject responded using a questionnaire and the online VAS. In the second run,
the subject verbally described his sensation at the 10 and 30sec mark.
4.3.5 Evaluation of dynamic thermal grill
In the dynamic grill condition, the participant was asked to place his forearm on the grill
and the grill was maintained at an adaptation temperature of 30°C for a duration of 60sec,
Evaluation and Characterisation of the Thermal Grill apparatus for Spinal Cord Injury patients | 2011
34
after which the tiles began ramping (1C/sec) until they reached the set-point
temperature. This temperature was held for a duration of 30sec with the participant‘s
forearm being in contact with the grill throughout the process. The thermal configurations
chosen for thermal testing were the same as shown in Figure 4.5, and were administered
in a randomised order.
There were two runs for each thermal configuration. During the first run, the participants
used the online VAS to dynamically rate the level of unpleasantness felt during the 30sec
testing period (Figure 4.6). In the second run, participants were asked to provide verbal
descriptors of the primary sensation of the stimulus.
4.3.6 Order of Presentation
Table 4.2 depicts the order of execution of the study. The order in which the five thermal
grill patterns were tested was randomized. A minimum 1 minute rest period was given
between each TG stimulus for static and dynamic testing.
Table 4.2 Order of presentation of stimuli. Patterns 1,2,3,4,5 represent the grill configurations
shown in Figure 4.5 that were used for testing. The order of the configurations will be randomly
assigned based on a computer generated randomised sequence.
Threshold
Testing
(Single
Tile)
Threshold
Testing
(Six Tiles)
Static Grill
Testing
Dynamic Grill
Testing
C
D
T
W
D
T
C
P
T
H
P
T
PT + DT VAS Descrip. VAS Descrip.
Pattern 1 2 3 4 5 1 2 3 4 5 1 2 3 4 5 1 2 3 4 5 1 2 3 4 5
Evaluation and Characterisation of the Thermal Grill apparatus for Spinal Cord Injury patients | 2011
35
Chapter 5
Results
5.1 Subjects
Eighteen young men (mean age of participants was 25 years (SD = 2)) participated in the
study. The majority of participants were right-handed (n = 16).
5.2 Thermal Thresholds – Spatial Characteristics
The CDT, WDT, CPT and HPT were measured on the forearm on the subjects with one
thermode and with all six thermodes, to study the spatial properties of temperature
thresholds. The temperature of the tiles was ramped up/down from a baseline temperature
of 30C until the subject indicated a threshold was reached. Both pain thresholds and
detection thresholds measured with a single thermode were significantly higher than
those measured with six adjacent thermodes (One-way ANOVA; p ≤ 0.05, in all four
cases i.e. CPT (p = 0.05), CDT (p < 0.001), HPT (p = 0.011) and WDT (p < 0.001). The
decrease in thresholds with the increase in stimulation area indicates the presence of
spatial summation of thermal stimuli. Figure 5.1 presents the group pain thresholds and
detection thresholds measured with both one and all six thermodes.
Evaluation and Characterisation of the Thermal Grill apparatus for Spinal Cord Injury patients | 2011
36
Figure 5.1 Thermal thresholds of the forearm. Box-plots of the Cold Detection threshold
(CDT), Cold Pain threshold (CPT), Warm Detection threshold (WDT), and Heat Pain threshold
(HPT) are depicted for both one (_1) and six (_6) tiles. The bottom, middle, and top lines of the
box represent the 25th, 50
th, and 75
th percentile value, respectively. The whiskers represent the
minimum and maximum values.
5.3 Pain Elicited by the TG
The thermal grill Pain Threshold was measured in subjects as the temperature differential
of the thermodes in each of the TG configurations (starting from a baseline temperature)
that induced the sensation of pain (using a ramp rate of 1C/s). Only 4 subjects (22.2%)
reported pain thresholds to the TGS before the TG boundary temperatures i.e. 20C for
the cool stimuli and 40C for the warm stimuli, were reached. The average temperature
differential of the TGS required to elicit pain in these four subjects was found to be
11.94C (SD = 1.05).
In 5 out of the remaining 16 subjects who did not indicate pain to the 20/40 TGS, the
thermal grill Pain Threshold was measured by allowing the temperature of the tiles to
exceed the 20C and 40C boundary temperatures. In this case tiles were ramped from a
baseline temperature upto a cool stimulus temperature of 0C and a warm stimulus
TEM
PER
ATU
RE
Evaluation and Characterisation of the Thermal Grill apparatus for Spinal Cord Injury patients | 2011
37
temperature of 50C, or until a subject indicated their pain threshold had been reached.
The average temperature differential of the TGS required to elicit pain in the five subjects
was found to be 29.26C (SD = 3.98).
The inter-configuration difference in thermal grill pain thresholds as measured above was
not found to be significant. The thermal grill pain thresholds were further examined in
relation to the subject‘s thermal pain thresholds (i.e. the HPT and CPT). A significant
correlation (Spearman‘s correlation: = 1.00, p < 0.001) was found between the subjects
thermal grill pain thresholds (averaged between the three thermal configurations tested
for each subject) and the differential between their thermal pain thresholds (HPT – CPT)
i.e. subjects with a low HPT and low CPT were found to have a lower threshold to the
TG stimulus, and vice versa.
5.4 Static vs. Dynamic thermal testing Intensity Ratings
The maximum pain intensity ratings recorded using the visual analog scale were analysed
by performing a Paired t-test (within-subject factor: stimulus type). The effect of static
TG condition was found to be significant when measured at the 5sec mark (Figure 5.2).
The maximum reported pain ratings were significantly higher in the dynamic testing
condition than in the static testing condition at the time point (Config_1: F= 17.0, p =
.003, Config_2: F = 17.0, p = .001, Config_3: F = 17.0, p = .005, Config_4: F = 17.0, p<
.001, Config_5: F = 17.0, p = .031). However, at 30sec, the difference between the
unpleasantness ratings for static and dynamic grill condition were not found to be
significant (p > 0.05). Figure 5.2 compares average pain intensity ratings recorded using
the VAS under conditions of static versus dynamic grill contact. The time variation of the
VAS ratings was also examined in relation to the TG configurations.
Evaluation and Characterisation of the Thermal Grill apparatus for Spinal Cord Injury patients | 2011
38
Figure 5.2 Graphs of the continuous unpleasantness ratings in response to the five thermal
stimuli applied in (a) dynamic and (b) static mode. Using an on-line VAS (0-10), a rating was
obtained every 100ms.The line graphs depict the continuous rating of pain over 30 s, averaged
across the 18 participants. By the 5s mark, the unpleasantness intensity ratings in response to the
dynamic stimulus were significantly higher than the static condition in all five configurations (p<
0.05). At 30 s, the difference between the unpleasantness ratings for static and dynamic grill
condition were not found to be significant (p> 0.05).
The frequency of ―painful‖ or ―burning‖ reports for the dynamic TGS was significantly
more than those for the static stimuli (p < 0.001). Additionally, when comparing the static
and dynamic testing conditions, the percentage of participants reporting nociceptive
sensations to the grill configurations was found to decrease to a greater extent for the
uniform thermal configurations than the TG configurations (p < 0.05), as shown in Figure
5.3.
5.5 Grill Configurations and TG intensity rating
Of the 18 subjects, 15 reported pain and/or unpleasantness (when asked to orally describe
the sensation) in response to the TGS (83.3%). Subjects were significantly more likely to
report pain in response to the thermal grill configurations than the uniform warm and cool
stimuli (Wilcoxon test; Z = -2.828, p = 0.005 for warm vs. TGS and Z = -2.00, p = 0.046
for cool vs. TGS) as demonstrated in Figure 5.3. However, no statistically significant
difference was seen in the average or maximum unpleasantness intensity VAS ratings
Evaluation and Characterisation of the Thermal Grill apparatus for Spinal Cord Injury patients | 2011
39
reported by subjects between different grill configurations (One-way ANOVA; F =
0.380, p = 0.822 for dynamic condition and F = 0.909, p = 0.463 for static condition) and
between the TGS and uniform stimuli (warm vs. TGS; F = 1.576, p = 0.218 and cool vs.
TGS; F = 0.001, p = 0.980). Figure 5.4 graphs the average and maximum VAS scores for
each configuration in static and dynamic conditions.
Figure 5.3 Percentage of „burning‟ descriptors used between uniform and TG
configurations. Subjects were significantly more likely to report burning sensation or pain in
response to the thermal grill configurations than the uniform warm and cool stimuli in both static
and dynamic testing conditions.
STATIC
0
10
20
30
40
50
All Warm All Cool TGS
Percen
tag
e o
f p
arti
cip
an
ts
rep
orti
ng
th
e s
en
sati
on
as
'Bu
rn
ing
'
DYNAMIC
0
10
20
30
40
50
All Warm All Cool TGS
Percen
tag
e o
f p
arti
cip
an
ts
rep
orti
ng
th
e s
en
sati
on
as
'Bu
rn
ing
'
Evaluation and Characterisation of the Thermal Grill apparatus for Spinal Cord Injury patients | 2011
40
Figure 5.4 Box plots indicating VAS ratings between different configurations.No significant
difference was seen in (a) average VAS ratings and (b) maximum VAS ratings obtained across
subjects over 60s stimulus duration.
The time variation of the VAS ratings was also examined in relation to the TG
configurations. At the 5sec time point, the continuous unpleasantness ratings in response
to the TGS were significantly higher than those recorded at the thirty second time point
(Config_3: 2=18.669, p < 0.001; Config_4: 2=20.086, p < 0.001; Config_5:
2=26.525, p < 0.001).
Evaluation and Characterisation of the Thermal Grill apparatus for Spinal Cord Injury patients | 2011
41
5.6 Thermal Quality and Characteristics of the TGI
In 49.07% of the TG runs, subjects characterised the sensation as being ―burning‖ or
―painful‖ in nature. The use of these nociceptive descriptors (such as ‗burning‘ or
‗painful‘) were significantly more in the case of TGS than for uniform stimuli (Binomial
test: Z = 0.50, p = .002). Subjects who reported pain and/or unpleasantness to one or
more of the TGS were termed ―responders‖. Conversely, approximately 17% of this
study‘s sample reported feeling neither pain nor unpleasantness in response to the TGS (n
= 3) and were termed as ―non-responders‖ for the purposes of this study. Table 5.1 shows
the variation in response between responders and non-responders for various grill
configurations. This data is extracted from the questionnaires that subjects were required
to fill in after each 30sec VAS trial.
Table 5.1 Descriptors chosen to describe the three thermal grill stimuli. Descriptors were
chosen from a list provided to subjects as well the subject‘s own interpretation of the sensation.
The frequency reported in brackets indicates the percentage of participants that used a particular
descriptor. ―TGS responders‖ refers to participants that reported pain and/or unpleasantness in
response to the application of atleast one of the TGS. Participants were free to use as few or as
many words as they thought appropriate.
Condition All participants –
Descriptors (%)
TGS responders only –
Descriptors (%)
Static Warm (88.9) Neutral (11.1) Warm (93.3) Neutral (6.7)
Dynamic Warm (77.8) Burning (5.6) Warm(93.3) Burning (6.7)
Static Cold (77.8) Burning (10.1) Cold (73.3) Burning (13.3)
Dynamic Cold (66.7) Burning (22.2) Cold (100.0) Burning (20.0)
Static Mixed (40.0) Burning (11.1) Mixed (31.3) Burning (13.3)
Dynamic Mixed (35.0) Burning (27.9) Mixed (25.0) Burning (25.0)
Static Mixed (57.8) Burning (15.8) Mixed (43.7) Burning (18.8)
Dynamic Mixed (33.3) Burning (47.6) Mixed (25.0) Burning (50.0)
Static Mixed (30.0) Burning (20.0) Mixed (25.0) Burning (25.0)
Dynamic Mixed (42.8) Burning (28.6) Mixed (37.5) Burning (37.5)
Evaluation and Characterisation of the Thermal Grill apparatus for Spinal Cord Injury patients | 2011
42
When asked to identify the main underlying quality felt, subjects correctly identified the
thermal quality of the cool stimulus (config_2) in 78% of runs for static conditions and
67% of the runs for dynamic condition (describing it as ―cool‖ or ―cold‖). 90% of
participants correctly identified the thermal quality of the warm stimulus (config_1)in
static grill condition while 78% of participants described the stimulus correctly in
dynamic condition (describing it as ―warm‖ or ―hot‖).
60.2% of the TG runs were correctly identified as being mixed (i.e. warm and cool) in
nature. However, when subjects were asked to identify a single predominant thermal
quality, the TGS were more frequently described according to the warm component, i.e.,
as either ―warm‖ or ―hot‖ (count of ―warm‖ or ―hot‖ vs. ―cool‖ or ―cold‖: Binomial tests;
p = 0.02).
The use of painful descriptors for the different TG configurations was analysed.
Configurations involving a greater percentage of cool (i.e., cool columns surrounding a
warm column) was found to be significantly more painful and unpleasant than equal area
configurations having a larger region of warm stimuli (i.e. warm columns surrounding a
cool column) (χ2 = 3.846, p = 0.04). Figure 5.5 graphs the subject reported descriptors on
a thermal scale progressing from extremely cold to extremely hot sensations.
Evaluation and Characterisation of the Thermal Grill apparatus for Spinal Cord Injury patients | 2011
43
Figure 5.5 Progression of the perceived thermal quality of the TGS for (a) Static Condition
and (b) Dynamic Condition. Participants were asked to describe the predominant thermal
quality of the TGS at 10, and 30s. The temporal progression of the thermal quality of the
stimulus was coded as fixed combinations (e.g., when the participant initially indicated mixed
sensations that progressed to a predominantly hot sensation, this was coded as ―mix hot‖).
Combinations where the participants indicated pain and/or unpleasantness are located at the
extreme ends of the graphs. Cold sensations are located on the left-hand of the graph. This is
followed by combinations of cold and mixed sensations; mixed sensations; hot and mixed
sensations; finally, combinations indicating predominantly hot sensations are found on the right-
hand side of the graph.
Evaluation and Characterisation of the Thermal Grill apparatus for Spinal Cord Injury patients | 2011
44
5.7 Thermal Thresholds and the TGI
A Spearman‘s correlation was calculated for the four different thresholds and the
unpleasantness intensity ratings (NRS) elicited by the TG. The only threshold that was
consistently significantly correlated with these ratings was the CPT (ρ =0.550, p = 0.052
for static condition; and ρ =0.535, p = 0.049 for dynamic condition) as demonstrated in
Figure 5.6.
Figure 5.6 Scatter plot of CPT vs. maximum VAS score of the TGS. The CPT was found to be
significantly correlated to the TGS VAS score (averaged across the three TGS conditions) in both
static and dynamic grill conditions.
5.8 Variance in Response
Although the TGI was successfully elicited in a majority of subjects, the response to the
TGS between individuals was varied: pain intensity ratings ranged from zero (i.e., ―no
pain‖) to scores of ten out of 10 points (10 = ―worst pain imaginable‖). Subject reported
descriptors to the stimuli further reflect this variability. Non-responders perceived the
TGS to be ―warm‖ or ―hot‖. While a few non-responders described the TG stimulus to be
―neutral‖ and ―not unpleasant or pleasant‖, just two participants characterized the TGS as
―pleasant‖ and ―comforting‖. However, in the case of these two participants, only a single
configuration was characterised as being pleasant, while the other two TG configurations
were characterized as unpleasant. Responders described their experience with the TGS as
0
2
4
6
8
10
0 10 20 30
max
VA
S sc
ore
CPT (C)
STATIC
0
2
4
6
8
10
0 10 20 30
max
VA
S sc
ore
CPT (C)
DYNAMIC
Evaluation and Characterisation of the Thermal Grill apparatus for Spinal Cord Injury patients | 2011
45
―uncomfortable‖, ―unpleasant‖, ―painful‖ and a sensation they ―didn‘t like/disliked‖. One
responder reacted strongly to the TGS and could only maintain contact with the grill for a
maximum of 5 sec before withdrawing his hand.
Evaluation and Characterisation of the Thermal Grill apparatus for Spinal Cord Injury patients | 2011
46
Chapter 6
Discussion
The present results indicate that the simultaneous application of adjacent cutaneous warm
and cold stimuli, at stimulus temperatures below the heat and cold pain thresholds, is
capable of producing a paradoxical sensation with a burning quality in a large majority of
subjects (83.3% of subjects reported pain and/or unpleasantness to one/more of the TGS).
6.1 TGI as a Painful Experience
In this study, the burning sensation attributed to the TGS was coupled with reports of
pain and unpleasantness. The nature of the TGI has not been clearly defined and has been
a topic of debate [11, 39, 44, 45, 46]. Although a majority of the authors reported that the
TG sensation could be painful, its relationships with normal thermal sensitivities (under
the same spatial conditions) had not been specifically investigated. In this respect, the
present results (refer to Figure 5.3 and Table 5.1) clearly demonstrate, in a large number
of naïve subjects, that the paradoxical sensation induced by a thermal grill can be
described as painful and/or unpleasant and hence confirms the hypothesis that the TG
device can be used to elicit a painful sensation in healthy individuals.
This study investigated the characteristics of the TGI by employing warm (40 ± 1C) and
cold (20 ± 1C) stimuli of various configurations. Craig reported that the uniform 20°C
and 40°C stimuli were rarely rated as non-painful by their 11 participants [10]. None of
the 13 individuals that participated in Leung et al.‘s (2005) study commented on feeling
pain in response to the presentation of thermodes set to 18°C, 20°C, 24°C, 36°C, 40°C, or
42°C. In this study‘s protocol, participants were required to report on feelings of
unpleasantness in response to the thermal grill stimuli and were not given any indication
Evaluation and Characterisation of the Thermal Grill apparatus for Spinal Cord Injury patients | 2011
47
if the stimuli were to be painful or not. Compared to the warm and cool temperatures
alone, pain in response to the TGS was elicited more frequently and was often described
to be burning in nature as demonstrated in Figure 5.3.
6.2 TG perception during Static vs. Dynamic Grill testing
This study was the first to compare the effects of dynamic and static grill conditions of
the TGS within the same group of subjects. Results show that the paradoxical sensations
can be perceived during synchronized dynamic cooling/warming of the forearm to
innocuous temperatures, but this response was not apparent in the static testing
conditions. Thermal receptors are most active during a change of temperature [63, 64]. In
the case of static testing, a sudden temperature change is seen as the forearm is placed in
contact with the preconfigured TGS. In contrast, testing with the dynamic grill requires
that the forearm is resting on the grill (which is at skin temperature) before temperature
change begins. Intuitively one would expect to see a larger initial VAS response in the
static condition, since the temperature change is immediate and should cause the thermal
receptors to fire rapidly at the time of initial stimulation. However, the initial VAS
response was markedly higher in the static dynamic condition. Interestingly, this was
observed in response to both the uniform and the TG stimuli and was short lasting (given
the time frame). By the 30sec point there was no significant difference seen in the effect
of static vs. dynamic condition on the VAS ratings. This difference in the initial response
may thus reflect the effect placing the forearm on the thermode including; the effect of
tactile contact of the thermode with the skin surface, or factors related to the motor act of
placing the hand on the grill.
Tactile stimulation in the case of static grill testing activates the rapidly adapting
mechanoreceptors including Meissner corpuscle, Pacinian corpuscle, and hair follicle
receptors. Since they are rapidly adapting or phasic, the action potentials generated
quickly decrease and eventually cease. In the dynamic grill testing condition, tactile
receptors fire minimally due to adaptation to the stimulus [60]. Green (2009) reported
Evaluation and Characterisation of the Thermal Grill apparatus for Spinal Cord Injury patients | 2011
48
that temperature perception on the hand is attenuated and its quality is changed when
thermal stimulation is accompanied by simultaneous tactile stimulation. The
spatiotemporal properties of the tactile stimulus dictate the level of contact suppression,
and suppression did not occur in significant amounts when a thermode was lightly drawn
across the surface of the skin as opposed to being touched to its surface [61]. His results
strongly implied that contact suppression results primarily from stimulation of low-
threshold mechanoreceptors that are more sensitive to vertical impact than to skin
deformation and that touch contributes in fundamental ways to normal temperature
perception.
However, subjects voluntarily placed their forearm on the grill in the static condition
only. Voluntary movement could cause descending inhibitory inputs which could cause
suppression of nociceptive transmission in the dorsal horn or higher centres [38].
Additionally, placing the hand requires attention which may affect the initial perception
of the thermode, or ability to focus on movement of the mouse, and thus the ability to
respond accurately in the initial few seconds of stimulation. These possibilities were not
evaluated in this study, and require further study.
6.3 Spatial Characteristics of the Thermal Grill
Different temperature configurations of the TG were used in this study. Figure 5.2
demonstrates that no statistically significant difference was seen in the unpleasantness
VAS intensity ratings reported for each of the configurations during stimulus application.
However, in post-stimulation questioning, the TG configuration with a greater cool
stimulation area was described to be significantly more painful than configurations with a
larger warm stimulation area, as reported in Figure 5.3.
Throughout the experiment, participants were simply told to indicate the level of
unpleasantness of the TG stimulus. This protocol was designed to minimize any
suggestions that the grill may be painful and so were not asked to rate pain during the
stimulus application. Instead, participants were given a questionnaire with a list of
Evaluation and Characterisation of the Thermal Grill apparatus for Spinal Cord Injury patients | 2011
49
descriptors to choose from and were additionally asked to describe the sensation in their
own words. A TG stimulus may have been perceived as qualitatively unique to uniform
warm/cool stimulus but equally as unpleasant. This may account for the higher
percentage of ‗burning‘ or ‗painful‘ descriptors used for the TGS when subjects were
asked to describe the sensation in their own words, even though the VAS ratings for the
TGS and uniform stimuli were similar.
Overall, it can be shown that although there was no significant variance in the
unpleasantness ratings between the different TG configurations, a significant difference
was seen in the descriptors used for these configurations. Specifically, TGS
configurations with a larger cool stimulation area were described to be more painful. This
contradicts previous finding that show that a cool bar interposed in a field of warm was
much more effective at evoking the TGI [50]. In all, these results confirm the hypothesis
that the perceived intensity of the TGI is dependent on the distribution pattern of the
warm and cool bars in the thermal grill stimulus.
6.4 Temporal Characteristics of the Thermal Grill
Descriptor analysis showed that the perceptions varied with time in no observable
pattern. Similarly, Alston [48] reported that participants experienced a fluctuation
between detecting both warm and cool, and feeling ―heat‖.
Craig (2002) and Green (2009) also reported that the ability to detect the thermal quality
of ―cold‖ diminished during the simultaneous presentation of both warm and cool
temperatures (i.e., TGS). Leung et al (2005) comparing the perception elicited by the
TGS after 3sec of stimulation to that produced by a uniform stimulus, found that
participants matched the TGI to painfully hot stimuli that surpassed the temperature of
the warm component. He found that following 10sec of stimulation, the sensation evoked
by the TGS still resembled hot (and not cold) stimuli; however, the temperatures of these
stimuli were not significantly higher than the warm component of the TGS. These authors
suggested that the diminished noxious nature of the TGS may reflect adaptation of the
Evaluation and Characterisation of the Thermal Grill apparatus for Spinal Cord Injury patients | 2011
50
central process underlying the TGI. Bouhassira et al. (2005) reported that their
participants described mixed sensations in response to the TGS over the 30sec of
application. The current data supports the observation that the perceived thermal quality
of the TG evoked response fluctuates during stimulus application. Further study is needed
to evaluate whether this reflects participant‘s attending to aspects of the stimulus or the
effect of neuronal responses at lower levels of the nervous system.
6.5 TGI and thermal thresholds
The intensity of the painful response to the TGS was significantly correlated to the CPT
(Section 5.7). This finding suggests that the CPT and TGI share a common physiological
mechanism. Prior researchers hypothesized that cold thermoreceptive channels
(ascending lamina-I Cold) modulate the effect of nociceptive (lamina-I HPC) pathways
[12]. Both the CPT and TGI would be affected by this integration.
Preceding research has shown various lines of evidence suggesting a relationship
between cold pain, cold thermoreception, and the TGI. Following the administration of
morphine, there is a significant correlation between the reductions in the CPT and the
lower pain intensity felt in response to the TGS [43].Craig and Bushnell (1994) theorized
that the disinhibition of pain seen in the TGI was linked to the cold allodynia experienced
during myelinated nerve blocks. Additionally, in post SCI patients experiencing central
neuropathic pain, the painful areas were found to co-localize with areas of maximal
thermo-sensory deficits [27, 62]. Collectively, these results suggest a modulatory role for
innocuous thermo-receptive input in the perception of pain.
Evaluation and Characterisation of the Thermal Grill apparatus for Spinal Cord Injury patients | 2011
51
6.6 The between-subject variability of the TGI
Despite between-subjects variation in pain and detection thresholds, the thermal grill pain
threshold was found to be significantly correlated to the temperature differential between
the heat and cold thermal threshold (i.e. HPT - CPT).
The results from this study also indicate that the perception and intensity of the TGI is a
highly variable phenomenon between individuals. Three participants (representing 16.6%
of the sample) did not report either pain or unpleasantness from the TGS. Previous
researchers identified within their samples a similar proportion of non-responders [26, 27,
28, 43, 62]. This shows that the TGI can be evoked in a majority of able-bodied subjects
using the temperature combination of 20C and 40C, within the limitations of our study.
Of the four thermal thresholds, CPT is the most variable between subjects [22, 57].
Therefore, the relation between the subject‘s CPT and perception of the thermal grill
illusion may hold some insight into explaining the consistent proportion of non-
responders across the different studies. Further research needs to be carried out in order
to examine the role (played by) cold pain thresholds on the perception of the TGI.
6.7 Important methodological issues
A crucial methodological difference between the present experiment, and previous
research [11, 12, 27, 43, 62] lies in the instructions to participants.
In the present experiment the subjects were instructed to describe the evoked perception
for warm, cold, and simultaneous warm and cold stimulation by choosing descriptors
from a list (cold, cool, warm, hot, neutral, burning cold, other, burning heat), and
spontaneously describe the perception verbally. Additionally at no point in the pre- or
intra-experimental sessions, were subjects told that the sensation could be painful.
Subjects were simply told to expect a unique sensation to the TG configurations and to
rate the level of unpleasantness on a scale of 1 – 10. However, the participants still
Evaluation and Characterisation of the Thermal Grill apparatus for Spinal Cord Injury patients | 2011
52
volunteered comments indicative of the perception of ―pain‖ and ―stinging‖, which are
characteristic of the thermal grill illusion. In contrast, in the experiment by Craig and
Bushnell (1994) participants were given a list of 15 words from the McGill Pain
Questionnaire [66], and a common definition of pain as ‗any uncomfortable sensation,
such as pricking, stinging, or burning, even if the stimulus is tolerable‘. The replicability
of the painful grill illusion in subjects without prior bias shows that the perception of the
thermal grill illusion is a very robust phenomenon.
Whereas previous research measures thermal thresholds using a single thermode, this
study used the same stimulation area to measure both the thermal thresholds and thermal
grill intensity ratings [63, 65]. This allowed us to better understand the relation between
the thermal grill illusion and thermal thresholds.
Using the same component temperatures for the TGS across all individuals meant that,
for some trials, the cold temperature or the warm temperature fell either below or above
pain thresholds, respectively. To offset this possibility, some researchers have defined the
cool and warm temperature with respect to the CPT and HPT, respectively (e.g., CPT +2
°C/HPT -2 °C) [28, 43, 45, 61]. The use of fixed temperatures was based on prior
research [12, 44, 45] indicating that the 20 °C and 40 °C combination produced the TGI
in a high number of individuals.
6.8 Using the TG as a Research Tool
It was proposed that the TGS can be used to mimic the burning pain experienced by
neuropathic pain patients, as well as to evaluate the sensory effects of analgesic agents
[11, 45]. The device developed for this study allows for full control over stimulus
variables, i.e. thermode temperatures, spatial configuration of warm and cool thermodes,
number of thermodes used and temperature ramp rates. Additionally, the safety checks
are in place to ensure that the temperatures reached by the grill do not present a physical
harm to the participant, hence making it ideal for prolonged testing paradigms. Most
Evaluation and Characterisation of the Thermal Grill apparatus for Spinal Cord Injury patients | 2011
53
importantly, the grill is mobile and can hence be used for testing in any region of the
body where neuropathic pain may occur.
In this study, we were able to successfully elicit the TGI in a majority of the able-bodied
subjects. To use the TG effectively as a clinical research tool, further research must be
carried out to understand of the mechanisms that cause the TGI and hence reproduce it
consistently in a large sample of healthy individuals.
6.9 Limitations of this Study
In the present experiments, the thermal grill illusion was elicited through six thermodes
arranged in a 3 x 2 array with a total surface area of 61cm2. However, throughout the
history of research on the TGI various stimulation areas have been used to produce the
stimulations. The large actuator size used in this experiment may account for the
difference in pain ratings seen from prior research.
This study was not specifically designed to analyze the effect of tactile stimulation on the
TGI; but rather was designed to study the effect of the TG ramping functionality on the
TGI. Hence, the lack of control over the various variables involved in understanding the
difference between static and dynamic grill testing, presents a limitation in interpreting
the results.
The VAS is a well-studied method for measuring both acute and chronic pain, and its
usefulness has been validated by several investigators. Since pain is a very subjective
sensation, subjects often claimed it difficult to judge and mark their level on
unpleasantness on the linear length of the VAS scale. This may account for the
discrepancy seen between the verbal descriptors used by subjects and their corresponding
VAS ratings.
Evaluation and Characterisation of the Thermal Grill apparatus for Spinal Cord Injury patients | 2011
54
The room temperature, humidity level and ambient noise were controlled to the best of
our abilities. However, normal day to day variations do occur which have been shown to
have an impact on a person‘s perception of thermal stimuli [51, 53].
Evaluation and Characterisation of the Thermal Grill apparatus for Spinal Cord Injury patients | 2011
55
Chapter 7
Conclusion
There has been considerable interest in the use of the Thermal Grill Illusion (TGI) for the
study of central neuropathic pain. To this end, the present study developed a portable and
reliable device that could successfully elicit the TGI in a majority of the able bodied
subjects. The present study was also the first to compare the effects of dynamic and static
contact of the TG within the same group of subjects. Results show that static testing
conditions resulted in significantly suppressed initial responses to thermal stimulation.
The source of this difference requires further investigation. A high correlation was also
seen in the subject‘s TG intensity scores and their cold pain threshold. However, the
spatial arrangement of the warm and cool stimuli was shown to have a significant effect
on the quality perception of the stimulus but not on the intensity ratings of those same
stimuli.
Future studies should attempt to manipulate the TGS to further illicit the TGI in all
healthy subjects in an attempt to further elucidate the mechanisms of the paradoxical pain
response elicited by this mixed stimulus.
Evaluation and Characterisation of the Thermal Grill apparatus for Spinal Cord Injury patients | 2011
56
References
[1] Rose, M. Pain following spinal injury: results from a postal survey. Robinson, J.E,
Ellis, P., and Cole, J. Pain 34, 101-102. 1988.
[2] Segatore, M. Understanding chronic pain after spinal cord injury. Journal of
Neuroscience Nursing 26(4), 230-236. 1994.
[3] Siddall, P.J. A Longitudinal study of the prevalence and characteristics of pain in
the first 5 years following spinal cord injury. McClelland, J.M., Rutkowski, S.B.,
and Cousins, M.J. Pain 103(3), 249-257. 2003.
[4] Nepomuceuno, C. Pain in patients with spinal cord injury. Fine, P.R., Richards, J.S.,
Gowens, H., Stover, S.L., Rantanuabol, U., Houston, R. Archives of Physical
Medicine and Rehabilitation 60(12), 605–609. 1979
[5] Baastrup, C. Pharmacological management of neuropathic pain following spinal
cord injury. Finnerup, N.B. Central Nervous System Drugs 22(6), 455-475. 2008.
[6] Haanpää, M. Are neuropathic pain screening tools useful for patients with spinal
cord injury? Pain 152(4), 715-716. 2011.
[7] Bouhassira, D. Diagnosis and assessment of neuropathic pain: The saga of clinical
tools. Attal, N. Pain 152(3 Suppl), S74-83. 2011.
[8] Haanpää, M. NeuPSIG guidelines on neuropathic pain assessment. Attal, N.,
Backonja, M., Baron, R., Bennett, M., Bouhassira, D., Cruccu, G., Hannson, P.,
Haythornthwaite, J., Iannetti, G., Jensen, T., Kauppila, T., Nurmikko, T., and Rice,
A., Rowbotham, M., Serra, J., Sommer, C., Smith, B.H., Treede, R.D. Pain 152(1),
14-27. 2011.
[9] Haanpää, M. Assessment of neuropathic pain in primary care. Backonja, M.,
Baron, R., Bennett, M., Bouhassira, D., Cruccu, G., Hannson, P., Jensen, T.,
Kauppila, T., Rice, A., and Smith, B. American Journal of Pain 122(10 Suppl), S13-
21. 2009.
[10] Woolf, C.J. Towards a mechanism-based classification of pain? Bennett, G.J.,
Doherty, M., Dubner, R., Kidd, B., Koltzenburg, M., Lipton, R., Loeser, J.D.,
Payne, R., Torebjork, E. Pain 77(3), 227-229. 1998
[11] Craig, A.D., Bushnell, M.C. The thermal grill illusion: unmasking the burn of cold
pain. Science 265, 252-255. 1994.
[12] Craig, A. D. New and old thoughts on the mechanisms of spinal cord injury pain.
Progress in Pain Research and Management 23, 237-261. 2002.
Evaluation and Characterisation of the Thermal Grill apparatus for Spinal Cord Injury patients | 2011
57
[13] Kern, D. Pharmacological dissection of the paradoxical painful sensation produced
by a thermal grill. Pelle-Lancien, E., Luce, V., and Bouhassira, D. Pain 135(3), 291-
299. 2008.
[14] Craig, A. D. Can the basis for central neuropathic pain be identified by using a
thermal grill? Pain 135(3), 215-216. 2008.
[15] IASP Task Force on Taxonomy. Part III: Pain terms, a current list with definitions
and notes on usage. Merskey, H., and Bogduk, N. Classification of Chronic Pain
(2nd ed.). IASP Press: Seattle, WA. 209-214. 1994
[16] Davidoff, G., Roth, E. J. Clinical characteristics of central (dysesthetic) pain in
spinal cord injury patients. Pain and Central Nervous System Disease: The Central
Pain Syndromes, 77-83. 1991. New York, Raven Press.
[17] Tasker, R., Dostrovsky, J.O. Deafferentation and central pain. Textbook of Pain
(2nd ed.), 154-180. 1989. New York, Churchill Livingstone.
[18] Hulseboch, C. Mechanisms of chronic central neuropathic pain after spinal cord
injury. Hains, B., Crown, E., and Calrton, S. Brain Research Reviews 60(1), 202-
213. 2009.
[19] Woolf, C. Neuropathic pain: aetiology, symptoms, mechanisms, and management.
Mannion, R. The Lancet 353, 1959-1964. 1999.
[20] Scholz, J., Woolf, C. Mechanisms of neuropathic pain. Pappagallo M. The
neurological basis of pain. 75-77. 2005. New York, McGraw-Hill.
[21] Woolf, C. Pain: moving from symptom control toward mechanism-specific
pharmacologic management. Annals of Internal Medicine 140(6), 441-451. 2004.
[22] Rolke, R. Quantitative sensory testing in the German Research Network on
neuropathic pain (DFNS): Standardised protocol and reference values. Baron, R.,
Maier, C., Tolle, T.R., Treede, R.D., Beyer, A., Binder, A., Birbaumer, N., Birklein,
F., Botefur, I.C., Braune, S., Flor, H., Huge, V., Kuleg, R., Landwehrmeyer, G.B.,
Magerl, W., Maihofner, C., Rolko, C., Schuab, C., Scherens, A., Sprenger, T.,
Valet, M., and Wasserka, B. Pain 123(3), 231-243. 2006.
[23] Backonja, M. Quantitative sensory testing in measurement of neuropathic pain
phenomena and other sensory abnormalities. Walk, D., Edwards, R., Sehgal, N.,
Moeller-Bertram, T., Wasan, A., Irving, G., Argoff, C., and Wallace, M. Clinical
Journal of Pain 25(7), 641-647. 2009.
[24] Yarnitsky, D. Quantitative sensory testing. Muscle Nerve 20(2), 198-204. 1997.
Evaluation and Characterisation of the Thermal Grill apparatus for Spinal Cord Injury patients | 2011
58
[25] Shy, M.E. Quantitative sensory testing: report of the Therapeutics and Technology
Assessment Subcommittee of the American Academy of Neurology. Frohman, E.
M., So, Y.T., Arezzo, J.C., Comblath, D.R., Giuliani, M.J., Kincaid, J.C., and
Ochoa, J.L. Neurology 60, 898-904. 2003.
[26] Defrin, R. Characterization of chronic pain and somatosensory function in spinal
cord injury subjects. Ohry, A., Blumen, N., and Urca, G. Pain 89(2-3), 253-263.
2001.
[27] Defrin, R. Sensory determinants of thermal pain. Ohry, A., Blumen, N., and Urca,
G. Brain 125(3), 501-510. 2002.
[28] Bouhassira, D., Attal, N., Parker, F., and Brasseur, L. Quantitative sensory
evalution of painful and painless patients with syringomyelia. Devor, M.,
Rowbatham, M.C., Wisenfield-Hallin. Proceedings of the IXth World Congress on
Pain, 401-411. 2000. Seattle, IASP Press.
[29] Alrutz, S. On the temperature senses: II The sensation ‗hot'. Mind 7, 140-144.
1898.
[30] Goldscheider, G. Psychophysics: method, theory and application (2nd ed.). 1985.
Hillsdale, Lawrence Erlbaum.
[31] Sinclair, D.C. Cutaneous sensation and the doctrine of specific energy. Brain 78(4),
584-616. 1955.
[32] Valbo, A.B. Activity from skin mechanoreceptors recorded percutaneously in
awake human subjects. Hagbarth, K.E. Experimental Neurology 21(3), 270-289.
1968.
[33] Kandel, E.R., Schwartz, J.H., Jessel, T.M. The sensory systems. Kandel, E.R.,
Schwartz, J.H., Jessel, T.M. Essentials of neural science and behaviour. 369-386.
1995. New York, McGraw-Hill.
[34] Wall, P.D., McMahon, S.B. The relationship of perceived pain to afferent nerve
impulses. Trends in Neuroscience 9, 254-255. 1986.
[35] Craig, A.D. A new view of pain as a homeostatic emotion. Trends in Neuroscience
26(6), 303-307. 2003.
[36] Defrin, R. Spatial summation and spatial discrimination of pain sensation. Givon,
R., Raz, N., Urca, G. Pain 126(1-3), 123-131. 2006.
[37] Harrison, J. Cold-evoked pain varies with skin type and cooling rate: a
psychophysical study in humans. Davis, K.D. Pain 83(2), 123-135. 1999.
[38] Melzack, R., Wall, P.D. Pain mechanisms: a new theory. Science 150, 971-979.
1965.
Evaluation and Characterisation of the Thermal Grill apparatus for Spinal Cord Injury patients | 2011
59
[39] Green, B.G. Synthetic heat at mild temperatures. Somatosensory and Motor
Research 19(2), 130-138. 2002.
[40] Campbell, J., Meyer, R. Mechanisms of Neuropathic Pain. Neuron 52(1), 77-92.
2006.
[41] Morin, C. Disruption of thermal perception in a multiple sclerosis patient with
central pain. Bushnell, M.C., Luskin, M.B., and Craig, A.D. Clinical Journal of Pain
18(3), 191-195. 2002.
[42] Heavner, J.E. Thermal grill illusion and complex regional pain syndrome type I
(reflex sympathetic dystrophy). Calvillo, O. and Racz, G.B. Regional Anesthesia
and Pain Medicine 22(3), 257-259. 1997.
[43] Green, B.G. Innocuous cooling can produce nociceptive sensations that are
inhibited during dynamic mechanical contact. Pope, J.V. Experimental Brain
Research 148(3), 290-299. 2003.
[44] Leung, A.Y. Qualitative and quantitative characterization of the thermal grill.
Wallace, M., Schulteis, G., and Yaksh, T.L. Pain 116(1-2), 26-32. 2005.
[45] Bouhassira, D. Investigation of the paradoxical painful sensation produced by a
thermal grill. Kern, D., Rouaud, J., Pelle-Lancien, E., and Morain, F. Pain 114(1-2),
160-167. 2005.
[46] Fruhstorfer, H. The significance of A-δ and C fibres for the perception of synthetic
heat. Harju, E. L. and Lindblom, U. European Journal of Pain 7(1), 63-71. 2003.
[47] Alston, J.H. The spatial condition of the fusion of warmth and cold in heat. Journal
of Psychology 31, 303-312. 1920.
[48] Li, X. The importance of stimulus parameters for the experience of the thermal grill
illusion. Petrini, L., Wang, L., Defrin, R., and Arendt-Nielsen, L. Clinical
Neurophysiology 39(6), 275-282. 2009.
[49] Dranga, R. Characterization of the Thermal Sensation Evoked by Application of a
Cold, Warm or Alternating Cold/Warm Thermal Grill Stimulus to Glabrous Skin
(Palm) and Hairy Skin (Forearm). Interface , 57-58. 2008.
[50] Lam, J.J. Intensity of the Thermal Grill Illusion depends on configuration of grill
elements. Hunter, J., Dostrovsky, J.O. 2010. Toronto, University of Toronto.
[51] Pavlakovic, G. Effect of Tile Application Pressure on Thermal Threshold detection.
Pavlakovic, H. Muscle Nerve 38, 1498-1505. 2009.
[52] Thermal Conductivity of some common Materials and Gases. The Engineering
Toolbox. 1999.http://www.engineeringtoolbox.com/thermal-conductivity-d_429.html
(Accessed on 04 October, 2011)
Evaluation and Characterisation of the Thermal Grill apparatus for Spinal Cord Injury patients | 2011
60
[53] Pavlakovic, G. Influence of intrinsic noise generated by a thermotesting device on
Thermal Sensory Detection and Thermal Pain Detection thresholds. Zuchner, K.,
Zapf, A., Bachmann, C.G., Graf, B.M., Crozier, T.A., Pavlakovic, H. Muscle Nerve
40(2), 257-263. 2009.
[54] Haugen, F. Demonstrating PID control principles using an air heater and Labview.
Fjelddalen, E., Dunia, R., and Edgar, T. CACHE News (Computer Aids for
Cheminal Engineering). 2007.
[55] Miller, M. Measurement of subjective phenomena in primary care research: The
Visual Analogue Scale. Ferris, D.G. Family Practice Research Journal 13(1), 15-24.
1993.
[56] Pfaff, G., ten Hagen, P. Seeheim Workshop on User Interface Management
Systems.1985. Berlin, Springer Verlag.
[57] Yarnitsky, D. Heat pain thresholds: Normative data and repeatability. Sprecher, E.
and Zaslansky, R., Hemli, J.A. Pain 60(3), 329-332. 1995.
[58] Lounasmaa, O.V. Information processing in the human brain: magneto-
encephalographic approach. Hämäläinen, M., Hari, R., and Salmelin, R.
Proceedings of the National Academy of Science U.S.A. 93(17), 8809-8815. 1996.
[59] Burnett, N. The experience of heat. Dallenbach, K.M. American Journal of
Psychology 38, 418-431. 1927.
[60] Johnson, K.O. The roles and functions of cutaneous mechanoreceptors. Current
Opinion in Neurobiology 11, 455-461. 2011.
[61] Green, B.G. Temperature perception on the hand during static versus dynamic
contact with a surface. Perception and Psychophysics 71(5), 1185-1196. 2009.
[62] Ducreux, D. Mechanisms of central neuropathic pain: a combined psychophysical
and fMRI study in syringomyelia. Attal, N., Parker, F., and Bouhassira, D. Brain
129, 963-976. 2006.
[63] Jenkins, W.L. Studies in thermal sensitivity: The reactions of untrained subjects to
simultaneous warm + cold stimulation. Journal of Experimental Psychology 22(6),
564-572. 1938
[64] Khasabov, S.G. Enhanced responses of spinal dorsal horn neurons to heat and cold
stimuli following mild freeze injury to the skin. Cain, D., Thong, D., Mantyh, P.,
Simone, D.A. Journal of Neurophysiology 86(2), 986-996. 2001.
[65] Hansson, P. Usefulness and limitations of quantitative sensory testing: Clinical and
research application in neuropathic pain states. Backonja, M., Bouhassira, D. Pain
129, 256-259. 2007.
Evaluation and Characterisation of the Thermal Grill apparatus for Spinal Cord Injury patients | 2011
61
[66] Melzack, R. The McGill Pain Questionnaire: major properties and scoring methods.
Pain 1(3), 277-299. 1975.
[67] Oldfield, R.C. The assessment and analysis of handedness: the Edinburgh
inventory. Neuropsychologia. 9(1), 97–113. 1791
Evaluation and Characterisation of the Thermal Grill apparatus for Spinal Cord Injury patients | 2011
62
Appendix A
Figure A.1. Screenshots of User Interface (a) Static Testing screen (b) Dynamic Testing screen
Waveform display
Set Dynamic Testing parameters
Temperature feedback
Temperature feedback
Preset Grill
Preset Patterns
Evaluation and Characterisation of the Thermal Grill apparatus for Spinal Cord Injury patients | 2011
63
Appendix B
Figure B.1. Participant feedback form
Evaluation and Characterisation of the Thermal Grill apparatus for Spinal Cord Injury patients | 2011
64
Appendix C
THERMAL GRILL USER MANUAL
The Thermal Grill is a computerized device designed to enable the determination of a
psychophysical measure called the thermal grill illusion (TGI); an illusion of pain that
occurs in individuals when interlaced comfortable warm (40°C) and cool (20°C) bars are
applied to the skin.
1.1 Principle of operation:
The TG consists of 6 peltier elements, called Thermodes, arranged in a 3x2 matrix which
act as the contact surface with the subject‘s skin. The device is capable of heating or
cooling the skin, as needed.
An adaptation temperature of 30°C is pre-programmed into the grill to be used prior to
each thermal experiment.
For threshold measurement, a quantified measurable thermal stimulus is induced by the
device. A simple push-button response by the patient, recorded by the computer,
completes each cycle of the examination.
For thermal grill testing, preset grill configuration are included, which upon the user‘s
choice induce a thermal stimulus by the device. A mouse driven visual analog scale,
recorded by the computer, allows for patient feedback.
Evaluation and Characterisation of the Thermal Grill apparatus for Spinal Cord Injury patients | 2011
65
1.1 Overview of Testing Methods
Threshold Testing
Detection of sensory thresholds depends on subjective data input. The Method of Limits
methodology is used by the device for sensory threshold testing. Testing consists of
stimuli of continuously changing intensity, which is halted by the subject at the moment
the requested sensation is perceived.
Static Testing
In Static Mode, the thermal tiles are set to a predetermined temperature configuration and
the thermodes will be held at that temperature till the experiment end.
Dynamic Testing
In Dynamic Mode, the tiles will be ramped up/down to a user defined temperature
configuration and be held at that temperature for the duration of the experiment at which
point the tiles will be ramped back to a reference adaptation temperature. Both the ramp
rate and the experiment duration are defined by the user.
1.2 Installation and Setup
1. Make sure that the TG controller modules are turned off.
2. Connect the ULinx Serial Connector to the USB port on the computer.
3. Check the water level within the cooling unit and ensure that no bubbles are
present within the tubing.
4. Plug the cooling unit into the power outlet and check to ensure that water is
circulating within the unit.
5. Connect the controller modules to a power outlet.
Evaluation and Characterisation of the Thermal Grill apparatus for Spinal Cord Injury patients | 2011
66
6. Turn on all three of the controller modules (switch is located at the back of each
controller box)
1.3 Operation
The user interface is designed such that at all times, the experimenter and the subject
have different displays. This allows the experimenter to collect feedback data from the
subject without biasing the results. In the following pages, unless specified, the user
interface displays will refer to those seen by the experimenter. In majority of the test
cases, the subject is shown a blank screen alone.
The TG Main Screen that is illustrated below is displayed each time you enter the
Labview program.
1. Navigate to folder labeled ―Thermal Grill Code‖ located on the desktop and open
Grill-Final Version.vi to start the Labview program.
2. A Front Panel Labview screen displaying the TG User Interface pops up. To
access the back panel or System Block Diagram press Ctrl+e. This shortcut
allows you to easily switch between the front panel and block diagram screens.
3. Click on the arrow on the top right hand corner of the Labview menu (as indicated
below) to start Labview.
4. Click the Start Program button to activate the Thermal Grill program.
Evaluation and Characterisation of the Thermal Grill apparatus for Spinal Cord Injury patients | 2011
67
5. The green light besides COMM PORT should light up to indicate that there is no
communication failure between the TG and the computer.
WARNING:
If the light is does not turn on, stop the program by clicking on the red stop sign in
the Labview menu (as indicated below). Unplug the USB series connector and
replug it. Repeat step 6. This would automatically restore the connection with the
Labview Program.
6. Peltier Status indicates which tiles are being actively controlled by the grill. To
deactivate a tile, press down on its corresponding switch on the screen.
Evaluation and Characterisation of the Thermal Grill apparatus for Spinal Cord Injury patients | 2011
68
1.4 Running an Experiment
Static Testing Mode
Click on the Static Testing button on the main screen of the user interface to enter
this mode. The following screen will become visible to the experimenter.
Actual
Temperature
indicates the current temperature of each of the grill tiles as recorded
via the tile‘s embedded thermistor. Real time graphical feedback of
the tile temperature is also displayed on the screen
Set Temperature indicates the set point temperature of each tile as defined by the
experimenter.
Preset Patterns easy access grill set point patterns that the experimenter can define
by clicking down on their corresponding switches. The experimenter
is also given the option to enter in his own Customized Pattern for
the grill.
Evaluation and Characterisation of the Thermal Grill apparatus for Spinal Cord Injury patients | 2011
69
In static mode testing is done via two methods (a) Descriptive Response (b) Visual
Analog Scale
In Descriptive Response mode of feedback, the subject is asked to indicate their overall
sensation at the 10sec and 30sec. A stop watch has been built into the user interface
display for this purpose.
1. Select the Preset Pattern or a Customized Pattern for the grill by click down on
its corresponding switch. Once you do so the values of Set Temperature should
change to indicate your selection and the tiles will start ramping to reach this
defined temperature. The tile temperatures can be read numerically form the
Actual Temperature box or graphically on the screen display.
2. Once the tiles have reached their preset temperature configuration, ask the subject
to place his/her hand on the grill.
3. Click down on the Start button in the stop watch window to begin the counting.
The Elapsed Time indicates the number of seconds that have elapsed since the
stop watch was started. To stop the stopwatch, click down on the Start button
again.
4. To restart the stop watch simply click down on the Start button to reset and restart
the timer.
In Visual Analog Scale mode of feedback, the subject is requested to move a linear,
mouse-driven scale, displayed on the monitor, to register their unpleasantness rating. Any
left-right movement of the mouse is translated into a corresponding value on the VAS.
1. Select the Preset Pattern or a Customized Pattern for the grill by click down on
its corresponding switch. Once you do so the values of Set Temperature should
change to indicate your selection and the tiles will start ramping to reach this
defined temperature. The tile temperatures can be read numerically form the
Actual Temperature box or graphically on the screen display.
2. Click on the Patient Feedback – VAS button. The following screen will pop up
allowing the experimenter to specify the file name to which the subject feedback
Evaluation and Characterisation of the Thermal Grill apparatus for Spinal Cord Injury patients | 2011
70
data will be stored. Enter the necessary file name in the box labeled Patient
Feedback – Static and click on the button to enter testing mode.
3. The following screen will be seen by the experimenter which displays
numerically and graphically the current tile temperature as well as the
Pain/Unpleasantness rating as indicated by the subject.
4. The stop watch inbuilt on the screen allows the experimenter to time the
experiment duration.
Evaluation and Characterisation of the Thermal Grill apparatus for Spinal Cord Injury patients | 2011
71
5. Simultaneously the following screen will be visible to the subject. The subject can
provide feedback by simply click on the screen to move the pointer along the
scale. All feedback will be automatically recorded and stored in the excel file
defined by the experimenter in Step 2.
6. At the end of the experiment duration, the experimenter must simple click on
Return to Static Testing to continue with the experimental protocol.
Evaluation and Characterisation of the Thermal Grill apparatus for Spinal Cord Injury patients | 2011
72
Dynamic Testing
Click on the Dynamic Testing button on the interface main screen to enter this mode. The
following screen will appear on the experimenter‘s screen
Experiment
Duration
indicates the length of time that the tiles will be held at the
experimenter defined grill configuration before ramping back to the
adaptation temperature
Ramp Rates indicates the rate at which the tiles will ramp from the adaptation
temperature of 30°C to the experimenter defined set point
temperatures. All ramp rates are in °C/s.
Preset Patterns easy access grill set point patterns that the experimenter can define
by clicking down on their corresponding switches. The experimenter
is also given the option to enter in his own Customized Pattern for
the grill.
In dynamic mode, testing is done via two methods (a) Descriptive Response (b) Visual
Analog Scale
Evaluation and Characterisation of the Thermal Grill apparatus for Spinal Cord Injury patients | 2011
73
In Descriptive Response mode of feedback, the subject is asked to indicate their overall
sensation at the 10sec and 30sec. A stop watch has been built into the user interface
display for this purpose.
1. Select the Preset Pattern or a Customized Pattern for the grill by click down on
its corresponding switch. Select the Experiment Duration and Ramp Rates to
create a ramping profile for the grill.
2. Click the Testing button to begin the testing protocol. The following screen will
pop up allowing the experimenter to specify the file name to which the subject
feedback data will be stored. Enter the necessary file name in the box labeled
Patient Feedback – Dynamic and click on the button to enter testing mode.
3. The following screen will be seen by the experimenter which displays
numerically and graphically the current tile temperature. The stop watch inbuilt
on the screen allows the experimenter to time the experiment duration. The tiles
will follow the ramping profile as determined in step 1.
4. At the end of the experiment duration, the experimenter must simple click on
Return to Dynamic Testing to continue with the experimental protocol.
Evaluation and Characterisation of the Thermal Grill apparatus for Spinal Cord Injury patients | 2011
74
In Visual Analog Scale mode of feedback, the experimenter will follow the same steps as
described above. Although in this case the subject will provide feedback via the VAS
scale as done in Static Testing VAS mode.
Threshold Testing
Click on the Dynamic Testing button on the interface main screen to enter this mode. The
following screen will appear on the experimenter‘s screen.
In threshold mode, testing is done via two methods (a) Uniform Threshold Testing (b)
Thermal Grill Threshold Testing
In Uniform Threshold Testing mode, the tiles will be simultaneously ramped up/down to
the upper/lower temperature limit of the grill. A simple mouse click by the subject will to
indicate threshold limit, will stop ramping and the corresponding temperature will be
recorded by the computer.
1. Select the Preset Pattern or a Customized Pattern for the grill by click down on
its corresponding switch.
Select the Experiment Duration and Ramp Rates to create a ramping profile for
the grill.
2. Click the Testing button to begin the testing protocol. The following screen will
pop up allowing the experimenter to specify the file name to which the subject
feedback data will be stored. Enter the necessary file name in the box labeled
Threshold Testing – Uniform and click on the button to enter testing mode.
Evaluation and Characterisation of the Thermal Grill apparatus for Spinal Cord Injury patients | 2011
75
3. Ask the user to click down on the screen when the threshold limit is reached to
stop ramping and return to the Dynamic Testing mode screen.
4. All feedback will be automatically recorded and stored in the excel file defined in
Step 2.
In Thermal Grill Threshold Testing mode, the tiles will be ramped up/down to an
experimenter defined TG configuration pattern. The subject is threshold feedback by
clicking on the appropriate buttons on the screen. Ramping stops once the subject clicks
to indicate that their pain threshold has been reached.
1. Select the Preset Pattern or a Customized Pattern for the grill by click down on
its corresponding switch. Select the Experiment Duration and Ramp Rates to
create a ramping profile for the grill.
2. Click the Testing button to begin the testing protocol. The following screen will
pop up allowing the experimenter to specify the file name to which the subject
feedback data will be stored. Enter the necessary file name in the box labeled
Threshold Testing – Uniform and click on the button to enter testing mode.
3. The following screen will be visible to the subject to indicate their detection and
pain thresholds. All feedback will be automatically recorded and stored in the
excel file defined in Step 2.
4. When the subject‘s pain threshold limit is reached, ramping stops and the display
returns to the Dynamic Testing mode.
Evaluation and Characterisation of the Thermal Grill apparatus for Spinal Cord Injury patients | 2011
76
Appendix D
STUDY SCRIPT
Before study:
- Ensure that TG are clean
- Turn on TG computer and software
- Ensure that the TG is working properly
- Set up and aim video camera on the grill
- Print out:
o Participant information/screening questionnaire
o Consent Form
o 2 Randomization Sheets
o 10 Qualitative Response
- Find out order for stimulus presentation
o Randomized grill configuration – static testing
o Randomized grill configuration – dynamic testing
During study:
Consent
Before we begin, I wanted to briefly go through the study. What we are interested in
recording is the perceptual response to the simultaneous application of pleasant
warm and cool stimuli across a body area. The body area being tested is the forearm.
Testing will be done using the thermal grill (point towards it). The temperatures across
the different elements will be set to one of three conditions: all warm, all cool, or a
mixture of warm and cool. The grill will be applied for a predetermined period of time.
You will be asked to describe the sensation this grill produces.
Evaluation and Characterisation of the Thermal Grill apparatus for Spinal Cord Injury patients | 2011
77
All data collected from you will remain confidential. This is done by using a number to
refer to your file. Any identifying information will be stored separately in a locked
cabinet. Also, only myself and my supervisors will have access to the information
obtained.
Your participation is completely voluntary, and you are free to withdraw from the study
at any point.
This consent form describes the information I just gave you. It also provides you with a
contact in case you have any questions regarding your rights as a research
participant. Please read through it thoroughly and, if you wish to participate, sign at
the bottom of the second page.
Sign form
Okay! Before we start, please go through this form and ensure that the information on it
is accurate (pass over Screening Questionnaire).
Just to make sure, you are not currently experiencing pain?
Okay, we are ready to begin the study.
TG Threshold Testing [Remember: ALWAYS test non-dominant side]
In the following tests, we will explore, using various procedures, how you perceive
temperature changes. In addition, we will examine, from what point on different test
stimuli are felt as being painful.
The test instructions will be read to you aloud. If you have not understood the test
instructions, please always feel free to immediately ask for clarification.
Evaluation and Characterisation of the Thermal Grill apparatus for Spinal Cord Injury patients | 2011
78
The grill is connected to this computer, so I can control the temperature to either warm or
cool your skin. Clicking on the mouse enables you to immediately stop the ongoing test
stimulus at any time.
For every test I will explain to you when to click down on the mouse.
So first of all, I will be conducting a trial run to familiarize you with the testing protocols.
CDT
Set ramp rate to 0.5°C/s
First we will test your ability to perceive cold sensations. Please click on the screen
immediately once you perceive a change in temperature to cool/cooler for the first time.
Once you click down please immediately remove your hand from the grill.
Subsequently, the tile will warm up again, until it reaches the baseline temperature. This
procedure will start in a few seconds.
WDT
Set ramp rate to 0.5°C/s
Now we will test your ability to perceive warm sensations. Please click on the screen
immediately once you perceive a change in temperature to warm/warmer for the first
time. Once you click down please immediately remove your hand from the grill.
Subsequently, the tile will cool down again, until it reaches the baseline temperature. This
procedure will start in a few seconds.
CPT
Set ramp rate to 1.0°C/s
Evaluation and Characterisation of the Thermal Grill apparatus for Spinal Cord Injury patients | 2011
79
Now we will test as to when you perceive the cooling of the thermode as painful. Your
skin will be slowly cooled. At some point in time you will feel a second sensation on top
of the usual ―cold‖ sensation. The impression of ―cold‖ will change its quality towards an
additional impression of a ―burning‖, ―stinging‖, ―drilling‖ or ―aching‖ sensation.
Please click on the screen immediately once you perceive such a change. Please DO
NOT wait to click down on the mouse until the sensation has become unbearably
painful. Once you click down please immediately remove your hand from the grill.
Subsequently, the tile will warm up again, until it reaches the baseline temperature. This
procedure will start in a few seconds.
HPT
Set ramp rate to 1.0°C/s
Now we will test as to when you perceive the warming of the thermode as painful. Your
skin will be slowly warmed. At some point in time you will feel a second sensation on
top of the usual ―warm‖ or ―hot‖ sensation. The impression of ―warmth‖ or ―heat‖ will
change its quality towards an additional impression of a ―burning‖, ―stinging‖,
―drilling‖ or ―aching‖ sensation.
Please click on the screen immediately once you perceive such a change. Please DO
NOT wait to click down on the mouse until the sensation has become unbearably
painful. Once you click down please immediately remove your hand from the grill.
Subsequently, the tile will cool down again, until it reaches the baseline temperature. This
procedure will start in a few seconds.
Testing within the control and test site
So now we will first do threshold testing with only one tile and then do the same for the
condition where all six tiles are changing temperature.
Evaluation and Characterisation of the Thermal Grill apparatus for Spinal Cord Injury patients | 2011
80
During the first condition, I want you to make sure that your forearm is in full contact
with the right-most tile in the lower row.
CDT - Set ramp rate to 0.5°C/s
Just as we have done in the practice round, you will first perceive a cooling of the skin.
Please click on the screen immediately as soon as you first feel a change of temperature
to ―cool or cooler‖. This procedure will be performed a total of 3 times.
WDT - Set ramp rate to 0.5°C/s
Please click on the screen immediately as soon as you first perceive a warming of the
skin. Again this procedure will be performed a total of 3 times.
CPT - Set ramp rate to 1.0°C/s
Please click on the screen immediately as soon as the ―cold‖ sensation changes its
quality to an additional sensation of ―burning‖, ―stinging‖, ―drilling‖ or ―aching‖. This
procedure will be performed a total of 3 times.
HPT - Set ramp rate to 1.0°C/s
Please click on the screen immediately as soon as the ―warm‖ or ―hot‖ sensation
changes its quality to an additional sensation of ―burning‖, ―stinging‖, ―drilling‖ or
―aching‖. This procedure will be performed a total of 3 times.
Now we will do threshold testing with all six tiles on. Please ensure that you forearm is
placed on the middle of the grill such that it makes contact with all six tiles.
CDT - Set ramp rate to 0.5°C/s
WDT - Set ramp rate to 0.5°C/s
Evaluation and Characterisation of the Thermal Grill apparatus for Spinal Cord Injury patients | 2011
81
CPT - Set ramp rate to 1.0°C/s
HPT - Set ramp rate to 1.0°C/s
PT - Set ramp rate to 1.0°C/s
We are now going to test the device in thermal grill mode with a mixture of warm and
cool tiles in three different configurations. For each configuration I will ask you to
indicate your pain threshold and well as when you first detect either a cool or warm
sensation.
The screen will now have three buttons: ―cool‖, ―warm‖ and ―unpleasant‖.
Please click on the button labeled ―cool‖ immediately IF you detect a change of
temperature to ―cool or cooler‖.
Please click on the button labeled ―warm‖ immediately IF you detect a change of
temperature to ―warm or warmer‖.
Please note that you may feel both or only one of these sensations during the trial. Click
down only on the button you deem appropriate.
Please click on the button labelled ―unpleasant‖ immediately as soon as the sensation
changes its quality to an additional sensation of ―burning‖, ―stinging‖, ―drilling‖ or
―aching‖ pain. This procedure will be performed a total of 3 times for each
configuration.
Static Testing
Next we are testing a mixture of different scenarios: all warm, all cool, and three
configurations which have a mix of warm and cool tiles; first each of these conditions
will be administered in a static mode.
Evaluation and Characterisation of the Thermal Grill apparatus for Spinal Cord Injury patients | 2011
82
For each of the testing conditions, I will set the grill to one of five configurations and will
then ask you to place your hand on the grill. Please do not make contact with the TG
until I tell you so.
Part 1
I want you to describe the primary sensation you feel after 10 and 30 seconds of placing
your forearm on the grill. I will give you a cue to indicate both these time points. Run
trial.
Part 2
As you can see, on the screen there is a scale ranging from “not unpleasant”, to “most
unpleasant”. The tick can be controlled using the mouse. The pointer should reflect the
level of unpleasantness you are feeling at the moment.
So, during certain trials, I will need you to place your hand on the grill for 30 seconds.
During this time, I want you to move the mouse along the scale indicating the degree of
unpleasantness you are feeling at that moment. This is meant to be interactive.
If the sensation increases during testing, you can move the mouse up the scale. If the
sensation decreases, you can move the mouse back down. Importantly, if you are not
feeling any unpleasantness, make sure the mouse is on the leftmost point of the scale.
Please focus on the stimulus during the trials.
Make sure to watch the screen to see what is being recorded.
Part 3
After these trials, I will ask you to complete a short, form to describe the overall
sensation felt from a list of six descriptors. If you think there is a better word that
describes your sensation, choose ‗Other‘, and write it out. Go ahead and read through the
selection.
Give them time to go through the list of descriptors. Run trial.
Evaluation and Characterisation of the Thermal Grill apparatus for Spinal Cord Injury patients | 2011
83
Dynamic Testing
Now we will run the same procedure as before but in dynamic mode. In this mode you
will keep you hand placed on the grill. Once you do so, the grill will be held at a neutral
temperature for 10 seconds and then be ramped up/down to one of five grill
configurations. I will indicate the 40 second mark at which point you will immediately
remove your hand from the grill.
Feedback will be down in the same manner as before.
Set ramp rate to 1.0°C/s
Run trial.
Ask for feedback at 20 sec and 40 sec mark.
End
That‘s it! Thank you for participating. Do you have any questions, or comments?