1 A. Project Information Final Report Contract 15-0522 Evaluation and demonstration of nitrogen management of organic vegetable production in leafy green vegetables on the Central Coast Richard Smith, UCCE Vegetable Crops Farm Advisor, Monterey, San Benito and Santa Cruz Counties, 1432 Abbott Street, Salinas, CA 93901, 831 759-7357, [email protected]Mike Cahn, UCCE Irrigation Farm Advisor, Monterey, San Benito and Santa Cruz Counties, 1432 Abbott Street, Salinas, CA 93901, 831 759-7377, [email protected]T.K. Hartz, Extension Specialist, Department of Plant Sciences, University of California, 1 Shields Ave. Davis, CA 95616, 530 752-1738, [email protected]Daniel Geisseler, Extension Specialist, Department of Land, Air and Water Resources, University of California, 1 Shields Ave. Davis, CA 95616, 530 754- 9637, [email protected]B. OBJECTIVES 1. Demonstrate and evaluate the proportion of crop nitrogen (N) needs that are provided by soil organic matter mineralization in organic leafy vegetable production under coastal climate conditions 2. Demonstrate and evaluate mineralization behavior of a group of commonly used dry and liquid organic fertilizers under field conditions on the Central Coast 3. Demonstrate and evaluate the N and phosphorus (P) balance of organic production fields (N and P inputs, mineralization and removal) 4. Refine and update algorithms of nitrate mineralization from soil organic matter in CropManage 5. Conduct outreach to growers via demonstration plots and UC nutrient management meetings, newsletters articles, blogs and scientific reports. C. ABSTRACT This project evaluated the mineralization of nitrogen (N) from soil organic matter and organic fertilizers in field and laboratory evaluations. In addition, evaluations of microbial activity and the usefulness of nitrate testing for managing fertilizer N applications was conducted. Nitrogen mineralized from soil organic matter during the crop cycle varied from 0.3 to 1.6 lbs N/A/day in laboratory evaluations; the technique used for the in-field mineralization over estimated available N. Regardless of the technique used to estimate mineralization, the amount of N provided by mineralization of soil organic matter only provided a small portion of N needs for lettuce and spinach which require 4 and 6 lbs N/A/day during their peak growth phase, respectively. Levels of residual mineral N were higher for the
Transcript
1
A. Project Information Final Report Contract 15-0522
Evaluation and demonstration of nitrogen management of organic vegetable production in leafy green vegetables on the Central Coast
Richard Smith, UCCE Vegetable Crops Farm Advisor, Monterey, San Benito and Santa Cruz Counties, 1432 Abbott Street, Salinas, CA 93901, 831 759-7357, [email protected]
Mike Cahn, UCCE Irrigation Farm Advisor, Monterey, San Benito and Santa Cruz Counties, 1432 Abbott Street, Salinas, CA 93901, 831 759-7377, [email protected]
T.K. Hartz, Extension Specialist, Department of Plant Sciences, University of California, 1 Shields Ave. Davis, CA 95616, 530 752-1738, [email protected]
Daniel Geisseler, Extension Specialist, Department of Land, Air and Water Resources, University of California, 1 Shields Ave. Davis, CA 95616, 530 754-9637, [email protected]
B. OBJECTIVES 1. Demonstrate and evaluate the proportion of crop nitrogen (N) needs that
are provided by soil organic matter mineralization in organic leafy vegetable production under coastal climate conditions
2. Demonstrate and evaluate mineralization behavior of a group of commonly used dry and liquid organic fertilizers under field conditions on the Central Coast
3. Demonstrate and evaluate the N and phosphorus (P) balance of organic production fields (N and P inputs, mineralization and removal)
4. Refine and update algorithms of nitrate mineralization from soil organic matter in CropManage
5. Conduct outreach to growers via demonstration plots and UC nutrient management meetings, newsletters articles, blogs and scientific reports.
C. ABSTRACT This project evaluated the mineralization of nitrogen (N) from soil organic matter and organic fertilizers in field and laboratory evaluations. In addition, evaluations of microbial activity and the usefulness of nitrate testing for managing fertilizer N applications was conducted. Nitrogen mineralized from soil organic matter during the crop cycle varied from 0.3 to 1.6 lbs N/A/day in laboratory evaluations; the technique used for the in-field mineralization over estimated available N. Regardless of the technique used to estimate mineralization, the amount of N provided by mineralization of soil organic matter only provided a small portion of N needs for lettuce and spinach which require 4 and 6 lbs N/A/day during their peak growth phase, respectively. Levels of residual mineral N were higher for the
2nd and 3rd crops of the season. Nine fertilizer trials were conducted to evaluate whether measurements of residual soil nitrate-N could guide fertilizer applications. Challenges to effective use of nitrate testing include the short crop cycle for baby crops (e.g. <30 days) and the lag time in the release of mineral N from organic fertilizers. These factors necessitate testing prior to planting the crop which creates uncertainty of available nitrate-N if nitrate is leached below the rootzone with germination water which is often a large amount of water applied (e.g. 3+ inches) in a short amount of time. On sandy soils, which are more prone to leaching nitrate-N from germination water, fertilizer evaluations indicated that soil nitrate-N tests were less reliable for guiding N fertilizer applications. On sites with less leaching potential, such as clay loams, soil nitrate tests for guiding fertilizer applications were more reliable.
Field evaluations of N mineralization from organic fertilizers showed that 4-4-2 (a mixture of poultry manure plus meat and bone meal) incorporated into the soil released 54 to 70% of the N in the pellets, while topical applications released 36 to 48%. In the 20 field evaluations, the amount of N applied as fertilizer ranged from 1.4 to 5.7 times the N uptake by the crops; however, taking into consideration the amount of N mineralizes from the organic fertilizer, N applications ranged from 0.4 to 2.7 times the N uptake by the crop. The unmineralized fertilizer N likely becomes part of the soil organic matter and behaves similarly.
A portion of phosphorus (P) in 4-4-2 is from bone meal and is not soluble at a soil pH’s greater than 7.0. Twenty eight of the 29 sites evaluated in this project had soil pH >7.0. This explains why P release from 4-4-2 ranged from only 8 to17%. The low availability of P from organic fertilizers may account for the lack of higher levels of bicarbonate extractable P in organic fields in comparison with adjacent neighboring conventional fields.
A comparison of soil characteristics of 20 organic sites with adjacent conventional fields was conducted. There was a trend that indicated that organic farms had slightly higher but not statistical levels of organic matter, total soil carbon (C) and total soil N than neighboring conventional farms; however, organic farms had statistically greater levels of hydrolysis of fluorescein diacetate (FDA – a measure of soil microbial activity) and higher water extractable organic nitrogen (WEON). The organic farms in these studies made little use of cover crops and composts. One big difference in farming practices between the organic and conventional farms was the type of fertilizer used. The organic farms used 4-4-2 which contains 29% C; for instance, two baby crops grown in a season, each receiving 3,000 lbs/A 4-4-2 would add 1,566 lbs of C/A. By comparison, a 6,000 lbs cover crop would add 2,640 lbs C/A. The use of organic fertilizers over the long-run, provides significant inputs of C to soils and may be responsible for increased microbial activity that we observed.
D. INTRODUCTION
3
Organic production in Central Coast (Monterey, Santa Cruz and San Benito Counties) was valued at $648 million in 2018 (12% of total ag value) and largely consists of leafy green vegetables such as lettuces and spinach, as well as spring mix. Large-scale organic production continues to expand given the optimal climatic conditions and sale/shipping infrastructure that exists in the area. Science based information for managing N is rarely applied to organic fertilizer programs which can result in both economic and environmental ramifications. It is common for growers to use set fertility programs that do not consider residual levels of soil nitrate; the use of soil tests for residual soil nitrate has become common place in conventional production systems, but organic vegetable producers have not adopted this technology to help fine tune N fertilizer applications. Increasing the efficiency of applied N can have economic benefits because organic fertilizers represent a substantial production cost. In addition, many of the materials used contain a high proportion of P relative to N may result in high inadvertent applications of P. The over application of N and P could result in environmental issues which can be important given that organic growers are subject to regulations by Region 3 of the Central Coast Regional Water Quality Control Board (CCRWQCB).
This project focused on better understanding the sources of N in organic crop production systems: mineralization of soil organic matter, residual soil mineral N, nitrate in irrigation water and N fertilizers. In addition, the mineralization of N and release of P and potassium (K) from organic fertilizers was evaluated. Comparisons in various soil parameters such as microbial activity, soil organic matter and total N between organic ranches and neighboring conventional fields were conducted. These evaluations were used to refine current algorithms for N mineralization that are used to predict available soil N in CropManage. Outreach was made to organic growers through blogs, trade magazines and a state-wide short course on organic soil fertility.
E. WORK DESCRIPTION Evaluations of N mineralization in organic fields: In both 2016 and 2017 ten N mineralization trials were conducted (total of 20 fields) with cooperating growers in commercial production fields of organic baby (lettuce, spinach, Swiss chard and kale) and full-term romaine and broccoli. Field sites included diverse locations, growers and soil types in the Salinas Valley. Replicates of unfertilized plots one 80-inch bed wide by 50-feet long were established, and divided into three sections: 1) crop plants removed and covered with plastic mulch to eliminate leaching by irrigation water. The plastic mulch was applied after the germination water to wet the soil which maintained it moist over the course of the crop cycle. The plastic mulch that was used was white on black and the white side faced up to reflect light away from the soil and minimize artificial heating of the soil by the plastic mulch. The black side of the plastic faced downward to inhibit the growth of weeds. 2) crop plants removed which provided a measure of N dynamics in the soil without crop removal but with leaching; and 3) with crop plants to provide a measure of the N dynamics in the soil with crop removal and
4
leaching but with no added N fertilizer. These three sections allowed us to measure mineralization of nitrate from soil organic matter without the confounding influences of crop removal and leaching by irrigation water. These unfertilized plots were paired with fertilized plots with and without plants. Water collection containers with a funnel were installed to measure the quantity of irrigation water applied with each irrigation; soil temperature and moisture instruments (Decagon 10HS) were installed in the three divisions of the unfertilized plots. Soil in each of the sections just described were sampled to 12 inches deep each week during the crop cycle. Samples were extracted with 2M KCl and analyzed for mineral nitrogen. An initial soil sample of the field was analyzed for total N content of the soil, organic matter content and extractable N and C. Crop yield and biomass N was evaluated at maturity. The nitrate-N content of the water was measured, and total N applied with irrigation was calculated from the water application estimates mentioned above.
Evaluations of N and P release from dry and liquid organic fertilizers: In 2016 and 2017 four field evaluations of N, P and K release from organic dry fertilizers were conducted. Twenty grams of 4-4-2 (poultry manure, feather meal and meat & bone meal) and 12-0-0 (feather meal) organic fertilizers were placed into 4 x 5-inch poly propylene mesh bags; the fertilizer was laid out in a single layer in the bags and the bags were placed either on the soil surface (held in place with 4 inch long metal staples) or buried three inches deep in the soil in an unfertilized plot; the bags were subject to wetting by the sprinkler irrigation practices used over the course of a commercial vegetable production cycle. Four bags from each location were removed each week, and the contents were collected from the bag and dried and weighed and then analyze for total N, P and K content.
Aerobic laboratory incubations were conducted at UC Davis. The incubations simulated soil incorporated dry fertilizer or liquid fertilizer. Soils from two organically managed fields was collected, air-dried and thoroughly mixed. Organic fertilizers were blended with these soils at approximately 100 mg N kg-1 soil, brought to field capacity water content, and incubated at 20 oC. At 2, 4 and 8 weeks of incubation, subsamples were extracted with 2 N KCl and mineral N (NH4-N and NO3-N) was determined. The rate of net N mineralization from the organic fertilizers was estimated as the increase in mineral N over time, minus that measured in control (unfertilized) soil.
Balance of N and P inputs in the soil and lettuce crops: Evaluations of N and P inputs from fertilizer, mineral N, nitrate-N in irrigation water and composts was evaluated in each of the 20 soil mineralization evaluations. Nitrogen and P in fertilizer was accounted for based on the application rates and analysis. Quantities of N in the irrigation water was measured and the load of N applied in the irrigation water was calculated based on the concentration of N in the irrigation water and the application rates as measured by a flow meters (drip irrigation) or the funnel/pipe reservoir (sprinkler irrigation). Nitrogen and P content of crop residue was measured at harvest evaluations in which the quantity of
5
residue and its and N and P content were measured. Evaluations of nitrate leaching were conducted in selected N mineralization fields.
Refine N mineralization algorithms currently used in CropManage: Algorithms used by CropManage were updated and refined based on the data developed by this project. Nitrogen mineralization algorithms will be added to CropManage to ultimately make the N management aspect of CropManage useable by organic vegetable producers.
Outreach/Demonstration: Outreach to growers and allied industry personnel was made through presentations at the annual Irrigation and Nutrient Management Meeting in Salinas and at industry meetings and university classes; results were published through newsletter, entries and industry trade magazines. A statewide University short course on organic soil fertility was held on February 12, 2019 where these results of this project were presented with other relevant topics.
F. DATA/RESULTS Evaluations of N mineralization in organic fields: Twenty in-field N mineralization trials were conducted with cooperating growers in commercial organic baby (spinach, lettuce, kale and chard) and full-term romaine lettuce and broccoli crops. Field sites included diverse locations and soil types in the Salinas Valley (Tables 1&2). Replicated fertilized and unfertilized plots were established as described in the methods and mineral N was sampled to 12 inches deep each week over the course of the crop cycle (baby crops = app. 30 days and full-term crops = app. 65 days). Soil samples from field site evaluations were sent to UC Davis for laboratory incubations to estimate N mineralization rates. Estimates of mineralization from soil organic matter from in-field evaluations varied from 0.3 to 3.3 lbs N/A/day and from 0.3 to 1.6 lbs N/A/day in laboratory evaluations (Table 3). There was a poor correlation between the two estimates (R2 = 0.08). In general, the field estimates of mineralization were higher than the lab estimates (mean=1.6 vs 0.5 lbs N/A/day, respectively); field estimates were also high in comparison with estimates of N mineralization found in the literature. Regardless of the technique used, the amounts of N that is mineralized from the soil organic matter, is substantially lower than the quantity of N that is needed by fast growing leafy green vegetables during the last half of the growing season (period of maximum uptake of N), which reaches 3-4 and 5-6 lbs N/A/day for lettuce and spinach, respectively. The quantity of N supplied by mineralization from soil organic matter was lower than the initial quantity of residual mineral N at the beginning of the cropping cycle in 13 of 17 sites (Table 3). The quantity of nitrate-N supplied by the irrigation water was generally low to moderate except for sites 2 and 16 that had 56.1 and 76.2 lbs N/A, respectively. Details of each site are shown in Tables 1 – 22 in the Appendix.
The yield of the crops was increased by N fertilization in 18 of the 20 evaluations (Table 4). The increase was moderate in most fields except for sites 8, 11 and 13. The quantities of residual soil nitrate at the beginning of the crop cycle
6
correlated with the percent yield increase of the crop (R2 = 0.36, Figure 1). The reasons that there was not a better correlation may have to do with the soil type and irrigation practices that may result in leaching of residual soil nitrate beyond the rootzone, especially with the germination water on sandy soils.
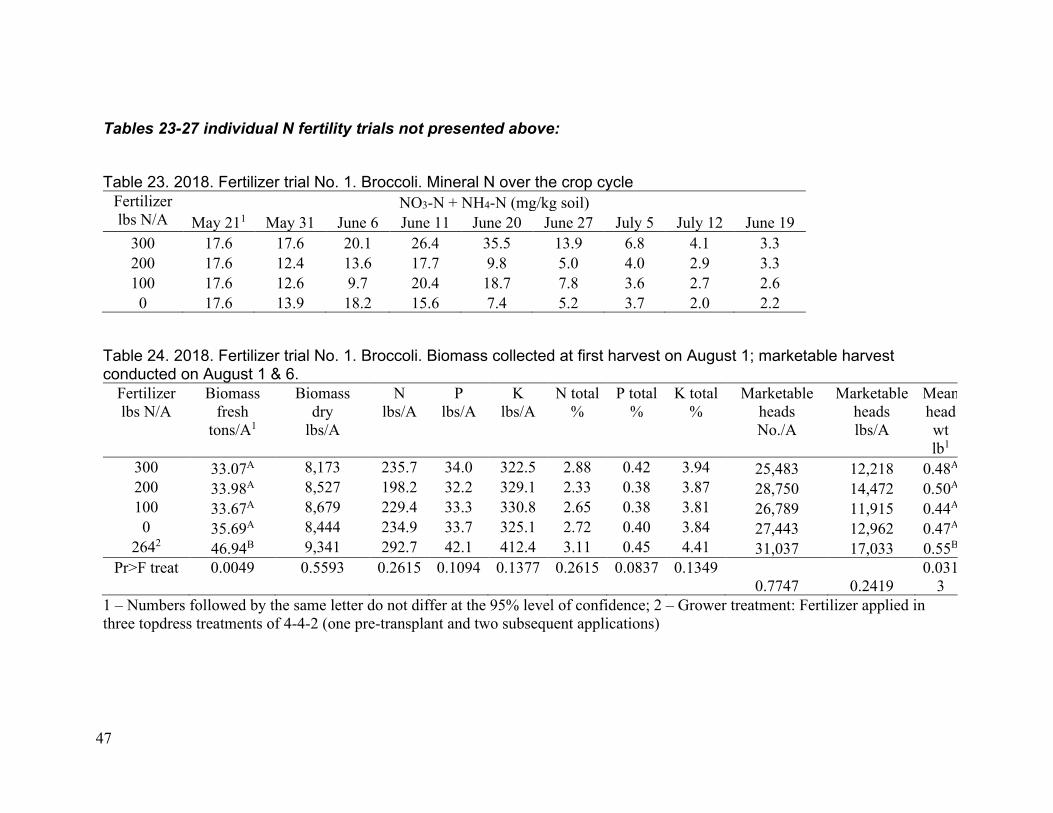
In order to better understand the benefits of accounting for levels of residual soil nitrate in the soil to guiding fertilizer N applications, nine follow up fertilizer trials were conducted in 2018 and 2019. Trials were conducted on variety of crops and soil types (Tables 5&6). The soils ranged from loamy sands to clay loams and organic matter from 0.99 to 3.47%. All trials had an untreated control that was compared with the grower standard fertilizer program and intermediate levels of applied N. Fertilizer N was applied at listing, planting and/or as a drop-on-top (DOT) application (for baby vegetables) or a DOT sidedress application (for full-term vegetables).
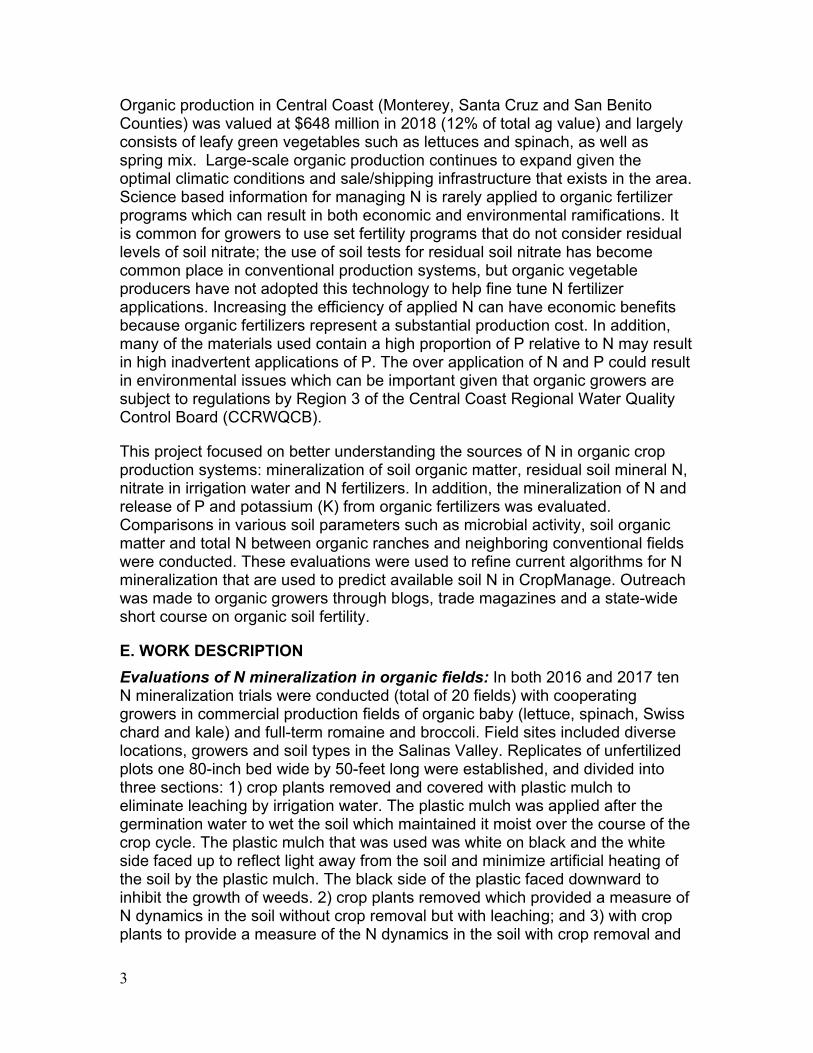
Trials that illustrate the main points of the fertilizer evaluations are presented and discussed here. Data tables for the trials not presented here are found in Tables 23 – 27 in the Appendix. Trial sites had a range of soil and crop types (Tables 5&6). Soils ranged from 0.045 to 0.188% total N, soil organic matter from 0.99 to 3.47% and clay content from 10 to 46%. Trial No. 2 was the second crop of the season and had high levels of residual soil nitrate, 33.0 ppm NO3-N, from the prior crop of baby lettuce (Table 7). Soil nitrate levels remained above 20.0 ppm NO3-N through the entire crop cycle, even in the untreated control. There was no yield improvement with additional fertilizer N, applied at listing or as a topdress at planting. There was a reduced yield in the 160 lbs N/A treatment. Yield reductions have been observed with the addition of organic fertilizer due to increased incidence of Phythium sp. causing stand reduction; it was unclear if that was the issue in this field, but the yield reduction with higher rates of fertilizer was significant. The soil type at this site was a clay loam which may have reduced nitrate leaching during the germination water; under these conditions, the preplant soil nitrate evaluation was useful for guiding fertilizer applications to this crop. Trial No. 3 was the third crop of the season and the prior crop was baby lettuce. Soil nitrate levels were 28.3 ppm NO3-N on the day of planting. The grower treatment was 160 lbs N/A, as 4-4-2 DOT at planting. Soil nitrate levels in all treatments ranged from 17.9 to 39.9 ppm nitrate-N in three sampling dates prior to harvest, Sept 4, 11 and 14. 160 lbs N/A at-planting had the highest soil nitrate-N levels on all sampling dates; at-planting applications had higher soil nitrate-N levels than equivalent topdress treatments. The treatment with120 lbs N/A applied at topdress had the lowest yield. Post planting topdressing N applications of 80 and 120 lbs N/A had lower yields than equivalent applications applied at-planting, which indicated that earlier fertilizer applications gave more time for the fertilizer to mineralize to supply N for this fast-growing crop of spinach. This trial was conducted on a sandy loam soil which may have resulted in more leaching loss of initial residual soil nitrate-N. Trial No. 4 was conducted on a clay loam soil and preplant soil nitrate N levels were 18.3 ppm. There were no statistical differences in yield among the treatments, although there was a trend of lower quantities of biomass N/A in the untreated control (Table 9). These
7
results indicate that applying 80 lbs N/A was as effective as 120 or 160 lbs N/A to this crop to achieve maximum yield. Trial No. 5 was conducted on a site under organic farming practices for 28 years. The romaine lettuce was the second crop of the season following snap beans. The grower thought there was sufficient residual soil nitrogen and did not plan to fertilize this crop. We asked him to fertilize two areas in the field to provide a comparison with his practice; 400 lbs of 12-0-0 (feather meal) were shanked into the bed at planting in the fertilizer treatment. Residual levels of soil nitrate were low, 11.9 ppm NO3-N. In the unfertilized treatment soil nitrate-N levels were moderate on three subsequent sampling dates (Sept 10 &26 and Oct 9); the nitrate-N levels then declined to low levels for the remainder of the cropping cycle (Table 10). The fertilized treatment had high nitrate-N levels for four subsequent sampling dates and then declined to low levels for the final three weeks of the cropping cycle. As part of the evaluation we conducted in-field and laboratory evaluations of mineralization of soil organic matter which were 1.0 and 0.7 lbs N/A/day, respectively. Total available N from nitrate-N mineralization from soil organic matter and N in irrigation water was 83.5 lbs N/A (based on in-field mineralization); net nitrate-N mineralization from fertilizer was 38.4 lbs N/A which gave the fertilizer treatment a total of 122 lbs N/A. Fertilizer application improved the yield of the lettuce by 3.1 lbs per box. It is possible that the difference in yield between the fertilized and unfertilized treatments (due to low soil nitrate-N levels) was not as dramatic, possibly given the robust mineralization of N at this site. Trial No. 8 was conducted on a well-drained silt loam soil during the warmest part of the season. This was the second crop of the season and followed baby lettuce; as a result, there was 21.6 ppm NO3-N at the beginning of the cropping cycle (Table 11). The nitrate values declined to low values by the end of the production season in all treatments. There were no statistical differences in yield among the treatments, but there was clear trend that the untreated control had less yield and lower levels of N in the biomass that all other treatments; clearly leaching losses of residual soil nitrate-N necessitated N fertilization for this site, but 40 lbs N/A gave equivalent yield to higher rates. This result indicates that on sandy soils with high levels of residual soil nitrate, there may be a need for fertilizer, but the amount can be modest to still achieve acceptable yields.
There is a lack of research on levels of nitrate leaching in organic vegetable production. We made some initial observations in three of these evaluations. Soil nitrate levels were measured down to 5-7 feet deep in the soil at the beginning and the end of the cropping cycle in three of the fertilizer trials (Table 12). These measurements provided an opportunity to explore whether there is evidence of nitrate leaching. Sites 5 and 6 had soil nitrate N levels at the end of the season that are mostly lower or unchanged from the initial levels. This would indicate little nitrate leaching at these sites. Site 4 has soil nitrate N levels that are enriched down to 5 feet deep, but are lower at 6-7 feet deep. This may indicate some potential leaching loss at this site.
Evaluations of N and P release from dry and liquid organic fertilizers: In 2016 and 2017 in-field N mineralization evaluations of 4-4-2 were conducted in
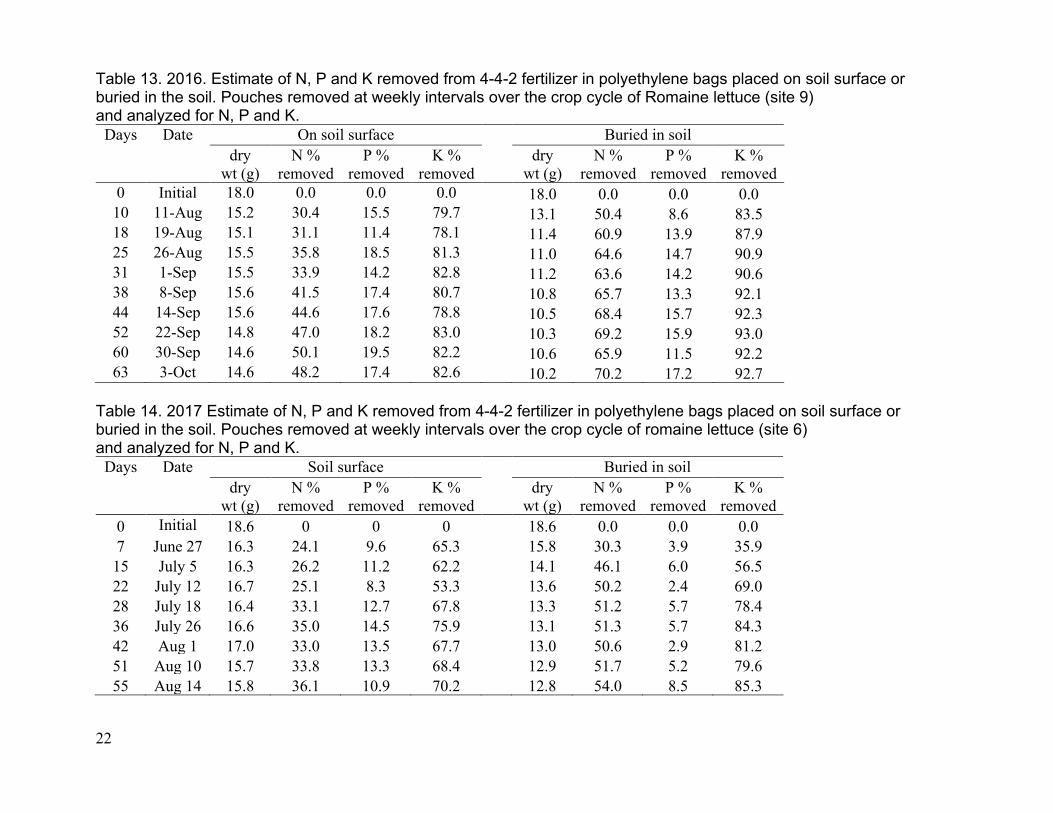
8
full-term romaine fields. In 2016 the evaluation was run from August 2 to October 3 (Table 13) and the average soil temperature at 6 inches depth over this period was 64.8 °F. The 2017 evaluation ran from June 20 to August 14 (Table 14) and the average soil temperature at 6 inches depth over this period was 69.8 °F. In 2016, over the course of 63 days 48.2% of the N in the fertilizer placed on the soil surface mineralized versus 70.2% of the N in the fertilizer that was buried in the soil (Table 13). In 2017, over the course of 55 days 36.1% of the N in the fertilizer placed on the soil surface mineralized versus 54.0% of the N in the fertilizer that was buried in the soil (Table 14). The differences between the two years is not due to soil temperatures because it was warmer in 2017. Regardless of the year to year variability, the trend between surface vs incorporated placement of the fertilizer remained constant. It is assumed that the wetting and drying of the fertilizer on the soil surface reduces mineralization while the fertilizer buried in the soil stays wetter more consistently, thereby facilitating mineralization. The release of P from surface and buried application of 4-4-2 over 63 days in 2016 was 17.4% and 17.2% for surface and buried placement, respectively in 2016; in 2017, 10.9% and 8.5% of the P released from surface and buried placement, respectively over 55 days. The lower release rate of P from 4-4-2 may be due to the high pH of the sites: 7.35 in 2016 and 7.77 in 2017. The high pH would reduce the solubilization of P from fertilizer derived from bone meal. The release of K from surface and buried application of 4-4-2 over 63 days in 2016 was 82.6% and 92.7% for surface and buried placement, respectively in 2016; in 2017 70.2% and 85.3%, was released from surface and buried placement, over 55 days. Potassium is water soluble and the observed release patterns probably reflect the efficiency of water movement through the fertilizer pouches.
In 2016 a trial was conducted comparing the release of N, P and K from 4-4-2 and with 12-0-0 buried 3 inches deep in the soil in a broccolini field. The evaluation ran from September 19 to November 29 and the average soil temperature at 6 inches depth over this period was 61.2 °F. Over the course of 71 days 60.5% of the N in 4-4-2 was released versus 86.2% of the N in 12-0-0 (Table 15). The percent of P released from 4-4-2 was 9.6% and 9.7% for 12-0-0. Potassium release was 91.0% for 4-4-2 and 85.7% for 12-0-0. It has been observed that greater percentages of N are release from fertilizers with a higher N content. This pattern was observed in this evaluation as well as in the laboratory incubations of dry fertilizers (Table 17). In 2017 an in-field comparison of mineralization of 12-0-0 placed on the soil surface and buried 3 inches deep was conducted. Over the course of 55 days 31.5% of the N was released from the surface applied fertilizer vs 86.0% from the buried fertilizer (Table 16). These data indicate that 12-0-0 releases a lower percentage of N than 4-4-2 if surface applied, but a higher percentage if incorporated into the soil. The laboratory evaluations are comparable to the incorporated in-field evaluations because the fertilizer is mixed with wet soil and incubated. The laboratory evaluations generally indicate a lower percent of N is mineralized from 4-4-2 and 12-0-0 than the in-field evaluations (Table 17), again, indicating that laboratory estimates are a more conservative estimate of N released from organic fertilizers.
9
Balance of N and P inputs in the soil and lettuce crops: Inputs of N measured were: net mineralization from fertilizer, nitrate-N applied in applied irrigation water, initial residual soil nitrate-N and N mineralized from the soil. The total amount of N is shown in Table 3. The total quantity of N available ranged from 82 to 393 lbs N/A over the crop cycle. Amount of N applied as fertilizer ranged from 1.2 to 4.8 times the N uptake by the crops. However, considering the amount mineralized over the crop cycle (Tables 13-17), fertilizer applications ranged from 0.4 to 2.7 times N uptake by the crop. This is an important consideration with regards to water quality regulations being developed by the Regional Water Quality Control Board. Organic fertilizers have two distinct phases of release of mineral N: a short rapid phase in which a portion of the N is released in the first 2-4 weeks, followed by a long slow phase. In-field and laboratory evaluations showed that mineral N released from the fertilizers never approach 100% of the N contained in the fertilizer. The highest percent N released that we measured was 86% from 12-0-0 over 55 days when it was incorporated into the soil (Table 16). The least was 31% of the N in 12-0-0 when it was applied to the soil surface. Laboratory incubations of 2.5-2.0-2.5 indicated only 15% of N mineralized over 56 days (Table 17). Under ideal conditions, high N containing materials (e.g. >8% N) can mineralize a great deal of their N, but other lower analysis materials leave a substantial portion of the N that they contain in the soil. The fate of this unmineralized N is not entirely clear, but it is assumed that it becomes part of the recalcitrant pool of soil organic matter and mineralizes similar to soil organic matter. Under this scenario the leaching potential of the residual N from organic fertilizer is probably low. We measured soil nitrate-N levels down to seven feet at the end of the cropping cycle, and in two of three fields, we observed little evidence of nitrate leaching. However, in one of the fields there was some enrichment of soil layers down to 4 feet in the soil at the end of the cropping cycle indicating downward movement of nitrate (Table 12).
Measurements of the P balance in the soil are shown in Table 18. Soil Olsen P values in the sites ranged from 10.2 to 57.2 ppm, excluding the outlier at site 2, 111.8 ppm, which was located at an old dairy pen. Total P in the soil ranged from 0.028% to 0.166% (Table 2). Organic leafy green vegetable growers may typically fertilize with 3-4000 lbs of 4-4-2 per crop (Table 1a&b) and grow multiple crops per year. If we assume total applications to a spinach crop of 3000 lbs and a similar application rate to three other crops in the same year (total of 9,000 lbs/A) that would result in 360 lbs of P2O5 or 157 lbs of P. This amount of P could easily begin to elevate bicarbonate extractable P in the soil. Elevated levels of soil P have been observed in other organic production systems which can have adverse effects on surface water quality. However, in the Salinas Valley, the soil pH’s in 28 out of 29 in-field mineralization and soil fertilizer evaluation sites were greater than 7.0 and in 23 of the 29 sites greater than 7.5. Under these conditions, the form of P in 4-4-2 and 12-0-0 was only released at a low percent ranging from 8.5% to 17.6% (Tables 13-15). Based on these estimates of P released from 4-4-2 made above, the net P released from the fertilizer may range
10
from 31 to 63 lbs of P2O5 or 13 to 28 lbs of P. Given the levels of P uptake by cool season vegetables, these levels would be at less risk for rapidly elevating soil P values. In a comparison of 20 organic fields with adjacent conventional fields, there were only slight differences in the levels of total P and Olsen P (Table 19) which may give further evidence that organic vegetable production is not elevating soil P levels, at least not more than conventional production. Figure 2 indicates that at low levels of total P, a greater percent is available as bicarbonate extractable P.
Organic vegetable production fields in the Salinas Valley are subject to the same economic and scheduling pressures as conventional production. As a result, the farms evaluated in these studies did not use cover crops or compost to any greater extent than the adjacent conventional farms. If we assume that the amount of crop residue between the two systems is equal, one difference between the organic and conventional system, that stands out is the input of carbon to the soil that comes from the use of organic fertilizers. Materials like 4-4-2 and 12-0-0 contain 28% and 46% carbon, respectively. Given the scenario presented above where 9,000 lbs of 4-4-2 is used per year for 3 vegetable crops, that equals an addition of 2,520 lbs of carbon per year. For comparison, the tops of a 7,000 lb dry matter cover crop contain 3,080 lbs of carbon. The yearly applications of substantial amounts of 4-4-2 and other organic fertilizers supply a significant input of carbon to the soil. In comparisons of soil characteristics between organic and neighboring conventional fields, there was a slight trend indicating higher levels of soil organic matter and total soil carbon in the organic systems (Table 19). Organic farms had higher levels of hydrolysis of fluorescein diacetate (FDA – a measure of soil microbial activity) and higher water extractable organic nitrogen (WEON). These data indicate that the input of carbon from the organic fertilizers is stimulating microbial activity in the organic farms relative to adjacent conventional farms.
Refine N mineralization algorithms currently used in CropManage: Currently CropManage has algorithms that estimate the quantity of mineralization of from the soil that can be expected over the crop cycle. The estimates of mineralization developed by this project will be used to refine the current algorithms for organic soils.
Outreach/Demonstration: This project had significant one to one outreach. Given the large number of field sites and the wide number of growers and crop consultants that we interacted with to coordinate and conduct the trials, we had numerous opportunities to discuss the evaluations and share ideas on crop nutrition in organic vegetable production systems. In addition, in the winter we met with each grower cooperator to discuss the results of the evaluations that we conducted on their farms. We obtained a great deal of good feedback from the cooperators that we used to refine the studies. Twenty-one talks were given that included data from these evaluations and four publications were published regarding these results. We held an all-day Statewide UC Short Course on
11
February 12, 2019 in Salinas attended by 70 people. A scientific publication of the results is planned.
12
Table 1a. 2016. Background on crop and fertilizer amount and application Site First
1 – N applied in fertilizer x % mineralized over crop cycle (estimated by pouch evaluations – see Tables 13-17) 2 – Estimate of N mineralized from soil organic matter from in-field mineralization study 3 – sum of Net N from fertilizer, N in irrigation water, Initial mineral N and N mineralized for soil over crop cycle. 4 – calculated from N mineralized from soil/days to harvest 5 – calculated from laboratory incubations conducted at 69 F for 10 weeks.
16
Table 4. 2016 sites 1-10 and 2017 sites 11-20, Yield and biomass N and P Site Fertilized
1 – Grower fertilizer program. See tables below for experimental fertilizer treatments; 2 – PI = preplant incorporation; DOT = drop on top dress application; @PL = at planting Table 6. 2018 sites 1-5 and 2019 sites 6-9. Baseline soil analysis for fertilizer rate study evaluations
Pr>F treat 0.0943 0.1304 0.1561 0.0158 1 – preplant baseline; 2 – Numbers followed by the same letter do not differ at the 95% level of confidence; 3 – grower treatment Table 8. Fertilizer trial No. 3. Spinach. Mineral nitrogen in top foot of soil (ppm NO3-N) over the cropping cycle and harvest evaluation, Sept 20
1 – preplant baseline; 2 – Numbers followed by the same letter do not differ at the 95% level of confidence; 3 – Grower practice
20
Table 9. Fertilizer trial No. 4. Spinach. Mineral nitrogen in top foot of soil (ppm NO3-N) over the cropping cycle and harvest evaluation: September 20
Fertilizer lbs N/A July 201 Sept 20 Oct 1 Oct 10 Oct 15 Harvest fresh
1 – preplant baseline; 2 – Grower practice Table 10. Fertilizer trial No. 5. Lettuce. Mineral nitrogen in top foot of soil (ppm NO3-N) over the cropping cycle.
Fertilizer1 lbs N/A
Aug 242 Sept 10 Sept 26 Oct 9 Oct 18 Oct 30 Nov 8 Net box lettuce
Pr>Ftreat --- 0.7981 0.1041 0.1254 0.0658 0.1785 0.0346 1 – Incorporated at listing + at-planting topdress Table 12. Soil nitrate-N (ppm NO3-N) early and late in the crop cycle below the root zone in the grower’s standard treatment
1 – Dates are prior to planting and after harvest of the crop
22
Table 13. 2016. Estimate of N, P and K removed from 4-4-2 fertilizer in polyethylene bags placed on soil surface or buried in the soil. Pouches removed at weekly intervals over the crop cycle of Romaine lettuce (site 9) and analyzed for N, P and K.
Table 14. 2017 Estimate of N, P and K removed from 4-4-2 fertilizer in polyethylene bags placed on soil surface or buried in the soil. Pouches removed at weekly intervals over the crop cycle of romaine lettuce (site 6) and analyzed for N, P and K.
Table 15. 2016. Estimate of N, P and K removed from 4-4-2 and 12-0-0 fertilizers in polyethylene bags buried in the soil. Pouches removed at weekly intervals over the crop cycle of broccolini (site 9) and analyzed for N, P and K.
Table 16. 2017 Estimate of N removed from 12-0-0 fertilizer in polyethylene bags placed on soil surface or buried in the soil. Pouches removed at weekly intervals over the crop cycle of romaine lettuce (site 6) and analyzed for N.
Days Date Soil surface Buried in soil dry wt
N % removed
dry wt
N % removed
0 Initial 19.1 0.0 19.1 0.0 7 June 27 18.5 12.8 14.4 30.7 15 July 5 18.3 12.0 10.5 58.9 22 July 12 18.3 12.0 7.8 74.5 28 July 18 18.9 14.7 6.7 79.0 36 July 26 18.7 14.0 6.2 82.3 42 Aug 1 18.9 16.5 5.8 83.7 51 Aug 10 16.8 25.6 5.6 84.1 55 Aug 14 16.2 31.5 5.2 86.0
24
Table 17. 2017 Laboratory incubations: Percent of initial nitrogen mineralized
Fertilizers Days incubated at 68 °F Dry 14 days 28 days 56 days
Table 18. 2016 sites 1-10 and 2017 sites 11-20, P applied in fertilizer and Olsen P in fertilized and unfertilized treatments at the end of the growing season Site Olsen-P Net P
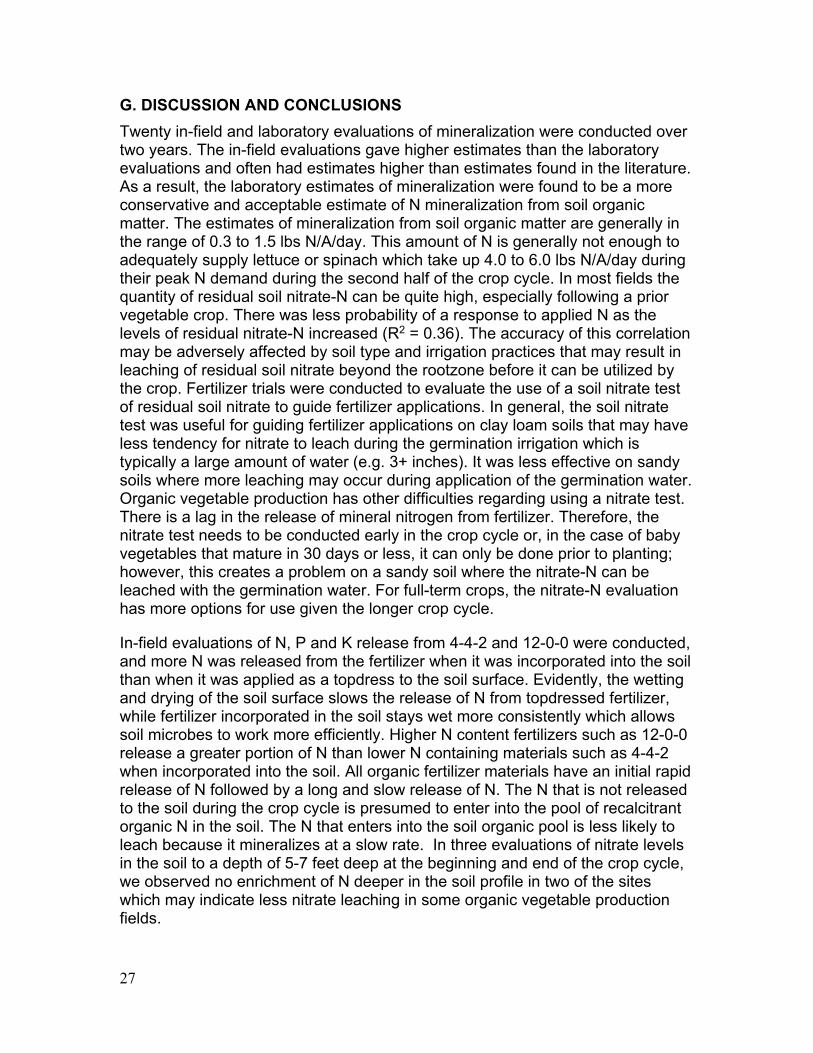
G. DISCUSSION AND CONCLUSIONS Twenty in-field and laboratory evaluations of mineralization were conducted over two years. The in-field evaluations gave higher estimates than the laboratory evaluations and often had estimates higher than estimates found in the literature. As a result, the laboratory estimates of mineralization were found to be a more conservative and acceptable estimate of N mineralization from soil organic matter. The estimates of mineralization from soil organic matter are generally in the range of 0.3 to 1.5 lbs N/A/day. This amount of N is generally not enough to adequately supply lettuce or spinach which take up 4.0 to 6.0 lbs N/A/day during their peak N demand during the second half of the crop cycle. In most fields the quantity of residual soil nitrate-N can be quite high, especially following a prior vegetable crop. There was less probability of a response to applied N as the levels of residual nitrate-N increased (R2 = 0.36). The accuracy of this correlation may be adversely affected by soil type and irrigation practices that may result in leaching of residual soil nitrate beyond the rootzone before it can be utilized by the crop. Fertilizer trials were conducted to evaluate the use of a soil nitrate test of residual soil nitrate to guide fertilizer applications. In general, the soil nitrate test was useful for guiding fertilizer applications on clay loam soils that may have less tendency for nitrate to leach during the germination irrigation which is typically a large amount of water (e.g. 3+ inches). It was less effective on sandy soils where more leaching may occur during application of the germination water. Organic vegetable production has other difficulties regarding using a nitrate test. There is a lag in the release of mineral nitrogen from fertilizer. Therefore, the nitrate test needs to be conducted early in the crop cycle or, in the case of baby vegetables that mature in 30 days or less, it can only be done prior to planting; however, this creates a problem on a sandy soil where the nitrate-N can be leached with the germination water. For full-term crops, the nitrate-N evaluation has more options for use given the longer crop cycle.
In-field evaluations of N, P and K release from 4-4-2 and 12-0-0 were conducted, and more N was released from the fertilizer when it was incorporated into the soil than when it was applied as a topdress to the soil surface. Evidently, the wetting and drying of the soil surface slows the release of N from topdressed fertilizer, while fertilizer incorporated in the soil stays wet more consistently which allows soil microbes to work more efficiently. Higher N content fertilizers such as 12-0-0 release a greater portion of N than lower N containing materials such as 4-4-2 when incorporated into the soil. All organic fertilizer materials have an initial rapid release of N followed by a long and slow release of N. The N that is not released to the soil during the crop cycle is presumed to enter into the pool of recalcitrant organic N in the soil. The N that enters into the soil organic pool is less likely to leach because it mineralizes at a slow rate. In three evaluations of nitrate levels in the soil to a depth of 5-7 feet deep at the beginning and end of the crop cycle, we observed no enrichment of N deeper in the soil profile in two of the sites which may indicate less nitrate leaching in some organic vegetable production fields.
28
Given the high rates of organic fertilizer that are applied to crops like spinach and lettuce (3-4,000 lbs/A/crop), there have been concerns that production of these crops would elevate Olsen P levels in soils, thereby creating a surface water quality hazard. The fertilizer release studies indicated that only 9-17% of the P in the fertilizer became available over the course of the cropping cycle. Given that a portion of the P in organic fertilizers may come from bone meal and the high pH’s in the soils (28 out of 29 sites >7.0), much of the P remains in an unavailable form in the soil. Considering the amount of fertilizer P that is applied and how much is released as phosphate, the fertilizer application rates of the organic fields is moderate. In a comparison of 20 organic sites with neighboring conventional vegetable production fields, Olsen and total P levels were equivalent.
Organic vegetable production fields in the Salinas Valley are subject to the same economic and scheduling pressures as conventional production. As a result, the farms evaluated in these studies did not use cover crops or compost to any greater extent than the adjacent conventional farms. If we assume that the amount of crop residue between the two systems is equal, one difference between the organic and conventional system, that stands out is the input of carbon to the soil that comes from the use of organic fertilizers. 4-4-2 contains 28% carbon and at common application rates used for leafy green production, it can supply significant input of carbon to the soil. In a comparisons of soil characteristics between organic and conventional fields, there were slightly higher levels of soil organic matter and total soil carbon in the organic systems. In addition, organic farms had higher levels of hydrolysis of fluorescein diacetate (FDA – a measure of soil microbial activity) and higher water extractable organic nitrogen (WEON. These data indicate that the input of carbon from the organic fertilizers is stimulating microbial activity in the organic farms relative to adjacent conventional farms.
H. PROJECT IMPACTS Organic vegetable production on the Central Coast of California is dominated by large-scale operations that are geared to supply mass markets across the US and internationally. These operations are subject to water quality regulations and are required to provide N-use reports to the Regional Water Quality Control Board. The water quality regulations are moving towards A-R metrics (applied – removed). Under this scenario growers will be increasingly restricted with regards to amount of N that they can apply in order for the A-R ratio to arrive at the desired value decided up by the board. The difficulty with organic production is that the fertilizer materials that they use do not mineralize 100% of the N they contain. The results of this study have helped the Regional Board to recognize that it has to accommodate this reality in the regulations they develop for organic production. That process is under way and it is hoped that reasonable regulations will be developed by the Regional Board. This project played a role in educating the regulators in this regard.
29
Regarding the impact on fertilization practices, this project received a good deal of attention from growers and crop consultants regarding N, P and K release from the fertilizers. In particular, the impact on N release from placement of the fertilizer has received attention and several growers have modified their practices to try to incorporate the fertilizer to improve N availability from fertilizers. This project did not answer all the questions regarding the use of nitrate testing to guide fertilizer applications, but it did provide the first evaluations on this issue that can be built upon by subsequent research efforts. I. OUTREACH ACTIVITIES SUMMARY Meetings
• Title: Organic Agriculture Training o Sponsor: Crop Production Services o August 5, 2016, Fresno; attendance - 95. o Richard Smith
• Title: Organic fertilizer research update o Sponsor: Annual UCCE Monterey County Meeting, 2017 Irrigation
and Nutrient Management meeting o Feb 23, 2017, Salinas; attendance – 103 o Richard Smith
• Title: Management of nitrogen in vegetable production systems o Sponsor: Hartnell College class o April 18, 2017, Salinas; attendance – 21 o Richard Smith
• Title: Management of nitrogen in organic vegetable production systems o Sponsor: Cal Poly Crop management class o Sept. 29, 2017, San Luis Obispo; attendance – 28 o Richard Smith
• Title: Organic fertilizer research project o Sponsor: 2017 FREP Annual Conference o Nov. 2, 2017, Modesto; attendance -180 o Richard Smith
• Title: Evaluation of organic fertilizers and soil mineralization o Sponsor: UCCE, Santa Barbara, Annual Vegetable and Strawberry
Meeting o November 28, 2017, Santa Maria; attendance – 45 o Richard Smith
• Title: Sources of phosphorus for organic vegetable production o Sponsor: Sponsor: Resource Conservation District, Sustainable
Soil Management Serie o April 5, 2018, Watsonville; attendance – 13 o Richard Smith
• Title: Organic soil fertility management o Sponsor: Agricultural and Land Based Training Association, Farmer
Training Meeting o August 22, 2018, Salinas; attendance – 30
30
o Richard Smith • Title: Sources of phosphorus for organic vegetable production
o Sponsor: Resource Conservation District, Sustainable Soil Management Series
o August 28, 2018, Watsonville; attendance – 25 o Richard Smith
• Title: Evaluation of nitrogen and phosphorus management in organic vegetable production
o Sponsor: Fertilizer Research and Education Program, Annual Conference
o October 24, 2018, Seaside; attendance – 130 o Richard Smith
• Title: Research Update on Soil Fertility of Organic Vegetable o Sponsor: Wilbur Ellis Research Meeting o October 25, 2018, Seaside; attendance – 55 o Richard Smith
• Title: Evaluation of residual mineral nitrogen for managing nitrogen fertilizer applications in organic vegetable production
o Sponsor: American Society of Agronomy o November 6, 2018, Baltimore, MD; attendance – 25 o Richard Smith
• Title: Organic Vegetable Production in the Salinas Valley o Sponsor: UC Davis Vegetable Production Class o November 10, 2018, Soledad; attendance – 45 o Richard Smith
• Title: Principles of Fertilization of Organic Vegetable o Sponsor: Cal Poly Organic Vegetable Production Class o December 5, 2018, San Luis Obispo: attendance – 40 o Richard Smith
• Title: Organic Soil Fertility for Vegetable Production o Sponsor: Ecological Farming Conference o January 24, 2019, Asilomar; attendance – 60 o Richard Smith
• Title: Organic Soil Fertility for Vegetable Production (Spanish) o Sponsor: Ecological Farming Conference o January 25, 2019, Asilomar; attendance – 25 o Richard Smith
• Title: Soil Fertility for Production of Organic Leafy Green Vegetables o Sponsor: California Chapter of the American Society of Agronomy;
February 6, 2019, Fresno; attendance – 80 o Richard Smith
• Title: Organic Soil Fertility Short Course o Sponsor: University of California Cooperative Extension, Monterey
County; February 12, 2019, Salinas; attendance – 70 o Richard Smith
• Title: Mineralization of N from Soil Organic Matter and Organic Materials
31
o Sponsor: Organic Soil Fertility Short Course; for Vegetables, February 12, 2019 in Salinas; attendance – 70
o Daniel Geisseler • Title: Nitrogen Management in Annual Vegetable Crops
o Sponsor: Nitrogen Management Training Program for California Certified Crop Advisers, March 13, 2019 in Fresno
o Daniel Geisseler • Title: Nutrient Management
o Sponsor: California Farm Academy Training; June 6, 2019 in Davis o Daniel Geisseler
Publications
• Release of nitrogen from organic soils and fertilizers investigated, UCCE Monterey County Blog, April 21, 2017: http://ucanr.edu/blogs/blogcore/postdetail.cfm?postnum=23882
• Smith, R.F., T.K. Hartz, D. Geisseler and P. Love. 2018. Release of mineral nitrogen from organic soils and fertilizers investigated. UCCE Monterey County Blog, April 20. https://ucanr.edu/blogs/blogcore/postdetail.cfm?postnum=26970
• Smith, R.F. 2018. Organic soil fertility for cool season vegetables. Organic Farmer 1(3):32-34
• Smith, R.F. 2019. Organic soil fertility for production of leafy green vegetables. Proceedings of the California Chapter of the American Society of Agronomy, pp 88-92. Fresno, February 5-6.
J. FACT SHEET/DATA BASE TEMPLATE Contract 15-0522 1. Evaluation and demonstration of nitrogen management of organic vegetable production in leafy green vegetables on the Central Coast 2. 15-0522 3. Richard Smith and Michael Cahn, University of California Cooperative Extension, Monterey County and Tim Hartz and Daniel Geisseler, University of California, Davis 4. January 2016 to June 2020 5. Salinas 6. Monterey, Santa Cruz and San Benito Counties 7. Highlights
• Nitrogen (N) mineralization estimates from soil organic matter ranged from 0.3 – 1.6 lbs N/A/day and was generally not sufficient to meet the N needs of fast-growing leafy vegetables that take up 3-5 lbs N/A/day • Organic fertilizer does not release all the N that they contain over the crop cycle; however, they released more N incorporated into the soil than with topdress applications • Organic fertilizer rates used in the 20 evaluations were modest in comparison to rates of N taken up by the crops • In a comparison of 20 paired organic and conventional farms indicated that organic farms had higher levels of hydrolysis of fluorescein diacetate (FDA) which indicates greater soil microbial activity. The input of carbon from the organic fertilizers probably is responsible for the higher microbial activity.
8. Introduction: Organic production in Central Coast (Monterey, Santa Cruz and San Benito Counties) was valued at $648 million in 2018 (12% of total ag value) and largely consists of leafy green vegetables such as lettuces and spinach, as well as spring mix. Increasing the efficiency of applied N can have economic benefits because organic fertilizers represent a substantial production cost. Organic growers are subject to regulations by the Central Coast Regional Water Quality Control Board (CCRWQCB) and are under pressure to comply with water quality regulations. This project focused on better understanding improvements in N and P management. 9. Methods/Management: Nitrogen mineralization trials were conducted in of 20 commercial organic cool-season vegetable fields. Replicated fertilized and unfertilized plots were established to make in-field estimates of N mineralization. Crop yield and biomass N was evaluated when the crop was mature. The nitrate-
33
N content of the water was measured, and total N applied with irrigation was calculated from the water application estimates mentioned above. In-field evaluations of N, P and K release from organic dry fertilizers were conducted. 4-4-2 and 12-0-0 organic fertilizers were placed into poly propylene mesh bags placed on the soil surface or buried in the soil; the bags were subject to sprinkler irrigation wetting and drying cycles. Four bags from each location were removed each week, and the contents were collected from the bag and dried and weighed and then analyze for total N, P and K content. Laboratory evaluations of mineralization of N from organic fertilizers was also conducted. Algorithms used by CropManage were updated and refined based on the data developed by this project. Outreach to growers and allied industry personnel was made through presentations at UC grower and industry meetings, University classes and a State-wide University short-course. 10. Findings: Nitrogen mineralized from soil organic matter during the crop cycle varied from 0.3 to 3.3 lbs N/A/day in-field evaluations and from 0.3 to 1.6 lbs N/A/day in laboratory evaluations. The laboratory estimates were determined to be a more accurate representation of mineralization. The amount of N provided by mineralization of soil organic matter provided a small portion of the crop needs because crops like lettuce and spinach which require 4 and 6 lbs N/A/day, respectively during their peak growth phase. Residual levels of mineral N often provided a more significant contribution to crop needs, especially in the 2nd and 3rd crops of the season. Nine fertilizer trials were conducted to evaluate whether measurements of residual soil nitrate-N could guide fertilizer applications. Challenges to effective use of nitrate testing include the short crop cycle for baby crops (e.g. <30 days) and the lag time in the release of mineral N from organic fertilizers. These factors necessitate testing earlier in the crop cycle than might be optimal if water applied in irrigations leach nitrate below the rootzone. On sites with less leaching potential, soil nitrate tests were found to be a useful tool to guide fertilizer applications.
Field evaluations of N mineralization from organic fertilizers showed that 4-4-2 incorporated into the soil released more mineral N than topical applications. The amount of N applied as fertilizer ranged from 1.4 to 5.7 times the N uptake by the crops. However, considering net mineralization of the organic fertilizer, then fertilizer applications ranged from 0.4 to 2.7 times the N uptake by the crop.
A large portion of phosphorus (P) in 4-4-2 is from bone meal and is not soluble at the soil pH at the sites evaluated in this study. Phosphorus release from 4-4-2 ranged from 8-17% over 60 days. The low release of P from organic fertilizers may account for the lack of elevated levels of bicarbonate extractable P in organic fields than in comparable neighboring conventional fields.
A comparison of soil characteristics of 20 organic sites with adjacent conventional fields was conducted. Organic farms had slight increases in organic matter, total soil carbon (C) and total soil N were observed over conventional
34
farms; however, statistically greater levels of hydrolysis of fluorescein diacetate (FDA – a measure of soil microbial activity) and higher water extractable organic nitrogen (WEON) were observed. These evaluations indicate that soil microbial activity responds to organic practices employed on the farms studied. The organic farms in these studies made little use of cover crops and composts. The biggest difference in carbon inputs to the soil was the use of organic fertilizer in organic production. For instance, 4-4-2 contains 29% C and two baby crops grown in a season, each receiving 3,000 lbs/A 4-4-2 would add 1,566 lbs of C/A. By comparison, a 6,000 lbs cover crop would add 2,640 lbs C/A. The use of organic fertilizers over the long run, provides significant inputs of C to soils and stimulates microbial activity.
K. COPY OF THE PRODUCT/RESULT Refined algorithms developed by this project for mineralization of N in organic production fields will be added to the CropManage web-based decision support program in the next round of updates to the program.
The UC ANR Publication 7249, Soil Fertility Management for Organic Crops, will be updated and expanded using the information from this publication. A scientific journal article on the results of this project will be prepared and published.
35
Appendix Tables 1-22 individual field mineralization evaluations: Table 1. 2016. Site 1. Mineral nitrogen in top foot of soil over the cropping cycle.
Treatment NO3-N + NH4-N (mg/kg soil)
April 20 April 26 May 5 May 10 May 13 mean SE mean SE mean SE mean SE mean SE
fert plants 28.1 0.5 27.4 1.3 20.8 2.2 14.7 4.1 8.1 0.7 11.2 3.4 6.6 0.3 Table 12. 2017 Site 1. Mineral nitrogen in top foot of soil over the cropping cycle.
Treatment NO3-N + NH4-N (mg/kg soil)
March 30* April 13 April 24 May 2 mean SE mean SE mean SE mean SE
fert plants 14.0 0.5 14.9 0.30 15.1 0.71 10.3 1.74 18.5 5.20 11.1 2.70 6.7 0.87 2. Table 14. 2017 Site 3. Mineral nitrogen in top foot of soil over the cropping cycle.
Treatment NO3-N + NH4-N (mg/kg soil)
May 1* May 24 June 1 June 9 mean SE mean SE mean SE mean SE
Plastic mulch 22.6 0.71 8.5 0.77 12.8 0.95 18.1 0.83 No fert no
Table 16. 2017 Site 4. Nitrate nitrogen in top three feet of soil at the beginning and end of the crop cycle.
Treatment Depth foot
NO3-N + NH4-N (mg/kg soil) May 11* July 27
mean SE mean SE No fertilizer with plants 1 29.4 4.31 1.2 0.17 No fertilizer with plants 2 5.9 0.67 1.5 0.28 No fertilizer with plants 3 4.9 1.58 5.0 0.96 Fertilized with plants 1 29.4 4.31 8.6 4.38 Fertilized with plants 2 5.9 0.67 2.3 1.03 Fertilized with plants 3 4.9 1.58 12.8 5.16
44
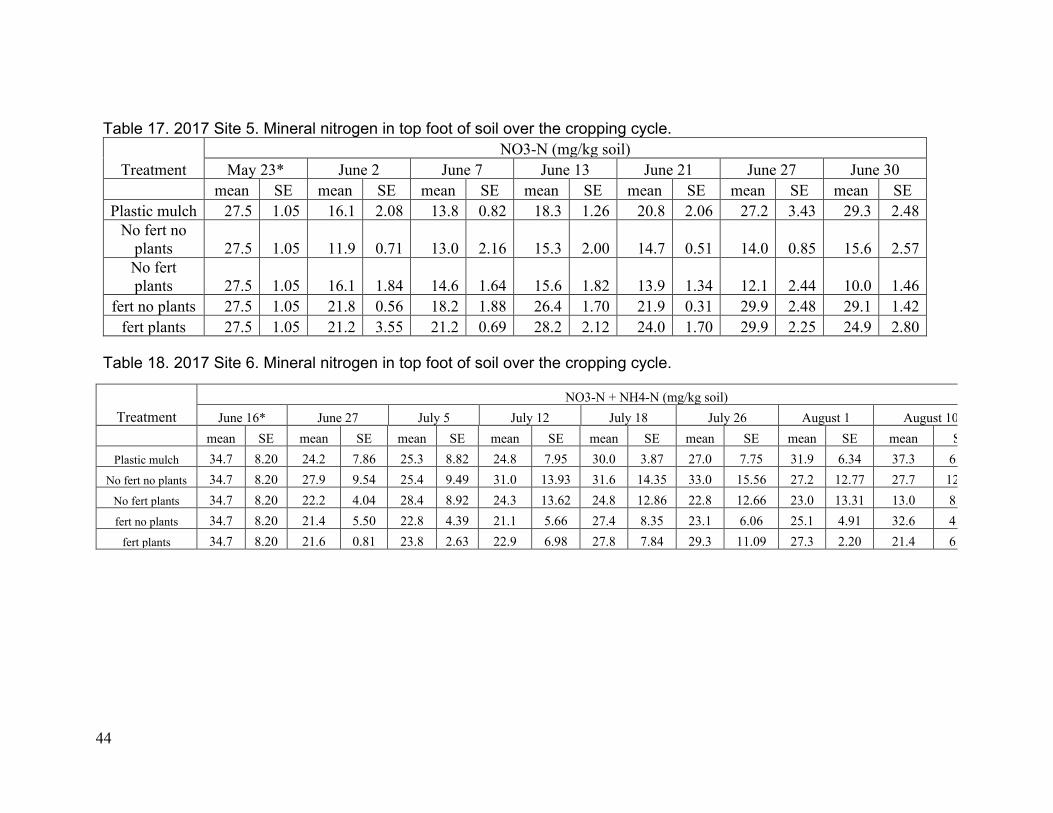
Table 17. 2017 Site 5. Mineral nitrogen in top foot of soil over the cropping cycle.
Treatment NO3-N (mg/kg soil)
May 23* June 2 June 7 June 13 June 21 June 27 June 30 mean SE mean SE mean SE mean SE mean SE mean SE mean SE
Plastic mulch 27.5 1.05 16.1 2.08 13.8 0.82 18.3 1.26 20.8 2.06 27.2 3.43 29.3 2.48 No fert no
3 1 – Numbers followed by the same letter do not differ at the 95% level of confidence; 2 – Grower treatment: Fertilizer applied in three topdress treatments of 4-4-2 (one pre-transplant and two subsequent applications)
48
Table 25a. 2019. Fertilizer trial No. 6. Romaine. Mineral N over the crop cycle At-planting lbs N/A