Page 1
ORIGINAL ARTICLE
Evaluation and prediction of blast-induced ground vibrationat Shur River Dam, Iran, by artificial neural network
Masoud Monjezi • Mahdi Hasanipanah •
Manoj Khandelwal
Received: 23 April 2011 / Accepted: 17 January 2012 / Published online: 18 February 2012
� Springer-Verlag London Limited 2012
Abstract The purpose of this article is to evaluate and
predict blast-induced ground vibration at Shur River Dam
in Iran using different empirical vibration predictors and
artificial neural network (ANN) model. Ground vibration
is a seismic wave that spreads out from the blasthole
when explosive charge is detonated in a confined manner.
Ground vibrations were recorded and monitored in and
around the Shur River Dam, Iran, at different vulnerable
and strategic locations. A total of 20 blast vibration records
were monitored, out of which 16 data sets were used for
training of the ANN model as well as determining site
constants of various vibration predictors. The rest of the 4
blast vibration data sets were used for the validation and
comparison of the result of ANN and different empirical
predictors. Performances of the different predictor models
were assessed using standard statistical evaluation criteria.
Finally, it was found that the ANN model is more accurate
as compared to the various empirical models available. As
such, a high conformity (R2 = 0.927) was observed
between the measured and predicted peak particle velocity
by the developed ANN model.
Keywords Ground vibration � Blasting � Artificial
neural network � Shur River Dam
1 Introduction
Ground vibrations resulting from the blasting are nettle-
some problems for mining. Whenever an explosive charge
detonates in a blasthole, huge amount of energy in terms of
high pressure and temperature is released. Only a part
(20–30%) of this energy is used for the actual fragmenta-
tion and displacement of the rock mass, and the rest of the
energy is wasted away and creates nuisances, such as blast
vibration, air blast, flyrock, noise, dust and back break. All
around the world, researchers are working to provide
appropriate damage criteria and to enhance the blasting
efficiency with higher trustiness and lesser nuisances [1–4].
Ground vibration is the result of the blasting operation.
This phenomenon is very crucial and critical as compared
to other ill effects that involve public residents in the close
vicinity of mining sites, mine owners and environmental-
ists. Also, with the emphasis shifting toward eco-friendly,
sustainable and geo-environmental activities, the field of
ground vibration has now become an important and imper-
ative parameter for safe and smooth running of any mining
and civil project [5]. When intensity of ground vibrations is
high, it annoys human beings and can even damage nearby
structures. As a consequence, measurement and prediction
of ground vibration level is necessary to judge the design of
blasting operations [6]).
Level of ground vibration depends mainly on two
parameters, that is, controllable parameters and uncon-
trollable parameters. Controllable parameters include bur-
den, spacing, stemming, subdrilling, hole diameter, total
charge and maximum charge per delay and delay interval,
M. Monjezi (&)
Faculty of Engineering, Tarbiat Modares University,
Tehran, Iran
e-mail: [email protected]
M. Hasanipanah
Islamic Azad University, Tehran South Branch, Tehran, Iran
M. Khandelwal
Department of Mining Engineering, College of Technology
and Engineering, Maharana Pratap University of Agriculture
and Technology, Udaipur 313001, India
e-mail: [email protected]
123
Neural Comput & Applic (2013) 22:1637–1643
DOI 10.1007/s00521-012-0856-y
Page 2
while uncontrollable parameters are rock conditions,
geology and rock properties [7].
A number of empirical equations were proposed by
different researchers to predict the peak particle velocity
(PPV) and to minimize and control the ground vibration.
Ground vibration is defined in terms of PPV. The maximum
velocity (measured in millimeters per second or inches per
second) at which a particle moves in the ground relative to
its inactive state is termed as PPV. The most commonly used
empirical predictor equations are shown in Table 1.
Where PPV is peak particle velocity (mm/s), D is the
distance between the blasting face to measuring locations
(m), W is the maximum explosive charge per delay (kg), K,
a, b and n are the site constants, which can be calculated by
multiple regression analysis.
Because the number of influencing parameters is too
high and the inter-relation among them is also very com-
plicated, empirical methods may not be fully suitable for
such problems. Currently, various artificial intelligence
techniques are frequently applied in such type of problems.
The artificial neural network (ANN) is a branch of the
artificial intelligence science and has developed rapidly
since the 1980s. Nowadays, ANN is considered one of the
intelligent tools to solve complex problems. ANN has the
ability to learn from patterns acquainted before. It is a
highly interconnected network of a large number of pro-
cessing elements called neurons in an architecture inspired
by the brain. ANN can be massively parallel and hence said
to exhibit parallel distributed processing [13].
ANN shows characteristics such as mapping capabilities
or pattern association, generalization, robustness or fault
tolerance as well as parallel and high-speed information
processing. ANN learns by examples; thus, it can be
trained with known examples of a problem to acquire
knowledge about it. Once appropriately trained, the net-
work can be put to effective use of solving unknown or
untrained instances of the problem [14]. Due to its multi-
disciplinary nature, ANN is becoming popular among the
researchers, planners, designers, etc. as an effective tool for
the accomplishment of their work. Therefore, ANN is
being successfully used in many industrial areas as well as
in research area. A number of researchers are using ANN in
various geo-mining problems [5, 6, 13, 15–19].
In the present paper, different empirical equations and
ANN technique have been used to predict PPV and the
computed results are compared with the data of the actual
field.
2 Case study
The project test site is the region of Shur River Dam in Sar
Cheshmeh, Iran. Topography of the region has led to
design dam structure in two separate parts, as shown in
Fig. 1. The first part is the main dam with height 85.5 m,
and the second part is the saddle dam with height 36.5 m
from the foundation. The dam can store up to 34 million
cubic meters of water. Different mines are in the vicinity of
the dam site. Mines in this region include main mine and
second mine. Distance between main mine and second
mine, and river dam are 1,000 and 500 m, respectively.
There is always a high risk of damage to dam due to blast
vibration. So, a blast vibration study was carried out at dam
site while blasting is performed in the mines. A total of 20
blast vibration records were monitored at the dam site.
Ground vibration was recorded with the help of a seis-
mograph MR 2002-CE from M/S SYSCOM, Swiss, Fig. 2.
This seismograph measures PPV in three orthogonal
directions. Dynamic range of this seismograph is more than
96 dB and sampling rate is 500 samples per second.
3 Data set
In this study, a total of 20 blast vibration records were
monitored at the dam site from which 16 data sets were
used for training of the ANN model and getting site
Table 1 Different empirical formulas for predicting PPV [8–12]
Empirical formulas Equation
USBM PPV ¼ K � Dffiffiffiffi
Wph in
Ambraseys–Hendron PPV ¼ K � DW0:33
h in
Davies et al. [10] PPV ¼ K�Db
W�a
Indian Standard PPV ¼ K � WD2=3
h i�n
Roy PPV ¼ aþ K � Dffiffiffiffi
Wph i�n
Fig. 1 Location of main dam and saddle dam
1638 Neural Comput & Applic (2013) 22:1637–1643
123
Page 3
constants of empirical equations, whereas the rest of the 4
data sets were used for the validation and comparison of
the ANN model and the results of other predictors.
Different blast parameters collected from the site are
PPV (mm/s), total charge (kg), maximum charge per delay
(kg), and distance between shot point and monitoring sta-
tion (m). Table 2 shows sample data sets of blast vibration.
Also, Fig. 3 shows the particle velocity produced from a
blast event.
4 Neural network model
ANNs have originated from the biological structure of the
human brain. Neural network model is built of cells that are
called neurons. Each neuron can receive, process and
transmit the electro-chemical signals dendrites extend from
the cell body to other neurons. Therefore, the neural net-
work establishes a relationship between input and output.
4.1 Training a network with back-propagation
algorithm
A neural network needs first to be trained before importing
new data sets. Different algorithms are available to train
neural networks, but back-propagation algorithm is mostly
used to solve the predicting problems [19].
The back-propagation networks have an input layer, one
or more hidden layers, and an output layer, as shown in
Fig. 4. Each layer is composed of different processing
elements called neurons. A transfer function processes
input data that reach the corresponding neuron. To differ-
entiate between the different processing units, values called
biases are introduced in the transfer functions. These biases
are referred to as the temperature of a neuron.
The algorithm that is used to train network is scaled
conjugate gradient. This algorithm is so abstruse, but its
base is made by two ways, namely Levenberg–Marquardt
algorithm and conjugate gradient algorithm.
Fig. 2 MR2002 to measure ground vibration
Table 2 Results of the ground vibration measurements
Event Total
charge (kg)
Maximum charge
per delay (kg)
Distance
(m)
PPV
(mm/s)
1 5,280 2,800 1,334.5 1.9
9 6,400 5,300 823 5.38
14 8,500 6,400 904 5.42
Fig. 3 Particle velocity from an
operation blasting, recorded by
MR2002
Neural Comput & Applic (2013) 22:1637–1643 1639
123
Page 4
5 Model performance
Performances of the different predictor models were
assessed using different standard statistical performance
evaluation criteria. The statistical measures considered
were coefficient of determination (COD), mean absolute
percentage error (MAPE), root mean square error (RMSE),
variance absolute relative error (VARE), median absolute
error (MEDAE) and variance account for (VAF). Various
statistical performance measures are listed in Table 3.
Where ti is measured values and xi is predicted values by
predictor models. A model which gives higher VAF is
better than that which gives lower VAF. A model which
gives lower MAPE is better than that which gives higher
MAPE. A model which gives lower VARE is better than
that which gives higher VARE. A model which gives lower
MEDAE is better than that which gives higher MEDAE.
6 Network architecture for predicting PPV
In this study, a four-layer feed-forward back-propagation
neural network is considered as the model. The architecture
of the network is given in Table 4.
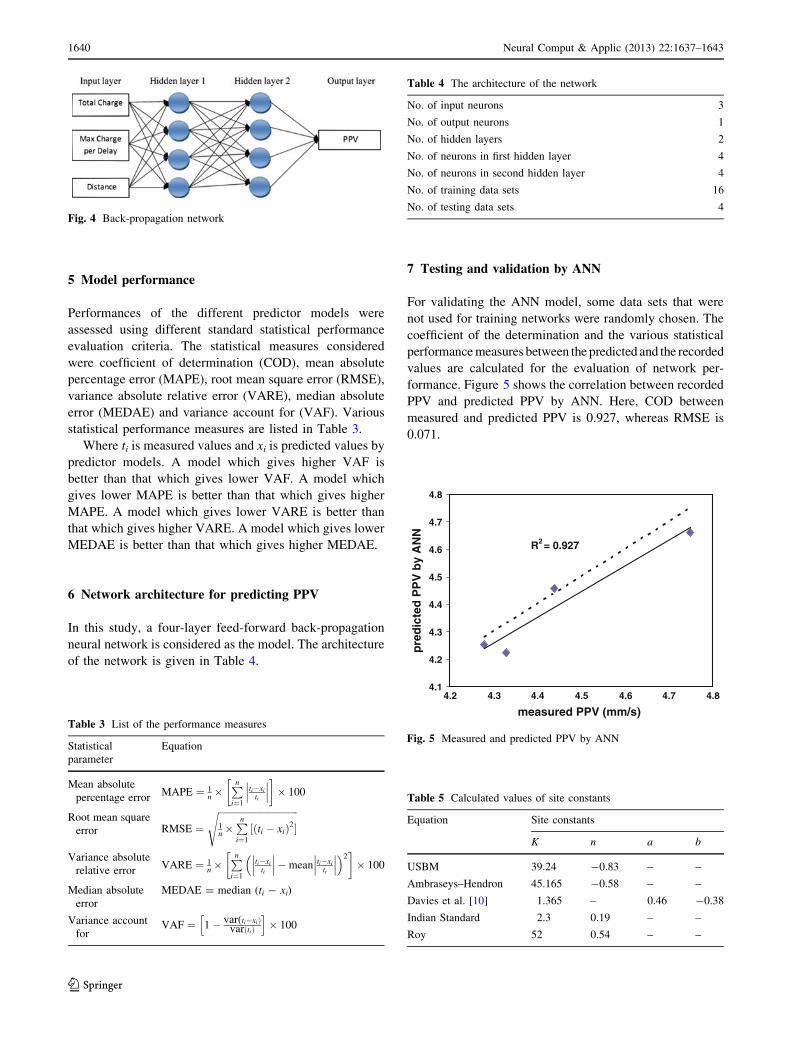
7 Testing and validation by ANN
For validating the ANN model, some data sets that were
not used for training networks were randomly chosen. The
coefficient of the determination and the various statistical
performance measures between the predicted and the recorded
values are calculated for the evaluation of network per-
formance. Figure 5 shows the correlation between recorded
PPV and predicted PPV by ANN. Here, COD between
measured and predicted PPV is 0.927, whereas RMSE is
0.071.
Fig. 4 Back-propagation network
Table 3 List of the performance measures
Statistical
parameter
Equation
Mean absolute
percentage errorMAPE ¼ 1
n�P
n
i¼1
ti�xi
ti
�
�
�
�
�
�
� �
� 100
Root mean square
error RMSE ¼ffiffiffiffiffiffiffiffiffiffiffiffiffiffiffiffiffiffiffiffiffiffiffiffiffiffiffiffiffiffiffiffiffiffi
1n�
P
n
i¼1
½ðti � xiÞ2�s
Variance absolute
relative errorVARE ¼ 1
n�P
n
i¼1
ti�xi
ti
�
�
�
�
�
��mean ti�xi
ti
�
�
�
�
�
�
� �2� �
� 100
Median absolute
error
MEDAE = median (ti - xi)
Variance account
forVAF ¼ 1� var(ti�xiÞ
varðtiÞ
h i
� 100
Table 4 The architecture of the network
No. of input neurons 3
No. of output neurons 1
No. of hidden layers 2
No. of neurons in first hidden layer 4
No. of neurons in second hidden layer 4
No. of training data sets 16
No. of testing data sets 4
R2 = 0.927
4.1
4.2
4.3
4.4
4.5
4.6
4.7
4.8
4.2 4.3 4.4 4.5 4.6 4.7 4.8
measured PPV (mm/s)
pre
dic
ted
PP
V b
y A
NN
Fig. 5 Measured and predicted PPV by ANN
Table 5 Calculated values of site constants
Equation Site constants
K n a b
USBM 39.24 -0.83 – –
Ambraseys–Hendron 45.165 -0.58 – –
Davies et al. [10] 1.365 – 0.46 -0.38
Indian Standard 2.3 0.19 – –
Roy 52 0.54 – –
1640 Neural Comput & Applic (2013) 22:1637–1643
123
Page 5
8 Predictions by different empirical equations
Table 5 illustrates the values of site constants of different
predictor equations, which were determined by multiple
regression analysis.
Figures 6, 7, 8, 9 and 10 graphically show correlations
between recorded and predicted PPV by different empirical
equations. Here, COD is 0.945, 0.193, 0.491, 0.391 and
0.949 for USBM, Ambraseys–Hendron, Davies et al. [10],
Indian Standard and Roy, respectively, whereas RMSE is
0.382, 0.416, 0.835, 0.493 and 0.428 for USBM, Ambra-
seys–Hendron, Davies et al. [10], Indian Standard and Roy,
respectively.
R² = 0.945
0
1
2
3
4
5
6
4.2 4.3 4.4 4.5 4.6 4.7 4.8
measured PPV (mm/s)
pre
dic
ted
PP
V b
y U
SB
M
Fig. 6 Measured and predicted PPV by USBM
R² = 0.193
0
0.5
1
1.5
2
2.5
3
3.5
4
4.5
5
4.2 4.3 4.4 4.5 4.6 4.7 4.8
measured PPV (mm/s)
pre
dic
ted
PP
V b
y A
-H
Fig. 7 Measured and predicted PPV by Ambraseys–Hendron
R² = 0.491
0
1
2
3
4
5
6
4.2 4.3 4.4 4.5 4.6 4.7 4.8
measured PPV (mm/s)
pre
dic
ted
PP
V b
y D
avie
s et
al.
[10]
Fig. 8 Measured and predicted PPV by Davies et al. [10]
R2 = 0.3914
0
1
2
3
4
5
6
4.2 4.3 4.4 4.5 4.6 4.7 4.8
measured PPV (mm/s)
pre
dic
ted
PP
V b
y In
dia
n S
tan
dar
d
Fig. 9 Measured and predicted PPV by Indian Standard
R2 = 0.9494
0
1
2
3
4
5
6
4.2 4.3 4.4 4.5 4.6 4.7 4.8
measured PPV (mm/s)
pre
dic
ted
PP
V b
y R
oy
Fig. 10 Measured and predicted PPV by Roy
Neural Comput & Applic (2013) 22:1637–1643 1641
123
Page 6
9 Results and discussion
Table 6 shows COD, MAPE, VARE, MEDAE, VAF and
RMSE for ANN and various vibration equations. Here,
maximum RMSE is for prediction by Davies et al. [10],
while minimum is for ANN.
10 Sensitivity analysis
Sensitivity analysis is a method to determine the effec-
tiveness of each input parameter on the amount of output
parameter. In this paper, input parameters are total charge,
maximum charge per delay and distance between shot
point and monitoring station, and output parameter is PPV.
For sensitivity analysis, the following equation was used:
Rij ¼Pm
k¼1 ðxik � xjkÞffiffiffiffiffiffiffiffiffiffiffiffiffiffiffiffiffiffiffiffiffiffiffiffiffiffiffiffiffiffiffiffiffiffiffi
Pmk¼1 x2
ik
Pmk¼1 x2
jk
q ð1Þ
where xi and xj are the elements of data pairs, which
indicate the input and output data sets, respectively. The
effect of each input parameter on the amount of PPV is
shown in Fig. 11. From the figure, it can be said that
distance between shot point and monitoring station has the
greatest effect on the amount of PPV, whereas maximum
charge per delay and total charge significantly affect the
blast vibration. In fact, sensitivity analysis is used before
determining the number of input parameters. Thus, low-
impact parameters are not used in the neural network and
network provides a model with more accuracy and less
error.
11 Conclusion
Ground vibration is an undesirable effect of blasting and
must be controlled and minimized to enhance the explosive
efficiency. Here, PPV has been predicted by the ANN as
well as different empirical equations. It was found that
results obtained from the neural network model is much
closer to reality, because of the empirical formula’s restric-
tions in utilized effective parameter of ground vibration.
However, empirical formula is based on only two parame-
ters: the maximum charge per delay and the distance of
explosion’s location. It is well known that ground vibration
is influenced by a number of parameters such as total
charge, burden, spacing and stemming. The advantage of
the neural network model is the unrestricted parameters
utilized for a more accurate prediction. If the parameter’s
variety in the input layer is more, the results will be closer to
reality. Selecting the number of hidden layers and the
number of neurons in the hidden layers contains no specific
theorems and is achieved by trial and error. It was found that
COD between measured and predicted PPV is 0.927,
whereas it was 0.945, 0.193, 0.491, 0.391 and 0.949 for the
USBM, Ambraseys–Hendron, Davies et al. [10], Indian
Standard and Roy equations, respectively. It was also found
that MAPE, VARE, MEDAE and RMSE were also mini-
mum for the ANN model as compared to various empirical
models. Sensitivity analysis was also carried out on maxi-
mum charge per delay, total charge and distance between
shot point and monitoring station, and it was found that
distance between shot point and monitoring station has
greatest effect on the PPV.
Table 6 Performance of different models for predicting PPV
Model COD MAPE VARE MEDAE VAF RMSE
USBM 0.945 7.25 0.26 0.264 19.71 0.382
Ambraseys–Hendron 0.193 8.75 0.129 0.366 3.37 0.416
Davies et al. [10] 0.491 16.67 0.768 0.692 6.79 0.835
Indian Standard 0.391 10.99 0.31 0.51 23.30 0.493
Roy 0.949 8.13 0.328 0.31 18.02 0.428
ANN 0.927 1.34 0.07 0.05 92.68 0.071
0.894 0.893
0.961
0.84
0.86
0.88
0.9
0.92
0.94
0.96
0.98
Total charge Max charge per delay Distance
Input parameters
Fig. 11 Sensitivity analysis for determining the effect of each input
parameter on PPV
1642 Neural Comput & Applic (2013) 22:1637–1643
123
Page 7
References
1. Duvall WI, Johnson CF, Meyer AVC (1963) Vibrations from
instantaneous and millisecond delay quarry blasts. RI. 6151.
US, Bureau of Mines, United States Department of Interior,
Washington
2. Nicholls HR, Johnson CF, Duvall WI (1971) Blasting vibrations
and their effects on structures. Bulletin Washington, DC, Bureau
of Mines, no. 656
3. Siskind DE, Crum SV, Otterness RE, Kopp JW (1989) Com-
parative study of blasting vibrations from Indiana surface coal
mines. RI 9226, USBM
4. Elseman I, Rasoul A (2000) Measurement and analysis of the effect
of ground vibration induced by blasting at the limestone quarries of
the Egyptian cement company. Cairo University, Egypt
5. Khandelwal M, Singh TN (2009) Prediction of blast induced
ground vibration using artificial neural network. Int J Rock Mech
Min Sci 46:1214–1222
6. Khandelwal M, Singh TN (2007) Evaluation of blast induced
ground vibration predictors. Soil Dyn Earthq Eng 27:116–125
7. Mostafa TM (2009) Artificial neural network for prediction and
control of blasting vibrations in Assiut (Egypt) limestone quarry.
Int J Rock Mech Min Sci 46(2):426–431
8. Duvall WI, Fogelson DE (1962) Review of criteria for estimating
damages to residences from blasting vibrations. R. I. 5968, US,
Bureau of Mines
9. Ambraseys NR, Hendron AJ (1968) Dynamic behaviour of rock
masses rock mechanics in engineering, practices. Wiley, London
10. Davies B, Farmer IW, Attewell PB (1964) Ground vibrations
from shallow sub-surface blasts, vol 217. The Engineer, London,
pp 553–559
11. Indian Standards Institute (1973) Criteria for safety and design of
structures subjected to underground blast. ISI Bull, IS-6922
12. Roy PP (1991) Prediction and control of ground vibrations due to
blasting. Colliery Gaurdian, 239
13. Khandelwal M, Singh TN (2005) Prediction of blast induced air
overpressure in opencast mine. Noise Vib Worldwide 36:7–16
14. Rajasekaran S, Pai GAV (2005) Neural networks, fuzzy logic and
genetic algorithms: synthesis and applications. Prentice Hall,
New Delhi
15. Monjezi M, Dehghani H (2008) Evaluation of effect of blasting
pattern parameters on back break using neural networks. Int J
Rock Mech Min Sci 45:1446–1453
16. Monjezi M, Ahmadi M, Sheikhan M, Bahrami A, Salimi AR
(2010) Predicting blast-induced ground vibration using various
types of neural networks. Soil Dyn Earthq Eng 30:1233–1236
17. Monjezi M, Ghafurikalajahi M, Bahrami A (2011) Prediction of
blast-induced ground vibration using artificial neural networks.
Tunn Undergr Space Technol 26:46–50
18. Monjezi M, Singh TN, Khandelwal M, Sinha S, Singh V, Hos-
seini I (2006) Prediction and analysis of blast parameters using
artificial neural network. Noise Vib Worldwide UK 37(5):8–16
19. Rogers SJ, Chen HC, Kopaska-Merkel DC, Fang JH (1995)
Predicting permeability from porosity using artificial neural net-
works. AAPG 79:1786–1797
Neural Comput & Applic (2013) 22:1637–1643 1643
123