+ All Categories
Home > Documents > EVALUATION -Based Technical Assistance Tuberculosis and ......integrated health service delivery, as...

EVALUATION -Based Technical Assistance Tuberculosis and ......integrated health service delivery, as...

Date post: 08-Jun-2020
Category:
Upload: others
View: 3 times
Download: 0 times
Share this document with a friend
56
EVALUATION USAID/Uganda’s District-Based Technical Assistance (DBTA) Model as Applied under Strengthening Tuberculosis and HIV/AIDS Responses (STAR) Projects in East, East-Central, and South-West Uganda . July 2015 This publication was produced at the request of the United States Agency for International Development.
Transcript

EVALUATION

USAID/Uganda’s District-Based Technical Assistance (DBTA) Model as Applied under Strengthening Tuberculosis and HIV/AIDS Responses (STAR) Projects in East, East-Central, and South-West Uganda

East, East-Central, and South-West Uganda.July 2015

This publication was produced at the request of the United States Agency for International Development.

.

Cover Photo: A STAR-E ART client at Sipi HCIII in Kapchorwa District being interviewed as part of the

DBTA/STAR evaluation client exit interviews. Photographer: Unknown

EVALUATION OF USAID/UGANDA’S

DISTRICT-BASED TECHNICAL

ASSISTANCE (DBTA) MODEL AS

APPLIED UNDER STRENGTHENING

TUBERCULOSIS AND HIV/AIDS

RESPONSES (STAR) PROJECTS IN EAST,

EAST-CENTRAL, AND SOUTH-WEST

UGANDA

JULY 2015

USAID/Uganda’s District-Based Technical Assistance (DBTA) model was designed

with a regional technical assistance focus to improve accessibility, quality, and availability of

integrated health service delivery as well as to improve health system financing and management.

The USAID/Uganda funded STAR (Strengthening TB and HIV/AIDS Responses) projects in East,

East-Central, and South-West Uganda were designated as the first of USAID/Uganda’s projects

to implement the DBTA model. The three DBTA programs were implemented by Management

Sciences for Health (MSH) in East Uganda (STAR-E, 2010), by John Snow International (JSI) in

East-Central Uganda (STAR-EC, 2010), and by Elizabeth Glaser Pediatric AIDS Foundation

(EGPAF) in South-West Uganda (STAR-SW, 2011). All three projects ended together in March

2015. As DBTAs, the three programs were expected to strengthen decentralized service-

delivery systems for improved uptake of quality HIV/AIDS and TB services.

DISCLAIMER

The author’s views expressed in this publication do not necessarily reflect the views of the

United States Agency for International Development or the United States Government.

This document was submitted by The QED Group, LLC Submitted to: USAID/Uganda under

USAID Contract No. AID-617-C-13-00007

USAID/UGANDA’S DBTA MODEL AS APPLIED UNDER STAR PROJECTS IN EAST, EAST-CENTRAL, AND SOUTH-WEST UGANDA i

ACKNOWLEDGMENTS

This work was commissioned by USAID Mission Uganda and was prepared independently by John Bosco Asiimwe, Julian Bagyendera, Andrew Balyeku, William Emmet, Namudda Jolly, Albert Kalangwa, Joy Mukaire, Edgar Mulogo, Caroline Nabacwa, Evelyn Namubiru, Xavier Nsabagasani, Nathan Nshakira, Vincent Owarwo, Eric Sewagudde, Barbara Tamale, Joel Tamale, and Charlotte Zikusooka on behalf of The QED Group LLC. The consultants appreciate the

technical advice and support from the USAID Mission Uganda staff toward the implementation

and preparation of this report. The input from the USAID Mission Uganda leadership, especially

Ms. Lane Pollack, organizational learning adviser, USAID/Uganda, Joseph Mwangi, senior

strategic information adviser, USAID/Uganda, and Ms. May Mwaka, monitoring and evaluation

specialist, USAID/Uganda, is particularly appreciated. The evaluation team also appreciates the

cooperation of the management and staff of the three DBTA/STAR projects and their input and

support during the field visits. The input from all respondents, including the project beneficiaries

and health service staff, staff of United States Government-funded partners, staff from district

governments, from the Ministry of Health, and from other central-level entities such as Uganda

AIDS Commission is very much appreciated. Finally, the technical and administrative assistance

of Ms. Ruth Nanyonga, Dr. Augustine Wandera, Ms. Lilian Likicho, Mr. Paul King, chief of party, and all of the QED staff of the USAID/Uganda Learning Contract is also greatly appreciated.

ii USAID/UGANDA’S DBTA MODEL AS APPLIED UNDER STAR PROJECTS IN EAST, EAST-CENTRAL, AND SOUTH-WEST UGANDA

USAID/UGANDA’S DBTA MODEL AS APPLIED UNDER STAR PROJECTS IN EAST, EAST-CENTRAL, AND SOUTH-WEST UGANDA iii

CONTENTS

EXECUTIVE SUMMARY .................................................................................................................. ix

Project Background................................................................................................................... ix

Evaluation Purpose .................................................................................................................... ix

Key Findings and Conclusions ................................................................................................. x

Recommendations .................................................................................................................... xii

I. INTRODUCTION ....................................................................................................................... 1

Evaluation Purpose ..................................................................................................................... 1

Evaluation Questions ................................................................................................................. 1

II. PROJECT BACKGROUND ...................................................................................................... 3

III. EVALUATION METHODS AND LIMITATIONS ................................................................ 5

Methodology ................................................................................................................................ 5

Limitations .................................................................................................................................... 8

Ethical Considerations ............................................................................................................... 8

IV. FINDINGS ..................................................................................................................................... 9

Improved Capacity and Sustainability .................................................................................... 9

Contribution to Improved Health Service Delivery ......................................................... 24

Cost Efficiency ........................................................................................................................... 30

V. CONCLUSIONS ........................................................................................................................37

Improved Capacity and Sustainability .................................................................................. 37

Contribution to Improved Health Service Delivery ......................................................... 37

Cost Efficiency ........................................................................................................................... 38

VI. RECOMMENDATIONS ...........................................................................................................39

FIGURES

Figure 1: Change in Number of Sites Providing both Adult and Pediatric ART ................24

Figure 2: Percentage of Patients Who Were Counseled and Received an HIV Test

in Last 12 Months and Know Their Results ................................................................................26

Figure 3: Increased Knowledge about TB....................................................................................29

iv USAID/UGANDA’S DBTA MODEL AS APPLIED UNDER STAR PROJECTS IN EAST, EAST-CENTRAL, AND SOUTH-WEST UGANDA

TABLES

Table 1. Sampling Frame for STAR Districts ................................................................................ 6

Table 2. List of Sample Districts for the STAR Evaluation ........................................................ 6

Table 3. Summary of Number of KIIs and FGDS ........................................................................ 7

Table 4. Annual Expenditure by Project ......................................................................................31

Table 5. Spending for FY13, Broken Down by Program Area ...............................................32

Table 6. Spending for FY14 and 2 Years Combined, Broken Down by Program Area ....33

Table 7. Breakdown of Expenditure for FY13 and FY14 (Combined) by Level of

Spending ..............................................................................................................................................34

Table 8. Cost Drivers of Expenditures FY13 and FY14 (Combined) in All

Three Projects ...................................................................................................................................35

ANNEXES

Annex A. Statement of Work ........................................................................................................41

Annex B. Methodology ....................................................................................................................51

Annex C. List of Key Informants ...................................................................................................63

Annex D. Interview Guides ............................................................................................................67

Annex E. Consent Form ..................................................................................................................91

Annex F. Area-Specific Client Exit Reports ................................................................................93

Annex G. Economic Analysis ...................................................................................................... 138

Annex H. Key Tables .................................................................................................................... 183

Section A: Pull-Out 1 DBTA/STAR Evaluation: STAR- East ................................................ 188

Section B: Pull-Out 2 Dbta/Star Evaluation: Star- South West ........................................... 228

Section C: Pull-Out 3 Dbta/Star Evaluation: Star- East Central .......................................... 254

USAID/UGANDA’S DBTA MODEL AS APPLIED UNDER STAR PROJECTS IN EAST, EAST-CENTRAL, AND SOUTH-WEST UGANDA v

LIST OF ABBREVIATIONS AND

ACRONYMS

AIDS Acquired immunodeficiency syndrome

ANC Antenatal care

ART Antiretroviral therapy

ASSIST

BCC

Applying Science to Strengthen and Improve Systems Project|Uganda

Behavioral change communication

BMU Beach management unit

CAO Chief administrative officer

CBDOTS Community-based directly observed treatment short course

CBO Community-based organization

CD4 Cluster of differentiation 4

CDO Community development officer

CPHL Central Public Health Laboratories

CSA Community support agent

CSO Civil society organization

DAC District AIDS committee

DAT District AIDS taskforce

DBM District-based mentor

DBTA District-Based Technical Assistance

DDP District development plan

DFPP District focal point person

DHO District health officer

DHT District health team

DHMT District health management team

DHIS2 District Health Information System 2

DMC District management committee

DOP District operational plan

DOTS Directly observed treatment short course

DQA Data quality assessment

DTLS District tuberculosis and leprosy supervisor

EGPAF Elizabeth Glaser Pediatric AIDS Foundation

EMHS Essential medicines and health supplies

vi USAID/UGANDA’S DBTA MODEL AS APPLIED UNDER STAR PROJECTS IN EAST, EAST-CENTRAL, AND SOUTH-WEST UGANDA

EID Early infant diagnosis

eMTCT Elimination of mother-to-child transmission of HIV

FBOs Faith-based organization

FGD Focus group discussion

FLEP Family life education program

FP Family planning

FSG Family support group

FSW

GIPA

Female sex worker

Greater Involvement of People Living with HIV/AIDS

GIS Geographical information system

GoU Government of Uganda

HC Health center

HFA Health facility assessment

HIV Human immunodeficiency virus

HMC Health management committee

HMIS Health management information systems

HSS Health systems strengthening

HTC HIV testing and counseling

HUMC Health unit management committee

IEC Information, education, and communication

IP Implementing partner

IPT Isoniazid preventive therapy

JSI JSI Research & Training Institute, Inc.

KII

KM

KYCS

Key informant interviews

Knowledge management

Know Your Child’s Status

LC Local council

LMIS Logistics management information system

LSM

LQAS

Logistics and supply management

Lot quality assurance sampling

MARP Most-at-risk population

MCH

MCPs

Maternal and child health

Multiple concurrent partnerships

MDR Multidrug resistant tuberculosis

MEEPP Monitoring and Evaluation of the Emergency Plan Progress

USAID/UGANDA’S DBTA MODEL AS APPLIED UNDER STAR PROJECTS IN EAST, EAST-CENTRAL, AND SOUTH-WEST UGANDA vii

MIPA Meaningful involvement of people living with HIV/AIDS

m2m mothers2mothers

MMS Multimedia messaging service

MoH

MoLG

M&E

MSH

MSMTG

NACWOLA

Ministry of Health

Ministry of local government

Monitoring and evaluation

Management Sciences for Health

Men who have sex with men and transgender women

National Community of Women Living with HIV/AIDS in Uganda

NAFOPHANU National Forum for People Living with HIV&AIDS Networks in Uganda

NMS National medical stores

OCA Organization capacity assessment

OPD Outpatient department

OVC Orphans and vulnerable children

PACE Program for Accessible Health Communication and Education

PCR Polymerase chain reaction

PEP Post-exposure prophylaxis

PEPFAR President’s Emergency Plan for AIDS Relief

PLHA

PLHIV

People living with HIV/AIDS

Person living with HIV

PMP Performance monitoring plan

PMTCT Prevention of mother-to-child transmission of HIV

PNFP Private not-for-profit health facility

PWID

PY

People who inject drugs

Program year

QI Quality improvement

RHITES Regional Health Integration to Enhance Services

RTC Routine testing and counseling

S&S

SACCO

Surveillance and surveys

Savings and credit cooperative

SCMS Supply chain management system

SCORE Sustainable comprehensive responses for vulnerable children

SCHW Sub-county health workers

SDA Special duty allowances

SDS Strengthening Decentralization for Sustainability

viii USAID/UGANDA’S DBTA MODEL AS APPLIED UNDER STAR PROJECTS IN EAST, EAST-CENTRAL, AND SOUTH-WEST UGANDA

SI

SLAMTA

Strategic information

Strengthening Laboratory Management Toward Accreditation

SMC Safe male circumcision

SMS Short message service

SOP Standard operating procedure

SOW

SPAI

Scope of work

Service performance assessment and improvement

SPARS Sparsely populated areas

SRH Sexual reproductive health

STAR-E Strengthening TB and HIV/AIDS Responses in East Uganda

STAR-EC Strengthening TB and HIV/AIDS Responses in East-Central Uganda

STAR-SW Strengthening TB and HIV/AIDS Responses in South-West Uganda

SURE Securing Ugandans’ Right to Essential Medicines

SUSTAIN Strengthening Uganda’s Systems for Treating AIDS Nationally

TB Tuberculosis

TSR Treatment success rate

UGX Ugandan shillings

UHMG Uganda Health Marketing Group

URHB Uganda Reproductive Health Bureau

USAID United States Agency for International Development

VFM

VHTs

Value-for-money

Village health teams

VMMC Voluntary medical male circumcision

WAOS

YCC

Web-based ordering system

Young child clinic

USAID/UGANDA’S DBTA MODEL AS APPLIED UNDER STAR PROJECTS IN EAST, EAST-CENTRAL, AND SOUTH-WEST UGANDA ix

EXECUTIVE SUMMARY

PROJECT BACKGROUND

The USAID/Uganda’s District Based Technical Assistance (DBTA) model features integrated

service delivery with a regional focus on improving accessibility, quality, and availability of

integrated health service delivery, as well as health system financing and management. The

USAID/Uganda-funded Strengthening TB and HIV/ AIDS Responses (STAR) projects in the

Eastern, East-Central, and South Western regions of Uganda were the first opportunities to

implement the DBTA model. The STARs projects were implemented from 2010 to 2015.

EVALUATION PURPOSE

This evaluation was commissioned in October 2014 to establish the extent of efficiency and

effectiveness of the USAID/Uganda’s DBTA project model as applied across the three STAR

projects. The purpose of the evaluation was to comprehensively analyze the implementation

process and results achieved through USAID/Uganda’s DBTA model.

Evaluation Questions

The evaluation aimed to establish the extent of efficiency and effectiveness of the DBTA project

model as applied across the three STAR projects pertaining to improved capacity and

sustainability, service delivery, and cost efficiency. The evaluation questions were as follows:

Improved Capacity and Sustainability

1. Approaches utilized by the STARs to strengthen districts and local governments to deliver

health services, differed and evolved over time. What are: a) the most successful and b) least

successful approaches applied by STAR-E, STAR-EC, and STAR-SW respectively towards

strengthening the institutional, management, and human capacity of CSOs and local

governments to deliver health services? What are the facilitators and barriers of these

approaches to achieving results? Are the approaches used and results achieved forold/established and relatively new/naive districts significantly different?

2. What was the effect of transition of direct implementation of district led health caremanagement activities from the STARs projects to district grants through SDS?

3. To what extent has the STARS program developed, established and/or strengthened

management and technical structures at the local government and health facility levels thatwill sustainably improve quality, availability and accessibility of HIV/AIDS and TB services?

4. What technical capacity in strategic information have the STARs developed, built and/or

strengthened? Where has this capacity been developed, built and or strengthened? How is

it manifested/ demonstrated? How sustainable is this capacity after the STARs’ exit?

Service Delivery

1. How has the support by the STARs contributed to improved health service delivery? Whatare the Service delivery outcomes attributed to the DBTAs?

2. What was the effect of integration of HIV/TB, HIV/Family Planning, HIV/AIDS and health onoverall health outcomes?

x USAID/UGANDA’S DBTA MODEL AS APPLIED UNDER STAR PROJECTS IN EAST, EAST-CENTRAL, AND SOUTH-WEST UGANDA

Cost Efficiency

1. To what extent can the DBTA design be considered cost efficient in strengthening capacity

of districts and CSOs to improve health service delivery?

Methods

The evaluation applied a cross-sectional design that used both quantitative and qualitative

methods for data collection and analysis. Key informant interviews (KIIs) and focus group

discussions (FGDs) were conducted with informants from the Ministry of Health,

USAID/Uganda’s health office staff, and representatives of programs and projects allied with the

DBTA/STAR projects. More than one hundred people were interviewed, and thirty-eight focus

groups were conducted. Additionally, more than six hundred client exit interviews were

conducted at a random sampling of facilities visited by the three sub-teams.

KEY FINDINGS AND CONCLUSIONS

This section presents a synthesis of the key findings and conclusions of the evaluation,

structured around the seven evaluation questions.

Approaches implemented under the DBTA/STAR programs: The most successful

approaches toward strengthening the institutional, management, and human capacity of

CSOs and local governments to deliver health services included mentorship and training,

integration of HIV/AIDS and TB services at lower-level health facilities, establishment of

community linkages for HIV/AIDS and TB services, a commodity-tracking system to reduce

stock outs, and the strengthening of laboratory services. Success was attributed to the

supportive national HIV/AIDS policy environment, the competence of the STAR technical

teams, and the availability of resources for the interventions.

The evaluation team identified a limited focus on empowering district health teams and

health facility leadership as a primary shortcoming of the programs. It was also noted that an

inadequate emphasis on systems strengthening was compounded by ambitious targets for

service-delivery outputs. Incentives undeniably increased demand for and utilization of

antiretroviral therapy (ART) sites but undermined sustainability. Other barriers included a

heavy focus on biomedical components of HIV prevention and serious health system

constraints, including inadequate human resources, irregularly scheduled and single-issue

vertical training programs, and central-level stock outs.

Lastly, there were no significant differences across the three regions in terms of approaches

applied or results achieved between old/established and relatively new/naive districts.

The effect of transition: Transition of direct implementation of district-led healthcare

management activities from the STARs projects to district grants through SDS was more

difficult in STAR-EC and STAR-E. In these regions, SDS was preceded by the STAR projects,

whereas in STAR-SW, SDS was launched together with the STAR project, resulting in better

collaboration during early implementation. The evaluation notes that there was a much

stronger collaborative relationship between SDS and STAR-SW compared with the other

STAR programs. This manifested in stronger district leadership in planning and management

of HIV/AIDS services, as well as improved partnership with other DBTAs.

Sustainability: The STAR program developed and strengthened management and technical

structures at the local-government and health-facility levels. To ensure sustainability, the

USAID/UGANDA’S DBTA MODEL AS APPLIED UNDER STAR PROJECTS IN EAST, EAST-CENTRAL, AND SOUTH-WEST UGANDA xi

district health management teams (DHMTs) were integrated into SDS grant A to enhance a

sense of ownership of HIV/AIDS and TB efforts, especially in STAR-SW. Technical

structures to support HIV/AIDS service decentralization including teams of regional and

district-based trainers, clinical mentors, supervisors, as well as multilevel quality

improvement (QI), are expected to sustainably improve quality, availability, and accessibility

of HIV/AIDS and TB services.

Strategic information: SI technical capacity was strengthened through health

management information systems/District Health Information System 2 (HMIS/DHIS2) and

lot quality assurance sampling (LQAS) implementation. The revised HMIS, which integrated

previously vertical reporting and introduced new forms for HIV treatment, was new to

lower-level facilities. STARs supported the roll-out of the new HMIS forms and established

internal district structures and processes for improving the quality of HIV/AIDS and TB data

collection. Additionally, STARs improved the timeliness and completeness of HMIS

reporting and its use at community, facility, and district levels. Among the mechanisms

introduced were district platforms for performance reviews, data dissemination, and

learning. District capacity to implement and use results from annual LQAS surveys was

increased, although implementation of LQAS still depends on external funding.

DBTA contribution to improved health service delivery and related health

outcomes: The DBTAs’ contribution to service delivery included rapid expansion of ART

services to lower-level facilities, from 88 to over 330 sites within three years of

implementation. This increase in service availability included infrastructure improvements at

health centers to accommodate an increased number of clients, management of associated

commodities, and improvements in laboratory support services. The DBTAs also supported

the roll-out of new clinical guidelines and built adaptive capacity of districts for any new

changes in guidelines through the establishment of local training teams and on-site training

approaches. Other critical areas addressed in expanding services to lower facilities were the

strengthening of logistics and supplies management (LSM) and SI management.

There were significant improvements in HIV/AIDS and TB service-delivery outcomes and

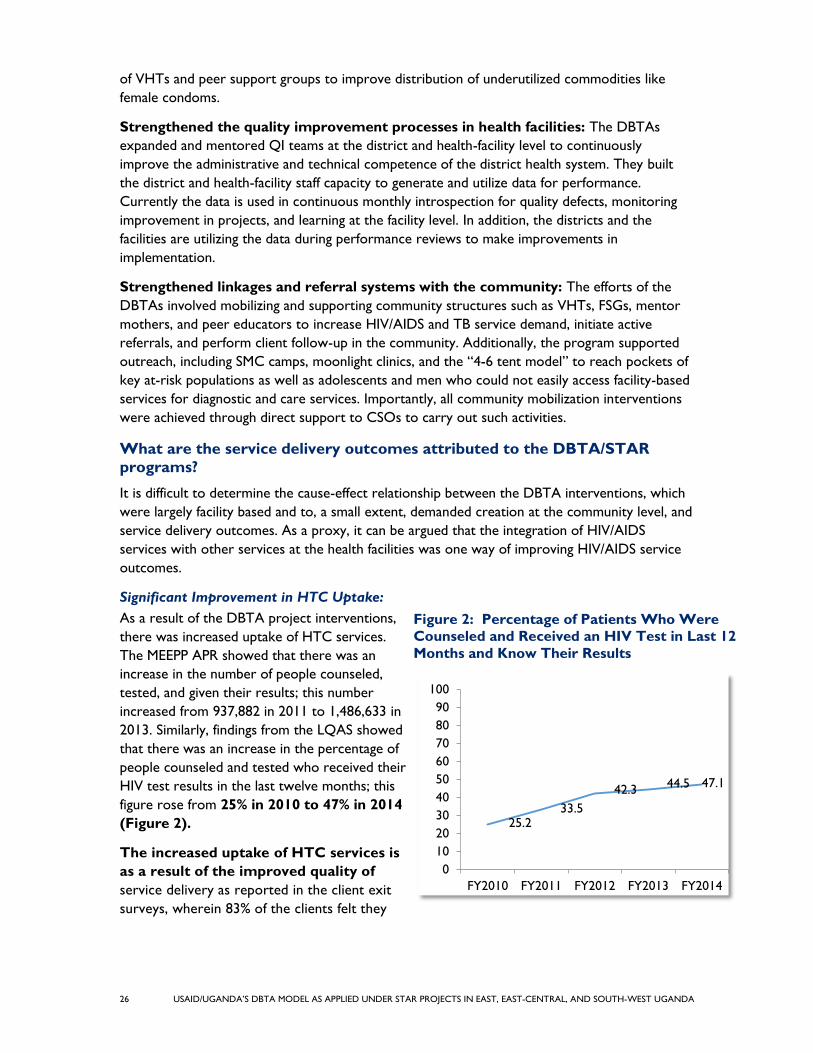
access to services. These included significant improvements in HIV testing and counseling

(HTC) uptake, with the percentage of people that had received HIV counseling and testing

and knew their HIV results rising from 25% in 2010 to 47% in 2014. Furthermore, couples

testing during the antenatal period increased from 76% to 94%, and individuals’ disclosing

HIV results to their spouses increased from 80% to 93% over the same period. There were

also significant improvements in ART enrollment and initiation. There was increased ART

enrollment, with new patients enrolled in HIV care doubling from 23,600 in 2011 to 40,100

in 2014. The number of new patients started on ART almost tripled from 10,821 in 2009 to

30,920 in 2014. However, though pre-ART enrollment and ART initiation improved,

retention on ART and improvements in quality of care remained stagnant.

Integration of HIV/AIDS care: Integration of HIV/AIDS services with other health areas

had the greatest impact on TB outcomes and uptake of ART among TB patients. There

were also improvements in uptake of antenatal care (ANC) services, births in health

facilities, and child health outcomes. However, there was no significant impact on practices

like household sanitation, hygiene, and nutrition practices.

xii USAID/UGANDA’S DBTA MODEL AS APPLIED UNDER STAR PROJECTS IN EAST, EAST-CENTRAL, AND SOUTH-WEST UGANDA

Cost efficiency: While each of the STAR projects has been able to achieve substantial

progress over the life of the projects, inefficiencies in program management suggest that

more could have been achieved with the level of investment.

RECOMMENDATIONS

The evaluation team recommends the following changes to improve the design of future DBTA

projects:

1. To strengthen DBTA capacity-building approaches, design future DBTA projects to address

the strengthening of multiple components of the health system, since many factors affect technical assistance uptake.

2. Clearly delineate roles, responsibilities, and programmatic parameters among multiple programs working in the same district to improve coordination and collaboration.

3. Invest in developing the leadership capacity of existing health management committees

(HMC) at the health-facility level to improve the quality assurance linkage between the

health services and the communities served.

4. In collaboration with the DBTA’s participating districts, establish and maintain a database to

determine the extent of cost sharing among districts, with reference to DBTA interventions to improve long-term sustainability.

5. Continue to support maintenance and utilization of the LQAS methodology for data

collection, strategic planning, and improvement of programs.

6. Continue to support community QI initiatives to strengthen linkages between health facilities and the communities they serve and to improve quality of care in service delivery.

7. Expand HIV/AIDS service integration to include other key health areas, such as chronic care and adolescent health.

8. Design DBTA programs with rigorous focus on the reduction to minimal necessary levels of

the percentage of administrative support costs required to sustain DBTA technical

assistance and DBTA operations to promote cost efficiency and value for money (VFM).

USAID/UGANDA’S DBTA MODEL AS APPLIED UNDER STAR PROJECTS IN EAST, EAST-CENTRAL, AND SOUTH-WEST UGANDA 1

I. INTRODUCTION

USAID/Uganda’s District Based Technical Assistance (DBTA) model was designed with a

regional technical assistance focus to improve accessibility, quality, and availability of integrated

health service delivery, as well as to improve health-system financing and management. The

USAID-funded STAR (Strengthening TB and HIV/AIDS Responses) projects in East, East-Central,

and South-West Uganda were designated as the first of USAID/Uganda’s projects to implement

the DBTA model. The three DBTA programs were implemented by Management Sciences for

Health (MSH) in East Uganda (STAR-E, 2010), by John Snow International (JSI) in East-Central

Uganda (STAR-EC, 2010), and by Elizabeth Glaser Pediatric AIDS Foundation (EGPAF) in South-

West Uganda (STAR-SW, 2011). All three projects ended March 2015.

Under a contract with USAID/Uganda, QED LLC, a consulting firm based in Washington, DC,

with a base in Uganda under the USAID-funded Monitoring, Evaluation, and Learning Contract,

recruited a professional team of eleven consultants supported by six research assistants to

undertake an evaluation of the DBTA model as implemented by the three STAR projects. As

defined by the evaluation’s scope of work (see Annex A), the purpose of the evaluation was to

assess the efficiency and effectiveness of the USAID/Uganda’s DBTA project model as applied to

the design and implementation of STAR project initiatives. The focus of the evaluation was on

learning from experiences gained in the process of implementing the model. The evaluation,

launched on October 27, 2014, was divided into two phases: October–December 2014 was

dedicated to data collection while January–February 2015 was dedicated to final data validation,

analysis, and preparation of the evaluation report.

EVALUATION PURPOSE

The purpose of the evaluation was to establish the extent of efficiency and effectiveness of the

USAID/Uganda’s DBTA project model as applied across the three STAR projects.

EVALUATION QUESTIONS

The evaluation was designed to provide answers to a number of questions pertaining to

improved capacity and sustainability, service delivery, and cost efficiency of the DBTA projects.

A key element of the evaluation was a comparison of what was in place before and after the

STAR projects in order to understand changes that could be attributed to the program.

The evaluation strived to answer the following questions:

Improved Capacity and Sustainability

1. Approaches utilized by the STARs to strengthen districts and local governments to deliver

health services, differed and evolved over time. What are: a) the most successful and b) least

successful approaches applied by STAR-E, STAR-EC, and STAR-SW respectively towards

strengthening the institutional, management, and human capacity of CSOs and local

governments to deliver health services? What are the facilitators and barriers of these

approaches to achieving results? Are the approaches used and results achieved for

old/established and relatively new/naive districts significantly different?

2. What was the effect of transition of direct implementation of district led health care

management activities from the STARs projects to district grants through SDS?

2 USAID/UGANDA’S DBTA MODEL AS APPLIED UNDER STAR PROJECTS IN EAST, EAST-CENTRAL, AND SOUTH-WEST UGANDA

3. To what extent has the STARS program developed, established and/or strengthened

management and technical structures at the local government and health facility levels that

will sustainably improve quality, availability and accessibility of HIV/AIDS and TB services?

4. What technical capacity in strategic information have the STARs developed, built and/or

strengthened? Where has this capacity been developed, built and or strengthened? How is it manifested/ demonstrated? How sustainable is this capacity after the STARs’ exit?

Service Delivery

1. How has the support by the STARs contributed to improved health service delivery? What

are the Service delivery outcomes attributed to the DBTAs?

2. What was the effect of integration of HIV/TB, HIV/Family Planning, HIV/AIDS and health on overall health outcomes?

Cost Efficiency

1. To what extent can the DBTA design be considered cost efficient in strengthening capacity

of districts and CSOs to improve health service delivery?

As specified under the scope of work (SOW), the evaluation report was expected to include

two distinct but linked sections, one of which (Section A of this report) was to focus on a

comprehensive discussion of the overall DBTA approach, and the second of which was to

consist of standalone pullouts for each of the three DBTA projects being evaluated (Sections B–

D of this report).

USAID/UGANDA’S DBTA MODEL AS APPLIED UNDER STAR PROJECTS IN EAST, EAST-CENTRAL, AND SOUTH-WEST UGANDA 3

II. PROJECT BACKGROUND

Working closely with the Ugandan Ministry of Health and through district health management

teams (DHMTs), district councils, health facilities, and communities, the projects’ general

objective was to increase the accessibility, coverage, and utilization of quality comprehensive

HIV/TB prevention, care, and treatment services within district health facilities and their

respective communities. This general objective was expected to be achieved through the

following specific objectives: (a) strengthening decentralized HIV/AIDS and TB service delivery

systems; (b) improving the quality and efficiency of HIV/AIDS and TB service delivery within

health facilities; (c) strengthening networks and referrals systems for HIV and TB services; and

(d) increasing demand for comprehensive HIV/AIDS and TB prevention, care, and treatment

services.

All three STAR projects were designed to strengthen systems at the decentralized level to

facilitate improved delivery and uptake of HIV/AIDS and TB services. District-led performance

reviews helped to identify coverage and service gaps. Anticipated service-delivery enhancements

included, but were not limited to, issues associated with leadership, management, health

management information systems (HMIS), and human resources for health care, supply chain

management, SI, infrastructure, and laboratories.

In addition, under USAID’s SDS project (started in 2010), the three STAR projects were

expected to link their implementation with SDS grants to fund and provide technical support to

CSOs to facilitate the uptake of comprehensive services. While the SDS project itself was not

part of the STAR project configuration, STAR collaboration with the SDS project was

considered of significant importance with respect to the impact of SDS on anticipated STAR

project outcomes.

4 USAID/UGANDA’S DBTA MODEL AS APPLIED UNDER STAR PROJECTS IN EAST, EAST-CENTRAL, AND SOUTH-WEST UGANDA

USAID/UGANDA’S DBTA MODEL AS APPLIED UNDER STAR PROJECTS IN EAST, EAST-CENTRAL, AND SOUTH-WEST UGANDA 5

III. EVALUATION METHODS AND

LIMITATIONS

METHODOLOGY

The evaluation applied a cross-sectional design that used mixed-method approaches, which

included both quantitative and qualitative methods. The evaluation questions provided the

framework around which the evaluation team developed evidence to support conclusions both

about lessons learned in implementing the DBTA model and about the value of the DBTA

approach. Various data collection techniques, such as structured observations, key informant

interviews (KIIs), client exit surveys, and reviews of existing secondary data were used.

As detailed in Annex B, the evaluation methodology comprised nine distinct organizational steps:

Step 1: Document Review: Documentation reviewed and consulted through the evaluation

were drawn from a significant volume of information available to the evaluation team. Among

those documents consulted were documents that addressed DBTA and project design, planning

and management, national policies, strategies and other kinds of related documents. (Please see

Annex C for a complete list of principal documents reviewed and consulted.)

Step 2: Team Management: The fifteen-person evaluation team was divided into multiple

technical teams with distinct responsibilities: a team leader dedicated to project management

and to the management of national-level government and USAID interviews; a two-person team,

each member of which was supported by two research assistants (“sub-teams”) for each of the

three project areas and was dedicated to managing KIIs and focus group discussions (FGDs)

within each project area; a two-person team that addressed issues associated with project-

related information management and logistics and supply management (LSM); a specialist in

economic analysis who assessed the DBTA model’s cost efficiency; and a specialist who

conducted client exit interviews. (Please see Annex B for a detailed description of the team

management methodology.)

Step 3: Review of Secondary Data: The sub-teams’ review of secondary data was supported

by the evaluation team’s statistician, who focused on the collection and analysis of project-

related statistics including, but not limited to, reports on lot quality assurance sampling (LQAS),

annual program reports compiled by Monitoring and Evaluation of the Emergency Plan Progress

(MEEPP), health facility assessment data, and the three projects’ operational statistics contained

in annual reports and other documents.

Step 4: District Sampling: Given the large number of districts across all three projects, the

evaluation team adopted purposive sampling, which included a mix of both the old and new

districts. As indicated in Table 2.1.4, the districts were categorized as either old or new. New

districts face markedly greater health system challenges than old districts, and those challenges

may have affected DBTA programs. For the purposes of this undertaking, new districts are

those established from July 2005. Table 1 provides an overview of the sampling frame for STAR

districts.

6 USAID/UGANDA’S DBTA MODEL AS APPLIED UNDER STAR PROJECTS IN EAST, EAST-CENTRAL, AND SOUTH-WEST UGANDA

Table 1. Sampling Frame for STAR Districts

STAR SOUTH-WEST STAR EAST-CENTRAL STAR EAST

Old Districts New Districts Old Districts New Districts Old Districts New Districts

Bushenyi Buhweju Iganga Luuka Kapchorwa Bukwo

Kabale Ibanda Bugiri Namayingo Mbale Kween

Kanungu Isingiro Kamuli Buyende Pallisa Bulambuli

Kisoro Kiruhura Kaliro Namutumba Busia Kibuku

Ntungamo Mitooma Mayuge Sironko Budaka

Rukungiri Sheema Bududa

Rubirizi Butaleja

33% sample

(2 districts)

33% sample

(2 districts)

33% sample

(2 districts)

50% sample

(2 district)

33% sample

(2 districts)

33% sample

(2 districts)

Building on the above sampling frame, it was decided to survey two districts per cluster, with a

mix of old and new districts in each project area. Table 2 indicates those districts that were

sampled as part of the STAR evaluation.

Table 2. List of Sample Districts for the STAR Evaluation

STAR SOUTH-WEST STAR EAST-CENTRAL STAR EAST

Old Districts New Districts Old Districts New Districts Old Districts New Districts

Bushenyi Buhweju Iganga Luuka Mbale Kibuku

Ntungamo Mitooma Kamuli Namayingo Kapchorwa Bulambuli

Finally, the evaluation team assigned to each project area selected an appropriate mix of HCIV,

HCIII, and HCII (i.e., high client load to low client load) facilities to be visited. In addition, as

private not-for-profit health facilities (PNFPs) are partially subsidized by the government of

Uganda, the sample survey also included three HCII PNFPs. (For a detailed description of the

sampling methodology employed for this evaluation see Annex B.)

Step 5: Key Informant Interviews (KIIs) and Focus Group Discussions (FGDs): In

each project area, sub-teams interviewed district-level chief administrative officers (CAOs),

district medical officers (DMOs) and district staff, and DBTA/STAR project officers and their

staff using standardized KII instruments. At the level of health facilities, the health worker in

charge and other relevant healthcare providers were interviewed using similarly standardized

instruments. Persons in charge of medical supply management and laboratory supply

management were also interviewed. As beneficiaries of grants under the STAR programs,

representatives of civil society organizations (CSOs) were jointly interviewed through

structured FGDs. As representatives of the communities and as service beneficiaries, persons

living with HIV/AIDS (PLHIVs) were organized with the assistance of the implementing partner

(IP) project officers to participate in FGDs, all of which were recorded and transcribed for later

reference by the evaluation team’s research assistants.

USAID/UGANDA’S DBTA MODEL AS APPLIED UNDER STAR PROJECTS IN EAST, EAST-CENTRAL, AND SOUTH-WEST UGANDA 7

Step 6: Review of DBTA’s Cost Efficiency: In response to question 7 of the evaluation’s

SOW, the evaluation team’s economist reviewed and analyzed USAID/Uganda’s President’s

Emergency Plan for AIDS Relief (PEPFAR) expenditure analyses reports for the three STARs.

MEEP APR 2011–2014 reports as submitted by the STARs were reviewed.

Step 7: Client Exit Interviews: Using the same base of facilities selected for the facility-based

KIIs, the evaluation team conducted client exit interviews. The client exit interviews were

conducted during the month of January 2015 in the interest of triangulating the findings from the

project KIIs and project reports, as well as collecting citizen perceptions on the quality of

services.

At the health-facility level, the interviewers selected at least nine clients from each of the

HIV/AIDS services (prevention of mother-to-child HIV transmission (PMTCT), HIV testing and

counseling (HTC), and antiretroviral therapy (ART)) as they exited the facility. An average of

twenty-seven respondents per facility were interviewed from either one HCIII or one HCIV in

each district. Overall, a total of 661 clients were interviewed. (Please see Annex B for a

complete description of the methodology, Annex E for a list of instruments, and Annex D for a

complete list of respondents.)

At the national level, the evaluation team’s leader conducted KIIs with representatives of the

Ministry of Health, allied ministries, USAID, and IPs working in collaboration with the STAR

projects. As in the project areas, standardized instruments were employed for the interviews.

At both project and national levels, evaluation team members prepared daily summaries of

interviews and of FGDs to serve as references during subsequent analyses, as indicated in

Table 3.

Table 3. Summary of Number of KIIs and FGDS

Method Category of Informant Central Level STAR-E STAR- SW STAR-EC Total

USAID 8 NA NA NA 8

ADPs 1 NA NA NA 2

IPs 3 1 1 1 3

3 4 3 10

3 5 6 14

12 6 10 28

12 6 10 28

1 1

6 6

2 2

6 6 27

3

2 2 2 6

3

Table 2.1.7. STAR Evaluation - Summary of Number of KIIs and FGDs

KIIs - Health In-Charge and

Staff (# of Districts /Hard to

Reach)

HCIV Groups

HCIII Groups

District planner, CDO, other groups

CAO

District DHT Staff

KIIs

12Central Govt. 12 NA NA NA

FGDs

- PLHA - Adult Male Groups

- PLHA - Adult Women Groups

- PLHA - Young Men Groups

- PLHA - Young Women

- Other Groups( CSOs, CSW,VHTs,MARPS ,VQIT)

15

Hospitals

8 USAID/UGANDA’S DBTA MODEL AS APPLIED UNDER STAR PROJECTS IN EAST, EAST-CENTRAL, AND SOUTH-WEST UGANDA

Step 8: Data Analysis: Building on the qualitative and quantitative data collected during the

month of November 2014 and a preliminary analysis presented to USAID and the project’s IPs

in early December 2014, each of the three field teams returned to the field in January 2015 to

further refine and validate its findings associated with the project area in which the team had

been working. In addition, each team drew upon the findings of the team’s economist and the

exit interviews to expand its findings related to the viability of the DBTA model. Section A of

this report’s consolidated findings and the project-specific pullout sections (Sections B–D) of this

report focus on the evaluation’s findings, conclusions, recommendations, and lessons learned.

Step 9: Information Dissemination: As specified in the evaluation’s SOW, the evaluation

team’s findings are to be disseminated. (Please see Annex B for a detailed discussion of the

evaluation’s information dissemination requirements.) A preliminary debriefing of the findings

was held in December 2014, and the results were used to improve the dissemination of findings.

LIMITATIONS

Evaluating the efficacy of the DBTA model as it was applied across three different DBTA

projects represented significant organizational and analytical challenges. The principal challenge

was in reaching conclusions that were relevant across all three STAR projects. While every

effort was made to validate such conclusions through consultations with each of the three IPs,

the generalized conclusions reached by the evaluation team did not receive total agreement

from all IPs.

ETHICAL CONSIDERATIONS

Much of the evaluation’s data collection process entailed having access to informants whose

willingness to respond to the evaluation’s inquiries was predicated on the evaluation’s adherence

to its pledge to uphold their anonymity. Accordingly, verbal consent was obtained from all

respondents prior to their interviews. (Please see Annex E for a sample of the verbal consent

form.) In addition, no financial or other incentives were provided to participants. Finally, any

information that could identify respondents was removed from the documentation associated

with the interviews.

USAID/UGANDA’S DBTA MODEL AS APPLIED UNDER STAR PROJECTS IN EAST, EAST-CENTRAL, AND SOUTH-WEST UGANDA 9

IV. FINDINGS

IMPROVED CAPACITY AND SUSTAINABILITY

What are the most successful approaches applied by the DBTA/STAR

Programs towards strengthening the institutional, management, and human

capacity of CSOs and local governments to deliver health services?

The most successful approaches used by the DBTA/STAR programs were the mentorship

program, the integration of HIV/AIDS and TB care at lower-level facilities, and the strengthening

of community linkages for HIV/AIDS and TB services.

Mentorship and Training

The mentorship program included off-site training as well as on-site practical support of local

health staff by a team of trained, qualified, and experienced health workers. In all KIIs conducted

with the local health workers across the DBTA regions, they reported mentorship as the main

process through which they learned and mastered skills and practices for their work. The

mentorship approach also helped local health workers to:

1. Improve their cognitive and practical capacity when handling HIV/AIDS and TB services and

accelerating transition of clients from high-volume, standalone, higher-level sites to lowerHCIII and HCII levels;

2. Gain skills in reporting processes and mechanisms, which in turn positively impacted thequality of services provided; and

3. Provide services in technical areas that they were originally not able to deliver, such as safemale circumcision (SMC) and Option B+.

Across the DBTA projects, mentorship was applied as an ongoing, capacity-building process

rather than a one-time event. The mentorship process was mainly a frontline, health-worker-

centered approach and did not focus closely on system management at the health-facility level.

The mentorship program targeted HIV/AIDS service delivery points, providing on-site training

and hands-on practice and imparting skills to the local health workers. The kinds of training and

mentoring activities varied from project to project, with some programs emphasizing on-site

training and others combining both

approaches.

For STAR-SW, on-site training was

emphasized because the process was

cheaper and did not divert health workers

from their stations. The STAR-SW

mentoring teams were established at

regional, district, and HSD levels to address

key HIV/AIDS and TB service areas like

ART, data management, laboratory services,

and clinical performance. STAR-SW initially

established a regional team of clinical

mentors, as no single district would have

“We have seen improved baseline CD4 from 34%

to 95%; update CD4 from 66% to 95% and have

enabled streamlined services for follow-up.”

(Service provider KII, HCIV)

“We have been able to maintain twenty-seven

mothers with increased quality of data from 0 to

54% ... routine visits are at 85% now.”

“One hundred sixty exposed babies were graduated

to negativity, and this was 100%.”

(Service provider KII, HCIII)

10 USAID/UGANDA’S DBTA MODEL AS APPLIED UNDER STAR PROJECTS IN EAST, EAST-CENTRAL, AND SOUTH-WEST UGANDA

been able to create such a team. Working alongside the STAR-SW technical team, the regional

team established district clinical mentorship teams, members of which were selected from

various facilities and included clinical officers and nurses.

In the STAR-EC region, the mentorship approach included a combination of on-site training at

high-volume health facilities able to mobilize adequate trainees for cost-efficient training as well

as off-site training, usually at centers of excellence in specific HIV/AIDS and TB service elements

within or outside the region. In each of the four districts visited, seven to fifteen health workers

were trained. Senior health workers were trained on how to teach their juniors and continue to

mentor them in various HIV/AIDS and TB service areas.

In the STAR-E program, mentorship

included training of sixty district-based

mentors (DBMs) selected from the district

health teams (DHTs) and various cadres

of service providers at HCIV and HCIII

levels. The districts in the region were

divided into four clusters of three districts

each. A clinical mentor was devoted to

each cluster and was supervised by a

STAR-E staff member, referred to as the

district health adviser. The various cadres

of service providers were taken for off-

site training.

Findings from the KIIs conducted with the district health managers and health providers showed

that through the mentorship program, the DBTA did a commendable job strengthening the skills

of service providers in the realms of ART and TB services. For STAR-E, the principal benefit of

the mentorship program was the improvement of the individual and collective capacity to

provide HIV and TB services with confidence.

An additional advantage of this approach

was that training was tailored to the real

working context and mentoring was on-

site and did not disrupt service delivery.

The facility-based mentors were readily

available to transfer skills to new recruits.

As an expression of appreciation, the district health officer (DHO) Mbale wanted the number of

technical mentors to be increased to enable them to spend more valuable time at each facility.

Some of the trainees also attested that the mentorship was beneficial.

Strengthening the Integration of HIV/AIDS and TB Care at Lower-level Health Facilities

Prior to the STAR projects, HIV/AIDS and TB services were provided solely at higher-level

health facilities. The DBTA STAR projects emphasized the expansion of HIV/AIDS and TB

services to the lower-level health facilities (HCII and HCIII) as well. This increased accessibility

and utilization of HIV/AIDS and TB services, which led to increased opportunities for early

detection of HIV/AIDS and TB and early initiation of treatment. This, in turn, prolonged the lives

of both TB and HIV/AIDS patients.

“We have gained from on-the-job training and

mentorship. We started ART just last year in 2013

and have graduated clients to ART—312 adults and

children…”

(Service provider, HC III)

“Before STAR intervention there was no HIV

enrollments. In the ART clinic we had one technician,

one nurse. After the training, staff can now freely

rotate and perform other duties.”

(Service provider, HCIV)

“Seven of us have been trained in HIV patient

management, and I am confident that any one of

the seven can run the ART clinic.”

(In-charge, HCIII, Bulambuli District)

USAID/UGANDA’S DBTA MODEL AS APPLIED UNDER STAR PROJECTS IN EAST, EAST-CENTRAL, AND SOUTH-WEST UGANDA 11

Strengthening Community Linkage for HIV and TB Services

The strengthening of community linkage cut across all three projects, with some variations.

Under the DBTAs, a common and successful approach to strengthening demand for and supply

of HIV/AIDS services focused on the establishment of extensive networks of community health

workers. In STAR-E, this network was created through the identification and training of linkage

facilitators, who were identified as experts within the population of clients accessing clinical

services. Linkage facilitators were mandated to mobilize community members for service

delivery, conduct client follow-up visits, and provide non-clinical HIV/AIDS-related services,

including counseling, organization of client records, and linking clients with health facilities.

Village health teams (VHTs) were mainly used to provide TB services, which included

community-based (CB) directly observed treatment short courses (DOTSs) and other non-HIV-

related services such as immunization and family planning. In the STAR-EC region, VHTs were

critical in intensified TB case finding and treatment referrals in hard-to-reach sub-counties and

island communities. In other STAR program areas, a similar pattern was observed. In the STAR-

SW region, VHTs, family support groups (FSGs), and peer educators were used to mobilize the

delivery of HIV/AIDS services at the community level. Through community structures, STAR-

SW reached over 120,000 clients and had a referral completion rate of 70%. Importantly,

referral mechanisms among the STAR-supported facilities, CSOs, community members such as

linkage facilitators, VHTs, FSGs, and mentor mothers were strengthened in all the three STAR

projects. At the time of the evaluation, the DBTAs were in the process of curtailing their

activities in the districts; however, during the FGDs with the expert clients it was noted that in

the selected sampled facilities where the discussions were conducted, expert clients actively

engaged in the delivery of HIV/AIDS and TB services, providing reasonable expectations for the

sustainability of this important initiative.

Commodity Tracking System to Reduce Stock Outs

The STAR programs strengthened logistics and supply chain management at district and health-

facility levels by introducing systems for tracking medicine orders and stock outs. The

approaches varied across the DBTA/STAR program areas, but the intentions were the same.

For example, STAR-SW introduced a range of systems, including an order tracker, a supply

tracker, a commodity tracker, and a short message service (SMS)-based weekly report on

stock status. STAR-E relied on a multimedia messaging service (MMS) to provide bimonthly

reports and orders to the logistics advisor. The logistics advisor combined the reports to

generate a consolidated report that detailed transfers of medicines between health facilities and

districts. STAR-EC relied on a spreadsheet that was shared by focal persons at the districts to

update and monitor the supply of medicines and indicate the quantity to be ordered or

transferred. These interventions reduced stock outs of the relevant HIV/AIDS and TB

commodities, excess accumulation of stock, and waste and expiration of health commodities at

the district level.

Strengthening Laboratory Services

Support to laboratory services included space modifications as well as the provision of

equipment, stationery, and staff training to enable the efficient delivery of quality HIV/AIDS and

TB diagnostic and monitoring services, thereby improving the quality and accessibility of health

care.

One of the vital interventions for strengthening laboratory services was the implementation of

the hub system under the coordination of the Central Public Health Laboratories (CPHL) on

12 USAID/UGANDA’S DBTA MODEL AS APPLIED UNDER STAR PROJECTS IN EAST, EAST-CENTRAL, AND SOUTH-WEST UGANDA

behalf of government of Uganda. As described by Kiyaga, et al,1 the hub laboratory support

system relied on the following: “Using Geographical Information System (GIS), a catchment area

of 30 to 40 km radius was mapped around each hub. Using the same GIS, health facilities within

that catchment area were identified with respective road networks. Motorbike routes were

demarcated such that a hub rider collecting samples and returning results would visit facilities in

the catchment area at least once a week. Each hub was provided with a motor bike and

equipped with the required supplies to perform the daily routes. Each hub served between 20 to

40 health facilities.” The role of the STAR programs in the process was to strengthen district

laboratory systems through infrastructure development (building and refurbishing labs), the

recruitment and capacity building (through districts) of staff including hub riders, and initial

operational support, including payment of salaries and the provision of fuel for hub riders. The

DBTA projects also provided operational support to the external quality assurance programs of

the Uganda Virus Research Institute (UVRI).

The success of the STAR programs is exemplified by the strengthening of labs under the

Strengthening Laboratory Management Toward Accreditation (SLAMTA) program. An

officer from CPHL noted that the hub system was especially successful in expanding and scaling

up access to early infant diagnosis (EID) and viral load laboratory services.

What are the least successful approaches applied by the DBTA/STAR Programs towards strengthening the institutional, management, and human

capacity of CSOs and local governments to deliver health services?

Although there were a number of successful technical approaches, the evaluation team identified

the following as shortcomings of the programs: (1) limited focus on empowering health facility

leadership; (2) limited focus on empowering DHT leadership; (3) limited education for clients

about the role of sexual risk behaviors in HIV/AIDS transmission; and (4) limited orientation to

day-to-day quality improvement.

Limited Focus on Empowering Health Facility Leadership

While the DBTAs achieved significant progress in implementing technical assistance approaches

that focused on improving service delivery, there was limited attention directed toward

upgrading health facility management capacity. Findings from the KIIs with health facility

management staff indicated that most of the technical support provided was considered to be

one-time and subject-specific (e.g., accounting, finances, human resources), with a focus on

performance of immediate objectives rather than on long-term sustainable management

development. Moreover, for all of the approaches and initiatives introduced by the STAR

programs, there was limited documentation left behind at the facility to assist the facility

managers in guiding the process of long-term knowledge management (KM) for the facility’s

management as well as the facility’s staff.

Empowerment for District Health Team (DHT) Leadership

As defined in the evaluation’s scope of work, the DBTA was “designed to strengthen

decentralized service delivery systems for improved uptake of quality HIV/AIDs and TB

services.” Based on discussions during the KIIs with USAID staff, it was evident that the launch

1 Kiyaga C, Sendagire H, Joseph E, et al. (2013) Uganda's New National Laboratory Sample Transport

System: A Successful Model for Improving Access to Diagnostic Services for Early Infant HIV Diagnosis

and Other Programs. PLoS One 8(11): e78609. doi:10.1371/journal.pone.0078609

USAID/UGANDA’S DBTA MODEL AS APPLIED UNDER STAR PROJECTS IN EAST, EAST-CENTRAL, AND SOUTH-WEST UGANDA 13

of the DBTA projects consisted of two complementary elements associated with the model:

service delivery improvements at all levels and health systems strengthening, predominantly at

the district level.

The first initiative, direction for which should have been more clearly included in the technical

assistance contracts of the three STAR IPs, was to focus on the provision of technical assistance

to develop the HIV/AIDS and TB health service delivery capacity of the selected district health

facilities with a peripheral, but empowering, linkage to district management.

The second initiative (SDS), under the direction of a separate IP, was to focus on the provision

of technical assistance to strengthen the management capacity of the districts in which the three

STAR projects were providing technical assistance to health facilities. SDS grants were intended

to improve the linkage between the district systems, the facilities, and the community.

According to USAID/Uganda respondents to the evaluation, both components of the DBTA

model were to work together toward realizing the potential of a Ugandan DBTA model.

Unfortunately, the timing of the launch of the second initiative under SDS was delayed, and by

the time SDS assumed full operations in 2011, two out of the three DBTAs (STAR-E and STAR-

EC) had already assumed, with the approval of USAID/Uganda, many of the district capacity-

building responsibilities that eventually fell to SDS to undertake. In addition, the process by

which SDS eventually assumed responsibility for district capacity development served to

undermine the importance of the DBTAs’ role in empowering and strengthening the technical

and managerial relationships and linkages between the district health authorities and the health

facility in-charges. Consequently, with the exception of STAR-SW, which had the programmatic

planning advantage of starting up at the same time as SDS, interviews at health centers revealed

staff generally looked to the DBTAs for technical, fiscal, and material support when addressing

the needs of their HIV/AIDS and TB programs.

Limited Emphasis on Systems Strengthening in the Program Design and Program

Implementation

A critical examination of the STAR program descriptions, with a focus on the overall goal and

the four objectives, clearly indicates that while the programs were physically located in districts,

the programmatic emphasis was on health facilities and their catchment communities. As such,

the focus of the DBTAs as implemented was on increasing both the supply and demand sides for

HIV/AIDS and TB services, with little emphasis on the systems strengthening. It was not the

mandate of the STAR programs to strengthen the systems, and this was evident in their

contracts, the approved Activity Monitoring Evaluation and Learning Plans (AMELPs), and

quarterly and annual reports. The lack of emphasis on systems strengthening was further

compounded by the very ambitious service-delivery output targets, especially in the voluntary

medical male circumcision (VMMC) and elimination of mother-to-child transmission of HIV

(eMTCT) program areas, both of which were expected to be delivered within short time

frames. This design and implementation weakness inevitably forced the DBTAs to take shortcuts

to achieve the required results while building some capacity along the way. In STAR-E for

example, the project personnel reported that targets for VMMC and eMTCT services were

overly ambitious and, as a result, targets for VMMC were mainly achieved through outreach

activities with allowances for the staff instead at the health facilities. This meant that health

workers were removed from their stations to conduct outreach operations and that there was

a lack of clarity about where to refer clients who experienced complications. Health workers

14 USAID/UGANDA’S DBTA MODEL AS APPLIED UNDER STAR PROJECTS IN EAST, EAST-CENTRAL, AND SOUTH-WEST UGANDA

who were involved in the outreach circumcision activities did not continue to perform

circumcision activities at their stations because there were no financial gains.

Limited Focus on Behavioral HIV Prevention Activities

The Uganda National HIV Prevention Strategy (2011–2015) emphasizes the need for

combination prevention, focusing on both behavioral and biomedical components. The main

focus of HIV prevention activities in the STAR programs has largely been on biomedical

approaches, including safe male circumcision (SMC), eMTCT, and the reduction of community

viral load through ART. However, little attention was paid to sexual risk behavior–focused

prevention approaches, such as education about the benefits of monogamy and abstinence/delay

of sexual debut among youth. It was evident that condom distribution largely focused on key

populations at risk as opposed to other groups, such as married couples. This did not reflect the

findings of the 2012 Uganda AIDS Indicator Survey reports, in which married couples were

found to be at high risk of infection due to extramarital sexual relationships.

According to findings from the KIIs conducted with service providers and the FGDs conducted

with PLHIVs across the DBTA regions, behavior change communication about the role of sexual

risk behaviors in the prevention of HIV transmission was limited. Additionally, respondents

noted, especially youths interviewed, that power relations at the family level negatively impacted

their ability to practice HIV prevention behaviors, including condom use, delay of sexual debut,

monogamy, and abstinence.. Mitigating HIV/AIDS exposure risk to others received limited

program attention under the DBTAs. It was reported by health workers and PLHIVs that

women who were enrolled in Option B+ had difficulty informing their husbands and other

relatives about their situation.

Provision of Incentives for Clients and Service Providers

The provision of maize flour and sugar to clients utilizing ART sites undeniably increased

demand for and utilization of those sites while also contributing to clients’ improved nutritional

status. However, as STAR programs came to a close, the availability of costly incentives similarly

came to an end. At the time of the evaluation, there was a question of whether the program’s

cessation would result in decreased supply and demand for ART services. In one of the STAR-E–

supported facilities, health workers and their in-charges categorically stated that they were no

longer inclined to work long hours in the ART clinic or provide outreach services since there

were no more allowances for the additional work. Another example that cut across the DBTA

programs was the delivery of VMMC services at the health facilities. The health workers stated

they would no longer take time off from their mandated duties to provide circumcisions without

the special allowances that they were previously provided with for participating in the program.

The evaluation teams also noted during client exit interviews that the clients included the

availability of welfare benefits obtained from the health centers as one of the measurements by

which they judged a health center’s quality of services. Failure to maintain welfare benefits as

part of the service delivery package is likely to negatively impact demand for HIV/AIDS and TB

services.

Logistics and Supply Management (LSM) of TB Drugs

Although not specifically included as a DBTA deliverable, during implementation of the STAR

programs, there was a country-wide gap in LSM of TB drugs. Initially, LSM for TB drugs was

operated by the National TB and Leprosy Program, under a separate arrangement from that of

other essential medicines and health supplies (EMHS). This arrangement had challenges that

USAID/UGANDA’S DBTA MODEL AS APPLIED UNDER STAR PROJECTS IN EAST, EAST-CENTRAL, AND SOUTH-WEST UGANDA 15

necessitated its integration into the national supply system starting in 2012. The quantity of TB

drugs delivered to health facilities was determined by the National Medical Stores (NMS) until

2013. During this period, there was less emphasis on placing orders and there were no order

forms. As a result, TB drugs were sent to all facilities in excess and there was no room for

redistribution across the districts. This led to the expiration of TB drugs in health facilities, yet

the STAR programs had limited scope for intervention.

What are the facilitators and barriers of these approaches to

achieving results?

Facilitating Factors

The following narrative describes the common factors that facilitated the application of the

DBTA model across all STAR programs.

Conducive HIV/AIDS Policy Framework

The national HIV/AIDS policy and clinical

guidelines in Uganda are well defined. The

STAR project across the three regions and

the district staff were well guided in terms of

what was required of them. With support

from MoH, the project technical teams,

together with the DHTs, were well placed to

respond to any changes in the relevant policies and implementation guidelines.

Technical Competencies of the STAR Teams

As noted above in the report’s discussion of successful approaches to the provision of technical

assistance, the DBTA/STAR programs achieved significant progress toward the STAR projects’

defined deliverables. Despite the rather high personnel turnover across the three programs, the

evaluation team attributes the programs’ success to staff competency in the required technical

areas. During KIIs with DHT members, they acknowledged the high specialization and practical

competency of the clinical advisors and mentors. The health workers who benefited from

mentoring also acknowledged the staff’s level of competence. At the same time, a number of

DHTs in selected districts indicated that they “...liked the project but not necessarily the team.”

Comments of this sort were assessed as reflecting more on the quality of professional and

personal interactions between program and district leadership rather than on technical

competence.

Conducive Community Environment

Based on KIIs with service providers, FGDs with community beneficiaries, and exit interviews

across the DBTA project regions, over the life of the DBTA interventions there was a positive

community-based environment for service delivery. The clients who participated in the exit

interviews reported that this conducive environment was not experienced at the health facilities

prior to the support provided by the STAR projects. In addition, the DBTA projects facilitated

the collaboration of health center staff and expert clients to develop a positive community-based

working environment. The expert clients helped in the delivery of HIV/AIDS and TB services,

both at the facilities and in the communities across the DBTA project regions. At each health

facility, the network of expert clients supported the provision of HIV counseling, organized files,

participated in mobilizing people to access HIV/AIDS and TB services, and conducted client

“We do not have enough local revenue and

so we need STAR-E to help us with putting up

essential services, and the health sector that

STAR-E supports is our priority.”

(Local council chairman, STAR-E district)

16 USAID/UGANDA’S DBTA MODEL AS APPLIED UNDER STAR PROJECTS IN EAST, EAST-CENTRAL, AND SOUTH-WEST UGANDA

follow-ups in the communities. This led to an increased demand for HIV/AIDS and TB services,

improved adherence to treatment regimens, and reduced the number of clients who were lost

to follow-up. FGDs noted the important role of CSOs in community mobilization and other

family support services. The positive community receptivity and the involvement of expert

clients were principal factors that led the improved community environment and the attainment

of the set service delivery targets required by the STAR projects.

Receptivity for Technical Assistance

The technical assistance introduced by the DBTA/STAR programs was well received at the

district and health facilities. The district and health facility managers provided the needed

support to ensure that the interventions were easily rolled out. The technical assistance that

was provided was judged to be adequate and relevant to health workers. There was good will

from the district leadership across the three STAR projects (both administrative and technical).

MOUs were signed, and the relevant district officials provided the necessary support. As a

result, the district health teams saw the valuable additions of the projects and were willing to

support the operationalization of the technical assistance, helping to make it a success. The

evaluation team also noted that the new districts were more committed to supporting the

DBTA projects.

Resources for Priority Technical Assistance Interventions

Availability of sufficient funds to implement the mandated activities was a cross-cutting

facilitating factor. The three DBTA projects were well funded, and this enabled service delivery

to take place. Funds were available to facilitate transport refunds, allowances for health workers

in HIV clinics, support for supervision, and male circumcision camps. Funds were also available

to enable the IPs to flexibly spend on ad hoc requests from USAID, MOH, and local

government. This kind of arrangement enabled continuity of the critical services. In addition,

once the SDS initiative was launched and the first grants were awarded in March 2011, the

environment was established for significant district-level support in concert with support

provided by the STAR projects. Finally, working in partnership with other USAID IPs, including

ASSIST, TRAC TBSPRING, and SURE, enabled the STAR projects to secure additional health

systems strengthening support, such as human resource capacity strengthening, quality

assurance, and monitoring and evaluation support.

Barriers and Challenges

The following section describes common barriers or challenges associated with program

planning, management, and implementation that impacted the application of the DBTA model

across all STAR programs.

Inadequate Human Resources

The problem of human resources affected both the performance of district leadership and

health facilities. In the districts, especially new ones, recruitment and retention of medical

officers, midwives, clinical officers, and laboratory technicians was a general problem. The CAOs

cited the limitations in the district wage bill as another challenge. The problem of inadequate

capacity was, however, partly ameliorated through the Human Resources for Health (HRH) and

SDS grants, which enabled districts to recruit critical staff for the district health system, with the

understanding that they would later be absorbed into the districts’ payrolls at the end of the

program.

USAID/UGANDA’S DBTA MODEL AS APPLIED UNDER STAR PROJECTS IN EAST, EAST-CENTRAL, AND SOUTH-WEST UGANDA 17

Continued High Levels of HIV-related Stigma and Discrimination

Based on discussions with clients in both FGDs and in client exit interviews, the spectrum of

stigma and discrimination continues to impact the willingness of PLHIVs to access health centers

for health issues. Women reported unwillingness to disclose their test results to their spouses,

especially if they were HIV positive.

Health System Weaknesses

The health system in Uganda is characterized by a number of inherent weaknesses.

Inadequate financing (low pay, low morale, poor work climate)

Low staffing for DHMTs (about sixty-four districts had staffing below 60% at the DHO’s

office)

Poor infrastructure, including lack of accommodations for health workers and geographical

barriers such as rough terrain and bad roads

Shifts in policies to match global trends, regardless of the readiness of available systems

Due to low salaries for health workers, the STAR projects resorted to “double-edged” financial

incentive schemes to encourage staff to continue to provide HIV/AIDS services. Laboratory

infrastructure was also limited in many facilities, with staff expressing concern for their safety

when conducting TB microscopy. The issue of equipment was, to a large extent, addressed by

the program, which ensured that the basic equipment for delivering minimum healthcare

packages was provided to all the supported facilities.

A number of districts in the STAR regions had health-sector leadership challenges that affected

district capacity to absorb and utilize the available technical assistance. In the evaluation team’s

discussions, both district and facility staff noted the existence of incomplete district, health sub-

district, and health-facility management structures, with many officers in “acting” capacities. It

was also observed that, even where DBTAs built capacity at the facility level, institutional

capacity for effective management was significantly diminished in a number of instances where

senior in-charge personnel were demonstrably under-qualified for their levels of responsibility.

The impact on DBTA programming and implementation associated with irregularly scheduled and single-issue vertical training programs

During the lifespan of the three STAR programs, HIV/AIDS care continued to evolve with

concomitant changes in policy, most notably with reference to the eMTCT policy of Option B+

and safe male circumcision. As a result, the time and resources consumed to engage facility staff

in what key informants described as constant and single-issue training cycles significantly

impacted DBTAs’ ability to effectively and efficiently program facility and community-level

capacity building initiatives.

Central-level Stock Outs of Vital Commodities

Earlier sections of this report cited facility-level improvements in LSM as one of the DBTAs’

most successful approaches. However, inadequacies associated with centrally controlled

deliveries of vital commodities resulted in stock outs of antiretroviral medications, test kits, and

reagents across all program regions. In response, DBTA staff adopted the practice of canvassing

facilities in the area to determine whether these facilities had reserves that could be distributed

18 USAID/UGANDA’S DBTA MODEL AS APPLIED UNDER STAR PROJECTS IN EAST, EAST-CENTRAL, AND SOUTH-WEST UGANDA

to those facilities lacking critical drugs and medical supplies. While the willingness of facilities to

share resources is to be commended, inadequate central-level management of vital commodities

was identified as a source of frequent frustration among LSM facility-based managers who, with

assistance from DBTA technical staff, approached their drug and medical supply responsibilities

in a professional and efficient manner.

Were the approaches used and results achieved for old/established and

relatively new/naive districts significantly different?

The evaluation team noted district-specific approaches, without reference to a standard pattern

across a program area or across the DBTAs’ regions. Generally, however, there were not

significant differences across the three regions in terms of approaches applied or results

achieved between old and new districts. Differences in implementation of the approaches noted

between old and new districts related more to elements of the regions’ health systems, including

availability of transport, human resources, and infrastructure. These elements were beyond the

programmatic or technical scope of the three DBTAs.

What was the effect of transition of direct implementation of district led health care management activities from the STARs projects to district

grants through SDS?

USAID/Uganda introduced the SDS project as a supplementary mechanism that would focus on

strengthening district-led coordination of health services and local government systems and

would provide performance-based grants to districts to complement service-delivery resources.

While the SDS project was not directly part of the evaluation of the STAR projects, it was

important to assess the effects of transitioning to the SDS grants on the DBTA. The evaluation

aimed to understand the extent to which transitioning direct implementation of district-led

health care management activities from the STARs projects to district grants through SDS

impacted the STARs projects’ provision of technical services under the DBTA model. The

findings indicate that the recipient districts felt positively about the arrangement.

Inaugurated in April 2010, with its first

grant issued in March 2011, the SDS

project and its implementation of

activities was preceded by the

inauguration of the STAR-E and STAR-

EC projects in late 2009. Prior to the

start-up of SDS activities, both STAR-E

and STAR-EC assumed many of the

district capacity-building activities that

were eventually taken over by SDS.

The entry of SDS in STAR-EC was poorly initiated by the districts. The local governments had

high expectations that were beyond the SDS mandate. The districts anticipated receiving funds

for infrastructure development and hardware purchases. On realizing that this was outside the

SDS mandate, the motivation for local governments to perform stagnated. As a result, it took

STAR-EC and SDS time to define roles, responsibilities, and programmatic parameters with the

local governments. It was only in the case of STAR-SW (launched in 2011) that transitioning

issues from a STAR project to the SDS project did not occur. In the South-West region, SDS

“Before SDS came on board, we were doing the

technical assistance and funding of those activities.

When SDS came, we would do the work planning with

the district, but SDS would fund those work plans,

which then meant that our role was to work with the

district and give technical assistance to the district

while they do the funding.”

(KII, STAR-EC)

USAID/UGANDA’S DBTA MODEL AS APPLIED UNDER STAR PROJECTS IN EAST, EAST-CENTRAL, AND SOUTH-WEST UGANDA 19

grants and the DBTA program began around the same time, and therefore the transition was

collaborative.

Strengthening district capacity to lead and manage service development: SDS grants

facilitated effective planning at the district level. Working in close collaboration, SDS and the

DBTA ensured proper coordination of the planning process in each district, including the

sharing of approved work plans, budgeting with other USAID-funded health projects, and

HIV/AIDS initiatives with district political and technical teams. The districts were also supported

to develop multiyear and annual implementation plans, determining key activities for achieving

targets for HIV/AIDS programming.

Provision of performance-based grants: SDS provided performance-based grants to the

districts, and this supported service-delivery coordination within districts and regions, as well as

USAID support to district health sector programs. SDS strengthened the district capacity to

manage vital SI. Support was provided for: the recruitment of additional staff at the facility level

and for technical positions in the district planning office; HMIS training that benefited all STAR-

SW districts; printing and reproduction of HMIS reporting registers/forms; coordination

meetings for SI committees; and the implementation of LQAS-related activities.

Strengthening of district capacity for managing partnerships: SDS coordinated USAID-

funded activities and contributed to improving district capacity to engage multiple funding

sources effectively. The role of SDS in the districts promoted alignment of USAID support to

districts, which facilitated alignment of priorities and linkages between partners. However, weak

partnerships among districts, CSOs, training institutions, private health partners (PHPs), and

non-PEPFER partners still exists.

Institutionalizing the culture of transparent accountability for both results and

finances: The ability of districts to manage grants and accounting transparently, while linking

financing to performance, was a major breakthrough for sustained district leadership and led to

greater outcomes in service delivery.

To what extent has the STAR program developed, established, and/or strengthened management and technical structures at the local-government

and health-facility levels to sustainably improve quality, availability, and

accessibility of HIV/AIDS and TB services?

Sustainability is one of the seven essential design elements described in the USAID request for

application (RFA) for the DBTA programs. The RFA defined two elements of sustainability—the

program activities and the program impact—and indicated that sustainability is dependent on the

development of local capacity to design, manage, and maintain services. The RFA further stated

that sustainability would be achieved through the direct technical and institutional capacity

building of: (a) government counterpart agencies; (b) local partner service providers (civil

society, faith, and PHA groups); and (c) community organizations and other groups. Two results

of such support as described in the RFA were: (a) greater involvement in planning,

implementation, and monitoring of HIV/AIDS and TB services; and (b) effective partnerships

with other service providers to link PHAs to a continuum of care through the network model

approach. The final requirement in the RFA related to sustainability was an exit strategy for the

program.

20 USAID/UGANDA’S DBTA MODEL AS APPLIED UNDER STAR PROJECTS IN EAST, EAST-CENTRAL, AND SOUTH-WEST UGANDA

The evaluation sought to establish the extent to which the STAR project developed

management and technical structures that would sustainably improve quality, accessibility, and

availability of HIV/AIDS and TB services in targeted districts. The evaluation team found that the

STARS programs had developed, established, and/or strengthened the following management

and technical structures:

Management Structures

Strengthening of management structures: Supervisory and planning structures were

strengthened, including the DHTs and district AIDS committees (DACs), particularly in

STAR-EC and STAR-SW. The STAR programs facilitated the operationalizing of specific

management functions, which were enhanced through training, mentorship, and joint

implementation opportunities. Specific STAR program staff were assigned clusters of

districts to support on a monthly basis. With the aid of the STAR programs, the DHTs

convened monthly and quarterly meetings, mainly to review performance and develop

implementation plans. As part of the mentorship activities, the STAR programs supported

the restructuring of quarterly meetings and supervisory plans to incorporate essential

elements of QI management. To ensure sustainability, operations of the DHTs as

coordination mechanisms were integrated into SDS grants to enhance a sense of ownership

of HIV/AIDS and TB efforts by the respective districts.

Strengthened regional and district teams: Regional and district teams were

strengthened for the management of SI through centralized training, practical on-site

training, and in-field practical skills transfer opportunities. The areas of focus included

streamlining and overseeing management of data collection for entry in the HMIS and the

DHIS2 and utilizing the web-based supply ordering system.

Strengthened capacity for CSOs participating in the DBTA/STAR projects: CSOs

were strengthened in several areas, including resource mobilization, financial management,

supervision, training and mentorship, and specialized aspects of proposal writing. This was a

significant step in developing institutional capacity of partner organizations to develop

strategic plans that can be funded by alternative partners.

Technical Structures

Strengthening of districts-based trainers, mentors, and supervisors: The

DBTA/STAR projects established district-based teams of trainers, mentors, and supervisors

to serve as hubs of technical expertise for expanding and sustaining the technical

competencies of the healthcare workforce in the respective districts. Each district had a

team of about five trainers and eight to twelve clinical mentors, comprising members from

the district and health-facility levels. To increase sustainability, these teams were

mainstreamed in their respective district health systems and at the facility level. As a result,

most of the health facilities will be able to sustain on-site training and mentorship.

Capacity building for service providers: Under the DBTA/STAR program, service

providers from over 680 health facilities were trained in various technical areas including

clinical skills, client management, management of QI, and service data management of

integrated HIV/AIDS and TB and HIV/AIDS and family planning (FP) services. On average,

the structure supported the development and maintenance of teams of seven to eight multi-

skilled service providers at 680 HCIV and III.

USAID/UGANDA’S DBTA MODEL AS APPLIED UNDER STAR PROJECTS IN EAST, EAST-CENTRAL, AND SOUTH-WEST UGANDA 21

Strengthened district, health facility, and CSO quality improvement (QI) teams:

In partnership with the MOH and other USAID partners, the STAR programs established

and/or strengthened a total of twenty-eight district QI teams, eighty-four facility QI teams,

and nine CSO QI teams. To pave the way for sustainability and also to create a sense of

ownership of QI activities, the project ensured that members of these teams included

district and facility mentors.

Capacity building for LQAS teams: A team of fifteen members, comprising

representatives from the DHT and district planning unit, were trained in LQAS

methodology and supported to apply it in their respective target DBTA/STAR project

districts on an annual basis. Training in LQAS included technical concepts, data collection

and analysis, and dissemination. Using the LQAS methodology, the districts were able to

identify performance gaps. The LQAS methodology was widely accepted by the Ministry of

Local Government (MoLG), DHTs, district planning units, district political leadership, and

DBTA managers.

What technical capacity in strategic information have the STARs developed,

built, and/or strengthened? Where has this capacity been developed, built,

and/or strengthened? How is it manifested/demonstrated? How sustainable

will this capacity be after the STARs’ exit?

To strengthen the technical capacity in SI management, the DBTA focused on three elements:

human capacity development, systems development, and material support. The evaluation team

measured technical capacity in SI in terms of focus, benefit, and potential for sustainability.

Technical capacity was strengthened in the following aspects:

Capacity to generate and process

routine service data: Working in

close collaboration with MOH and

SDS, the STAR programs supported

the streamlining of data collection at

the facility level by providing essential

materials for documenting and

reporting on service delivery. Also,

the STAR programs provided technical

assistance in improving data quality by

introducing the concept and practice

of data auditing and cleaning. This support went to all districts and their respective health

facilities. With improved capacity to generate data, the STARs went further to train and

mentor health facility teams in reviewing and using data at the facility level to plan QI.

Interviews with service providers showed that various teams now recognize the use of

service data as a strategic tool in identifying gaps and making improvements.

Electronic medical record systems: KIIs

reported that in some regions, STAR

programs supported the rolling out of

patient-level electronic medical record

systems (MOH OpenMRS), particularly in

“We have the skills to collect data, do data

tabulations manually, and reporting.”

(KII, Kamuli DHT)

“The in-charge at a facility can make simple

analysis of data collected in a month or a quarter

to identify any striking issues that might need the

attention of the facility. For example, check number

of clients per service and compare it to a previous

month or quarter. Find out lost-to-follow-up clients

who were on ART, PMTCT, or TB treatment. This

data has informed the facility to generate action

points for the coming month or quarter.”

(KII, Busembatya HCIII)

22 USAID/UGANDA’S DBTA MODEL AS APPLIED UNDER STAR PROJECTS IN EAST, EAST-CENTRAL, AND SOUTH-WEST UGANDA

high-volume facilities. As a result, there was quicker retrieval and access of patient medical

records.

Capacity for application of LQAS in

community surveys: The STAR project

strengthened the capacity of all

participating districts to apply LQAS

methodology in annual community

surveys. LQAS application in the STAR

project aimed at generating population-

based data on key outcome indicators for

HIV/AIDS and TB prevention, care and

treatment, and related components of

maternal and child health. LQAS allowed

generation of district-specific data for

strategic planning and improvement of

programs. In each district, a team of eight to ten people was trained in concepts and

principles of LQAS, data collection, tabulation of results, and use of information.

District and facility-level platforms for performance review and data

dissemination: The STAR project revitalized and strengthened district and heath-facility

processes for performance reviews and dissemination of strategic data. The effort

institutionalized HMIS data review and feedback processes, quarterly review meetings for

key stakeholders, dissemination of SI from LQSA, and learning sessions for peer review and

sharing. A culture of evaluating performance and generating and sharing lessons was

inculcated in the management operations of the respective district teams.

Capacity to generate information and data from communities and service users:

The STAR project supported the

creation of a community-based data

system to solicit and document

information from and about targeted

communities using the existing system

of VHTs. The project facilitated

introduction of record books to

document eligible clients, referrals, and

follow-up mechanisms for VHTs and

Mother Mentor. The practice resulted

in greater service utilization.

Manifestation and Utilization of Strategic Information

The STAR project’s strengthening of technical capacity in SI management is evident in three

distinct elements of capacity building: human capacity development, systems development, and

material support. Human capacity development entailed organizing and conducting training and

mentorship opportunities that targeted district-based biostatisticians, HMIS focal persons,

records assistants, CSO technical persons, and service providers.

Systems development entailed installation and facilitation of computerized data collection

systems like HMIS, DHIS2, patient records systems, web-based ordering systems, surveillance

“LQAs has been very useful and we have often

referred to the information in our planning and

budgeting”.

“… data collected helped the district team to

analyse and plan, for example HIV will be

streamlined in district work plan, we have to

recruit more workers to extend services”

“Results collected by LQAS help us in planning

because it is evidence based as compared to

HMIS development plans. This helps in resource

allocation”

(KII DHT)

“We have the referral books, and with follow-up

we get to know the clients in the area. There are

VHTs based at health facilities and community-

based VHTs. Every month we have parish meetings

organized by the parish VHT coordinator, and we

synchronize the data and write in the parish

register from which we make the report.”

(FGD, VHT, Busesa)

USAID/UGANDA’S DBTA MODEL AS APPLIED UNDER STAR PROJECTS IN EAST, EAST-CENTRAL, AND SOUTH-WEST UGANDA 23

systems, and data quality assessment

processes. Systems development also

involved initiation of regular performance

review forums, annual application of the

LQAS methodology, and a community

information system managed by VHTs and

Mother Mentors. Strengthening systems that

generate SI notably improved reporting rates

for the HIMS systems in all districts. On

average, timeliness and completeness

increased from 40% to 97% for all STAR-

supported districts between 2013 and 2014. In addition, improvements in capacity to use the

web-based supply ordering system translated into timely ordering of supplies, stock

redistribution within a district, and reductions in stock out rates. Furthermore, the capacity to

generate and utilize LQAS data is evident in all STAR districts. District-specific data for HIV

prevention and maternal child health (MCH) outcome indicators were available on an annual

basis in 2010, 2011, 2013, and 2014. KIIs with DHTs, service providers, and district leadership

confirmed the use of LQAS and HMIS data in planning, and all districts disseminated strategic

data widely through the public display of dashboards and other wall charts. Most districts

expressed appreciation for the utility of SI, as well as confidence in being able to conduct LQAS

without external technical support.

SI management capacity was also manifested in the existence and use of systematic district and

facility-level platforms for performance reviews, data dissemination, and learning. Although the

STAR project provided technical assistance in restructuring monthly and quarterly performance

review meetings, those meetings have been district led over the years. The meetings improve

intra- and inter-sectoral coordination by providing platforms for district health departments and

CSOs to share their immediate plans and routine information and present experiences from

their activities and processes. The platforms enhanced collaborative learning and adaptation of

change.

Strategic data was also used at the district level for annual performance assessments,

development of district implementation plans, and other health service delivery programs

beyond HIV/AIDS and TB care. One example is the use of LQAS data in Mitooma District,

where LQAS data showed weak performance in sanitation. In response, the district council

formulated a by-law to improve community response to water, sanitation, and hygiene (WASH)

interventions. DHTs and service providers appreciated and were proud of the developments

and the strengthening of systems for SI management.

Material support entailed reproduction and provision of record-keeping books and reporting

tools, computers, power generators, and solar power systems. Acknowledging the importance

of collecting service data after the initial support from SDS grants, districts continued to solicit

support for reproduction and distribution of data collection and reporting tools. In general, all

STAR-supported health facilities have adequate data collection and reporting tools. The rest of

the equipment, such as computers, power generators, and solar power systems, are located in

the fields of operation.

“…the monthly data review district meetings

ensure that all facilities complete their

summaries, including internal data quality

assessments, on time.”

(KII, STAR-SW)

“I have used LQAS information for accountability

during district council meetings.”

(DHO)

24 USAID/UGANDA’S DBTA MODEL AS APPLIED UNDER STAR PROJECTS IN EAST, EAST-CENTRAL, AND SOUTH-WEST UGANDA

Sustainability of Strategic Information Management Capacity

The evaluation team observed that investments in strengthening technical capacity for SI

management were made in the development of district-based human resources, and therefore,

they were found to be sustainable. However, sustainability of SI management capacity in district-

based human resources relies on the ability of districts to motivate and retain staff and refrain

from staff transfers that do not consider the existing capacity at individual health facilities.

Nonetheless, it will be necessary for districts to sustain SI capacity through sustained demand

for and utilization of SI. Current use of strategic data generated with support from the DBTA is

limited to health departments, DHTs, and health-facility teams, with minimal involvement of

other sectors, local government, and political leadership.

The financial implications for sustaining systems that generate SI are far beyond the financial

capacity of the districts. Although the first application of LQAS seems high, at 15–20 million

Ugandan shillings (UGX), there is evidence that subsequent applications are cheaper, at a

reduced cost of about 8 million UGX. Most districts showed willingness to include LQAS in

their annual budgets. Another potential limitation to sustaining the capacity for SI management is

minimal engagement of the private sector in the institutionalization of LQAS as a management

tool. The private sector has potential to be the future custodian of and a technical resource for

maintaining its use. The evaluation noted that the STAR project needed to do more in soliciting

SI on client satisfaction.

CONTRIBUTION TO IMPROVED HEALTH SERVICE DELIVERY

How has the support contributed to improved health service delivery in the

targeted districts?

While the evaluation does not fully attribute progress and achievements in the target districts to

the DBTAs, the DBTA/STAR programs are major contributors in terms of both inputs and

outputs, with consequent outcomes in health service delivery. The DBTAs’ contributions to

service delivery included expansion of ART services to lower-level health facilities, support for

the roll-out of new policy guidelines, strengthened logistics and supplies management, and

strengthened SI management.

Expansion of ART Services Delivery to Lower-level Facilities:

By expanding ART services to lower-level health

facilities, the DBTAs increased access to services.

The STAR programs supported the accreditation

of a number of health facilities in the districts to

enable increased access to and utilization of

comprehensive HIV/AIDS and TB services. By 2014,

the number of facilities accredited to provide

HIV/AIDS and TB services increased by more than

three times. As illustrated in Figure 1, the number

of outlets providing ART services increased almost

four fold over the life of the three DBTAs,

increasing from 88 in 2011 to 330 outlets in 2014.

This was mainly achieved through the efforts of

accreditation support by the DBTAs.

88

127

222

330

FY2011 FY2012 FY2013 FY2014

Num

ber

of O

utlets

Reporting Period

Figure 1: Change in Number of Sites

Providing both Adult and Pediatric ART STAR Annual Reports

USAID/UGANDA’S DBTA MODEL AS APPLIED UNDER STAR PROJECTS IN EAST, EAST-CENTRAL, AND SOUTH-WEST UGANDA 25

Increase in access to services was demonstrated by

findings from client exit interviews; 84% of clients

reported that they found it easy to access and

utilize HIV/AIDS and TB services.

Expansion of infrastructure for HIV/AIDS and TB services at selected health

facilities: The key infrastructure improvements at health centers included: expansion and

redesign of the service delivery space to accommodate large numbers of clients;

refurbishments of clinical care and laboratory areas; improvements in clinic furniture; and

improvements in facilities for the systematic storage of the large amounts of client records

inherent in the high-volume chronic care clinics and for the storage of HIV/AIDS and TB

supplies, such as medicines and surgical kits for male circumcision, through provision of

shelves, store pallets, file folders, etc.

Support to districts to enable them to quickly adapt revised national clinical

guidelines: To achieve rapid adaptation of revisions in national clinical guidelines, the DBTA

established regional and district training teams that supported dissemination of national policies

and clinical guidelines for SMC, Option B+, ART, and TB care.

Strengthened HIV/AIDS and TB laboratory services: The DBTA supported construction

and renovation of laboratories, provided equipment, including microscopes and CD4 machines,

trained laboratory staff, and improved sample transportation through the national laboratory

hubs strategy. This increased access to appropriate TB and HIV/AIDS diagnostic tests and

reduced rejected samples to less than 2% of the total samples, as reported by STAR-SW. The

DBTAs also supported revitalization of TB diagnostic services at health facilities and outreach

based at the sub-county level.

Strengthened logistics and supplies management: Although strengthening supply chain

management was listed as an element to be addressed under the DBTA model for the three

STAR programs, this was not specified in the program results framework. The interventions

were, therefore, ad hoc in nature, and it was understood that another mechanism, the Securing

Ugandan’s Right to Essential Medicines (SURE) project, would work on supplies. DBTAs worked

closely with the SURE program to fix some of the ad hoc challenges in medicine supplies.

Relevant SURE activities included mentoring staff and direct support to the districts and health

facilities to ensure that orders were submitted to NMSs in a timely manner and followed up on

to ensure that supplies were received, properly stored, and accounted for. As a result, there

were reductions in stock outs of essential commodities at health facilities, as well as reductions

in stock accumulation, wastage, and expiration of health commodities within the districts.

The DBTA/STAR program used various approaches to strengthen logistics and the supply

system. STAR-E was particularly successful with facility-based training in each district, tagging

medicine management supervisors (MMSs), and establishing innovative distribution of condoms

through its behavior change communication (BCC) function. STAR-EC successfully provided

operational support to the districts, including facilitating the ordering process by providing

facilitation fees to the district officials. Overall, STAR-EC experienced general improvement in

the management of medicines by providing MMSs with facilitation fees to implement in sparsely

populated areas. STAR-SW was particularly successful in capacity building through mentorship,

on-site training in logistics management, coaching with a focus on newly accredited sites, and use

“The STAR projects have revolutionized

care for HIV/AIDS in the country.”

(MoH central-level official)

26 USAID/UGANDA’S DBTA MODEL AS APPLIED UNDER STAR PROJECTS IN EAST, EAST-CENTRAL, AND SOUTH-WEST UGANDA

of VHTs and peer support groups to improve distribution of underutilized commodities like

female condoms.

Strengthened the quality improvement processes in health facilities: The DBTAs

expanded and mentored QI teams at the district and health-facility level to continuously

improve the administrative and technical competence of the district health system. They built

the district and health-facility staff capacity to generate and utilize data for performance.

Currently the data is used in continuous monthly introspection for quality defects, monitoring

improvement in projects, and learning at the facility level. In addition, the districts and the

facilities are utilizing the data during performance reviews to make improvements in

implementation.

Strengthened linkages and referral systems with the community: The efforts of the

DBTAs involved mobilizing and supporting community structures such as VHTs, FSGs, mentor

mothers, and peer educators to increase HIV/AIDS and TB service demand, initiate active

referrals, and perform client follow-up in the community. Additionally, the program supported

outreach, including SMC camps, moonlight clinics, and the “4-6 tent model” to reach pockets of

key at-risk populations as well as adolescents and men who could not easily access facility-based

services for diagnostic and care services. Importantly, all community mobilization interventions

were achieved through direct support to CSOs to carry out such activities.

What are the service delivery outcomes attributed to the DBTA/STAR programs?

It is difficult to determine the cause-effect relationship between the DBTA interventions, which

were largely facility based and to, a small extent, demanded creation at the community level, and

service delivery outcomes. As a proxy, it can be argued that the integration of HIV/AIDS

services with other services at the health facilities was one way of improving HIV/AIDS service

outcomes.

Significant Improvement in HTC Uptake:

As a result of the DBTA project interventions,

there was increased uptake of HTC services.

The MEEPP APR showed that there was an

increase in the number of people counseled,

tested, and given their results; this number

increased from 937,882 in 2011 to 1,486,633 in

2013. Similarly, findings from the LQAS showed

that there was an increase in the percentage of

people counseled and tested who received their

HIV test results in the last twelve months; this

figure rose from 25% in 2010 to 47% in 2014

(Figure 2).

The increased uptake of HTC services is

as a result of the improved quality of

service delivery as reported in the client exit

surveys, wherein 83% of the clients felt they

25.2 33.5

42.3 44.5 47.1

0

10

20

30

40

50

60

70

80

90

100

FY2010 FY2011 FY2012 FY2013 FY2014

Figure 2: Percentage of Patients Who Were

Counseled and Received an HIV Test in Last 12

Months and Know Their Results

USAID/UGANDA’S DBTA MODEL AS APPLIED UNDER STAR PROJECTS IN EAST, EAST-CENTRAL, AND SOUTH-WEST UGANDA 27

were appropriately counseled, while three-quarters of the respondents mentioned that the

health workers discussed with them specific actions to be taken in light of their HIV test

results.

Furthermore, couple testing has improved, as shown in the DBTA LQAS results. There was an

increase in the proportion of mothers of children eleven months old and younger who were

tested for HIV and received their results with their partners, rising from 76% in 2011 to 94% in

2014 across all supported districts.

Increased enrollment in ART services: As a result of the DBTA interventions in the

districts, there was improvement in the numbers of clients enrolled for pre-ART and ART

services. As noted in MEEPP APR data, the number of new patients enrolled in HIV/AIDS care

annually doubled from 23,600 in 2011 to 40,100 in 2014. As illustrated in Figure 1, the number

of outlets providing ART services increased almost four fold over the life of the three DBTAs,

increasing from 88 in 2011 to 330 outlets in 2014. This was mainly achieved through the efforts

of accreditation support by the DBTAs. The number of new patients started on ART almost

tripled from 10,821 in 2009 to 30,920 in 2014. A number of factors contributed to this result,

including the roll-out of national policies such as the Option B+ in eMTCT, test–and-treat for

special groups, as well as the revision of ART eligibility threshold during the STAR program’s

implementation period.

No improvement in ART retention: MEEP APR (2011–2014) showed that the percentage

of adults and children with HIV known to still be on treatment twelve months after initiation of

ART in the DBTA districts remained stagnant; the median figure of 90.8% in 2011 only

decreased to 87.8% in 2014 across the STAR-supported districts. However, the majority of

client exit survey respondents reported that services improved over time. On average, 50% of

the respondents said there was some improvement, while 25% said there was significant

improvement.

Increased utilization and uptake of PMTCT services: There was an increase in uptake of

couple counseling and testing for HIV during pregnancy. MEEP APR data showed an increase in

the number of male partners who were tested and received HIV test results in the PMTCT

clinic; the numbers more than doubled over the four years from 19,850 in 2011 to over 52,877

(6% to 15%) in 2014. Despite the increased number of male spouses who were tested, male

attendance for couple testing still remains low.

The number of HIV-exposed babies born to HIV-positive mothers who were given ARVs

doubled from 3,128 in 2010 to 6,082 in 2014, and 91% of these HIV-positive mothers were

given ARVs for PMTCT. Furthermore, all HIV-exposed infants were given co-trimoxazole

prophylaxis within two months, pointing to increased utilization and uptake of PMTCT services.

Reduced drop-out of clients on ART: Retention in care and adherence to ART are critical

elements of HIV/AIDS care interventions and are closely associated with optimal individual and

public health outcomes and cost effectiveness. The percentage of adults and children with

HIV/AIDS known to still be on treatment twelve months after initiation of ART decreased from

95% in 2011 to 87% in 2014 across the STAR-supported districts (MEEPP APR 2011–2014).

Increased access to ART for TB patients: There was an increase in ART initiation during

TB treatment and improved HIV case detection among TB patients. Data showed an increase in

the percentage of registered HIV-positive TB cases who initiated ART across the STARs, with

28 USAID/UGANDA’S DBTA MODEL AS APPLIED UNDER STAR PROJECTS IN EAST, EAST-CENTRAL, AND SOUTH-WEST UGANDA

the district median rising from 12% in 2011 to 77% in 2014. However, this still falls short of the

national target of 100%. In most districts, the increase was seen between 2012 and 2013.

Finding and diagnosing patients with TB and HIV/AIDS is a prerequisite for timely TB treatment

and ART initiation, and it improves health outcomes among HIV-infected TB patients. Data

shows that the median percentage of registered new and relapsed TB cases with documented

HIV status in STAR-supported districts rose from 7.5% to 90% between 2011 and 2014. Despite

these improvements in clinical care, the DBTAs have had minimal impact on level of community

awareness regarding TB. Awareness across the districts that TB is a curable disease only rose

from 60% to 77%, and knowledge of at least two signs and symptoms of TB only increased from

61% to 63% over the four years.

Change in risky sexual behavior and sexual debut before the age of fifteen remained at 9%.

LQAS findings showed no major change in the percentage of individuals who had sex with more

than one sexual partner in the last twelve months; the figures increased slightly from 14% in

2011 to 15% in 2014. The proportion of individuals who had sex with a non-marital or non-

cohabiting sexual partner in the last twelve months remained at 18% over the same period.

Condom use during sex with a non-marital or non-cohabiting sexual partner in the last twelve

months declined from 67% to 56%, and only 3% of youth knew at least three correct steps for

proper condom use.

Increased client confidence in the services: As a result of the DBTA project interventions,

there was an improvement in the quality of HIV/AIDS and TB services and increased client

satisfaction.

The client exit survey revealed that 75% of respondents reported an improvement in the quality

of HIV/AIDS and TB services provided at the health facilities, citing a conducive environment as

one of the causes. Almost all clients were satisfied with the way the services were provided to

them: 98% felt that they were attended to in a friendly and respectful way; 95% said that they

had sufficient privacy; and 96% reported that the services they received were safe. Highlighted

improvements included better time management by the health workers, friendlier staff, and the

availability of shelters and chairs for clients waiting to receive services. Clients also cited the

formation and establishment of family support groups for eMTCT as a pillar that supports

eMTCT.

Increased TB community awareness also improved, with 77% of people 77% aware that TB is a

curable disease in 2014 compared with 54% in 2011 LQAS year. As illustrated in Figure 3 below,

over the same period (2011–2014), the percentage of individuals who knew at least two signs

and symptoms of TB increased from 54% to 62%, and those who knew the risk of not

completing TB treatment increased from 88% to 91% (LQAS, 2011–2014).

USAID/UGANDA’S DBTA MODEL AS APPLIED UNDER STAR PROJECTS IN EAST, EAST-CENTRAL, AND SOUTH-WEST UGANDA 29

Figure 3: Increased Knowledge about TB

100

90

80

70

60

50

40

30

20

10

0

Aware that TB is Curable

Know at least 2 signs and symptoms completing TB

of TB

Know the risk of not

Treatment

2011

2014

Increased knowledge about sexually transmitted infections (STIs): LQAS (2011–2014)

data showed that the percentage of individuals who correctly identified at least two common

signs or symptoms of STIs remained low, at 45% among men, and changed from 54% to 61%

among women over the four years. The percentage of individuals who knew three or more

actions to take when infected with an STI slightly changed from 36% to 42%.

Findings show anecdotal improvements in uptake of HIV testing and identification of HIV-

positive individuals through integrating HTC in outpatient, maternity, and outreach services.

Integration appears to have improved linkage to HIV/AIDS care, but serious weaknesses in

retention on ART remain. There were no data to assess retention in pre-ART care or

adherence to ART.

What was the effect of integration of HIV/TB, HIV/Family Planning, HIV/AIDS and health on overall health outcomes?

The effect of integration was assessed based on outcomes related to non-HIV/AIDS-related

services within the general population and, where data were available, among PLHIVs. HIV

services were integrated with other health services within the primary healthcare context, such

as maternal health, child health, family planning, and TB care. In some cases, like TB care and

maternal health, clear improvements were observed in service outcomes related to non-

HIV/AIDS-related services. There were also notable gaps, such as weak service integration with

adolescent health. The evaluation team looked at the changes that occurred shortly after

integration in 2010 and after three years of implementation in 2014 but did does not compare

before and after service integration.

Effect of integration on HIV/AIDS and TB service outcomes: The integration of

HIV/AIDS and TB care increased HIV testing and ART initiation among TB patients. This was

confirmed by the MEEPP APR 2009–2014 service data, which showed that the number of

registered new and relapsed TB cases with documented HIV status increased, with the district

median of 8% to 90%. The number of TB patients started on treatment also increased from 14%

to 79% over the four-year period.

30 USAID/UGANDA’S DBTA MODEL AS APPLIED UNDER STAR PROJECTS IN EAST, EAST-CENTRAL, AND SOUTH-WEST UGANDA

Increased uptake of ART for TB patients: Patients in TB treatment were also tested for

HIV. Findings of the MEEP APR 2011–2014 data showed an increase in the percentage of

registered TB cases who were HIV-positive and accessed ART services across the DBTA/STAR

project areas, with the district median rising from 12% in 2011 to 77% in 2014. However, this

still falls short of the national target of 100%. In most districts, the increase was between 2012

and 2013.

Detecting and diagnosing patients with TB and HIV/AIDS is a prerequisite for timely TB

treatment and ART initiation, as this improves health outcomes among HIV-infected TB patients.

MEEP APR 2011–2014 data showed that the median percentage of registered new and relapsed

TB cases with documented HIV status rose from 7.5% to 90%.

Effect on maternal health outcomes: Implementing PMTCT in antenatal care (ANC) may

have influenced the uptake of ANC services and births in health facilities from 2011 to 2014

across the DBTAs. The proportion of mothers receiving ANC at least four times rose from 43%

to 53% over this period. This did not vary much (54% in 2014) when compared with the total

LQAS USAID districts. There were also improvements in the number of births registered in the

health facilities, with the proportion of mothers who delivered in health facilities increasing from

60% to 74% over the four years. This did not vary much (75% in 2014) when compared with the

total LQAS USAID districts.

Effect of integration on HIV/family planning outcomes: Family planning uptake, though

still low, showed improvement. The percentage of sexually active women age fifteen to forty-

nine years who used a modern method of family planning increased from 31% to 37%. This

shows better performance when compared with the total USAID LQAS districts, which reduced

from 37% to 35% over the same period.

Effect on child health outcomes: Integrated outreach services covered: ANC, immunization,

EID, HTC, and eMTCT. LQAS 2011–2014 data showed general improvements in child health

outcomes. The percentage of children aged twelve to twenty-three months who were fully

vaccinated increased from 58% to 74%; this was a greater improvement compared with the total

LQAS USAID districts at 56% to 67%, respectively.

Effect on other health services outcomes: In addition to delivering HIV/AIDS services at

health centers, the DBTAs also conducted integrated outreach services using a “4-6 tent

model,” whereby HIV/AIDS services where provided alongside other medical services. This

approach registered many patients coming in for non-HIV/AIDS-related services, but data were

not readily available for this assessment. However, there seemed to be little impact on practices

like household sanitation, hygiene, and household nutrition. The percentage of individuals who

wash their hands with soap after visiting the toilet remained at 60% over the four-year period.

COST EFFICIENCY

To what extent can the DBTA design be considered cost efficient in

strengthening capacity of districts and CSOs to improve health service

delivery?

Within the context of this evaluation, cost-efficiency refers to a rough assessment of value-for-

money (VFM) that considers an analysis of both the level of investment and what the project has

achieved given the level of spending. This assessment is not a comprehensive economic

USAID/UGANDA’S DBTA MODEL AS APPLIED UNDER STAR PROJECTS IN EAST, EAST-CENTRAL, AND SOUTH-WEST UGANDA 31

evaluation (cost-effectiveness) or thorough assessment of efficiency of the project. It was agreed

that the amount time and resources available for the cost-efficiency assessment were not

adequate to permit a detailed efficiency assessment.

VFM is a term used to assess whether or not an organization has obtained the maximum benefit

from the goods and services it both acquires and provides, with the resources available to it.

Some elements may be subjective, difficult to measure, intangible, and misunderstood. Judgment

is therefore required when considering whether VFM has been satisfactorily achieved or not. It

not only measures the cost of goods and services, but also takes account of the mix of quality,

cost, resource use, fitness for purpose, timeliness, and convenience to judge whether or not,

together, they constitute good value. Achieving VFM is often described in terms of the “three

Es”: economy, efficiency, and effectiveness. The definitions of the three are as follows:

Economy: Careful use of resources to save expense, time, or effort

Efficiency: Delivering the same level of service for less cost, time, or effort

Effectiveness: Delivering a better service or getting a better return for the same amount

of expense, time, or effort

This section provides a rough assessment of VFM for each of the STARs projects. Within the

resource constraints for doing this evaluation, this assessment was able to assess economy, and

to some extent efficiency, but was not able to measure the effectiveness of the projects given the

level of effort required do this and the resources available (time and money) to undertake the

assessment.

Overall Project Spending

Table 4 provides details of annual spending by each project. Since inception of the projects up

until end of FY14, the three projects have spent a total of about $103 million.

Table 4. Annual Expenditure by Project

US $ FY09 FY10 FY11 FY12 FY13 FY14 TOTAL

STAR-E 7,268,918 6,578,800 7,291,409 6,737,277 8,211,381 36,087,785

STAR-SW 6,052,665 6,695,637 8,838,639 8,047,211 29,634,152

STAR-EC 1,289,882 4,960,701 8,135,570 6,424,473 8,310,362 8,647,004 37,767,992

Total 103,489,929

Spending by Program Area, FY13 and FY14

This assessment transitioned into on a detailed review and analysis of the PEPFAR expenditure

reports for FY13 and FY14. However, the assessment made an attempt at reviewing the

programs’ expenditures for the whole period of 2010–2014. Unfortunately, expenditure

information for FY10, FY11, and FY12 are not detailed enough to permit a proper trends and

overall analysis of project spending. Based on the PEPFAR expenditure analysis data for FY13

and FY14, a review of the spending allocations by program area was considered (see Tables 5

and 6).

32 USAID/UGANDA’S DBTA MODEL AS APPLIED UNDER STAR PROJECTS IN EAST, EAST-CENTRAL, AND SOUTH-WEST UGANDA

Table 5. Spending for FY13, Broken Down by Program Area

STAR-SW STAR-E STAR-EC TOTAL % of

total

Facility-Based Care, Treatment, and

Support 1,405,049 801,785 1,410,921 3,617,756 15.1%

Community-Based Care,

Treatment, and Support 1,229,417 451,661 - 1,681,078 7.0%

PMTCT 1,781,684 1,323,133 1,316,958 4,421,775 18.5%

Voluntary Medical Male

Circumcision 1,317,233 1,540,659 3,311,005 6,168,897 25.8%

HIV Testing and Counselling 263,447 511,485 973,464 1,748,396 7.3%

Post-exposure Prophylaxis - - 50,370 50,370 0.2%

Blood Safety - - - -

Laboratory 1,524,577 263,253 433,100 2,220,930 9.3%

Infection Control 263,447 267,587 - 531,033 2.2%

Orphans and Vulnerable Children - - - -

SORP-General Population 263,447 - 489,572 753,019 3.2%

Key Populations-PWID - - - -

Key Populations-FSW 174,646 40,122 39,510 254,278 1.1%

Key Populations-MSMTG - - - -

Other Vulnerable Populations-

Prevention 615,693 135,522 152,782 903,996 3.8%

Medically-Assisted Therapy

SI 8,994 8,994 0.04%

Surveillance

HSS 1,402,071 123,684 1,525,754 6.4%

TOTAL 8,838,639 6,737,277 8,310,362 23,886,278

USAID/UGANDA’S DBTA MODEL AS APPLIED UNDER STAR PROJECTS IN EAST, EAST-CENTRAL, AND SOUTH-WEST UGANDA 33

Table 6. Spending for FY14 and 2 Years Combined, Broken Down by Program Area

FY 14 STAR-SW STAR-E STAR-EC TOTAL

2 Years

Combined

Facility-Based Care,

Treatment, and

Support

2,066,045 1,357,224 1,030,543 4,453,812 17.9% 8,071,568 16.5%

Community-Based

Care, Treatment,

and Support

531,622 1,046,559 711,362 2,289,542 9.2% 3,970,621 8.1%

PMTCT 2,390,329 699,714 908,799 3,998,842 16.1% 8,420,617 17.3%

Voluntary Medical

Male Circumcision 786,266 1,046,921 3,129,702 4,962,889 19.9% 11,131,786 22.8%

HIV Testing and

Counselling 461,982 261,811 1,123,597 1,847,389 7.4% 3,595,786 7.4%

Post-exposure

Prophylaxis 9,451 - - 9,451 0.0% 59,821 0.1%

Blood Safety - - - -

-

Laboratory 650,148 378,456 441,547 1,470,150 5.9% 3,691,080 7.6%

Infection Control 80,665 104,906 - 185,571 0.7% 716,605 1.5%

Orphans and

Vulnerable Children - 158,134 390,617 548,751 2.2% 548,751 1.1%

General Population

–Prevention 232,569 105,691 400,938 739,198 3.0% 1,492,217 3.1%

Key Populations-

PWID - - - -

-

Key Populations-

FSW 299,045 89,048 44,372 432,465 1.7% 686,744 1.4%

Key Populations-

MSMTG 160,934 - - 160,934 0.6% 160,934 0.3%

Other Vulnerable

Populations-

Prevention

378,155 845 232,443 611,444 2.5% 1,515,440 3.1%

Medically-Assisted

Therapy - - - -

- 0.00%

SI

1,303,023 119,104 1,422,127 5.7% 1,431,121 2.9%

Surveillance

216,614 113,979 330,594 1.3% 330,594 0.7%

HSS

1,442,434

1,442,434 5.8% 2,968,189 6.1%

TOTAL 8,047,211 8,211,381 8,647,004 24,905,596

48,791,874 100.0

%

Results in Tables 5 and 6 provide insight into how each of the projects allocated its resources

across the different program areas. Key findings from these results are:

1. Each of the three projects allocated its resources differently, and as such there were

differences in priorities for each project. The only priorities consistent across all three

projects were PMTCT and VMMC. However, for PMTCT, there was a change in priorities

in FY14, and PMTCT received a relatively lower proportion of the funds allocated by STAR-E and STAR-EC.

34 USAID/UGANDA’S DBTA MODEL AS APPLIED UNDER STAR PROJECTS IN EAST, EAST-CENTRAL, AND SOUTH-WEST UGANDA

2. Care and treatment took up nearly 25% of total funds for the two-year period. This is in line

with the government of Uganda’s priorities, as noted in the Ugandan National HIV

Prevention Strategy.

3. The key priorities for all three projects were: care and treatment, VMMC, PMTCT, HTC,

and laboratory. These priorities took up about 80% of total resources for the two years.

The remaining program areas (infection control, blood safety, prevention for general

population and key populations, and orphans and vulnerable children (OVCs)) took up the

remaining 20%. These priorities are aligned to what the USAID Mission Uganda provided as guidance for how money should be spent over the project life.

Spending by Level

Table 7 provides details on the levels where funds were spent. Results show that spending at the

district level (to support direct provision of HIV/AIDS services) took less than half (57.8%) of

the total resources for all three projects over the two-year period. It can be argued that

spending on SI and health systems strengthening (HSS) was at the program level. A more

detailed assessment is required to provide further information on whether spending on SI and

HSS were directed at improving systems at the district and health-facility levels.

Table 7. Breakdown of Expenditure for FY13 and FY14 (Combined) by Level of Spending

Level of Spending STAR-SW STAR-E STAR-EC TOTAL

Investment (Site Level) 1,808,814 2,069,053 1,551,930 5,429,797 11.1%

Recurrent (Site Level) 7,882,074 1,949,836 8,082,929 17,914,839 36.7%

Program Management 3,051,380 6,828,682 5,617,492 15,497,554 31.8%

Strategic Information 1,669,332 2,658,282 1,273,913 5,601,527 11.5%

Health Systems

Strengthening 2,474,250 1,442,804 431,102 4,348,156 8.9%

48,791,874

Results in 7 show that nearly 32% of total project funds (for all three projects combined and

over the two-year period) was spent on program management. While the critical role of

program management cannot be understated in ensuring the achievement of project objectives

and proper use of funds, the current structure of project management is inefficient and is the

main cause of high management costs. For instance, there are up to three tiers of management

for these projects (international, national, and lower-level implementers and partners). At each

of these levels, both personnel and other management-related overheads are incurred. This

approach to management is inefficient and results in further inefficiencies. For example, for

STAR-SW, in FY13, a total of $1.41 million (17.6% of total annual spending) was spent on

program management. Of this $1.41 million, about $1.22 million (86.4%) was spent on “above

national” level program management, implying that this is not spent in-country.

These findings point toward some degree of allocative inefficiency; a more efficient allocations of

project resources would spend funds in-country on actual project targets. Ultimately, a large

percentage of funds were spent on program management outside the country, with a relatively

high level of spending on the enabling environment, and high levels of spending outside the

country to administratively support the project. This approach to supporting improvements in

service delivery is both expensive and not sustainable in the long run.

USAID/UGANDA’S DBTA MODEL AS APPLIED UNDER STAR PROJECTS IN EAST, EAST-CENTRAL, AND SOUTH-WEST UGANDA 35

Cost drivers

A further look into expenditures on specific line items reveals the main cost drivers. This

assessment provides better insight about the efficiency of resource allocation and use. Table 8

shows that expenditure on personnel took up 38% of total resources for all three projects over

the two-year period (FY13 and F14). This is personnel expenditure at site, national, and above-

national levels. A more detailed assessment of the breakdown of personnel expenditure at the

different levels is recommended in order to provide further insights about allocative efficiency.

From an economy point of view, it is highly probable that this level of spending on personnel is

inefficient.

As noted earlier, program management took up near 32% of total resources for the three

projects over the two-year period. Program management is the second highest cost driver for

these projects. This level of spending on program management is inefficient and cannot be

sustained if to the programs must achieve more outcomes with fewer resources.

Table 8. Cost Drivers of Expenditures FY13 and FY14 (Combined) in All Three Projects

These expenditure categories are standard as required and reported in the PEPFAR expenditure analysis.

See also http://www.pepfar.gov/documents/organization/195700.pdf. An effort has been made to explain

some of the categories below.

In the paragraph below the previous Table 7, the explanation does not suggest that 32% includes

personnel. The explanation attempts to explain the inefficiencies of having a three-tier system of program

management and how each tier would require its own resources.

The third cost driver is “other general expenses,” which mainly support the administrative

functions of the projects at site and national levels. These expenses include, but are not limited

to: office utilities and rent; staff meetings; telephone systems; staff recruiting; bank charges; office

equipment; computer equipment for staff and facilities; vehicle purchases; printing and

stationery; contractual services, including legal, accounting, and consultation; trainers; costs

associated with GHC fellows; data entrants and clerks; translation of program information,

education, and communication (IEC) materials into local languages; temporary staff; and

materials related to the casual labor loading program. Table 8 shows that these expenses took

up 23% of total project funds, which is considered relatively high. Potentially, cutting back

spending on these items could lead to efficiency gains.

US $ FY13 FY14 TOTAL % of total

for 2 years

Personnel (at all levels) 9,546,174 9,111,340 18,657,514 38.2%

Program Management 6,606,900 8,890,654 15,497,554 31.8%

Other General/Administrative 4,571,265 6,752,808 11,324,073 23.2%

National Level 3,940,874 4,545,220 8,486,094 17.4%

Travel and Transport 3,511,234 3,719,979 7,231,214 14.8%

Above National 2,056,802 3,619,391 5,676,194 11.6%

Training (Site Level) 3,021,047 1,868,978 4,890,025 10.0%

Other Supplies (Site Level) 2,243,895 2,499,509 4,743,404 9.7%

Consultants 158,229 329,434 487,663 1.0%

36 USAID/UGANDA’S DBTA MODEL AS APPLIED UNDER STAR PROJECTS IN EAST, EAST-CENTRAL, AND SOUTH-WEST UGANDA

The three projects spent 11.6% of their total resources on “above national” expenses. These

include personnel and other overhead costs supported by the projects. Expenditure of $5.6

million at this level is considered inefficient, despite the critical and important role the

international support plays in the projects.

Comments on Value-for-money

The following issues should be noted in relation to the findings on VFM for the three projects:

Economy

As noted earlier, program management costs (and above-national costs) took up a

significantly large proportion of the total project budget. This is partly due to the three-

tiered management structure, with negotiated salaries and overheads for each level (above-

national, national level, and sub-grantee level). This management structure is inefficient.

Through KIIs, it was noted that USAID supports local governments through a grant that is

managed by the SDS project. This support was implemented in parallel with the STARs

project, but it targeted the same districts. While the SDS support is directed toward

improving the capacity of local governments to implement their mandates, the SDS support

and STARs support were not well synchronized, and this resulted in inefficiencies. Most

specifically, implementation of some of the activities by STARs project was delayed due to

poor coordination and synchronization of activities with SDS.

Efficiency

Allocative efficiency: Results in Table 8 show a relatively high allocation of funds to

program management, SI, and HSS, compared with the proportion of funds allocated to

supporting actual provision of HIV/AIDS services (prevention, care, and treatment). While

the importance of an enabling environment is clear, an allocation of close to 52.2% does not

reflect allocative efficiency, considering the needs and gaps in service provision.

Technical efficiency: Although an attempt was made to calculate unit expenditure and

benchmark it against the unit costs of implementing similar services for each of the projects,

we note that we are not “comparing apples with apples” and that the findings on this should

not form the basis for judgments about the technical efficiency of the DBTA model.

The approach being used for mentoring, training, and supervision attracts costs, particularly

related to (a) personnel, (b) training, and (c) travel and transport. A further inquiry into the

approaches used by the projects for these is recommended as there are potential efficiency

gains in changing the way mentoring, training, and supervision are done.

USAID/UGANDA’S DBTA MODEL AS APPLIED UNDER STAR PROJECTS IN EAST, EAST-CENTRAL, AND SOUTH-WEST UGANDA 37

V. CONCLUSIONS

The evaluation team examined and reported its findings with reference to the SOW’s seven

evaluative questions. On the basis of our examination, with input from multiple informants and

available documentation, we conclude the following:

IMPROVED CAPACITY AND SUSTAINABILITY

1. Approaches implemented under the DBTA/STAR programs: The three

DBTA/STAR programs have achieved the program objectives and intermediate results to a

large extent, especially with respect to increasing availability and accessibility of HIV/AIDS

and TB services. There were no major differences across the regions in terms of

implementation approaches and results. The evaluation team found that the majority of

DBTA approaches used were successful and appropriate for improving accessibility, quality,

and availability of integrated health service delivery, as well as health financing and

management. The most successful approaches were mentorship and training, HIV/AIDS and

TB care integration, and the establishment of community linkages. The success of these

approaches was attributed to a conducive HIV/AIDS care environment and the technical

competence of the STAR teams. However, resources for priority technical assistance

interventions were constrained by specific barriers within the context of operation, which

included health systems constraints outside the scope of the project, inadequate human resources, and poor infrastructure.

2. Effect of transition from the STAR programs to district grants through SDS: The

discordance between the STAR programs’ emphasis on defined facility-based service-

delivery results, together with the SDS program’s emphasis on the provision of grants

focused on strengthening decentralized systems, resulted in limited synergy between the

two elements of the DBTA program. Furthermore, there was poor coordination between

SDS and STAR in the East and East-Central regions, as well as unclear expectations for

beneficiaries and local government regarding the role of SDS versus STAR.

3. Sustainability: While technical initiatives introduced under the STAR programs were

sustainable, the STAR programs’ limited emphasis on health systems strengthening, on the

development of programmatic linkages between districts and health facilities, and on ways to

address financial resources required to maintain the program’s monetary investments undermined prospects for long-term sustainability.

CONTRIBUTION TO IMPROVED HEALTH SERVICE DELIVERY

1. Use of strategic information: Under the DBTA/STAR programs, capacity to collect and

use information for health systems management purposes specific to HIV/AIDS and TB

services was significantly enhanced. The STAR project strengthened the capacity of all

participating districts to apply the LQAS methodology in annual community surveys. LQAS

allowed generation of district-specific data for strategic planning and improvement of

programs. KIIs with DHTs, service providers, and district leadership confirmed the use of LQAS and HMIS data in planning and data dissemination.

2. DBTA contribution to improved health service delivery and related health

outcomes: The DBTA/STAR programs were major contributors to the improvement of

health service delivery, especially in HIV/AIDS and TB services. The program contributed to

the expansion of quality HIV/AIDS and TB service delivery to lower-level health facilities. As

a result of improvements in service delivery, the evaluation found significant improvements

38 USAID/UGANDA’S DBTA MODEL AS APPLIED UNDER STAR PROJECTS IN EAST, EAST-CENTRAL, AND SOUTH-WEST UGANDA

in HIV/AIDS and TB service-delivery outcomes, including increases in HTC uptake for

individuals and couples, PMTCT uptake, and pre-ART enrollment and ART initiation.

However, while ART initiation improved, ART retention remained stagnant despite efforts.

3. The effects of integration on health outcomes: Integration, as supported by the

DBTAs, had a clear impact on health outcomes specifically related to HIV/AIDS service

integration with TB and maternal health. The integration of HIV/AIDS and TB dramatically

increased HIV testing and ART initiation among TB patients. However, outcomes related to

HIV/AIDS integration with other health service areas did not show much improvement, andthere were integration gaps, such as with adolescent health and chronic care.

COST EFFICIENCY

1. Cost efficiency: While each of the STAR programs has been able to achieve substantial

progress over the life of the projects, inefficiencies in program management suggest thatmore could have been achieved with the level of investment.

The evaluation team has assessed that the three STAR programs were successful in terms of

meeting the requirements of their technical assistance contracts. However, an increased focus

on health systems strengthening, sustainability, integration of services, and cost efficiency could

have facilitated the programs’ reaching the full potential of a comprehensive District Based

Technical Assistance (DBTA) program.

USAID/UGANDA’S DBTA MODEL AS APPLIED UNDER STAR PROJECTS IN EAST, EAST-CENTRAL, AND SOUTH-WEST UGANDA 39

VI. RECOMMENDATIONS

The evaluation team recommends the following changes to improve the design of future DBTA

projects:

1. To strengthen DBTA capacity-building approaches, the design of future DBTA

projects should address the strengthening of multiple components of the health

system, since many factors affect technical assistance uptake. The evaluation team

especially recommends continued support for DBTA’s strengthening of facility-level

laboratories. The DBTA/STAR programs’ advancements in the quality of facility-based

laboratories, laboratory equipment, and laboratory technicians, as well as support for the

innovative development of laboratory hubs, merits continued inclusion under future DBTAs.

Such recognition under future DBTAs should be accompanied by an explicit program of

district and national-level advocacy that will lead to budgetary line-item support for

laboratory systems within the period of time covered by the next DBTA projects.

2. Clearly delineate roles, responsibilities, and programmatic parameters among

multiple programs working in the same district to improve coordination and

collaboration: The evaluation notes that there was a much stronger collaborative

relationship between SDS and STAR-SW compared with the other STAR programs.

Working in close collaboration, SDS and the DBTA ensured proper coordination of the

planning process, including sharing of approved work plans, budgeting with other USAID-

funded health projects, and HIV/AIDS initiatives with district political and technical teams.

Clearly delineating roles, responsibilities, and programmatic parameters will also improve

understanding among beneficiaries and local governments of what can be expected from the various programs being implemented in their communities.

3. Invest in developing the leadership capacity of existing health management

committees (HMCs) at the health-facility level: Such investment should center on

strengthening the role of the HMCs as a focal point for a proactive quality assurance linkage

between the health services and the communities they serve and would constitute a holistic approach to managing community engagement and improving health outcomes.

4. In collaboration with the DBTA’s participating districts, establish and maintain a

database to determine the extent of cost sharing among districts, with

reference to DBTA interventions to improve long-term sustainability: By

establishing such a database, DBTAs and USAID will foster an environment of understanding

between districts and their partner DBTAs that will strengthen the potential for a

knowledge-based program under which DBTAs, USAID, and local governments will be able

to identify ways in which districts can progressively and realistically assume fiduciary

responsibility for selected DBTA initiatives.

5. Continue to support maintenance and utilization of the LQAS methodology for

data collection, strategic planning, and improvement of programs: The current

DBTAs have established the value of LQAS for district management and evaluation

purposes. Continued short-term investment should focus on refresher training of district

data collectors and on continued development of user-friendly mechanisms and processes

designed to enhance the effective use of LQAS for district-level monitoring and response to

performance indicators. At the same time, it is recommended that USAID work with the

MoLG to build upon the expressed interest of the government to progressively institutionalize support for the LQAS.

40 USAID/UGANDA’S DBTA MODEL AS APPLIED UNDER STAR PROJECTS IN EAST, EAST-CENTRAL, AND SOUTH-WEST UGANDA

6. Continue to support community quality improvement initiatives to strengthen

linkages between health facilities and the communities they serve and to

improve quality of care in service delivery: Current DBTA initiatives have made

significant progress in development of QI linkages between the health facilities and the

communities they serve. Continued development of these linkages should focus on

progressive institutionalization of the capacity of health services to effectively identify ways

to enhance client satisfaction and sustained utilization of HIV/AIDS and TB services.

Improvements in quality of care at the community and facility level have the potential to

positively impact ART retention and other benefits of HIV/AIDS and TB service

decentralization. Lastly, there is a need to strengthen measurements of the parameters of quality and the utilization of results in QI interventions.

7. Integration should be expanded to include other key health areas: There is need

to review whether strengthened facilities can take on other key health areas, including

chronic care, integration of out- and inpatient services, and facility management. This would

require integrated access to records, ability to provide daily ART regimens, and multiskilled

health workers. Furthermore, the design of the intended integration should be developed in

parallel with clear indicators to measure the effectiveness of integrating services.

8. Design DBTA programs that rigorously focus on the reduction to minimal

necessary levels of the percentage of administrative support costs required to

sustain DBTA technical assistance and DBTA operations to promote cost

efficiency and value for money: Such reductions should be applied at all three levels

(international, national, and sub-grantee) of DBTA program management. The focus of such

reductions should be on promoting cost efficiency and VFM with an explicitly forward-

looking and transparent orientation toward the districts’ capacity to progressively absorb

programmatic costs during the execution and at the completion of the DBTAs’ contracts.


Recommended