63
Evaluation LBSC 796/INFM 718R Session 5, October 7, 2007 Douglas W. Oard
| Date post: | 15-Dec-2015 |
| Category: |
Documents |
| Upload: | ryley-cristy |
| View: | 217 times |
| Download: | 2 times |

Evaluation
LBSC 796/INFM 718R
Session 5, October 7, 2007
Douglas W. Oard

Agenda
• Questions
• Evaluation fundamentals
• System-centered strategies
• User-centered strategies

IR as an Empirical Discipline
• Formulate a research question: the hypothesis
• Design an experiment to answer the question
• Perform the experiment– Compare with a baseline “control”
• Does the experiment answer the question?– Are the results significant? Or is it just luck?
• Report the results!

Evaluation Criteria
• Effectiveness– System-only, human+system
• Efficiency– Retrieval time, indexing time, index size
• Usability– Learnability, novice use, expert use

IR Effectiveness Evaluation
• User-centered strategy– Given several users, and at least 2 retrieval systems
– Have each user try the same task on both systems
– Measure which system works the “best”
• System-centered strategy– Given documents, queries, and relevance judgments
– Try several variations on the retrieval system
– Measure which ranks more good docs near the top

Good Measures of Effectiveness
• Capture some aspect of what the user wants
• Have predictive value for other situations– Different queries, different document collection
• Easily replicated by other researchers
• Easily compared– Optimally, expressed as a single number

Comparing Alternative Approaches
• Achieve a meaningful improvement– An application-specific judgment call
• Achieve reliable improvement in unseen cases– Can be verified using statistical tests

Evolution of Evaluation
• Evaluation by inspection of examples
• Evaluation by demonstration
• Evaluation by improvised demonstration
• Evaluation on data using a figure of merit
• Evaluation on test data
• Evaluation on common test data
• Evaluation on common, unseen test data

Which is the Best Rank Order?
= relevant document
A.
B.
C.
D.
E.
F.

Which is the Best Rank Order?
R
R
R
R
R
R
R
R
R
R
RRRRRR
RR
R
R
R
RRR
R
R
R
R
R
RRRRR
R
RRRR
R
R
a b c d e f g h

IR Test Collection Design
• Representative document collection– Size, sources, genre, topics, …
• “Random” sample of representative queries– Built somehow from “formalized” topic statements
• Known binary relevance– For each topic-document pair (topic, not query!)– Assessed by humans, used only for evaluation
• Measure of effectiveness– Used to compare alternate systems
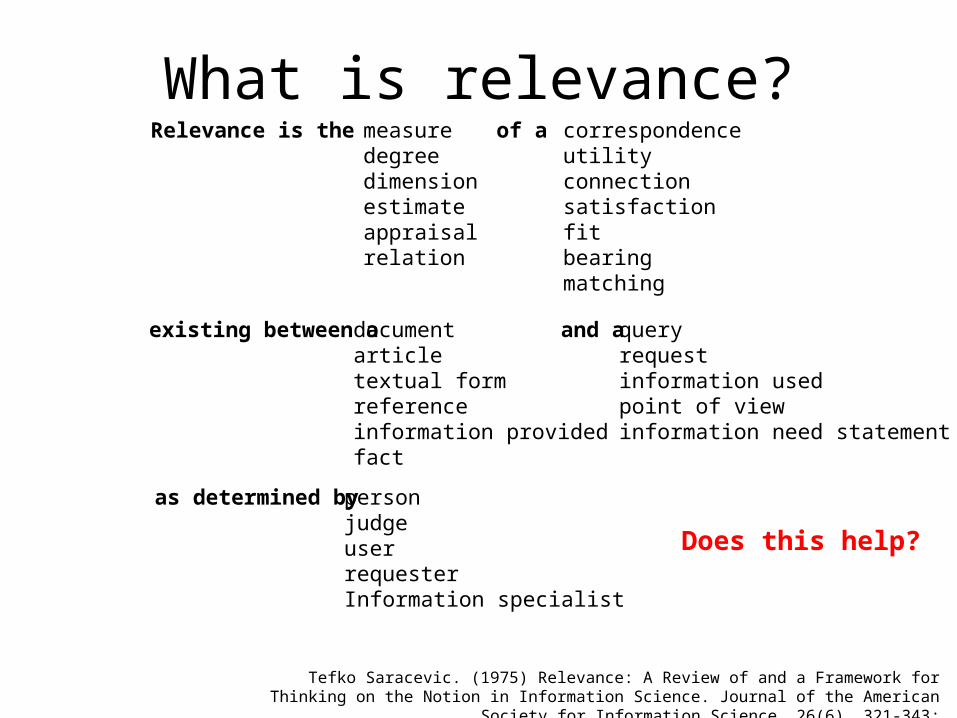
What is relevance?measuredegreedimensionestimateappraisalrelation
correspondenceutilityconnectionsatisfactionfitbearingmatching
documentarticletextual formreferenceinformation providedfact
queryrequestinformation usedpoint of viewinformation need statement
personjudgeuserrequesterInformation specialist
Tefko Saracevic. (1975) Relevance: A Review of and a Framework for Thinking on the Notion in Information Science. Journal of the American Society for Information Science, 26(6), 321-343;
Relevance is the of a
existing between a and a
as determined by
Does this help?
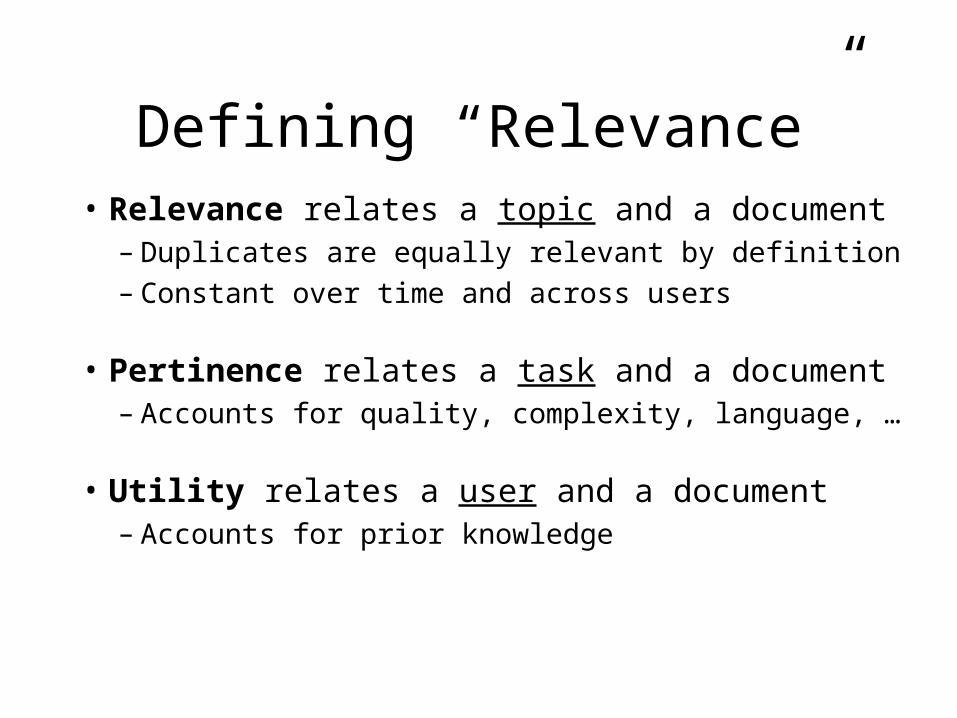
Defining “Relevance”• Relevance relates a topic and a document
– Duplicates are equally relevant by definition– Constant over time and across users
• Pertinence relates a task and a document– Accounts for quality, complexity, language, …
• Utility relates a user and a document– Accounts for prior knowledge

Another View
Relevant RetrievedRelevant +Retrieved
Not Relevant + Not Retrieved
Space of all documents

Set-Based Effectiveness Measures
• Precision– How much of what was found is relevant?
• Often of interest, particularly for interactive searching
• Recall– How much of what is relevant was found?
• Particularly important for law, patents, and medicine
• Fallout– How much of what was irrelevant was rejected?
• Useful when different size collections are compared

Effectiveness Measures
Relevant Retrieved
False Alarm Irrelevant Rejected
MissRelevant
Not relevant
Retrieved Not RetrievedDocAction
FA
Miss
1RelevantNot
Rejected IrrelevantFallout
1Relevant
RetrievedRelevant Recall
Retrieved
RetrievedRelevant Precision
User-Oriented
System-Oriented
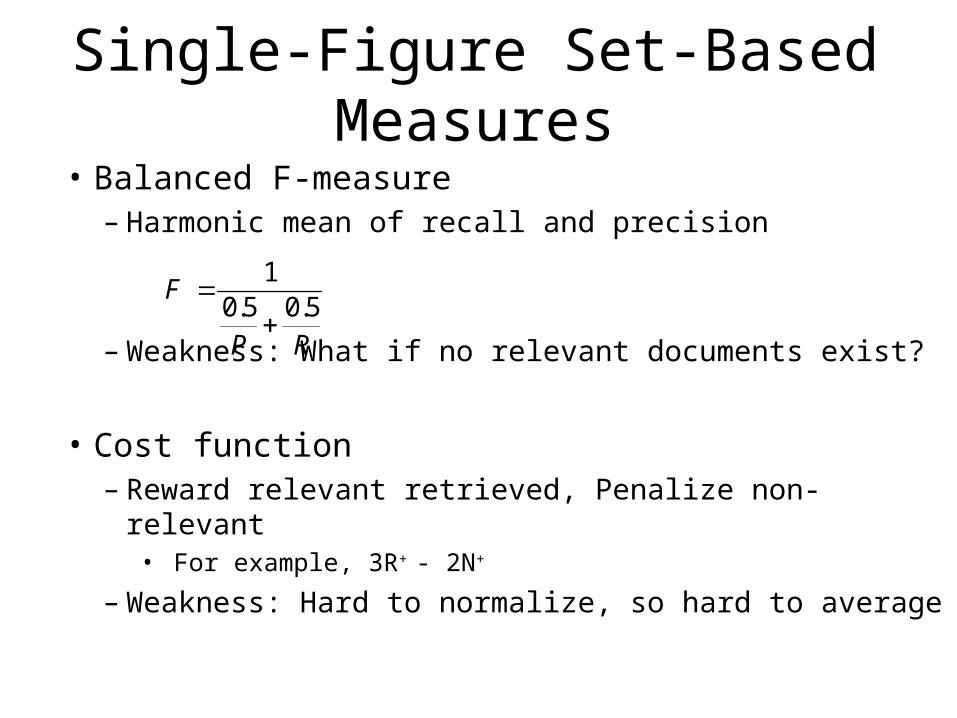
Single-Figure Set-Based Measures
• Balanced F-measure– Harmonic mean of recall and precision
– Weakness: What if no relevant documents exist?
• Cost function– Reward relevant retrieved, Penalize non-relevant
• For example, 3R+ - 2N+
– Weakness: Hard to normalize, so hard to average
RP
F5.05.0
1

Single-Valued Ranked Measures
• Expected search length– Average rank of the first relevant document
• Mean precision at a fixed number of documents– Precision at 10 docs is often used for Web search
• Mean precision at a fixed recall level– Adjusts for the total number of relevant docs
• Mean breakeven point– Value at which precision = recall

Automatic Evaluation Model
IR Black Box
Query
Ranked List
Documents
EvaluationModule
Measure of Effectiveness
Relevance Judgments
These are the four things we need!

Ad Hoc Topics
• In TREC, a statement of information need is called a topic
Title: Health and Computer Terminals
Description: Is it hazardous to the health of individuals to work with computer terminals on a daily basis? Narrative: Relevant documents would contain any information that expands on any physical disorder/problems that may be associated with the daily working with computer terminals. Such things as carpel tunnel, cataracts, and fatigue have been said to be associated, but how widespread are these or other problems and what is being done to alleviate any health problems.
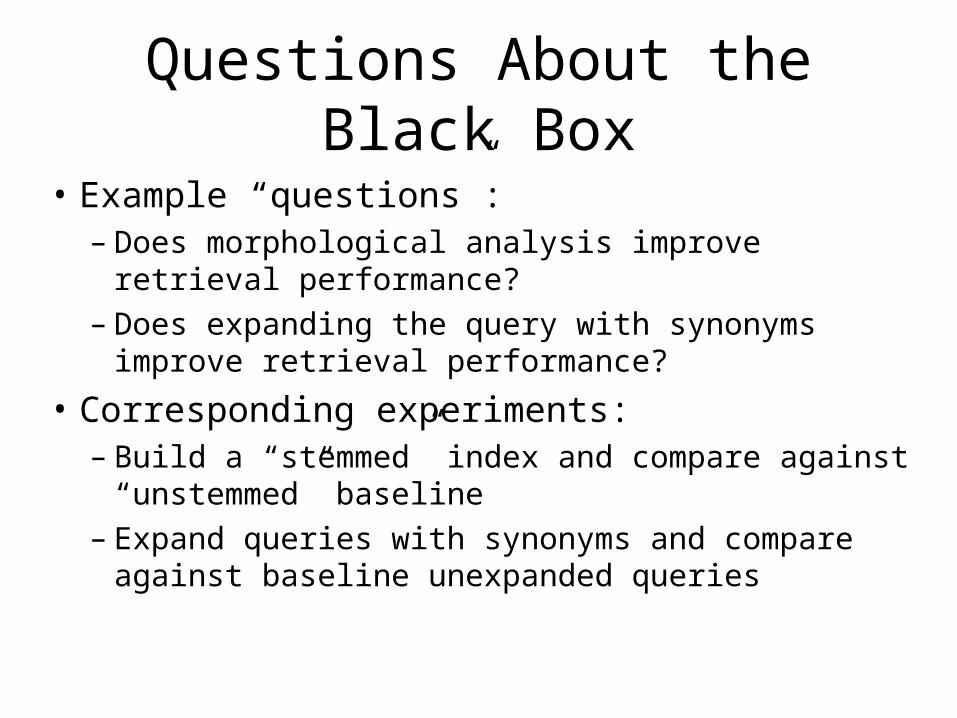
Questions About the Black Box
• Example “questions”:– Does morphological analysis improve retrieval performance?– Does expanding the query with synonyms improve retrieval
performance?
• Corresponding experiments:– Build a “stemmed” index and compare against “unstemmed”
baseline– Expand queries with synonyms and compare against baseline
unexpanded queries

Measuring Precision and Recall
= relevant document
1/1 1/2 1/3 1/4 2/5 3/6 3/7 4/8 4/9 4/10
5/11 5/12 5/13 5/14 5/15 6/16 6/17 6/18 6/19 4/20
1/14 1/14 1/14 1/14 2/14 3/14 3/14 4/14 4/14 4/14
5/14 5/14 5/14 5/14 5/14 6/14 6/14 6/14 6/14 6/14
Assume there are a total of 14 relevant documents
Precision
Recall
Precision
Recall
Hits 1-10
Hits 11-20

Graphing Precision and Recall
• Plot each (recall, precision) point on a graph
• Visually represent the precision/recall tradeoff
0
0.2
0.4
0.6
0.8
1
0 0.1 0.2 0.3 0.4 0.5
Recall
Pre
cis
ion

Uninterpolated Average Precision– Average of precision at each retrieved relevant
document– Relevant documents not retrieved contribute
zero to score
= relevant document
1/1 1/2 1/3 1/4 2/5 3/6 3/7 4/8 4/9 4/10
5/11 5/12 5/13 5/14 5/15 6/16 6/17 6/18 6/19 4/20
Precision
Precision
Hits 1-10
Hits 11-20
Assume total of 14 relevant documents: 8 relevant documents not retrieved contribute eight zeros MAP = .2307

Uninterpolated MAP
R
R
1/3=0.33
2/7=0.29
AP=0.31
RR
R
R
1/1=1.002/2=1.00
3/5=0.60
4/9=0.44
AP=0.76
R
R
R
1/2=0.50
3/5=0.60
4/8=0.50
AP=0.53
MAP=0.53

Visualizing Mean Average Precision
0.0
0.2
0.4
0.6
0.8
1.0
Av
era
ge
Pre
cis
ion
Topic

What MAP Hides
0
0.1
0.2
0.3
0.4
0.5
0.6
0.7
0.8
0.9
1
0 0.1 0.2 0.3 0.4 0.5 0.6 0.7 0.8 0.9 1
Recall
Prec
isio
n
Adapted from a presentation by Ellen Voorhees at the University of Maryland, March 29, 1999

Why Mean Average Precision?
• It is easy to trade between recall and precision– Adding related query terms improves recall
• But naive query expansion techniques kill precision
– Limiting matches by part-of-speech helps precision• But it almost always hurts recall
• Comparisons should give some weight to both– Average precision is a principled way to do this– More “central” than other available measures

Systems Ranked by Different MeasuresP(10) P(30) R-Prec Ave Prec Recall at
.5 PrecRecall(1000)
Total Rel Rank of1st Rel
I NQ502 I NQ502 ok7ax ok7ax att98atdc ok7ax ok7ax tno7tw4ok7ax ok7ax I NQ502 att98atdc ok7ax tno7exp1 tno7exp1 bbn1
att98atdc I NQ501 ok7am att98atde mds98td att98atdc att98atdc I NQ502att98atde att98atdc att98atdc ok7am ok7am att98atde bbn1 nect’challI NQ501 nect’chall att98atde I NQ502 I NQ502 Cor7A3rrf att98atde tnocbm25nect’chall att98atde I NQ501 mds98td att98atde ok7am I NQ502 MerAbtndnect’chdes ok7am bbn1 bbn1 I NQ501 bbn1 I NQ501 att98atdc
ok7am nect’chdes mds98td tno7exp1 ok7as pirc8Aa2 ok7am acsys7almds98td I NQ503 nect’chdes I NQ501 bbn1 I NQ502 Cor7A3rrf mds98tdI NQ503 bbn1 nect’chall pirc8Aa2 nect’chall pirc8Ad pirc8Aa2 ibms98a
Cor7A3rrf tno7exp1 ok7as Cor7A3rrf tno7exp1 I NQ501 nect’chdes Cor7A3rrftno7tw4 mds98td tno7exp1 acsys7al Cor7A3rrf nect’chdes mds98td ok7ax
MerAbtnd pirc8Aa2 acsys7al ok7as acsys7al nect’chall acsys7al att98atdeacsys7al Cor7A3rrf pirc8Aa2 nect’chdes Cor7A2rrd acsys7al nect’chall Brkly25
iowacuhk1 ok7as Cor7A3rrf nect’chall I NQ503 mds98td pirc8Ad nect’chdes
Ranked by measure averaged over 50 topics
Adapted from a presentation by Ellen Voorhees at the University of Maryland, March 29, 1999

Correlations Between Rankings
Kendall’s computed between pairs of rankings
P(30) R Prec AvePrec
Recallat .5 P
Recall(1000)
TotalRels
Rank1st Rel
P(10) .8851 .8151 .7899 .7855 .7817 .7718 .6378P(30) .8676 .8446 .8238 .7959 .7915 .6213R Prec .9245 .8654 .8342 .8320 .5896Ave Prec .8840 .8473 .8495 .5612R at .5 P .7707 .7762 .5349Recall(1000) .9212 .5891Total Rels .5880
Adapted from a presentation by Ellen Voorhees at the University of Maryland, March 29, 1999

0
50
100
150
200
250
300
350
400
TREC Topic
Kno
wn
Rel
evan
t D
ocum
ents
Relevant Document Density
Adapted from a presentation by Ellen Voorhees at the University of Maryland, March 29, 1999

Alternative Ways to Get Judgments• Exhaustive assessment is usually impractical
– Topics * documents = a large number!
• Pooled assessment leverages cooperative evaluation– Requires a diverse set of IR systems
• Search-guided assessment is sometimes viable– Iterate between topic research/search/assessment– Augment with review, adjudication, reassessment
• Known-item judgments have the lowest cost– Tailor queries to retrieve a single known document– Useful as a first cut to see if a new technique is viable

Obtaining Relevance Judgments
• Exhaustive assessment can be too expensive– TREC has 50 queries for >1 million docs each year
• Random sampling won’t work– If relevant docs are rare, none may be found!
• IR systems can help focus the sample– Each system finds some relevant documents– Different systems find different relevant documents– Together, enough systems will find most of them

Pooled Assessment Methodology
• Systems submit top 1000 documents per topic
• Top 100 documents for each are judged– Single pool, without duplicates, arbitrary order– Judged by the person that wrote the query
• Treat unevaluated documents as not relevant
• Compute MAP down to 1000 documents– Treat precision for complete misses as 0.0

Does pooling work?
• Judgments can’t possibly be exhaustive!
• This is only one person’s opinion about relevance
• What about hits 101 to 1000?
• We can’t possibly use judgments to evaluate a system that didn’t participate in the evaluation!
It doesn’t matter: relative rankings remain the same!
It doesn’t matter: relative rankings remain the same!
It doesn’t matter: relative rankings remain the same!
Actually, we can!
Chris Buckley and Ellen M. Voorhees. (2004) Retrieval Evaluation with Incomplete Information. SIGIR 2004.
Ellen Voorhees. (1998) Variations in Relevance Judgments and the Measurement of Retrieval Effectiveness. SIGIR 1998.
Justin Zobel. (1998) How Reliable Are the Results of Large-Scale Information Retrieval Experiments? SIGIR 1998.

Lessons From TREC
• Incomplete judgments are useful– If sample is unbiased with respect to systems tested
• Different relevance judgments change absolute score– But rarely change comparative advantages when averaged
• Evaluation technology is predictive– Results transfer to operational settings
Adapted from a presentation by Ellen Voorhees at the University of Maryland, March 29, 1999

Effects of Incomplete Judgments
• Additional relevant documents are:– roughly uniform across systems– highly skewed across topics
• Systems that don’t contribute to pool get comparable results
Adapted from a presentation by Ellen Voorhees at the University of Maryland, March 29, 1999

Inter-Judge Agreement
0100200300400500
# Relevant per Topic by Assessor
Primary A B
Assessor Group Overlap
Primary & A .421
Primary & B .494
A & B .426
All 3 .301
Adapted from a presentation by Ellen Voorhees at the University of Maryland, March 29, 1999

0
0.1
0.2
0.3
0.4
System
Ave
rage
Pre
cisi
on
Line 1
Line 2
Mean
Original
Union
I ntersection
Effect of Different Judgments
Adapted from a presentation by Ellen Voorhees at the University of Maryland, March 29, 1999

Net Effect of Different Judges
• Mean Kendall between system rankings produced from different qrel sets: .938
• Similar results held for– Different query sets– Different evaluation measures– Different assessor types– Single opinion vs. group opinion judgments
Adapted from a presentation by Ellen Voorhees at the University of Maryland, March 29, 1999
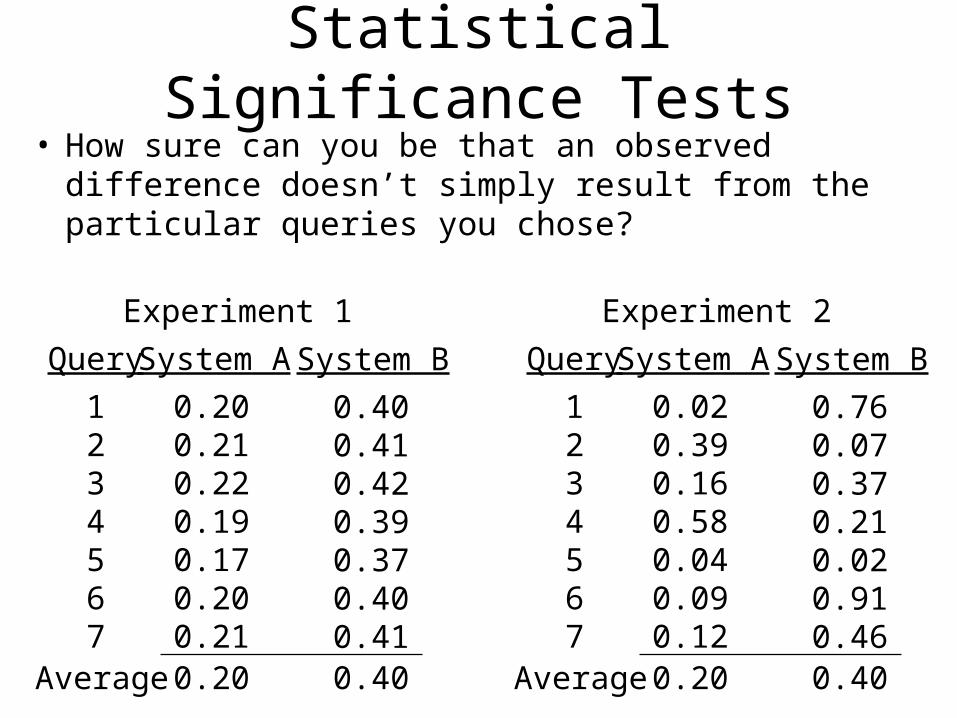
Statistical Significance Tests• How sure can you be that an observed difference doesn’t
simply result from the particular queries you chose?
System A
0.200.210.220.190.170.200.21
System B
0.400.410.420.390.370.400.41
Experiment 1
Query
1234567
Average 0.20 0.40
System A
0.020.390.160.580.040.090.12
System B
0.760.070.370.210.020.910.46
Experiment 2
Query
1234567
Average 0.20 0.40

Statistical Significance TestingSystem A
0.020.390.160.580.040.090.12
System B
0.760.070.370.210.020.910.46
Query
1234567
Average 0.20 0.40
Sign Test
+-+--+-p=1.0
Wilcoxon
+0.74- 0.32+0.21- 0.37- 0.02+0.82- 0.38p=0.9375
0
95% of outcomes
Try some out at: http://www.fon.hum.uva.nl/Service/Statistics.html

How Much is Enough?
• Measuring improvement– Achieve a meaningful improvement
• Guideline: 0.05 is noticeable, 0.1 makes a difference
– Achieve reliable improvement on “typical” queries• Wilcoxon signed rank test for paired samples
• Know when to stop!– Inter-assessor agreement limits max precision
• Using one judge to assess the other yields about 0.8

Recap: Automatic Evaluation
• Evaluation measures focus on relevance– Users also want utility and understandability
• Goal is to compare systems– Values may vary, but relative differences are stable
• Mean values obscure important phenomena– Augment with failure analysis/significance tests
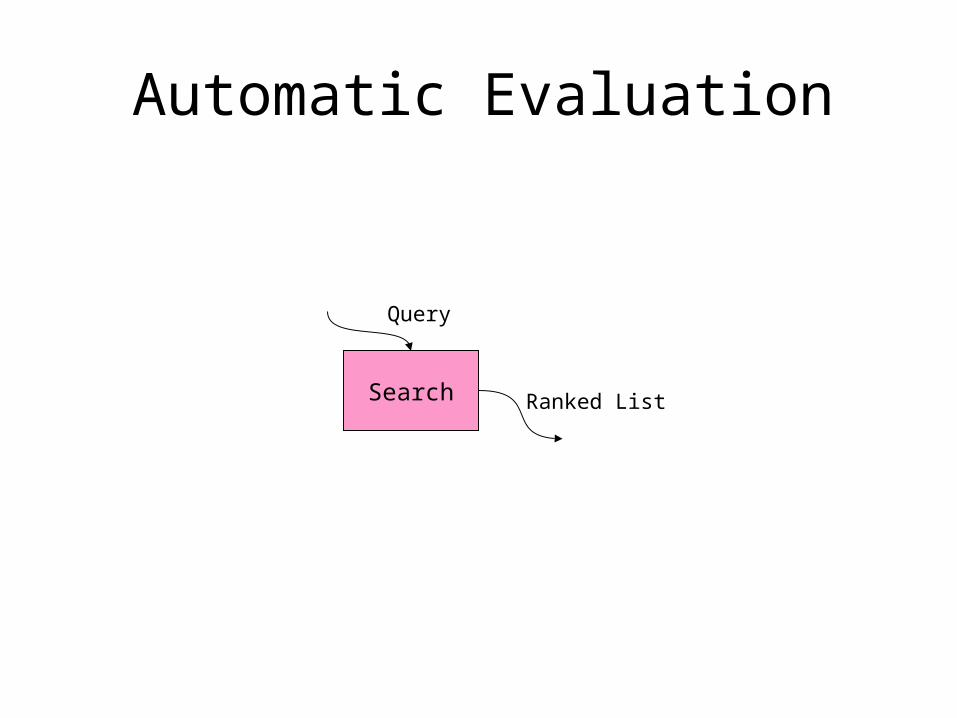
Automatic Evaluation
Search
Query
Ranked List

User Studies
Search
Query
Selection
Ranked List
Examination
Document
Document
QueryFormulation
Query Reformulation and
Relevance Feedback

User Studies
• Goal is to account for interface issues– By studying the interface component– By studying the complete system
• Formative evaluation– Provide a basis for system development
• Summative evaluation– Designed to assess performance

Questions That Involve Users
• Example “questions”:– Does keyword highlighting help users evaluate document
relevance?
– Is letting users weight search terms a good idea?
• Corresponding experiments:– Build two different interfaces, one with keyword
highlighting, one without; run a user study
– Build two different interfaces, one with term weighting functionality, and one without; run a user study

Blair and Maron (1985)• A classic study of retrieval effectiveness
– Earlier studies used unrealistically small collections
• Studied an archive of documents for a lawsuit– 40,000 documents, ~350,000 pages of text– 40 different queries– Used IBM’s STAIRS full-text system
• Approach:– Lawyers wanted at least 75% of all relevant documents– Precision and recall evaluated only after the lawyers were satisfied
with the results
David C. Blair and M. E. Maron. (1984) An Evaluation of Retrieval Effectiveness for a Full-Text Document-Retrieval System. Communications of the ACM, 28(3), 289--299.
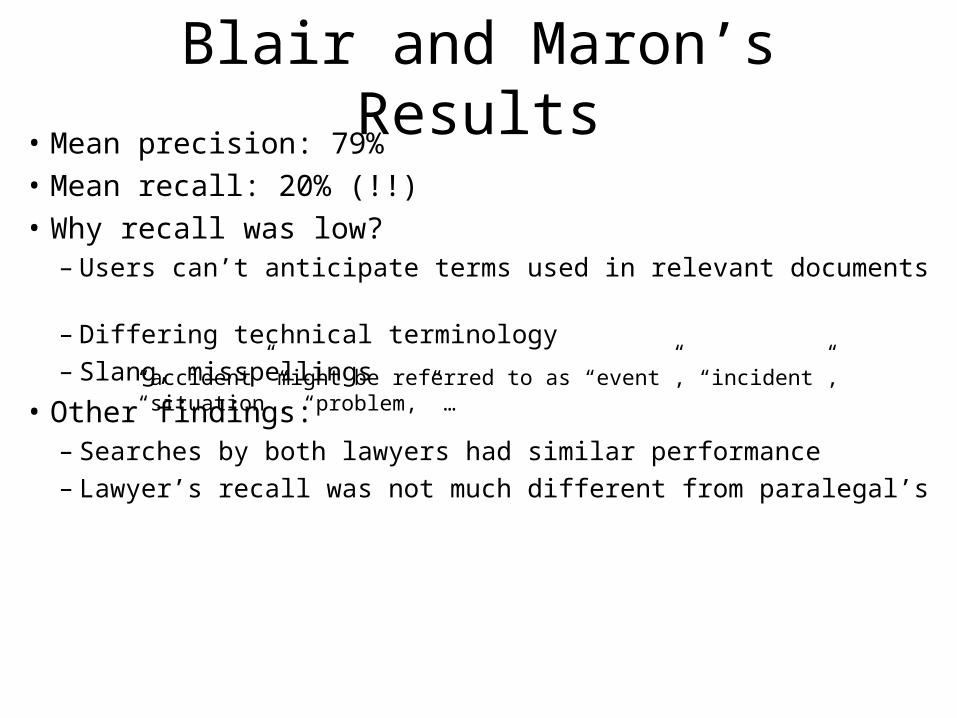
Blair and Maron’s Results• Mean precision: 79%• Mean recall: 20% (!!)• Why recall was low?
– Users can’t anticipate terms used in relevant documents
– Differing technical terminology– Slang, misspellings
• Other findings:– Searches by both lawyers had similar performance– Lawyer’s recall was not much different from paralegal’s
“accident” might be referred to as “event”, “incident”, “situation”, “problem,” …

Quantitative User Studies• Select independent variable(s)
– e.g., what info to display in selection interface
• Select dependent variable(s)– e.g., time to find a known relevant document
• Run subjects in different orders– Average out learning and fatigue effects
• Compute statistical significance– Null hypothesis: independent variable has no effect– Rejected if p<0.05
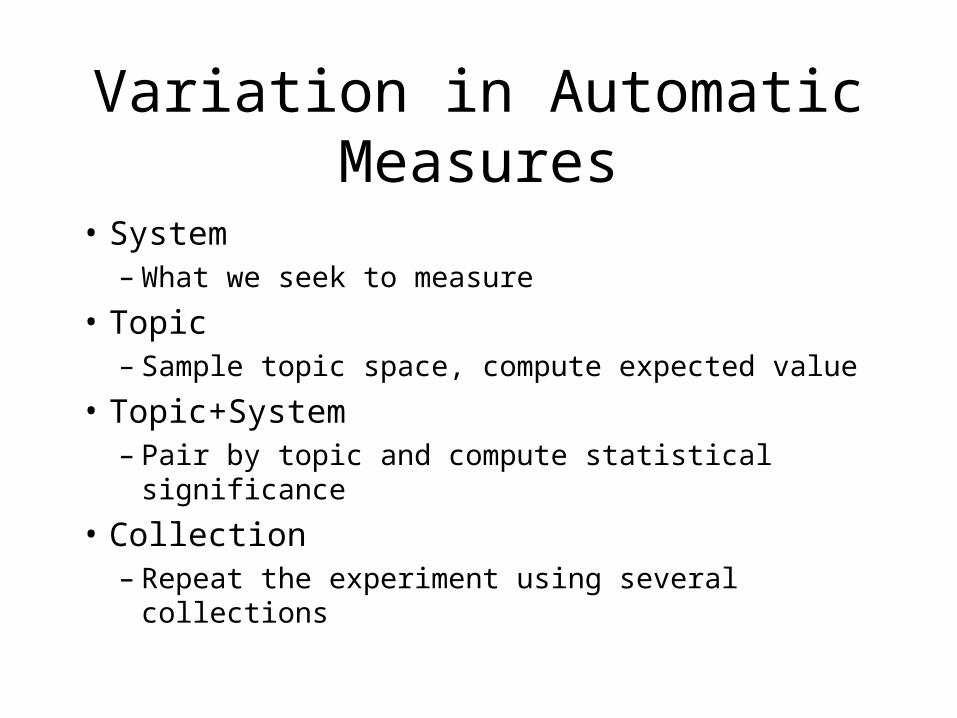
Variation in Automatic Measures
• System– What we seek to measure
• Topic– Sample topic space, compute expected value
• Topic+System– Pair by topic and compute statistical significance
• Collection– Repeat the experiment using several collections

Additional Effects in User Studies
• Learning– Vary topic presentation order
• Fatigue– Vary system presentation order
• Topic+User (Expertise)– Ask about prior knowledge of each topic
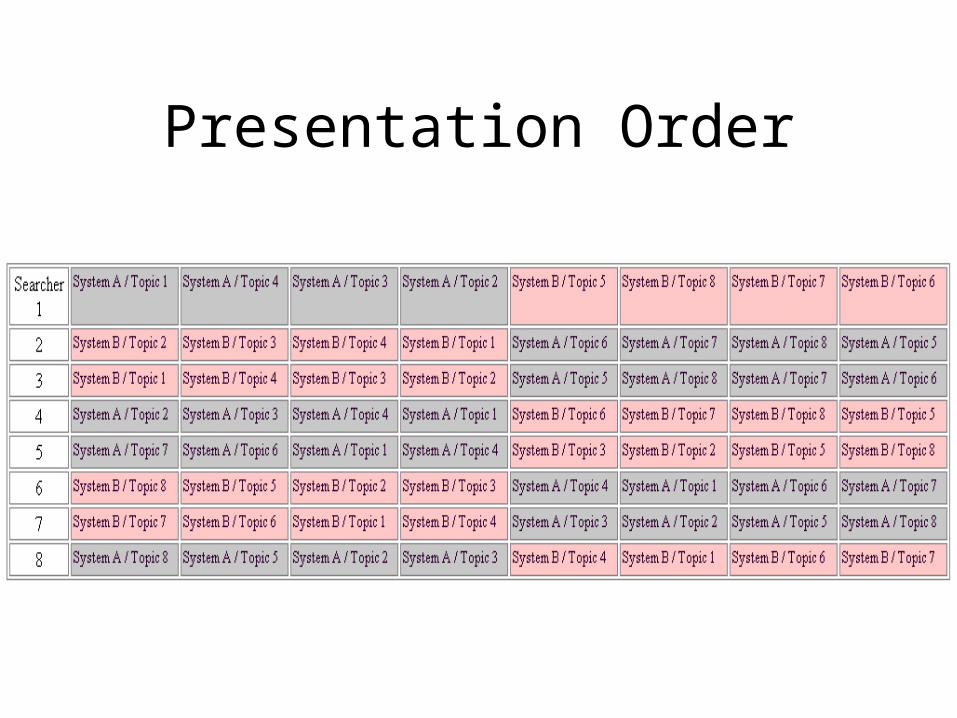
Presentation Order

Batch vs. User Evaluations• Do batch (black box) and user evaluations
give the same results? If not, why?
• Two different tasks:– Instance recall (6 topics)
– Question answering (8 topics)
Andrew Turpin and William Hersh. (2001) Why Batch and User Evaluations Do No Give the Same Results. Proceedings of SIGIR 2001.
What countries import Cuban sugar?What tropical storms, hurricanes, and typhoons have caused
property damage or loss of life?
Which painting did Edvard Munch complete first, “Vampire” or “Puberty”?
Is Denmark larger or smaller in population than Norway?

Results• Compared of two systems:
– a baseline system– an improved system that was provably better in
batch evaluations
• Results:Instance Recall Question Answering
Batch MAP User recall Batch MAP User accuracy
Baseline 0.2753 0.3230 0.2696 66%
Improved 0.3239 0.3728 0.3544 60%
Change +18% +15% +32% -6%
p-value (paired t-test)
0.24 0.27 0.06 0.41

Example User Study ResultsF
α=
0.8
English queries, German documents4 searchers, 20 minutes per topic

Qualitative User Studies• Observe user behavior
– Instrumented software, eye trackers, etc.– Face and keyboard cameras– Think-aloud protocols– Interviews and focus groups
• Organize the data– For example, group it into overlapping categories
• Look for patterns and themes
• Develop a “grounded theory”
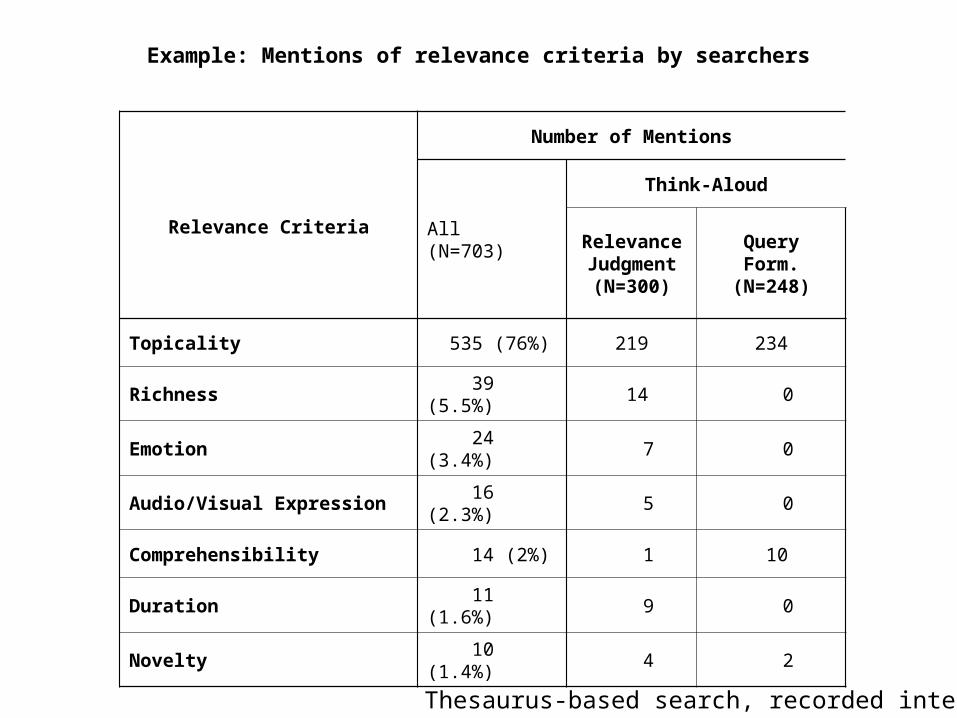
Example: Mentions of relevance criteria by searchers
Relevance Criteria
Number of Mentions
All(N=703)
Think-Aloud
Relevance Judgment(N=300)
QueryForm.
(N=248)
Topicality 535 (76%) 219 234
Richness 39 (5.5%) 14 0
Emotion 24 (3.4%) 7 0
Audio/Visual Expression 16 (2.3%) 5 0
Comprehensibility 14 (2%) 1 10
Duration 11 (1.6%) 9 0
Novelty 10 (1.4%) 4 2
Thesaurus-based search, recorded interviews

Topicality
0 20 40 60 80 100 120 140
Object
Time Frame
Organization/Group
Subject
Event/Experience
Place
Person
Total mentions by 8 searchers
Thesaurus-based search, recorded interviews

Questionnaires
• Demographic data– For example, computer experience– Basis for interpreting results
• Subjective self-assessment– Which did they think was more effective?– Often at variance with objective results!
• Preference– Which interface did they prefer? Why?

Summary
• Qualitative user studies suggest what to build
• Design decomposes task into components
• Automated evaluation helps to refine components
• Quantitative user studies show how well it works

One Minute Paper
• If I demonstrated a new retrieval technique that achieved a statistically significant improvement in average precision on the TREC collection, what would be the most serious limitation to consider when interpreting that result?


