Evaluation of audio test methods and measurements for end-of-line loudspeaker quality control Steve Temme 1 and Viktor Dobos 2 (1. Listen, Inc., Boston, MA, 02118, USA. [email protected]; 2. Harman/Becker Automotive Systems Kft., H-8000 Székesfehérvár, Hungary) ABSTRACT In order to minimize costly warranty repairs, loudspeaker OEMS impose tight specifications and a “total quality” requirement on their part suppliers. At the same time, they also require low prices. This makes it important for driver manufacturers and contract manufacturers to work with their OEM customers to define reasonable specifications and tolerances. They must understand both how the loudspeaker OEMS are testing as part of their incoming QC and also how to implement their own end-of-line measurements to ensure correlation between the two. Specifying and testing loudspeakers can be tricky since loudspeakers are inherently nonlinear, time-variant and effected by their working conditions & environment. This paper examines the loudspeaker characteristics that can be measured, and discusses common pitfalls and how to avoid them on a loudspeaker production line. Several different audio test methods and measurements for end-of- the-line speaker quality control are evaluated, and the most relevant ones identified. Speed, statistics, and full traceability are also discussed. Keywords: end of line loudspeaker testing, frequency response, distortion, Rub & Buzz, limits
Transcript
Evaluation of audio test methods and measurements for
end-of-line loudspeaker quality control
Steve Temme1 and Viktor Dobos2 (1. Listen, Inc., Boston, MA, 02118, USA. [email protected];
2. Harman/Becker Automotive Systems Kft., H-8000 Székesfehérvár, Hungary)
ABSTRACT
In order to minimize costly warranty repairs, loudspeaker OEMS impose tight
specifications and a “total quality” requirement on their part suppliers. At the same
time, they also require low prices. This makes it important for driver manufacturers
and contract manufacturers to work with their OEM customers to define reasonable
specifications and tolerances. They must understand both how the loudspeaker
OEMS are testing as part of their incoming QC and also how to implement their
own end-of-line measurements to ensure correlation between the two.
Specifying and testing loudspeakers can be tricky since loudspeakers are inherently
nonlinear, time-variant and effected by their working conditions & environment.
This paper examines the loudspeaker characteristics that can be measured, and
discusses common pitfalls and how to avoid them on a loudspeaker production line.
Several different audio test methods and measurements for end-of- the-line speaker
quality control are evaluated, and the most relevant ones identified. Speed, statistics,
and full traceability are also discussed.
Keywords: end of line loudspeaker testing, frequency response, distortion, Rub &
Buzz, limits
INTRODUCTION
In order to guarantee quality while keeping testing fast and accurate, it is important for audio
manufacturers to perform only those tests which will easily identify out-of-specification products,
and omit those which do not provide additional information that directly pertains to the quality of the
product or its likelihood of failure. Various test parameters, such as the test methods and length of
the test signal, need to be optimized to ensure that all faults are captured, yet the test is not
unnecessarily long.
In addition, it is important to be aware of the unique characteristics of loudspeakers, for
example, the inherent non-linearity of loudspeakers (their behavior changes with temperature,
humidity and level) makes it important to control environmental conditions. Since production line
measurements are not usually made in an anechoic chamber for practicality and cost reasons,
optimization of the test and test environment to minimize interference from background noise is
important.
Finally, loudspeakers have a spectrum of results and a good understanding of tolerances and
limits is important. Quality control measurements are generally relative or compared to a reference
or statistical standard, and determining what this standard should be is open to great debate and will
be addressed later in the paper.
1. TEST ENVIRONMENT AND SYSTEM
1.1 Test System
The most important requirement of a QC test is to catch audible defects such as rub & buzz and
loose particles, as this is what the consumer bases their perception of audio quality on. Traditionally,
human listeners were used, but these days, automated end-of-line (EOL) test systems are responsible
for most production line tests. Much work has been done by test system manufacturers on perceptual
audio, the art of making an automated system that correlates well to human perception, and today’s
systems are extremely sophisticated in their analysis methods [1] [2] [3].
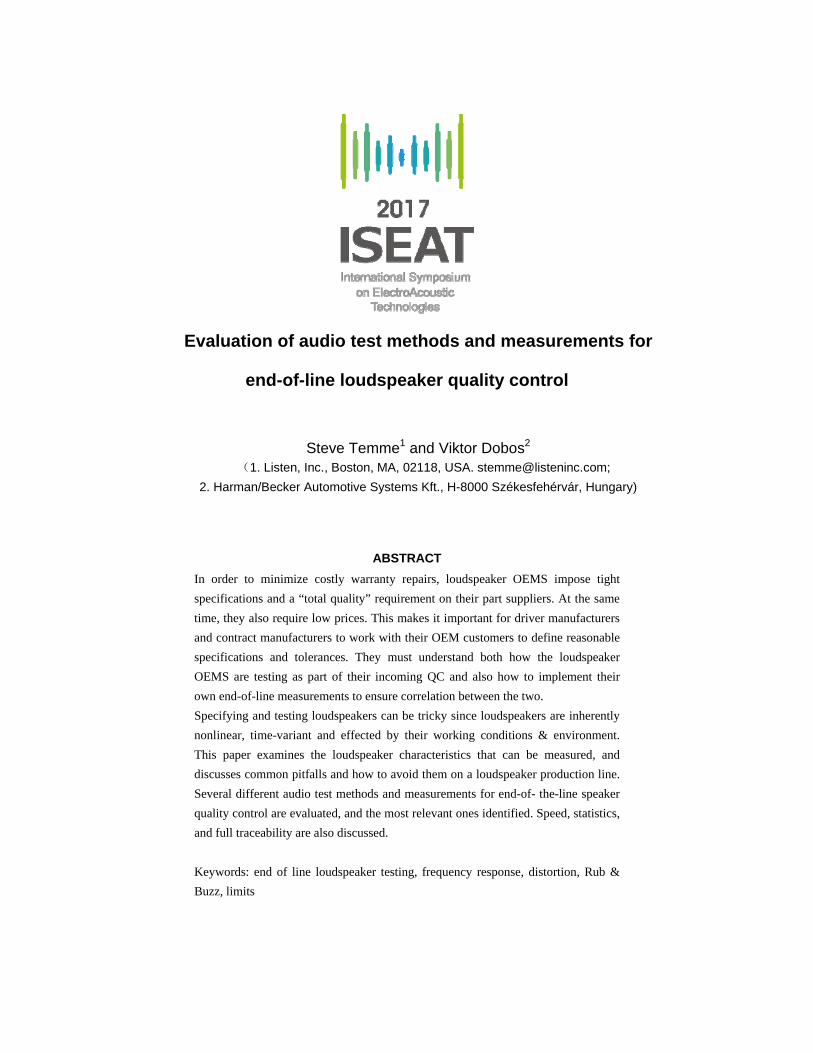
A typical EOL loudspeaker test system consists of audio test and measurement software running
on a computer, a measurement microphone, and an audio interface to transmit the test signal to the
speaker and the recorded waveforms back to the computer for analysis. Amplifiers and impedance
boxes are also required for powering the speaker and measuring impedance. AmpConnect from
Listen, Inc. simplifies factory testing by combining the audio interface amplifier, impedance
measurement and more in a single USB-connected device. This simplifies test setup and minimizes
the potential for incorrect operation as internal wiring replaces all external cabling. Fig. 1 shows a
typical production line audio test equipment setup using this hardware.
Figure 1. Loudspeaker production line setup using SoundCheck system with AmpConnect
1.2 Noise Isolation
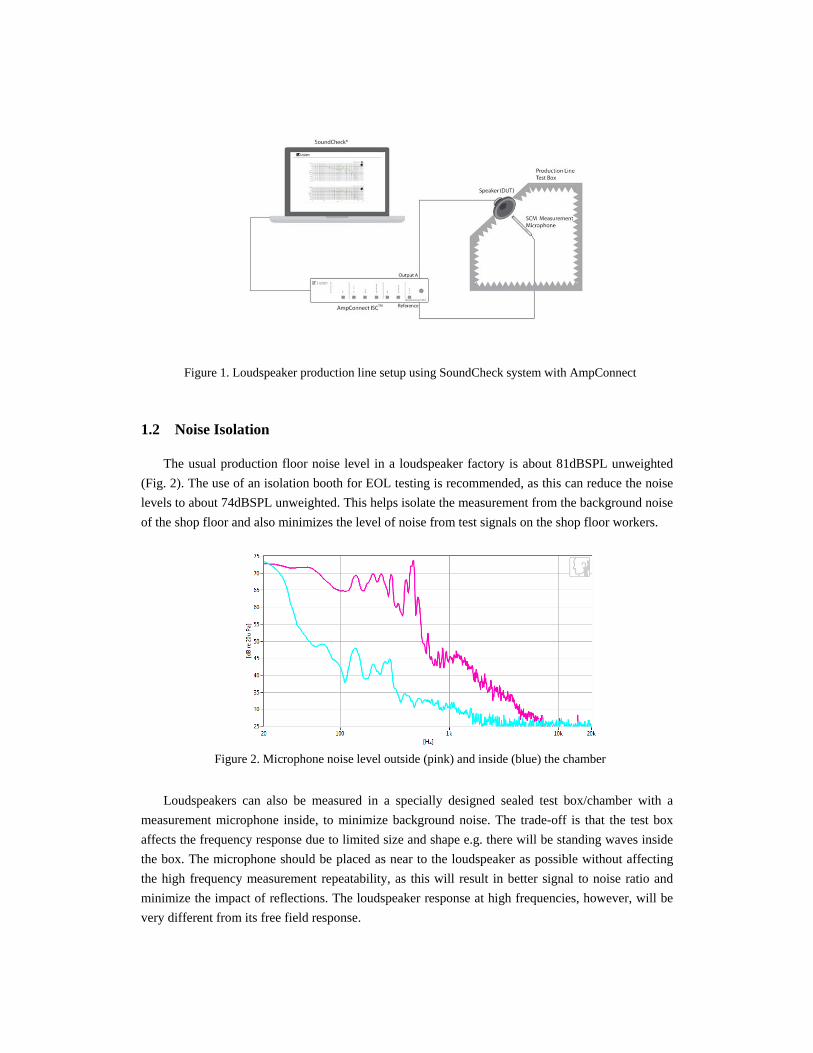
The usual production floor noise level in a loudspeaker factory is about 81dBSPL unweighted
(Fig. 2). The use of an isolation booth for EOL testing is recommended, as this can reduce the noise
levels to about 74dBSPL unweighted. This helps isolate the measurement from the background noise
of the shop floor and also minimizes the level of noise from test signals on the shop floor workers.
Figure 2. Microphone noise level outside (pink) and inside (blue) the chamber
Loudspeakers can also be measured in a specially designed sealed test box/chamber with a
measurement microphone inside, to minimize background noise. The trade-off is that the test box
affects the frequency response due to limited size and shape e.g. there will be standing waves inside
the box. The microphone should be placed as near to the loudspeaker as possible without affecting
the high frequency measurement repeatability, as this will result in better signal to noise ratio and
minimize the impact of reflections. The loudspeaker response at high frequencies, however, will be
very different from its free field response.
1.3 Loudspeaker orientation in test box
It is preferable to point the loudspeaker down at the measurement microphone to catch loose
particles inside the voice coil and dust cap that can occur during manufacturing from bits of
adhesives, magnets, iron and dirt. If the speaker is pointing up during testing, the loose particles may
lodge into the bottom of the pole piece and not get detected.
1.4 Repeatability
The two most important considerations in a test jig design are the repeatability of the
measurement (positioning of the speaker) and the sealing. A plate with foam positioning (Fig. 3)
ensures consistent positioning, minimizes vibrations, and also helps seals the test box from external
background noise.
Figure 3. Aluminum plate test jig with foam positioning and sealing
With correct sealing, the signal-to-noise for the acoustic measurement will be as shown in figure 4.
The factory background noise is greatly attenuated inside the sealed test box by 25dB at some
frequencies. This is very important when measuring loudspeaker distortion. If the background noise
is greater than the harmonic level, it will not be measured accurately. For rub & buzz measurements,
a high order harmonic can be audible even when it is 60dB below the fundamental frequency [1] [2].
Figure 4. Microphone level inside test chamber with high level 200Hz test tone
1.5 Electrical Connection
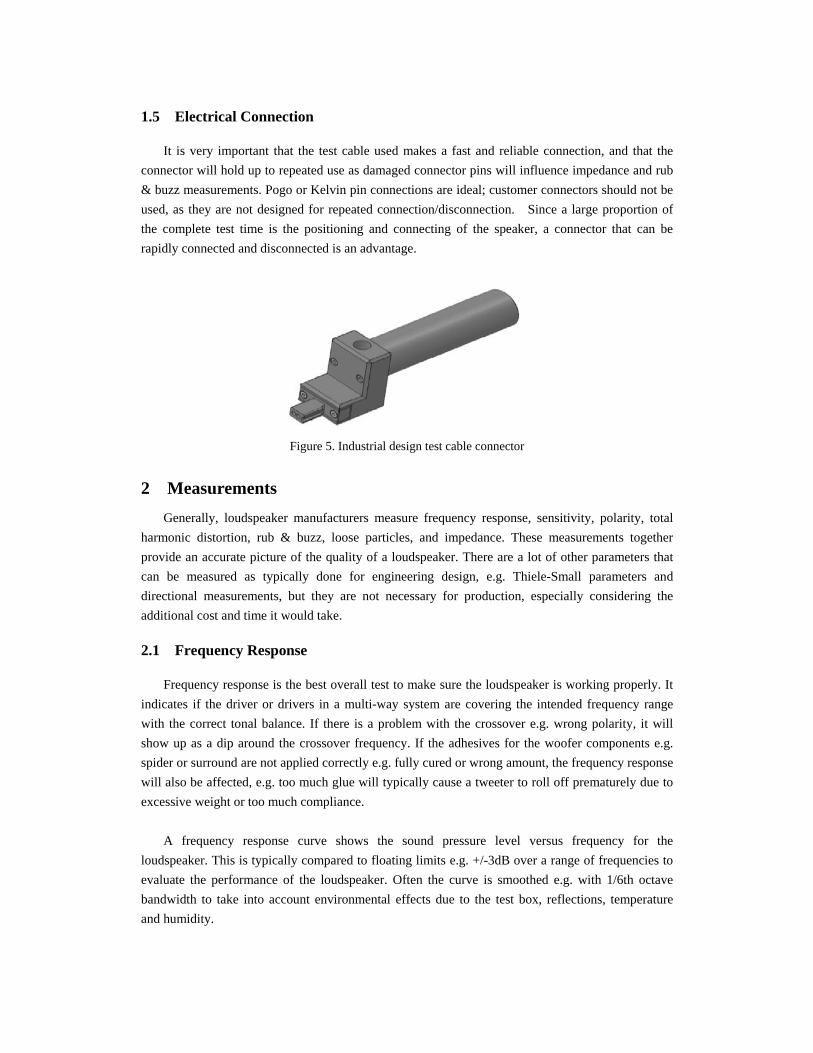
It is very important that the test cable used makes a fast and reliable connection, and that the
connector will hold up to repeated use as damaged connector pins will influence impedance and rub
& buzz measurements. Pogo or Kelvin pin connections are ideal; customer connectors should not be
used, as they are not designed for repeated connection/disconnection. Since a large proportion of
the complete test time is the positioning and connecting of the speaker, a connector that can be
rapidly connected and disconnected is an advantage.
Figure 5. Industrial design test cable connector
2 Measurements
Generally, loudspeaker manufacturers measure frequency response, sensitivity, polarity, total
harmonic distortion, rub & buzz, loose particles, and impedance. These measurements together
provide an accurate picture of the quality of a loudspeaker. There are a lot of other parameters that
can be measured as typically done for engineering design, e.g. Thiele-Small parameters and
directional measurements, but they are not necessary for production, especially considering the
additional cost and time it would take.
2.1 Frequency Response
Frequency response is the best overall test to make sure the loudspeaker is working properly. It
indicates if the driver or drivers in a multi-way system are covering the intended frequency range
with the correct tonal balance. If there is a problem with the crossover e.g. wrong polarity, it will
show up as a dip around the crossover frequency. If the adhesives for the woofer components e.g.
spider or surround are not applied correctly e.g. fully cured or wrong amount, the frequency response
will also be affected, e.g. too much glue will typically cause a tweeter to roll off prematurely due to
excessive weight or too much compliance.
A frequency response curve shows the sound pressure level versus frequency for the
loudspeaker. This is typically compared to floating limits e.g. +/-3dB over a range of frequencies to
evaluate the performance of the loudspeaker. Often the curve is smoothed e.g. with 1/6th octave
bandwidth to take into account environmental effects due to the test box, reflections, temperature
and humidity.
2.2 Sensitivity
Sensitivity is the sound pressure level for a given stimulus voltage. It is derived from a properly
calibrated frequency response measurement usually with an absolute limit e.g. between 86 & 90dB
SPL at a frequency or average of frequencies. It is sensible to choose a range of frequencies to
measure sensitivity. There is a risk that a single measurement frequency may occur at a peak or dip
in the frequency response due to a reflection and will not be consistent from speaker to speaker.
Sensitivity is important for two reasons; an incorrect sensitivity measurement may indicate a
poorly magnetized motor and it is important to have similar sensitivities between speakers for good
stereo balance when matching left and right drivers, for example in an automobile.
2.3 Polarity
A polarity measurement verifies that plus and minus leads are wired properly by examining the
corresponding positive or negative going impulse response or absolute phase response. This is
particularly important for multi-way drivers. This is a binary test so simple limits are required.
2.4 Harmonic Distortion
Total Harmonic Distortion measurements ensure that distortion does not exceed an absolute
level versus frequency e.g. maximum of 3%. THD is a good indicator for motor and suspension
problems, and analysis of the distortion harmonics can be a good indicator of manufacturing issues.
If the voice coil is not centered properly, the 2nd and even harmonic levels will increase due to an
asymmetrical magnetic field, voice coil offset or a spider/surround problems. If the driver is reaching
a limit in both the positive and negative going direction, the 3rd and odd order harmonics will
increase due to symmetrical non-linearities [1].
In order to minimize background noise in the measurement, a narrow band tracking filter (FFT)
and complex averaging is required. For more information on this technique, please see [4].
2.5 Rub & Buzz
Rub & Buzz is an important parameter as it causes considerable annoyance to the listener, and is
invariably caused by manufacturing issues. It occurs when high order harmonics (typically greater
than the 10th harmonic) appear due to a rubbing voice coil, buzzing lead wires, partial gluing of
membrane, surround and dust cover and other mechanical or sealing defects. Rub & buzz should not
exceed an absolute level versus frequency [2]. Some automotive companies require loudspeaker
manufacturers to use a HI-2 algorithm that weights the higher harmonics more than the lower
harmonics to correlate better the greater audibility of the higher harmonics [5]. This is done in a
more realistic way by the Perceptual Rub & Buzz algorithm in Listen’s SoundCheck software, which
simulates the masking filters in a human ear [2].
2.6 Loose Particles
Loose particles are caused by dirt, glue and magnetic chips trapped inside the voice coil or dust
cap. Since the loose particles randomly hit, it is best to look for this defect in the time domain using
a time envelope. Limits are usually absolute [3].
2.7 Impedance
Impedance measures the load the loudspeaker presents to the amplifier over a range of
frequencies and typically requires a reference resistor or current sense circuit to measure the current.
It is important to use a resistor or an electrical circuit that does not affect the loudspeaker load [6].
A variety of post-processing can be performed on impedance measurements such as calculating
resonance frequency and Q used in Thiele-Small parameters. This will be discussed in more detail
later.
3 Measurements that should not form part of EOL Loudspeaker test
3.1 Voice coil offset
While measurement of voice coil (VC) offset is a valuable laboratory tool for development and
failure analysis purposes, it is not necessary for EOL testing, as the same result is achieved by the
second harmonic measurement, which is already being made as part of the THD test. Additionally
measuring the VC offset simply increases the measurement cycle time by well over a second with no
additional pass/fail results.
VC offset and variation in the geometry of the suspension are the main contributors of the 2nd
Harmonic distortions and THD [7]. Limits added to the second harmonic enable strong asymmetry
problems, such as voice coil offset issues, to be identified without making any additional
measurements. Although this does not identify the root cause from the manufacturing process, it
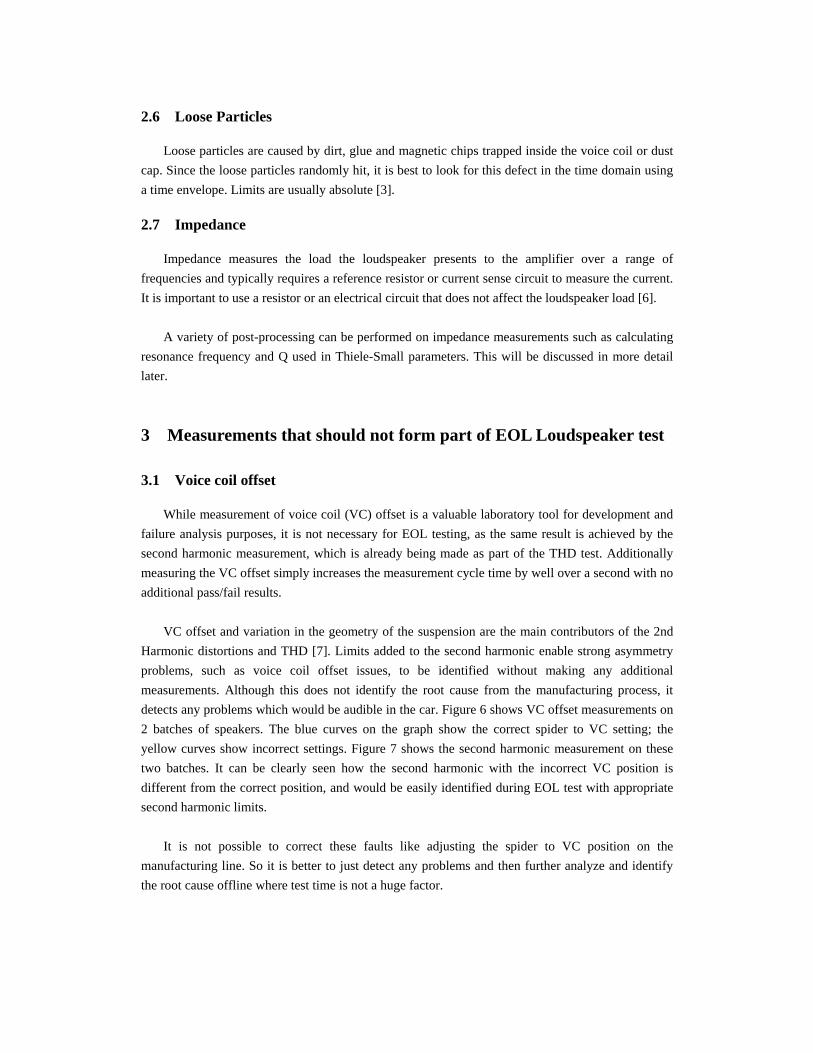
detects any problems which would be audible in the car. Figure 6 shows VC offset measurements on
2 batches of speakers. The blue curves on the graph show the correct spider to VC setting; the
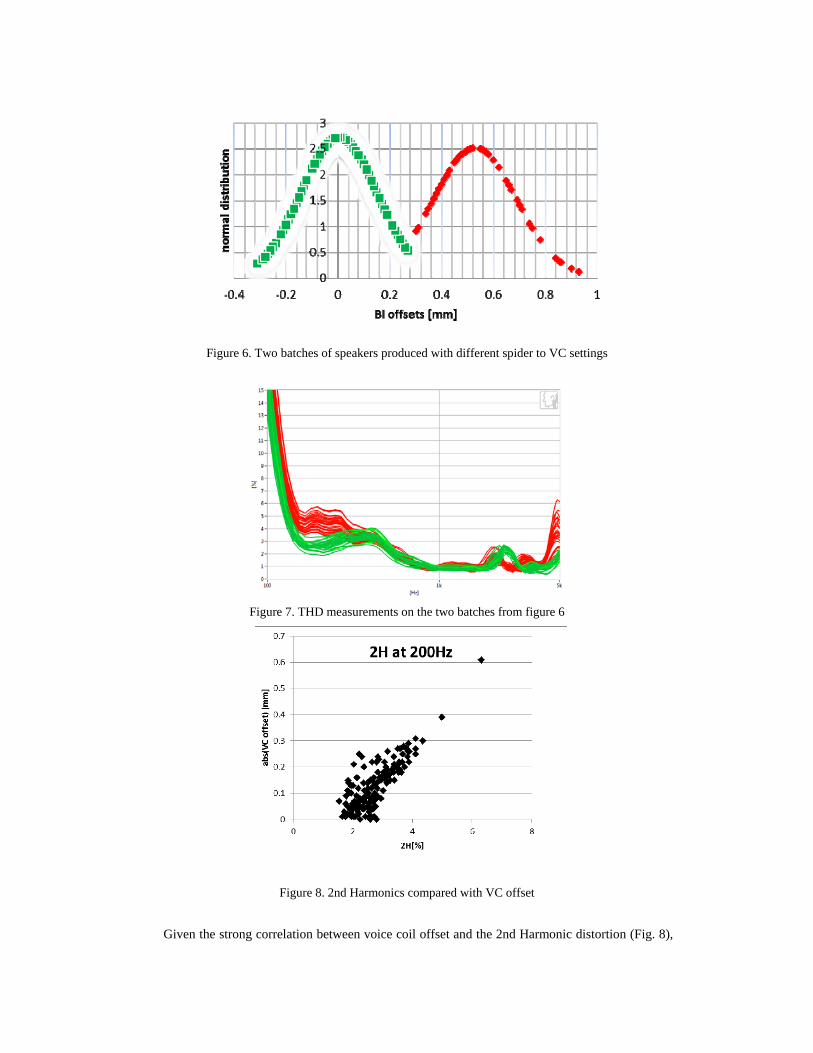
yellow curves show incorrect settings. Figure 7 shows the second harmonic measurement on these
two batches. It can be clearly seen how the second harmonic with the incorrect VC position is
different from the correct position, and would be easily identified during EOL test with appropriate
second harmonic limits.
It is not possible to correct these faults like adjusting the spider to VC position on the
manufacturing line. So it is better to just detect any problems and then further analyze and identify
the root cause offline where test time is not a huge factor.
Figure 6. Two batches of speakers produced with different spider to VC settings
Figure 7. THD measurements on the two batches from figure 6
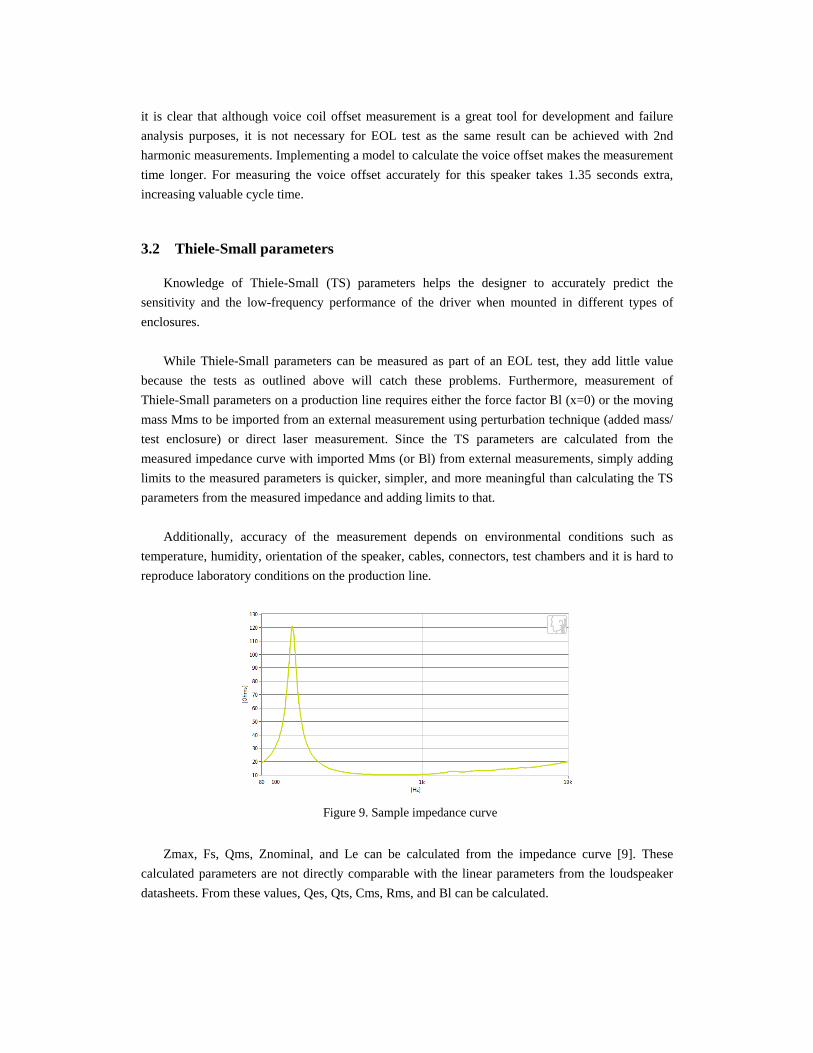
Figure 8. 2nd Harmonics compared with VC offset
Given the strong correlation between voice coil offset and the 2nd Harmonic distortion (Fig. 8),
it is clear that although voice coil offset measurement is a great tool for development and failure
analysis purposes, it is not necessary for EOL test as the same result can be achieved with 2nd
harmonic measurements. Implementing a model to calculate the voice offset makes the measurement
time longer. For measuring the voice offset accurately for this speaker takes 1.35 seconds extra,
increasing valuable cycle time.
3.2 Thiele-Small parameters
Knowledge of Thiele-Small (TS) parameters helps the designer to accurately predict the
sensitivity and the low-frequency performance of the driver when mounted in different types of
enclosures.
While Thiele-Small parameters can be measured as part of an EOL test, they add little value
because the tests as outlined above will catch these problems. Furthermore, measurement of
Thiele-Small parameters on a production line requires either the force factor Bl (x=0) or the moving
mass Mms to be imported from an external measurement using perturbation technique (added mass/
test enclosure) or direct laser measurement. Since the TS parameters are calculated from the
measured impedance curve with imported Mms (or Bl) from external measurements, simply adding
limits to the measured parameters is quicker, simpler, and more meaningful than calculating the TS
parameters from the measured impedance and adding limits to that.
Additionally, accuracy of the measurement depends on environmental conditions such as
temperature, humidity, orientation of the speaker, cables, connectors, test chambers and it is hard to
reproduce laboratory conditions on the production line.
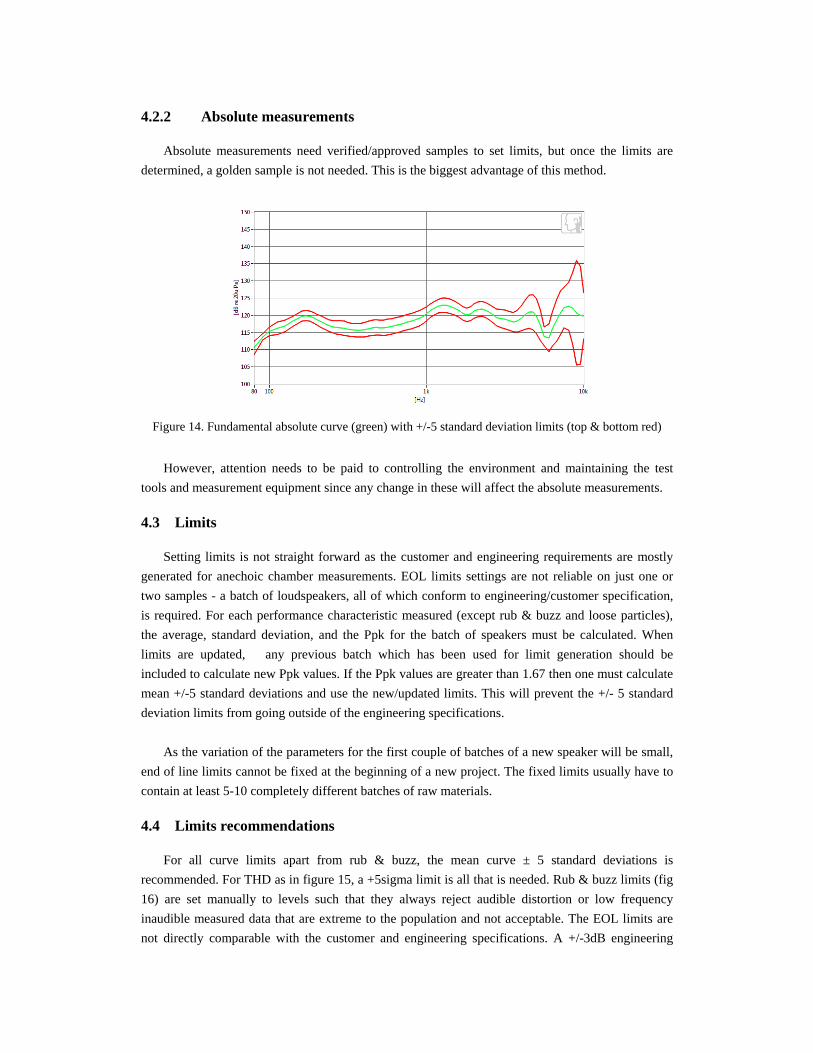
Figure 9. Sample impedance curve
Zmax, Fs, Qms, Znominal, and Le can be calculated from the impedance curve [9]. These
calculated parameters are not directly comparable with the linear parameters from the loudspeaker
datasheets. From these values, Qes, Qts, Cms, Rms, and Bl can be calculated.
4 Test Configuration: Stimuli, Reference Standards and Limits
4.1 Stimulus type and duration
It is recommended that speakers are measured with one high level stimulus. The level should be
the highest that the speakers can be expected to play, or at least the highest that will not destroy the
loudspeaker if it is measured without fully cured adhesives.
The test stimulus (fig. 10) should excite the loudspeaker over its useful frequency range, and if
required, it should cover the frequencies below the loudspeaker’s fundamental resonance frequency.
It is also a good idea to sweep from high to low frequencies rather than low to high, as this applies a
more gradual increase in power to the loudspeaker and reduces loudspeaker and measurement
settling time. Consequently a faster sweep can be used, reducing test time.
Figure 10. Listen Stweep™ parameters
The stimulus duration or averaging time at each frequency can also be adjusted to minimize the
effects of background noise by averaging longer at lower frequencies where there is typically more
background noise present (Fig. 4). An nth octave stepped sine sweep performs this nicely by
allowing the choice of how many cycles to measure at low frequencies and how long an averaging
time to measure at high frequencies. It can also be helpful to break-in the loudspeaker first by
playing a low frequency tone or pink noise before sweeping the sine wave (fig. 11). This warms up
the loudspeaker components, especially the voice coil and results in a more stable, realistic and
repeatable measurement.
Figure 11. Stimulus with pink noise and mixed test level and resolution stepped sine sweep
The length of the stimulus depends on the loudspeaker. Usually cycle time is within the 1 to 3
second range, with shorter times for smaller speakers and up to 3 seconds for a subwoofer. The
signal to noise ratio or confidence of the measurement (fig. 12) can be used to determine what the
minimum sweep duration needs to be for a given noisy factory environment.
Figure 12. Confidence limits (red), measurement (green) and standard error (yellow) for different sweep
time parameters
It is important to optimize the length of the sine sweep; if it is too fast or does not have enough
frequency resolution, problem areas such as high Q resonances causing distortion can be missed. The
best way to determine the minimum sweep duration is to measure first with a slow (24 cycles or
10ms averaging time), high resolution sweep such as 1/24th octave steps, then decrease the
averaging time while monitoring the measurement confidence. This is particularly important for
distortion measurements such as rub & buzz that require a wide dynamic measurement range.
Finally, decrease the frequency resolution and overlay it with the high resolution measurement on
the same graph to see if the speaker’s frequency response peak and dips are adequate.
Usually the majority of the loudspeaker test cycle time is due to loading and unloading the
loudspeaker, especially when this is done manually. This can be decreased by automatic positioning
and connections or measuring multiple speakers simultaneously.
4.2 Reference Standards and Limits
There are two common ways to make loudspeaker frequency response limits; comparison to a
reference standard (golden sample) or absolute measurements. Both of these measurements can
satisfy production test needs but there are trade-offs.
4.2.1 Relative measurement to a reference standard
Using this method, a ‘perfect’ sample is selected, and all measurements compared to this
speaker. The benefits of this method are that the test environment, temperature, humidity,
measurement chamber and test jigs have no influence on the measurements since they are all relative
to the reference standard speaker. Limits can be re-set from time to time. However, the reference
loudspeaker can drift over time, and after a while it becomes necessary to replace it with a new
reference loudspeaker. Attention must be paid to storing the samples and requalifying the samples
from time to time. This is not easy and therefore the biggest disadvantage to this method.
Figure 13. Fundamental relative to a golden unit with +/-5 standard deviation limit (top red) calculated
on the previously approved parts
The most important thing in this method is choosing the golden samples. Moreover, there are
some additional questions such as what makes a golden sample and how to handle the changes of the
golden sample? A batch of good loudspeakers can be measured and the speaker that comes closest or
best fits the mean is usually selected as the golden sample.
4.2.2 Absolute measurements
Absolute measurements need verified/approved samples to set limits, but once the limits are
determined, a golden sample is not needed. This is the biggest advantage of this method.
Figure 14. Fundamental absolute curve (green) with +/-5 standard deviation limits (top & bottom red)
However, attention needs to be paid to controlling the environment and maintaining the test
tools and measurement equipment since any change in these will affect the absolute measurements.
4.3 Limits
Setting limits is not straight forward as the customer and engineering requirements are mostly
generated for anechoic chamber measurements. EOL limits settings are not reliable on just one or
two samples - a batch of loudspeakers, all of which conform to engineering/customer specification,
is required. For each performance characteristic measured (except rub & buzz and loose particles),
the average, standard deviation, and the Ppk for the batch of speakers must be calculated. When
limits are updated, any previous batch which has been used for limit generation should be
included to calculate new Ppk values. If the Ppk values are greater than 1.67 then one must calculate
mean +/-5 standard deviations and use the new/updated limits. This will prevent the +/- 5 standard
deviation limits from going outside of the engineering specifications.
As the variation of the parameters for the first couple of batches of a new speaker will be small,
end of line limits cannot be fixed at the beginning of a new project. The fixed limits usually have to
contain at least 5-10 completely different batches of raw materials.
4.4 Limits recommendations
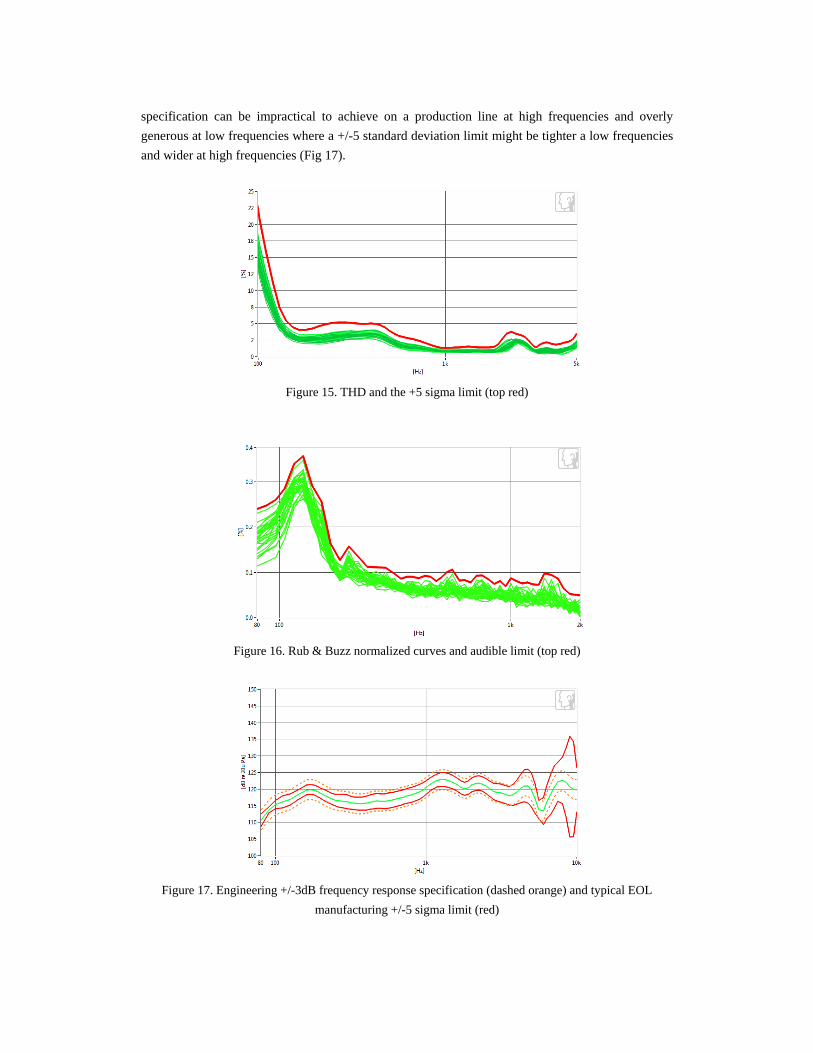
For all curve limits apart from rub & buzz, the mean curve ± 5 standard deviations is
recommended. For THD as in figure 15, a +5sigma limit is all that is needed. Rub & buzz limits (fig
16) are set manually to levels such that they always reject audible distortion or low frequency
inaudible measured data that are extreme to the population and not acceptable. The EOL limits are
not directly comparable with the customer and engineering specifications. A +/-3dB engineering
specification can be impractical to achieve on a production line at high frequencies and overly
generous at low frequencies where a +/-5 standard deviation limit might be tighter a low frequencies
Figure 17. Engineering +/-3dB frequency response specification (dashed orange) and typical EOL
manufacturing +/-5 sigma limit (red)
5 PROCESS CONTROL
5.1 Gage R&R
It is recommended is to carry out a MSA (measurement system analysis) study for all the
different loudspeakers which are measured on the test system, with at least 10 parts, measured 4
times in a row. It is important to make sure the speakers cools down to room temperature between
two consecutive measurements. Two parameters should be measured, one electrical and one
acoustical, for example nominal impedance and average sensitivity.
This method can give an insight into; Repeatability, Precision of repetition; Variation in the
average of measurements; within system variations, commonly referred to as EV (Equipment
Variation) and also as Cg (Gage Capability Potential). The evaluation has to be done based on the
defined tolerances.
5.2 Parts traceability
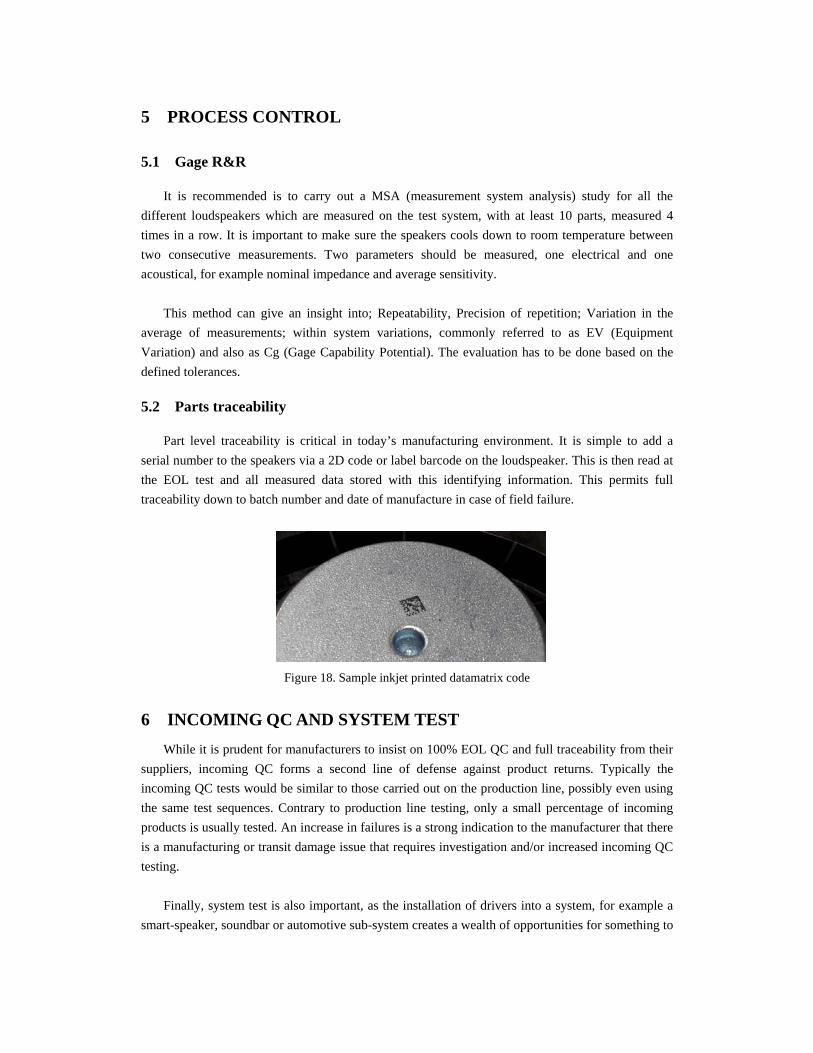
Part level traceability is critical in today’s manufacturing environment. It is simple to add a
serial number to the speakers via a 2D code or label barcode on the loudspeaker. This is then read at
the EOL test and all measured data stored with this identifying information. This permits full
traceability down to batch number and date of manufacture in case of field failure.
Figure 18. Sample inkjet printed datamatrix code
6 INCOMING QC AND SYSTEM TEST
While it is prudent for manufacturers to insist on 100% EOL QC and full traceability from their
suppliers, incoming QC forms a second line of defense against product returns. Typically the
incoming QC tests would be similar to those carried out on the production line, possibly even using
the same test sequences. Contrary to production line testing, only a small percentage of incoming
products is usually tested. An increase in failures is a strong indication to the manufacturer that there
is a manufacturing or transit damage issue that requires investigation and/or increased incoming QC
testing.
Finally, system test is also important, as the installation of drivers into a system, for example a
smart-speaker, soundbar or automotive sub-system creates a wealth of opportunities for something to
go awry, ranging from component damage to incorrect installation or vibration damage.
Furthermore, it is often desirable to test additional functionality of an audio system as a whole, for
example microphone arrays for voice controlled smart-speakers¬¬¬¬¬ and active noise cancellation
systems. The test configurations for these use the same basic equipment, but differ in their setup.
7 CONCLUSIONS
Efficient loudspeaker EOL quality control requires a well-designed test chamber and test jig to
keep background noise out and minimize vibration. A carefully optimized swept stepped-sine sweep
is required for a fast sweep without compromising resolution. Complex averaging and narrow band
filtering is required to help minimize background noises from contaminating the measurements or
masking the harmonics. Only the essential measurements such as frequency response, sensitivity,
polarity, total harmonic distortion, rub & buzz, loose particles, and impedance should be performed
to optimize test time while still catching any manufacturing defect. Smart limits based on statistics
and audibility such as perceptual rub & buzz need to be used to guarantee customer satisfaction.
REFERENCES
[1] S. Temme, "Why and How to Measure Distortion in Electroacoustic Transducers'', presented at the AES 11th Conference on Audio Test and Measurement, Portland, Oregon (29-31 May, 1992).
[2] S. Temme, P. Brunet, and D. B. (Don) Keele, “Practical Measurement of Loudspeaker Distortion Using a Simplified Auditory Perceptual Model,” presented at the AES 127th Convention, preprint 7905, (2009 October).
[3] P.Brunet, S.Temme, “Loose Particle Detection in Loudspeakers” AES 115th Convention, October 2003.
[5] David Clark, "Blat Distortion in Loudspeakers," DLC Design Note 950189. [6] S.Temme, T.Scott, “Advances in Impedance Measurement of Loudspeakers and
Headphones”, Presented at the AES135th Convention, New-York, 2013 October 17–20.
[7] W. Klippel, Joachim Schlechter; Fast Measurement of Motor and Suspension Nonlinearities in Loudspeaker Manufacturing, Audio Engineering Society Convention Paper 7903
[8] Harman International Ltd.; Internal documents by R.H. Small, S. Anthony, V. Dobos.
[9] Witold Waldman: Non-Linear Least squares estimation of Thiele-Small parameters from impedance measurements.