19
Evaluation of Benzene Fenceline Monitoring Program in USEPA’s Proposed Refinery Sector Rule By: Ted Bowie, Kimberly Wahnee, David Phong, and Idania Zamora
Evaluation of Benzene FencelineMonitoring Program in USEPA’s Proposed Refinery Sector RuleBy: Ted Bowie, Kimberly Wahnee, David Phong, and Idania Zamora
Overview of Refinery Source Category
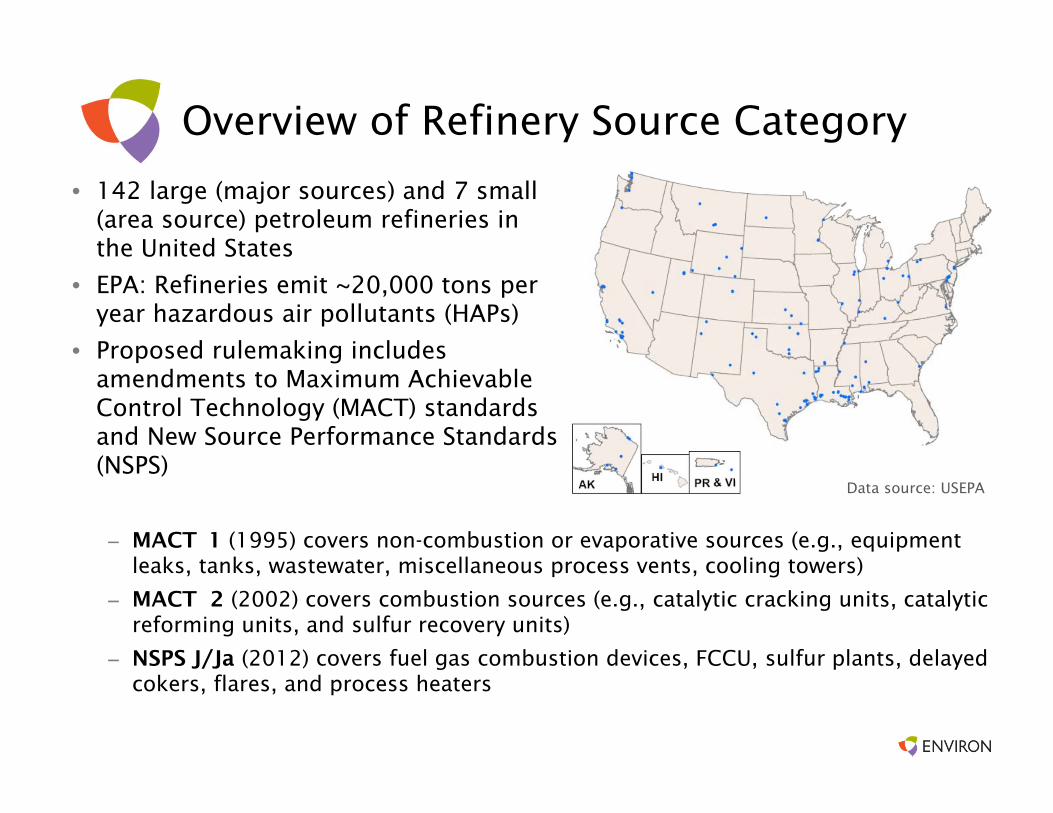
• 142 large (major sources) and 7 small (area source) petroleum refineries in the United States
• EPA: Refineries emit ~20,000 tons per year hazardous air pollutants (HAPs)
• Proposed rulemaking includes amendments to Maximum Achievable Control Technology (MACT) standards and New Source Performance Standards (NSPS)
– MACT 1 (1995) covers non-combustion or evaporative sources (e.g., equipment leaks, tanks, wastewater, miscellaneous process vents, cooling towers)
– MACT 2 (2002) covers combustion sources (e.g., catalytic cracking units, catalytic reforming units, and sulfur recovery units)
– NSPS J/Ja (2012) covers fuel gas combustion devices, FCCU, sulfur plants, delayed cokers, flares, and process heaters
Data source: USEPA
Overview of Proposed Rule
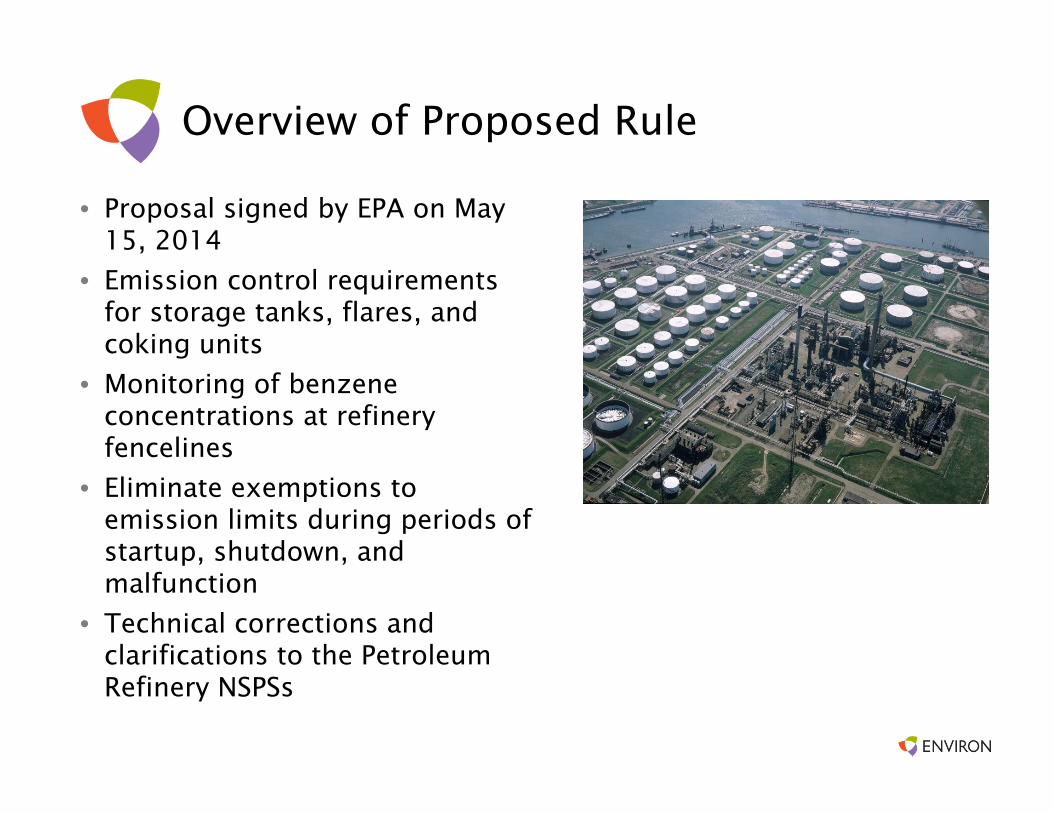
• Proposal signed by EPA on May 15, 2014
• Emission control requirements for storage tanks, flares, and coking units
• Monitoring of benzene concentrations at refinery fencelines
• Eliminate exemptions to emission limits during periods of startup, shutdown, and malfunction
• Technical corrections and clarifications to the Petroleum Refinery NSPSs
What Does EPA’s Residual Risk Analysis Show?
• Risk deemed to be “acceptable” under 112(f)
• Highest maximum individual risk (MIR) estimated at 60 in a million (actuals) and 100 in a million (allowables)– Highest MIR driven by naphthalene and benzene from equipment leaks
• Sector-wide population at risk greater than 1 in a million is predicted at 5,000,000– Cancer incidence of 0.3 cases/year driven by delayed cokers (DCU) and
PAHs
• Maximum chronic non-cancer HI of 0.9 due to emissions hydrogen cyanide from FCCU
• Maximum acute non-cancer HQ of 5 due to emissions of nickel from FCCU
• Proposed amendments estimated to lower population at risk to 4,000,000, and reduce incidence about 18%
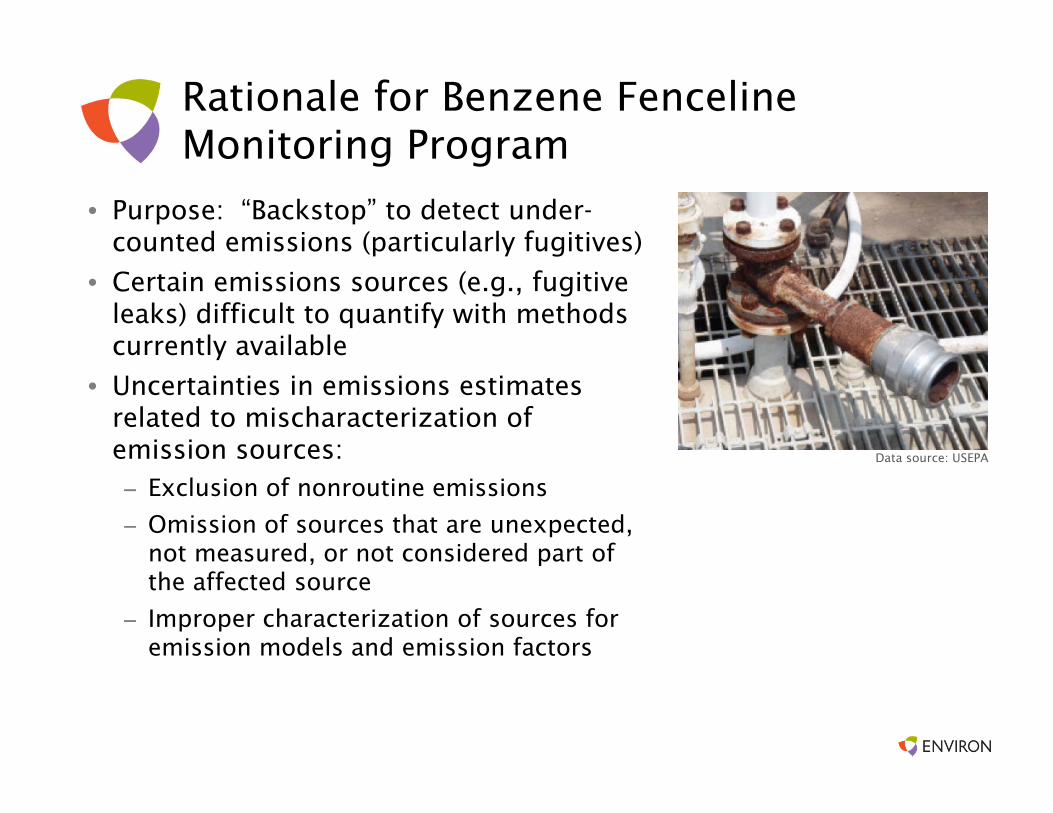
Rationale for Benzene FencelineMonitoring Program
• Purpose: “Backstop” to detect under-counted emissions (particularly fugitives)
• Certain emissions sources (e.g., fugitive leaks) difficult to quantify with methods currently available
• Uncertainties in emissions estimates related to mischaracterization of emission sources:– Exclusion of nonroutine emissions
– Omission of sources that are unexpected, not measured, or not considered part of the affected source
– Improper characterization of sources for emission models and emission factors
Data source: USEPA
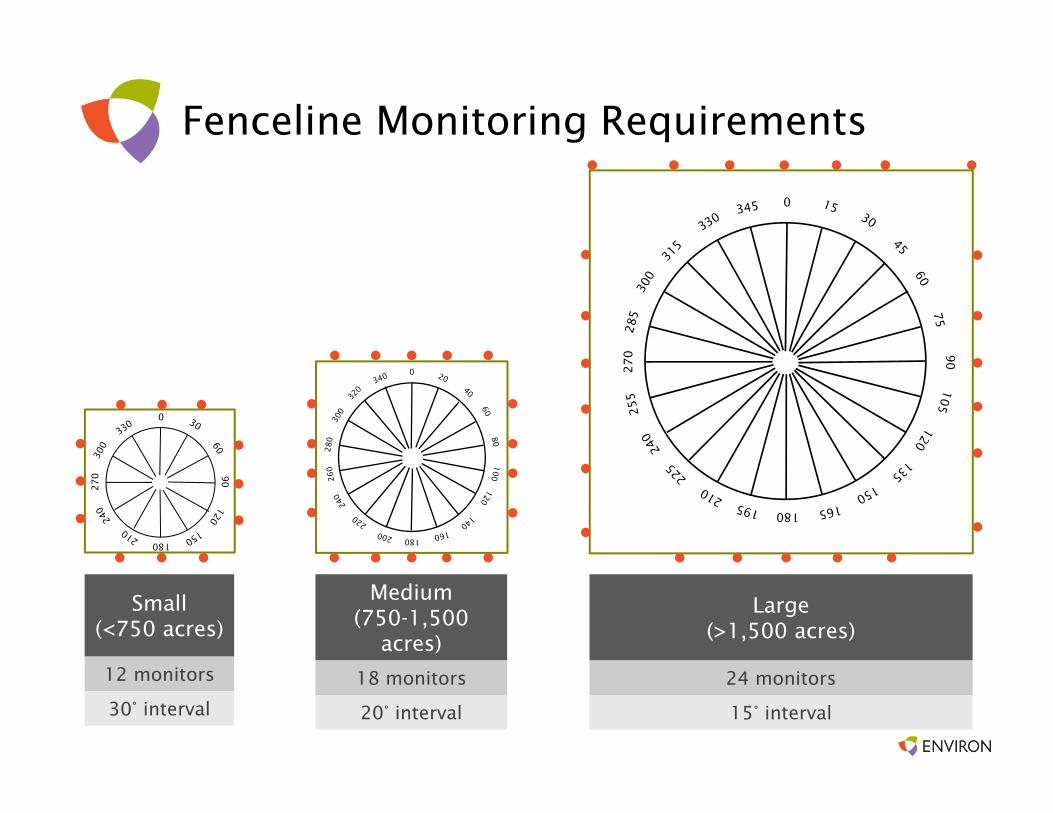
Fenceline Monitoring Requirements
Small (<750 acres)
12 monitors
30° interval
90
180
27
0
0
27
0
Medium (750-1,500
acres)
18 monitors
20° interval
Large(>1,500 acres)
24 monitors
15° interval
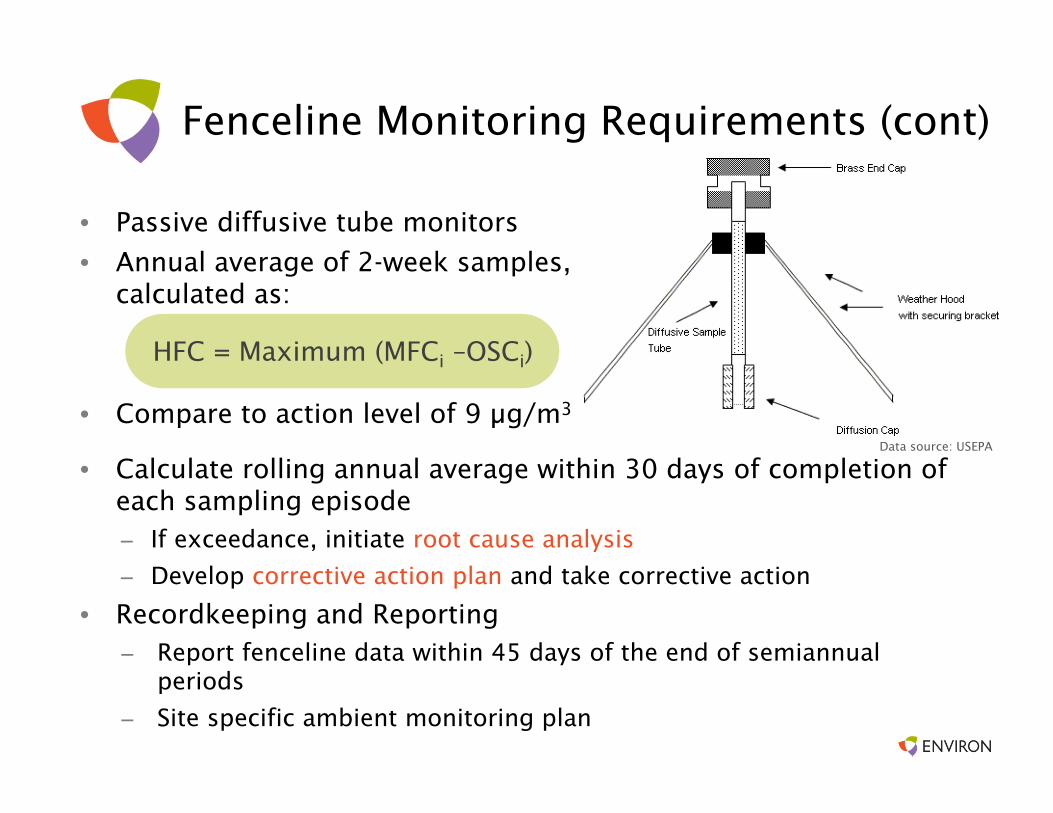
Fenceline Monitoring Requirements (cont)
• Passive diffusive tube monitors
• Annual average of 2-week samples, calculated as:
• Compare to action level of 9 μg/m3
• Calculate rolling annual average within 30 days of completion of each sampling episode– If exceedance, initiate root cause analysis
– Develop corrective action plan and take corrective action
• Recordkeeping and Reporting – Report fenceline data within 45 days of the end of semiannual
periods
– Site specific ambient monitoring plan
HFC = Maximum (MFCi –OSCi)
Data source: USEPA
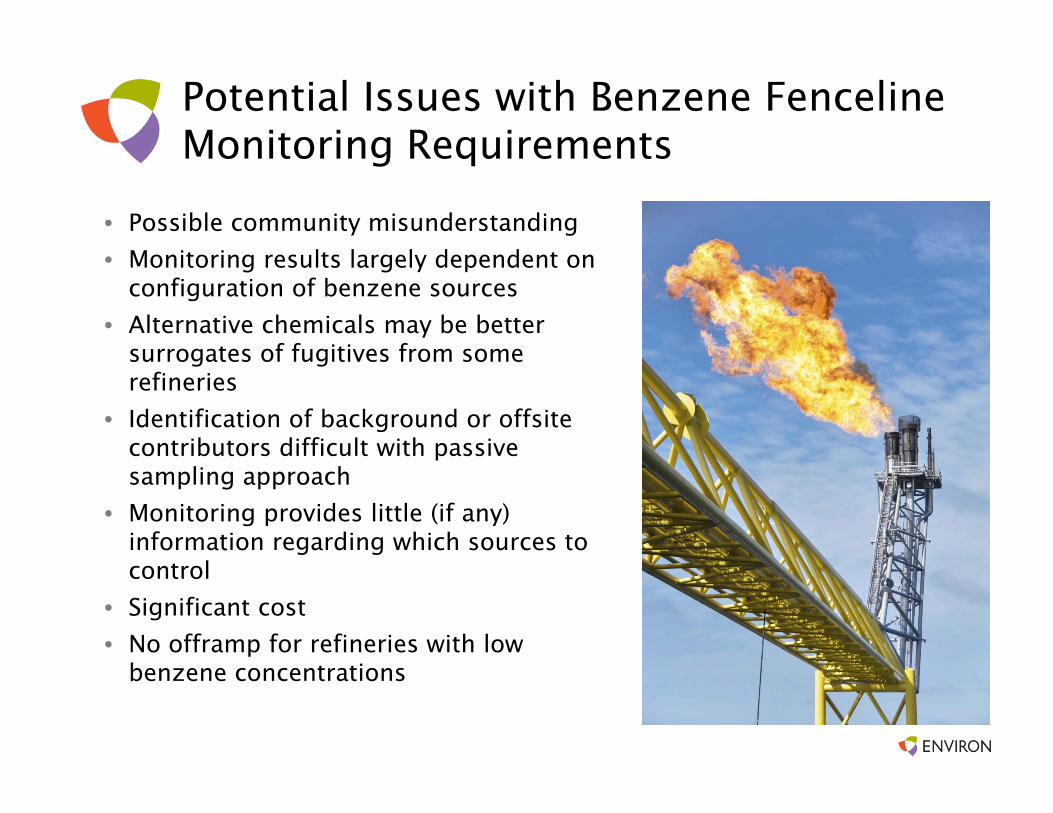
Potential Issues with Benzene FencelineMonitoring Requirements
• Possible community misunderstanding
• Monitoring results largely dependent on configuration of benzene sources
• Alternative chemicals may be better surrogates of fugitives from some refineries
• Identification of background or offsite contributors difficult with passive sampling approach
• Monitoring provides little (if any) information regarding which sources to control
• Significant cost
• No offramp for refineries with low benzene concentrations
Public Relations
• Fenceline concentrations are not representative of chronic risks, but some members of the public may misunderstand the data
• Stated purpose of benzene monitoring is to detect un-reported emissions, but…– Some might attempt to equate
benzene concentrations to risks
– Data will be publically available
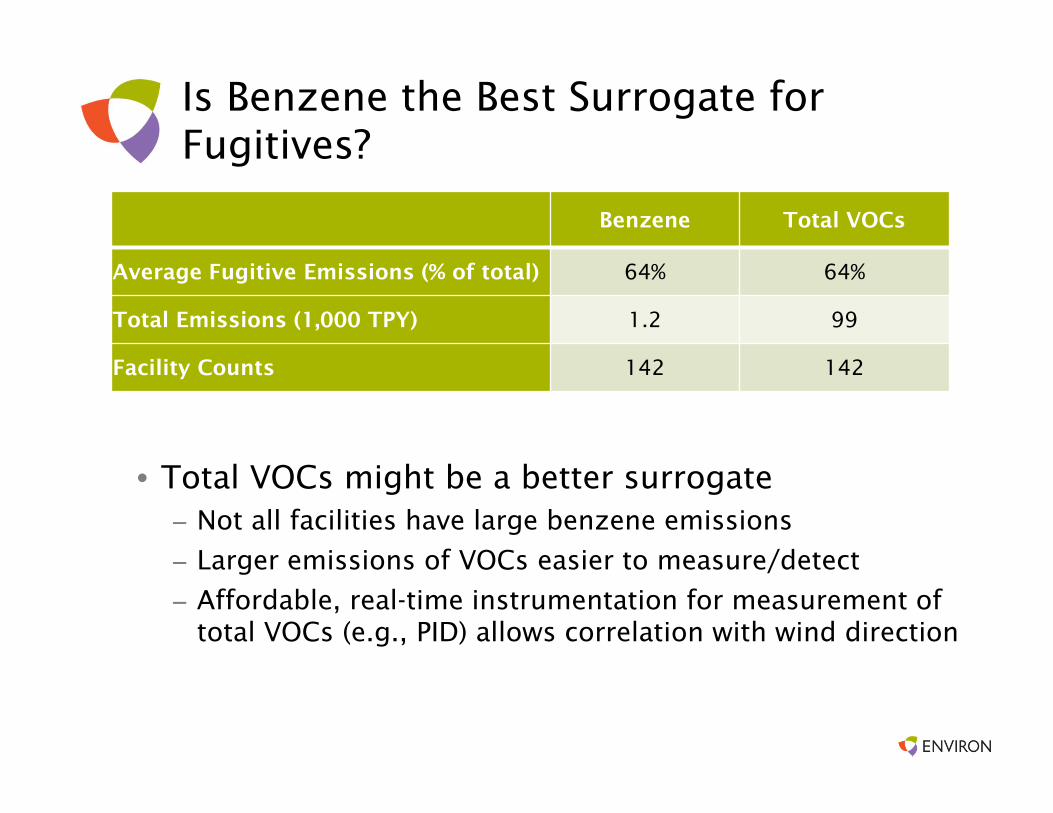
Is Benzene the Best Surrogate for Fugitives?
• Total VOCs might be a better surrogate– Not all facilities have large benzene emissions
– Larger emissions of VOCs easier to measure/detect
– Affordable, real-time instrumentation for measurement of total VOCs (e.g., PID) allows correlation with wind direction
Benzene Total VOCs
Average Fugitive Emissions (% of total) 64% 64%
Total Emissions (1,000 TPY) 1.2 99
Facility Counts 142 142
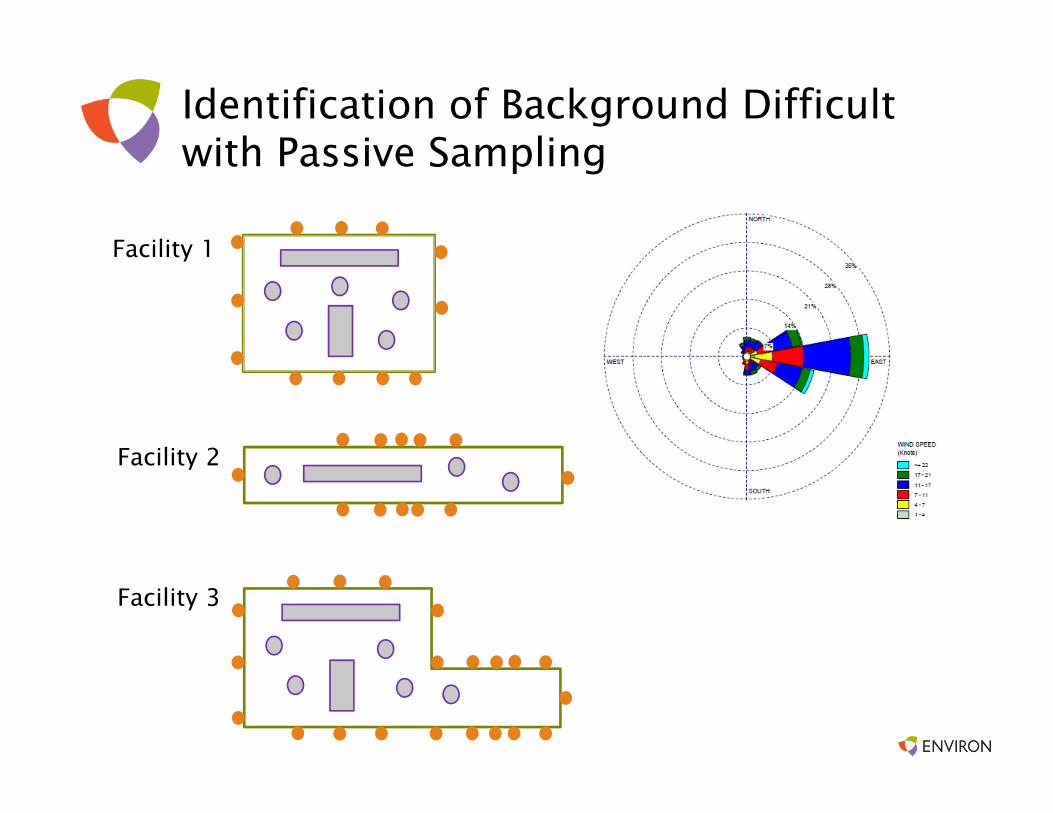
Identification of Background Difficult with Passive Sampling
Facility 1
Facility 2
Facility 3
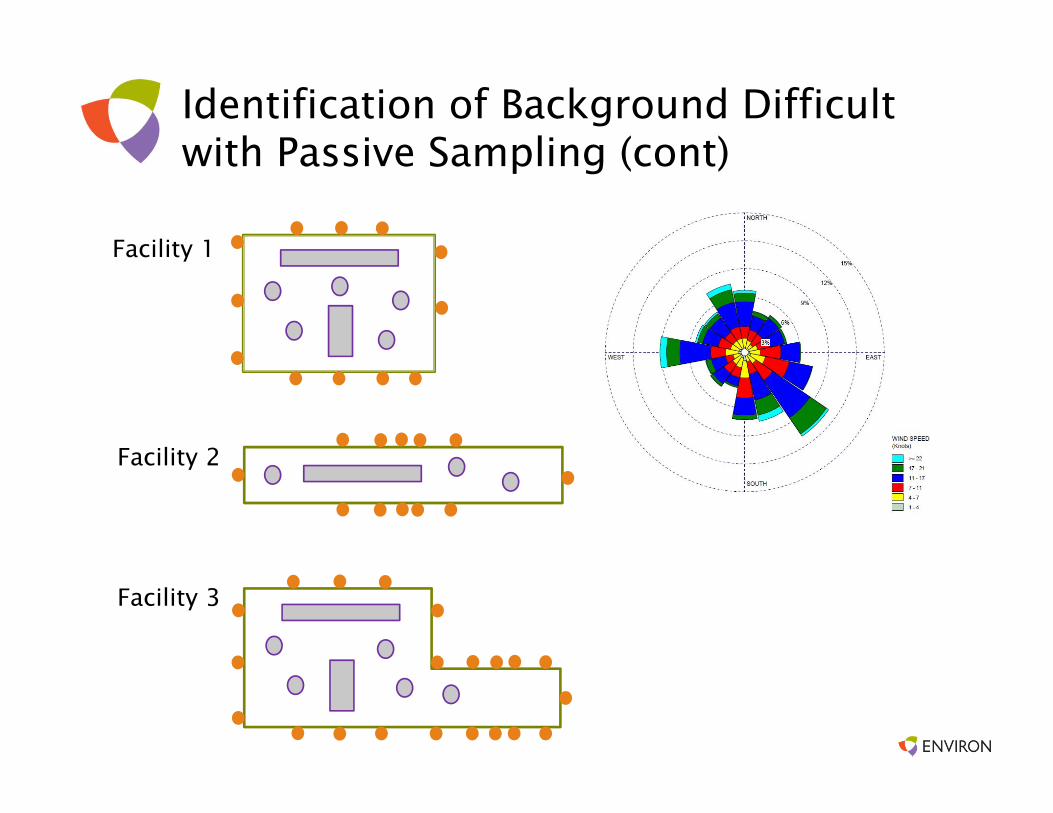
Identification of Background Difficult with Passive Sampling (cont)
Facility 1
Facility 2
Facility 3
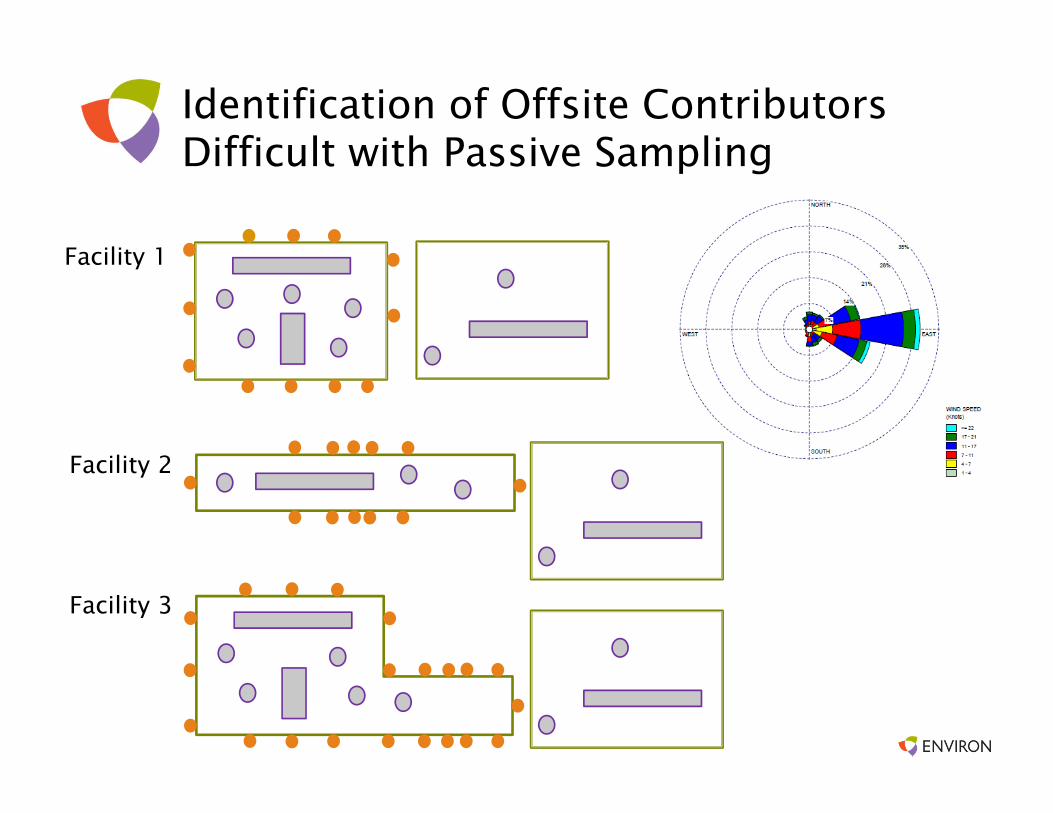
Identification of Offsite Contributors Difficult with Passive Sampling
Facility 1
Facility 2
Facility 3
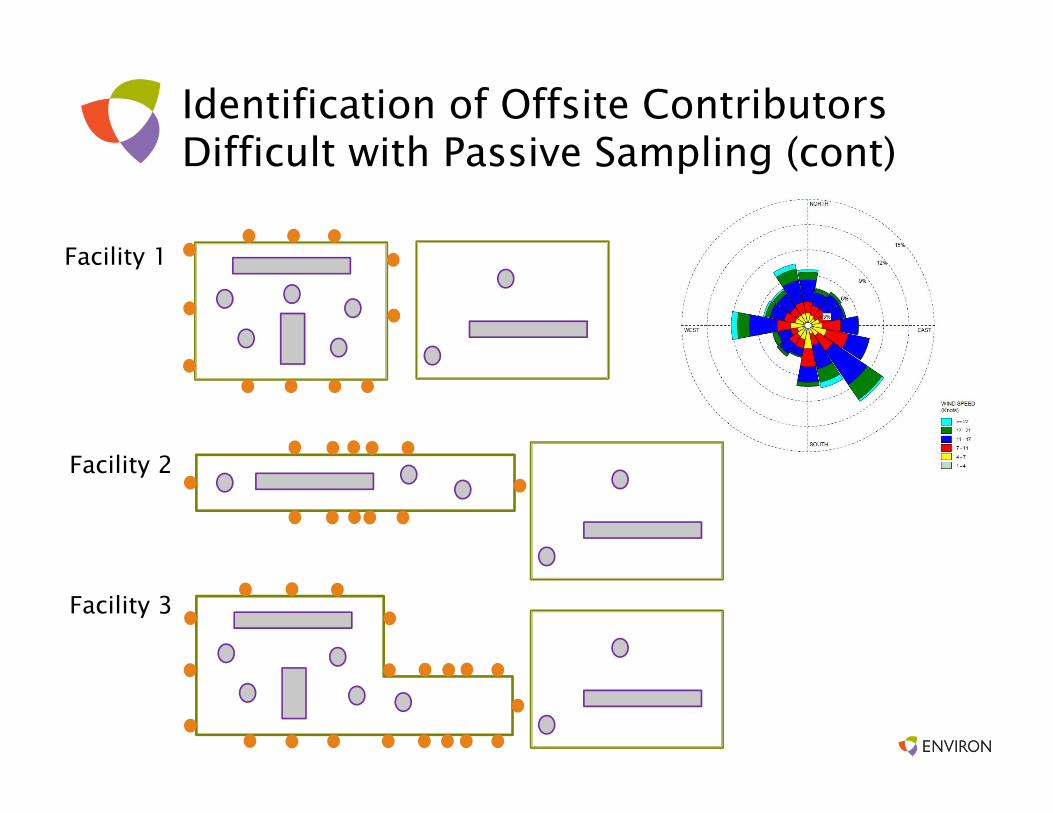
Identification of Offsite Contributors Difficult with Passive Sampling (cont)
Facility 1
Facility 2
Facility 3
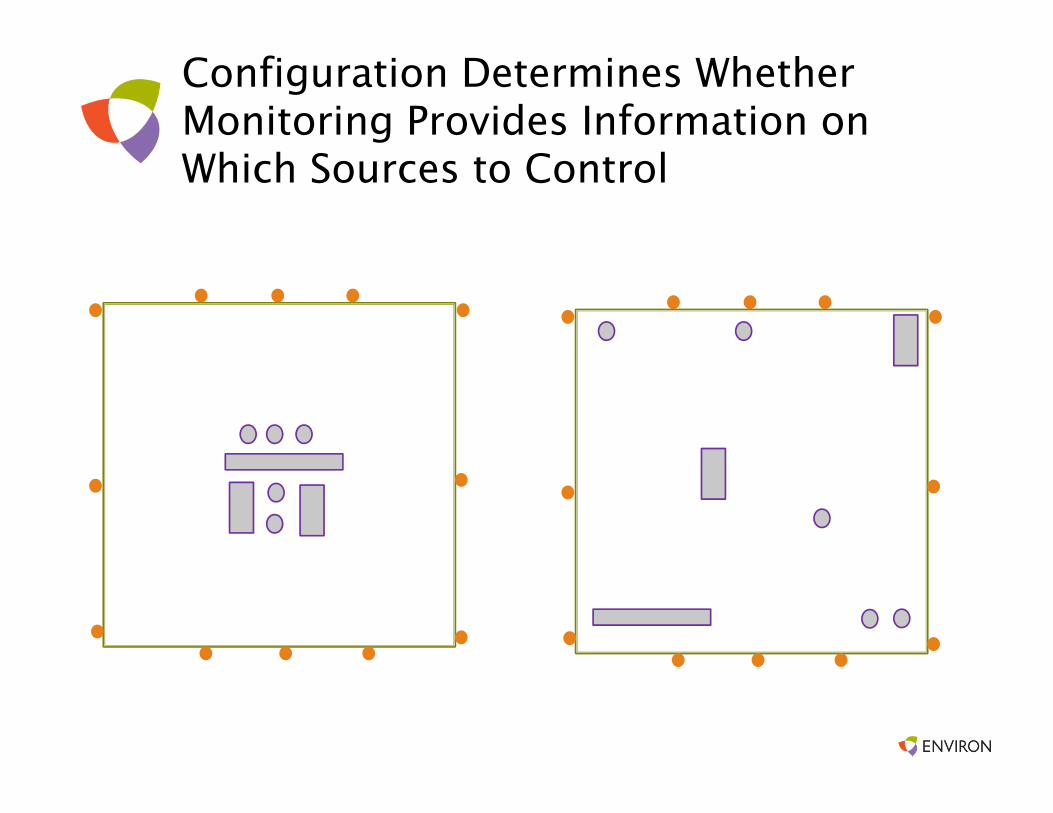
Configuration Determines Whether Monitoring Provides Information on Which Sources to Control
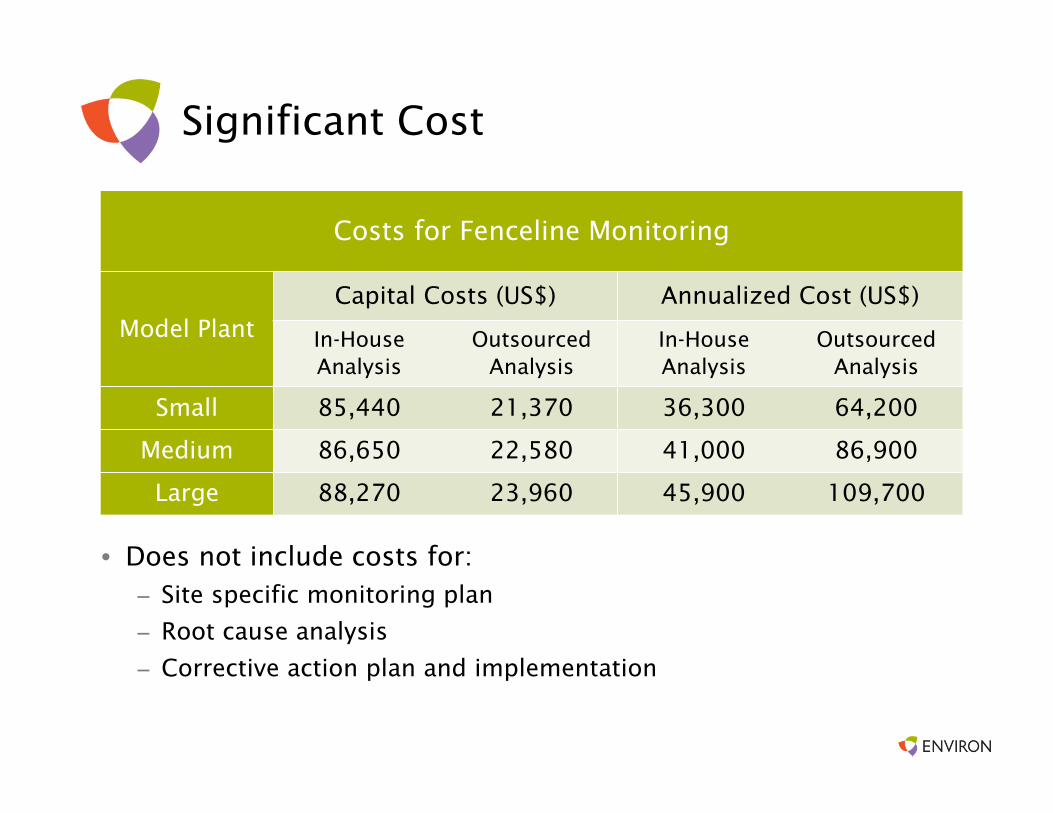
Significant Cost
Costs for Fenceline Monitoring
Model PlantCapital Costs (US$) Annualized Cost (US$)
In-House Analysis
Outsourced Analysis
In-House Analysis
Outsourced Analysis
Small 85,440 21,370 36,300 64,200
Medium 86,650 22,580 41,000 86,900
Large 88,270 23,960 45,900 109,700
• Does not include costs for:– Site specific monitoring plan
– Root cause analysis
– Corrective action plan and implementation
Strategies to Overcome Program Limitations
• Conduct dispersion modeling– Identify which sources are
driving benzene concentrations
– Identify benzene “hot spots”
• Perform meteorological data analysis– Determine if winds are consistent, or if diurnal or seasonal
variations are present
– Identify which monitors are upwind and downwind (if possible)
Strategies to Overcome Program Limitations (cont)
• Consider additional monitors– Offsite monitors can help tease
out background and offsite sources
– Onsite monitors can help identify larger fugitive sources (e.g., LDAR)
• Consider focused real-time monitoring – Determine if concentrations due to onsite or offsite sources
– Identify and correct problems quicker than with passive approach
– Options range from simplistic (e.g., PID) to more sophisticated (e.g., UV-DOAS)

Questions?
Ted Bowie, MS, PE, CIHENVIRON International Corporation
San Francisco, California


