Evaluation of Best Management Practice (BMP) Effectiveness Final Report State Water Resources Control Board Agreement No. 02-113-254-0 Deliverable 7.1 Steven Bay Jeffrey Brown Southern California Coastal Water Research Project 7171 Fenwick Lane, Westminster, California 92683 December 16, 2005
Transcript
Evaluation of Best Management Practice (BMP) Effectiveness
Final Report
State Water Resources Control Board Agreement No. 02-113-254-0
Deliverable 7.1
Steven Bay Jeffrey Brown
Southern California Coastal Water Research Project 7171 Fenwick Lane, Westminster, California 92683
December 16, 2005
i
Acknowledgements
This study could not have been completed without the assistance of many organizations and individuals that provided access to the BMPs, samples, or data. The authors thank Suzanne Dallman (L.A. & San Gabriel Rivers Watershed Council) and Fereidoun Jahani (LADPW) for providing the chemistry data and samples for toxicity from the L.A. metal recycling yard and South Pasadena sites, respectively. The authors also thank Stephen Lyon (OCWD) for his collaboration on the SSF dosing experiment, Nancy Palmer (City of Laguna Niguel) for access and information for the Wet CAT site, and Angie Bera (Santa Monica Baykeeper) for access and sampling assistance at the BC120 site. We also thank Neal Shapiro, Jamie Malpede, and Louis Hernandez (City of Santa Monica) for access to and information regarding the Pico-Kenter and SMURRF sites. Thanks to Bob Stearns (CalScience) for sample distribution of the L.A. metal recycling yard samples. We also wish to thank SCCWRP staff Darrin Greenstein, Diana Young, Brian Pauley, and Rebecca Hagstrom for their assistance with toxicity testing and quality assurance. This project was funded by California State Water Resources Control Board Agreement Number 02-113-254-0.
ii
Table of Contents Acknowledgements........................................................................................................................ i Introduction ...................................................................................................................................1 Project Assessment ......................................................................................................................2
Attainment of goals....................................................................................................................2 Attainment of objectives ............................................................................................................2 Project deliverables ...................................................................................................................3 Challenges to project completion ..............................................................................................3 Recommendations ....................................................................................................................4
Study Design .........................................................................................................................6 Sampling Methods .................................................................................................................8 Chemical Analysis .................................................................................................................9 Toxicity Testing....................................................................................................................10 Data Analysis.......................................................................................................................10
Results ....................................................................................................................................12 Changes in Toxicity .............................................................................................................12 Effectiveness of Metals Removal.........................................................................................13 Effectiveness of Pesticides Removal...................................................................................14 Effectiveness of TSS Removal ............................................................................................14 Tiered Evaluation of BMP Effectiveness..............................................................................15
Discussion ...............................................................................................................................15 Comparison to the International Stormwater Database.......................................................16 Research Needs ..................................................................................................................17
Literature Cited........................................................................................................................18
1
Introduction Urban and agricultural discharges have contributed to degraded water quality throughout southern California. For example, more than 150 sites are on the state’s list of impaired waterbodies in southern California. As a result, runoff management agencies are implementing various Best Management Practices (BMPs) to reduce or eliminate these water quality impairments. The BMPs are extremely varied and may include public education, installation of treatment facilities/devices, the routing of runoff through grassy/wetland habitats, or diversion to sanitary sewers to reduce or remove constituents of concern such as trash, nutrients, or toxic constituents. There are several issues that make evaluating BMP effectiveness challenging. One challenge is that BMP effectiveness must be differentiated from variability. This includes variability in discharge characteristics, sample collection, and analysis. Second, because BMPs tend to perform better with higher concentrations of contaminants in the inflow, the removal effectiveness can be under-estimated if the inflow concentrations are very low. Third, large reductions in contaminant levels do not necessarily imply effectiveness, if concentrations in the effluent are still above the levels of protection. Fourth, the approaches used to evaluate effectiveness are not consistent among studies. Common approaches have included calculating the percent reduction either between the study mean inflow and outflow concentrations, or the mean of individual event percent reductions, or between inflow and outflow mass. More recently, effectiveness has been estimated using hypothesis testing (e.g., ANOVA), probability plots, linear regression, and threshold approaches (e.g., compare effluent concentrations with water quality criteria). Each method can give a different measure of effectiveness. Previous studies have examined the effectiveness of BMPs in southern California. The study conducted by Caltrans is one of the most comprehensive BMP evaluations (Caltrans 2004). Using the linear regression approach for evaluation, the Caltrans study determined that BMPs which use infiltration or sand filtration technologies were some of the most effective for reducing levels of TSS, total nutrients and total metals. Data from this and other studies from southern California have been included in the International Stormwater BMP Database (Strecker et al. 2004). This database contains inflow and outflow contaminant concentrations for a variety of BMPs in order for users to assess removal effectiveness, determine the achievable water quality values for effluents, and predict changes in mass loadings for the different BMP types. The data in the International Stormwater Database and the Caltrans study, however, do not include direct measures of BMP effectiveness regarding toxicity. While information on chemical constituents is usually included in BMP effectiveness studies, information on changes in toxicity is comparatively lacking. Toxicity to aquatic life from urban runoff discharges is frequently detected. Aquatic toxicity has been measured in waterbodies such as Ballona Creek, Santa Monica Bay, Los Angeles River, Santa Ana River, San Diego Creek, Newport Bay, Chollas Creek, and San Diego Bay. Because of the many chemical constituents found in runoff, measuring a routine suite of chemicals alone does not give a complete assessment of changes made by the BMP. Including measures of toxicity can improve the evaluation of BMP effectiveness because toxicity tests help account for unmeasured contaminants, they incorporate the additive and antagonistic interactions of chemicals, and they are direct measures of effect.
2
The goal of this project was to assess the effectiveness of BMPs in southern California for improving water quality impacts related to toxicity. Four objectives were established for the project. The first objective was to identify range of potential BMP technologies and sites that were suitable for inclusion in the project. The second objective was to establish cooperative monitoring agreements with the agencies maintaining the BMPs so that the project funds could be used to analyze the largest number of samples possible. The third objective was to obtain multiple samples from each BMP site over a two-year period. The final objective was to measure toxicity, pesticides, and dissolved metals in each of the samples. This report is organized into two sections: Project Assessment and Project Summary. The Project Assessment includes an evaluation of the success of the project in attaining its goals and objectives; this section also provides recommendations for future investigations. The Project Summary includes a description of the key findings of the study and provides supporting information for the Project Assessment. A more detailed presentation of the results is contained in the BMP assessment report, which was submitted previously (Deliverable 6.2).
Project Assessment Attainment of goals This project was successful in attaining its goal of assessing the effectiveness of BMPs in regards to reducing impacts from toxics. Five different BMP strategies were investigated: instream wetland, subsurface flow wetland, continuous deflection separation, screening/microfiltration/UV treatment, and screening/settlement. Upstream and downstream samples were collected from each of these sites and analyzed for parameters relevant to assessing water quality impacts from toxics. Not all types of BMPs were able to be included in the study, however. Most of the BMPs included in this study were designed to treat primarily dry weather flows. In addition, some BMP strategies, such as detention basins or the use of chemical sorbents, could not be included in the study for logistical reasons. Attainment of objectives All of the project’s four objectives were accomplished, as described below:
• Identify range of potential BMP technologies and sites. We developed a list of candidate BMP types with the assistance of a planning group that included the LA Regional Board, SCCWRP, LA and San Gabriel Rivers Watershed Council, Santa Monica Bay Restoration Commission, City of Santa Monica, Los Angeles Department of Public Works, County of Orange, and Orange County Water Department. The planning provided information on existing BMP sites, type of treatment, and collaboration opportunities. The recommendations of the planning group were used to help select the sites used for the project.
• Establish cooperative monitoring agreements with other agencies. SCCWRP collaborated with six other agencies for sample collection or analysis during this study. This high level of collaboration was essential to enabling this study to be completed as designed. For example, all sample collection activities and most of the chemical analyses at two of the study sites were contributed by the collaborating agencies. In
3
other cases, the collaborating agencies provided access to the site or the use of facilities for sample collection. It would have only been feasible to study a much smaller number of sites and samples without the support of these other agencies.
• Obtain multiple samples from each BMP site over a two-year period. This objective was partially accomplished. Four or five sampling events were successfully conducted at each site, and all samples were obtained within a one-year period. The original project scope of work intended to conduct 5-8 sampling events over a two-year period. Two factors contributed to the change in sampling effort: time and funding. Completion of administrative activities related to the contract and QAPP took longer that expected. As a result, only one year of sampling could be accomplished within the completion date of the project. The per sample analysis costs were also higher than anticipated because many of the sites had no ongoing monitoring program. As a result, additional costs were incurred for sample collection and analysis that reduced the number of samples that could be analyzed.
• Measure toxicity, pesticides, and dissolved metals in each of the samples. This objective was met for the majority of the samples. Each of the samples was analyzed for toxicity and dissolved metals. Pesticides were not measured in some of the samples from two sites where the analyses were being conducted by a collaborating agency. These agencies had different analytical suites and it was not possible to obtain the pesticide data. Pesticides were also not measured in samples from the sub-surface wetland because these compounds were known to be absent in the experimental system.
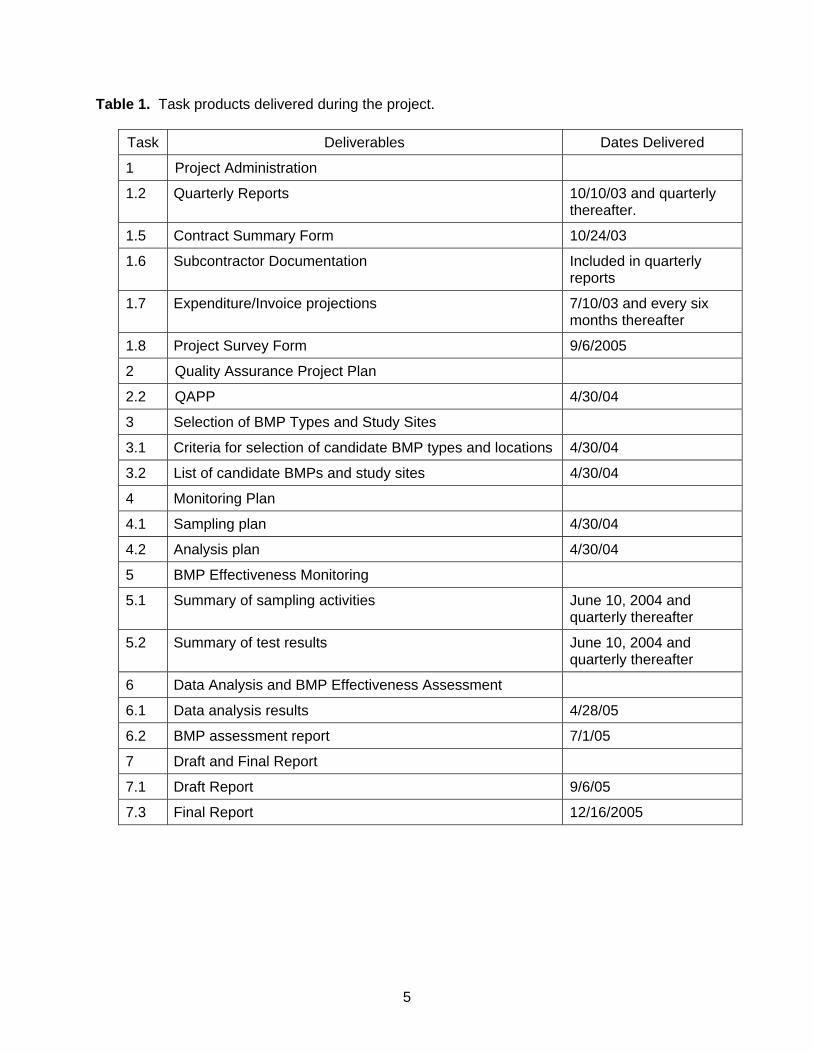
Project deliverables Sixteen types of deliverables were planned for this project. All of the deliverables have been submitted. A summary of the items and submittal dates is shown in Table 1. Challenges to project completion In general, this project was very successful in accomplishing its objectives. Several types of challenges were encountered during the project that complicated completion of the project or completion of the work, however. The first type of challenge was caused by administrative procedures that are part of the contract management process. Delays of nearly a year were associated with preparation of a final scope of work and QAPP. The format and level of detail needed for these activities were not fully described prior to the start of the project. Thus, the time and labor allowances for these administrative activities were inadequate, which resulted in project delays. Due to the fixed completion date of the contract, the result of these delays was to shorten the time available for sampling and analysis. The second challenge to the project involved coordination with the various collaborating agencies. While such collaboration was essential to the completion of this project, the involvement of other agencies complicates activities such as sample collection and testing. For example, different strategies were used for collection and analysis of storm event samples at the South Pasadena and LA metal recycling yard sites. These variations have the potential to affect the comparability of the data among BMP sites. These variations were not considered to seriously affect the utility of the data for the purposes of this study, however, because the primary evaluations were made between upstream and downstream samples within a site. Use of these data in the future for other types of comparisons may be limited by such variations.
4
The final challenge to project completion was related to unplanned events affecting sample collection. Any type of field sampling is subject to disruption due to unanticipated weather conditions or equipment malfunctions. Some of these situations occurred during this project, which affected some of the analyses. For example, completion of the BMP installation at the BC120 site was delayed by several months. As a result, we were unable to collect as many samples from the BC120 site as was originally planned. In another case, weather and scheduling conflicts delayed sampling at several sites in November 2004. These delays then resulted in a scheduling conflict with the toxicity testing laboratory, which required a modification to the analyses. In general, the schedule-related factors did not seriously compromise the success of this project. Recommendations This study has contributed to our understanding of the effectiveness of several types of BMPs for improving the water quality of urban runoff. Limitations in the duration and scope of this study were present, however, and additional investigation is needed to gain a better understanding of BMP effectiveness. Several recommendations for continuing and improving the study of BMP effectiveness are described below.
• Investigate other BMP technologies, especially those designed to treat toxics
• Conduct further evaluations of wetland treatment systems
• Increase the number of samples analyzed for selected BMP types
• Improve coordination among collaborating agencies
• Emphasize systems applicable to treating stormwater
• Focus efforts on sites with degraded water quality
5
Table 1. Task products delivered during the project.
Task Deliverables Dates Delivered
1 Project Administration
1.2 Quarterly Reports 10/10/03 and quarterly thereafter.
1.5 Contract Summary Form 10/24/03
1.6 Subcontractor Documentation Included in quarterly reports
1.7 Expenditure/Invoice projections 7/10/03 and every six months thereafter
1.8 Project Survey Form 9/6/2005
2 Quality Assurance Project Plan
2.2 QAPP 4/30/04
3 Selection of BMP Types and Study Sites
3.1 Criteria for selection of candidate BMP types and locations 4/30/04
3.2 List of candidate BMPs and study sites 4/30/04
4 Monitoring Plan
4.1 Sampling plan 4/30/04
4.2 Analysis plan 4/30/04
5 BMP Effectiveness Monitoring
5.1 Summary of sampling activities June 10, 2004 and quarterly thereafter
5.2 Summary of test results June 10, 2004 and quarterly thereafter
6 Data Analysis and BMP Effectiveness Assessment
6.1 Data analysis results 4/28/05
6.2 BMP assessment report 7/1/05
7 Draft and Final Report
7.1 Draft Report 9/6/05
7.3 Final Report 12/16/2005
6
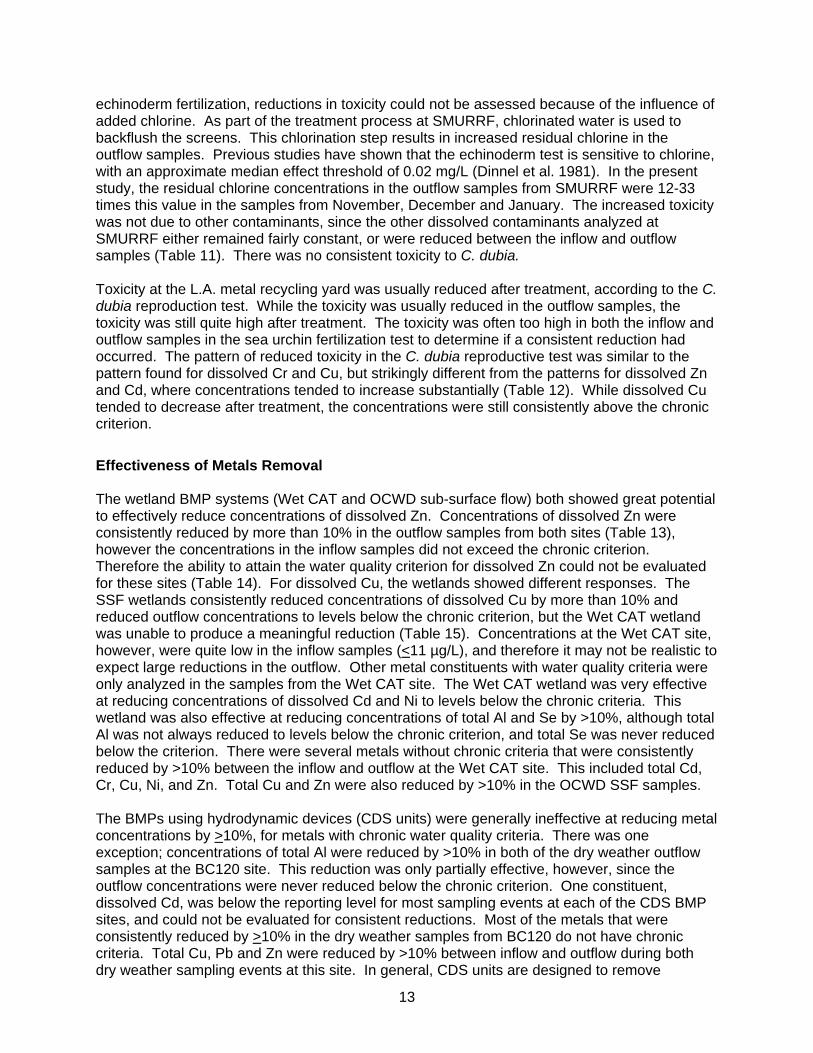
Project Summary Methods Study Design Seven BMP sites representing five BMP technologies were assessed for their effectiveness to reduce contaminant concentrations and toxicity (Figure 1). The five BMP technologies included wetlands, hydrodynamic devices [e.g., continuous deflection separation (CDS) units], microfiltration, UV treatment, and screening/settlement. Four to five sampling events were conducted at each site (Table 2). Samples were collected both before and after the BMP treatment process in order to evaluate the effectiveness of each BMP system. Paired inflow/outflow samples of dry weather or stormwater runoff were collected between 2/2/04 and 3/10/05. Two sites were sampled only during storm events, and three sites were sampled only during dry weather flow. One other site was sampled during both storm and dry weather events. Finally, one site was experimentally dosed with a mixture of Cu, Zn, and diazinon over a six week period. Time-weighted composite samples were collected at most BMP sites, with multiple grabs collected and composited at two of the sites. Most of the data in this study were collected specifically for this investigation, however some of the data were obtained from other monitoring programs. Differences in the constituents analyzed among the various sites reflected differences in study design among the monitoring programs (Table 3). Samples from most sites were analyzed for metals, organophosphorus pesticides, pyrethroid pesticides, glyphosate (active ingredient in Roundup and Rodeo), and toxicity (echinoderm fertilization test, and Ceriodaphnia dubia survival and reproduction test). The fact that this was a collaborative effort was the main reason why not all sites were monitored for both dry and wet weather flow; most sites were either not operated or not monitored by the managing agency during both dry and wet weather conditions, or the site did not receive both types of flow. The cost of sample analysis and the project timing was the other reason.
Wetlands Wet CAT (wetland) The Wetland Capture and Treatment network (Wet CAT) was designed to treat low-flow urban runoff from a residential neighborhood in the Aliso Creek watershed. While there are three distinct wetlands in the Wet CAT network, this study focused on the largest one, known as the West wetland. The West wetland is a 1.4 acre, ½ mile long parcel of land on the west side of Alicia Parkway in Laguna Niguel. It is located on privately-owned common-area property, and maintained by the City of Laguna Niguel. The West wetland treats 317 acres of exclusively urban runoff. It is designed to treat flows of approximately 0.2 cfs, with measured flows at 0.15 cfs in the summer and 0.12 cfs in the fall of 2003. The hydraulic residence time is 3 days. Effluent from the West wetland leads to Sulphur Creek, then to Aliso Creek. Only dry weather runoff samples from the Wet CAT site were collected for this study. Samples were collected at the head of the wetland, and as the water left the wetland. OCWD (sub-surface flow constructed wetland) The other wetland BMP in this study was the Orange County Water Department’s sub-surface flow (SSF) constructed wetlands, located next to OCWD’s Field Research Laboratory near Anaheim Lake. These wetlands measure approximately 1 m tall x 2 m wide x 8 m long, and are
7
constructed from concrete panels. Each wetland cell is filled with ¾” pea gravel. A monoculture of wetland plants (bulrushes, genus Scirpus) are planted in the gravel. The gravel provides an approximate thousand-fold increase in surface area for the growth of bacterial biofilms that increase the rate of contaminant degradation or removal. Within the gravel matrix there are distinct oxygen rich (aerobic) and oxygen free (anaerobic) zones where specific microbial processes take place. Water flows beneath the surface of the gravel matrix. The source water for the wetlands comes from Conrock Basin, which receives wet and dry weather flow from the Santa Ana River. The advantages of sub-surface flow wetlands are less land area required for a system, the elimination of vector problems and viable operation in winter. The wetland cells were constructed in 2002. This was the only BMP in this study that was experimentally dosed with contaminants. Two replicate wetland cells were used in this study. Each cell was continuously dosed with a mixture of Cu, Zn, and diazinon and monitored over a six week period. The nominal concentrations flowing into each cell were 30 µg/L Cu, 60 µg/L Zn, and 0.4 µg/L diazinon. Concentrations of each contaminant were measured in the influent and effluent from each replicate system over five sampling periods. The samples were also analyzed for toxicity using the sea urchin fertilization test. The flow rate for the source water from Conrock Basin was maintained at 4 L/min. Two stock solutions (one for Cu and Zn, and one for diazinon) were made up, and diluted to working solutions on a daily basis. The working solutions were added to each wetland cell on a continuous basis using peristaltic pumps. The flow rates for the working solutions were maintained at 5 mL/min. Filters made from montmorillonite clay and granular activated carbon were used to recover any remaining amounts of contaminants from the effluent that were not removed by the wetlands.
Hydrodynamic devices (CDS units) Three of the BMP sites used a CDS Technologies Continuous Deflective Separation (CDS) hydrodynamic device. These devices use a vortex and screening process to remove solids from dry and wet weather runoff. The components of a CDS unit consist of a sump, separation chamber (which contains a stationary screen cylinder), and diversion weir. Particles within the diverted treatment flow are retained by the deflective screen and are maintained in a circular motion, forcing them to the center of the separation chamber, creating an enhanced swirl concentration of solids (vortex separation), until they settle into the sump. Pico-Kenter (hydrodynamic device) This CDS unit is located at the end of Pico Blvd. near the beach in Santa Monica, and is operated by the City of Santa Monica. It receives a mix of runoff from approximately 4,200 acres of western Los Angeles County which includes commercial, residential, and transportation areas. The effluent from this CDS unit feeds into the Santa Monica Urban Runoff Recycling Facility (SMURRF) (see below). This unit has been operating since February 2001. BC120 (hydrodynamic device) This CDS unit is located near Ballona Creek in Culver City. It receives runoff from approximately 4,077 acres of Culver City, and drains into Ballona Creek at Overland Ave. This BMP was installed in January 2005.
8
South Pasadena (hydrodynamic device) This CDS unit is located near the intersection of Orange Grove and El Centro in the City of South Pasadena, and is operated by the Los Angeles County Department of Public Works (LACDPW). It receives runoff from 6 acres comprised of approximately 70% residential, 20% industrial, and 10% other. It has been operating since 2003.
Screening/hydrodynamic device/microfiltration/UV treatment SMURRF (screening/hydrodynamic device/microfiltration/UV treatment) The Santa Monica Urban Runoff Recycling Facility (SMURRF) is located at 1601 Appian Way, adjacent to the Santa Monica Pier. It receives runoff from approximately 5,100 acres of commercial, residential and transportation activities, which includes mostly the runoff from the Pico-Kenter CDS unit (see above), and to a smaller degree the Pier storm drain. This BMP treats dry weather flow using a combination of technologies, including 2 mm2 screening, a hydrodynamic device to remove sand and grit, microfiltration to remove turbidity (effluent turbidity <2 ntu), and ultraviolet radiation to kill pathogens (Boyle Engineering Corp. 1999). Water from the facility is used for City landscaping and government toilets. This system is designed to treat up to 500,000 gallons of runoff per day. The facility is operated by the City of Santa Monica, and has been in service since May 2001.
Screening/settlement L.A. metal recycling yard (screening/settlement) The L.A. metal recycling yard BMP is located at a metal scrap facility near downtown Los Angeles. This BMP treats runoff that is exclusive to this site, and is monitored only during wet weather events. Approximately 0.85 acres of the scrap yard is treated by the BMP. Water from the site flows into a sump, where settlement of the heavier particles occurs. The water then flows through a screen mesh into an infiltration trench. This BMP is being monitored by the Los Angeles and San Gabriel Rivers Watershed Council as part of a Watershed Augmentation Study. It is currently owned and maintained by the Watershed Council and Geomatrix, but will be turned over to the L.A. metal recycling yard after the 2004-2005 monitoring season. This BMP has been in operation since October 2003.
Sampling Methods
Wet CAT, Pico-Kenter, BC120, SMURRF The samples from the Wet CAT, Pico-Kenter, BC120 and SMURRF sites were collected by MACTEC Engineering and Consulting Inc. (San Diego). Samples from each of these sites were collected with American Sigma 900 Max Autosamplers, configured with 19 L borosilicate jars. Flow monitors (American Sigma 950 Area Velocity Bubbler Flowmeters) were used at each site, except for Pico-Kenter, where the flow meters could not be installed due to the non-ideal configuration. The components of each monitoring system used were calibrated for time and sample aliquot volume prior to deployment. The autosamplers at these sites collected 200 mL aliquot inflow and outflow samples every 15 min for 24 h. Because the flow at the SMURRF site was intermittent (treatment occurred only when sufficient volume of runoff had accumulated),
9
the autosamplers were triggered by the flowmeter only when the effluent was flowing. Most of these sites used paired autosamplers to collect the inflow and outflow samples simultaneously. At the Wet CAT wetland, however, sampling of the outflow was delayed by 24 h after starting the inflow collection, in an attempt to account for the hydraulic residence time of the wetland. The samples from the other sites in this study (OCWD SSF, South Pasadena, L.A. metal recycling yard) were each collected by different agencies, using different methods.
OCWD SSF Five sampling events were sampled at the OCWD SSF wetlands. At approximately weekly intervals, OCWD personnel collected 2 L composite samples of the inflow and outflow samples from each wetland for chemical and toxicity analysis. Three manual grab samples were collected over 24 h and composited. The flow rate was monitored and adjusted by visual inspection of a sight glass flow meter.
South Pasadena Five stormwater sampling events were captured at the South Pasadena site. Composite samples were collected by LADPW personnel. The samples for toxicity testing were collected every 20 min usually for 3 h during the initial part of each storm. The samples for chemical analysis were also collected every 20 min, but the sample duration was usually longer, lasting from 3 h up to 4 d.
L.A. metal recycling yard Four stormwater sampling events were captured at the L.A. metal recycling yard. Multiple grab samples were collected and composited for the first two events (2/2/04, 2/18/04), while single grab samples were collected for the other two events (10/26/04, 2/11/05). The samples were collected by GeoMatrix.
Chemical Analysis Because the samples in this study were analyzed by multiple agencies, more than one testing procedure was sometimes used (Table 4). The samples from the SMURRF, Pico-Kenter, WetCAT, and BC120 sites were analyzed for metals, organophosphate (OP) pesticides and pyrethroid pesticides by CRG Marine Laboratories (Torrance). The samples from the South Pasadena site were analyzed for metals and OP pesticides by the LADPW Environmental Toxicology Laboratory (South Gate), and the samples from the L.A. metal recycling yard were analyzed for metals by CalScience (Garden Grove). The OCWD SSF samples were analyzed for metals by CRG Marine Laboratories, and for diazinon by SCCWRP. All glyphosate analyses were made by MHW Laboratories (Monrovia). All metals analyses at CRG were made using Inductively Coupled Plasma Mass Spectrometry (ICPMS), following EPA 200.8 (EPA 1996). The samples for trace metals were filtered in the laboratory immediately upon receipt using 0.45 µm Nalgene disposable cellulose nitrate filters. The dissolved fraction was then acidified to a pH <2 using Optima nitric acid and allowed to sit for a minimum of 16 hours. The samples were then analyzed using ICPMS by direct aspiration into the nebulizer.
10
All organics analyses at CRG were made using Gas Chromatography Mass Spectrometry (GCMS), following EPA 625 (EPA 1996). Samples for trace organics were first spiked with recovery surrogates, then extracted 3 times with methylene chloride using a separatory funnel. The combined solvent extract was dried using anhydrous sodium sulfate, concentrated by roto-evaporation, and cleaned up using alumina/silica gel chromatography. Internal standards were added to the cleaned extracts, which were then analyzed using GCMS. The diazinon analyses at SCCWRP used Enzyme-Linked Immuno Sorbent Assay (ELISA). ELISA is an analytical method that uses antibodies to target specific pesticides, and a color changing reaction to quantify the amount of pesticide present in a sample. Pesticide analyses by ELISA were made using Strategic Diagnostics Inc. (Newark, DE) EnviroGard plate kits.
Toxicity Testing Dry-weather and wet-weather samples were tested for toxicity using the 7-d Ceriodaphnia dubia survival and reproduction test (USEPA 1994). The samples were usually tested at three concentrations (100%, 50%, and 25% runoff concentrations). All toxicity tests were started within 2 d of sample collection. Ten replicates were included in each test. The test endpoints were percent of survival and the number of offspring. A concurrent copper reference toxicant test was conducted with each testing event. Each test included a laboratory control. Test solutions were changed on a daily basis, and the organisms were fed each day. Dissolved oxygen, conductivity, pH, and temperature were measured each day. Alkalinity, hardness, and total ammonia were measured at the beginning of each experiment. Water quality measurements during the test met the test recommended ranges. The echinoderm fertilization test was also used (USEPA 1995). This test measures toxic effects on sea urchin or sand dollar sperm, as a reduction in their ability to fertilize eggs. Purple sea urchins (Strongylocentrotus purpuratus) were used in the majority of tests, while sand dollars (Dendraster excentricus) were used for the tests from November 2004. The tests consisted of a 20 minute exposure of sperm to samples of 25, 50, or 100% runoff sample diluted with hypersaline brine. Eggs were then added and given 20 minutes for fertilization to occur. The eggs were then preserved and examined later with a microscope to assess the percentage of successful fertilization. Toxic effects were expressed as a reduction in fertilization percentage. The tests were conducted in glass shell vials containing 10 mL of solution at a temperature of 15°C. Four replicates were tested for each sample. A seawater blank was included as negative control. A concurrent reference toxicity test with copper was conducted with each testing event.
Data Analysis
Chemistry Tiered Approach to Evaluating Effectiveness In many cases there was a difference between the inflow and outflow concentrations. Determining what constitutes a meaningful difference, however, is important when evaluating BMP effectiveness. With the limited number of sampling events in this study, the effectiveness could not be evaluated using a statistical approach. Therefore a tiered approach was used, which first examined the magnitude of the difference in concentrations between the inflow and outflow samples. If the difference was consistently greater than what would be expected from variability alone, then the data were compared to the appropriate chronic water quality criterion.
11
In this approach, the BMP had to have a meaningful difference between the inflow and outflow concentrations, even if the outflow concentration was meeting the water quality criterion. Two designations of effectiveness were assigned for each constituent at a BMP site; one designation for whether the BMP reduced the constituent, and a second designation (if the magnitude was great enough) for whether the water quality criteria was met due to reductions by the BMP. One potential source of the differences between inflow and outflow concentrations that could confound the interpretation of BMP efficiency is analytical variability. This type of variability can be caused by such things as differences in sample preparation and instrument conditions. Fortunately, analytical variability can be estimated from the sample duplicates that were measured as part of the quality assurance objectives in this study. The relative percent difference (RPD) is a measure of variability between a pair of samples, with higher RPD values indicating greater variability between the data pairs. The RPD was calculated as:
)100(xAverage
EffluentInfluent −
In this study, there were 120 pairs of laboratory duplicate analyses for metals using field samples that were measured by CRG Marine Laboratories. Most of the pairs had RPD values <10%, indicating that analytical variability was usually less than 10% for both dissolved and total metals. Therefore, differences of >10% for the inflow and outflow metals data are greater than what would be expected from analytical variability, and are probably meaningful. This was the first tier of the evaluation approach. While the duplicate measurements were only available for the analyses made by CRG Marine Laboratories, the concept that differences between the inflow and outflow concentrations had to be at least 10% to be meaningful was applied to the metals data from all three analytical laboratories. The 10% difference rule was also applied to TSS and pesticides, because these constituents did not have enough duplicate measurements made to determine a meaningful level of analytical variability. The percent reduction between inflow and outflow contaminant concentrations was calculated for each BMP site as:
)100(xInfluent
EffluentInfluent −
The second tier in evaluating BMP effectiveness was to compare the outflow concentrations to chronic water quality criteria. While the water quality criteria are not currently used to assess regulatory compliance of the runoff in this study, these criteria are useful for determining if concentrations in the inflow and outflow are at protective levels. For those samples that had a >10% reduction between inflow and outflow concentrations for at least 75% of the sampling events, the data were compared with the appropriate freshwater chronic water quality criterion. California Toxics Rule values were used for total Se, as well as for dissolved As, Cd, Cu, Ni, Pb, and Zn. There are no chronic criteria for dissolved Ag, Al, Cr(3+6), Se or Sn. For total Al, chlorpyrifos and malathion, the national freshwater chronic water quality criteria were used, while for diazinon, the California Department of Fish and Game freshwater chronic criterion was used. In cases where at least two of the inflow samples exceeded the water quality criterion, the relationship of the outflow concentration to the water quality criterion was examined.
12
Toxicity Data from the echinoderm and C. dubia tests were evaluated for significant reductions in fertilization, survival or reproduction using analysis of variance (ANOVA) with Dunnett’s test, or with Steel’s Many-One rank test when assumptions of normality or homoscedasticity were not met. Comparisons were made against the seawater control for the echinoderm fertilization test, and against the laboratory dilution water control for the C. dubia test. Using this approach, the highest concentration of runoff that did not cause significant toxicity (the no effect concentration, NOEC) was estimated for each of the inflow and outflow samples. The median-effect concentrations (LC50 or EC50) were also calculated. These are the concentrations of runoff that caused a 50% reduction in survival (LC50), or reproduction or fertilization (EC50). Toxicity units were then calculated to compare the magnitude of response. Toxic units (TU) were derived as 100/LC50 or 100/EC50. A TU > 1 indicates a strong toxic response. Because the highest concentration of runoff sample tested with the echinoderm fertilization test was 50%, the lowest TU that could be calculated was 2. Therefore, having no toxicity in the 50% sample would be associated with TU <2. The lowest concentration of runoff in the fertilization test was 12.5%. Therefore in cases with extreme toxicity where the EC50<12.5%, the associated TU would be >8. Results
Changes in Toxicity Toxicity, when present, was reduced by the two wetland BMPs. Both the Wet CAT wetland, and the OCWD SSF wetland reduced the toxicity in two of the sampling events, while the other sampling events at these sites did not have sufficient toxicity to evaluate removal. While there was a consistent reduction for many of the metal contaminants in the events with the non-toxic samples, the inflow concentrations were not great enough to have caused toxicity (Tables 5, 6). The toxicity to C. dubia survival and reproduction in the samples from the Wet CAT site was influenced by dissolved salts. While survival and reproduction were consistently low in these samples, the toxicity was usually equivalent to the salt blank that was tested concurrently with the Wet CAT samples. In a previously study, concentrations of dissolved salts associated with conductivity values greater than 1.8-2.8 mS caused impairment to C. dubia reproduction (Brown and Bay 2003). In the present study, the conductivity values in all of the Wet CAT samples exceeded this threshold range by at least a factor of two. Toxicity due to other contaminants could only be resolved in the November inflow sample. While the conductivity value was relatively high in this sample, the survival was significantly lower than that found in the salt control. The high salt content did not cause interference with the echinoderm fertilization test, since hypersaline brine was added to the samples to bring the conductivity level up to approximately 54 mS. In general, the CDS units had no effect on the toxicity. This is not surprising, since the CDS units were designed to remove solids from runoff, yet the fraction usually associated with toxicity is the dissolved phase, and the CDS units had little effect on the dissolved metals in this study (Tables 7-10). The toxicity data for the samples from the SMURRF site could not be used to evaluate toxicity removal effectiveness. While the inflow samples from two of the events were toxic to
13
echinoderm fertilization, reductions in toxicity could not be assessed because of the influence of added chlorine. As part of the treatment process at SMURRF, chlorinated water is used to backflush the screens. This chlorination step results in increased residual chlorine in the outflow samples. Previous studies have shown that the echinoderm test is sensitive to chlorine, with an approximate median effect threshold of 0.02 mg/L (Dinnel et al. 1981). In the present study, the residual chlorine concentrations in the outflow samples from SMURRF were 12-33 times this value in the samples from November, December and January. The increased toxicity was not due to other contaminants, since the other dissolved contaminants analyzed at SMURRF either remained fairly constant, or were reduced between the inflow and outflow samples (Table 11). There was no consistent toxicity to C. dubia. Toxicity at the L.A. metal recycling yard was usually reduced after treatment, according to the C. dubia reproduction test. While the toxicity was usually reduced in the outflow samples, the toxicity was still quite high after treatment. The toxicity was often too high in both the inflow and outflow samples in the sea urchin fertilization test to determine if a consistent reduction had occurred. The pattern of reduced toxicity in the C. dubia reproductive test was similar to the pattern found for dissolved Cr and Cu, but strikingly different from the patterns for dissolved Zn and Cd, where concentrations tended to increase substantially (Table 12). While dissolved Cu tended to decrease after treatment, the concentrations were still consistently above the chronic criterion.
Effectiveness of Metals Removal The wetland BMP systems (Wet CAT and OCWD sub-surface flow) both showed great potential to effectively reduce concentrations of dissolved Zn. Concentrations of dissolved Zn were consistently reduced by more than 10% in the outflow samples from both sites (Table 13), however the concentrations in the inflow samples did not exceed the chronic criterion. Therefore the ability to attain the water quality criterion for dissolved Zn could not be evaluated for these sites (Table 14). For dissolved Cu, the wetlands showed different responses. The SSF wetlands consistently reduced concentrations of dissolved Cu by more than 10% and reduced outflow concentrations to levels below the chronic criterion, but the Wet CAT wetland was unable to produce a meaningful reduction (Table 15). Concentrations at the Wet CAT site, however, were quite low in the inflow samples (<11 µg/L), and therefore it may not be realistic to expect large reductions in the outflow. Other metal constituents with water quality criteria were only analyzed in the samples from the Wet CAT site. The Wet CAT wetland was very effective at reducing concentrations of dissolved Cd and Ni to levels below the chronic criteria. This wetland was also effective at reducing concentrations of total Al and Se by >10%, although total Al was not always reduced to levels below the chronic criterion, and total Se was never reduced below the criterion. There were several metals without chronic criteria that were consistently reduced by >10% between the inflow and outflow at the Wet CAT site. This included total Cd, Cr, Cu, Ni, and Zn. Total Cu and Zn were also reduced by >10% in the OCWD SSF samples. The BMPs using hydrodynamic devices (CDS units) were generally ineffective at reducing metal concentrations by >10%, for metals with chronic water quality criteria. There was one exception; concentrations of total Al were reduced by >10% in both of the dry weather outflow samples at the BC120 site. This reduction was only partially effective, however, since the outflow concentrations were never reduced below the chronic criterion. One constituent, dissolved Cd, was below the reporting level for most sampling events at each of the CDS BMP sites, and could not be evaluated for consistent reductions. Most of the metals that were consistently reduced by >10% in the dry weather samples from BC120 do not have chronic criteria. Total Cu, Pb and Zn were reduced by >10% between inflow and outflow during both dry weather sampling events at this site. In general, CDS units are designed to remove
14
particulate material, which would be a substantial benefit for reducing the total load of metals. However, the majority of metals chronic criteria are for the dissolved phase. The SMURRF site was effective at reducing two of the metals with chronic criteria by >10%. The treatment process at SMURRF consistently reduced concentrations of total Al and dissolved Zn by >10%, with total Al reduced to levels below the chronic criterion. Dissolved Zn concentrations, however, were consistently below the chronic criterion in the inflow, and therefore the ability to attain this water quality criterion could not be assessed. The majority of metal constituents that were consistently reduced by >10% do not have chronic criteria; concentrations of total Cr, Cu, Ni, Pb, and Zn, and dissolved Al were consistently reduced between the inflow and outflow samples at SMURRF. Dissolved metals in the SMURRF inflow were consistently below the chronic water quality criteria, and therefore attainment of these criteria could not be evaluated. The screening/settlement apparatus at the L.A. metal recycling yard was usually effective at reducing concentrations of dissolved Cu and Pb by >10%. Dissolved Pb was reduced to levels below the chronic criterion half of the time, while dissolved Cu was never reduced below the criterion. This BMP was not effective for reducing any of the other metals with chronic criteria. Only one metal constituent without a chronic criterion (dissolved Cr) was consistently reduced by >10%.
Effectiveness of Pesticides Removal Only three BMP sites had at least two sampling events with detected amounts of pesticide, and could be evaluated for removal effectiveness. Diazinon was measured in the inflow from the Wet CAT and OCWD SSF wetlands, while chlorpyrifos was detected in the inflow from the South Pasadena CDS site. Both wetland BMPs were able to reduce diazinon by >10%. However, the OCWD SSF wetlands were inconsistent over time in their ability to reduce concentrations below the chronic criterion, and the inflow concentrations at the Wet CAT site were not high enough to evaluate attainment of the water quality criterion. The OCWD sub-surface flow wetlands appeared to completely remove diazinon during the first week, but were less effective during the other four sampling events. It is unclear why the effectiveness of diazinon removal was reduced after the first event, however the most likely explanation is that because there were inconsistencies with the dosing of the wetlands during the first week, the lack of diazinon in the outflow sample was because the diazinon had not mixed throughout the system. The dosing of the metals solution at OCWD, which used a different delivery system, was not affected. At the South Pasadena site, the concentrations of chlorpyrifos were not consistently reduced by >10%, hence this BMP was not effective at removing this OP pesticide.
Effectiveness of TSS Removal Numerical water quality criteria do not exist for TSS, so the BMPs were only evaluated for their ability to reduce the concentrations of TSS by at least 10%. The Wet CAT wetland was able to reduce TSS during all sampling events captured, presumably because of the long residence time which allowed for sedimentation processes to occur. A previous study found an average TSS reduction of 23% at the Wet CAT site (CH2MHill 2004), which is less than the 74% average reduction found in this study. There were mixed results for the CDS units. TSS was reduced in both of the dry weather samples from BC120, but was not reduced in the wet weather samples from BC120, and was inconsistently reduced in the samples from Pico-Kenter and South Pasadena.
15
The microfiltration process used at SMURRF consistently reduced the levels of TSS by more than 10%. The screening/settlement process used at the L.A. metal recycling yard, however, was not able to consistently reduce TSS levels. Reduction in TSS is not a parameter of direct relevance to water column toxicity, as contaminants usually need to be in the dissolved form to produce effects on organisms under laboratory exposure conditions. However, TSS removal does correspond to reductions in particle-associated contaminants, which could have a beneficial impact on sediment toxicity or bioaccumulation from feeding. The study design and analytical methods used in this study were not sufficient to assess potential impacts on sediment toxicity. Different procedures for sample collection and testing are needed to the toxicity associated with runoff particles.
Tiered Evaluation of BMP Effectiveness A direct side-by-side comparison of BMP effectiveness using the results of this study is not possible because the BMPs were located at different sites and received different types of runoff inflows. The BMPs were compared using a tiered evaluation process that examined both the ability to reduce inflow chemical concentration (Table 13) and ability to attain water quality criteria (Table 14). This evaluation showed that the most effective reductions of toxic constituents were produced by BMP systems that incorporated wetland plants (Table 15). Hydrodynamic separation devices showed little effectiveness for producing meaningful reductions in toxic constituents. The tiered evaluation was incomplete for many constituents or BMP types because the concentrations in the inflow were already relatively low, relative to water quality criteria. Discussion This study expands our understanding of BMP effectiveness under field conditions in southern California, adding new information for sites that have not been examined previously, and assessing additional constituents of concern for aquatic life protection (e.g., toxicity, OP pesticides) at sites that have been studied before. The assessment of treatment effectiveness described in this study is intended to provide information regarding the technologies examined and to aid in the selection of BMPs for future installations, not to evaluate the suitability of a specific BMP at the study sites. The BMPs included in this study were installed for purposes other than removal of aquatic life toxicity and the results are therefore not intended to assess the overall effectiveness of the specific BMP for its intended purpose. For example, the effluents from the SMURRF and L.A. metal recycling yard treatment systems do not enter urban creeks or channels, but are used as reclaimed water (SMURRF) or for ground water infiltration. The Wet CAT and CDS systems were installed for the treatment of constituents other than toxicity, such as bacteria (Wet CAT) and trash (CDS units). Toxicity of the Wet Cat inflow was reduced in the outflow samples. This is consistent with the reduction in contaminant concentrations. In fact, both of the BMPs based on wetland systems (e.g., Wet CAT, SSF wetlands) were effective in reducing the concentrations of total and dissolved metals, and diazinon. Dissolved metals that exceeded chronic water quality criteria in the inflow were usually reduced below these criteria after treatment by the wetlands. Diazinon concentrations, while consistently reduced at both the Wet CAT and SSF wetland sites, did not exceed the chronic criterion in the Wet CAT inflow samples (and consequently could not be
16
assessed for attainment of this criterion), and were rarely decreased below the chronic criterion by the SSF wetlands. In general, the hydrodynamic devices (e.g., CDS units) had no effect on toxicity. This is not surprising, since these BMPs were not designed for reducing concentrations of dissolved contaminants, which are the forms most likely to cause water column toxicity. The hydrodynamic devices were generally ineffective at reducing contaminants with water quality criteria. The toxicity data from SMURRF could not be used to evaluate toxicity removal effectiveness. There was no consistent toxicity to Ceriodaphnia dubia, and the sea urchin test was influenced by the chlorinated water used to backflush the treatment screens at this site. However, the treatment process at the SMURRF site did consistently reduce concentrations of most total metals and TSS. In spite of this, the concentrations of dissolved metal constituents could not be evaluated for attainment of chronic criteria because the inflow concentrations were consistently below the criteria. The toxicity of the samples at the L.A. metal recycling yard was often reduced after treatment, although the outflow samples were still highly toxic. The screening/settlement apparatus at this site was inconsistent in reducing most metals and TSS.
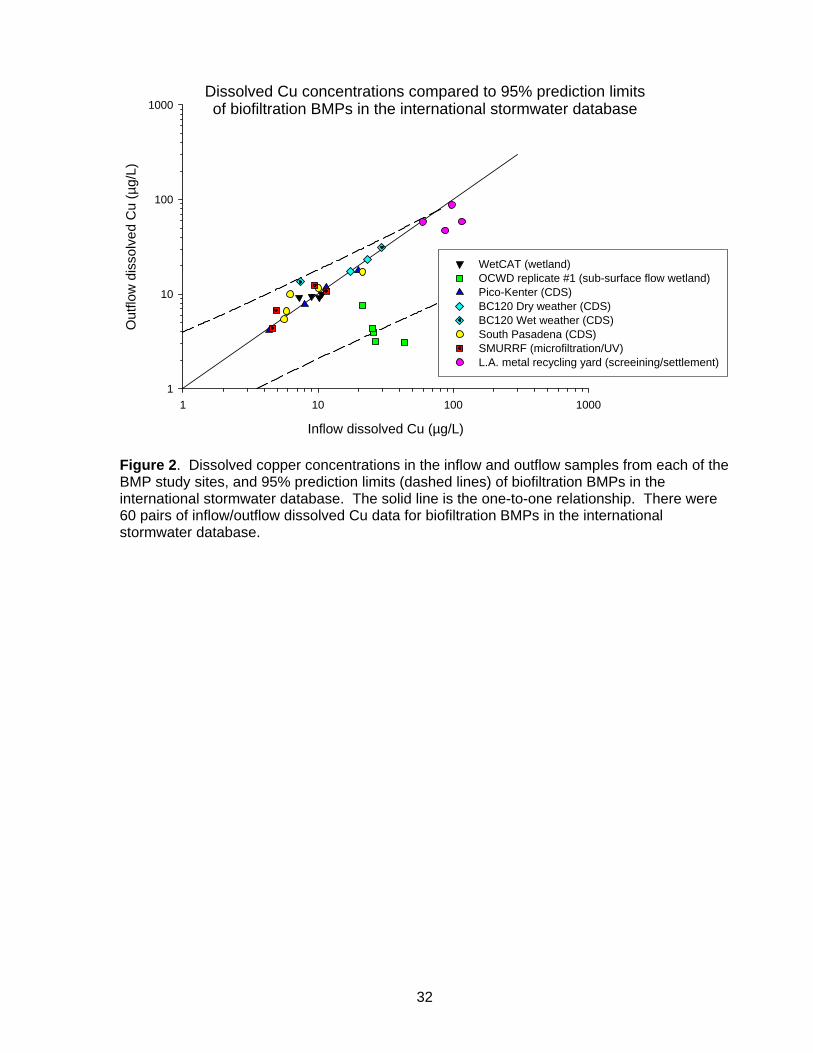
Comparison to the International Stormwater Database The data were compared with the International Stormwater BMP Database in order to determine if the removal effectiveness was comparable with other technologies and studies (Figures 2-4). The stormwater database contains inflow and outflow data for metals and TSS that has been collected over the past decade from several types of BMPs (Strecker et al. 2004). The database is sponsored by several agencies, including the US EPA and the American Society of Civil Engineers. For analysis of the data, the upper and lower 95% prediction limits from log transformed paired inflow and outflow data from biofiltration BMPs in the stormwater database were calculated and compared with the data for each of the BMPs in the present study. Biofiltration BMPs (which include grass strips and swales) are believed to be one of the most effective types of BMPs currently in use (E. Strecker, personal communication). Analyses were made for dissolved Cu, Zn and TSS. For dissolved Cu, most of the data from the present study fell within the prediction limits from the international stormwater database. The data were also compared to the one-to-one reference line (which represents no change between inflow and outflow). This comparison showed that while most of the data for the biofiltration BMPs were below this line (indicating a general net reduction in dissolved Cu between inflow and outflow), there were only two BMP sites in the present study that were consistently below this line. The OCWD SSF wetland and L.A. metal recycling yard were the only sites that had consistent reductions in dissolved Cu, with median reductions of 85% for OCWD replicate cell #1, 75% for replicate cell #2, and 28% for the metal recycling yard, compared to a 22% median reduction by the biofilter BMPs. The reductions in the present study were usually within the biofilter prediction levels for dissolved Zn, except for the OCWD SSF wetland and the L.A. metal recycling yard. For the OCWD SSF wetland, the data were below the lower prediction limit of the biofiltration BMPs for dissolved Zn, indicating a greater reduction by the SSF wetland than the biofilter BMPs. The dissolved Zn data from the L.A. metal recycling yard, however, were usually above the biofiltration upper prediction limit. The data at the L.A. recycling yard were also above the one-to-one reference line, indicating a net gain in dissolved Zn. Other than the OCWD SSF wetland, the only other sites that were consistently below the one-to-one line were the Wet CAT wetland,
17
and SMURRF. The median reductions in dissolved Zn at the OCWD (95% for replicate cell#1, 98% for replicate #2), and Wet CAT sites (72%) were greater than the median reduction from the biofiltration BMPs (45%), while the median reduction at SMURRF (20%) was lower. For TSS, only the data from SMURRF and Wet CAT were below the lower biofilter prediction limit. The median reductions in TSS at SMURRF (>98%) and the Wet CAT wetland (88%), and the reductions in the two dry weather samples from BC120 (73%, 50%) were all greater than the median reduction for the biofiltration BMPs in the stormwater database (18%). Data from the other sites in this study were usually within the prediction limits for TSS, except for the wet weather flow from BC120, which consistently exceeded the upper prediction limit. The data from the CDS units in this study were also compared with the data from the hydrodynamic devices in the stormwater database. All of the data from the CDS units fell within the 95% prediction limits of the hydrodynamic devices for dissolved Cu. The reductions in dissolved Cu were more variable with the database. However, the median reduction from the database (2%) was similar to the median reduction from Pico-Kenter (3%), the two dry weather events from BC120 (-1%, 0%), and the January wet weather event from BC120 (-5%). The median reduction in dissolved Cu in the database was lower than the median reduction from South Pasadena (9%). The reduction in the February wet weather event from BC120 was negative (-82%). For dissolved Zn, the reductions from the current study fell within the prediction limits of the hydrodynamic devices in the stormwater database. The results of the current study appear to coincide to the one-to-one reference line better than the data from the stormwater database for dissolved Zn. However, the median reduction in dissolved Zn from the database (0%) was lower than the median reduction from Pico-Kenter (8%), and South Pasadena (12%), and the March dry weather event from BC120 (29%), and the January wet weather event from BC120 (18%). The median reduction of the January dry weather event and February wet weather event from BC120 were negative (-10% and -42%, respectively). There was also a greater range in reduction of TSS for data from the stormwater database than the current study. Overall, the median reduction in TSS from the database (48%) was greater than the median reduction for Pico-Kenter (5%), and South Pasadena (15%), or the two wet weather samples from BC120 (-6%, -67%). The TSS reduction in the database was not as great, however, as for the two dry weather samples from BC120 (73%, 50% removal).
Research Needs While this study adds to the knowledge base, there were some limitations to this study. First, this study had a limited number of sampling events from each site and was conducted over a relatively short time frame. This study was restricted to a maximum of five sampling events due to the resources available and the short time-line of the project. Because of this, the among-event variability measured at each site may not be representative of other times of the year (for the dry weather samples), or additional years (particularly for wet weather, since the 2004-2005 rain season had double the normal amount of rainfall). Second, while analytical variability was incorporated into the two-tiered approach, there are other potential sources of variability that were not. This includes sampling variability (inconsistencies in the composition of the flow), and variability from sample handling (conditions that change the concentrations between the time of sample collection and analysis). Inconsistencies in the composition of the flow can lead to erroneous conclusions about differences between the inflow and outflow sample if there were spikes in contaminant
18
concentrations that were picked up by one of the autosamplers and not the other. For example, the large increases in several of the total metals (Cd, Cr, Cu, Ni, Pb, Zn) and chlorpyrifos in the March 2005 samples from Pico-Kenter probably did not originate from the CDS unit itself, but were more likely due to inconsistencies in the flow composition. Differences in how samples are handled (e.g. temperature, time until analysis) can also lead to variability between samples. Third, there were instances where the apparent removal effectiveness was low, because the inflow concentrations were too low to expect large reductions. For example, only one of the four sampling events at the Wet CAT site had concentrations of dissolved Cu that were reduced by >10%. However, the concentration of dissolved Cu in the inflow for these events was probably too low to expect large reductions in the outflow. The overall evaluation in the two-tiered approach did not distinguish between situations where the inflow was probably too low to evaluate removal by the BMP, and situations where the BMP failed to reduce high concentrations of contaminants. Finally, there are other types of BMPs in use in southern California that were not represented in this study, including detention basins and media filters. A previous study by Caltrans (2004) indicated these BMPs are among the most effective technologies for improving water quality, but did not examine reductions in toxicity or pesticides. Media filtration has been shown to substantially reduce toxicity in runoff from the National Steel and Shipbuilding Company (NASSCO) (H. Bermudez, personal communication). BMPs that use a multi-staged treatment system to treat several parameters should also be examined in greater detail. Stormwater and dry weather runoff contain many types of constituents of concern (e.g., trash, metals, pesticides, bacteria) and different treatments methods are usually needed to remove each category. Multi-staged systems that combine particle separation with the removal of dissolved constituents have the potential to greater reductions in toxics than were found for the structural BMPs evaluated in this study. Future investigations would benefit by increasing the number of sampling events and the duration of the study. Increasing the number of sampling events would allow additional statistical approaches to be used to evaluate the data. Future studies would also benefit by including additional BMP types, in order to characterize the wide variety of the BMPs being used in southern California. The assessment of BMP effectiveness regarding sediment toxicity is another issue in need of investigation. Sediment toxicity is frequently encountered in receiving waters near the mouths of urban rivers and creeks, and runoff discharge is a likely contributor to this situation. Just as the effectiveness of a particular BMP for a constituent such as trash may have little relevance to reducing water column toxicity, the characteristics of BMPs that are important for reducing water column toxicity may differ from those needed to be effective in reducing sediment toxicity. Literature Cited Boyle Engineering Corporation. 1999. Engineering report for dry-weather runoff, reclamation, storage, pumping, distribution, and nonpotable water use area facilities. Prepared for City of Santa Monica. Boyle Engineering Corporation, Fresno, CA. Brown, J. and S. Bay. 2004. Organophosphorus pesticides in the Malibu Creek watershed. pp. 94 – 102 in: S.B. Weisberg and D. Elmore (eds.), Southern California Coastal Water Research Project Biennial Report 2003-2004. Southern California Coastal Water Research Project. Westminster, CA.
19
Brown, J. and S. Bay. 2005. Assessment of best management practice (BMP) effectiveness. Report #461. Southern California Coastal Water Research Project. Westminster, CA. California Department of Transportation (Caltrans). 2004. BMP retrofit pilot program, Final report. Report CTSW-RT-01-050. Caltrans, Division of Environmental Analysis. Sacramento, CA. CH2MHill. 2004. Wetland Capture and Treatment (Wet CAT) Network Agreement No. 01-122-259-0. CH2MHill, Santa Ana, and City of Laguna Niguel Public Works and Engineering, Laguna Niguel, CA. Dinnel, P.A., Q.J. Stober and D.H. DiJulio. 1981. Sea urchin sperm bioassay for sewage and chlorinated seawater and its relation to fish bioassays. Marine Environmental Research 5:29-39. Siepmann, S. and B. Finlayson. 2000. Water Quality Criteria for diazinon and chlorpyrifos. California Department of Fish and Game. Office of Spill Prevention and Response. Administrative Report 00-3. 2000. Strecker, E., M. Quigley, B. Urbonas, and J. Jones. 2004. State-of-the-art in comprehensive approaches to stormwater. The Water Report 6:1-10. United States Environmental Protection Agency (USEPA). 1995. Short-term methods for estimating the chronic toxicity of effluents and receiving waters to west coast marine and estuarine organisms. EPA 600/R-95/136. Cincinnati, OH. United States Environmental Protection Agency (USEPA). 1994. Short-term methods for estimating the chronic toxicity of effluents and receiving waters to aquatic organisms. EPA 600/4-91/002. Cincinnati, OH. United States Environmental Protection Agency (USEPA). 1996. Test methods for evaluating solid waste. Physical/chemical methods (SW-846). Third edition. U.S. Government Printing Office, Washington, D.C. GPO document #955-001-00000-1. United States Environmental Protection Agency (USEPA). 2000. Water quality standards; Establishment of numeric criteria for priority toxic pollutants for the State of California; Rule. 40 CFR part 131. United States Environmental Protection Agency (USEPA). 2002. National Recommended Water Quality Criteria: 2002. Office of Water, Office of Science and Technology. EPA-822-R-02-047.
20
Figure 1. BMP sampling locations. The type of sample collected for this study (dry or wet weather) is indicated in the text box. The freeways in Los Angeles and Orange Counties have been added for reference.
2 2/18/04 Composite (multiple grabs) 15 27,460 3 10/26/04 Grab 5 Not measured 4 2/11/05 Grab 13 Not measured
22
Table 3. Constituents analyzed for each BMP site. Differences in the constituents among sites reflect differences in study design among the monitoring programs contributing data. OP pesticides = organophosphorus pesticides.
Chemistry Toxicity
Site Sampling event
Sample Date
Metals (dissolved
& total)
OP pesticides
Pyrethroid pesticides Glyphosate Ceriodaphnia
dubia chronic test Sea urchin
fertilization test
Wet CAT wetland (dry) 1 Inflow 11/17/04 Acute test 1 Outflow 11/18/04 Acute test 2 Inflow 12/15/04 Acute test 2 Outflow 12/16/04 Acute test 3 Inflow 1/19/05 Acute test 3 Outflow 1/20/05 Acute test 4 Inflow 3/9/05 4 Outflow 3/10/05 OCWD sub-surface wetland (dry) 1 2/3/05 2 2/10/05 3 2/24/05 4 3/3/05 5 3/10/05 Pico-Kenter hydrodynamic
2 12/16/04 Acute test 3 1/20/05 Acute test 4 3/10/05 L.A. metal recycling yard
screening/settlement (storm) 1 2/2/04
2 2/18/04 3 10/26/04 4 2/11/05
23
Table 4. Constituent methods and reporting levels used to analyze the runoff samples. Differences reflect the multiple agencies involved, and the analytical laboratories that conducted the chemical analyses.
SMURRF, Pico-Kenter, Wet CAT, BC120 L.A. metal recycling yard South Pasadena
Analyte Reporting Level Method Reporting
Level Method Reporting Level Method
General Hardness (mg/L) 5 SM 2340 B 2 EPA 130.2 2 EPA 130.2 Dissolved Organic Carbon (mg/L) 0.5 EPA 415.1 0.5 EPA 415.1 Not analyzed Ammonia (mg/L) 0.05 SM 4500 NH3 0.10 EPA 350.2 0.1 EPA 350.3 pH Not applicable EPA 150.1 Not applicable EPA 150.1 Not applicable EPA 150.1 Conductivity (µmhos/cm) 0.2 SM 2510 1.0 EPA 120.1 Not analyzed Total dissolved solids (mg/L) 0.2 SM 2540 C 1.0 EPA 160.1 Not analyzed Total suspended solids (mg/L) 0.5 SM 2540 D 2.0 EPA 160.2 2 160.2
Table 5. Wet CAT median influent and effluent values. Samples were collected over four dry weather events. ND = not determined; there were too many non-detect measurements to estimate this value. However, if there was only one non-detect, the non-detect value was substituted with half the reporting level, and an estimate was made1. The sample concentration range that was used in at least one of the toxicity testing events did not allow for adequate prediction of toxic units2.
Sea urchin fertilization test TU ND2 <2 ND2 Ceriodaphnia dubia survival TU <1 <1 ND2 Ceriodaphnia dubia reproduction TU <1 <1 1 sample analyzed
25
Table 6. OCWD sub-surface flow wetlands median influent and effluent values. Samples were collected over five sampling events. ND = not determined. If there was only one non-detect, the non-detect value was substituted with half the reporting level, and an estimate was made1. The sample concentration range that was used in at least one of the toxicity testing events did not allow for adequate prediction of toxic units2.
Table 7. Pico-Kenter median influent and effluent values. Samples were collected over four dry weather events. ND = not determined; there were too many non-detect measurements to estimate this value. However, if there was only one non-detect, this value was substituted with half the reporting level, and an estimate was made1. The sample concentration range that was used in at least one of the toxicity testing events did not allow for adequate prediction of toxic units2.
Metals (dissolved) As 2.7 2.8 -4.6 – 5.3 Cd 0.11 ND ND Cr 1.5 1.5 -7.5 – 12.8 Cu 9.7 9.8 -2.6 – 10.6 Pb ND ND ND Hg ND ND ND Ni 2.4 2.3 -2.3 – 7.9 Se 2.2 2.1 -16 – 21 Zn 23.3 22.6 -5.5 – 17
Diazinon ND ND ND Toxicity
Sea urchin fertilization test TU <2 ND2 ND2 Ceriodaphnia dubia survival TU <1 <1 0 Ceriodaphnia dubia reproduction TU <1 <1 1 sample analyzed
27
Table 8. South Pasadena median influent and effluent values. Samples were collected over five wet weather sampling events. ND = not determined; there were too many non-detect measurements to estimate this value. However, if there were two non-detects, these values were substituted with half the reporting level, and an estimate was made1. NA = not analyzed. The sample concentration range that was used in at least one of the toxicity testing events did not allow for adequate prediction of toxic units2.
Study Site Median Concentration
Analyte Influent Effluent Range of %
removal over the five sampling
events General
Dissolved Organic Carbon (mg/L) NA NA NA Ammonia (mg/L) 0.43 0.5 -31 – 57 Conductivity (mS) NA NA NA TDS (mg/L) 29.0 27.0 -422 – 67 TSS (mg/L) 54.0 26.0 -57 – 97
Metals (total), µg/L As 1.01 ND ND Cd ND ND ND Cr 1.8 1.6 -40 – 55 Cu 22.2 20.2 -6 – 26 Pb 6.5 3.8 -49 – 80 Hg ND Ni 3.0 2.7 -34 – 30 Se ND ND ND Zn 97.2 90.2 -26 – 28
Metals (dissolved), µg/L As ND ND ND Cd ND ND ND Cr 0.61 0.8 -104 – 4.8 Cu 8.2 10.7 -60 – 19 Pb 0.71 1.01 -51 – 58 Hg ND ND ND Ni 1.21 1.31 -20 – 5.8 Se ND ND ND Zn 50.5 63.4 -33 – (-4.4)
Diazinon ND ND ND Toxicity
Sea urchin fertilization test TU >8 >8 ND2 Ceriodaphnia dubia survival TU <1 <1 ND2 Ceriodaphnia dubia reproduction TU <1 <1 ND2
28
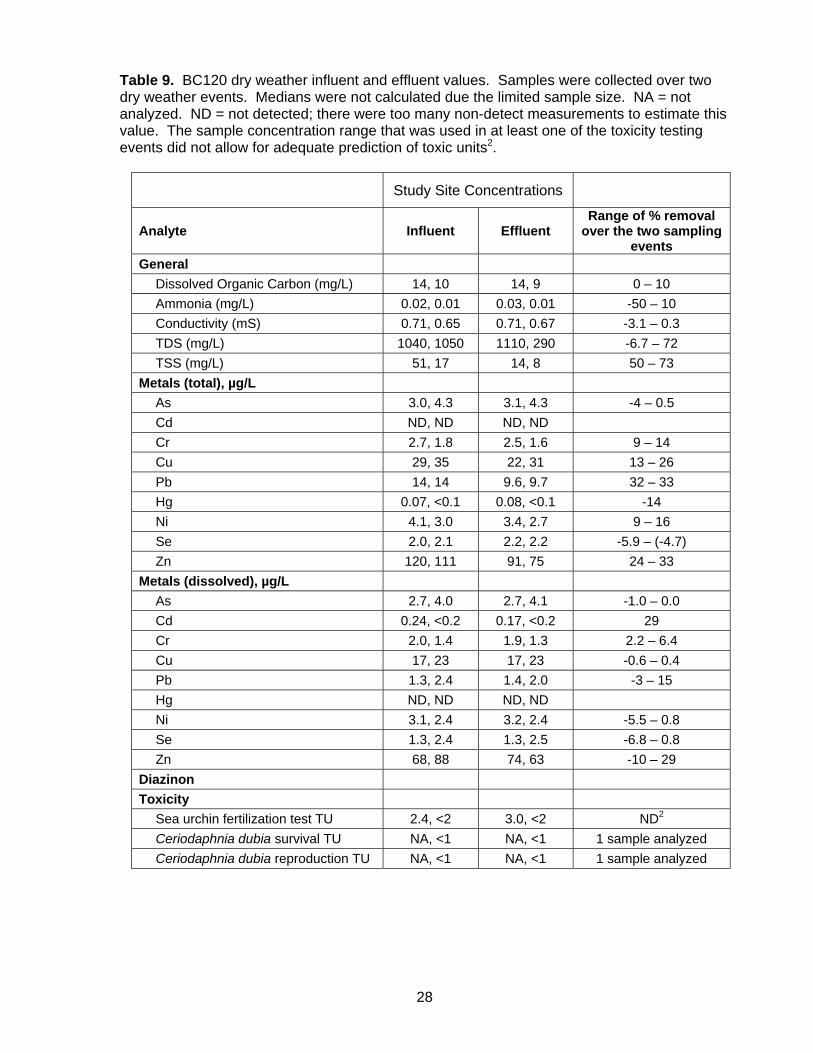
Table 9. BC120 dry weather influent and effluent values. Samples were collected over two dry weather events. Medians were not calculated due the limited sample size. NA = not analyzed. ND = not detected; there were too many non-detect measurements to estimate this value. The sample concentration range that was used in at least one of the toxicity testing events did not allow for adequate prediction of toxic units2.
Sea urchin fertilization test TU 2.4, <2 3.0, <2 ND2 Ceriodaphnia dubia survival TU NA, <1 NA, <1 1 sample analyzed Ceriodaphnia dubia reproduction TU NA, <1 NA, <1 1 sample analyzed
29
Table 10. BC120 wet weather influent and effluent values. Samples were collected over two wet weather events. Medians were not calculated due to the limited sample size. NA = not analyzed. ND = not detected; there were too many non-detect measurements to estimate this value. The sample concentration range that was used in at least one of the toxicity testing events did not allow for adequate prediction of toxic units2.
Sea urchin fertilization test TU >8, 2.6 >8, 2.9 ND2 Ceriodaphnia dubia survival TU NA, <1 NA, <1 1 sample analyzed Ceriodaphnia dubia reproduction TU NA, <1 NA, <1 1 sample analyzed
30
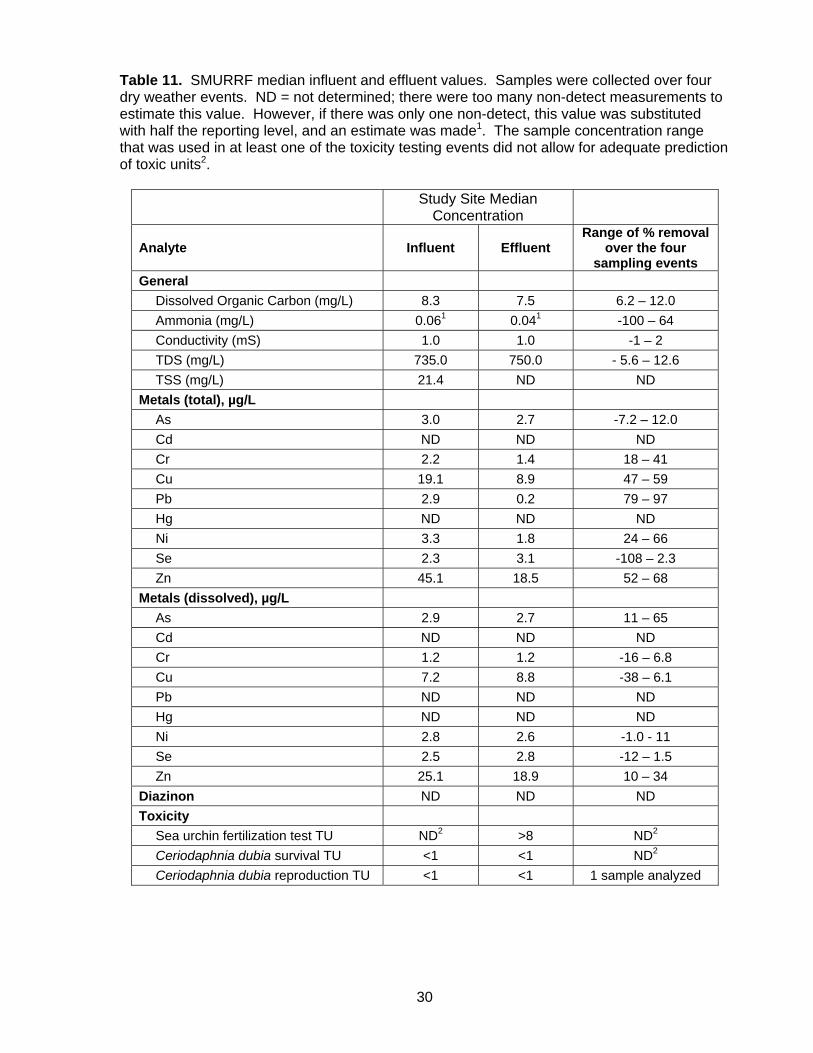
Table 11. SMURRF median influent and effluent values. Samples were collected over four dry weather events. ND = not determined; there were too many non-detect measurements to estimate this value. However, if there was only one non-detect, this value was substituted with half the reporting level, and an estimate was made1. The sample concentration range that was used in at least one of the toxicity testing events did not allow for adequate prediction of toxic units2.
Sea urchin fertilization test TU ND2 >8 ND2 Ceriodaphnia dubia survival TU <1 <1 ND2 Ceriodaphnia dubia reproduction TU <1 <1 1 sample analyzed
31
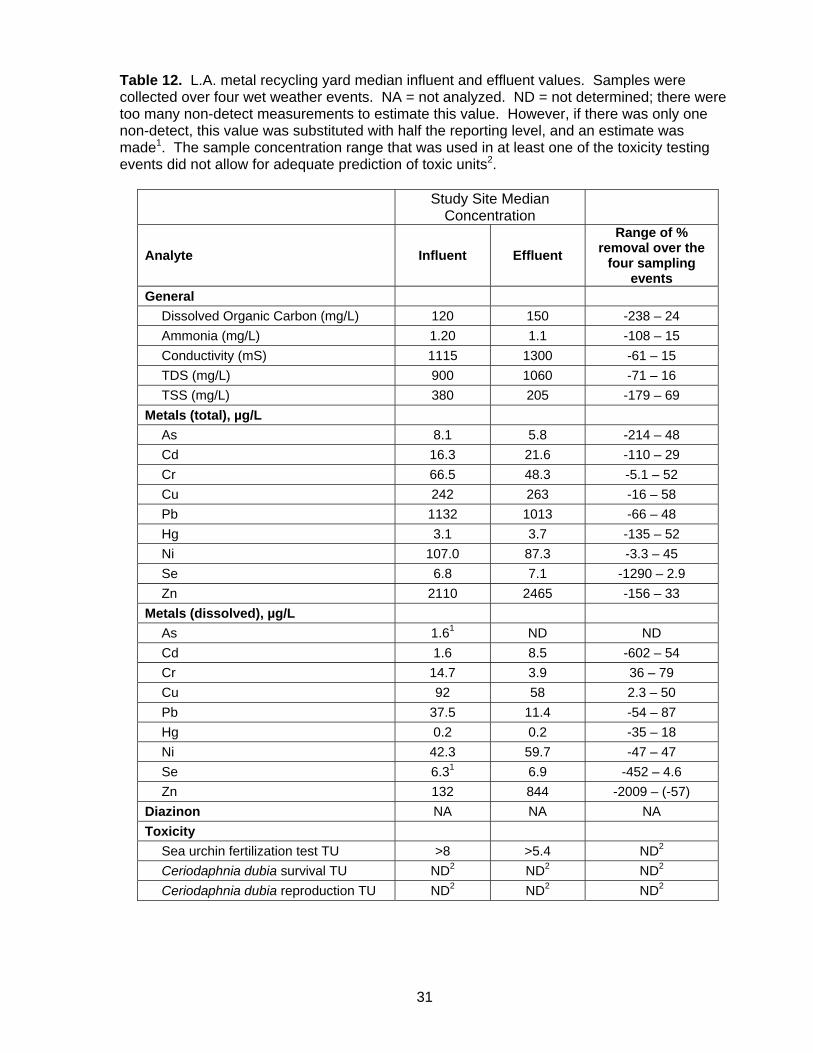
Table 12. L.A. metal recycling yard median influent and effluent values. Samples were collected over four wet weather events. NA = not analyzed. ND = not determined; there were too many non-detect measurements to estimate this value. However, if there was only one non-detect, this value was substituted with half the reporting level, and an estimate was made1. The sample concentration range that was used in at least one of the toxicity testing events did not allow for adequate prediction of toxic units2.
Figure 2. Dissolved copper concentrations in the inflow and outflow samples from each of the BMP study sites, and 95% prediction limits (dashed lines) of biofiltration BMPs in the international stormwater database. The solid line is the one-to-one relationship. There were 60 pairs of inflow/outflow dissolved Cu data for biofiltration BMPs in the international stormwater database.
33
Dissolved Zn concentrations compared to 95% prediction limitsof biofiltration BMPs in the international stormwater database
Figure 3. Dissolved zinc concentrations in the inflow and outflow samples from each of the BMP study sites, and 95% prediction limits (dashed lines) of biofiltration BMPs in the international stormwater database. The solid line is the one-to-one relationship. There were 60 pairs of inflow/outflow dissolved Zn data for biofiltration BMPs in the international stormwater database.
34
TSS concentrations compared to 95% prediction limitsof biofiltration BMPs in the international stormwater database
Figure 4. Total suspended solids concentrations in the inflow and outflow samples from each of the BMP study sites, and 95% prediction limits (dashed lines) of biofiltration BMPs in the international stormwater database. The solid line is the one-to-one relationship. There were 27 pairs of inflow/outflow dissolved TSS data for biofiltration BMPs in the international stormwater database.
35
Table 13. Proportion of sampling events with >10% reduction between inflow and outflow samples. NA = not analyzed. ND = not detected.
Wet CAT (wetland)
Dry weather
OCWD (sub-surface flow wetland)
Experimental dosing
Pico-Kenter (CDS)
Dry weather
BC120 (CDS)
Dry weather
BC120 (CDS)
Wet weather
South Pasadena
(CDS) Wet weather
SMURRF (filtration + UV)
Dry weather
L.A. metal recycling yard (grit removal)Wet weather
Total metals Al 3/4 NA 1/4 2/2 0/2 2/4 4/4 2/4 As 1/4 NA 1/4 0/2 0/2 ND 1/4 2/4 Cd 4/4 NA ND ND 0/2 ND 1/1 1/4 Cr 3/4 NA 0/4 1/2 0/2 2/5 4/4 1/4 Cu 4/4 5/5 (cell#1 & #2) 0/4 2/2 0/2 2/5 4/4 1/4 Ni 4/4 NA 0/4 1/2 0/2 2/5 4/4 2/4 Pb 0/2 NA 2/4 2/2 0/2 3/5 4/4 2/4 Se 4/4 NA 0/4 0/2 0/2 ND 0/4 0/4 Zn 4/4 5/5 (cell#1 & #2) 0/4 2/2 0/2 3/5 4/4 2/4
Dissolved metals Al 4/4 NA 2/4 0/2 0/2 ND 4/4 1/2 As 0/4 NA 0/4 0/2 0/2 ND 0/4 2/3 Cd 4/4 NA 0/1 1/1 1/1 ND ND 1/4 Cr 2/4 NA 2/4 0/2 0/2 0/4 0/4 4/4 Cu 1/4 5/5 (cell#1 & #2) 1/4 0/2 0/2 1/5 0/4 3/4 Ni 4/4 NA 0/4 0/2 0/2 0/3 1/4 2/4 Pb 0/1 NA 0/2 1/2 0/2 0/3 1/2 3/4 Se 1/4 NA 2/4 0/2 1/2 ND 0/4 0/4 Zn 4/4 5/5 (cell#1 & #2) 1/4 1/2 1/2 0/5 4/4 0/4
Total suspended solids 4/4 NA 2/4 2/2 0/2 3/5 4/4 2/4 Organophosphorus pesticides
Malathion 1/1 NA ND ND ND ND 1/1 NA Pyrethroid pesticide ND NA ND ND ND NA ND NA
Bifenthrin ND NA ND 0/1 ND ND ND NA Glyphosate ND NA ND ND ND NA ND NA
36
Table 14. BMP effectiveness with regard to chronic water quality criteria. The denominator indicates the number of inflow samples that exceeded the water quality criteria, while the numerator indicates the number of outflow samples that met the criteria only after treatment by the BMP. Instances where the inflow sample was already below the water quality criteria are not counted. NA = not analyzed.
Wet CAT (wetland)
Dry weather
OCWD (sub-surface flow
wetland) Experimental
dosing
Pico-Kenter (CDS)
Dry weather
BC120 (CDS) Dry weather
BC120 (CDS) Wet weather
South Pasadena
(CDS) Wet weather
SMURRF (filtration + UV)
Dry weather
L.A. metal recycling yard (grit removal) Wet weather
Total metals Al 3/4 NA 0/3 0/2 0/2 0/3 4/4 0/2 Se 0/4 NA 0/1 0/0 0/0 0/0 0/1 0/3
Dissolved metals As 0/0 NA 0/0 0/0 0/0 0/0 0/0 0/0 Cd 3/3 NA 0/0 0/0 0/0 0/0 0/0 0/0
* = The outflow sample from 1/2/05 met the water quality criterion only because the hardness of the outflow sample increased substantially relative to the inflow sample, thereby increasing the criterion. These samples are not counted as meeting the chronic criteria after treatment in this table.
37
Table 15. Overall effectiveness of BMP treatment. The evaluation of the BMP efficiency used a two-tier approach, with a designation of effectiveness for each tier (tier 1/tier 2). The first part of the designation refers to the ability to reduce concentrations by >10%, while the second part of the designation refers to the ability to attain a water quality criterion. Reductions less than 10% were given a “No/U” designation for no meaningful reduction by the BMP. If the concentrations were reduced by >10% for at least 75% of the sampling events, the data were then compared to water quality criteria (second tier). If there was insufficient data to assess effectiveness (e.g., measurements were usually below the reporting level), the designation of “U/U” was used. If the outflow sample was reduced to below the chronic criterion a “Yes/+” designation was used. If the reduction did not result in outflow concentrations below the criterion, a “Yes/-“ designation was used. If there was a consistent reduction, but the outflow inconsistently met the criterion, the designation of “Yes/?” was used. Instances where concentrations were reduced, but the inflow data was consistently below the criteria were given a “Yes/U“ designation. NA = not analyzed.
Wet CAT (wetland)
Dry weather
OCWD (sub-surface flow wetland)
Experimental dosing
Pico-Kenter (CDS)
Dry weather
BC120 (CDS)Dry weather
BC120 (CDS) Wet weather
South Pasadena
(CDS) Wet weather
SMURRF (filtration + UV)
Dry weather
L.A. metal recycling yard (grit removal) Wet weather
Total metals Al Yes/? NA No/U Yes/– No/U No/U Yes/+ No/U Se Yes/– NA No/U No/U U/U U/U No/U No/U
Dissolved metals As No/U NA No/U No/U No/U U/U No/U No/U Cd Yes/+ NA U/U U/U U/U U/U U/U No/U Cu No/U Yes/+ No/U No/U No/U No/U No/U Yes/– Ni Yes/+ NA No/U No/U No/U U/U No/U No/U Pb U/U NA U/U No/U No/U No/U U/U Yes/? Zn Yes/U Yes/U No/U No/U No/U No/U Yes/U No/U
OP pesticides Chlorpyrifos U/U NA U/U U/U U/U No/U U/U NA Diazinon Yes/U Yes/? U/U U/U U/U U/U U/U NA