EVALUATION OF BIOGENIC METHANE A Guidance Prepared for the Evaluation of Biogenic Methane in Constructed Fills and Dairy Sites Prepared By: California Environmental Protection Agency Department of Toxic Substances Control March 28, 2012
Transcript
EVALUATION OF BIOGENIC METHANE
A Guidance Prepared for the Evaluation of Biogenic Methane in Constructed Fills and Dairy Sites
Prepared By: California Environmental Protection Agency
Department of Toxic Substances Control
March 28, 2012
EVALUATION OF BIOGENIC METHANE
1.0 Introduction (will also discuss local methane requirements)
1.1 Introduction 1.2 Conceptual Model 1.3 Methane Generation
2.0 Field Data Needs 2.1 Methane Extent
2.2 Soil Parameters 2.3 Pressure Readings 2.4 Organic Carbon Content and Moisture Content 2.5 Fixed Gas Analysis 3.0 Technical Approach 3.1 Air Permeability and Saturation 3.2 Pressure Gradient 3.3 Saturation
3.4 Evaluation of Potential Maximum Methane Concentration by Fixed Gas Analysis
3.5 Estimation of Flux Underneath the Building 4.0 Technical Approach for Estimation of Allowable Flux 4.1 Concentration Threshold
4.2 Air Exchange Rate 4.3 Building Volume 4.4 Allowable Sub-slab Soil Gas Concentration 4.5 Allowable Sub-slab Soil Gas Pressure 5.0 Conclusions Appendix A Interpretation of Fixed Gas Analysis Appendix B Using Munsell Colors to Infer Soil Redox Conditions
ACKNOWLEDGMENTS Preparation of this guidance was possible through the efforts of the following individuals at the California Environmental Protection Agency:
Rafat Abbasi Department of Toxic Substances Control Alice Campbell Department of Toxic Substances Control
Primary Reviewer:
Joe Hwong Department of Toxic Substances Control Amit Pathak Department of Toxic Substances Control
The team also would like to acknowledge the contribution from various consultants who provided substantial contribution towards the completion of this document.
Disclaimer This document is a compilation of available information, knowledge, experience, and best practices regarding biogenic methane site assessment and remediation. This document does not contain regulatory requirements. In general, this document should be used as a reference. Differences may exist between the recommendations in this document and what is appropriate under site-specific conditions.
Evaluation of Biogenic Methane Chapter 1-Introduction Page 1-1
CHAPTER 1 - INTRODUCTION 1.1 INTRODUCTION
DTSC is proposing to revise its existing approach to evaluating sites with biogenic methane. Biogenic methane comes from organic materials as they decompose in oxygen-free environments. The existing guidance “The Methane Assessment and Remedies at School sites dated June 2005” provides a framework for evaluating such sites based on a combination of subsurface methane concentration and pressure. However, the 2005 guidance primarily assumes that concentration alone plays a significant role in posing an unacceptable explosive risk without considering the subsurface methane pressure or soil properties. In the last 6-7 years in evaluating several methane sites with biogenic sources, DTSC has learnt that, in addition to concentration, pressure plays a significant role in evaluation of explosive risk. The role of pressure in methane gas migration and intrusion was first examined in 2002 in the Methane Transport computer program (MTRANS) study of San Diego County area homes built on organic soils.1 The City of Los Angeles in 2004 recognized the importance of pressure in their city-wide methane mitigation requirements.2 The City’s ordinance suggests a greater risk from methane having subsurface pressures of significantly greater than two inches of water column. A 2008 publication “Hazard Assessment by Methane CVP (concentration, volume, pressure)” showed that there is no inherently unsafe methane soil gas concentration; and that methane soil gas must exhibit pressure to be hazardous.3 In summary, new studies have found that for methane to pose an explosive risk, it must not only exist at higher concentration but also be migrating under high pressure from subsurface to inside the buildings. Therefore, a new approach for the future school sites with the history of biogenic methane source is proposed. Under the revised approach, methane concentration and pressure data will be collected and the estimated methane flow will be calculated and compared with maximum allowable concentration in the sub-surface to evaluate whether methane poses a potential explosion risk at the site.
1 Geokinetics, et al, MTRANS (Methane Transport) Methane Gas Migration Model, June 25, 2002. 2 City of Los Angeles, Ordinance #175790, March 29, 2004, table 71, p.12. 3 Sepich, John, 2008, Hazard Assessment by Methane Concentration/Volume/Pressure (CVP), Proceedings of the Sixth International Conference on Remediation of Chlorinated and Recalcitrant Compounds, Monterey, California, May 2008, ISBN 1-57477-163-9, Battelle, Columbus, Ohio.
Evaluation of Biogenic Methane Chapter 1-Introduction Page 1-2
1.2 SCOPE AND APPLICABILITY This guidance is only intended to address sites with biogenic methane which originates in artificial fills and/or at sites with historical dairy operations. The artificial fills and/or sites with dairy operations have limited methane contamination, relatively low generation rates and consequently low volumes of methane. In some cases, however, the absolute concentration of methane can be quite high. Despite high concentrations, the low volumes are commonly insufficient to present a risk of explosion or fire as will be shown later on by sensitivity analysis. This guidance presents a way to calculate the intrusion rate of a well-characterized methane source in order to decide whether it poses a risk to the structure or inhabitants. However, at sites where groundwater is shallower and fluctuates significantly, methane evaluation can poses complications that are best addressed on a case-by-case basis are beyond the scope of this guidance. Additionally, sites with methane associated with petroleum production should not be evaluated using approach described herein.
1.3 CONCEPTUAL MODEL
The amount of methane flowing though a given area (methane flux) is controlled primarily by pressure gradients, either self-generated or barometrically generated. Although minor amounts of diffusion and dispersion also occur, but most flux is advective and is driven by pressure-.. The approach to the problem of estimating methane flux is to determine the maximum safe methane concentration in the zone of migration, assuming a default rate of advective flux of gas per square foot into a proposed structure through slab cracks, and assuming a building air exchange rate, along the lines of the Johnson-Ettinger model4 for indoor air studies. This upflow rate is adjustable in the model. The approach uses Darcy’s Law 5 (Q=Kair I A) to estimate bulk gas flow, and uses the partial pressure of methane to calculate methane flux in the subsurface. A modification to the Darcy equation was done to incorporate air permeability and open pores for gas flow. Using relative proportions of fixed gases to estimate the maximum concentration of methane is also recognized and is incorporated in the evaluation. Darcy’s law is applied to low-pressure soil gas, which behaves as an incompressible fluid as long as gage pressures remain low, say less than 1% above atmospheric pressure. ** Average atmospheric pressure at sea level is about 14.7 psi (pounds per square inch), or about 407 inches of water column (w.c.). This suggests that Darcy’s Law can be used for vapor movement through 4 USEPA “Johnson and Ettinger” Model for Subsurface Vapor Intrusion into Buildings, 1991, http://www.epa.gov/oswer/riskassessment/airmodel/johnson_ettinger.htm, url accessed May 11, 2010. 5 Henry Darcy, Les Fontaines Publiques de la Ville de Dijon ("The Public Fountains of the Town of Dijon"), Dalmont, Paris (1856). **Journal of Contaminant Hydrology Volume 5, Issue 3, March 1990, Pages 297-314 Unsteady radial flow of gas in the vadose zone by David B. McWhorter
Evaluation of Biogenic Methane Chapter 1-Introduction Page 1-3
soil up to gage pressures of about four inches of w.c. Calculating flux (Q) requires three parameters, namely: air permeability; air pressure gradient; and the area through which the gas will flow, here considered to be one square foot. This document allows for either English units, or equivalent metric units, to be used. Once the flux is estimated in the subsurface, an algorithm based on the principal of conservation of mass with application to the average concentration of soil vapor in the building is used. The average concentration in the building is the function of subsurface soil gas concentration, outside concentration of contaminant in the air, air exchange rates, and building volume. The observed concentration and calculated flux are combined with building parameters, which include building slab crack area, building volume, and building air exchange rate, to calculate the maximum concentration of methane in the building. See Figure 1, Conceptual Model.
Figure 1-Conceptual Model
1.4 METHANE GENERATION
Methane in fill material and/or dairies is generated by the anaerobic decomposition of organic material. Such decomposition occurs in phases and is
Evaluation of Biogenic Methane Chapter 1-Introduction Page 1-4
characterized by minimal concentration of methane at the outset.6 See Figure 2 and Appendix A. Subsequently, fermentation results in generation of methane and carbon dioxide. This source gas has a composition of approximately 45% carbon dioxide (CO2) and 55% methane (CH4). The density of source gas is essentially the same as air, so density-driven flux (i.e. buoyancy due to low specific gravity) is not the primary driver for migration. As the gas moves in the vadose zone, it may encounter free oxygen from tidal air movement in the soil, oxygen from moisture (water and water vapor), or even from chemically combined oxygen such as found in iron compounds in the soil. The concentration of methane will then decrease as it becomes oxidized, along with a concurrent increase in the concentration of CO2. But oxidation of methane soil gas stops as oxygen in the soil is depleted.
Mixing of soil gas with air and anaerobic microbial activity near the ground surface may produce both diluted and oxidized methane, and the resulting high CO2 concentrations in soil gas. Diluted soil gas would retain the initial (roughly equal) balance ratio of CH4 and CO2, while oxidized methane would show an increase in the CO2 to CH4 ratio above initial values.7 While high concentrations of CO2 in the soil are not regulated, they may indicate that active decomposition is still taking place but is being masked by degradation, and furthermore that under circumstances where oxygen is prevented from reaching the vadose zone, the oxidation of methane soil gas could be impaired. Therefore comparison of deeper to shallower soil gas samples utilizing fixed gas analyses can indicate whether dilution or oxidation of methane is occurring, and consequently whether there is potential for higher methane flux if surface conditions should change. Hardscape, buildings and landscaping may block atmospheric air entry to the vadose zone; and methane concentrations which degraded beneath an undeveloped open field might pose a hazard after construction of impervious surfaces and implementation of landscape irrigation. Even absent site development, heavy rain can increase generation rates by providing moisture (oxygen), and increase the distance methane can move laterally by plugging the shallow soil pores just beneath the ground surface. Assessment of explosive hazard therefore requires an estimate of the maximum concentration reachable under any changed future conditions.
6 F. Pohland and J.C. Kim, 1999, In situ anaerobic treatment of leachate in landfill bioreactors, Water Science Technology, 40 (8) (1999), pp. 203–210. 7 Isaac R. Kaplan and John E. Sepich, Geochemical Characterization, Source and Fate of Methane and Hydrogen Sulfide at the Belmont Learning Center, Los Angeles, USA, American Association of Petroleum Geologists, Environmental Geosciences, Volume 17, Number 1, ISSN 1075-9565, pp. 45-69, March, 2010.
Evaluation of Biogenic Methane Chapter 1-Introduction Page 1-5
Figure 2-Methane Generation
Current engineering practice for fill construction may limit organic material to levels as low as 0.5% by weight, for practical reasons of constructability and fill stability -- organic material does not compact well, and decomposition, either aerobically or anaerobically, will cause the fill to settle. This phenomenon might suggest including even more stringent limits on organics in fill. In actual practice, however, such low levels make it impossible at some sites to find any compliant earth material for engineered fills. The San Diego area MTRANS study determined that high concentrations of methane are normal in engineered fill containing silts or clays, and that the methane did not pose a hazard to structures.8 Different classes of organics decompose at different rates,9 with wood (cellulose) decomposing much more slowly than fine vegetation or organic materials in silty soils or debris basin cleanout. The organic carbon content is thus an imperfect predictor of the actual potential for methane generation, but it is a convenient index for comparison of various earth materials. However when soils are not homogeneous, it may be difficult to obtain representative samples for an accurate estimate of the average organic carbon content. Methane concentrations may show strong seasonality. California’s generally semiarid climate generally includes half a year of rainy season and half a year of dry season, leading to marked variations in available moisture in the shallow soil. (Soil moisture content tends to be more stable at greater depths.) Since soil 8 Geokinetics, et al, 2002. 9 Recovery, Processing, and Utilization of Gas from Sanitary Landfills, February 1979, U.S. Department of Commerce National Technical Information Service PB-293 165, p.5.
Evaluation of Biogenic Methane Chapter 1-Introduction Page 1-6
moisture is a significant factor driving decay of organic matter, wetting and drying of a (non-irrigated) fill may result in marked variations in methane concentration with time. Finally, because the organic matter in earth fill which is undergoing microbial decomposition represents a fixed but declining biomass source, overall rates of methane generation may be observed to decline as the fill ages. To calculate the rate of decomposition, the USEPA LandGEM10 model uses a theoretical first-order kinetic model under anaerobic conditions.
LandGEM uses the following first-order decomposition rate equation to estimate annual emissions over a time period that you specify.
eM
LQ ktkCH
ijt
f
n
t 100
1
1.014
Where QCH4 = annual methane generation in the year of the calculation (m3/year) i = 1 year time increment n = (year of the calculation) - (initial year of waste acceptance) j = 0.1 year time increment k = methane generation rate (year-1) Lo = potential methane generation capacity (m3/Mg) Mi = mass of waste accepted in the ith year (Mg) tij = age of the jth section of waste mass Mi accepted
For more information, see the USEPA LandGEM model and its documentation, particularly the effect of moisture on decay rates.
10 United States Environmental Protection Agency, May 2005, Landfill Gas Emissions Model (LandGEM) Version 3.02, EPA-600/R-05/047
Evaluation of Biogenic Methane Chapter 2-Field Data Needs Page 2-1
CHAPTER 2 - FIELD DATA NEEDS Introduction The goal of a field investigation of a biogenic methane source is to obtain the data necessary for calculation of methane flux into a proposed structure. The parameters necessary are:
1. The nature and extent, both lateral and vertical, of the methane source area, including maps, tables, and results of field investigations.
2. The maximum expected concentration of methane beneath the building 3. The effective hydraulic or air permeability of the soil beneath the building
foundation 4. The volume of the building 5. The maximum effective pressure gradient in the soil 6. The depth to groundwater and general pattern of seasonal groundwater
fluctuation In lieu of field measurements, certain conservative default parameters can be used and in many cases will be sufficient to support closure. In other cases, DTSC staff may require that additional data be obtained. Default values are: Pressure, 6 inches of water column (w.c), methane concentration 45%, saturation 2%, and hydraulic conductivity values for the coarsest 10% of the material under the site as tabulated in the spreadsheet. 2.1 METHANE EXTENT The project proponent should provide concentration of methane in probes or other measurement points (i.e. vaults, crawl spaces, water well headspace, etc.). Other relevant data might include site history, depth to water, presence of other methane sources including oil fields, utility lines, septic systems, swamps/wetlands, sanitary landfills, or hydrocarbon spills that could be contributing factors. Single measurements of methane are not sufficient to characterize the source. Some methane sources go dormant for part of the year, making finding the peak methane concentration time-consuming. A solution is to irrigate to demonstrate the range of likely methane levels and find the peak. Commercial firms specialize in setting up temporary irrigation facilities for specified time periods, including bringing in and later disassembling piping and sprinklers, on a rental basis. Data submitted should include tabular summaries of measurements, maps and cross sections illustrating the extent and history of the problem, including seasonal variation. Probes may be temporary or permanent, but should be constructed with a working lifetime of at least a year. Probe depths similar to
Evaluation of Biogenic Methane Chapter 2-Field Data Needs Page 2-2
those used for VOC investigations are preferred, with similar limitations. Generally, 25’, 15’ and 7’ bgs are preferred, but circumstances may dictate a different depth. Very shallow probes may be difficult to seal unless they are in paved areas. Vent risers or other similarly constructed features would be considered if suitably designed and sealed, and a deeper probe was installed so that the gradient could be measured. 2.2 SOIL PARAMETERS Provide field and laboratory information characterizing the fill, including boring logs signed by an appropriately registered professional (geologist, soil or civil engineer) showing depth, USCS (Unified Soil Classification System) soil type, field moisture content, Munsell color (important for establishing redox state of the soil), location and concentration of organics or other descriptive data) (Munsell color 11,12 -- hue (actual color), value (lightness or darkness) and
chroma (strong or weak) -- is used by the USDA (United States Department of Agriculture) to infer redox states of soils, and is therefore considered a valid tool to describe the oxidation state of the soils.13). See also Appendix B. Laboratory soil data: For representative soil types in the fill, provide soil density, field moisture, grain size analysis, and Atterberg limits (parameters identifying solid, semi-solid, plastic and liquid state limits for fine grained soils, and useful for distinguishing between silt and clay, and between different types of silts and clays). Provide a measurement of the vadose zone air permeability for the fill. The USACE EM 1110-1-4001 Appendix D should be consulted for a discussion of methods to measure air permeability. In general, small core samples are not representative of the effective air permeability of acre-scale regions of the vadose zone, since most gas exchange follows paths of least resistance along old borings, root holes, cracks, burrows, trenches, lift surfaces in fills, or other kinds of discontinuities. Permeameter data will be de-rated by an order of magnitude in K for every order of magnitude of length between the sample size and the area of the methane problem. (i.e., If a lab test yields a permeability of 10^-5 cm/sec for a 5 cm sample, then it will be de-rated as 10^-4 at 50 cm, 10^-3 at 500 cm, etc.) .
2.3 PRESSURE READINGS Provide data sufficient to show the maximum natural pressure gradient in the soil. Single pressure measurements are not acceptable. However, a default value of the maximum likely pressure differential, here considered 6
11 Munsell, Albert H. (1905). A Color Notation 12 Munsell, Albert H. (January 1912). "A Pigment Color System and Notation". The American Journal of Psychology (University of Illinois Press) 23 (2): 236–244. doi:10.2307/1412843. 13 http://soils.usda.gov/education/resources/lessons/color/
Evaluation of Biogenic Methane Chapter 2-Field Data Needs Page 2-3
inches w.c., may be used. Since soil gas pressure is affected by barometric pressure, a data-logging pressure transducer will likely be needed, capable of recording pressure every 10 minutes for three or more days. The pressure transducer should have a sensitivity of at least a half inch w.c. Because the sensor data are generally noisy, they may be smoothed using a 6- or 10-point moving average to facilitate calculating the maximum instantaneous pressure gradient. Probe construction must ensure that there are no air leaks along the casing, since this will preclude representative differential pressures measurements. While new probes with fresh bentonite are generally airtight, old probes with dried-out seals may leak, so leak testing must be performed before pressure measurements can begin, and the seal rehydrated if necessary. The rehydration period should be at least a day to allow the bentonite to rehydrate, considering that it likely took a year to dry out. The most current version of Soil Gas Advisory should be used for sampling and construction of soil gas probes. Differential pressure is measured between adjacent probes, not across intermediate probes. Pressure from a 25’ probe must pass across the 15’ probe before reaching the 7’ probe. The pressure gradient is determined by dividing the pressure by the distance between the probes in any convenient set of consistent units (ft/ft, inches/inches, cm/cm etc) to obtain a dimensionless gradient. Building vacuum may be added to the natural gradient, again in consistent units. An ideal case would be to measure pressure during the onset of a storm front with a substantial drop in barometric pressure, such as winter storms or summer thunderstorms. The most difficult time to sample is often during the late summer, when the soil is at its driest and there is little variation in barometric pressure. Any extraordinary pressures induced by the building should be considered in addition to the natural gradient. However, in most commercial buildings, heating-ventilating-air-conditioning (HVAC) systems are positive pressure, maintained at between 0.02 and 0.03 “H2O (inches of water column equivalent pressure). Positive HVAC pressures may be as low as 0.01 “H2O in older systems, or as high as 0.05 “H2O in applications such as clean rooms. For negative pressure systems, which might induce soil vapor flux into the occupied space, one might assume -0.01 to -0.02 “H2O. For buildings without HVAC, or where such systems are not in operation, there can also be transient pressure gradients caused by wind and stack effects. Little information is available regarding how much of this pressure would induce flow from the soil versus through the above grade building shell, although the shell contribution will be significant. Because positive or negative induced pressures are normally in the order of a few hundredths of an inch of water, they do not substantially affect the calculations of soil vapor intrusion when using default values of two to four inches of water for soil vapor
Evaluation of Biogenic Methane Chapter 2-Field Data Needs Page 2-4
pressure. It should be noted that the soil vapor pressures induced by barometric lag are generally much greater than pressures generated by decomposition. 2.4 ORGANIC CARBON CONTENT AND MOISTURE CONTENT Describe the origin, source, age, moisture content, and total mass of organic matter in the fill. The purpose of this is to allow estimation of the probable rate of decomposition as described above, and find the generation rate to compare with the flux calculation. This information will have been generated as described in Section 1.3 above. 2.5 FIXED GAS ANALYSIS Provide information on the other fixed gases present in the vadose zone besides methane. The data should include concentration in ppm or percent as appropriate. Fixed gas analysis may be by field instruments (i.e. GEM14 unit or CGI15 or other similar equipment) but 10% of samples should be analyzed by GC (gas chromatograph). The gas analyses should include methane, oxygen, carbon dioxide, and nitrogen (or balance gas for field instruments), and other detected gases such as H2S, non-methane hydrocarbons (such as ethane, propane, butane, pentane+), hydrogen, and carbon monoxide. Note that field instruments for measuring fixed gases are not generally designed to operate at temperatures above 100 degrees Fahrenheit. Particularly, LCD displays and oxygen sensors behave badly. (Freezing weather has its own challenges with calibration problems and batteries freezing.) Field data should include a statement of the outside temperature. Note also that field instruments using infrared analyzers are calibrated to methane, but still have cross-sensitivity to ethane, propane, butane and other higher order combustible vapors. In the presence of these gases, the methane readings may be overstated. GC analyses should be reviewed to check on the accuracy of the field instruments.
14 Landtec Company 15 Mine Safety Appliance Company
Evaluation of Biogenic Methane Chapter 3-Technical Approach Page 3-1
CHAPTER 3 - TECHNICAL APPROACH An Excel® Spreadsheet Has Been Prepared to aid calculation of Flux.
This spreadsheet uses the identified data from the field investigation to calculate the flux into a building. The following sections describe the input data 3.1 AIR PERMEABILITY (KAIR) AND SATURATION Air permeability is calculated from user input hydraulic conductivity data. It is much more common to have hydraulic conductivity data for a soil sample than to have air permeability data. However, if air permeability has been measured directly, that data should be entered into the appropriate cell under the Output section of the excel spread sheet. Conductivity should be de-rated as described in Section 2.2 above when the soil area tested is very small. The spread sheet algorithm for converting hydraulic conductivity to air permeability is as follows:
Evaluation of Biogenic Methane Chapter 3-Technical Approach Page 3-2
ka = kh [ w a / a w]
where w = viscosity of water (0.011 poise)16 a = specific gravity of water (1 g/cc) a = viscosity of air (0.00018 poise)17
w = specific gravity of air (0.0012 g/cc)18
When hydraulic conductivity information is not directly available for the site soils, the spreadsheet uses default values, based upon the type of soil, from the following table:
Conductivities in compacted fill are often lower than in natural soils.
16 CRC Handbook of Chemistry and Physics, 65th Ed., page F35, viscosity of water 0.010019 poise at 20oC. 17 http://en.wikipedia.org/wiki/Viscosity, visc. air = 1.78 × 10⁻⁵ kg/(m·s) at 15.0 °C (1kg/(m·s)=10poise) 18 CRC Handbook of Chemistry and Physics, 65th Ed., page F10, specific gravity air 0.010019 poise at 20oC
Evaluation of Biogenic Methane Chapter 3-Technical Approach Page 3-3
3.2 PRESSURE GRADIENT (I) The pressure gradient is calculated from the supplied data. However, a default value of the maximum likely pressure differential, here considered 2-inches w.c., or higher, may be used (see discussion, limitation regarding the use of Darcy’s law, Section 1.2). Normally, pressures found in the soil due to barometric lag are a fraction of an inch of water. Pressures exceeding two inches of water are considered significant and suggest the need for explanation beyond normal barometric lag. The building’s negative pressure is entered in the lower section. The total of the two are used in calculating the gradient. 3.3 SATURATION Saturation is obtained from the soils lab data. Saturation decreases permeability, and varies from about 5% to about 50% for drained soils. Saturation “ ” is entered into the spread sheet as a unitless value between 0 and 1 (zero representing no saturation, and one or “unity” representing 100% saturation). The spread sheet calculates adjusted ka = ka* (1- ) 3.4 EVALUATION OF POTENTIAL MAXIMUM METHANE
CONCENTRATION BY FIXED GAS ANALYSIS
Subsurface monitoring probes are used to measure soil gas concentrations, according to the protocols described elsewhere in this document. The subsurface methane concentration utilized in the spreadsheet should never be less than the maximum concentration measured in the soil, and DTSC staff may require that the number conservatively consider the maximum anticipated concentration based on removing the effects of oxidation from shallow probe data, where oxidations effects are considered significant. 3.5 ESTIMATION OF FLUX UNDERNEATH THE BUILDING Methane flux is calculated from Darcy’s law after suitable unit conversion. Flux is the product of air permeability, the gradient, and the area, for which the J&E crack area formula is used.
Evaluation of Biogenic Methane Chapter 3-Technical Approach Page 3-4
CHAPTER 4 - TECHNICAL APPROACH FOR ESTIMATION OF
ALLOWABLE FLUX As indicated in section 3.0, once the flux is estimated in the subsurface, it is necessary to consider what concentration could be expected in an enclosed space (building). The spreadsheet provides an analytical solution to convective transport of methane gas. Since concentration in an enclosed space is also a function of air exchange rate, building volume, and crack area, it is necessary to input the numerical values of these parameters in the spreadsheet. The Johnson and Ettinger (J&E model) already provides a framework regarding estimation of the attenuation factors or estimation of soil gas concentration that can be left in-place. 4.1 CONCENTRATION THRESHOLD Previous DTSC guidance conservatively included 500 ppmv indoor air methane as a threshold concentration, which would necessitate further evaluation at a site. For the purpose of using this model, the same indoor air methane concentration of 500 ppmv should be used in the spreadsheet when estimating the corresponding soil gas concentration that can be left in-place. 4.2 AIR EXCHANGE RATE
The model incorporates the building parameters including air exchange rate to determine sub-surface soil gas concentration. It is recommended that an exchange rate of 0.5 per hour be used. Higher air exchange rates can only be used if proper justification is provided and DTSC project manager is consulted.
4.3 BUILDING VOLUME The building parameters including length, width, and height in feet need to be measured and incorporated in the model.
4.4 ALLOWABLE SUB-SLAB SOIL GAS CONCENTRATION
The goal of this model is to estimate the allowable soil gas concentration in the subsurface based on the soil gas flux calculated from the Darcy’ flow equation using either default or the data collected from the field. The methodology sets indoor air concentration limit at 500 ppmv and uses building parameters, air exchange rate for estimating soil gas concentration underneath the slab. The spread sheet uses the following algorithm:
C1 = C2*[(AEH*B)/Q]
where
C1: Methane concentration in soil gas entering building through slab, ppmv
Evaluation of Biogenic Methane Chapter 4 – Tech Approach for Estimation of Allowable Flux Page 4-2
C2: Equilibrium indoor air concentration, ppmv (DTSC default 500 ppmv) AEH: Air exchange rate per hour (DTSC default 0.5 per hour) B : Building volume in cubic centimeters Q: estimated soil gas flux (see calculation below)
The algorithm is based on the principal of conservation of mass with application to the average concentration of soil vapor in the building. The average concentration in the building is the function of subsurface soil gas concentration, outside concentration of contaminant in the air, air exchange rates, and building volume. Since the leakage into the building is considered insignificant, therefore concentration in the outdoor air is set at zero to derive the algorithm. This is more conservative since it minimizes the dilution associated with outdoor air intrusion.
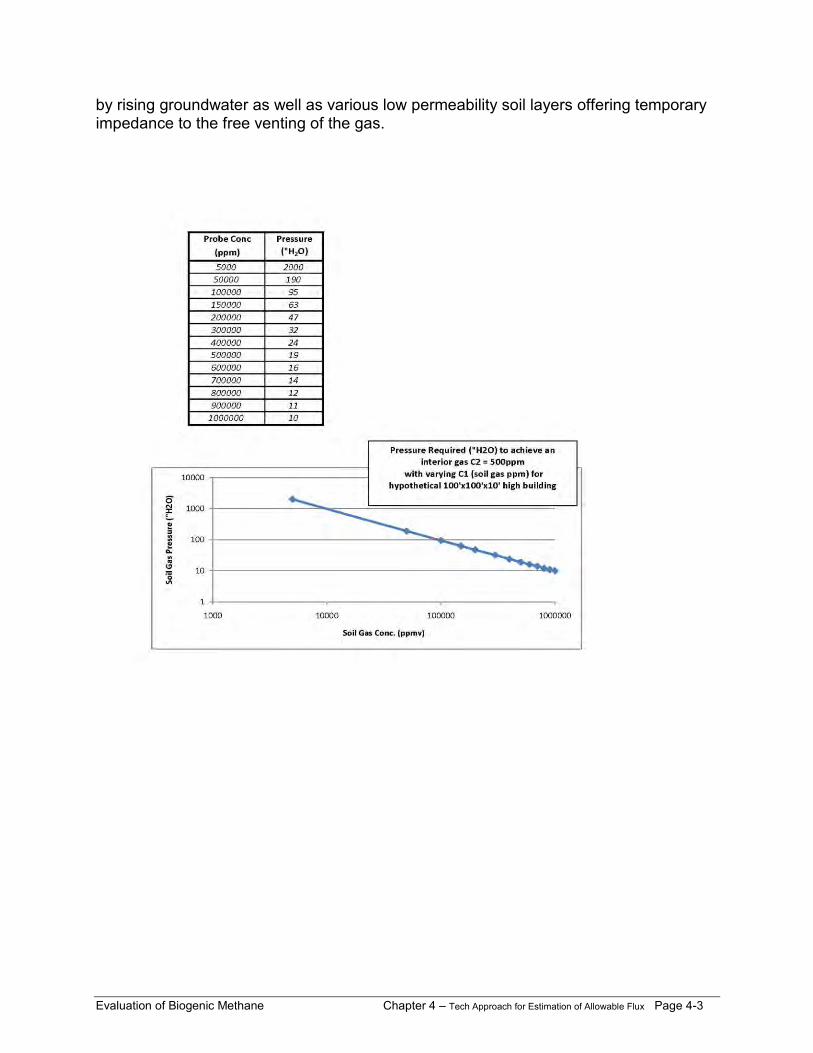
4.5 ALLOWABLE SUB-SLAB SOIL GAS PRESSURE Only pressurized methane soil gas can achieve explosive concentrations in building space abutting the gassy soil.19 The goal of the calculation is to determine what soil gas pressures are required, at various soil gas concentrations, to achieve an indoor air concentration of 500 ppmv. Using the same soil and building size parameters of the previous example, and inputting the data for various pressure gradients into the excel spread sheet, we can develop a table of values and plot that in a curve, which becomes a straight line on a log-log scale (see below). The results are consistent with real life experience. At a soil gas concentration of 5,000 ppmv methane, a soil gas pressure of 2,000 inches of water would be required to drive flux to the extent that the building would have an interior air concentration of 500 ppmv methane. At the other end of the scale, at a soil gas concentration of 1,000,000 ppmv methane (100%), a soil gas pressure of 10 inches of water would be required to drive flux to the extent that the building would have an interior air concentration of 500 ppmv qualitatively the model results are valid (i.e. increasing soil gas pressure = increasing risk). The 1985 Ross explosion20 in the Fairfax area of Los Angeles was caused by the intrusion of large amounts of thermogenic soil gas (methane associated with petroleum sites) into a small room of a clothing store, perhaps ignited by an employee time clock, in an area of the city already well known for it seeping tars and gases (i.e. the world famous La Brea Tar Pits). Pressures of up to 27 psi were recorded in the field following the incident. It has been estimated that the gases were as high as 40 psi in the soil under the building just before combustion occurred.21 This is equivalent to over 1,000 inches of water column pressure. Pressure in the ground may have been exacerbated
19 Sepich, 2008, p. 7 20 Methane Gas Within the Fairfax District, Los Angeles, by Joseph W. Cobarrubias, paper published in Engineering Geology Practice in Southern California, - 1992, Association of Engineering Geologists, p. 131-143. 21 Cobarrubias, 2008.
Evaluation of Biogenic Methane Chapter 4 – Tech Approach for Estimation of Allowable Flux Page 4-3
by rising groundwater as well as various low permeability soil layers offering temporary impedance to the free venting of the gas.
Evaluation of Biogenic Methane Chapter 5 – Conclusions Page 5-1
CHAPTER 5 - CONCLUSIONS Using site-specific data, the above described spreadsheet, along with the described data collection methods, can be used to predict whether buildings at a particular site may be at risk from methane in soil gas. Use of the flux calculation method as shown in the supplied spreadsheet indicates that at low soil gas pressures, there is de minimus risk; but that at elevated soil gas pressures the risk increases with pressure. In addition to the above protocol, sites without significant pressure must be evaluated to determine the risk of re-pressurization at some time in the future. As indicated in the preceding sections, indoor air impacts of 500 ppm or greater are seldom achievable under ordinary conditions as calculated by the flux model. However, acquiring sufficient data to document the source of the methane, and to eliminate other sources, should be the goal of the initial investigation. Because some sites could have methane coming from multiple sources, sufficient data should be obtained to ascertain that fill material and/or dairy operations are the predominant sources. This guidance is not designed to address sites with methane from petrogenic source. The use of the fixed-gas analysis tool can help distinguish between petrogenic and biogenic sources. Isotope studies can help distinguish between young fill sources and older sedimentary sources such as peat bogs, marsh, or similar naturally occurring deposits. Landfill gas is distinguishable by its VOC content. In urban areas, natural-gas leaks can occur and must be distinguished from fill material sources. The flux method appears to be a useful way to help identify and document low-risk sites and eliminate costly and unnecessary investigations and remedial construction at sites with low-volume and low-pressure methane in underlying fill soils.
Evaluation of Biogenic Methane Appendix A
Appendix A
Interpretation of Fixed Gas Analysis
Evaluation of Biogenic Methane Appendix A-1
Appendix A
Interpretation of Fixed Gas Analysis
Fixed gas analyses (the four principal gases of interest, methane, carbon dioxide,
oxygen, and nitrogen) are very useful in establishing the origin and fate of methane in
soil gas. Methane can be produced biogenically, that is, by anaerobic degradation of
organic matter, or can come from a petroleum-related natural gas, either by direct
migration from oil fields, or by utility line leaks or other artificial sources. While
advanced isotopic and laboratory analysis can help pinpoint the origin of the gas, simple
examination of the proportions of the four fixed gases can often identify the origin of the
gas by differences in ratios of degradation products. A spreadsheet has been
developed to aid in this analysis. This tool takes data from measurements at probes or
other measurement points, and uses basic assumptions about starting compositions
and the chemistry of oxidation of methane when it mixes with atmospheric air in soil.
Then it performs are four groups of calculations: dilution of the target with air, oxidation
of target’s methane to CO2, and adding or removing oxygen from iron or sulfate in the
soil to further modify the CO2 and O2 concentrations. When the target line matches one
of the four process lines and the cells in the corresponding column are all green, then
the relevant processes are considered quantified. Finally, the sheet describes in words
what the probe data mean.
Evaluation of Biogenic Methane Appendix A-2
The sheet shows the chemical reactions being used in the calculations, which are
simple calculations of ratios according to the chemical formulas. The slider buttons will
change the percentages of each process, but data can also be entered directly into the
yellow boxes. The chart shows progress in matching the composition. Not all lines will
match the target, but one line should provide a best fit. Occasionally, one box simply
will not match within 2%, so in that case, it is best to make sure methane matches, and
let nitrogen be a little off. (This situation probably means there is another reaction which
the model does not include.)
Evaluation of Biogenic Methane Appendix A-3
The reactions:
Source Gas: When the slider is at zero, the source is 100% biogenic. The slider adds
petrogenic gas, which is 100% methane, at the stated ratio and calculates the resulting
new concentrations of each gas in turn. When the result is within 1% of the target, the
cell goes green.
Dilution: When the slider is at zero, no mixing with atmospheric air occurs. As air is
mixed, the new proportion of each fixed gas is calculated. Again when the result is
within 1% of the target, the cell goes green.
Iron oxidation: When the slider is at zero, no additional O2 is removed from the system.
The slider removes a percentage of O2 and converts recalculates N2, leaving methane
and CO2 alone. This may be thought of as the natural weathering process of fill soils.
Iron reduction: When the slider is at zero, no O2 is added to the system from reduction
of iron (or other sources of inorganic oxygen, such as sulfate (SO3) or nitrate (NO3)).
When this process is active, often H2S is observed as an accessory gas. This indicates
that sulfate-reducing bacteria are active as well as methane-producing bacteria. These
soils are often black or show reducing colors, demonstrating that iron, at least, is one of
the contributors of O2.
Experimenting with the supplied datasets will illustrate the operation of the sheet, and
how the data show different origins and subsequent degradation histories.
Evaluation of Biogenic Methane Appendix B
Appendix B
Using Munsell Colors to Infer Soil Redox Conditions
Evaluation of Biogenic Methane Appendix B-1
Appendix B
Using Munsell Colors to Infer Soil Redox Conditions
For most California soils ultimately derived from igneous bedrock, the dominant pigment
is iron, derived from weathering of ferromagnesian minerals. Weathering consists of
oxidation and hydration of the generally reduced minerals, and iron species generally
oxidize or hydrolxylize, forming hematite and goethite. Under reducing conditions,
these compounds lose oxygen and iron is reduced, generally combining with reduced
sulfur to form iron sulfide or pyrite (FeS). These iron compounds have characteristic
colors, and correspond to Munsell colors. Oxidized iron produces reds, yellow, and
orange-toned soils, and reduced iron produces olive, green, gray, blue or black soils.
The USDA routinely uses Munsell colors to identify the oxidation state of waterlogged
soils, and the USACE uses Munsell colors to identify permanent waterlogged soils for
the purpose of establishing perennial streams. However, using Munsell colors to infer
redox states in soils has not been commonly established as a practice in environmental
studies.
Table 1. Iron species, grain size, and colors of soils (USDA)
Name Composition Particle Size Munsell Color Visual Color Goethite FeOOH (1-2 m m) 10YR 8/6 Yellow Goethite FeOOH (~0.2 m m) 7.5YR 5/6 Strong Brown
Hematite Fe2O3 (~0.4 m m) 5R 3/6 Red Hematite Fe2O3 (~0.1 m m) 10R 4/8 Red Lepidocrocite FeOOH (~0.5 m m) 5YR 6/8 Reddish-
Yellow Lepidocrocite FeOOH (~0.1 m m) 2.5YR 4/6 Red Ferrihydrite Fe (OH)3 2.5YR 3/6 Dark Red Glauconite K(SixAl4-x)(Al,Fe,Mg)O10(OH)2 5Y 5/1 Dark Gray
Iron Sulfide FeS 10YR 2/1 Black
Evaluation of Biogenic Methane Appendix B-2
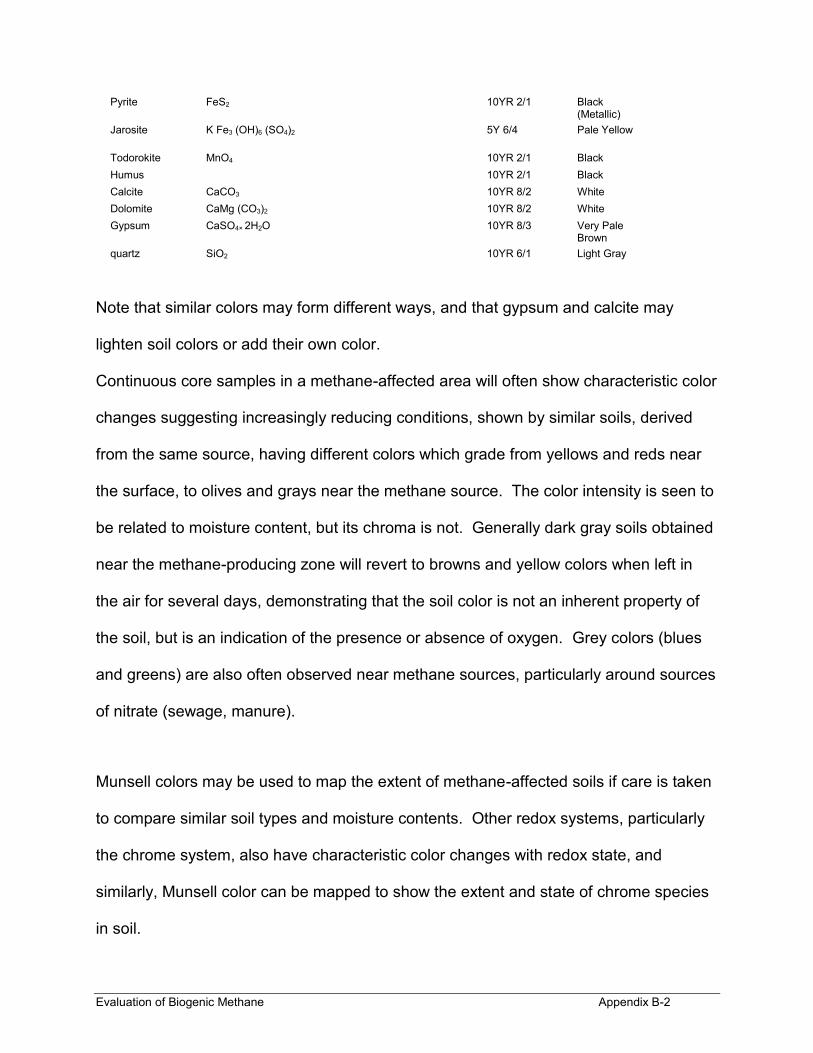
Pyrite FeS2 10YR 2/1 Black
(Metallic) Jarosite K Fe3 (OH)6 (SO4)2 5Y 6/4 Pale Yellow
Todorokite MnO4 10YR 2/1 Black Humus 10YR 2/1 Black Calcite CaCO3 10YR 8/2 White Dolomite CaMg (CO3)2 10YR 8/2 White Gypsum CaSO4× 2H2O 10YR 8/3 Very Pale
Brown quartz SiO2 10YR 6/1 Light Gray
Note that similar colors may form different ways, and that gypsum and calcite may
lighten soil colors or add their own color.
Continuous core samples in a methane-affected area will often show characteristic color
changes suggesting increasingly reducing conditions, shown by similar soils, derived
from the same source, having different colors which grade from yellows and reds near
the surface, to olives and grays near the methane source. The color intensity is seen to
be related to moisture content, but its chroma is not. Generally dark gray soils obtained
near the methane-producing zone will revert to browns and yellow colors when left in
the air for several days, demonstrating that the soil color is not an inherent property of
the soil, but is an indication of the presence or absence of oxygen. Grey colors (blues
and greens) are also often observed near methane sources, particularly around sources
of nitrate (sewage, manure).
Munsell colors may be used to map the extent of methane-affected soils if care is taken
to compare similar soil types and moisture contents. Other redox systems, particularly
the chrome system, also have characteristic color changes with redox state, and
similarly, Munsell color can be mapped to show the extent and state of chrome species