Desalination and Water Purification Research and Development Program Report No. 116 Evaluation of Biological Treatment for Perchlorate-Impaired Water Supplies U.S. Department of the Interior Bureau of Reclamation June 2008
Transcript
Desalination and Water Purification Research and Development Program Report No. 116
Evaluation of Biological Treatment for Perchlorate-Impaired Water Supplies
U.S. Department of the Interior Bureau of Reclamation June 2008
REPORT DOCUMENTATION PAGE Form Approved OMB No. 0704-0188
Public reporting burden for this collection of information is estimated to average 1 hour per response, including the time for reviewing instructions, searching existing data sources, gathering and maintaining the data needed, and completing and reviewing this collection of information. Send comments regarding this burden estimate or any other aspect of this collection of information, including suggestions for reducing this burden to Department of Defense, Washington Headquarters Services, Directorate for Information Operations and Reports (0704-0188), 1215 Jefferson Davis Highway, Suite 1204, Arlington, VA 22202-4302. Respondents should be aware that notwithstanding any other provision of law, no person shall be subject to any penalty for failing to comply with a collection of information if it does not display a currently valid OMB control number. PLEASE DO NOT RETURN YOUR FORM TO THE ABOVE ADDRESS.
T1. REPORT DATE (DD-MM-YYYY) T June 2008
T2. REPORT TYPE T
Final T3. DATES COVERED (From - To)T March 2004 to May 2005
5a. CONTRACT NUMBER Agreement No. 03-FC-81-0921
5b. GRANT NUMBER
T4. TITLE AND SUBTITLE Evaluation of Biological Treatment for Perchlorate-Impaired Water Supplies
9. SPONSORING / MONITORING AGENCY NAME(S) AND ADDRESS(ES) U.S. Department of the Interior Bureau of Reclamation Denver Federal Center PO Box 25007 Denver CO 80225-0007
11. SPONSOR/MONITOR’S REPORT NUMBER(S)
DWPR No. 116
12. DISTRIBUTION / AVAILABILITY STATEMENT Available from the National Technical Information Service Operations Division, 5285 Port Royal Road, Springfield VA 22161 13. SUPPLEMENTARY NOTES T
Report can be downloaded from Reclamation Web site: www.usbr.gov/pmts/water/publications/reports.html
14. ABSTRACT Several studies have evaluated multiple treatment technologies for perchlorate removal. Of the myriad of technologies available, ion exchange with brine treatment has the advantage of destroying perchlorate and nitrate in the spent brine and does not produce another waste stream that has to be disposed. In this study, the performance of a biologically enhanced ion exchange process that incorporates brine treatment and reuse was investigated. The biological brine treatment process evaluated treated spent brine containing perchlorate and nitrate. Treated groundwater (free of perchlorate and nitrate) was produced from the ion-exchange process, which was regenerated using treated and reused brine from the biological brine treatment process. Results of 20 cycles of resin exhaustion and regeneration using treated brine showed that the ion exchange process could successfully remove perchlorate and nitrate to meet California Department of Health Services operational goals. More importantly, the biological brine treatment system consistently reduced perchlorate and nitrate concentrations in the spent brine (6-percent sodium chloride [NaCl]) within 24 hours to below treatment goals (perchlolate [ClO4
-] < 100 micrograms per liter [µg/L] and nitrate [NO3-] < 0.5 milligrams as
nitrogen per liter [mg-N/L]) for 20 (re)cycles. This was the first pilot-scale demonstration of biological destruction of perchlorate and nitrate in 6-percent NaCl spent brine using the salt-tolerant culture developed by the project team. Previous studies have been successful only with a 3-percent NaCl acclimated culture. 15. SUBJECT TERMS desalination, perchlorate, nitrate, biological, sequencing batch reactor (SBR), fluidized bed reactor (FBR), ion exchange (IX) 16. SECURITY CLASSIFICATION OF:
UL 19a. NAME OF RESPONSIBLE PERSONT
Steve Dundorf a. REPORT
UL b. ABSTRACT
UL c. THIS PAGE
UL
17. LIMITATION OF ABSTRACT
SAR
18. NUMBER OF PAGES
40 19b. TELEPHONE NUMBER (include area code)
303-445-2263
SS Standard Form 298 (Rev. 8/98) P Prescribed by ANSI Std. 239-18
U.S. Department of the Interior Bureau of Reclamation Technical Service Center Water and Environmental Services Division Water Treatment Engineering Research Team Denver, Colorado June 2008
Desalination and Water Purification Research and Development Program Report No. 116
Evaluation of Biological Treatment for Perchlorate-Impaired Water Supplies
Prepared for Reclamation Under Agreement No. 03-FC-81-0921
The views, analysis, recommendations, and conclusions in this report are those of the authors and do not represent official or unofficial policies or opinions of the United States Government, and the United States takes no position with regard to any findings, conclusions, or recommendations made. As such, mention of trade names or commercial products does not constitute their endorsement by the United States Government.
MISSION STATEMENTS
The mission of the Department of the Interior is to protect and provide access to our Nation's natural and cultural heritage and honor our trust responsibilities to Indian tribes and our commitments to island communities.
The mission of the Bureau of Reclamation is to manage, develop, and protect water and related resources in an environmentally and economically sound manner in the interest of the American public.
Acknowledgement The authors would like to gratefully acknowledge the contributions of the following individuals: Chet Anderson, Steve Seffer, and Ken Godbey from Azusa Light & Water for providing the pilot test site and operation support; Dr. Debbie Roberts, Dr. Dennis Clifford, Dr. Xiaohua Lin, and Tanushree Hiremath from the University of Houston for providing the perchlorate brine culture inoculum and continued guidance during the project; and Joan Oppenheimer, Brian Gallagher, Eric Bruce, and Darren Giles from MWH’s Applied Research Department for providing project assistance, preparing pilot-scale equipment, and providing operational support throughout the project.
Finally, the authors would like to extend their appreciation to the Bureau of Reclamation for their support in the implementation of this project.
v
Table of Contents
Page
Acronyms................................................................................................. ix
1. Executive Summary ........................................................................... 1 1.1 IX Process Baseline Testing ..................................................... 1 1.2 Brine Treatment and Reuse....................................................... 2 1.3 Alternative Reactor Evaluation................................................. 2 1.4 Cost Analysis ............................................................................ 3 1.5 Recommendations..................................................................... 3
2. Introduction........................................................................................ 5 2.1 Background............................................................................... 5 2.2 Perchlorate Treatment Technologies ........................................ 6 2.2.1 Technology Implementation Status .............................. 8 2.2.2 Perchlorate Treatment for Drinking Water ................... 9 2.3 Biologically Enhanced IX Treatment ....................................... 11 2.3.1 Brine Treatment and Reuse........................................... 13 2.4 Objectives of the Study............................................................. 14
3. Conclusions and Recommendations .................................................. 15
4. Materials and Methods....................................................................... 19 4.1 Pilot Plant.................................................................................. 19 4.1.1 Influent Water Quality Parameters ............................... 19 4.1.2 IX Process Description ................................................. 20 4.1.3 Biological Brine Treatment Process ............................. 21 4.1.4 Operational and Design Parameters.............................. 25 4.2 Summary of Sampling and Analytical Plan.............................. 26 4.3 Analytical Methods................................................................... 27 4.4 Quality Assurance/Quality Control (QA/QC) .......................... 27 4.4.1 IX/ Brine Treatment Pilot Processes............................. 27 4.4.2 Sampling and Laboratory Analyses .............................. 28
5. Results and Discussion ...................................................................... 29 5.1 IX Operation ............................................................................. 29 5.1.1 Initial Resin Evaluation................................................. 29 5.1.2 Baseline IX Performance .............................................. 31 5.2 Biological Brine Treatment....................................................... 36 5.2.1 Culture Growth and Acclimation.................................. 36 5.2 2 Brine Treatment and Reuse........................................... 38 5.3 Alternative Reactor Evaluation................................................. 44 5.3.1 Bench-Scale FBR Performance .................................... 46
6.2 Estimated Treatment Costs ....................................................... 53 6.2.1 Capital Cost................................................................... 53 6.2.2 Operation and Maintenance Costs ................................ 54 6.2.3 Total Water Production Costs....................................... 57
REFERENCE LIST ................................................................................. 59
Appendix A Conceptual Estimation of Capital and Operation and Maintenance Costs for Different Treatment Alternatives.................. 61 List of Figures Figure Page
2-1 Perchlorate releases as of April 2003 (EPA, 2003) .................. 5 2-2 Brine treatment and reuse flow schematic ................................ 12 4-1 Pilot plant trailer, influent reservoir, and well pump head ....... 19 4-2 IX with brine treatment pilot plant............................................ 20 4-3 IX with brine treatment pilot plant process schematic.............. 22 4-4 Biological brine treatment system ............................................ 23 4-5 FBR schematic .......................................................................... 24 5-1 Exhaustion profile for the initial evaluation of the polyacrylic resin................................................................... 29 5-2 Polyacrylic resin regeneration evaluation................................. 30 5-3 Comparison of exhaustion profiles during baseline testing (runs 1, 5, 10) ....................................................................... 31 5-4 End of exhaustion water quality at 255 BV during base line testing............................................................................ 32 5-5 Regeneration profiles during baseline testing (runs 1, 5, 10) ....................................................................... 33 5-6 Regeneration profile of perchlorate during baseline testing (runs 1, 5, 10) ....................................................................... 34 5-7 Regeneration profile of nitrate during baseline testing (run 1, 5, 10)......................................................................... 34 5-8 Regeneration profile of bicarbonate during baseline testing (run 1, 5, 10).............................................................................. 35 5-9 Regeneration profile of sulfate during baseline testing (run 1, 5, 10)......................................................................... 35 5-10 6-percent brine culture kinetic performance ............................. 38 5-11 Comparison of exhaustion profiles during brine reuse testing (runs 1, 10, 20) ......................................................... 39 5-12 Exhaustion water quality at 240 BV during brine recycling testing ................................................................... 40
vii
List of Figures (continued) Figure Page
5-13 Composite spent brine anions prior to biological brine treatment ..................................................................... 41 5-14 Profile of perchlorate concentration during different regeneration runs.................................................................. 42 5-15 Profile of nitrate concentration during different regeneration runs.................................................................. 43 5-16 Profile of sulfate concentration during different regeneration runs.................................................................. 43 5-17 Profile of bicarbonate concentration during different regeneration runs.................................................................. 44 5-18 Concentration profile of the FBR effluent data ........................ 47 6-1 Capital costs for different treatment alternatives ...................... 54 6-2 Annual O&M costs for each treatment alternatives.................. 55 6-3 Contribution of each O&M component to total O&M cost in conventional IX.............................................. 55 6-4 O&M components for each treatment alternative normalized with respect to O&M costs for conventional IX process....................................................... 56 List of Tables Table Page
2-1 Pros and Cons of Perchlorate Treatment Technologies from AwwaRF Sponsored Studies....................................... 8 2-2 Perchlorate Treatment Classification Categories from GWRTAC May 2001 Technology Status Report ................ 9 2-3 Perchlorate Treatment Classification Categories as of 2004............................................................................. 10 2-4 Perchlorate Leakage Estimates Based on UH EMCT-Windows Program ............................................ 14 4-1 Influent Water Quality Summary (November 2004 to February 2005)................................................................. 20 4-2 IX System Design and Operational Parameters........................ 25 4-3 Sampling and Analytical Plan................................................... 26 4-4 Summary of Approved or Standard Analytical Procedures............................................................................ 28 5-1 Constituents of Synthetic Medium............................................ 37 5-2 Operational Parameters for FBR............................................... 46 6-1 Range of Construction-related Costs ........................................ 51
viii
List of Tables (continued) Table Page
6-2 Recommended Contingency for Corresponding Level of Estimate ................................................................. 51 6-3 Summary of Engineering Assumptions Used in the IX Cost Analysis .................................................................. 52 6-4 Summary of Assumptions Used in Cost Model for Brine Treatment Options................................................ 52 6-5 Total Water Production Cost for Each Treatment Process ....... 58
ix
Acronyms AwwaRF American Waterworks Association Research Foundation BV bed volume CDPH California Department of Public Health CCL Contaminant Candidate List Cl- chloride ClO4
- perchlorate cm centimeter DLR detection limit for purpose of reporting DoD Department of Defense DO dissolved (aqueous) oxygen DOE Department of Energy EBCT empty bed contact time EMCT Equilibrium Multi-Component Theory FBR fluidized bed reactor ft feet ft3 cubic feet GAC granular activated carbon gpm gallons per minute gpd gallons per day GWRTAC Groundwater Remediation Technologies Analysis Center HCl hydrochloric acid HRT hydraulic residence time IX ion exchange L liter lbs/ft3 pounds per cubic feet M molar MBfR membrane biofilm reactor MCL maximum contaminant level Mg magnesium mg/L milligram per liter mg-N/L milligrams as nitrogen per liter min minute mL milliliter MWH Montgomery Watson Harza
x
Acronyms (continued)
NaCl sodium chloride NDCEE National Defense Center for Environmental Excellence NF nanofiltration ND nondetect NH4ClO4 ammonium perchlorate nm nanometer NO3
- nitrate NSF National Science Foundation O2 oxygen OEHHA Office of Environmental Health Hazard Assessment PHG Public health goal PLC programmable logic controller PNDM Perchlorate and Nitrate Destruction Module ppm parts per million PVC polyvinylchloride QC quality control Reclamation Bureau of Reclamation RfD reference dose RO reverse osmosis RPD relative percent deviation SBR sequencing batch reactor SERDP Strategic Environmental Research and Development Program SO4
2- sulfate TDS total dissolved solids UCMR Unregulated Contaminants Monitoring Rule UF ultrafiltration EPA United States Environmental Protection Agency µg/L micrograms per liter µL microliter µS microsiemens
1
1. Executive Summary Since the detection of perchlorate in some California groundwater, a large number of wells have been forced to shut down. The current California Department of Public Health (CDPH) maximum contaminant level Public Health Goal is set at 6 micrograms per liter (µg/L), whereas the average concentration of perchlorate in impacted waters in California is approximately 20 µg/L. A number of feasible treatment technologies have been identified. However, most technologies involve a transfer of perchlorate from water to another phase or the generation of a concentrated perchlorate laden waste stream, which still poses the problem of disposal of this stream. Biological treatment enables the destruction of perchlorate in this waste stream, thus rendering it reusable and making it more cost effective.
Several studies have evaluated multiple treatment technologies for perchlorate removal. Of the myriad of available technologies, ion exchange (IX) with brine treatment has the advantage of destroying perchlorate and nitrate in the spent brine and does not produce another waste stream that has to be disposed. In this study, the feasibility of IX using biological brine treatment and reuse was investigated. The evaluated biological brine treatment process treated spent brine containing perchlorate and nitrate. Perchlorate- and nitrate-free groundwater was produced from the IX process, which was regenerated using biologically treated brine.
1.1 IX Process Baseline Testing
Purolite A-850 polyacrylic resin was chosen for this test. The first phase of the project focused on performance of the resin and determination of operating parameters for water quality at the site. Based on these operating parameters, baseline performance for the resin was established.
To determine the appropriate operating conditions for the pilot plant, the resin was exhausted until perchlorate breakthrough occurred. Based on initial results, chromatographic peaking of nitrate concentrations in excess of the CDPH operational goal of 8 milligrams as nitrogen per liter (mg-N/L) limited the operation of a single vessel system in this water. Consequently, a run length of 255 bed volumes (BV) was selected. Counter-current regeneration of the exhausted resin using a 6-percent sodium chloride (NaCl) solution was performed until complete removal of perchlorate was achieved. Complete removal of nitrate (NO3
-), sulfate (SO4-), bicarbonate
(HCO3-) and perchlorate (ClO4
-) was achieved in 13 BV. Based on this, a partial regeneration of 21 pounds per cubic foot (lbs/ft3) was selected for the resin during
2
baseline testing. Once operating conditions were established, the resin was continuously exhausted and regenerated to establish baseline performance. After 10 cycles, no significant changes in performance, treated water quality, or spent brine characteristics were detected.
1.2 Brine Treatment and Reuse
The biological brine treatment system was housed in a sequencing batch reactor (SBR) and demonstrated that the process was able to consistently reduce perchlorate and nitrate concentrations in the spent brine (6-percent NaCl) to below treatment goals (perchlorate [ClO4
-] < 100 µg/L and NO3- < 0.5 milligrams
per liter [mg/L]) for 20 (re)cycles. This was the first pilot scale demonstration of biological destruction of perchlorate and nitrate in 6-percent NaCl spent brine by the project team’s salt-tolerant culture.
Results for 20 cycles of exhaustion and regeneration of resin using treated brine showed that the IX process could successfully remove perchlorate and nitrate to meet CDPH operational goals. As expected, bicarbonate and sulfate accumulated in the recycle brine but did not affect the quality of the process water over the 20 cycles.
It is important to note that additional components of the brine may accumulate to levels that would classify it as a hazardous waste or be toxic to the biological culture. Additionally, the effective exhaustion cycle may be reduced necessitating an increased regeneration frequency. Several options, however, could be pursued to avoid these situations: (1) periodically waste the recycled brine and continue treatment with a fresh batch of brine; (2) periodically or continuously waste a portion of the recycled brine (and, subsequently, amend it with virgin brine) to limit the accumulation of these nontargeted anions; or (3) further processing of the treated recycled brine to remove the accumulating anions (i.e., passing the treated brine through a nanofiltration [NF] or reverse osmosis [RO] membrane). Further testing, however, should be carried out to evaluate the long-term effect of accumulating these anions on both resin and culture performance.
1.3 Alternative Reactor Evaluation
A bench-scale fluidized bed reactor (FBR) was constructed and operated as a proof-of-concept experiment to demonstrate perchlorate and nitrate reduction in spent brine. The FBR performance showed that the microorganisms in the inoculum (i.e., from the culture used in the SBR) may satisfactorily adapt to the fluidized bed environment. Consistent perchlorate and nitrate removal at steady state operation was observed. At a hydraulic retention time (HRT) of 3 days,
3
100 mg/L of perchlorate were consistently reduced to less than 1 mg/L. Nitrate reduction was consistently greater than 99 percent as well.
It should be noted that the operating conditions were not optimized for maximum performance. Thus, further performance evaluation by reducing the HRT should be tested as part of a future investigation. This evaluation will provide key information regarding kinetic and design parameters to be used in scaled-up versions of future FBRs.
1.4 Cost Analysis
The previous evaluations provided the basis for elaborating a conceptual cost analysis of the IX process with biological brine treatment. A comparison of the total water treatment cost, using different brine treatment options, indicated that IX with biological brine treatment is 28 percent more cost effective than the IX coupled with chemical brine treatment (i.e., Calgon PNDM). Also, IX with biological treatment was estimated to be 19 percent less expensive than conventional IX using brine disposal.
Biological brine treatment using FBR appears to be a promising option. Current estimates of water production costs using the IX process with biological brine treatment using an FBR show values comparable to those of treatment with SBR. However, these estimates were based on kinetics of perchlorate reduction in a SBR. Utilization of an FBR configuration is anticipated to provide improved kinetics, leading to savings in capital costs due to the smaller reactor volumes required.
1.5 Recommendations
Based on the results of this feasibility study, additional pilot testing is strongly recommended to confirm long-term performance of this treatment process, demonstrate culture sustainability, and develop detailed design criteria and costs. Specifically, the effect of accumulating ions in the recycled brine and its effect on resin performance and biological treatment process should be further studied. Detailed microbial monitoring should also be conducted to assess the ability of the brine culture to survive under long-term operation conditions.
The feasibility of this treatment process using higher strength (8-percent NaCl) brine and its impact on the biological process would provide valuable data to further optimize this process and reduce treatment costs. Based on data from the bench-scale FBR, the original brine culture inoculum is capable
4
of degrading both perchlorate and nitrate. Since FBRs have shown better kinetic performance over other conventional reactors, further testing and optimization of the FBR is warranted.
5
2. Introduction 2.1 Background
Following the development of highly sensitive analytical techniques in 1997, perchlorate (ClO4
-) was detected in numerous water supplies. The United States Environmental Protection Agency (EPA) has confirmed perchlorate releases in 25 States (figure 2-1), with California having the highest number of confirmed releases (EPA, 2003; Mayer, 2003). The EPA also estimates that groundwaters in at least 44 States have the potential to be contaminated with perchlorate (Logan, 2001). Perchlorate appears to be linked to the historical manufacturing, usage, or processing of ammonium perchlorate (NH4ClO4), a solid rocket fuel. In March 1998, the EPA formally added perchlorate to the drinking water contaminant candidate list (CCL) (Perciasepe, 1998). Its monitoring in drinking water supplies was mandated in 1999 under the Unregulated Contaminants Monitoring Rule (UCMR) (Browner, 1999).
Figure 2-1. Perchlorate releases as of April 2003 (EPA, 2003).
The primary concerns over perchlorate toxicity are based on its interference of iodide uptake by the thyroid gland and the related potential carcinogenic, developmental, reproductive, and immunotoxic effects that may result from this interference. In adults, the thyroid helps to regulate metabolism. In addition to
Perchlorate Releases as of April, 2003Major RiversState with no reported perchlorate releaseState with a reported perchlorate release
6
metabolism, the thyroid plays a major role in proper development of children. Impairment of thyroid function in expectant mothers may impact the fetus and newborn and cause detrimental effects including behavioral changes, delayed development; and decreased learning capabilities. Changes in thyroid hormone levels may also result in thyroid gland tumors (EPA, 2003).
California Department of Public Health (CDPH) first established an action level in 1997 when, in cooperation with the Office of Environmental Health Hazard Assessment (OEHHA), it reviewed EPA’s 1992 and 1995 evaluations of perchlorate. EPA, as part of its Superfund activities, had developed a “provisional” reference dose (RfD) for perchlorate, based on the effects of this chemical on the thyroid gland. CDPH established an 18-micrograms-per-liter (µg/L) action level, which corresponded to the upper value of the 4- to 18-µg/L range that resulted from EPA’s provisional RfD. The lower value of 4 µg/L corresponded to the detection limit for purpose of reporting (DLR).
In January 2002, EPA released for public review and comment its revised draft toxicity assessment on perchlorate entitled, “Perchlorate Environmental Contamination: Toxicological Review and Risk Characterization,” which specified a revised draft RfD of 1 µg/L. Based on this assessment, CDPH concluded that its perchlorate action level needed to be revised downward. Accordingly, on January 18, 2002, CDPH reduced the perchlorate action level to 4 µg/L, the lower value of the 4- to 18-µg/L range that resulted from the earlier provisional RfD (and, as mentioned above, a value equal to its DLR). In December 2002, the California OEHHA released a revised draft perchlorate Public Health Goal (PHG), proposing a concentration of 2 to 6 µg/L. The final PHG was established as 6 µg/L in 2004 and contributes to the DHS development of a maximum contaminant level (MCL) for perchlorate. Currently, CDPH continues to utilize the 6-µg/L action level. A State bill has passed in California requiring CDPH to establish an MCL to regulate the maximum allowable level of perchlorate in drinking water within the State. In 2007, CDPH established an MCL of 6 µg/L.
2.2 Perchlorate Treatment Technologies
Perchlorate treatment technologies have been loosely categorized into two technological classifications: (1) destruction—biological reduction, chemical reduction, and electrochemical reduction and (2) removal—IX, membrane filtration, and electrodialysis with subsequent disposal of contaminated brine.
Several key organizations have funded the majority of the treatment technology development projects, and some research has also been sponsored directly by water utilities, perchlorate manufacturers, and Federal institutions such as the
7
U.S. Department of Defense (DoD) and National Aeronautics and Space Administration.
The key funding organizations are the:
1. American Waterworks Association Research Foundation (AwwaRF)
2. Strategic Environmental Research and Development Program (SERDP)
3. National Science Foundation (NSF)
AwwaRF, through the establishment of a Perchlorate Research Partnership, is managing funds appropriated by the Congress to specifically address low level (<1,000 parts per billion perchlorate contamination in drinking water supplies. The $4 million in congressional funds were augmented with an additional $1.6 million in funding from AwwaRF and individual researchers for a total effort valued at $6.1 million. The Perchlorate Research Partnership, which included EPA, the East Valley Water District in San Bernardino, California, and AwwaRF, initiated seven projects in 1998. Each project focused on a different technology to establish whether the perchlorate treatment goal of 4 µg/L could be achieved. These technologies consisted of:
1. Ion exchange
2. Conventional ozone and granular activated carbon (GAC)
3. Reverse osmosis (RO), nanofiltration (NF), and ultrafiltration (UF) membranes
4. Tailored GAC
5. Membrane biofilm reactor (MBfR)
6. Fixed-film biological treatment
7. Electrochemical reduction
For each project, phase 1 consisted of laboratory-based proof-of-concept work, while phase 2 supported further development of the technology by pilot-scale or field-scale demonstrations. The three technologies that did not progress to phase 2 were conventional ozone/GAC, electrochemical reduction, and membranes, which were considered too costly for drinking water treatment applications. The other four technologies showed promising results and were tested in phase 2. A detailed comparison of the pros and cons of the four projects tested through phase 2 (IX, tailored GAC, membrane biofilm reactor, and fixed-film biological treatment) is provided in table 2-1.
8
Table 2-1. Pros and Cons of Perchlorate Treatment Technologies from AwwaRF Sponsored Studies
Technology Pros Cons IX Proven technology with
large product selection driving healthy economic competition.
Generation of perchlorate-laden brine remains the one big obstacle to successful use of this technology. This is currently handled through using more costly disposable resins or brine treatment techniques that still require enhancements for cost-effective operation.
Tailored GAC No regeneration brine is created during treatment.
Carbon tailoring has limited capacity for perchlorate removal. While quaternary ammonium monomers improve capacity over what is achieved with organic polymers, they have not yet been approved for use in potable water treatment by NSF and could require use of conventional GAC bed in series with monomer-tailored GAC bed.
MBfR No regeneration brine created during treatment.
No demonstrated scale-up project has been performed for this technology, and direct biological processes may still encounter public/regulatory resistance. Full denitrification and pH control may be required to fulfill perchlorate removal objectives.
Requires a downstream polishing step to remove microbes that leach from the packed bed; this could make regulatory approval difficult.
The perchlorate treatment work funded by SERDP has focused on the development of in situ bioremediation methods. SERDP concluded that perchlorate-degrading bacteria appear to be ubiquitous in subsurface environments and the key challenge is in achieving adequate delivery of the carbon electron donor and managing competitive effects from nitrate or sulfate. While in situ treatment is cheaper than pump-and-treat alternatives for cleanup at rocket facilities (estimated to be between 50 to 75 percent of ex situ treatment costs), it is not a viable alternative for water agencies requiring immediate access to water that will meet the perchlorate regulatory standards. NSF funds are restricted to academic institutions and, as such, tend to focus more on proof-of-concept studies.
2.2.1 Technology Implementation Status A perchlorate treatment technology status report was released by the Ground-Water Remediation Technologies Analysis Center (GWRTAC) in May 2001. The GWRTAC is a national environmental technology transfer center established
9
in 1995 to provide information on using innovative technologies for remediation of contaminated groundwater. The GWRTAC is operated by Concurrent Technologies Corporation (CTC) in association with the University of Pittsburgh’s Environmental Engineering Program through funding provided by the EPA Technology Innovation Office (TIO), DoD National Defense Center for Environmental Excellence (NDCEE), and the U.S. Department of Energy (DOE). The report summarized the treatment technologies being evaluated in 65 perchlorate contamination case studies. The treatment classification categories and their percentage frequencies are presented in table 2-2.
Table 2-2. Perchlorate Treatment Classification Categories from GWRTAC May 2001 Technology Status Report
Treatment Classification Category
Percentage Breakdown of Case Studies1
(%) Ex Situ Biological 45 In Situ Biological 18 Ex Situ Physical 22 Ex Situ Chemical 6 In Situ Physical/Chemical 0 Not Specified 3 General Biological 6
1 Percentage based on 65 case studies.
Since the release of this report, the treatment classifications have been further expanded. Review of Air Force Center for Environmental Excellence (AFCEE) perchlorate technology fact sheets released in August 2002 and a January 2004 California EPA draft report on “Perchlorate Contamination Treatment Alternatives” indicate the implementation status of the technologies summarized in table 2-3.
2.2.2 Perchlorate Treatment for Drinking Water Three treatment technologies have proven to be technically feasible for drinking water treatment: biological reduction, IX, and RO membranes. Although IX and RO are historically proven technologies for drinking water treatment, they require specialized disposal and/or treatment of the perchlorate-laden saline waste stream generated as a byproduct of these processes. However, future regulations may prevent the discharge of this perchlorate-laden brine. Biological reduction, on the other hand, reduces perchlorate to the innocuous chloride ion (Cl-) without the production of any residuals that require special handling, which is a major advantage. Though feasible, direct biological treatment of perchlorate-
10
Table 2-3. Perchlorate Treatment Classification Categories as of 20041 Treatment
Classification Vendors
(Researchers) Treatment
Range LocationsIon Exchange Calgon ISEP
Calgon Anion Exchange US Filter Anion Exchange Ion Exchange
Calgon ISEP+™ System ORNL Applied Research Associates
< 2 gpm CA
Biological Reduction
Envirogen/US Filter FBR/GAC Applied Research Associates Foster Wheeler/Arcadis PBR Penn State University PBR EcoMat Hall Reactor Applied Research Associate Applied Research Associates
CSTR Hollow-Fiber MBfR
0.3 to 5,300 gpm CA, TX, NV, UT
In Situ Biological Treatment
Acetate Amend Water Injection Amended Water Injection Groundwater Barrier Trench Corn Syrup Injection Permeable Barrier/Injection Multilayer Permeable Barrier
For aquifer rather than well treatment
CA, NV, TX, NM
Tailored Granular Activated Carbon
Not as effective as other technologies; best as retrofit of existing systems
CA
Biologically Active Carbon
University Illinois and MWD Pilot Scale Study
Pilot-scale CA
Membrane Filtration
Reverse osmosis Nanofiltration Electrodialysis
No applications
Chemical Reduction
Ultraviolet light/ZVE iron reductionTitanium +3 chemical reduction Electrochemical reduction
Lab-scale research CA, DC
Electrochemical Capacitive deionization aerogel – Lawrence Livermore National Laboratory licensed to CDT systems
Lab-scale research CA
Phytoremediation Willow trees Salt cedar trees Engineered use of wetland plants
Bench and pilot scale research
CA, NV
1 CA = California; NV = Nevada; TN = Tennessee; TX = Texas; UT = Utah; NM = New Mexico; DC = Washington, DC; gpm = gallons per minute; gpd = gallons per day; FBR = fluidized bed reactor; PBR = packed bed reactor; FFP = ???; CSTR = continuous stirred tank reactor; MWD = Metropolitan Water Distirct; CDT = capacitive deionization technology.
11
contaminated groundwater for potable use must first overcome significant public apprehension, even open hostility, before it can be applied in this manner.
The project team has previous experience with all three identified perchlorate treatment methods. As a part of a recent AwwaRF study, the project team investigated the applicability of a novel MBfR for perchlorate removal. This direct biological treatment technology utilized hollow-fiber membranes to supply an inorganic electron donor (hydrogen) to a perchlorate-reducing biofilm growing on the outside of the fibers.
Indirect biological treatment technologies were also investigated by the project team. When coupled with conventional and proven perchlorate treatment technologies (i.e., IX and RO), indirect biological treatment perchlorate would be able to effectively address issues regarding the handling and/or disposal of residual produced by IX and RO processes. Biological treatment of perchlorate-laden brines would reduce perchlorate to innocuous chloride and, thereby, comply with future discharge requirements that would otherwise limit current and future conventional regenerable IX systems in operation.
2.3 Biologically Enhanced IX Treatment
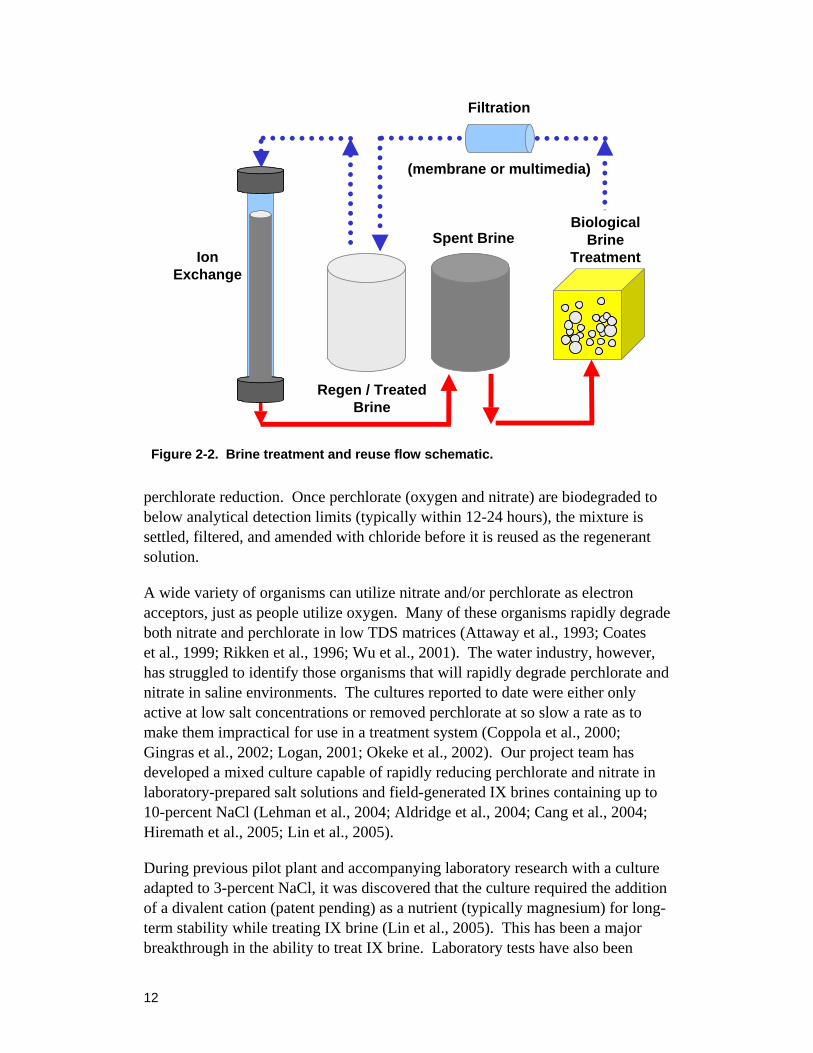
The project team developed a biologically enhanced IX treatment system comprised of two primary components: (1) a conventional regenerable IX process for perchlorate removal and (2) a biological treatment system for perchlorate destruction in spent regenerant. The IX component removes perchlorate from the contaminated groundwater producing potable quality treated water, which is collected in a clearwell and can be used as rinse water after regeneration. Once the resin is exhausted (i.e., loaded with perchlorate), it is regenerated with a high total dissolved solids (TDS) solution (typically, 7- to 10-percent sodium chloride [NaCl]) producing a perchlorate-laden spent brine. As illustrated in figure 2-2, the spent brine is then fed to the biological brine treatment system, where the salt-tolerant culture biologically reduces perchlorate to innocuous chloride. After biological treatment, the brine is filtered (using membranes or media filtration to screen out perchlorate-reducing bacteria) and returned to the regeneration (sweet) brine tank to be reused for the subsequent resin regeneration.
The biological brine treatment system has been evaluated at pilot-scale (Aldridge et al., 2004) using a closed reactor operated as an anaerobic sequencing batch reactor (SBR). In this process, spent brine is amended with acetic acid to serve as an electron donor for reduction; and additional salt amendments are provided, as necessary, to develop an ideal microbial environment to facilitate rapid biological
12
Figure 2-2. Brine treatment and reuse flow schematic.
perchlorate reduction. Once perchlorate (oxygen and nitrate) are biodegraded to below analytical detection limits (typically within 12-24 hours), the mixture is settled, filtered, and amended with chloride before it is reused as the regenerant solution.
A wide variety of organisms can utilize nitrate and/or perchlorate as electron acceptors, just as people utilize oxygen. Many of these organisms rapidly degrade both nitrate and perchlorate in low TDS matrices (Attaway et al., 1993; Coates et al., 1999; Rikken et al., 1996; Wu et al., 2001). The water industry, however, has struggled to identify those organisms that will rapidly degrade perchlorate and nitrate in saline environments. The cultures reported to date were either only active at low salt concentrations or removed perchlorate at so slow a rate as to make them impractical for use in a treatment system (Coppola et al., 2000; Gingras et al., 2002; Logan, 2001; Okeke et al., 2002). Our project team has developed a mixed culture capable of rapidly reducing perchlorate and nitrate in laboratory-prepared salt solutions and field-generated IX brines containing up to 10-percent NaCl (Lehman et al., 2004; Aldridge et al., 2004; Cang et al., 2004; Hiremath et al., 2005; Lin et al., 2005).
During previous pilot plant and accompanying laboratory research with a culture adapted to 3-percent NaCl, it was discovered that the culture required the addition of a divalent cation (patent pending) as a nutrient (typically magnesium) for long-term stability while treating IX brine (Lin et al., 2005). This has been a major breakthrough in the ability to treat IX brine. Laboratory tests have also been
Regen / Treated Brine
Spent BrineBiological
Brine TreatmentIon
Exchange
Filtration
(membrane or multimedia)
13
performed to demonstrate the stability and versatility of the culture under various conditions. Experiments were conducted using spent brine collected from the Calgon ISEP continuous IX process operated by the La Puente Valley County Water District (LPVCWD) in Baldwin Park, California. Results demonstrated that the microbial culture could consistently reduce perchlorate and nitrate in the spent brine to below detection limits (100 µg/L) within 24 hours in the presence of varying concentrations of brine constituents such as salt (3- to 10-percent NaCl), nitrate (400 to 4,000 milligrams per liter [mg/L]), sulfate (600 to 6,000 mg/L) and pH (5 to 9). These were the first results to show that biological degradation of perchlorate can be achieved in IX spent brine containing high NaCl concentrations (up to 10 percent) (Hiremath et al., 2005).
2.3.1 Brine Treatment and Reuse The success of perchlorate treatment using the IX process with reuse of treated spent brine depends on the perchlorate level in the recycled brine following treatment. Perchlorate is a monovalent ion, which is not subject to selectivity reversal in the high ionic strength of NaCl brine used for regeneration. Owing to its inherent high affinity and lack of selectivity (affinity) reversal, a significant portion of any perchlorate remaining in the spent brine will re-adsorb (exchange) onto the resin during regeneration. Then, on the subsequent exhaustion cycle, some of the re-adsorbed perchlorate will exchange for chloride and leak into the column effluent immediately at the start of the run. Consequently, it is critical to reduce the perchlorate level in the brine to avoid subsequent leakage above the 6-µg/L CDPH Advisory Action Level.
Table 2-4 presents an analysis using the University of Houston Equilibrium Multi-Component Theory (EMCT)-Windows model runs with varying amounts of perchlorate in 6-percent brine for the regeneration of the polyacrylic resin. Based on the trend, the maximum allowable concentration of perchlorate in treated 6-percent brine was approximately 0.8 mg/L. Manipulation of the model indicated that the equivalent fraction of perchlorate in the early leakage following regeneration would be the same as the equivalent fraction of perchlorate in the treated brine. Therefore, the perchlorate leakage can be quickly estimated as the product of the equivalent fraction of perchlorate in the brine and the total concentration of ions in the feed water.
From these models, a rule of thumb was developed to easily predict the perchlorate brine treatment goal to avoid leakage. Although the EMCT program output does not include the equivalent fraction of perchlorate (XClO4) in the column effluent after regeneration, this parameter is simple to calculate as it the same XClO4 in the brine after treatment. Stated simply, the equivalent XClO4 in the early leakage following regeneration will be the same as the XClO4 in the treated
14
Table 2-4. Perchlorate Leakage Estimates Based on UH EMCT-Windows Program
ClO4- in Brine
(mg/L)
Eq fraction, XClO4 in Brine
After Treatment
Eq Fraction, YClO4 on Resin After Regeneration
ClO4- Leakage
on Next Run (meq/L)1
ClO4- Leakage
on Next Run (µg/L)
0.100 10-6 5.52 x 10⁻⁶ 0.000005 0.5 1.00 10-5 5.51 x 10⁻⁵ 0.00005 5 10 10-4 5.50 x 10⁻⁴ 0.00051 51
100 10-3 5.48 x 10⁻³ 0.0051 510 1,000 10-2 5.26 x 10⁻² 0.051 5,100
1 meq/L = milliquivalent per liter.
brine. With this information, the perchlorate leakage is simply calculated as the product of the XClO4 in the brine and the total concentration of ions in the feed water.
2.4 Objectives of the Study
The primary objective of this research was to demonstrate the efficacy of an innovative biologically enhanced IX treatment system that can remediate perchlorate- and nitrate-impacted groundwater and produce potable quality water without the generation of perchlorate-laden residuals. Pilot testing focused on the following objectives:
• Demonstrate production of potable quality water from the overall treatment system at a real groundwater test site.
• Validate biological perchlorate destruction in higher strength (up to 6-percent NaCl) IX brine using a SBR.
• Verify that biologically treated brine is suitable for continuous recycling as IX regenerant.
• Evaluate the ability of a fluidized bed reactor (FBR) to reduce perchlorate and nitrate as an alternative brine treatment reactor configuration.
• Assess the relative cost of IX with brine treatment compared to conventional perchlorate treatment methods.
15
3. Conclusions and Recommendations The goal of this project was to demonstrate the feasibility of the IX process coupled with biological brine treatment to remove perchlorate and nitrate from the groundwater, thus producing potable quality water. The spent brine stream generated from the IX process was biologically treated and reused for 20 cycles. This section presents conclusions from each phase of the study.
IX Process Baseline Testing:
• A polyacrylic resin was evaluated by exhausting the resin at a flow rate of 2.1 gpm for 700 bed volume (BV). Based on the initial breakthrough of nitrate above the CDPH operational goal of 8 mg/L, a run length of 255 BV was selected for further study.
• Countercurrent regeneration using 6-percent NaCl was performed; and complete removal of nitrate, sulfate, bicarbonate, and perchlorate was achieved after 13 BV of regeneration. Based on this, a partial regeneration of 21 pounds per cubic foot (lbs/ft3) was selected for baseline testing.
• Ten cycles of baseline testing were conducted to verify continuous operation and demonstrated no significant change in performance, treated water quality, or spent brine characteristics.
Brine Treatment and Reuse Using a SBR:
• Spent brine from each resin regeneration was biologically treated and then reused for the consecutive regeneration. Twenty cycles of regeneration and reuse were performed. The biological SBR could consistently degrade 3,000 µg/L of perchlorate to less than 100 µg/L and nitrate from 2,000 mg/L to less than 0.5 mg/L within 24 hours.
• During the 20 cycles, the resin successfully treated perchlorate and nitrate from the groundwater producing process water below the CDPH treatment goals for both perchlorate and nitrate.
• Bicarbonate and sulfate accumulation in the brine did not affect the quality of the process water or regeneration efficiency over the 20 cycles.
Alternative Reactor Configuration Evaluation:
• As an additional scope to the project, a bench-scale FBR was constructed to treat spent IX brine.
16
• Results demonstrated that the FBR was capable of 99-percent removal of nitrate and perchlorate in 4.5-percent brine (from a 6-percent NaCl regeneration).
• These results were based on short-term evaluation primarily intended as a proof-of-concept of perchlorate and nitrate reduction using an FBR. Further pilot testing is recommended to optimize the FBR performance.
Relative Costs:
• A conceptual cost analysis was performed to compare different perchlorate treatment strategies including: conventional IX with brine disposal, IX using biological brine treatment and reuse, IX using chemical brine treatment and reuse, and single-use IX (disposable resins).
• IX treatment using single-use disposable resins currently is the most economical option. However, application of single-use resins may not be applicable for long-term treatment. This application demands additional resin destruction and replacement operations, which may significantly increase the associated operation and maintenance (O&M) costs. Additionally, single-use resins may be limited by the impact of site-specific water quality. The capacity of disposable resins for perchlorate removal is influenced by the presence of nitrate and, to a lesser extent, sulfate in the source water. When nitrate approaches or exceeds the MCL, the run length of the disposable resin column is reduced to the point where the application is not economical because nitrate removal will control the run length instead of perchlorate.
• Preliminary conceptual costs suggest that utilizing biological brine treatment can reduce treatment costs up to 18 percent: from $1.36 per 1,000 gallon for conventional IX with brine disposal to $1.11 per 1,000 gallons for IX coupled with biological brine treatment and reuse.
• When compared to IX with chemical brine treatment (i.e., Calgon ISEP+), using biological brine treatment was found to be a more cost-effective option. A 26-percent reduction in cost was seen—$1.50 per 1,000 gallons for IX with chemical brine treatment to $1.11 per 1,000 gallons for IX with biological brine treatment.
Recommendations for Future Study:
• Based on the results of this investigation, additional pilot testing is recommended to confirm long-term performance of this treatment process.
17
The effect of accumulating ions in the recycled brine and its effect on resin performance and biological treatment process should be further studied.
• The feasibility of this treatment process using higher strength (8-percent NaCl) brine and its impact on the biological process would provide valuable data to further optimize this process and reduce treatment costs.
• Based on data from the bench-scale FBR, the original brine culture inoculum is capable of degrading both perchlorate and nitrate. Since FBRs have shown better kinetic performance over other conventional reactors, further testing and optimization of the FBR is warranted.
19
4. Materials and Methods To accomplish the objectives of this research, a suite of analytical methods, experimental systems, and procedures were employed. The analytical methods were used to assess the water quality and quantify the performance of the experimental systems. This section contains information concerning the materials and methods used in performing this study.
4.1 Pilot Plant
Designed and constructed at MWH’s Research Center and Fabrication Facility, MWH’s Mobile Water Treatment Pilot Trailer, containing the IX pilot plant was setup at Azusa, California. This site is managed by Azusa Light & Water and has a groundwater well containing both perchlorate and nitrate. A photo of the exterior of the trailer, feed tank reservoir, and pump head is shown in figure 4-1.
Figure 4-1. Pilot plant trailer, influent reservoir, and well pump head.
4.1.1 Influent Water Quality Parameters The influent groundwater was generally stable for most of the monitored parameters, as summarized in table 4-1. The groundwater was low in perchlorate and high in both nitrate and sulfate. Although perchlorate concentration was close to the CDPH MCL of 6 µg/L, the pilot plant had the option of spiking perchlorate to an increased level, if necessary. The concentration of nitrate in the water was the limiting factor in the IX service run length since the effluent nitrate concentration cannot exceed the Federal MCL of 10 milligrams per liter as nitrogen (mg-N/L). The groundwater has a high buffering capacity and high hardness.
20
Table 4-1. Influent Water Quality Summary (November 2004 to February 2005)
Parameter Units Value Perchlorate μg/L 10 Nitrate mg/L as nitrate (NO3) 61 Sulfate mg/L 56 Bicarbonate mg/L as calcium carbonate
(CaCO3) 208
Chloride mg/L 25 pH — 8.0 Alkalinity mg/L as CaCO3 210 Total Hardness mg/L as CaCO3 265 Turbidity nephelometric turbidity unit 0.10 TDS mg/L 423 Calcium (Ca) mg/L 84 Magnesium (Mg) mg/L 14
4.1.2 IX Process Description Figure 4-2 shows a picture of the pilot plant. It included two parallel IX columns (clear polyvinylchloride [PVC]) that could be independently operated in either co- or counter-current exhaustion or regeneration. For the purposes of this study, the columns were operated in a counter-current mode with up-flow exhaustion and down-flow regeneration. Screens were inserted at the top and bottom of each IX column to contain the resin in the column during the exhaustion and regeneration modes.
Figure 4-2. IX with brine treatment pilot plant.
21
Treated water was collected in a clearwell and was also used as rinse water after regeneration. The spent brine solution was collected in a holding tank to be fed to the biological brine treatment system. Since the influent concentration of perchlorate was low for this groundwater, the spent brine was amended with perchlorate to a concentration of 3 mg/L. This concentration simulated the average concentration of perchlorate in IX brine for currently existing full-scale IX plants in the southern California area. After biological reduction of perchlorate and nitrate, the treated brine was returned to the regeneration (sweet) brine tank for consecutive regeneration. A process schematic of this system is shown in figure 4-3 to illustrate some of these details.
4.1.3 Biological Brine Treatment Process The biological brine treatment system utilized a marine mud inoculum to biologically reduce both perchlorate and nitrate in a 6-percent NaCl regenerant brine solution. Two different reactor configurations were used to evaluate the performance of the perchlorate-reducing salt-tolerant culture used in this study.
4.1.3.1 Pilot-scale Sequencing Batch Reactor The pilot-scale reactor, shown in figure 4-4, was operated as an anaerobic SBR and had the following features:
• Hermetically sealed high-density polypropylene tank with a bubble trap to release internal pressure developed during biological reduction and nitrogen sparging
• Coarse diffuser located at the bottom of the reactor for oxygen stripping and nitrogen sparging to assist with the suspension of biomass
• Integrated shaft mixer to suspend biomass
• Dedicated fill port located at top of the reactor for feeding brine and supplying chemicals
• Multiple drain and sample ports located on the sides and bottom of the reactor for operational flexibility as a SBR
Operation of the biological brine treatment system followed the conventional fill-and-draw procedure: (1) fill, (2) mix and react, (3) settle, and (4) draw. During the pilot-scale fill operation, spent brine generated during the resin regeneration process was diverted directly to the SBR at a flowrate of 0.37 gpm. During this time, nitrogen sparging and reactor mixing were used to encourage oxygen stripping. Once the reactor had completed filling, acetic acid was supplied to the culture, based on the stoichiometric requirement of acetate for reduction of
22
Figu
re 4
-3.
IX w
ith b
rine
trea
tmen
t pilo
t pla
nt p
roce
ss s
chem
atic
.
23
Figure 4-4. Biological brine treatment system.
perchlorate and nitrate. While 1.5 times excess acetate concentration was maintained in the culture, the excess acetate passed through the regeneration process and, thus, did not have to be added with each cycle.
The SBR contents (now containing the perchlorate- and nitrate-laden brine amended with acetate) were mixed and allowed to react. Once perchlorate and nitrate were reduced to the treatment goals (NO3
- < 0.01 mg/L and ClO4-
< 100 µg/L), the SBR entered the settling phase. The suspended biomass in the treated brine was allowed to settle for 1 to 2 hours. After settling, approximately 50 percent of the reactor supernatant was drawn, filtered, and collected in the regeneration tank. Additional NaCl was added to the treated regenerant brine solution to readjust the chloride concentration before being reused for the following regeneration of the exhausted IX resin. The conductivity of the 6-percent brine increased with regeneration cycles due to the accumulation of sulfate and bicarbonate. Hence, brine conductivity was closely tracked to maintain the correct salt concentration.
4.1.3.2 Bench-scale Fluidized Bed Reactor The FBR system consisted of a reactor column with a recycle line and pump, influent header, feed system, gas collection system, effluent line, and sampling ports, as shown in figure 4-5. The reactor was constructed of PVC tube with an inner diameter of 2 inches and a length of 6 feet. The influent header was packed with marbles of varying sizes to distribute the flow across the reactor cross section.
24
Figure 4-5. FBR schematic.
The reactor was initially filled with 400 grams of F800 granular activated carbon (Calgon Corporation, Pittsburgh, Pennsylvania). The GAC was washed with deionized (DI) water to remove fines and was kept submerged under water prior to filling the reactor to remove air from the pores. Spent brine (8-percent NaCl) was generated from resin regeneration containing 4,000 mg/L NO3
- and 600 µg/L of ClO4
- and amended with acetic acid, magnesium, and nutrient solution. The reactor was inoculated with 100 milliliters (mL) of the perchlorate-reducing brine culture from the SBR and spiked with perchlorate to achieve a bulk concentration of 50 mg/L. A recycle flow of 2 liters per minute was used to achieve 100-percent expansion of the bed. The expanded bed volume was 3 liters and helped to prevent back pressure resistance to flow. Also, a larger expansion helped to provide a larger hydraulic retention time (HRT) for a given influent flow rate. As the biofilm attached to surface of the media grew, the density of the particles decreased, thus expanding the bed further. The recycle flow was adjusted to maintain constant fluidization of the bed.
NN Nutrient Feed
Recycle
Bubble Trap
Fluidizing GAC
Marble Pack
Effluent
25
4.1.4 Operational and Design Parameters The operational and design parameters of the system are summarized in table 4-2. A polyacrylic resin (Purolite A-850) was selected as the representative resin for perchlorate and nitrate removal, based on discussions with resin manufacturers and previous bench- and pilot-scale experience (Aldridge et al., 2004).
Table 4-2. IX System Design and Operational Parameters1 Parameter Column
System Design Resin Name A-850 Column Diameter 4.0 inches Resin Bed Depth 5.0 feet Bed Volume 0.35 ft3 Flow Mode Up-flow service and down-flow
regeneration
Exhaustion Empty Bed Contact Time (EBCT) 1.5 min Service Flowrate 2.1 gpm Service Loading Rate 4.9 gpm/ft3 Surface Loading Rate 19 gpm/ft2 Run Length 255 BV
Regenerant Strength 6 percent Salt Loading Rate 21 lbs/ft3 Regeneration Period 45 min Bed Volumes of Regenerant 6.7 Volume of Regenerant (Total) 65 liters Bed Volumes of Rinse 3
1 ft3 = cubic feet; gpm/ft3 = gallons per minute per cubic foot; gpm/ft2 = gallons per minute per square foot; min = minute; mL/min = milliliters per minute; cm/min = centimeters per minute.
During the exhaustion of the resin, a 2.1-gpm flow rate was used for each 4-inch-diameter column. Given an empty bed contact time (EBCT) of 1.5 minutes, this translates to an up-flow service loading rate of 4.9 gallons per minute per cubic foot of resin. A 17.4-centimeter-per-minute velocity was used for counter-current
26
regeneration, corresponding to a 7-minute EBCT. A salt loading rate of 25 lbs/ft3 was used during initial operation of the resin. It was later determined that a loading of 21 lbs/ft3 was sufficient for regeneration. Hence, the later baseline runs and all the recycle runs were regenerated at 21 lbs/ft3.
4.2 Summary of Sampling and Analytical Plan
The pilot was designed so that samples could be collected from the break tank (influent water), each column effluent during service and regeneration, clearwell, sweet brine tank, spent brine storage tank, and brine treatment system effluent. Sampling sites were selected to provide a complete analysis of a variety of processes used in this study. The frequency of sample collection was based on operational conditions and historical performance. Table 4-3 shows the sampling schedule followed.
Table 4-3. Sampling and Analytical Plan
Parameter Method Analyst Influent EffluentSalt
SolutionSpent Brine
Treated Brine
Flowrate Rotameter Onsite Online NA Online NA 1 per dayTemperature SM2550B Onsite 1 per day 1 per day 1 per day 1 per day 1 per dayPressure Pressure
gauge Onsite 1 per day 1 per day NA NA NA
Perchlorate EPA 314.0 ARD Lab 1 per day 1 per day NA Composite or 5 per cycle
1 per day
Chloride EPA 300.1 ARD Lab 1 per day 1 per day NA Composite or 5 per cycle
1 per day
Nitrate EPA 300.1 ARD Lab 1 per day 1 per day NA Composite or 5 per cycle
1 per day
Sulfate EPA 300.1 ARD Lab 1 per day 1 per day NA Composite or 5 per cycle
1 per day
Bicarbonate SM 4500-CO2D
Onsite 1 per day 1 per day NA Composite or 5 per cycle
1 per day
pH SM 4500H+ Onsite 1 per day 1 per day NA Composite or 5 per cycle
1 per day
Alkalinity SM 2320B Onsite 1 per day 1 per day NA Composite or 5 per cycle
1 per day
Specific Conductivity
SM 2510B Onsite 1 per day 1 per day Online Online 1 per day
DO SM 4500-OG Onsite 1 per week
1 per week
NA NA 1 per day
Ca and Mg EPA 200.7 Onsite 1 per week
1 per week
NA 1 per week 1 per week
27
During each phase of pilot testing, several water quality parameters were analyzed. Analytical requirements were grouped under three main categories: exhaustion cycle, regeneration cycle, and biological brine treatment.
• IX (exhaustion phase): Influent water samples were collected on a daily basis and analyzed for the critical anions, pH, alkalinity, and temperature. Timed effluent samples were collected to develop breakthrough curves for selected anions and were analyzed for major anions and several other water quality parameters.
• Regeneration: The solution was analyzed for chloride prior to regeneration to check that the actual strength does not vary from the target strength by more than 10 percent. Online conductivity was used to monitor the progress of the regenerant solution through the resin. A composite spent brine sample was collected at the end of the regeneration in a spent brine storage tank and analyzed for major anions, conductivity, and several other selected water quality parameters identified in table 4-3.
• Spent Brine Treatment: Samples were collected from the influent and effluent of the biological treatment processes and analyzed for the parameters included in table 4-3. These include major anions, process intermediates, and general water quality parameters.
4.3 Analytical Methods
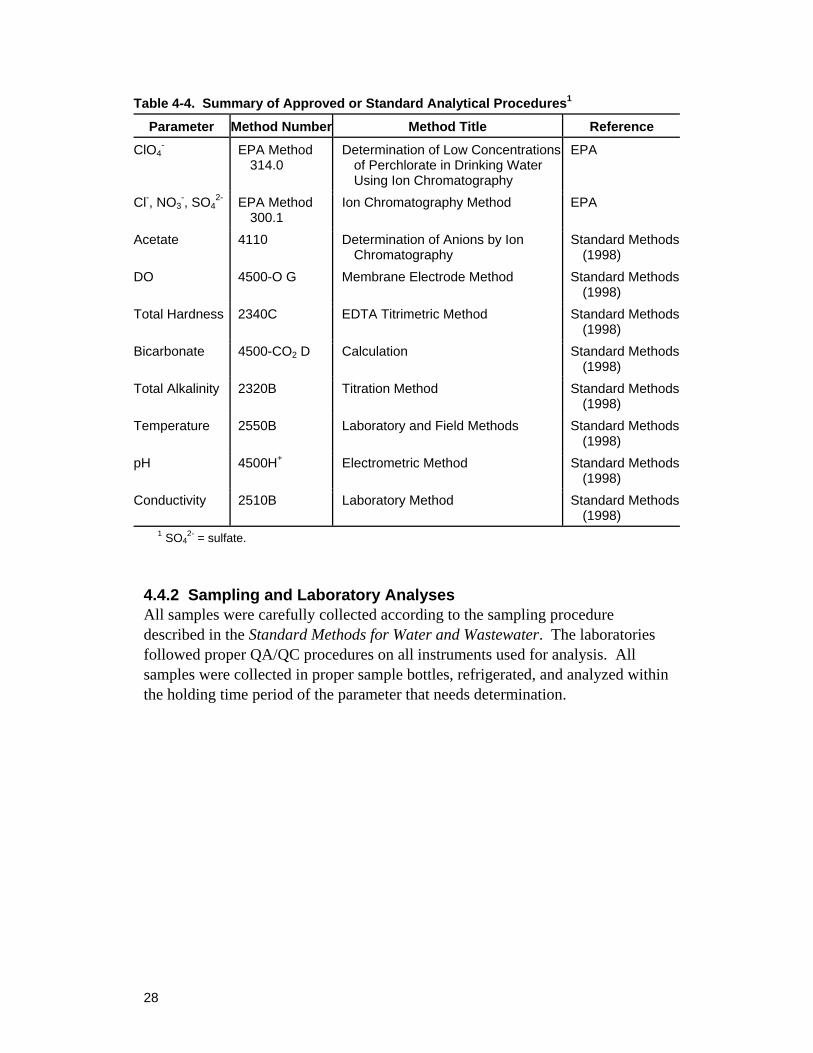
Water quality parameters were measured following Standard Methods (1998) or EPA methods. A summary of analytical procedures used is provided below in table 4-4.
4.4 Quality Assurance/Quality Control (QA/QC)
The following section provides a general description of QA/QC procedures employed during the study.
4.4.1 IX/Brine Treatment Pilot Processes
• Pilot Auxiliary Units: All equipment related to the pilot equipment such as pressure gauges, flow meters, and safety switches were calibrated onsite during the pilot startup period and verified at a minimum on a biweekly basis.
• Online Monitoring Devices: The online conductivity meters were calibrated onsite using a batch conductivity meter biweekly.
28
Table 4-4. Summary of Approved or Standard Analytical Procedures1
Parameter Method Number Method Title Reference
ClO4- EPA Method
314.0 Determination of Low Concentrations
of Perchlorate in Drinking Water Using Ion Chromatography
EPA
Cl-, NO3-, SO4
2- EPA Method 300.1
Ion Chromatography Method EPA
Acetate 4110 Determination of Anions by Ion Chromatography
Standard Methods (1998)
DO 4500-O G Membrane Electrode Method Standard Methods (1998)
Total Hardness 2340C EDTA Titrimetric Method Standard Methods (1998)
Bicarbonate 4500-CO2 D Calculation Standard Methods (1998)
Total Alkalinity 2320B Titration Method Standard Methods (1998)
Temperature 2550B Laboratory and Field Methods Standard Methods (1998)
pH 4500H+ Electrometric Method Standard Methods (1998)
Conductivity 2510B Laboratory Method Standard Methods (1998)
1 SO42- = sulfate.
4.4.2 Sampling and Laboratory Analyses All samples were carefully collected according to the sampling procedure described in the Standard Methods for Water and Wastewater. The laboratories followed proper QA/QC procedures on all instruments used for analysis. All samples were collected in proper sample bottles, refrigerated, and analyzed within the holding time period of the parameter that needs determination.
29
5. Results and Discussion 5.1 IX Operation
5.1.1 Initial Resin Evaluation A polyacrylic resin (Purolite A-850) was initially evaluated by operating to perchlorate breakthrough to determine the appropriate run length to be used for baseline testing. After perchlorate breakthrough, the resins were regenerated in counter-current mode to determine the appropriate long-term operational conditions for resin regeneration. The polyacrylic resin was exhausted for 700 BV, during which breakthrough of perchlorate, nitrate, and bicarbonate occurred. Sulfate breakthrough was not observed during this period. Figure 5-1 shows perchlorate breakthrough occurring after approximately 650 BV of water processed. Nitrate was observed in the effluent much earlier in the run at approximately 250 BV. The anticipated decrease in the effluent chloride ion concentration can be seen during the course of the exhaustion cycle, as less chloride was available to be displaced from the resin over time by additional bicarbonate, nitrate, perchlorate, and sulfate ions.
Figure 5-1. Exhaustion profile for the initial evaluation of the polyacrylic resin.
During this run, chromatographic peaking of nitrate concentrations in excess of CDPH operational nitrate goal of 8 mg-N/L (i.e., equivalent to 80 percent of the MCL) was observed. As a result, the polyacrylic resin was operationally limited
0
50
100
150
200
0 100 200 300 400 500 600 700
Bed Volumes
Ani
ons
(mg/
L)
0
10
20
30
40
Perc
hlor
ate
(µg/
L)
ChlorideNitrateSulfatePerchlorate
30
by nitrate in this water, unless a sufficient number of IX vessels could be operated in parallel to ensure that a blended effluent did not exceed the operational limit. It was decided that for the purposes of this study, the pilot plant should be operated such that it produces water of potable quality. Consequently, the run length selected for the baseline testing was 255 BV. Since perchlorate was not observed in the effluent until approximately 650 BV, a 255-BV run length was determined sufficient for removing both perchlorate and nitrate from the groundwater.
Counter-current regeneration of the polyacrylic resin was performed using a 6-percent NaCl solution until the concentrations of perchlorate and nitrate remained below analytical detection limits. Figure 5-2 shows the profile of anions displaced during the regeneration cycle at a salt loading rate of 41 lbs/ft3. Nitrate, sulfate, and bicarbonate were completely removed from the resin after 4 BV of regeneration, and perchlorate was removed after 10 BV of regeneration.
Figure 5-2. Polyacrylic resin regeneration evaluation (41 lbs of NaCl per ft3 of resin). Based on these results, a partial regeneration of 25 lb/ft3 (6.7 BV) was selected for the polyacrylic resin during initial baseline testing. This would ensure that no nitrate, sulfate, nor bicarbonate would accumulate on the resin over time. Displacement of a large fraction of the perchlorate was also anticipated—especially since during regular operation (i.e., shorter run lengths), less perchlorate would accumulate on the resin.
0
10,000
20,000
30,000
40,000
50,000
0 2 4 6 8 10
Bed Volumes
Ani
ons
(mg/
L)
0
500
1,000
1,500
2,000
2,5000 10 20 30 40
Salt Loading Rate (lb NaCl/ft3)
Perc
hlor
ate
(µg/
L)
ChlorideSulfateBicarbonateNitratePerchlorate
31
5.1.2 Baseline IX Performance Once initial operating conditions were established, baseline performance of the IX system was established to estimate its long-term performance for perchlorate removal and also to serve as a reference for subsequent brine treatment and recycling experiments. The resin was exhausted and regenerated with a 6-percent NaCl brine solution for 10 cycles.
Using the operating conditions determined during the initial resin evaluation, the polyacrylic resin was exhausted for 255 BV at a flow rate of 2.1 gpm and regenerated with 25 lbs/ft3 using 6-percent NaCl brine. Ten exhaustion and regeneration cycles were performed to establish the baseline performance. Figure 5-3 summarizes the exhaustion profiles of perchlorate, nitrate, sulfate, chloride, and bicarbonate observed during selected runs (run 1, 5, and 10). As seen in these anion profiles, a high degree of repeatability was observed during baseline testing. This consistency indicated that bicarbonate and nitrate were not accumulating on the resin. However, the exhaustion data alone were insufficient to determine if other anions, like perchlorate and sulfate, were accumulating on the resin when applying the chosen regeneration procedure. Effluent analyses for the other runs indicated similar performance.
Figure 5-3. Comparison of exhaustion profiles during baseline testing (runs 1, 5, 10).
0
100
200
300
0 100 200 300
Bed Volumes
Ani
ons
(mg/
L)
0
10
20
30
40
Perc
hlor
ate
(µg/
L)
ClO4- and SO4
2-
non-detect at 255 BV
Cl HCO3
NO3
32
Closer inspection of the effluent nitrate concentration throughout the baseline testing also revealed a high level of reproducibility. As shown in figure 5-4, the effluent nitrate concentration was below the 10-mg-N/L MCL for all runs. However, the run length would need to be slightly shortened to create potable quality water below the 8-mg-N/L operational goal.
Figure 5-4. End of exhaustion water quality at 255 BV during baseline testing.
Partial regeneration was performed in counter-current mode at a flow rate of 0.37 gpm for 6.7 BV (salt loading rate of 25 lbs/ft3). Figure 5-5 compares the regeneration profiles of perchlorate, nitrate, sulfate, and chloride observed during selected runs. Nitrate and sulfate were completely displaced from the resin after 3.5 BV. Perchlorate was measured (average concentration = 191 µg/L) at the end of each of the 10 regeneration cycles. The chloride concentration increased for 3 BV and then remained relatively constant for the rest of the regeneration at 37,000 mg/L.
A closer look at the regeneration curves for each individual anion displaced during regeneration (figure 5-6 to figure 5-9) indicated that the total mass of anions adsorbed by the resin during these runs varied slightly. This variation was likely to be the result of the small but regular variability in the influent water quality concentrations of these anions (perchlorate, nitrate, sulfate, and bicarbonate). The lack of a shift in elution time or consistent increase in peak
0
20
40
60
80
1 3 5 7 9
IX Cycle
Ani
on (m
g/L)
0
50
100
150
200
250
300
Bic
arbo
nate
(mg/
L)
HCO3
NO3
ClO4- and SO4
2-
non-detect at 255 BV
Nitrate MCL, 44 mg/L (10 mg/L as N)
Operational Goal, 35.2 mg/L (8 mg/L as N)
33
area indicated that these anions were not accumulating on the resin in significant quantities within the 10 baseline cycles.
As measurable concentrations of perchlorate were in the brine at the end of the regeneration cycle, it was expected that after prolonged operation, the concentration of perchlorate would build up on the resin. If this concentration would accumulate to the point of causing perchlorate leakage, a complete regeneration of the resin with respect to perchlorate would be required. This regeneration, however, would only be approximately twice the normal regeneration salt loading rate based on the initial resin evaluation.
Figure 5-6. Regeneration profile of perchlorate during baseline testing (runs 1, 5, 10).
Figure 5-7. Regeneration profile of nitrate during baseline testing (run 1, 5, 10).
0
250
500
750
1,000
0 1 2 3 4 5 6 7
Bed Volumes
Perc
hlor
ate
(µg/
L)
R1
R5
R10
0
5,000
10,000
15,000
20,000
0 1 2 3 4 5 6 7
Bed Volumes
Nitr
ate
(mg/
L)
R1
R5
R10
35
Figure 5-8. Regeneration profile of bicarbonate during baseline testing (run 1, 5, 10).
Figure 5-9. Regeneration profile of sulfate during baseline testing (run 1, 5, 10).
0
10,000
20,000
30,000
40,000
0 1 2 3 4 5 6 7
Bed Volumes
Bic
arbo
nate
(mg/
L)
R1
R5
R10
0
5,000
10,000
15,000
20,000
25,000
0 1 2 3 4 5 6 7
Bed Volumes
Sulfa
te (m
g/L)
R1
R5
R10
36
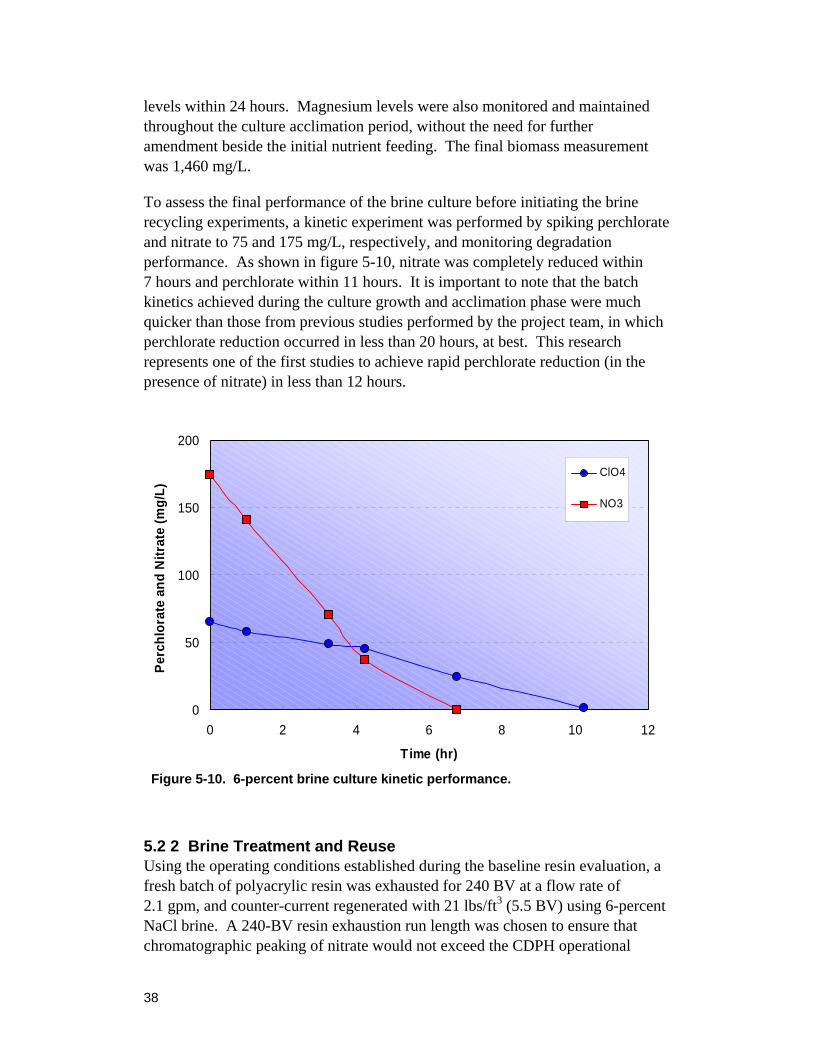
5.2 Biological Brine Treatment
5.2.1 Culture Growth and Acclimation The objective of this task was to acclimate the perchlorate- and nitrate-reducing brine culture to higher concentration brine (5- to 6-percent NaCl) prior to initiating brine treatment and recycling experiments. Previously, the project team completed an AwwaRF study (Aldridge et al., 2004) in which the biological brine culture was utilized in 3-percent NaCl brine. Although perchlorate degradation studies were successful in 3-percent NaCl brine, attempts to acclimate the culture to higher brine strengths were unsuccessful. The following presents results from the first pilot-scale attempts to acclimate the existing perchlorate-reducing culture to 6-percent NaCl.
First, approximately 5 gallons of the brine culture, capable of reducing both perchlorate and nitrate, were grown at bench-scale in 3-percent NaCl brine. Once the performance of the culture was established (i.e., perchlorate and nitrate reduction in less than 24 hours), the 5-gallon culture was transferred into the pilot-scale SBR; and 15 gallons of freshly prepared 3-percent NaCl synthetic brine solution were added to increase the total culture volume to 20 gallons. The makeup of the synthetic brine solution is detailed in table 5-1. The concentration of biomass, measured as volatile suspended solids (VSS), was initially 760 mg/L; and perchlorate and nitrate were both spiked to 500 mg/L to encourage culture activity and growth. Concentrations of perchlorate, nitrate, and VSS were monitored over time to characterize culture performance.
VSS was maintained at approximately 750 mg/L. For the next three feedings, perchlorate and nitrate were spiked to 500 mg/L and monitored. By the third feeding, complete reduction of perchlorate and nitrate to below detection limits was achieved within 24 hours and the biomass concentration had increased to 1,060 mg/L as VSS. At this time, the culture volume was increased to 25 gallons and the spike/monitoring process was repeated for another week to until biomass levels increased to 1,000 mg/L. By the end of the third week of operation, the brine culture volume was increased to 30 gallons, complete perchlorate and nitrate reduction was consistently occurring within 24 hours, and the VSS was maintained at 1,000 mg/L. These startup results demonstrated rapid perchlorate and nitrate reduction in 3-percent NaCl brine as the volume was gradually increased.
37
Table 5-1. Constituents of Synthetic Medium1 Component Concentration
1 g/L = grams per liter; mL/L = milliliters per liter. 2 Mineral solution composition in deionized water
(grams per liter [g/L]). After the first feeding, perchlorate and nitrate were reduced within 48 hours; and VSS was maintained at approximately 750 mg/L. For the next three feedings, perchlorate and nitrate were spiked to 500 mg/L and monitored. By the third feeding, complete reduction of perchlorate and nitrate to below detection limits was achieved within 24 hours, and the biomass concentration had increased to 1,060 mg/L as VSS. At this time, the culture volume was increased to 25 gallons; and the spike/monitoring process was repeated for another week to until biomass levels increased to 1,000 mg/L. By the end of the third week of operation, the brine culture volume was increased to 30 gallons, complete perchlorate and nitrate reduction was consistently occurring within 24 hours, and the VSS was maintained at 1,000 mg/L. These startup results demonstrated rapid perchlorate and nitrate reduction in 3-percent NaCl brine as the volume was gradually increased.
After the final working volume was achieved (30 gallons), salt was added to the brine culture to increase the NaCl content to 6 percent. A key finding in the project team’s previous research (Aldridge et al., 2004) was the brine culture’s dependence on presence of divalent cation (typically magnesium) as a nutrient to allow for rapid perchlorate reduction in high strength brine (patent pending). As a result, the brine culture solution was spiked with 500-mg/L perchlorate and nitrate, and magnesium chloride was amended to maintain a Mg2+/Na mass ratio of 0.11. Daily perchlorate and nitrate spikes continued for the following 3 weeks during which perchlorate and nitrate were both consistently reduced to nondetect
38
levels within 24 hours. Magnesium levels were also monitored and maintained throughout the culture acclimation period, without the need for further amendment beside the initial nutrient feeding. The final biomass measurement was 1,460 mg/L.
To assess the final performance of the brine culture before initiating the brine recycling experiments, a kinetic experiment was performed by spiking perchlorate and nitrate to 75 and 175 mg/L, respectively, and monitoring degradation performance. As shown in figure 5-10, nitrate was completely reduced within 7 hours and perchlorate within 11 hours. It is important to note that the batch kinetics achieved during the culture growth and acclimation phase were much quicker than those from previous studies performed by the project team, in which perchlorate reduction occurred in less than 20 hours, at best. This research represents one of the first studies to achieve rapid perchlorate reduction (in the presence of nitrate) in less than 12 hours.
5.2 2 Brine Treatment and Reuse Using the operating conditions established during the baseline resin evaluation, a fresh batch of polyacrylic resin was exhausted for 240 BV at a flow rate of 2.1 gpm, and counter-current regenerated with 21 lbs/ft3 (5.5 BV) using 6-percent NaCl brine. A 240-BV resin exhaustion run length was chosen to ensure that chromatographic peaking of nitrate would not exceed the CDPH operational
39
treatment goal for nitrate (80 percent of the 10 mg/L as N MCL). Previously during baseline testing, several runs exceeded the 8 mg/L as N (35.2 mg/L nitrate) goal when operated to 255 BV, as seen in figure 5-4.
A total of 20 cycles was completed for brine reuse testing. The main focus of this phase of testing was to determine if the brine culture could be sustainable in higher strength brine (greater than 3-percent NaCl) while reducing perchlorate and nitrate to below detection limits within 24 hours. A secondary goal was to monitor IX effluent water quality and to evaluate if brine recycling negatively affected resin performance. However, a more detailed pilot study would be required to fully understand the impact of brine reuse on resin efficiency. This would involve performing additional re(cycles) to simulate long-term operation and conducting detailed microecology monitoring.
Figure 5-11 compares the exhaustion profiles of perchlorate, nitrate, sulfate, chloride, and bicarbonate observed during selected runs (run 1, 10, and 20). Effluent analysis for all other runs indicated similar reproducible performance. As seen in these anion profiles, a high degree of repeatability was observed during the course of biological brine treatment and reuse testing.
Figure 5-11. Comparison of exhaustion profiles during brine reuse testing (runs 1, 10, 20).
Additionally, nitrate was maintained well below the CDPH operational nitrate goal for all runs, as shown in figure 5-12.
0
100
200
300
400
0 100 200 300
Bed Volumes
Ani
ons
(mg/
L)
ClO4- and SO4
2-
non-detect at 240 BV
Cl HCO3
NO3
40
Figure 5-12. Exhaustion water quality at 240 BV during brine recycling testing.
Before being transferred to the SBR, spent brine from each regeneration was amended with two times the stoichiometric requirement of acetic acid (electron donor) and sufficient magnesium chloride to maintain a Mg2+/Na mass ratio of 0.11 (patent pending). As previously described, perchlorate was also added to increase its concentration to approximately 3.0 mg/L, to simulate perchlorate concentrations in spent brine from representative IX facilities in southern California. Biological reduction of perchlorate to below the 100-µg/L treatment goal was successfully achieved for all 20 runs within 24 hours. Simultaneous reduction of nitrate occurred below analytical detection limits within 8 hours. As expected, sulfate and bicarbonate were not removed by the biological brine treatment system, and their respective concentrations in the brine increased with each consecutive regeneration, shown later in figure 5-13.
It is important to consider that in addition to bicarbonate and sulfate, additional nontargeted ions (i.e., uranium, silica, fluoride, barium, arsenic, etc.) may potentially accumulate in the recycled brine, depending on site-specific raw water quality. Although not investigated in this feasibility study, if accumulation is allowed to continue unabated, operational, water quality, or disposal goals may be jeopardized. Components of the brine might accumulate to levels that would classify it as a hazardous waste or become toxic to the biological culture. Additionally, the effective exhaustion cycle may be reduced, which would demand more frequent regenerations. Several options, however, could be pursued to avoid these situations: 1) periodically waste the recycled brine and continue
0
20
40
60
80
1 3 5 7 9
IX cycle
Ani
on (m
g/L)
0
50
100
150
200
250
300
Bic
arbo
nate
(mg/
L)
HCO3
ClO4- and SO4
2-
non-detect at 240 BVNO3
Nitrate MCL, 44 mg/L (10 mg/L as N)
Operational Goal, 35.2 mg/L (8 mg/L as N)
41
treatment with a fresh batch of brine; 2) periodically waste a portion of the recycled brine (and subsequently amend it with virgin brine) to limit the accumulation of these nontargeted anions; or 3) further processing of the treated recycled brine to remove the accumulating anions (i.e., passing the treated brine through an NF or RO membrane). Additional testing, however, should be conducted to evaluate the long-term effect of accumulation of these anions on resin performance and culture performance.
After perchlorate and nitrate were reduced to below detection limits, the treated brine from the SBR was settled, decanted, and used to refill the regeneration tank. The treated brine was also amended with NaCl to restore the 6-percent concentration for the subsequent regeneration. Figure 5-13 shows the concentration of selected anions in the composite brine, following resin regenerations with recycled brine. Perchlorate and nitrate concentrations remained consistent for all 20 runs averaging 500 µg/L and 2,700 mg/L, respectively (before perchlorate was spiked to 3.0 mg/L) demonstrating that resin efficiency was not affected during the 20 re(cycles) performed. The average NaCl concentration in the spent brine was 4.5 percent, due to the exchange of chloride ions with perchlorate, nitrate, bicarbonate, and sulfate during the 6-percent NaCl regeneration.
Detailed regeneration profiles of perchlorate and nitrate for selected runs (run 1, 10, and 20), as seen in figure 5-14 and figure 5-15, were nearly identical to the results found during baseline testing. This observation confirmed that biologically treated brine could successfully be reused numerous times without a loss in resin performance. In addition, the accumulation of sulfate and bicarbonate (figure 5-16 and 5-17) in the treated brine had no effect on the regeneration performance (in terms of perchlorate and nitrate removal) when this brine was recycled. It is worth mentioning that as sulfate and bicarbonate accumulated in the brine with increasing number of runs, the peak height of the sulfate and bicarbonate chromatographic peaks in the regeneration profiles increased correspondingly but the retention times of these chromatographic peaks remained constant.
Figure 5-14. Profile of perchlorate concentration during different regeneration runs.
0
250
500
750
1,000
0 1 2 3 4 5 6 7
Bed Volumes
Perc
hlor
ate
(µg/
L)
R1
R10
R20
43
Figure 5-15. Profile of nitrate concentration during different regeneration runs.
Figure 5-16. Profile of sulfate concentration during different regeneration runs.
0
5,000
10,000
15,000
20,000
0 1 2 3 4 5 6 7
Bed Volumes
Nitr
ate
(mg/
L)
R1
R10
R20
0
10,000
20,000
30,000
40,000
0 1 2 3 4 5 6 7
Bed Volumes
Sulfa
te (m
g/L)
R1
R10
R20
44
Figure 5-17. Profile of bicarbonate concentration during different regeneration runs.
5.3 Alternative Reactor Evaluation
A critical issue in the development of biological treatment systems is optimizing reactor configuration. To date, the treatment system had only been evaluated using an SBR configuration. Although the SBR is ideally suited to evaluate a wide range of brine quality conditions and provide a critical link between bench- and pilot-scale development, alternative reactor configurations (i.e., flow-through) may have significant advantages for full-scale operation and additional potential cost savings. As a result, it was determined that evaluation of an alternative and optimized reactor configuration may be beneficial to the full-scale development and implementation of the project team’s biological brine treatment system.
Biological FBRs are fixed-film bioreactors that rely on the immobilization of microbes on a hydraulically fluidized bed of small media particles. Due to the relatively thin films obtained, the FBR maintains high concentrations of active biomass in the reactor, thereby providing high volumetric efficiency. The influent stream is introduced in an upflow mode at a velocity sufficient to fluidize, or expand, the bed of media particles. The most frequently used media are sand and GAC. Sand is usually chosen for treatment of water containing high concentrations of organic matter or where the equivalent organic dosing is high, and the inventory of biomass in the FBR is expected to be large (i.e., high biofilm
0
10,000
20,000
30,000
40,000
50,000
0 1 2 3 4 5 6 7
Bed Volumes
Bic
arbo
nate
(mg/
L)
R1
R10
R20
45
growth applications). GAC is usually selected when the treatment criteria is very stringent (i.e., treatment down to µg/L levels) or for polishing the effluent from sand FBR systems.
The GAC FBR is one in which a biofilm grows attached to the activated carbon particles, which are fluidized by the drag exerted by the upward flowing water. The carbon allows for a very large specific surface area for biomass growth, allowing for very large concentrations of biomass which, in turn allows for shorter retention times. The carbon helps to maintain long solids retention time, which could be necessary for anaerobic/anoxic degradation of inhibitory compounds. Also, the exterior surface roughness of the GAC makes it superior to other media for microbial sheltering (Suidan et al., 1988). The biomass is able to grow in the pores of the GAC, which helps to attain better attachment, a desirable feature when the fluidization velocities are high. Furthermore, some properties of GAC makes it a suitable media for FBRs, including its uniform size, low specific gravity, good abrasive resistance, and surface conducive to cell immobilization. Weber et al. (1973) have proposed that the absorptive properties of GAC increase the concentration of soluble organic matter at the interface, thereby stimulating biological growth.
Some of the reasons for better performance of FBR in comparison to other conventional reactors, such as attached growth or suspended growth reactors, are as follows (Gupta and Sathiyamoorthy, 1999):
• Low heat and mass transfer resistance due to reduced thickness of hydrodynamic boundary layer.
• When GAC is used as the attachment media, it offers very high surface area.
• Multiple stage FBRs can be easily implemented and they offer better control over solids retention times and empty bed contact times.
• Low washout of microbes from the system.
• Minimum sludge recycle.
• Biomass recovery at high substrate loading.
• Clog-free operation during high substrate loading and high biomass accumulation.
• The reactor is mounted vertically and, hence, has a small footprint.
• The system is fairly simple and robust; hence, operator skill required is low.
46
A few disadvantages of FBR include:
• Generation of fines due to attrition between the particles.
• Fines make the liquid viscous, increasing pumping costs.
5.3.1 Bench-Scale FBR Performance Considering the aforementioned advantages, a bench-scale FBR was constructed to test the adaptability of the perchlorate-reducing brine inoculum to a fluidized bed environment. This experiment was intended to be a proof-of-concept. One of the primary concerns was the attachment of the biomass to the media. Earlier experiments with sand and diatomaceous earth had shown that the brine culture did not readily attach to those surfaces. Since the pores and crevices in the GAC provide shelter to the biomass even in a high shear environment, GAC was chosen as the attachment media.
Following the startup and acclimatization phase, the operational parameters were varied to attain consistent perchlorate degradation. The operational parameters are summarized in table 5-2.
Table 5-2. Operational Parameters for FBR
Phase Day
number
Brine Concentration
(%)
Influent Perchlorate
Concentration (ppm)
Influent Nitrate
Concentration (ppm)
Flow Rate
(L/day) I 1-9 8 75 4,000 2 II 10-18 6 100 2,000 2 III 19-28 6 100 - 4 IV 29-37 4 - - 0 V 38- 4 100 - 1
Figure 5-18 shows the effluent concentration of the reactor during the different phases of operation.
Following is a discussion of the effect of change in various operational parameters on the effluent concentration. During phase I, up to 90-percent removal of nitrate and 66-percent removal of perchlorate were achieved, indicating that both denitrification and perchlorate reduction were slow. An increasing trend in the perchlorate effluent concentration indicated that the reactor had not reached steady state and the perchlorate loading was higher than the rate at which perchlorate was being reduced. When the feed was stopped for a day, an immediate reduction in bulk concentration was observed.
47
Figure 5-18. Concentration profile of the FBR effluent data.
Since a continuously stirred tank reactor (CSTR) operation was assumed, a decrease in the bulk concentration inside the reactor would reflect in a lower effluent concentration. Further, it was desirable to get the microorganisms inside the reactor acclimatized to lower bulk concentrations. At the same time, it was desirable to have enough biomass of perchlorate degrading microorganisms attached to the media.
It was hypothesized that perchlorate reduction kinetics and acclimatization would improve in lower strength brine. Hence, the strength of brine was lowered to 6 percent during phase II. To increase the biomass concentration of perchlorate reducers, the concentration of perchlorate in the feed was increased to 100 mg/L. During this phase, complete nitrate removal was achieved while 75-percent removal of perchlorate was attained. This was an improvement over the performance in the phase I.
During phase III, 100-mg/L perchlorate was fed at 4 liters per day. The FBR started to fail, and effluent perchlorate concentrations increased during this phase. Oxidation reduction potential (ORP) readings indicated that the reduction potential was sufficient for nitrate and perchlorate reduction. Further, DO inside the reactor was less than 0.02 mg/L indicating a good anoxic environment. From days 23-25, when the reactor was operated in batch mode and the feeding was stopped, the perchlorate concentration inside the reactor began to drop. On restarting the feed, the effluent concentrations began to increase again. This
0
15,000
30,000
45,000
60,000
75,000
90,000
0 10 20 30 40 50 60
Days
Eff
luen
t Con
cent
ratio
n, µ
g/L
8% brine,75 ppm,2 L/day
Phase I
6% brine,100 ppm,4 L/day
Phase III
4% brine,100 ppm,No feed
Phase IV
4% brine,100 ppm,1 L/day
Phase V
6% brine,100 ppm,2 L/day
Phase II
NO3--N(mg/L)
ClO4- ( g/L)
48
indicated that the kinetics of degradation were slow and the amount of perchlorate degrading biomass inside the reactor was not sufficient to handle the given perchlorate loading.
In phase IV, the concentration of brine inside the reactor was reduced to 4 percent to improve the kinetics of degradation, and the perchlorate concentration inside the reactor was spiked to 100 mg/L. During this phase, the reactor was operated in batch mode, and the bulk concentration was monitored. The high perchlorate concentration was expected to stimulate the growth of perchlorate-reducing organisms.
During phase V, the reactor was fed at 1 liter per day (HRT = 3 days) with the feed consisting of 100-mg/L perchlorate in 4-percent brine. Once steady state operation was achieved, 99-percent removal of perchlorate was demonstrated. It is worth noting that this was the first instance of successful perchlorate reduction using the project team’s perchlorate-reducing culture in a flow-through system.
Further optimization of the operational parameters is required. This will be done by successively reducing the EBCT. This study showed the feasibility of perchlorate and nitrate reduction using the project team’s perchlorate-reducing brine culture in a FBR.
49
6. Conceptual Cost Analysis 6.1 Background
Pilot testing of the IX process combined with biological brine treatment and reuse determined that this process was effective in treating both perchlorate and nitrate in the water. An additional benefit of using biological brine treatment, besides providing a sustainable source of water by treating perchlorate- and nitrate-contaminated water, is an improvement to currently approved IX technology. Therefore, a conceptual cost analysis was performed to estimate capital and operational costs associated with a various full-scale IX perchlorate treatment systems. A cost analysis was conducted for the following IX treatment options:
• Conventional IX (using regenerable resins) with brine disposal: In this option, the IX resin can be regenerated using a brine solution. During the process of regeneration, perchlorate and nitrate on the anion resin is displaced by chloride ions; and these ions are eluted during the regeneration process. This perchlorate-laden brine must be disposed of using a dedicated brine line.
• Conventional IX with biological brine treatment using a SBR: In this option, the perchlorate-laden brine generated from the IX process is treated in a sequential batch reactor. The treated brine can then be reused for regeneration.
• Conventional IX with biological brine treatment using a FBR: This process treats the perchlorate-laden brine using a FBR, which has multiple advantages over the SBR, including faster kinetics, lower operational costs, and a smaller foot print area.
• Conventional IX with chemical brine treatment: Conventional IX process generates spent IX brine that must be disposed of in a dedicated brine line. Calgon Carbon Corporation has introduced a catalytic destruction process known as the perchlorate and nitrate destruction module (PNDM) to treat spent perchlorate-laden brine.
• IX using single-use (disposable) resins: Single-use nonregenerable resin with high capacity for perchlorate removal has been evaluated in this option. These resins are neither regenerated nor reused. After the resin has been completely exhausted, they are removed from the system and disposed of, typically via incineration.
An important consideration with regard to the cost of treating perchlorate contaminated water is the fact that using single-use resins is understood to be less
50
expensive than the existing brine handling alternatives, which include brine disposal or chemical or biological brine treatment for reuse applications. Compared to IX with biological treatment, the water production cost associated with treatment based on single-use resins may be approximately 30 percent lower. This is because single-use resin run lengths inherently are often one to three orders of magnitude longer than conventional regenerable resins (e.g., 400 BV versus 100,000 BV). This eliminates the costly requirement of salt for frequent regenerations and, in turn, makes the otherwise costly incineration of the loaded resin economical. However, it is important to note that single-use resins perform well only when the concentrations of competitive anions, such as sulfate and nitrate (i.e., usually found accompanying perchlorate in contaminated sites), are relatively low. If the concentrations of these anions are high, the competition for the resin’s active sites becomes detrimental to system performance. In this case, more specialized (and often more costly) single-use resins are required, but even these resins need to be replaced more often. This results in significant increases in resin and incineration costs, which lowers the cost advantages of using this process. Given that the assumed conditions for this study consider significant concentrations of nitrate and sulfate (i.e., competitive anions), no substantial benefit is expected from using single-use resins in this case. Consequently, this treatment alternative was not discussed in the cost section. It is worth mentioning, on the other hand, that biological processes are not affected by high concentrations of these competitive ions.
Design criteria used to estimate advanced treatment costs were based on information collected during current and previous pilot testing and manufacturer recommendations. Full-scale treatment costs for each treatment option were developed for a 2,500-gpm (3.6-million-gallon-per-day) system treating an influent water quality of 25 mg/L NO3- and 20 µg/L ClO4-, which is representative of the groundwater quality in southern California. The cost estimate encompassed the following considerations:
• Treatment capacity of 2,500 gpm of process water
• Brine stream from regeneration process at a flow rate of 25 gpm
• Capital, construction-related, and labor costs included
• O&M costs including consumables, power, and equipment based on pilot performance
Construction-related costs include engineering design, site work, legal, and administrative work involved in the construction of a new brine treatment facility. These values are calculated using a range of construction-related
51
costs (i.e., as a percentage of the capital cost), based on experience with water treatment plant construction (table 6-1).
Table 6-1. Range of Construction-related Costs
Construction-related Cost Average Range1
(%)
Civil Site Work 1 to 10 Instrumentation 3 to 15 Electrical Site Work 7 to 12 Piping 5 to 12 Construction Contingency 10 to 35 Contractor Overhead and Profit, Bonds, and Insurance
10 to 20
Engineering, Legal and Administrative 10 to 30 1 Average ranges based on experience with surface water
treatment plant design.
Construction contingencies applied to the cost estimate reflect the degree of confidence in the design which, in turn, is related to the acceptance and development of the selected technology. For this reason, the selected level of contingency indicates the level of detail provided for a given design stage. A low contingency budget indicates a high degree of confidence in the design (i.e., conventional IX) while a high contingency budget suggests the opposite (i.e., chemical and biological brine treatment). The recommended contingency levels for the varying types of cost estimates are listed in table 6-2. In this case, a low degree of confidence was assumed since the brine treatment technologies evaluated in this study were still at experimental stage. Thus, a 20-percent contingency was applied to the engineering analysis in this study, which corresponds to a “Conceptual” cost estimate according to the table below.
Table 6-2. Recommended Contingency for Corresponding Level of Estimate
Type of Cost Estimate Level of Accuracy
(%)
Recommended Contingency
(%)
Order-of-Magnitude +50 to -30 20 to 30 Conceptual +40 to -20 15 to 20 Preliminary Design +30 to -15 10 to 15 Definitive +15 to -5 5 to 10
52
6.1.1 Engineering Assumptions The cost model was based on the IX design capacity (flow rate, bed volumes, loading rates, etc.) and the spent brine water quality characteristics. Major variables included in this analysis were design criteria, spent brine water quality (for discharge and/or treatment analysis), and cost information related to capital costs. Design run times for multiple-use IX resins were based on previous pilot experience. Table 6-3 summarizes the engineering assumptions used in the cost analysis.
Table 6-3. Summary of Engineering Assumptions Used in the IX Cost Analysis
Input Design Information Regenerable Resin Design Flow Rate 2,500 gpm Design Run Time 400 BV Service Loading Rate 4 gpm/ft3 Salt Loading Rate 25 lbs/ft3 Salt Strength 6 percent
O&M Costs Associated with the IX System Value Plant Equipment Life 20 years Resin Life 5 years Energy Unit Cost $0.08 per kilowatthour
Table 6-4 summarizes the design parameters and costs associated with the brine treatment options. Since the annual fee for using a brine line is generally based on the chemical oxygen demand (COD) and total suspended solids (TSS) in untreated spent brine, these two parameters were included in the model. Assumed values were 3,500 mg/L for COD and 50 mg/L for TSS, based on analysis of brine collected during pilot testing.
Table 6-4. Summary of Assumptions Used in Cost Model for Brine Treatment Options
Spent Brine Water Quality Value Perchlorate, mg/L 3.5 Nitrate, mg/L 1,250
Capital Costs Associated with Biological or PNDM Treatment Value Post Biological Filtration Unit $51,000 Number of Pumps (Booster, Transfer, and Chemical) 8 Pump Cost $1,000 per
horsepower
53
Table 6-4. Summary of Assumptions Used in Cost Model for Brine Treatment Options (continued)
Biological Brine Treatment Value Number of Biological Reactor Tanks (16,500 gallon) 5 Number of Equalization Tanks (3,000 gallons each) 1
PNDM Brine Treatment Value Desired Ammonia Residual 500 mg/L Catalyst Unit Cost in PNDM $80 per pound
6.2 Estimated Treatment Costs
6.2.1 Capital Cost Capital costs are related to all elements required for establishing a new IX treatment facility, to the point where it is ready to operate. Capital costs generally include equipment, installation, construction-related costs, engineering and legal fees, etc. A detailed description of the calculation of capital and O&M costs for all the discussed treatment alternatives is presented in Appendix A at the end of this study. Figure 6-1 shows the capital costs for developing a 2,500-gpm treatment facility that will operate according to the engineering criteria established in table 6-3 and table 6-4. This figure shows estimated capital costs for each one of the proposed treatment alternatives.
Figure 6-1 shows that coupling brine treatment processes to the conventional IX process increases the capital cost of the facility at various levels. Adding the PNDM process to the treatment train represents the most expensive alternative, as it increases the capital costs by 82 percent, with respect to the capital costs of conventional IX treatment (i.e., no brine reuse). On the other hand, adding biological treatment of brine either by using SBR or FBR causes essentially the same increase of capital costs (14 percent). This result indicates that when similar kinetics are assumed for the FBR and the SBR (as it was the case for this analysis), the capital costs of a combined IX system with biological treatment of brine based either in SBR or FBR are also similar. In reality, however, the FBR usually exhibits faster kinetics than other conventional reactors such as the SBR. Faster kinetics translate into smaller reactor volumes or lesser number of reactors. Also, the footprint of an FBR is much smaller than an SBR treating similar volumes of waste. This will result in added savings in utility costs.
54
Figure 6-1. Capital costs for different treatment alternatives.
In all cases, equipment costs represented the largest portion of the capital costs (i.e., between 50 to 60 percent of the total). The second largest group was construction costs (approximately 20 percent), followed by engineering, legal and administrative fees, contingencies, etc. This calculation did not include land costs, as it was assumed that the brine treatment facilities would be built in available areas near the existing IX systems. The effect of the capital costs on the total water production cost for each one of these treatment alternatives will be shown later in this section.
6.2.2 Operation and Maintenance Costs O&M costs involve all costs associated with the production of a unit volume of treated water. These costs are usually estimated on an annual basis and mainly include consumables (i.e., chemicals in general), labor, energy, utilities, and other miscellaneous costs (i.e., maintenance requirements). As mentioned in the previous section, a detail of these calculations is presented in Appendix A.
Figure 6-2 shows the annual O&M costs for a 2,500-gpm treatment facility designed according to the engineering criteria established in table 6-3 and table 6-4.
Figure 6-2 shows that the O&M costs of conventional IX process are reduced when brine treatment and reuse processes are incorporated to the treatment train, mostly due to the reduction in consumables cost, as it will be shown later.
0.0
2.0
4.0
6.0
8.0
10.0
12.0
Conventional IX IX w/ chemical brinetreatment (PNDM)
IX w/ biological brinetreatment (SBR)
IX w/ biological brinetreatment (FBR)
Cap
ital C
ost (
in m
illio
ns)
55
Figure 6-2. Annual O&M costs for each treatment alternative.
Figure 6-3 shows the contribution of each O&M cost component to the overall O&M cost for conventional IX.
Figure 6-3. Contribution of each O&M component to total O&M cost in conventional IX.
0.0
0.2
0.4
0.6
0.8
1.0
1.2
1.4
Conventional IX IX w/ chemical brinetreatment (PNDM)
IX w/ biological brinetreatment (SBR)
IX w/ biological brinetreatment (FBR)
Ann
ual O
&M
Cos
t (in
mill
ions
)
Consumable Costs46%Labor Costs
9%
Miscellaneous O&M Costs
20%
Resin Costs2%
Disposal Costs2%
Energy Costs21%
56
According to this figure, consumables (i.e., mostly salt) represent the largest component of O&M costs in conventional IX treatment (i.e., no brine reuse). For this reason, although incorporating brine treatment and reuse to conventional IX treatment demands of additional investment of energy, labor, and other costs, overall, there is a substantial decrease of O&M costs, mostly resulting from the reduction in salt demand. This conclusion is supported by the results shown in figure 6-2.
Chemical brine treatment using PNDM was found to reduce the O&M costs by approximately 15 percent with respect to the O&M costs of conventional IX. However, the most noticeable reduction in O&M costs was observed when biological treatment was incorporated to the treatment process, either using SBRs (27-percent reduction) or an FBR (31-percent reduction). These reductions in O&M costs are better explained when reviewing the variation of each O&M component for each of these coupled IX/brine treatment processes.
Figure 6-4 shows the variation of the different O&M components for each treatment process, with respect to the values of these O&M components in conventional IX treatment. If there is no variation, the respective category was assigned a value of zero, while any increase or decrease in value was quantified as a positive or negative percentage, respectively.
Figure 6-4. O&M components for each treatment alternative normalized with respect to O&M costs for conventional IX process.
Based on the results shown in figure 6-4, the following conclusions can be established:
• Incorporating chemical brine treatment (PNDM process) to a conventional IX process reduces the consumable costs by 92 percent, with respect to the costs of the conventional IX process with brine disposal. When incorporating biological brine treatment based on SBR and FBR, these costs are reduced by 73 percent and 81 percent, respectively. This explain the overall decrease of O&M costs in all cases.
• Since the majority of the brine is reused, disposal costs are greatly reduced in all cases (>95 percent).
• Resin costs for all the coupled processes are the same as those from conventional IX with brine disposal.
• Energy costs increase by almost 30 percent when incorporating the PNDM process, while there is a negligible increase when incorporating the biological processes (approximately 1 percent). This reflects the high energy demand of the PNDM process, which typically operates at high temperature and pressure (i.e., 270 degrees Celsius and 600 pounds per square inch).
• Labor costs for the IX-PNDM and the IX-SBR processes are 25 percent higher than those of conventional IX with brine disposal. In the case of the IX-FBR process, this increase is slightly smaller (21 percent).
• Miscellaneous O&M costs for the IX-PNDM process are more than twice than those for conventional IX, while they are just 14 and 12 percent more for SBR and FBR (the biological processes), respectively. An important consideration in this case is the high maintenance costs of the PNDM process, due to its specialized (and often costly) equipment.
6.2.3 Total Water Production Costs The total water production cost involves the capital and O&M costs of a given process. In this cost analysis, the capital costs presented in figure 6-1 are amortized at 6-percent interest over 20 years for all equipment and with resin life estimated at 5 years. These values are calculated on an annual basis that can then be added to the annual O&M costs presented in figure 6-2, to calculate the water production costs for each process. These values are shown in table 6-5.
58
Table 6-5. Total Water Production Cost for Each Treatment Process
Capital Cost1 O&M Cost1 Water Treatment
Costs1
Perchlorate Treatment Technology
$ per acre-foot
$ per 1,000
gallons
$ per acre-foot
$ per 1,000
gallons
$ per acre-foot
$ per 1,000
gallons Conventional IX with brine
disposal 114 0.35 329 1.01 443 1.36
IX with chemical brine treatment (PNDM)
207 0.63 282 0.86 489 1.50
IX with biological brine treatment (SBR)
129 0.39 231 0.71 360 1.11
IX with biological brine treatment (FBR)
129 0.39 216 0.66 346 1.06
1 Costs normalized using ENR’s Construction Cost Index and Marshall and Swift Equipment Index, where appropriate.
The values from table 6-5 show the following:
• Water production cost of the IX/PNDM process is almost 10 percent higher than that of conventional IX. This is due to its much higher capital costs (81 percent), which overcome the reduction in O&M costs (15 percent).
• Biological processes show a water production cost lower than that of conventional IX (19 and 22 percent lower for SBR and FBR, respectively). In both cases, the increases in capital costs (13 percent for both SBR and FBR) are easily surpassed by the reductions in O&M costs (30 and 35 percent for SBR and FBR, respectively).
Therefore, there are considerable savings in salt costs when brine is reused, despite the additional utility and operational costs associated with brine treatment. As shown in table 6-5, the water production costs for each coupled process predict that biological treatment and reuse of brine for regenerable IX systems is the most economical treatment alternative. It is important to note that cost estimates for the FBR were based on kinetic data from the current SBR (i.e., since FBR data was not available at the time). It is also worth mentioning that FBR usually provides a large improvement in kinetics over conventional reactors such as the SBR. This translates into lower requirements of reactor volume and processing time. Hence, brine treatment based on FBR technology may be considered a promising alternative that deserves further investigation.
59
REFERENCE LIST
Aldridge, L., T. Gillogly, G. Lehman, D. Clifford, D. Roberts and X. Lin, 2004. Treatability of Perchlorate in Groundwater Using Ion-exchange Technology, Phase II. AWWA Research Foundation, Denver, Colorado.
Aldridge, L., T. Gillogly, J. Oppenheimer, G. Lehman, K. Witter, A. Burbano, D. Clifford and A. Tripp. Treatment of Perchlorate Using Single-Use Ion-Exchange Resins. AWWA Research Foundation, Denver, Colorado, In Press.
Attaway, H. and M. Smith, 1993. Reduction of perchlorate by an anaerobic enrichment culture. Journal of Industrial Microbiology, 12, 408–412.
Browner, C.M., 1999. Part II: Environmental Protection Agency. 40 CFT Parts 9, 141, and 142. Revisions to the unregulated contaminant monitoring regulation for public water systems; final rule. Federal Register 1999, 64 (180), 50555–50620.
Cang, Y, D.J. Roberts, and D.A. Clifford, 2004. Development of Cultures Capable of Reducing Perchlorate and Nitrate in High Salt Solutions. Water Research, 38, 3322–3330.
Coates, J.D., U. Michaelidou, R.A. Bruce, S.M. O’Connor, J.N. Crespi, and L.A. Achenbach, 1999. Ubiquity and Diversity of Dissimilatory (Per)chlorate-Reducing Bacteria. Applied and Environmental Microbiology 65(12), 5234–5241.
Coppola, E.N.; G.R. McDonald, 2000. Bio-degradation of ammonium perchlorate, nitrate, hydrolysates and other energetic materials. United States Patent, 6,077,432.
EPA Groundwater & Drinking Water Perchlorate, January 2003. <http://www.epa.gov/fedfac/documents/perchlorate.htm>, May 10, 2003.
Gingras, T.M.; and J.R. Batista, 2002. Biological reduction of perchlorate in ion-exchange regenerant solutions containing high salinity and ammonium levels. Journal of Environmental Monitoring, 4, 96–101.
Gupta, C.K., and D. Sathiyamoorthy, 1999. Fluid Bed Technology in Materials Processing. CRC Press, Boca Raton, Florida.
Hiremath, T., D.J. Roberts, X. Lin, D.A. Clifford, T.E. Gillogly, and G.E. Lehman, 2005. Biological Treatment of Perchlorate in Spent ISEP Ion-Exchange Brine. Submitted to Environmental Science and Technology.
60
Lehman, S.G., T. Gillogly, D. Roberts, T. Hiremath, X. Lin, D. Clifford, 2004. Biological Reduction of Perchlorate and Nitrate Treatment Residuals, in Proceedings of the 2004 East Valley Water District Water Quality Conference, Ontario, California.
Lin, X, D.J. Roberts, T. Hiremath, D.A. Clifford, T. Gillogly, and G. Lehman, 2005. Divalent Cation Addition (Ca2+ or Mg2+) Stabilizes Biological Treatment of Perchlorate and Nitrate in Ion-exchange Spent Brine. Submitted to Water Research.
Logan, B.E., 2001. Assessing the outlook for perchlorate remediation. Environmental Science and Technology, 35, 482A–487A.
Logan, B.E., J. Wu, and R.F. Unz, 2001. Biological perchlorate reduction in high-salinity solutions. Water Research, 35(12), 3034–3038.
Mayer, K., 2003. Memorandum – Transmittal of Perchlorate Maps and Table, Updated April 2003. EPA. May 14, 2003.
Okeke, B.C., T. Giblin, and W.T. Frankenberger, 2002. Reduction of perchlorate and nitrate by salt tolerant bacteria. Environmental Pollution, 118, 357–363.
Perciasepe, R., 1998. Part III: Environmental Protection Agency. Announcement of the drinking water contaminant candidate list; notice. Federal Register 1998, 63 (40), 10273–10287.
Rikken, G.B., A.G.M. Kroon, and C.G. Van Ginkel, 1996. Transformation of (per)chlorate into chloride by a newly isolated bacterium: reduction and dismutation. Applied Microbiology and Biotechnology, 45, 42–426.
Suidan M.T., J.T. Pfeffer, G.F. Nakhla, 1998. Anaerobic Expanded Bed GAC Reactor for the Treatment of Biologically Inhibiting Wastes during Coal and Petroleum Distillation, in Proceedings of 1998 Fifth International Symposium on Anaerobic Digestion, Bologna, Italy. May 1998.
Weber, W. J., Jr., Friedman, L.D., and Bloom, R.J., Jr., 1973. Biologically Extended Physiochemical Treatment, in Proceedings of 1973 Sixth Conference of International Association on Water Pollution Research, Jerusalem.
Wu, J., R.F. Unz, H. Zhang, and B.E. Logan, 2001. Persistence of perchlorate and the relative numbers of perchlorate-and chlorate-respiring microorganisms in natural waters, soils, and wastewater. Bioremediation, 5, 119–130.
61
Appendix A Conceptual Estimation of Capital and Operation and Maintenance Costs for Different Treatment Alternatives
63
Appendix A Conceptual Estimation of Capital and Operation and Maintenance Costs for Different Treatment Alternatives IX System with Brine Disposal (Conventional IX) Capital Costs:
IX System 2,251,170$ Initial Resin Cost = 138,956$
Building Costs = 239,145$ Brine Line Connection Fee = 40,000$
Sub-total 1 -- Equipment Total = 2,669,272$ Sub-total 2 -- Construction Cost1 = 960,938$