EVALUATION OF CALIFORNIA’S QUALITY OF CARE REPORT CARD FINAL REPORT to the California Office of the Patient Advocate February 2005 Center for Health Services Research in Primary Care University of California, Davis
Transcript
EVALUATION OF
CALIFORNIA’S QUALITY OF CARE REPORT CARD
FINAL REPORTto the California Office of the Patient AdvocateFebruary 2005
Center for Health Services Research in Primary CareUniversity of California, Davis
EVALUATION OF
CALIFORNIA’S QUALITY OF CARE REPORT CARD
Final Report to the California Office of the Patient AdvocateFebruary 2005
UC Davis Project Staff:Julie Rainwater, Ph.D. Principal InvestigatorSheila R. Enders M.S.W. Co-Investigator/Focus Group FacilitatorPatrick S. Romano, M.D. M.P.H. Co-Investigator Madan Dhamar, M.D. Graduate Student ResearcherDaniel Tancredi, M.S. Senior Statistician
Research Affiliate and Consultant:Albert Lowey-Ball, M.S., M.A.
University of California, DavisCenter for Health Services Research in Primary Care2103 Stockton Blvd., Suite 2224Sacramento, CA 95817
This UCD Center for Health Services Research in Primary Care report was funded by the California Office of the Patient Advocate.
The views expressed in this report are those of the authors and do not necessarily represent the Center for Health Services Research or the Office of the Patient Advocate.
Citation: JA Rainwater, A Lowey-Ball, SR Enders, PS Romano, M Dhamar.Evaluation of California’s HMO Report Card.
A Report for the California Office of the Patient Advocate.Davis, CA: UCD Center for Health Services Research in Primary Care, 2005.
About The Center for Health Services Research in Primary Care
University Of California, Davis
The University of California, Davis Center for Health Services Research in Primary Care facilitates policy-relevant research in the areas of health care quality, access, delivery, costs, and outcomes. Since its founding in 1994, the Center has conducted numerous studies addressing important health research and policy issues. The Center is an interdisciplinary unit comprised of UC Davis faculty and researchers with backgrounds in medicine, program evaluation, public policy, quality of care, survey research, and statistics. The Center collaborates with other academic units and provides research and consulting services for health care organizations, governmental agencies and private industry.
For more information regarding the Center for Health Services Research in Primary Care, see www.ucdmc.ucdavis.edu/chsrpc or contact:
Center for Health Services Research in Primary Care
2103 Stockton Blvd., Suite 2224 Sacramento, CA 95817
tel (916) 734-2818 fax (916) 734-8731
Acknowledgements
The Center would like to thank Ed Mendoza and the staff of the Office of the Patient Advocate and the Department of Managed Health Care for providing timely data to the Evaluation Team. Center staff members who provided invaluable assistance for this project include Vania Manipod, Geeta Mahendra, and Chris Harlan. The consumer focus groups were skillfully facilitated and analyzed by Sheila R. Enders, MSW. Graduate student researcher, Madan Dhamar, MD, contributed his expertise with the analysis of the OPA website. Margaret Fix and Ryan Prasad, research assistants to Albert Lowey-Ball, provided informed support on the surveys of health plans and medical groups. We would like to acknowledge the contribution of all the consumers who completed surveys and participated in focus groups, providing valuable feedback on California’s Quality of Care Report Card and comments and suggestions for its improvement. We also thank the numerous key informants in California HMOs and medical groups for their willingness to share their experience with the Quality Report Card.
Evaluation of California’s Quality of Care Report Card v
I. Introduction and Background ..................................................................................................... 5 The Office of the Patient AdvocateThe Quality of Care Report CardGoals and objectives of the Quality Report CardQuality Report Card project activities
II. Evaluation Approach and Methodology .................................................................................... 7 Evaluation framework and questions Evaluation methods
III. Are California Consumers Using the Quality of Care Report Card? ........................................... 9 Use of the Quality of Care Report Card website Who uses the Quality of Care Report Card? How do California consumers find out about the Quality of Care Report Card? Other users of California’s Quality of Care Report Card
IV. How Useful is the Quality of Care Report Card to California Consumers? ............................... 13Feedback from consumer focus groupsMost popular quality categories viewed on the Quality Report Card website Usefulness of the quality categories on the Quality Report Card websiteWhat do users like most about the Quality Report Card website?What would users change about the Quality Report Card website?Usefulness of the print Quality Report Card Findings from other surveys on the usefulness of the Quality Report Card
V. Impact of California’s Quality of Care Report Card on Participating Plans and Medical Groups ................................................................................ 21
Interviews with key informants in HMOs and medical groupsFamiliarity with California’s Quality of Care Report CardUsefulness of the Quality Report Card for quality improvementImpact of the Quality Report Card on market share and reputationOpinions about the Quality Report Card and public reporting of quality information
VI. Recommendations ................................................................................................................. 29
Evaluation of California’s Quality of Care Report Cardvi
Appendix – Description of California’s Quality of Care Report Card 2003/2004 .......................... 33
Appendix – Methods .................................................................................................................. 37Analysis of website logsConsumer survey data analysisConsumer focus group methodsInterviews with key informants in HMOs and medical groups
Appendix – Data Tables ............................................................................................................. 62 TABLE 1. HMO Quality Indicators: Specific Results Pages Viewed on
California’s Quality of Care Report Card 2003/2004 Website
TABLE 2. Medical Group Quality Indicators: Specific Results Pages Viewed
on California’s Quality of Care Report Card 2003/2004 Website
TABLE 3. HMO Informants’ Ratings of the Usefulness of Quality Indicators included in California’s Quality of Care Report Card
TABLE 4. Medical Group Informants’ Ratings of the Usefulness of Quality Indicators included in California’s Quality of Care Report Card
Evaluation of California’s Quality of Care Report Card vii
List of TablesTABLE 1. HMO Quality Indicators: 10 Most Popular Specific Results Pages Viewed
California’s Quality Report Card 2003/2004 Website ................................................... 17TABLE 2. Medical Group Quality Indicators: 10 Most Popular Specific Results Pages
Viewed California’s Quality of Care Report Card 2003/2004 Website .......................... 17TABLE 3. Quality Improvement Activities Related to Public Reporting (past 18 months)
According to Key Informants in HMOs and Medical Groups ................................... 23
List of ChartsCHART 1. Opening Pages Viewed California’s Quality of Care Report Card 2003/2004 Website .....................................................................................9 CHART 2. Consumers’ Reasons for Using California’s Quality of Care Report Card Website and Print Quality Report Card ...................................................10CHART 3. Information Source for California’s Quality of Care Report Card Website and Print Quality Report Card ..............................................................11CHART 4. Non-Consumers Who Use California’s Quality of Care Report Card Website and Print Quality Report Card ...................................................11CHART 5. HMO Quality Category Viewed, Number of Views of Category Opening Page California’s Quality of Care Report Card 2003/2004 Website ........................................................................................................................16 CHART 6. Health Topic Category Viewed on California’s Quality of Care Report Card 2003/2004 Website ...................................................................................16 CHART 7 Medical Group Quality Category Viewed on California’s Quality of Care Report Card 2003/2004 Website .........................................................16 CHART 8. Usefulness of HMO Quality Categories When Selecting a Health Plan: California’s Quality of Care Report Card 2003/2004 Website and Print Report Card ..................................................................................................18CHART 9. Usefulness of Medical Group Quality Categories When Selecting a Medical Group: California’s Quality of Care Report Card 2003/2004 Website and Print Report Card ..................................................................19CHART 10. Overall Usefulness of California’s Quality of Care Report Card Website and Print Report Card When Selecting a Health Plan ....................................20CHART 11. Familiarity with California’s Quality of Care Report Card Website and Print Report Card among HMO and Medical Group Informants ........................22 CHART 12. Dissemination of California’s Quality of Care Report Card within Participating HMOs and Medical Groups ...................................................................22 CHART 13. Other Uses for California’s Quality of Care Report Card within Participating HMOs and Medical Groups ...................................................................24CHART 14. Perceived Impact of California’s Quality of Care Report Card on Reputation and Market Share of Participating HMOs and Medical Groups ........................................................................................................................25CHART 15. Opinions About California’s Quality of Care Report Card among HMO and Medical Group Informants ............................................................26CHART 16. Suggested Improvements for California’s Quality of Care Report Card among HMO and Medical Group Informants ....................................................26
1Executive Summary
EXECUTIVE SUMMARY
Project SummaryThe Center for Health Services Research in Primary Care, University of California, Davis, conducted an evaluation on behalf of the State of California’s Office of the Patient Advocate (OPA) of California’s Quality of Care Report Card. The Quality Report Card is published annually to provide consumers with comparative information on the performance of California’s largest HMOs and medical groups. The print report, in booklet form, provides five summary ratings on HMO quality, four ratings on medical group quality, and a listing of HMO services in other languages. The website (www.opa.ca.gov/report_card) provides this information plus detailed results for more than 50 specific quality measures. In 2003/2004 the Quality Report Card included results for 10 HMOs and 118 medical groups. Both the web and print versions are available in English, Spanish, and Chinese.
Evaluation Approach and MethodsThis report evaluates three research questions:
• Do consumers use California’s Quality of Care Report Card?• How useful to consumers are the quality measures included in the Quality Report Card?• What is the impact of the Quality Report Card on quality improvement and other activities in the participating
HMOs and medical groups?
Both qualitative and quantitative methods are used. Data are presented from six consumer focus groups, mail and Internet surveys of 2,341 Quality Report Card users, interviews with program staff, and in depth telephone interviews with 56 key informants within the health plans and medical groups included in the Quality Report Card. The results of the evaluation reported here pertain to the 2003/2004 Quality Report Card and some of the improvements suggested by the evaluation have recently been incorporated by OPA into the 2004/2005 Quality Report Card.
EVALUATION OF CALIFORNIA’S QUALITY OF CARE REPORT CARD
Evaluation of California’s Quality of Care Report Card2
Highlights of findings
Consumer Use of the Quality of Care Report Card
• California consumers access California’s Quality of Care Report Card to compare the performance of HMOs and medical groups. The Quality of Care Report Card website has over 28,000 visitors each year. The dissemination of the Quality Report Card booklet has increased each year, with more than 100,000 booklets distributed by request or through Walgreen’s pharmacies and public libraries in 2003/2004.
• Most users (90%) identify themselves as belonging to OPA’s intended audience for the Quality Report Card - consumers who are comparing HMOs, seeking information about HMOs, or are considering joining an HMO.
• Consumers learn about the existence of the Quality Report Card from newspaper or print media and, increasingly, Internet searches. Some recall hearing about the Quality Report Card through radio or television, but few recall seeing the booklets in Walgreen’s pharmacies.
• Other users of the Quality Report Card website and booklets include health insurance brokers and representatives of health plans and provider groups.
Usefulness of the Quality Report Card• Most Quality of Care Report Card website users
review the statewide summary results page (i.e., “star chart”) to see the overall quality scores for health plans. Less than half of these users remain on the website to look at similar information about one or more medical groups.
• Users of the Quality Report Card are most
interested in comparing HMO performance in the area of Plan Service (e.g., how quickly the plan handles complaints, customer service, paying claims, getting patients needed care, and overall rating for service).
• When comparing medical groups, the most useful information pertains to Specialty Care (e.g., how easy it is to see a specialist within the medical group). Consumers also care about getting appointments in a timely manner and receiving timely care or tests from their doctor.
• Comparative information on prevention indicators (e.g., immunizations, cancer
screenings) are of less interest to consumers. In some cases, this is because the plans and providers all achieve a similar acceptable level of performance. In other cases, the indicator is only relevant to specific types of people, such as parents.
• Some specific measures included on the Quality Report Card website such as Mental Health Care, are accessed frequently and are particularly useful to consumers, possibly because the data are not easily accessed elsewhere.
• Presenting the comparative performance information by health topic or disease (e.g., diabetes, women’s health, heart care, mental health) is preferred over the existing category labels used in the Quality Report Card.
• Except among senior citizens, focus group participants find the print Quality Report Card to be too general and have a clear preference for the detailed information on the website. However, consumers suggest wider distribution of the print report card to call public attention to the availability of comparative quality information, especially for individuals who do not have Internet access.
• Medical group performance could receive greater consumer attention in the future because the number of medical groups participating in the Quality Report Card increases each year and consumers report having a wider choice of medical groups than HMO plans.
• The amount of information on the website is more than sufficient for the average user. Consumers report they have a limited choice of plans so tailoring the website information to one’s own choice-set would be an improvement. Additionally, consumers report they would welcome tailoring the information to include just the measures relevant to one’s own health care concerns and demographic characteristics.
• Consumers acknowledge the value of a report card that contains both types of measures contained in the current report card – administrative or medical record data and patient satisfaction surveys.
• A useful enhancement to the Quality Report Card would be additional information on the number of consumer complaints and grievances against the HMO plans. Measures comparing plan performance for “lifestyle” topics, such as obesity, nutrition, physical activity, and smoking are of interest to consumers. Focus group participants
3Executive Summary
felt that health topics relevant to men, such as prostate cancer screening, should be available on the website.
• The website’s usefulness would be improved for consumers if other information that is seen as critical to selecting a plan or provider, such as cost and covered benefits data, were presented side-by-side. However, consumers acknowledge these data might be complicated and difficult to present and interpret.
• Consumers have a generally positive attitude toward the publication of comparative quality data for health plans and medical groups. Although most focus group members were not familiar with OPA, they note a preference for information that is collected and distributed by an “objective” party or public agency, rather than the plans themselves.
Impact on Quality Improvement in HMOs and Medical Groups
• The participating HMOs and medical groups are highly familiar with the Quality Report Card. Information from the Quality Report Card is discussed or shared widely with medical and quality improvement staff as well as boards of directors within their organizations.
• The Quality Report Card is used primarily for benchmarking performance with similar providers. Its impact on market share and reputation is seen as relatively modest. A few health plans use the Quality Report Card in marketing proposals and some medical groups use the Quality Report Card in their rate negotiations.
• Medical groups (47%) are more likely than health plans (13%) to undertake quality improvement activities in response to their Quality Report Card performance, including instituting new processes of care, hiring of quality-oriented staff, and improved data reporting.
• HMO and medical group executives are somewhat critical of public reporting in general, stating that summary scores do not accurately reflect their organization’s true quality of care. A majority of executives expect that their organization’s performance will improve in the future.
• Most endorse including additional specific measures in the summary “stars” as an improvement to the Quality Report Card. About
half of the executives mentioned that a separate Medi-Cal reporting capability would be useful.
• Although they make limited use of the Quality Report Card for quality improvement, HMOs and medical groups devote time and attention to public reporting. The majority of health plans and medical groups support the continued production of the Quality Report Card by OPA or a similar state agency or by a public-private partnership.
Recommendations Consumer Use of the Quality of Care Report CardBuild on the generally positive attitude toward public reporting. Consumers endorse the concept of publicly available quality comparisons as a positive step toward making managed care accountable to patients, even if it has limited direct influence on their choices. Publication of the data should be continued by OPA or a similar entity that does not appear to have a stake in the results.
Explore new approaches for publicizing the website. Ideas suggested by consumers for searching the Internet and finding the website could be incorporated, including providing links on popular health-related websites. Advertising about the OPA website in print media, television and radio, especially at times when consumers are most likely to use the information, such as employer open enrollment months, should continue or increase. Health plans and doctor’s offices should be enlisted to provide the website address on in-office posters or patient materials. Consumers report their contacts with health-advocacy groups often led them to the website. OPA should engage in outreach to these groups in order to make the Quality Report Card more visible. Consumers who have a problem with their HMO also have exposure to the website. The Quality Report Card should be easily accessed from the DMHC complaint website.
Consider additional venues for disseminating the booklet. Many consumers interested in quality information but who lack Internet access or prefer summary measures (such as senior citizens) find the booklet helpful. OPA could expand the number of outlets for distribution of the print Quality Report Card. Venues suggested by these consumers included placement of the booklets in doctor’s offices, mailings by health plans and employers, distribution to additional pharmacies, and placement at
health fairs or community centers.
Evaluation of California’s Quality of Care Report Card4
Usefulness of the Quality of Care Report CardPresent the results by health topic. Only one of the current category titles (Plan Service) is intuitively appealing to consumers. Consumers prefer to go directly to the results for health topics or diseases that are relevant to them, such as women’s health, diabetes, heart care, or mental health. Except for the Plan Service category, the current categories for organizing the results could be replaced with health topic categories in the booklet and made less prominent on the website opening pages.
Highlight measures that resonate most with consumers. When comparing health plans, consumers consistently named a set of measures that should be more prominently displayed or easily accessed. Consumers want to move quickly to the results for the Plan Service measures (e.g., quick complaint resolution, prompt care, and good customer service), Mental Health measures, since they are not easily accessed elsewhere, and access to and delivery of Specialty Care. The website should simplify or reduce steps necessary to “drill down” to these results.
Consider adding measures in areas of increasing interest to consumers. Consumers expressed interest in measures of plan and medical group performance in “lifestyle” topics, such as obesity, nutrition, and smoking cessation. Additional measures on topics relevant to men, such as prostate cancer screening, should be explored. A separate direct link to information about complaints and grievances would be useful.
Explore improvements to the website that would permit users to tailor the information to their own demographics and health care needs. Some of the elements on the website are ignored by many users. OPA could improve the Quality Report Card by implementing existing technology for tailoring website paths based on user- supplied data, such as geographic location, age, gender, disease states or chronic conditions.
Make it easier for consumers to move quickly to medical group comparisons. The Quality Report Card includes additional medical groups each year. Consumers report they have a wider choice of medical groups than health plans. Making the link to information on medical groups more prominent on the website opening page could improve its utility for consumers. A mapping of the medical group to HMO membership should be easily retrievable for users.
Retain measures based on both types of data – medical records and administrative data as well as patient survey. Consumers value administrative data and also recognize
the patient experience and satisfaction survey results as an important source of information about people “like them”.
Explore improvements to the website that would permit users to view quality results at the same time as cost and benefit data. Improved linkages between the OPA website and the health benefits websites of large employers and purchasing groups might move some consumers closer to their preference of viewing quality data “side-by-side” with cost and coverage information.
Continue annual efforts to evaluate the usefulness of the Quality Report Card for informing consumer choice. OPA should continue to survey both website and booklet users for feedback and suggestions for improvement. Consumer focus groups should be conducted throughout the state annually to facilitate modifications and refinements based on feedback from actual and potential users of the information.
Impact on Quality Improvement in HMOs and Medical GroupsProvide health plans and medical groups with additional guidance on how to use the Quality Report Card for quality improvement. The impact that the Quality Report Card has on plans and medical groups provides an indirect but important benefit to consumers because plans may focus on quality improvements that could impact their results. Currently, plans and medical groups report little in the way of specific quality improvement activities pertaining to the Quality Report Card. OPA should consider convening a workshop or some other from of outreach to quality improvement staff that explains how the specific measures are defined and calculated and how specific practices translate into performance results. Medical groups appear more inclined to institute quality improvement activities in response to their Quality Report Card results, so specific recruitment of their participation is warranted.
Continue to cultivate the endorsement of plans and providers in the public reporting “movement’ by addressing some of their concerns about comprehensiveness and validity. Most key informants suggested that additional measures be included in the summary results and that additional reports be undertaken for Medi-Cal patients. OPA should consider convening work groups which include plans and providers to explore the feasibility of these ideas.
Take steps to ensure the Quality Report Card is responsive to the changing managed care environment in California. Meetings to stay abreast of new organizational arrangements and continued coordination with provider groups and plans and incentive arrangements such as “pay for performance” are critical.
Introduction and Background 5
I. INTRODUCTION AND BACKGROUND
The Office of the Patient AdvocateThe primary mission of the Office of the Patient Advocate (OPA) is to inform and educate consumers about their rights and responsibilities as HMO enrollees. OPA’s specific statutory mandates include:
• Annually publishing an Internet-based HMO Quality Report Card;
• Developing consumer education materials and programs;
• Collaborating with other patient advocacy organizations;
• Assisting HMO enrollees who are experiencing problems with their HMO;
• Advising the Department of Managed Health Care.
The Quality of Care Report CardOn September 30, 2003, OPA launched the third annual Quality of Care Report Card. The Quality Report Card includes quality and patient satisfaction data for HMOs and medical groups. The HMO’s presented in the Quality Report Card are California’s 10 largest and serve 95% of the state’s residents enrolled in managed care plans. It also provides information on the availability of and access to HMO services in languages other than English. Printed summaries (100,000 booklets) in English, Spanish,
or Chinese are distributed via 625 libraries and 350 Walgreen’s pharmacies throughout the state. Television commercials and coverage on news programs distributed the telephone and website contact information to obtain the print Quality Report Card. The full version of the Quality Report Card is available on the Internet at www.opa.ca.gov/report_card.
The 4th Quality of Care Report Card was released in September 2004. The Year 4 Quality Report Card updates data for the health plans, expands the number of included medical groups from 118 to almost 200, provides a comparative assessment of linguistic services provided by health plans, provides more consumer-friendly complaint data from the HMO Help Center, and expands information on the services available at each health plan.
Goals and objectives of the Quality Report CardCalifornia’s Quality of Care Report Card has three objectives:
• To provide consumers, purchasers, advocates, and regulators with comparative information on the performance of California HMOs and medical groups using clinical (HEDIS) and patient satisfaction (CAHPS and CAS) data reported by
health plans1.
Evaluation of California’s Quality of Care Report Card6
• To assist HMOs in their own quality improvement efforts by providing them data on their performance in relationship to other HMOs in the state.
• To educate consumers about how to compare and obtain quality health care from their HMOs.
OPA and its contractors have taken steps to make the web and print versions of the Quality Report Card both useful and usable for consumers. Focus groups were conducted to obtain direct user feedback during both the design and post-launch phases of the project each year. Research and experts in the field of consumer reporting were consulted in order to ensure that the Quality Report Card incorporates “state-of-the-art” techniques in reporting on quality of care for consumers.2
According to OPA, there are a number of challenges in developing a consumer report card. Many consumers are not aware that there are differences in health care quality. They may have a limited choice of health plans (e.g., their employer may offer only one) and may therefore not be motivated to compare plans. At times, such as
during open enrollment periods, consumers are inundated with health plan information and may be less likely to seek quality comparisons when they most need them. In general, consumers are more motivated to consider cost and choice of provider when choosing a health plan.
Quality Report Card project activitiesEach year OPA has reached a number of California consumers through web and print versions of the Quality Report Card.
In addition to the website and booklet dissemination, OPA’s Mobile Information Center (MIC) plays a role in distributing the Quality Report Card to consumers. The MIC travels throughout the State providing consumers with face-to-face education and assistance about their rights as HMO enrollees. In 2003, OPA and its eight local, community based partners conducted over 350 MICs making direct, face-to-face contact with over 24,000 HMO consumers.
Website Website Print Booklets Report Card Time Period Visitors Visits Distributed
Year 1 9/26/01-9/30/02 30,372 59,168 54,503
Year 2 10/1/02-9/29/03 31,528 64,895 91,189
Year 3 9/30/03-10/28/04 23,802 50,138 103,757
7Evaluation Approach and Methodology
II. EVALUATION APPROACH AND METHODOLOGY
Evaluation framework and questionsThe evaluation assesses the following3:
Objective 1: Are California health care consumers using California’s Quality of Care Report Card? The evaluation examines whether Californians use the Quality Report Card to compare among HMOs and medical groups and how they become aware of it.
Objective 2: How useful to consumers are the quality indicators that are currently included in the Quality Report Card? The evaluation describes the extent to which the quality categories and specific indicators are relevant to consumers. Issues explored include consumer interest in the indicators, the relative importance of each indicator for selecting a health plan, and consumers’ suggestions for improving the Quality Report Card.
Objective 3: Does the Quality Report Card have an impact on the participating HMOs and medical groups? The evaluation examines whether HMOs and medical groups have made changes in their quality improvement activities as a direct or indirect consequence of the release of the public report card. This and other organizational responses to the publication of the Quality Report Card are described.
Evaluation methodsA complete description of the evaluation methods and data can be found in the Appendix. Sources of data for the evaluation include:
• Original survey data for the evaluation was collected from two sources:
1) On-line survey of website users during the first six months after the launch of the Quality Report Card in September 2003.
2) Mail survey of consumers who had requested the year 2 (2002) or year 3 (2003) print Quality Report Cards.
• Consumer focus groups discussed the usefulness of the Quality Report Card for decision-making, which specific indicators were most and least useful, and how the Quality Report Card could be improved. All groups were comprised of Californians who had requested the Quality Report Card in year 2 or 3 or who had volunteered to be contacted by the evaluators when using the website.
Evaluation of California’s Quality of Care Report Card8
• Telephone interviews were conducted with key informants in California HMOs and medical groups to elicit opinions on the impact of the Quality Report Card on managed care organizations and the usefulness of the indicators for quality improvement.
• Findings from two recent surveys that examined the use of the Quality Report Card in 2002 are summarized.
• Information supplied by the director of OPA and program staff provided background on program activities and print Quality Report Card dissemination activities. OPA staff provided logs of requests for the print Quality Report Card for all three publication years.
9Are California Consumers Using the Quality of Care Report Card?
III. ARE CALIFORNIA CONSUMERS USING THE QUALITY OF CARE REPORT CARD?
Use of the Quality of Care Report Card website Review of the Quality Report Card website usage logs for 2003/2004 indicates that there were 1,413,780 hits between September 30, 2003 and March 17, 2004, representing 41,440 hits to the site’s homepage, www.opa.ca.gov/report_card.4 The majority of website activity (approximately 55% of total visits) occurred on the release date and the month following. In the first 5.5 months following the release of the Quality Report Card, there were 33,388 visits to the site overall, representing an average of 197 visits per day. The number of unique visitors to the site for the six month period was 16,539.
As shown in Chart 1, about 44% of the website pages viewed display the statewide summary results (i.e.,“star chart”) for the HMOs. The summary level results (“star chart”) for medical groups (all counties combined) comprise about (21%) of the pages viewed. About 9% of views are of the page where a PDF copy of the Quality Report Card could be printed. A small percentage of pages viewed include the “About the Quality of Care Report Card”
information (3.5%) and the “Message from the Governor” (3.3%). According to the on-line survey of website users, the most frequently viewed sections of the website are the HMO star charts (74.5%), medical group star charts (46.7%), “About this Quality Report Card” (19.2%), HMO contact information (11.2%), and HMO services in other languages (4.2%).
Who uses the Quality of Care Report Card?Among the 1,798 website users who answered the on-
Chart 1: Opening Pages ViewedCalifornia’s Quality of Care Report Card 2003/2004 WebsiteSeptember 2003-March 2004
Evaluation of California’s Quality of Care Report Card10
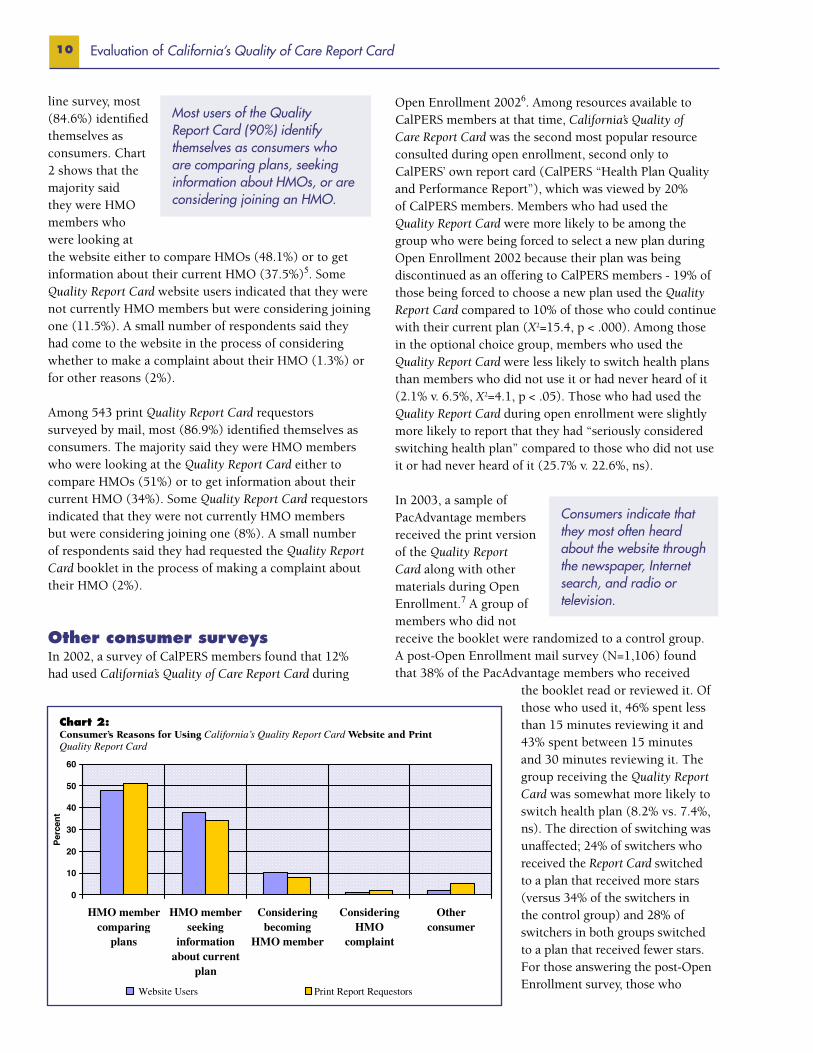
line survey, most (84.6%) identified themselves as consumers. Chart 2 shows that the majority said they were HMO members who were looking at the website either to compare HMOs (48.1%) or to get information about their current HMO (37.5%)5. Some Quality Report Card website users indicated that they were not currently HMO members but were considering joining one (11.5%). A small number of respondents said they had come to the website in the process of considering whether to make a complaint about their HMO (1.3%) or for other reasons (2%).
Among 543 print Quality Report Card requestors surveyed by mail, most (86.9%) identified themselves as consumers. The majority said they were HMO members who were looking at the Quality Report Card either to compare HMOs (51%) or to get information about their current HMO (34%). Some Quality Report Card requestors indicated that they were not currently HMO members but were considering joining one (8%). A small number of respondents said they had requested the Quality Report Card booklet in the process of making a complaint about their HMO (2%).
Other consumer surveysIn 2002, a survey of CalPERS members found that 12% had used California’s Quality of Care Report Card during
Most users of the Quality Report Card (90%) identify themselves as consumers who are comparing plans, seeking information about HMOs, or are considering joining an HMO.
Open Enrollment 20026. Among resources available to CalPERS members at that time, California’s Quality of Care Report Card was the second most popular resource consulted during open enrollment, second only to CalPERS’ own report card (CalPERS “Health Plan Quality and Performance Report”), which was viewed by 20% of CalPERS members. Members who had used the Quality Report Card were more likely to be among the group who were being forced to select a new plan during Open Enrollment 2002 because their plan was being discontinued as an offering to CalPERS members - 19% of those being forced to choose a new plan used the Quality Report Card compared to 10% of those who could continue with their current plan (X2=15.4, p < .000). Among those in the optional choice group, members who used the Quality Report Card were less likely to switch health plans than members who did not use it or had never heard of it (2.1% v. 6.5%, X2=4.1, p < .05). Those who had used the Quality Report Card during open enrollment were slightly more likely to report that they had “seriously considered switching health plan” compared to those who did not use it or had never heard of it (25.7% v. 22.6%, ns). In 2003, a sample of PacAdvantage members received the print version of the Quality Report Card along with other materials during Open Enrollment.7 A group of members who did not receive the booklet were randomized to a control group. A post-Open Enrollment mail survey (N=1,106) found that 38% of the PacAdvantage members who received
the booklet read or reviewed it. Of those who used it, 46% spent less than 15 minutes reviewing it and 43% spent between 15 minutes and 30 minutes reviewing it. The group receiving the Quality Report Card was somewhat more likely to switch health plan (8.2% vs. 7.4%, ns). The direction of switching was unaffected; 24% of switchers who received the Report Card switched to a plan that received more stars (versus 34% of the switchers in the control group) and 28% of switchers in both groups switched to a plan that received fewer stars. For those answering the post-Open Enrollment survey, those who
Consumers indicate that they most often heard about the website through the newspaper, Internet search, and radio or television.
Chart 2: Consumer’s Reasons for Using California’s Quality Report Card Website and Print Quality Report Card
11Are California Consumers Using the Quality of Care Report Card?
received the Quality Report Card during open enrollment were more likely to say they had “seriously considered” switching their health plan (37% vs. 31%, X2=4.03, p < .03).
How do California consumers find out about the Quality of Care Report Card?For website users, the most frequently cited methods of finding out about the Quality Report Card site was an Internet search (30.1%), newspaper or other print media (30.9%) and radio or TV (17.1%). Some also said they heard about the site from their employer or health plan (6.9%). An additional 5.4% said they heard about it through an electronic message or group list serve. Friends or relatives were also cited as a method of hearing about the Quality Report Card website by 4% of respondents and health or consumer advocates were the source for about 3%.
The newspaper (17.5%) and radio or TV (8.1%) were cited as ways of hearing about the print Quality Report Card, however some respondents said they heard about it through an Internet search (19.2%). Print report requestors also said they had heard about the Quality Report Card from their employer or health plan (14.8%) or from a health or consumer advocacy group (16.8%).8
Other users of California’s Quality of Care Report CardA small percentage of website users and Quality Report Card requestors identify themselves as non-consumers. The identifiers for non-consumer Quality Report Card website users (n=275) include insurance brokers (12.8%), health care providers or provider group administrators (16%), employees or representatives of HMOs or health plans (15.2%), health advocates (4.1%), employers (2.9%), students or researchers (6.2%), and members of the media (1.2%) (Chart 4). The identifiers for non-consumer print Quality Report Card requestors (N=71) include insurance brokers (17%), health care providers or provider group administrators
(14%), employees or representatives of HMOs or health plans (11%), health advocates (10%), employers (6%) and students or researchers (6%).
The Quality Report Card is accessed by individuals who work for plans and providers as well as insurance brokers, health advocates, and researchers.
For website users, the most frequently cited methods of finding out about the QualityReport Card site was an Internet search (30.1%), newspaper or other print media (30.9%)and radio or TV (17.1%). Some also said they heard about the site from their employeror health plan (6.9%). An additional 5.4% said theyheard about it through an electronic message orgroup list serve. Friends or relatives were also citedas a method of hearing about the Quality ReportCard website by 4% of respondents and health orconsumer advocates were the source for about 3%.
The newspaper (17.5%) and radio or TV (8.1%)were cited as ways of hearing about the printQuality Report Card, however some respondents said they heard about it through anInternet search (19.2%). Print report requestors also said they had heard about the QualityReport Card from their employer or health plan (14.8%) or from a health or consumeradvocacy group (16.8%).8
0
5
10
15
20
25
30
35
Inreten
aeSt
rhc
N
pswe
apeo/rt
nirpreh
t
dem
ia
aRd
VTrooi
pmE
lyo
H/reMO lia
M-E/evreStsiL rFeindo
eRr
italve
Hlaeth/ Cons
vdAremu
aco
et
D
ewrorettelswenCH
M
bsite
W
amrahP
s'neergla
cy
D
ehto/llacert'no
r
tnecre
P
Website Users Print Report Requestors
Consumers indicate thatthey most often heardabout the website throughthe newspaper, Internetsearch, and radio ortelevision.
A small percentage of website users and Quality Report Card requestors identifythemselves as non-consumers. The identifiers for non-consumer Quality Report Cardwebsite users (n=275) include insurance brokers (12.8%), health care providers orprovider group administrators (16%), employees or representatives of HMOs or healthplans (15.2%), health advocates(4.1%), employers (2.9%), students or researchers(6.2%), and members of the media(1.2%) (Chart 4)9. The identifiers for non-consumer print Quality Report Card requestors(N=71) include insurance brokers (17%), healthcare providers or provider group administrators(14%), employees or representatives of HMOs orhealth plans (11%), health advocates (10%),employers (6%) and students or researchers (6%).
The Quality Report Card isaccessed by individuals who workfor plans and providers as well asinsurance brokers, healthadvocates, and researchers.
0
5
10
15
20
25
30
35
40
45
rBkoer
Prodive
rp/r
ivode
ardmiinsttaor
erOMH
p
eeyolpme/evitatneser
edutS
n
ehcraeseR/t
rcovdA
aet yolp
mE
er aideM
U
eificepsn
d
tnecre
P
Website Users Print Report Requestors
Chart 3: Information Source for California’s Quality of Care Report Card Website and Print Quality Report Card
Chart 4: Non-Consumers Who Use California’s Quality of Care ReportCard Website and Print Quality Report Card
How Useful is the Quality of Care Report Card to California Consumers? 13
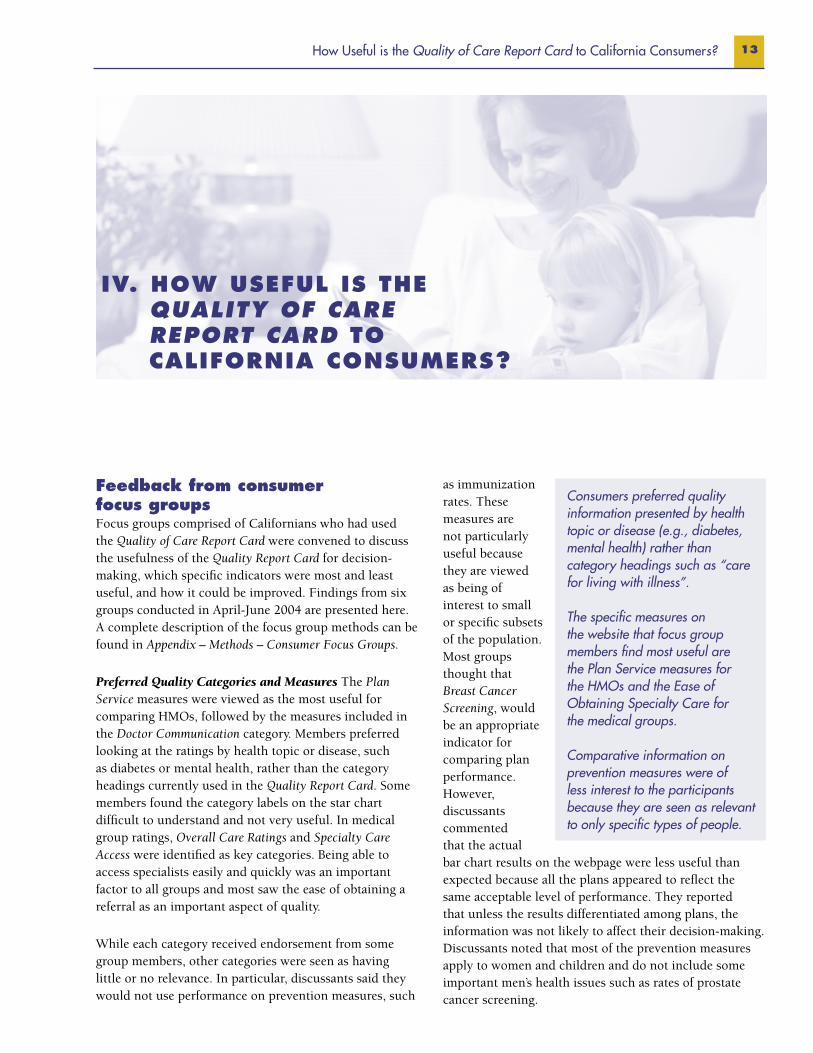
IV. HOW USEFUL IS THE QUALITY OF CARE REPORT CARD TO CALIFORNIA CONSUMERS?
Feedback from consumer focus groupsFocus groups comprised of Californians who had used the Quality of Care Report Card were convened to discuss the usefulness of the Quality Report Card for decision-making, which specific indicators were most and least useful, and how it could be improved. Findings from six groups conducted in April-June 2004 are presented here. A complete description of the focus group methods can be found in Appendix – Methods – Consumer Focus Groups.
Preferred Quality Categories and Measures The Plan Service measures were viewed as the most useful for comparing HMOs, followed by the measures included in the Doctor Communication category. Members preferred looking at the ratings by health topic or disease, such as diabetes or mental health, rather than the category headings currently used in the Quality Report Card. Some members found the category labels on the star chart difficult to understand and not very useful. In medical group ratings, Overall Care Ratings and Specialty Care Access were identified as key categories. Being able to access specialists easily and quickly was an important factor to all groups and most saw the ease of obtaining a referral as an important aspect of quality.
While each category received endorsement from some group members, other categories were seen as having little or no relevance. In particular, discussants said they would not use performance on prevention measures, such
as immunization rates. These measures are not particularly useful because they are viewed as being of interest to small or specific subsets of the population. Most groups thought that Breast Cancer Screening, would be an appropriate indicator for comparing plan performance. However, discussants commented that the actual bar chart results on the webpage were less useful than expected because all the plans appeared to reflect the same acceptable level of performance. They reported that unless the results differentiated among plans, the information was not likely to affect their decision-making. Discussants noted that most of the prevention measures apply to women and children and do not include some important men’s health issues such as rates of prostate cancer screening.
Consumers preferred quality information presented by health topic or disease (e.g., diabetes, mental health) rather than category headings such as “care for living with illness”.
The specific measures on the website that focus group members find most useful are the Plan Service measures for the HMOs and the Ease of Obtaining Specialty Care for the medical groups.
Comparative information on prevention measures were of less interest to the participants because they are seen as relevant to only specific types of people.
Evaluation of California’s Quality of Care Report Card14
Preference for Print and Web Versions Except among discussants over 65, consumers felt the information in the booklet was too general and not particularly useful. Consumers were not clear about the difference between one, two, or three stars, and the “star chart” ratings showed similar results for all the HMOs, reducing the usefulness of the information in the booklet. Discussants, with the exception of some of the older individuals who said they did not have access to the Internet, stated a clear preference for the detailed information presented on the Quality Report Card website. The website provides more detailed and personally relevant information necessary to make more informed decisions. Consumers endorsed wide distribution of the print version of the Quality Report Card, since the Internet is not available to everyone.
Customized Information A recurring theme among focus group members was that information tailored to one’s own health problems and characteristics, or those of a family member, was more useful. Consumers were interested in accessing the specific measures matching their demographics, such as age and gender, or health needs, such as diabetes or heart care. The groups discussed whether technology is available to allow website users to customize the information on the website. If so, the utility of the Quality Report Card would improve. Consumers thought “on-demand” printing of a personalized booklet would be useful. Individuals without children or with grown children wanted to bypass certain information such as children’s immunizations or asthma. One group member suggested that the printed booklet could provide more detailed information if there was a separate booklet for each region of the state.
Value of Administrative vs. Survey Data Focus group participants indicated equal preference for measures based on both administrative and patient survey data sources. However, discussants wondered if administrative data took into account the fact that doctors “sometimes do the right thing” but patients are not always compliant.
Data from medical records was considered especially worthwhile because it “forces plans to be audited and compliant with some standards”. There were concerns about the source and quality of the data and questions about methods, such as how the data was collected, the sample size, and survey return rates. Members of one group thought there should be basic methodological information on the results charts themselves – that it should not require leaving the chart to find out the type of data, sample size, and return rate.
Other Information Desired Consumers in all of the focus groups said they wanted information about costs of coverage. They stated that not knowing the cost of the different plans made it hard to use the quality information in the actual decision-making process. Most agreed that cost, as well as benefits covered, would have to be weighed in selecting a plan. Whether the plan actually pays for the level of care in the prevention measures (e.g., screening for breast cancer every two years) was viewed as important. For some members, the cost of the plan or provider would be given more weight than the quality ratings. They would not necessarily pay more for a plan or provider that rated highly in the Quality Report Card. In addition to the information in the Quality Report Card, to make a truly informed choice, one would need provider directories, premium/contribution rates, and benefit schedules for each plan being considered. However, consumers who have several HMOs available to them may find this task complicated and time-consuming.
Focus group members noted that some quality indicators of great interest to them were not included in the Quality Report Card. They suggested that it would be useful to see information on how plans and medical groups give attention to “lifestyle” issues, such as nutrition, smoking, and obesity and how the doctors and plans are doing in the area of patient education on these issues. Additionally, there was interest in how the plans followed up with patients. The information on post-diagnosis treatment for cancer and other illnesses would be useful in making choices about plans and physicians.
Other concerns or questions noted in most groups included how consumers could find out about complaints and grievances against a plan or provider, how well plans do at mail order of prescriptions and how the plans and doctors have done over time – whether they are improving or declining in performance. It was also noted that the website or booklet should contain information on how to switch plans or medical groups if one feels they are “in the wrong plan” or “in a bad group”.
The ability to easily tailor the extensive information to one’s own characteristics or health concerns or those of a family member would improve the usefulness of the website.
Consumers acknowledge the value of a report card that contains both types of measures contained in the current report card - administrative or medical record data and patient satisfaction surveys.
How Useful is the Quality of Care Report Card to California Consumers? 15
Other Findings and Comments by Focus Group Members A number of the participants reported having little if any choice of plans or providers. The Quality Report Card contains far more providers and plans than most people need for comparison. Some consumers commented that it is a good idea to produce this information, however, their decisions about plans and providers often come from talking with family, friends, and co-workers. Others said the information would supplement other ways of making the decision.
There was some confusion in all groups about the difference between a plan and a medical group. Some of the confusion appeared related to Kaiser being both a medical group and a plan. Several noted that in the 2003/2004 Quality Report Card, the Kaiser health plan looked like a “good performer” but, in some regions, the Kaiser medical group did not appear to perform as well.
Focus group members generally favored the concept of public reporting of health plan information. They liked the idea that the Quality Report Card is produced by a government entity and that the participation of health plans is voluntary. Some groups wanted to know how the state pays for the production of the Quality Report Card, and whether it includes taxpayer funds. Advertising the Quality Report Card through newspaper and television (public service announcements) was endorsed. The groups also felt that the plans themselves should distribute the information in some way. Other venues could include doctor’s offices, pharmacies, government offices, and schools. Other members wanted health plans and medical providers to make it available to employers during open enrollment.
Most popular quality categories viewed on the Quality Report Card website In the six months after the launch of the 2003/2004 Quality of Care Report Card there were 33,388 visits to the website (www.opa.ca.gov/report_card) by 16,539 unique visitors. Approximately 44% of website users proceed to view the HMO Quality statewide summary “star” chart and 21% view the medical group summary “star” chart for a specific county.
The most frequently viewed category for HMO quality is the Plan Service category (Chart 5). Care for Living with Illness is the least popular category. The health topic that receives the most attention is Women’s Health Care, followed by Mental Health Care, Diabetes, and Heart Care (Chart 6).
Sample Focus Group Member Comments:
“I like that it is an independent reliable government agency. It is easy to find out costs, not so easy to find out about quality”.
“I disagree with rating on the 1-3 stars system. This doesn’t give a true picture of the differences or lack thereof.”
“Change the presentation to get greater differentiation between plans. For a number of categories all plans seem the same, but they are likely different.”
“I want to compare HMOs by how well they treat serious/severe illness with possibly expensive treatments, such as cancer, HIV, etc. and this is nowhere in the site. I am not worried about preventive treatment or easily medicated illness such as high blood pressure or cholesterol, but I am scared of going to an HMO because of the rumor that illnesses with expensive treatments get short shrift…”
“I would use this information as a starting point, but then I would still call the plan or its’ customer service to get the other information I need on co-payments, benefits, drug formulary, etc.”
“I followed my doctor to a new group and everything was pretty much the same. My experience with the doctor is more important.”
“My medical group is not listed. Even if it is too small to qualify, I would like to see it listed and say ‘N/A’ due to not enough information.”
“How do I know what medical groups go with what HMOs?”
“I would have to know the cost of the plan before I would be able to really use this.”
“I switched plans but not medical group and I didn’t notice any difference in my care.”
“In the booklet, what were the research methods? How were data collected? What questions were asked and what was the sample size? Need a little more detailed information regarding where the ratings came from”.
“I think my care has improved since they started all these surveys…”
“A step in the right direction…”
Evaluation of California’s Quality of Care Report Card16
when comparing medical group performance was Getting Treatment and Specialty Care(Chart 7). The most popular specific measure was Easy To See A Specialist followed by“after hours help” in the Timely Care and Service category (Table 2).11 Compared to theHMO level indicators, the medical group level detail measures were not viewed asfrequently, perhaps indicating that users leave the website before viewing medical groupresults. Only these two medical group specific measures are among the top third of pagesviewed. In general, the analysis of the website use supports the feedback from focusgroups where consumers frequently wanted to know about the accessibility of specialtycare when considering a medical group.
1,115
826
518
428
0
200
400
600
800
1,000
1,200
Overall Health CareScore
Getting Treatmentand Specialty Care
Timely Care andService
Communicating withPatients
# ofViews
The five Plan Service measures for the HMOs (overall plan rating for service, complaints handled quickly, getting needed care, customer service, paying claims) are among the top ten most popular specific performance indicators viewed by website users (Table 1).9 Two of the three mental health performance indicators (treatment visits for depression, anti-depressant medication ongoing treatment) are also among the top 10 most popular specific performance indicators viewed by website users. It is notable that the mental health performance indicators were rarely mentioned as being of particular interest during focus group discussions. This could indicate that the Quality Report Card website serves as a special resource where consumers can privately view comparative information on plan performance in mental health care.
The breast cancer screening and cervical cancer screening measures along with visits during pregnancy receive attention from both focus group members and website users. Some other HMO prevention/screening measures are not frequently viewed. Immunization rates, visits after delivery, and Chlamydia screening all appear in the lower half of the frequency distribution. Measures that apply to individuals with asthma are also infrequently looked at and considered of mild interest or importance in focus group discussions.
The most popular category viewed when comparing medical group performance was Getting Treatment and Specialty Care (Chart 7). The most popular specific measure was Easy To See A Specialist followed by After Hours Help in the Timely Care and Service category (Table 2).10 In general, the analysis of the website use supports the feedback from focus groups where consumers frequently wanted to know about the accessibility of specialty care when considering a medical group. Compared to the HMO level indicators, the medical group detailed measures were not viewed as frequently, perhaps reflecting that users leave the website before viewing medical group results.
The five Plan Service indicators (i.e., overall plan rating for service, complaints handled quickly, getting needed care, customer service, and paying claims) are all among the top 10 most popular specific performance indicators viewed by consumers, a finding consistent with the comments of focus groups that this information resonates with consumers.
In the six months after the launch of the 2003/2004 Quality of Care Report Card therewere 33,388 visits to the website (www.opa.ca.gov/report_card) by 16,539 uniquevisitors. Approximately 44% of website users proceed to view the HMO Qualitystatewide summary “star” chart and 21% view the medical group summary “star” chartfor a specific county.
The most frequently viewed category for HMO quality is the Plan Service category(Chart 5). Care for Living with Illness is the least popular category. The health topicthat receives the most attention isWomenʼs Health Care, followed byMental HealthCare, Diabetes, and Heart Care (Chart 6).
1,6031,500
1,257
911
765
0
200
400
600
800
1,000
1,200
1,400
1,600
1,800
Plan Service Care for Staying Health Care for Getting Better Doctor Communicationand Service
The five Plan Service measures for the HMOs (overall plan rating for service, complaintshandled quickly, getting needed care, customer service, paying claims) areamong the top ten most popular specificperformance indicators viewed by websiteusers (Table 1).10 Two of the three mentalhealth performance indicators (treatmentvisits for depression, anti-depressantmedication ongoing and after mental illnessstay) are also among the top 10 most popularspecific performance indicators viewed bywebsite users. It is notable that the mentalhealth performance indicators were rarelymentioned as being of particular interestduring focus group discussions. This couldindicate that the Quality Report Cardwebsite serves as a resource whereconsumers can view comparative information on plan performance in mental health care.
1,389
1,281
1,168
1,039
0
200
400
600
800
1,000
1,200
1,400
1,600
Women's Health Care Mental Health Care Diabetes Care Heart Care
# ofViews
The five Plan Service indicators(i.e., overall plan rating forservice, complaints handledquickly, getting needed care,customer service, and payingclaims) are all among the top 10most popular specificperformance indicators viewed byconsumers, a finding consistentwith the comments of focusgroups that this informationresonates with consumers.
Chart 5: HMO Quality Category Viewed -Number of Views for Category Opening PageCalifornia’s Quality of Care Report Card 2003/2004 Website
Chart 6: Health Topic Category ViewedCalifornia’s Quality of Care Report Card 2003/2004 Website
Chart 7: Medical Group Quality Category Viewed California’s Quality of Care Report Card 2003/2004 Website
How Useful is the Quality of Care Report Card to California Consumers? 17
Table 1: HMO Quality Indicators: 10 Most Popular Specific Results Pages Viewed California’s Quality Report Card 2003/2004 Website
Specific Measure Description # Views Quality Health (6 mos) Category TopicOverall Plan Rating 51% of members who rated their health plan highly overall— 1324 Plan Not 8, 9 or 10 on a 0-10 scale. Service applicable
Treatment Visits For % of depressed patients who were seen at least 3 times 1152 Care for Mental Depression during the 12-week initial treatment phase Getting Better Health
Complaints Handled % of members who reported that the plan resolved their 996 Plan No Quickly complaint within one week. Service applicable
Getting Needed Care Members ratings of their HMOs on helping members 965 Plan Not get the care they need Service applicable
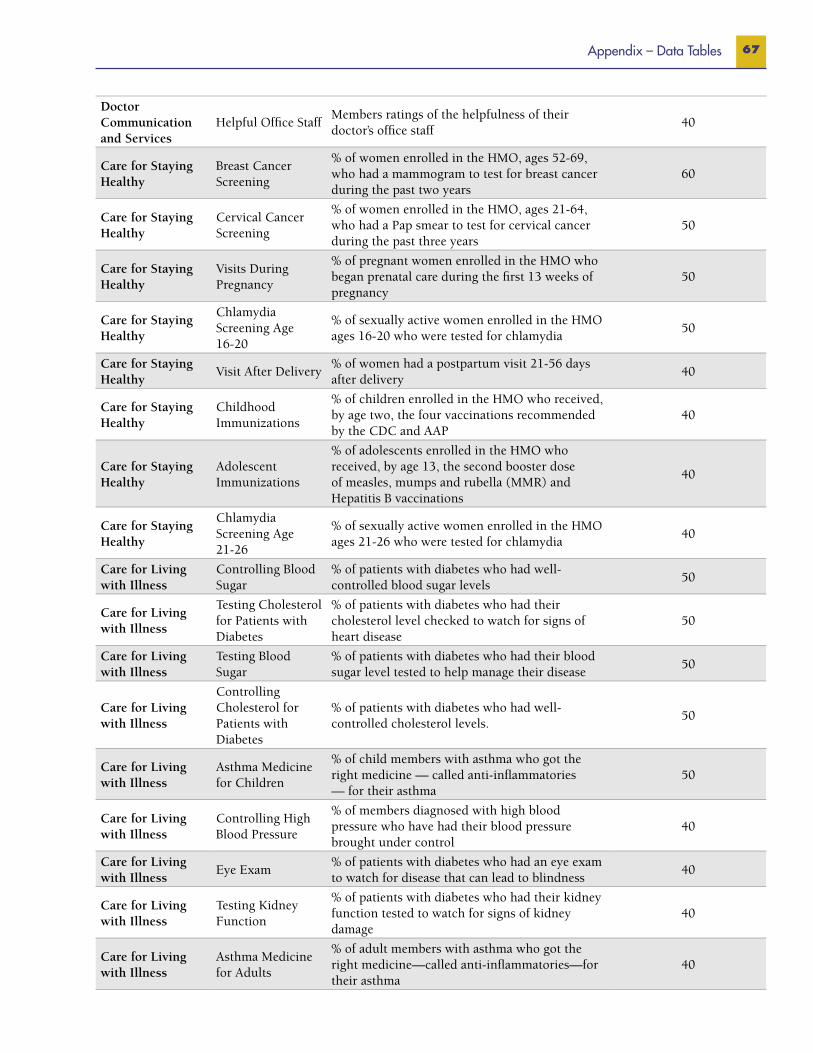
Breast Cancer Screening % of women enrolled in the HMO, ages 52-69, who had a 954 Care for Women’s mammogram to test for breast cancer during the past two years Staying Healthy Health
Customer Service Members ratings of their HMOs on providing 934 Plan Not good customer service Service applicable
Controlling Cholesterol % of members’ whose cholesterol levels were well controlled 857 Care for Heart after a heart attack or other serious heart problem/surgery Getting Better Care
Anti-depressant Medication % of depressed patients who remained on anti-depressant 820 Care for Mental Ongoing Treatment medication for a 6-month on-going care period that followed Getting Better Health the initial treatment
Paying Claims Members ratings of their HMOs on paying 809 Plan Not claims correctly and quickl Service applicable
Personal Doctor Highly Rated % of members who rated their personal doctor highly — 808 Doctor Not 8, 9 or 10 on a 0-10 scale. Communication applicable and Services
Table 2: Medical Group Quality Indicators: 10 Most Popular Specific Results Pages Viewed California’s Quality of Care Report Card 2003/2004 Website
Specific Measure Description # Views Quality �y
Easy to See a Specialist % of patients who reported not have a problem seeing a specialist 780 Getting Treatment and Specialty Care
After Hours Help % of patients who reported getting the care that they needed from 695 Timely Care and their doctor’s office after it was closed for the day Service
Getting Tests and Treatment % of patients who reported not have a problem getting care or tests 600 Getting Treatment that they or a doctor believed necessary and Specialty Care
Getting Appointments Soon % of patients who reported getting appointments as soon as they wanted. 595 Timely Care and Service
Getting to Specialist: % of patients who reported being seen by a specialist for routine care 471 Getting Treatment Routine Care as soon as they needed. and Specialty Care
Urgent Problems % of patients who reported getting care as soon as they wanted for an 449 Timely Care and Seen Quickly illness or injury. Service
Aware of Your % of patients who reported that their personal doctor was informed and 432 Getting Treatment Specialty Care up-to-date about the patient’s specialty care and Specialty Care
Getting to Specialist: % of patients who reported being seen by specialist for an urgent 424 Getting Treatment Urgent Care problem as soon as they needed and Specialty Care
Doctor Spends Time % of patients who reported that their doctors spend 413 Communicating with Patient enough time with them. with Patients
Seeing Doctor Quickly: % of patients who reported getting illness or injury care from their 368 Timely Care and Urgent Care personal doctor as soon as they wanted Service
Evaluation of California’s Quality of Care Report Card18
Usefulness of the quality categories on the Quality Report Card websiteWhen asked to rate the usefulness of the ratings categories, the majority of website user rated all the categories as “very” or “extremely” useful when selecting a health plan.11 Consistent with the findings from the consumer focus groups and the website usage trends, the HMO category that receives the highest usefulness rating is Plan Service; 65.5% find this category useful. The least useful category is Care for Living With Illness; 58.8% of respondents rated this as useful when selecting a plan (Chart 8). The category receiving the most favorable rating for usefulness among website users is Medical Group–Overall Care Rating. This category was rated as “very” or “extremely” useful when selecting a medical group by 66.7% of respondents. Most respondents also give high usefulness ratings (63% or greater) to the other 3 medical group categories. (Chart 9). When asked how important the HMO quality ratings were in choosing a health plan, the majority of consumers (76.7%) found the ratings to be very important.12 Consumers also found the medical group quality ratings important in choosing a medical group (74.1%).
What do users like most about the Quality Report Card website?Many consumers liked that the information on the website allowed them to directly compare HMOs and providers. The fact that the information is made available to consumers and that the plans themselves were not the
source of the information was also cited as important. The website was judged easy to use by the majority of respondents. Over 75% said they either agreed or strongly agreed with the statement that “the instructions on the
site were clear” and 77% either agreed or strongly agreed with the statement, “I could move through the site easily.” Ease of use was frequently mentioned as a positive aspect of the site. Almost all website users (89%) said that they would recommend the Quality Report Card to others.
What would users change about the Quality Report Card website?Changes to the Quality Report Card website suggested by consumers included adding information on member complaints about plans and how they are resolved. Another frequent suggestion was that the site should provide data on PPOs in addition to HMOs. Some consumers noted that they do not have a choice of HMOs, but can choose among
Sample Website User’s Comments:
“One of the few sites that will directly compare HMOs…”
“I like … the ability to rank my HMO with others; it gave me confidence in my choice…”
“The best thing about this site is.. that it exists…”
“It’s the most comprehensive ‘third party’ report I’ve seen not linked to an HMO or medical group’s website”..
“What I like most about the site is …that this information is readily available…”
“It might help to keep insurance companies and medical groups striving to improve”
“It’s very helpful knowing they are being checked”.
When asked to rate the usefulness of the ratings categories, the majority of website usersrated all the categories as “very” or “extremely” useful when selecting a health plan. 12Consistent with the findings from theconsumer focus groups and the websiteusage trends, the HMO category thatreceives the highest usefulness rating is PlanService; 65.5% find this category useful.The least useful category is Care For LivingWith Illness; 58.8% of respondents ratedthis as useful when selecting a plan (Chart 8)
0
10
20
30
40
50
60
70
80
Plan Service DoctorCommunicationand Service
Care for GettingBetter
Care for StayingHealthy
Care for Livingwith Illness
tnecre
P
Website Users Print Report Requestors
The majority of website userssurveyed say the quality ratings are“very important” in helping themchoose a health plan (77%) ormedical group (74%).
Chart 8: Usefulness of HMO Quality Categories When Selecting a Health PlanCalifornia’s Quality of Care Report Card Website and Print Report Card
Evaluation of California’s Quality of Care Report Card 19
several medical groups within a PPO Plan. A suggestion was made that information on a greater number of medical groups and individual physicians should be included.
Some consumers indicated that they would have liked more information about the data and research methods. A frequent comment was that the star system did not provide enough information to evaluate the quality differences among the plans or groups. When asked whether there are aspects of health care that are important but not included in the Quality Report Card, consumers mentioned that the cost of plans and providers was an important factor and that including it on the website would make the information far more useful. The suggestion that the website include information on grievances and complaints against the plans was repeated. Another clear theme was the potential for including information on treatments covered, denials of referrals, and/or coverage for pre-existing conditions. Another suggested addition to the site was information that would allow users to compare the plans on their prescription drug benefits and service quality.
Usefulness of the print Quality Report Card Users of the print Quality Report Card were asked to rate the usefulness of the HMO quality categories when selecting a health plan. The majority rated all the categories as “very” or “extremely” useful. Consistent with the findings from the consumer focus groups, the website usage trends, and the survey of website users, print Quality Report Card requestors find the Plan Service ratings to be most useful.
Website User’s Comments:
“I would prefer to look at two plans and do a direct comparison. I can only choose from 2 of the ones listed”.
“Survey whether people have a choice of HMOs first. Though I see medical care providers to whom I would transfer, my employer does not offer coverage with those groups, so I can’t ‘choose’ an HMO.”
“Present the medical group data according to which HMOs they are in…”
“Perhaps give a little more explanation of what the ratings mean. What does it take to get 3 stars, versus 2, versus 1; what 95% means to the typical patient experience.”
“Ratings are all too similar. Every plan always seems to score between 70% and 80% in every category. There needs to be better ways to differentiate the really bad ones from the ‘just a little bad’ ones. I can’t believe every HMO in the state really has a 70% or better approval rating”.
“Since (name of plan) came out so high, I went to their site, only to find it is significantly more expensive than my current plan. Cost is not a factor in your survey.”
“You should list any complaints against the HMO and/or doctors, nurses, etc. The public has a right to know about complaints and medical mistakes.”
“Show the number of ‘adverse’ actions filed against an HMO – let us see who generally makes life difficult for its members.”
“Data for HMO providers regarding the number of referrals requested vs. denied would be helpful (if you could pull the teeth necessary to get the data).”
“How many times a decision to deny coverage is reversed by state authorities should be included in the analysis”.
“I am worried about getting the medicines prescribed to me. I wish I could be sure my HMO was no different from the others in offering drug benefits. That is one thing missing in these charts.”
“I am having an unforeseen problem with the (name of plan) prescription drug formulary. I expected my generics to be covered and they are not. I sure wish you had specific question like ‘Does the pharmacy benefit cover the prescription your doctor thought was most suitable for you?’”
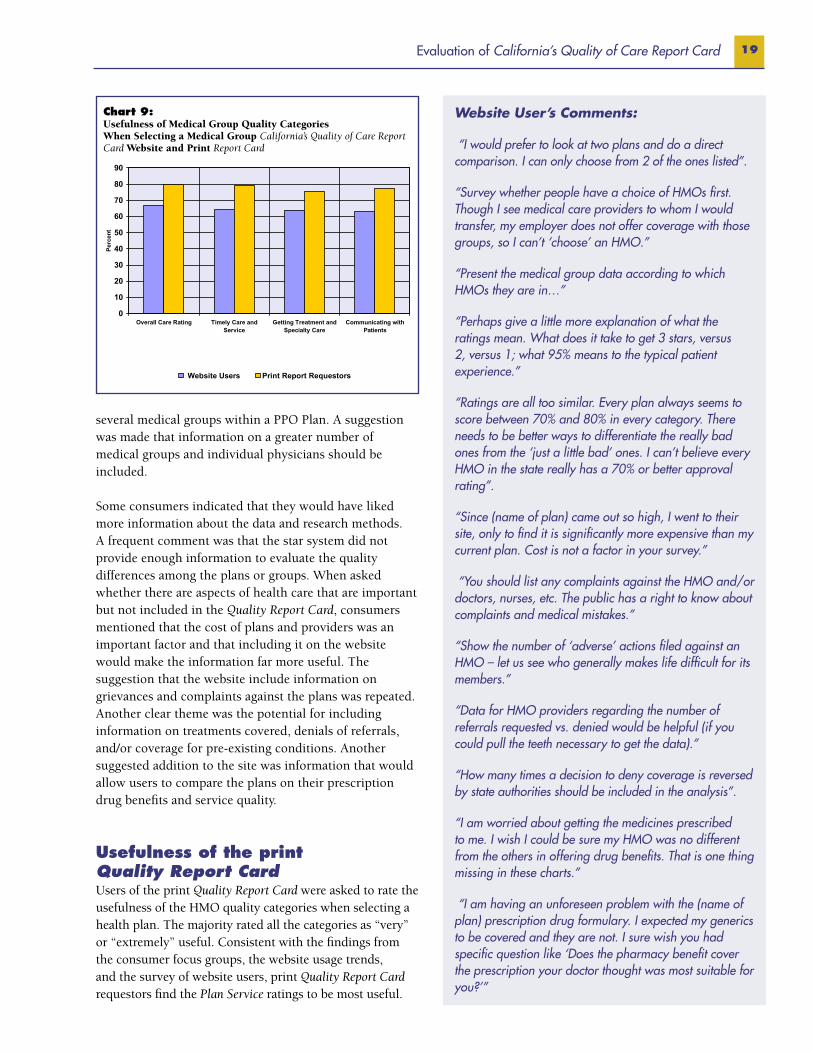
The medical group quality category receiving the most favorable rating for usefulnessamong website users is Medical Group – Overall Care Rating. This category was ratedas “very” or “extremely” useful when selecting a medical group by 66.7% ofrespondents. Most respondents also give high usefulness ratings (63% or greater) to theother 3 medical group categories. (Chart 9)
When asked how important the HMO quality ratings were in choosing a health plan, themajority of consumers (76.7%) found the ratings to be very important.13 Consumers alsofound the medical group quality ratings important in choosing a medical group (74.1%).
0
10
20
30
40
50
60
70
80
90
Overall Care Rating Timely Care andService
Getting Treatment andSpecialty Care
Communicating withPatients
tnecre
P
Website Users Print Report Requestors
Chart 9: Usefulness of Medical Group Quality CategoriesWhen Selecting a Medical Group California’s Quality of Care Report Card Website and Print Report Card
Evaluation of California’s Quality of Care Report Card20
Plan service was rated as useful by 76.1% of respondents. The two least useful categories are Care For Staying Healthy (72.1%) and Care For Living With Illness (72.8%). All of the categories received higher ratings from the print report requestors than the website users. (Chart 8)
As with website users, the most useful category to Quality Report Card requestors is Medical Group – Overall Care Rating, which is seen as useful by 79.8% of respondents. Two-thirds of respondents also give high usefulness ratings (75% or greater) to the other three medical group categories (Chart 9)
When asked how important the HMO quality ratings were in choosing a health plan, the majority of consumers who used the booklet (81.6%) found the ratings to be “very” or “extremely” important in helping them choose a plan. Booklet users also found the medical group quality ratings important in choosing a medical group (83.5%).
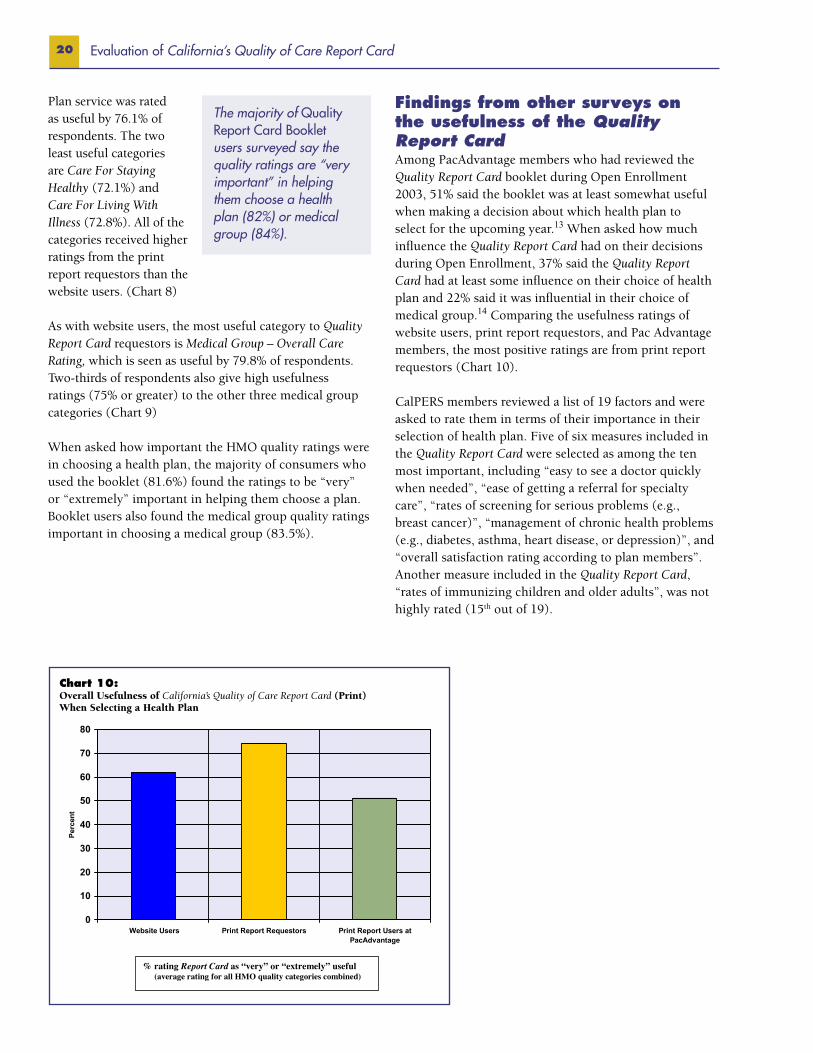
Findings from other surveys on the usefulness of the Quality Report CardAmong PacAdvantage members who had reviewed the Quality Report Card booklet during Open Enrollment 2003, 51% said the booklet was at least somewhat useful when making a decision about which health plan to select for the upcoming year.13 When asked how much influence the Quality Report Card had on their decisions during Open Enrollment, 37% said the Quality Report Card had at least some influence on their choice of health plan and 22% said it was influential in their choice of medical group.14 Comparing the usefulness ratings of website users, print report requestors, and Pac Advantage members, the most positive ratings are from print report requestors (Chart 10).
CalPERS members reviewed a list of 19 factors and were asked to rate them in terms of their importance in their selection of health plan. Five of six measures included in the Quality Report Card were selected as among the ten most important, including “easy to see a doctor quickly when needed”, “ease of getting a referral for specialty care”, “rates of screening for serious problems (e.g., breast cancer)”, “management of chronic health problems (e.g., diabetes, asthma, heart disease, or depression)”, and “overall satisfaction rating according to plan members”. Another measure included in the Quality Report Card, “rates of immunizing children and older adults”, was not highly rated (15th out of 19).
The majority of Quality Report Card Booklet users surveyed say the quality ratings are “very important” in helping them choose a health plan (82%) or medical group (84%).
Among PacAdvantage members who had reviewed the Quality Report Card bookletduring Open Enrollment 2003, 51% said the booklet was at least somewhat useful whenmaking a decision about which health plan to select for the upcoming year.14 Whenasked how much influence the Quality Report Card had on their decisions during OpenEnrollment, 37% said the Quality Report Card had at least some influence on their choiceof health plan and 22% said it was influential in their choice of medical group.15Comparing the usefulness ratings of website users, print report requestors, and PacAdvantage members, the most positive ratings are from print report requestors (Chart 10).
% rating Report Card as “very” or “extremely” useful(average rating for all HMO quality categories combined)
Chart 10: Overall Usefulness of California’s Quality of Care Report Card (Print) When Selecting a Health Plan
21Impact of California’s Quality of Care Report Card on Participating Plans and Medical Groups
Interviews with Key Informants in HMOs and Medical GroupsAn objective of California’s Quality of Care Report Card is to assist HMOs in their own quality improvement efforts by providing them with data on their performance in relationship to other HMOs in the state. As the number of participating medical groups increases, the Quality Report Card may play an expanding role in providing medical groups with timely data on their performance in relation to other provider groups in the state. To what extent and in what ways has the Quality Report Card impacted the 10 HMOs and 118 medical groups included in the 2003/2004 Quality Report Card? A survey of key informants in health plans and medical groups sought to address the following research questions15:
• Are HMO and medical group quality leaders familiar with the Quality Report Card, in either print or web format?
• How useful are the specific performance measures in the Quality Report Card for quality improvement at HMOs or medical groups? What other uses do providers find for the Quality Report Card?
• What impact, if any, does the Quality Report Card have on the market share and reputation of California HMOs and medical groups?
• What are the attitudes of HMOs and medical
V. Impact of California’s Quality of Care Report Card on Participating Plans and Medical Groups
groups with respect to the Quality Report Card and public reporting of quality information?
Interviews were completed with 21 key informants from the HMOs, with at least two respondents from each plan. Half the individuals interviewed were senior executives, such as CEOs, and half were clinical quality leaders, such as medical directors and directors of quality improvement who had oversight of the plan’s participation in quality reporting activities. One or more informants in each of the 118 participating medical groups were sent a survey via e-mail. A subset of informants in 24 medical groups was interviewed by telephone. The majority of respondents in the medical groups were medical directors (62%) or quality managers (33%).
Familiarity with California’s Quality of Care Report Card At least one key informant in each of the 10 HMOs recalled seeing California’s Quality of Care Report Card 2003/2004, either in print or on the Internet. With one exception, all medical group respondents were familiar with the Quality Report Card (Chart 11). The majority of key informants in HMOs (68%) spent 20 minutes or less reviewing the information in the Quality Report Card. Most medical group informants (63%) said they spent twenty minutes or less reviewing it but more than one-third indicated they spent more than 20 minutes.
Evaluation of California’s Quality of Care Report Card22
Three-quarters of HMO respondents said they had shared or discussed their planʼsperformance in the Quality Report Card with medical staff or quality improvement staffor both. Other departments with whom they shared the report include public relations,board of directors, or marketing departments (Chart 12). Medical groups reportedsomewhat greater distribution of the Quality Report Card within their organizations thanHMOs. Two-thirds of medical group respondents reported sharing or discussing theirmedical groupʼs performance in the Quality Report Card with clinical qualityimprovement staff. Over half (54%) also said it was shared with their board of directors.Only a few medical group respondents (23%) indicated their results had been shared withmarketing or public relations units.
0
10
20
30
40
50
60
70
80
Medical staff Qualityimprovement
staff
Board ofdirectors
Marketing /Public relations
Other
tnec re
P
HMO key informants Medical group key informants
Three-quarters of HMO respondents said they had shared or discussed their plan’s performance in the Quality Report Card with medical staff or quality improvement staff or both. Other departments with whom they shared the report include public relations, board of directors, or marketing departments (Chart 12). Medical groups reported somewhat greater distribution of the Quality Report Card within their organizations than HMOs. Two-thirds of medical group respondents reported sharing or discussing their medical group’s performance in the Quality Report Card with clinical quality improvement
At least one key informant in each of the 10 HMOs recalled seeing Californiaʼs Qualityof Care Report Card 2003/2004, either in print or on the Internet. With one exception,all medical group respondents were familiar with the Quality Report Card (Chart 11).The majority of key informants in HMOs (68%) spent 20 minutes or less reviewing theinformation in the Quality Report Card. Most medical group informants (63%) said theyspent twenty minutes or less reviewing it but more than one-third indicated they spentmore than 20 minutes.
0
10
20
30
40
50
60
70
80
90
100
Recall seeing QualityReport Card 2003/2004(print or Internet)
Less than 20 minutesspent reviewing Quality
Report Card
More than 20 minutesspent reviewing Qualtiy
Report Card
tnec re
P
HMO key informants Medical group key informants
staff. Over half (54%) also said it was shared with their board of directors. Only a few medical group respondents (23%) indicated their results had been shared with marketing or public relations units.
Usefulness of the Quality Report Card for Quality ImprovementHMOs: In general, the HMO informants find the measures in the Quality Report Card to be of limited usefulness in improving the quality of care provided by their
organization. When asked to rate the overall usefulness of the measures in the Quality Report Card, only 13% of those interviewed reported they were useful for quality improvement.16 The measures in the Doctor Communication and Services category receive the highest ratings from respondents.17 With one exception (Helpful Office Staff), all the specific measures in this category were rated as useful by at least half of respondents.The Getting Care Quickly measure was rated as useful for quality improvement by 70% of informants. Two other indicators in this category; how patients rate their Specialty Care Doctor and how well Doctors Communicate with patients, were viewed as useful by 60% of those interviewed.
The measures included in the Care for Getting Better category are considered the least useful for quality improvement. Four of the seven indicators in this category are seen as useful by no more than half of those interviewed. The measures pertaining to Depression Treatment and Anti-Depression Medication are considered not useful by more than 70% of those interviewed.In the Care for Staying Healthy category, only one measure, Breast Cancer Screening, is viewed as useful for quality improvement by 60% of respondents. In the Care for Living with Illness category, 40% of respondents felt that none of the specific quality measures were useful. Only one indicator in the Plan Service category, Customer Service, received positive endorsement for quality improvement from more than half of those interviewed.
Medical Groups Informants from medical groups report that the specific measures in the Quality Report Card are at least
Chart 11: Familiarity with California’s Quality of Care Report Card Website and Print Report Card Among HMO and Medical Group Informants
Chart 12: Dissemination of California’s Quality of Care Report Card Within Participating HMOs and Medical Groups
23Impact of California’s Quality of Care Report Card on Participating Plans and Medical Groups
somewhat useful in their quality improvement activities. The majority of respondents viewed each specific quality indicator in the Communicating with Patients category favorably.18 Doctor Explains Clearly was rated as useful by 78% of those surveyed. Several of the measures in the largest category, Timely Care and Services, were rated as being useful for quality improvement by more than two-thirds of those surveyed, including After Hours Help, Help Over the Phone, Seeing Doctor Quickly for Urgent Care, and Seeing Doctor for Preventive Care. The measures included in the category Getting Treatment and Specialty Care are the least useful for quality improvement in medical groups.The majority of respondents rated only one specific measure, Getting Tests and Treatments, as useful.
Quality Improvement Activities Informants described a number of quality improvement activities undertaken in response to quality reporting (Table 3). In addition, other quality improvement activities mentioned by key informants in the HMOs include:
• Working on new disease management programs for diabetes, asthma, cancer
• Encouraging case management by physician extenders
• Initiating diet, anti-smoking, exercise programs• Strengthened RN/MD teams
When asked whether any of the activities in the past 18 months were directly related to the organization’s
performance in the Quality Report Card, only 13% said yes.
Medical group informants mentioned several types of quality improvement activities, including increased quality discussions with internal staff and boards of directors (46%), changes in the way data are reported (54%), and the introduction of computerized physician order processes (27%). Examples of data-related changes include:
• More standardized computer reports for internal use
• Increasing the frequency of data reporting to plans and others
• Use of hard copy standardized questionnaires for patients
• Linking data to financial incentives• Improved responsiveness to external data
requests
Medical group respondents indicated that at least some of these quality improvement activities had been undertaken in response to the Quality Report Card – about 46% of medical group respondents indicated that the Quality Report Card had at least some influence, direct or indirect, on the type and emphasis of quality improvement activities within their medical groups. Overall, more than half of the medical group respondents (54%) thought the Quality Report Card was useful for monitoring or improving quality.
Table 3: Quality Improvement Activities Related to Public Reporting (past 18 months) According to Key Informants in HMOs and Medical Groups
Informants Informants reporting activity reporting activity within their within their HMOs Medical Group Activity (N=21) (N=35)
Instituted a new or revised process of care 74% 40%
Provided guidelines for best practices and shared benchmark information with providers 53% 55%
Changed the way data are reported or how frequently 63% 55%
Initiated computerized medical record or physician order entry 63% 26%
Sent reminders for preventive care 58% 49%
Instituted use of cross functional workgroups, conducted workshop or training in doctor-patient communication 63% 38%
Collected data out of medical records and shared results 53% 49%
Used staff incentives, rewards, recognition 47% 49%
Held board meetings or staff discussions 37% 47%
Other activities 37% 35%
Evaluation of California’s Quality of Care Report Card24
Other Uses for the Quality Report CardIn both HMOs and medical groups, the Quality Report Card serves another important purpose – benchmarking performance to allow comparisons with similar plans or providers. This was frequently mentioned as one of the ways in which it was helpful. Almost half of HMO respondents and a majority of medical group informants said they had looked at the report card in order to compare their results with their competitors (Chart 13).
About two-thirds of HMO respondents and three-fourths of medical group informants were unable to recall any media coverage of their organizations’ performance in the Quality Report Card. However, some recalled that a story had appeared in local newspapers or on local television news programs. The HMOs themselves rarely utilize the comparative quality information for marketing purposes. Two informants stated that their results had been part of a marketing or advertising campaign, highlighting the HMO’s good performance. In a few cases, a medical group’s marketing unit utilized the report card for advertising (17%).
Impact of the Quality Report Card on Market Share and ReputationHMOs The majority of the respondents (68%) felt the Quality Report Card would have no impact on their organizations’ market share (Chart 14). Two-thirds of those who said it would have an impact indicated that it would decrease rather than enhance the HMOs market share. When asked whether they thought it would affect their organizations’ public image, most (53%) felt it had no discernible impact. Among those who felt it would have an impact, 44% thought it would detract rather than enhance the HMOs public image, primarily due to the impact of negative media coverage on consumers.
Medical Groups Even fewer medical group informants felt that the Quality Report Card would impact their medical groups’ market share, with the majority (72%) indicating it would have no effect. Sixty-two percent felt it would have no discernible impact or affect on their medical groups’ reputation. Among those who thought it would impact their reputation, most (70%) thought the impact would be positive.
Opinions about the Quality Report Card and the Public Reporting of Quality InformationKey informants in the HMOs and medical groups expressed a wide range of opinions regarding the Report Card and the public reporting of quality information in general. Key findings and suggestions for improvement are highlighted below.
Validity of the Data: Most respondents (63% HMO informants, 51% medical group informants) indicate that the data behind the Quality Report Card has moderate validity (Chart 15). However some expressed concern that the data are not well reflected in the “star charts” that appear in the booklet and on the website summary
pages. A few mentioned that the weights used to calculate summary measures were not transparent and appeared to have changed from year to year. Medical group respondents expressed that more should be done to account for differences among types of groups and felt that OPA did not appear to have adequate technical expertise in statistics.
Reflection of Actual Performance: Less than half of both HMO and medical group informants (42% and 40% respectively) stated that the Quality Report Card’s scores were an accurate reflection their organization’s true quality of care (Chart 15). However, the medical group respondents indicated that the information was “very useful”, especially in comparative quality benchmarking among medical groups and in negotiations with HMOs.
Appropriateness for Public Use: Respondents suggested
In both HMOs and medical groups, the Quality Report Card serves another importantpurpose – benchmarking performance to allow comparisons with similar plans orproviders. This was frequently mentioned as one of the ways in which it was helpful.Almost half of HMO respondents and a majority of medical group informants said theyhad looked at the report card in order to compare their results with their competitors(Chart 13).
About two-thirds of HMO respondents and three-fourths of medical group informantswere unable to recall any media coverage of their organizationsʼ performance in theQuality Report Card. However, some recalled that a story had appeared in localnewspapers or on local television news programs (Chart 14). The HMOs themselvesrarely utilize the comparative quality information for marketing purposes. Twoinformants stated that their results had been part of a marketing or advertising campaign,highlighting the HMOʼs good performance. In a few cases, a medical groupʼs marketingunit utilized the report card for advertising (17%).
0
10
20
30
40
50
60
70
Benchmark forcomparison with similar
providers
Quality Improvementwithin organization
Marketing / Advertising Negotiation / Proposals
tnecre
P
HMO key informants Medical group key informants
Chart 13: Other Uses for California’s Quality of Care Report Card Websiteand Print Report Card Within Participating HMOs and Medical Groups
25Impact of California’s Quality of Care Report Card on Participating Plans and Medical Groups
Opinions of Key Informants in Health Plans and Medical Groups: Quality Report Card Is Biased or Unfair
“At (health plan), we think it is unfair and discriminates against honest reporters by making them appear worse.”
“The Quality Report Card doesn’t measure quality of care... It mostly measures customer satisfaction”.
“OPA should adjust the data in the Quality Report Card to take into account smaller medical groups that can’t afford to hire data-gathering and quality improvement staff.”
The Quality Report Card should distinguish among medical groups by type of group, type of contract with health plans, and by type of payor.
The weights used for the ‘star’ summary measures “are not statistically sound” and “have been capriciously changed without input from medical groups”.
“Medical groups don’t serve patients, doctors serve patients”.
The underlying data sets in the Quality Report Card need “more measures with more emphasis on clinical outcomes and better consumer samples”.
Opinions of Key Informants in Health Plans and Medical Groups: Quality Report Card Is Too General
“The Quality Report Card measures are too general, they do not get at quality of care and ‘seemingly’ focus on what doctors do, not health plans.”
“The ‘star measures’ are valid indicators but the Quality Report Card should add more specific clinical measures that get at patient outcomes.”
“The printed Quality Report Card needs to include a (simple) explanation of what the stars mean and how they are developed…”
HMOs The majority of the respondents (68%) felt the Quality Report Card would haveno impact on their organizationsʼ market share (Chart 14). Two-thirds of those who saidit would have an impact indicated that it would decrease rather than enhance the HMOsmarket share. When asked whether they thought it would affect their organizationsʼpublic image, most (53%) felt it had no discernible impact. Among those who felt itwould have an impact, 44% thought it would detract rather than enhance the HMOspublic image, primarily due to the impact of negative media coverage on consumers.
Medical Groups Even fewer medical group informants felt that the Quality Report Card
0
5
10
15
20
25
30
35
40
45
50
Quality Report Card has an impact onreputation / public image (agree)
Quality Report Card has an impact onmarket share (agree)
tn ec re
P
HMO key informants Medical group key informants
that if the number of detailed measures included in the Quality Report Card was increased, consumers could see how plans and groups actually compare. However, there was considerable criticism of the usefulness of the clinical measures themselves in their inability to reflect actual physician performance. Less than half of the informants in HMOs and medical groups (42% each) said that the Quality Report Card’s results were appropriate for use by consumers in selecting plans or providers (Chart 15).
Responsibility for public reporting of quality information:Although most respondents are familiar with the Quality Report Card, there is confusion as to its source. Four respondents believed that the Department of Managed Health Care (DMHC) was responsible for the production of the Quality Report Card and the collection of the data it includes. Many considered OPA to be part of DMHC, although some respondents did recognize OPA as a separate entity, even if closely linked to DMHC. Some HMO respondents (75%) volunteered negative opinions of DMHC, including the perception that its leadership was antagonistic to the health plan industry and did not appear to appreciate the complexities of the health plan arena. They acknowledged that some of this antagonism “spilled over” to OPA, possibly due to the ambiguity of organizational linkages between OPA and DMHC.
Despite the somewhat negative view of the state entity responsible for oversight of HMOs, a majority of HMO respondents said OPA or a similar public agency should continue to be responsible for developing and distributing the Quality Report Card (Chart 15). The majority of
Chart 14: Perceived Impact of California’s Quality of Care Report Card on Reputation and Market Share of Participating HMOs and Medical Groups
Evaluation of California’s Quality of Care Report Card26
Opinions of Key Informants in Health Plans and Medical Groups: Usefulness of the Quality Report Card
“We love the Quality Report Card because it helps consumers and doctors and is easy to understand and use as benchmark.”
“The Quality Report Card changed the organization… (we) added a ‘quality initiatives’ department and hired an MD and RN to run it and used scores (on the Report Card) in employer proposal price quotes.” (We) “use the Report Card in negotiations with affiliated medical groups… it offers leverage to (the health plan).”
“The Quality Report Card, along with the Pay-for-Performance program, has resulted in (our) hiring more data gathering and reporting staff and has allowed medical groups to compare themselves in California”.
Opinions of Key Informants in Health Plans and Medical Groups: Future of the Report Card
“Reporting on quality of care to (the public) will greatly expand in the near future because that is what government and consumers want.”
“There should be more cooperation and coordination among IHA, PBGH, CCHRI and OPA and OPA as a public agency should be in the lead on this initiative”.
We are impressed with …”the efforts of (the OPA Director) and staff.”
“The future of reporting to the public on (health care) quality by state (agencies) is very bright and (the role of) OPA will expand.”
medical group informants also supported OPA’s role as the pertinent state agency. However, some HMO respondents favored reducing OPA’s role and giving the plans more input in the Report Card. They suggest a public-private partnership be responsible for production and distribution of the Quality Report Card. Some commented that steps were being taken in this direction through IHA and the Pay-for-Performance program. Other medical group respondents specifically commended OPA’s role in coordinating with IHA, PBGH and CCHRI and said these efforts should be strengthened. Most respondents in both HMOs and medical groups are opposed to a report card produced exclusively by a private entity, whether non-
profit or for-profit.
Suggested Improvements for California’s Quality Report Card The most frequently mentioned suggestion from both HMO and medical group respondents (40%) was to include more measures as part of the “stars” ratings (Chart 16). More measures of clinical quality, even if more complex, would improve the Quality Report Card’s validity and make it a more accurate measure of quality of care and consumer satisfaction. Medical group informants
Suggested Improvements for Californiaʼs Quality Report Card The most frequentlymentioned suggestion from both HMO and medical group respondents (40%) was toinclude more measures as part of the “stars” ratings (Chart 16). More measures ofclinical quality, even if more complex, would improve the Quality Report Cardʼs validityand make it a more accurate measure of quality of care and consumer satisfaction.Medical group informants stated that the “star” system was less than ideal because it wastoo simplistic for provider feedback or quality improvement purposes, and at the sametime too difficult for consumers to fully understand.
OPA or similarstate agency shouldbe responsible for
Report Card
tnecr
eP
HMO key informants Medical groupkey informants
Chart 16: Suggested Improvements for California’s Quality of Care ReportCard Among HMO and Medical Group Informants
Chart 15: Opinions About California’s Quality of Care Report Card Among HMO and Medical Group Informants
27Impact of California’s Quality of Care Report Card on Participating Plans and Medical Groups
stated that the “star” system was less than ideal because it was too simplistic for provider feedback or quality improvement purposes, and at the same time too difficult for consumers to fully understand.
Many informants were not aware that the Quality Report Card included only commercial enrollees and indicated that OPA should make this clearer in its presentation of results. Medicare and Medi-Cal enrollees are viewed as distinct types of patients and informants believe that performance on the quality measures may differ by type of patient. HMO informants expressed an interest in a separate and/or separable Medi-Cal Report Card, on the
basis that these enrollees are different from commercial enrollees and respond to different incentives.
Medical group informants mentioned that a single consumer-oriented report card, produced by OPA or some other neutral public agency, would be welcome, especially if there were an increased advisory role for the medical groups. Strengthening data-reporting collaboration among OPA, CCHRI and other pertinent organizations is a positive step.
29Recommendations
Consumer Use of the Quality of Care Report CardBuild on the generally positive attitude toward public reporting. Consumers endorse the concept of publicly available quality comparisons as a positive step toward making managed care accountable to patients, even if it has limited direct influence on their choices. Publication of the data should be continued by OPA or a similar entity that does not appear to have a stake in the results.
Explore new approaches for publicizing the website. Ideas suggested by consumers for searching the Internet and finding the website could be incorporated, including providing links on popular health-related websites. Advertising about the OPA website in print media, television and radio, especially at times when consumers are most likely to use the information, such as employer open enrollment months, should continue or increase. Health plans and doctor’s offices should be enlisted to provide the website address on in-office posters or patient materials. Consumers report their contacts with health-advocacy groups often led them to the website. OPA should engage in outreach to these groups in order to make the Quality Report Card more visible. Consumers who have a problem with their HMO also have exposure to the website. The Quality Report Card should be easily accessed from the DMHC complaint website.
Consider additional venues for disseminating the booklet. Many consumers interested in quality information but
VI. Recommendations
who lack Internet access or prefer summary measures (such as senior citizens) find the booklet helpful. OPA could expand the number of outlets for distribution of the print Quality Report Card. Venues suggested by these consumers included placement of the booklets in doctor’s offices, mailings by health plans and employers, distribution to additional pharmacies, and placement at health fairs or community centers.
Usefulness of the Quality of Care Report CardPresent the results by health topic. Only one of the current category titles (Plan Service) is intuitively appealing to consumers. Consumers prefer to go directly to the results for health topics or diseases that are relevant to them, such as women’s health, diabetes, heart care, or mental health. Except for the Plan Service category, the current categories for organizing the results could be replaced with health topic categories in the booklet and made less prominent on the website opening pages.
Highlight measures that resonate most with consumers. When comparing health plans, consumers consistently named a set of measures that should be more prominently displayed or easily accessed. Consumers want to move quickly to the results for the Plan Service measures (e.g., quick complaint resolution, prompt care, and good customer service), Mental Health measures, since they are not easily accessed elsewhere, and access to and delivery
Evaluation of California’s Quality of Care Report Card30
of Specialty Care. The website should simplify or reduce steps necessary to “drill down” to these results.
Consider adding measures in areas of increasing interest to consumers. Consumers expressed interest in measures of plan and medical group performance in “lifestyle” topics, such as obesity, nutrition, and smoking cessation. Additional measures on topics relevant to men, such as prostate cancer screening, should be explored. A separate direct link to information about complaints and grievances would be useful.
Explore improvements to the website that would permit users to tailor the information to their own demographics and health care needs. Some of the elements on the website are ignored by many users. OPA could improve the Quality Report Card by implementing existing technology for tailoring website paths based on user- supplied data, such as geographic location, age, gender, disease states or chronic conditions.
Make it easier for consumers to move quickly to medical group comparisons. The Quality Report Card includes additional medical groups each year. Consumers report they have a wider choice of medical groups than health plans. Making the link to information on medical groups more prominent on the website opening page could improve its utility for consumers. A mapping of the medical group to HMO membership should be easily retrievable for users.
Retain measures based on both types of data – medical records and administrative data as well as patient survey. Consumers value administrative data and also recognize the patient experience and satisfaction survey results as an important source of information about people “like them”.
Explore improvements to the website that would permit users to view quality results at the same time as cost and benefit data. Improved linkages between the OPA website and the health benefits websites of large employers and purchasing groups might move some consumers closer to their preference of viewing quality data “side-by-side” with cost and coverage information.
Continue annual efforts to evaluate the usefulness of the Quality Report Card for informing consumer choice. OPA should continue to survey both website and booklet users for feedback and suggestions for improvement. Consumer focus groups should be conducted throughout the state annually to facilitate modifications and refinements based on feedback from actual and potential users of the information.
Impact on Quality Improvement in HMOs and Medical GroupsProvide health plans and medical groups with additional guidance on how to use the Quality Report Card for quality improvement. The impact that the Quality Report Card has on plans and medical groups provides an indirect but important benefit to consumers because plans may focus on quality improvements that could impact their results. Currently, plans and medical groups report little in the way of specific quality improvement activities pertaining to the Quality Report Card. OPA should consider convening a workshop or some other from of outreach to quality improvement staff that explains how the specific measures are defined and calculated and how specific practices translate into performance results. Medical groups appear more inclined to institute quality improvement activities in response to their Quality Report Card results, so specific recruitment of their participation is warranted.
Continue to cultivate the endorsement of plans and providers in the public reporting “movement’ by addressing some of their concerns about comprehensiveness and validity. Most key informants suggested that additional measures be included in the summary results and that additional reports be undertaken for Medi-Cal patients. OPA should consider convening work groups which include plans and providers to explore the feasibility of these ideas.
Take steps to ensure the Quality Report Card is responsive to the changing managed care environment in California. Meetings to stay abreast of new organizational arrangements and continued coordination with provider groups and plans and incentive arrangements such as “pay for performance” are critical.
31
Endnotes
1 A detailed description of the content of California’ Quality of Care Report Card 2003/2004 is given in Appendix – Description of California’ Quality of Care Report Card 2003/2004.
2 Information provided by OPA.
3 The Evaluation does not include an assessment of the linguistic services portion of the Report Card because a separate report was recently commissioned to evaluate these services, including the collection of detailed data from California consumers. The usability of the website was also not specifically addressed, since the contractor who designs the website for OPA conducts extensive usability testing throughout site development each year.
4 A complete description of the method used for website log analyses is given in Appendix – Methods: Analysis of Website Logs.
5 Survey question: Why did you come to come to California’s Quality of Care Report Card 2003/2004 website? Or Why are you interested in California’s Quality of Care Report Card? Source: “Website Users”: online survey responses of 1,798 OPA website users, October 2003 through March 2004. “Print Report Requestors”: mail survey responses of 543 individuals who requested print Quality Report Card from OPA in 2003 or 2004.
6 A detailed description of the survey of CalPERS members can be found in Appendix - Methods.
7 A detailed description of the dissemination of the Report Card to and subsequent survey of PacAdvantage members can be found in Appendix - Methods.
8 Survey question: How did you hear about Califorrnia’s Quality of Care Report Card 2003/2004? Source: “Website Users”: online survey responses of 1,798 OPA website users, October 2003 through March 2004. “Print Report Requestors”: mail survey responses of 543 individuals who requested print Quality Report Card from OPA in 2003 or 2004.
9 The complete list of number of views for each HMO quality specific measure can be found in the Appendix-Data Tables.
10 The complete list of number of views for each medical group quality specific measure can be found in the Appendix-Data Tables.
11 “Very” or “extremely” useful is defined as a rating of 4 or 5 on 5-point scale, where 1=”not at all useful” and 5=”extremely useful”.
12 “Very” or “extremely” important is defined as a rating of 4 or 5 on 5-point scale, where 1=”not at all important” and 5=”extremely important”.
13 The usefulness rating for the PacAdvantage sample used a 6-point scale. For the PacAdvantage sample, usefulness is defined as a rating of 4 or 5 or 6 on the 6-point scale, where 1=”not at all useful” and 6=”extremely useful”.
14 Influence is defined as a rating of 4 or 5 or 6 on a 6-point scale, where 1=”not influence at all” and 6=”large amount of influence”
15 A complete description of the key informant interviews is included in Appendix – Methods – Interviews with Key Informants in
HMOs and Medical Groups.
16 Respondents were asked to rate the overall usefulness and usefulness of each specific measure include in the Report Card on a scale of 1 to 6, where 1 equals “not at all useful” and 6 equals “extremely useful”. Responses of 4, 5 or 6 are considered a “useful” rating in the results presented here.
17 A complete list of the usefulness ratings assigned by HMO informants can be found in Appendix – Data Tables – HMO Key Informants Usefulness Ratings.
18 A complete list of the usefulness ratings assigned by the Medical Group informants can be found in Appendix – Data Tables
– Medical Group Key Informants Usefulness Ratings.
Endnotes
33Appendix – Description of California’s Quality of Care Report Card 2003/2004
APPENDIX:Description of California’s Quality Report Card 2003/2004
The State of California’s Offi ce of the Patient Advocate (OPA) publishes the Quality of Care Report Card to provide Californian’s with comparative information on the performance of California’s largest HMOs and medical groups.
The website and booklet provide information on:
• HMO Quality: The HMO quality ratings are summarized into fi ve categories:
• Care for Staying Healthy • Care for Getting Better • Care for Living with Illness • Doctor Communication and Service • Plan Service
A subset of the HMO quality measures are summarized into four health topics:
• Diabetes • Heart Care • Mental Health • Women’s Health
• Medical Group Quality: The medical group quality ratings are summarized into four categories:
• Overall Rating of Care • Getting Treatment and Specialty Care • Communicating with Patients • Timely Care and Service
“Star Charts” for HMO/Medical Group PerformanceIn the “star chart” of the booklet (and opening page of the website) a chart is presented showing the overall performance or “summary score” of each HMO in each of the fi ve categories. The summary result for the HMOs by health topic is available only on the website. A similar “star chart” for medical group performance is available separately by county or region. In general, the summary scores represent the proportion of members who had a positive experience or got the right care and are calculated on a 0 to 100 scale for each topic for that HMO or medical group. The score is then assigned one of four performance grades, as defi ned by OPA:
Evaluation of California’s Quality of Care Report Card34
“Star Chart” Grade HMO Definition Medical Group Definition
Excellent ★★★
(3 filled stars)
“Generally, this grade means that more than 80% of the health plan members had a positive experience or got the right care.”
“Generally, this grade means that more than 80% of patients reported favorable experiences such as the patients’ doctors listened carefully to them.”
Good ★★
(2 filled stars)
“Generally, this grade means that three of every four of the health plan’s members had a positive experience or got the right care.”
“Generally, this grade means that roughly three of every four patients reported favorable experiences such as not having a problem seeing a specialist.”
Fair ★
(1 filled star)
“Generally, this grade means that about two of every three of the health plan’s members had a positive experience or got the right care.”
“Generally, this grade means that about two of every three patients reported favorable experiences such as getting care as soon as the patient wanted when ill or injured.”
Poor ✩
(1 blank star)
“Generally, this grade means that fewer than 60% of the health plan’s members had a positive experience or got the right care.”
“Generally, this grade means that more than 40% of patients reported negative experiences such as not getting advice or help over the phone when patients call the doctor’s office.”
Plan/Provider Specific ResultsDetailed information on the performance is presented for plans on 36 measures and for medical group on 20 measures. The specific results are presented as bar charts of percentages from 0% to 100%. A short description of each measure is provided at the top of the bar chart. Specific results are available only on the Quality Report Card website; the booklet contains only the summary “star charts”. Examples of the specific results charts are shown.
Data Source, Scoring and Rating MethodsThe California Cooperative Healthcare Reporting Initiative (CCHRI) provides oversight for collection of the data that is used to score the quality results. CCHRI is a statewide collaborative of employers, health plans, and providers dedicated to providing accurate, standardized, comparable reports on health care performance. HMOs and medical groups voluntarily provided the data to CCHRI. In 2003, the CCHRI plans represented more than 90% of the California commercial HMO members.
HMOs The quality measures are based on the services, care and experiences of commercial HMO members who were enrolled in the HMO throughout calendar year 2003.
35Appendix – Description of California’s Quality of Care Report Card 2003/2004
HMO quality scores are constructed using the HEDIS® (Health Plan Employer Data Information Set) and CAHPS® (Consumer Assessment of Health Plans Survey) quality performance systems. The HEDIS® measures are based on patient medical charts and records of the services provided to members. The CAHPS® measures are based on a survey of patients who report about their experiences with the HMO and its doctors. For more information about HEDIS® and CAHPS® visit www.ncqa.org.
Medical Groups The medical group quality measures are taken from a survey or patient’s experiences of care and service, the 2003 California Consumer Assessment Survey (CAS). The average of all of a medical group’s patients’ scores is calculated to create a medical group score. The scores represent the average or typical experience that that medical group’s patients reported.
Other Information in the Quality Of Care Report CardCalifornia’s Quality of Care Report Card 2003/2004 also provides information on HMO Services in Other Languages. The availability or absence of five HMO services, presented separately for commercial, Medi-Cal, Healthy Families, and Medicare patients, are listed:
• HMO provides interpreter at doctor’s office• HMO provides interpreter free of charge• HMO provides sign language interpreter at doctor’s office• HMO provides translated list of bilingual doctors• HMO monitors satisfaction of non-English speakers
Both the website and booklet prominently list resources for HMO members who wish to make a complaint about their HMO’s failure to resolve a care or service problem, including contact information for the California Department of Managed Health Care (DMHC) and the HMO complaints helpline.
The WebTrends log file records the URL pathway followed by each visitor to the website. Reports generated by WebTrends summarize the number of times a specific pathway is followed to a specific document (or page). The number of “views” for a specific website page, such as a “results” bar chart, were summarized by analyzing the WebTrends “Top Documents” report for the 250 most frequently viewed pages. Multiple pathways can be lead to the same page depending on the language (i.e., English, Spanish, Chinese) and/or county the user has selected. Each possible pathway to a specific page was counted in summarizing the popularity of the page.
Views were counted instead of visits since the popularity of a website page might be driven by more than one view of the page by a single visitor. Individual visitors are counted each time they visit the website and are counted only once per visit no matter how many pages they view. If a visitor is idle longer than the idle-time limit, WebTrends assumes the visit was voluntarily terminated. If the visitor continues to browse the site after reaching the idle-time limit, a new visit is counted. The number of views of the page is equal to the number of times the specified page or document was viewed by a visitor. Since each page or document can be viewed more than once by the same visitor, the number of views is greater than the number of visits to the page.
The total number of views includes all the views of the page for all three languages (i.e., English, Spanish, Chinese) and for all California counties combined. For example, the popularity of a page showing the results for “Overall Medical Care” includes the number of views for that chart for all counties and languages that appear in the “top documents” listing.
LIMITATIONS Due to time constraints, the time period for the weblogs represents only a partial year of website usage.
Consumer survey data analysisOn-line survey of website users In the first six months following the launch of the 2003/2004 Quality of Care Report Card, 1,798 individuals completed a “pop-up” on-line survey while using the website. The questionnaire for the on-line survey of website users can be found in Appendix – Data Collection Instruments. The majority of respondents were female (61.8%), spoke English (95.8%), and had completed college (70.8%). The average age of respondents was 50.8 years.
LIMITATIONS The on-line survey was completed by approximately 11 percent of the website visitors during the time period studied. While the survey provides valuable feedback about the Quality of Care Report Card website, the respondents are not necessarily representative of all website visitors. Response bias may be present since visitors who benefited from using the site may have been more likely to complete the survey and their opinions may not be generalizable to the
California HMO enrollee population.
Mail survey of print Quality Report Card requestors. Six months following the launch of the 2003/2004 Quality Report Card, 2,285 individuals who had contacted OPA to request a print copy of the Year 2 or Year 3 Quality Report Card booklet were mailed a brief survey. A total of 543
Evaluation of California’s Quality of Care Report Card38
questionnaires were returned (25%). The questionnaire for the survey of print Quality Report Card requestors can be found in Appendix – Data Collection Instruments. The average age of respondents to the print Quality Report Card Requestors Survey was 54.6 years. As in the website survey, the majority of respondents were female (65.4%) and spoke English (96.6%). Fewer print Quality Report Card users than website users report having completed a 4-year college (54.7% vs. 70.8%).
LIMITATIONS The mail survey of Quality Report Card requestors was sent to individuals who had some or limited exposure to the Quality of Care Report Card in 2002-2004. While the survey provides valuable feedback about the print version of the Quality of Care Report Card, the respondents are not necessarily representative of all Quality Report Card users. Response bias may be present since users who benefited from using the booklet may have been more likely to complete the survey and their opinions may not be generalizable to the California HMO enrollee population.
Other surveys (CalPERS members / PacAdvantage members) A recently completed 3-year project entitled “Information about Quality in a Randomized Evaluation (INQUIRE)”, funded by the Agency for Healthcare Research and Quality (AHRQ) was designed to determine whether consumers can be influenced to make healthcare decisions using information about health plan quality. Phase 1 of the study, in partnership with the California Public Employees Retirement System (CalPERS), was focused on identifying factors associated with the use of employer-disseminated quality information about health and medical group performance and how consumers use such information during open enrollment (OE). A stratified random sample of 2,500 CalPERS members was surveyed by mail before open enrollment 2002; 1,592 recipients (63.7%) returned pre-OE questionnaires. Respondents were surveyed again after open enrollment (January-February 2002) to assess the short-term impact of the quality information and how useful it was for selecting a health plan. The response rate to the Post-OE survey was 81.3% (N = 1,294). The Post-OE questionnaire included an item asking respondents to indicate whether they had used the “HMO Quality Report Card from the California Department of Managed Health Care…during the recent Open Enrollment period.”
Phase 2 of the INQUIRE project was a randomized controlled trial of a quality dissemination intervention during 2003 open enrollment. The intervention group participated in an “Active Consumer Education Program” designed to motivate consumers to use quality information when selecting a health plan. These activities were undertaken through a partnership with the Pacific Business Group on Health, which administers the PacAdvantage purchasing pool for over 11,000 small employers. As employees of small businesses, PacAdvantage members differ from CalPERS members in that they do not currently have the ability to receive or request a comprehensive report card from their employers. Therefore, they represent a key target audience for the OPA Quality Report Card. In the spring of 2003, a stratified random sample of 1,770 PacAdvantage members who were in OE, received the California’s Quality Report Card, the HMO Guide produced by OPA, and an invitation to call the Quality Care Consumer Education Center. A group of 1,558 members who did not recieve the materials were randomized to a control group. Following OE, 1,106 (33%) members returned a questionnaire in the mail which included items to measure socio-demographic characteristics, health status, factors affecting health plan and medical group choice, quality information accessed during previous open enrollment periods, and information desired. Individuals who had received the Quality Report Card during OE were asked whether they used it, how much time they spent reviewing it, how useful it was and how much impact it had on their selection of health plan during OE.
LIMITATIONS The research activities of the INQUIRE project were underway at the time that this report was commissioned, so the project could not be designed to specifically address the evaluation questions posed here. The CalPERS and PacAdvantage survey respondents are representative of their organizations’ membership. The survey respondents may represent California consumers who receive health benefits through their employer, but their opinions and experiences are not necessarily generalizable to all HMO enrollees in California.
39Appendix – Methods
Consumer focus group methodsIn April through June 2004, consumer focus groups were conducted to obtain feedback from users of California’s Quality of Care Report Card.
Discussion TopicsThe complete topic guide for the focus group discussions can be found in Appendix – Data Collection Instruments. The focus group discussion was focused on five main topics:
• Usefulness of the Print Report Card – Group members shared how they had heard of the Quality Report Card and how useful the information in the booklet had been in selecting a health plan.
• Feedback on the “Star Chart” and Website Opening Page for HMOs – Discussion focused on the usefulness of the summary measures and categories used.
• Feedback and Evaluation of Specific Measures for HMOs – Participants were asked to share which measures they found most relevant and useful. Measures selected by the group were given detailed scrutiny. Specific results charts were projected on a screen and participants provided feedback on the extent to which the results would affect their decision-making, how much they trust the data, and any suggestions for improving how the data are displayed.
• Feedback and Evaluation of Specific Measures for Medical Groups – Participants were asked to share which measures they found most relevant and useful. Specific results charts were projected on a screen and participants provided feedback on the extent to which the results would affect their decision-making, how much they trust the data, and any suggestions for improving how the data are displayed.
• Preferences and Suggestions – Participants discussed the positive and negative aspects of using the booklet or website, how the information could be more useful, and suggestions for additional data that could improve the Quality Report Card. Participants were asked their opinion about whether the Quality Report Card should be produced by a state agency and how it should be distributed.
Participant Recruitment A letter of invitation was sent to 2,285 individuals who had contacted OPA to request a print Quality Report Card in 2002 or 2003. In addition, individuals who completed the on-line survey while visiting the OPA report card site in 2003 and who voluntarily provided their name, address, e-mail, or phone number were invited to take part in the focus groups (approximately 150 people).
Group CompositionA total of six focus groups were conducted between April and June 2004 with a total of 42 participants: 12 men and 30 women. The groups were composed of 32 Caucasians, four African Americans, three Asians, and three Hispanics. Four groups were conducted with participants from the greater Sacramento area and two groups were conducted with participants from the greater Los Angeles area. One group was primarily composed of senior citizens or older adults including those who recently selected a health plan or a Medicare supplement. Most groups had individuals with one or more chronic illness(s) or who self-identify their health status as “poor” or “fair”. However, the majority of participants were healthy adults who obtain their health insurance coverage through their employer. Individuals who said they were pursuing a complaint against their health plan were excluded.
Focus Group MechanicsAt the beginning of each session, participants were provided with a folder that included a copy of the print Quality Report Card. Each participant then introduced him-or herself to the group. The Subject’s Bill of Rights and Consent Forms were explained and each subject signed the forms, keeping a signed and dated copy for themselves. The sessions were tape recorded with the participants’ permission, transcribed by professional transcribers, and edited for clarity by one of the facilitators. Participants were paid $50 for the 2-hour discussion session. As background, the facilitator explained that the data for the Quality Report Card is obtained through patient surveys, administrative records of the various plans, and
Evaluation of California’s Quality of Care Report Card40
through a sampling of medical records of patients who belong to the various plans. The difference between a managed health care plan and medical provider group was also explained. Participants were informed that only some (and not all) of the medical plans and groups voluntarily report information to the OPA. The Quality Report Card booklet was then briefly reviewed. The majority of the group discussion was directed at the “live” OPA website, which was projected on a screen at the front of the room. The complete topic guide for the focus group discussions can be found in Appendix – Data Collection Instruments.
LIMITATIONS Four focus groups were conducted in Northern California and two in Southern California. The experience of patients in managed care organizations may be different in Northern California where managed care penetration is very high and consumers are potentially familiar with one or more HMOs. Since all the groups were comprised of individuals who had some prior exposure to the Quality of Care Report Card, the participants are not necessarily representative of all potential Quality Report Card users.
Interviews with Key Informants in HMOs and Medical GroupsUnder the guidance of the Center for Health Services Research in Primary Care (CHSRPC) of the University of California, Davis, Albert Lowey-Ball Associates, Inc. (ALBA), conducted surveys of key informants at all ten Health Maintenance Organizations (HMOs) and selected medical groups (Provider Medical Groups, PMGs, and/or Independent Practice Associations, IPAs) listed in California’s Quality of Care Report Card 2003/2004. An analogous web survey instrument was developed and distributed to key informants in all medical groups. The interviews and web survey were conducted in May, June, and July 2004.
The guide for the interviews with key informants can be found in Appendix – Data Collection Instruments. Interviews and surveys were conducted under conditions of strict confidentiality in order encourage candor and accuracy. Respondents were asked to comment on the Quality Report Card itself and to share their opinions on the general topic of reporting HMO and medical group quality information for use by consumers.
Interview TopicsTelephone interviews with key informants covered four major topics.
• Familiarity with and Use of the Quality Report Card – The interviewer asked the respondent about his or her familiarity with the Quality Report Card in either booklet or web format, and how much it has been discussed among key organizational components within the health plan or the medical group.
• Usefulness of the Quality Report Card for Quality Improvement - The interviewer read the list of specific measures included in the Quality Report Card and asked respondents to rate the indicator’s usefulness for monitoring quality or quality improvement activities. Usefulness was scored using a six-point scale, where 1=”not at all useful for quality improvement” and 6=”extremely useful for quality improvement”. Respondents were then asked to recall recent quality improvement efforts in their organization and whether any could be attributed to their performance in the Quality Report Card or public reporting in general.
• Impact of the Quality Report Card on Market Share and Reputation – The respondent was asked to recall any media coverage of their organization’s performance in the Quality Report Card and the effect, if any, of the Quality Report Card on the organization’s market share and reputation. Only respondents identified as CEO or medical director/chief medical officer were administered this part of the interview.
• General Evaluation and Attitudes – Suggestions for improving the Quality Report Card were solicited and the respondent was encouraged to share any other aspect of their experience with the Quality Report Card. The interviewer specifically asked each respondent’s opinion on who should be responsible for reporting quality information to consumers.
Identification of Eligible Organizations
41Appendix – Methods
HMOs All ten HMOs included in the Quality Report Card 2003/2004 were eligible and at least two individuals in each organization completed an interview.
Medical Groups Due to mergers and terminations, five of the medical groups included in the Quality Report Card were not eligible for survey, leaving 113 eligible groups. Key informants in all medical groups were invited via electronic mail to answer a web-based version of the survey. Eleven usable responses were obtained from the web survey. An additional 30 medical groups were contacted by telephone to request an interview, resulting in 24 completed interviews. An attempt was made to interview respondents from groups in all parts of the state and to include both those who had high and low performance ratings in the Quality Report Card (e.g., whether or not the organization had a “blank star” rating, indicating a “poor” performance on one or more summary measures).
Key Informants in Medical Groups Selected for Interview or Survey
Total # groups included
in Quality Report Card 2003/2004
# Interviews completed
# Web surveys completed
Geographic location
Northern CA – San Francisco or East Bay Area (Regions 2, 3, 4)
20 7 3
Northern CA – Sacramento and Central CA (Regions 1 and 5)
14 6 1
Greater Los Angeles Area (Regions 6, 7, 8, 9, 10)
66 8 5
San Diego (Region 11)
13 3 2
Performance in Quality Report Card 2003/2004
“Poor” rating (at least one blank-star, no 3-star ratings)
22 5 2
“Good” or “Fair” ratings (one or two stars)
75 16 7
“Excellent” ratings (one or more 3-star rating, no blank-star rating)
16 3 2
Total 113 24 11
Identification of Key InformantsHMOs At least one key informant with responsibility for clinical quality monitoring and one informant with overall executive oversight were sought for interview in each of the ten HMOs included in the 2003/2004 Quality Report Card. An extensive list of potential contacts at the health plans was developed from information on file with the Department of Managed Health Care (DMHC), each organization’s website, and from contacts developed by Albert Lowey-Ball Associates, Inc. (ALBA) in prior engagements. Considerable effort was made to identify an appropriate clinical quality leader who was knowledgeable about the public performance reporting activities in California. The final group of HMO key informants includes at least one senior executive and one clinical quality leader in each of the 10 organizations. In the case of one plan, two clinical respondents as well as the senior executive were interviewed. In total, 21 individuals
Evaluation of California’s Quality of Care Report Card42
were interviewed. The majority of identified clinical quality informants were familiar with HEDIS reporting, CAHPS, and the CCHRI, if not the Quality Report Card itself. Approximately 150 telephone calls to health plans were made and typically appointments were required. Interviews lasted between 25 and 45 minutes.
Medical Groups After accounting for recent mergers and dissolutions, the universe of eligible medical groups was 113. Of these, 30 groups were targeted for telephone interviews. All contacts in 113 groups were invited to respond to a web-based version of the survey. The initial list of potential contacts in the medical groups was developed from the list of contacts for the Integrated Healthcare Association (IHA) Pay-For-Performance (P4P) project. This list was merged with professional association listings, each group’s website, and contacts developed by Albert Lowey-Ball Associates, Inc. (ALBA) in prior engagements. Efforts were made to identify an appropriate clinical quality leader who was knowledgeable about the public performance reporting activities in California. The majority of identified clinical quality informants were familiar with the P4P project and/or the Consumer Assessment Survey (CAS), if not the Quality Report Card itself. Approximately 175 telephone calls to medical groups were required. Interviews lasted between 25 and 45 minutes.
Respondent Job Titles HMO Key Informants
Medical Group Key Informants
Senior Executives
CEO/President 2 1
Vice President/Senior Vice President/Senior Manager of Government Programs/Provider Relations/Decision Support/Public Affairs/ Marketing
8 1
Clinical Quality Leaders
Chief Medical Officer/ Medical Director 6 21
Director of Quality Assurance/Quality Manager /Quality Improvement Director/Quality Analyst /Nurse Analyst/Clinical Support
4 8
Other (Associate Medical Officer/Utilization Review Manager / Media Director) 1 4
Total 21 35
43Appendix – Data Collection Instruments
APPENDIX:Data Collection Instruments
Website Users On-Line Questionnaire
OPA CA HMO Report Card v3.0 Exit this survey >>
Thank you for taking a moment to share with us your experience using the OPA Quality of Care Report Card. We are interested in your feedback in order to help us make sure the Report Card meets the needs of California’s HMO enrollees.
This survey should only take a few minutes to complete. If you have not yet explored the Report Card, you can leave this survey window open and come back to it later.
Thank you,The Office of the Patient Advocate
Next >>
1. Why did you come to the Report Card site today?❏ I am an HMO member looking to compare HMOs❏ I am an HMO member looking for information about my HMO❏ I am considering becoming a member of an HMO❏ Other (please specify) _____________________
2. How did you find the Report Card site?❏ Newspaper❏ Radio or TV❏ Internet Search❏ Heard from a friend or relative❏ Heard from employer or HMO❏ Other (please specify) ____________________________
3. Which sections of the Report Card did you visit? (please check all that apply)❏ HMO Quality Ratings❏ Medical Group Quality Ratings❏ HMO Services in Other Languages❏ HMO Contact Information❏ About this Report Card❏ Other (please specify) _______________________________
Evaluation of California’s Quality of Care Report Card44
4. Please indicate your level of agreement or disagreement with the following statements:
Neither Strongly Agree nor Strongly Disagree Disagree Disagree Agree Agree
The instructions on the site were clear ❏ ❏ ❏ ❏ ❏
I could move through
the site easily ❏ ❏ ❏ ❏ ❏
5. How useful were the Report Card HMO ratings?
1- Not at 5-Extremely Not all useful 2 3 4 useful sure
Care for Staying Healthy ❏ ❏ ❏ ❏ ❏ ❏ Care for Getting Better ❏ ❏ ❏ ❏ ❏ ❏ Care for Living with Illness ❏ ❏ ❏ ❏ ❏ ❏ Doctor Communication and Service ❏ ❏ ❏ ❏ ❏ ❏
Plan Service ❏ ❏ ❏ ❏ ❏ ❏
6. How useful were the Report Card medical group ratings? 1- Not at 5-Extremely Not all useful 2 3 4 useful sure
Overall Care Rating ❏ ❏ ❏ ❏ ❏ ❏ Getting Treatment and Specialty Care ❏ ❏ ❏ ❏ ❏ ❏ Communication with Patients ❏ ❏ ❏ ❏ ❏ ❏ Timely Care and Service ❏ ❏ ❏ ❏ ❏ ❏
7. Please rate your agreement with the following statements.
Neither I didn’t Strongly agree nor Strongly see these Disagree Disagree disagree Agree agree charts
The star charts were clear and understandable ❏ ❏ ❏ ❏ ❏ ❏
The bar charts were clear and understandable ❏ ❏ ❏ ❏ ❏ ❏
The check mark charts were clear and understandable ❏ ❏ ❏ ❏ ❏ ❏
45Appendix – Data Collection Instruments
8. How important are the HMO/Medical Group quality ratings in helping you choose: 1- Not at all 5-Extremely N/A important 2 3 4 important
An HMO ❏ ❏ ❏ ❏ ❏ ❏ A Medical Group ❏ ❏ ❏ ❏ ❏ ❏
9. Would you recommend this Report Card to others? ❏ Yes ❏ No
10. What did you like most about the Report Card site? __________________________
11. What would you change about the Report Card site? __________________________
12. Are there aspects of health care that are important to you that do not appear in the Report Card? If so, what are they? ____________________________________________
About You 13. Age (optional) ___________
14. Gender (optional ) ❏ Female ❏ Male15. What language do you primarily speak at home? (optional) ❏ English ❏ Spanish ❏ Chinese (Cantonese or Mandarin) ❏ Japanese ❏ Korean ❏ Pilipino (Tagalog or Filipino) ❏ Portuguese ❏ Vietnamese ❏ Other (please specify) _______________
16. What is the highest level of school you have completed? (optional) ❏ 8th grade or less ❏ Some high school, but did not graduate ❏ High school or GED ❏ Some college of 2-year degree ❏ 4-year college ❏ More than 4-year college degree
17. Ethnicity (optional) _______________________
Evaluation of California’s Quality of Care Report Card46
18. Would you be willing to provide additional feedback to the Office of the Patient Advocate about your experience with this website (optional)
❏ No❏ Yes (Enter your name, e-mail, and/or phone number and you may be contacted).
Thank you!
We greatly appreciate your response to our survey and hope the 2003 Quality of Care Report Card has been useful.
The following questions are about California’s Quality of Care Report Card 2003/04:
How does your HMO or medical group compare with others?The State of California Office of the Patient Advocate
1. Why are you interested in California’s Quality of Care Report Card 2003/04?
❏ I am an HMO member looking to compare HMOs
❏ I am an HMO member looking for information about the HMO I am in now
❏ I am considering becoming an HMO member
❏ Other (please specify) ___________________________________________
2. How did you hear about California’s Quality of Care Report Card 2003/04? Check all the ways you heard.
❏ Newspaper or other print media
❏ My HMO or health plan
❏ Internet Search
❏ Heath care provider (e.g., physician)
❏ Radio or TV
❏ Consumer or health advocate group (e.g, AARP, consumer reports)
❏ Friend or relative
❏ My employer or a co-worker
❏ Other (please specify)____________________________________________________________
Evaluation of California’s Quality of Care Report Card48
3. California’s Quality of Care Report Card 2003/04 shows ratings of health plans or HMOs in 5 areas. How useful are the following for comparing the quality of health plans or HMOs? Circle your answer.
HMO ratings - 1 to 3 stars (★) for:
Not at All Extremely Not Useful Useful Sure
Care for Staying Healthy – How well HMOs and their doctors help members avoid illness and find problems early . ............................... .1 2 3 4 5 0
Care for Getting Better – How well HMOs and their doctors help members get the right treatment to recover from illness ......................... 1 2 3 4 5 0
Care for Living with Illness - How well HMOs and their doctors take care of members who have chronic illnesses .........................................................1 2 3 4 5 0
Doctor Communication and Services – Patients’ ratings of the quality of communication and service received from the HMO’s doctors and their staffs ...1 2 3 4 5 0
Plan Service – Patients’ ratings of how wellHMOs help members get the care they need and
provide customer service .....................................................1 2 3 4 5 0
4. How important are the HMO quality ratings in California’s Quality of Care Report Card 2003/04 in making your choice of health plan? Circle your answer
Not at all Extremely Not important Important Applicable ▼ ▼ ▼ ▼ ▼ ▼
1 2 3 4 5 0
49Appendix – Data Collection Instruments
5. Most primary care doctors belong to a group of physicians called a medical group. California’s Quality of Care Report Card 2003/04 shows ratings of medical groups in 4 areas. How useful are the following for comparing the quality of medical groups? Circle your answer.
Medical group ratings - 1 to 3 stars (★) for: Not at All Extremely Not Useful Useful Sure
Overall Rating of Care – Patients’ ratings of the care overall from the doctors and other
staff at the medical group ........................................... 1 2 3 4 5 0
Getting Treatment & Specialty Care – Patients’ ratings of the medical group in getting testsor treatments and seeing specialists when needed. .............1 2 3 4 5 0
Communicating With Patients – Patients’ratings of the groups’ doctors and staff in listening carefully, explaining clearly, and spending enoughtime with them . ..................................................................1 2 3 4 5 0
Timely Care & Service – Patients’ ratings of themedical group on scheduling and keeping appointments on time, getting care after hours and by telephone and seeing their regular doctor without delay . ..........................1 2 3 4 5 0
6. How important are the medical group quality ratings in California’s Quality of Care Report Card 2003/04 in making your choice of medical group? Circle your answer.
Not at all Extremely Not
important Important Applicable
▼ ▼ ▼ ▼ ▼ ▼
1 2 3 4 5 07. What is your age in years?
8. Are you male or female? ❏ Male
❏ Female
9. Overall, how would you rate your health in the past 3 months? Circle your answer.
Excellent Very Good Good Fair Poor Very Poor
▼ ▼ ▼ ▼ ▼ ▼
1 2 3 4 5 0
10. What is the highest grade or level of school that you have completed? Choose one.
❏ 8th grade or less ❏ Some college or 2-year degree
❏ Some high school, but did not graduate ❏ 4-year college graduate
❏ High school graduate or GED ❏ More than 4-year college degree
Evaluation of California’s Quality of Care Report Card50
11. What language do you mainly speak at home? Choose one.
❏ English ❏ Japanese ❏ Pilipino (Tagalog or Filipino)
❏ Spanish ❏ Korean ❏ Vietnamese
❏ Cantonese ❏ Portuguese ❏ Other (please write in) _____________________
Thank You.
Please return the questionnaire in the enclosed stamped envelope to:
Center for Health Services Research in Primary CareUniversity of California, Davis
2103 Stockton Blvd., Suite 2224Sacramento, California 95817
PART I – INTRODUCTION(10-15 minutes)Introduction to packets placed at each seat – Packet includes informed consent (2 copies), payment voucher (2 copies), OPA
Report Card, 1-page questionnaire, notepaper, name tag. Complete consent forms and payment vouchers (sign one, keep one), questionnaire. RA collects all paperwork.
Ground rules - Respect for privacy and confidentiality; one person at a time; food & drinksParticipant introductions.
PART II - BACKGROUND INFORMATION (10-15 minutes)“Why are we here? This is a guided group discussion about the OPA HMO Report Card, available in print and on the web site: www.opa.ca.gov/report_card. The State produces this as a tool for consumers in selecting managed health plans and wants to evaluate the usefulness of this effort to inform consumers. The California Office of the Patient Advocate has contracted with UC Davis, Center for Health Services Research, to conduct a comprehensive evaluation of the HMO Report Card.”
“Where does this information come from? The Health Plans and Medical Groups that have their names in here have provided the State of California with this information on a voluntary basis. Some of the information comes from surveys of patients who are members of the different HMOs. Other information comes from the administrative records of the plans or a sample of medical records for patients who belong to the plans.”
“Let’s begin by looking at the Booklet in your packets.”
Describe the HMO Quality Report Card effort, including the relationship between HMOs (health plans) and medical groups. Refer participants to page 1 of the OPA Report Card Booklet for an answer to the question “What’s the difference between an HMO and a Medical Group?” Read the following,
• Your HMO provides services through a network of doctors;• Your doctor will be in a medical group that has a contract with your HMO.• Both the HMO and medical group share the responsibility of meeting your health care needs.
“Some (but not all) of the HMOs and medical groups available in the (Sacramento) area provide information to the state for presentation in the Quality of Care Report Card.”
“There are 8 HMOs in the (Sacramento) area (with Medicare HMO plan name in parenthesis) that participate in the Quality of Care Report Card:
• Aetna Health Care of California (Aetna “Golden” or Aetna “Golden Choice”)• Blue Cross HMO – California Care (“Senior Secure”)• Blue Shield of CA (“Blue Shield 65 Plus” LA area)• CIGNA HealthCare (no separate Medicare plan)• Health Net (“Seniority Plus”)• Kaiser Permanente North (N. CA only - “Senior Advantage”)• Kaiser Permanente South (S. CA only - “Senior Advantage”)• PacifiCare of CA (“Secure Horizons”)• Universal Care (S. CA only – no Medicare)• Western Health Advantage (“WHA Care Plus”)
Evaluation of California’s Quality of Care Report Card52
“There are several Medical Groups in the (Sacramento) area. 8 participate in the Quality of Care Report Card. They are:• Golden State Physicians• Hill Physicians• Kaiser Permanente (Sacto area)• Sutter Independent Physicians• Sutter Medical Group• Sutter West Medical Group• UC Davis Medical Group• Woodland Clinic
“Individual doctors belong to just one medical group. But his or her medical group could have contracts with more than one of the HMOs.”
PART III – DISCUSSION OF THE QUALITY REPORT CARD(60-75 minutes)
For groups of individuals who were recruited from OPA logs of requests for the report card:“Some of you here today may have seen this booklet before. The Office of the Patient Advocate keeps track of requests for the booklet and some of you were contacted from OPAs lists.”
General feedback and evaluation “How many of you recall seeing this booklet before?” “Do you recall seeing it or calling or e-mailing OPA to get a copy”? “How did you hear about the OPA Report Card?” “Why did you request the Report Card?” “Now that you have had a few minutes to look this over, I would like to know what you think of the booklet?” “Is there any page that gets your attention first?”
Feedback and evaluation of star chart and opening page for HMOs “Please turn to page 3 with the “HMO Quality Statewide Ratings”. Go to web page or slide with HMO star chart. “You’ll notice that this page shows stars for the HMOs for 5 different quality areas.” “This same chart is available on the OPA report card website” “How useful do you think it is to know how many stars each HMO has?”“What do you think of the 5 summary measures given here?”“Which measures seems the best/worst, most/least useful?”
• Care for Staying Healthy• Care for Getting Better• Care for Living with Illness• Doctor Communication & Services• Plan Service
Feedback and evaluation of specific measures for HMOs“Ok now I would like to show you the information that goes into assigning those stars. For each of those 5 quality categories, there are several different measures or data elements that have been summarized into the ‘star’. I would like to show you some of this more detailed information and hear what you think about it”.
Go to web page or slide which lists the specific measures for the quality categories above. Begin with the slide entitiled “Care for Staying Healthy”, ask the questions below, then repeat for the other 4 categories.“Here are the # pieces of information that are summarized into the star for the category ‘Care for Staying Healthy’.” Read the header for the page.
“Which of these more specific pieces of information is most interesting or useful to you?”
53Appendix – Data Collection Instruments
“If you had to pick one item to take a closer look at or would give more weight to in making a decision about which HMO is best, which would it be?” Go around the room and give everyone a chance to say which measure they would look at.
“If you had to pick one item that you probably would ignore or give no weight to in making a decision about which HMO is best, which would it be?” Go around the room and give everyone a chance to say which measure they would NOT look at.
“Ok, since most people said they were interested in (specific measure), let’s take a look at how the HMOs in (Sacramento) do on that measure” Go to web page or slide with the specific results (bar chart with percentages) for measure selected by most group members. Go to more than one if no clear preference.
“What does this chart tell you about the HMOs? Is it what you expected? How helpful would this information be for you if you were selecting an HMO? Even if you were not in the process of selecting an HMO, would you want to know this about your HMO?”
Listen for or probe for feedback on issues such as source of the data, trust in the data, misunderstandings of what the measure or percentages mean, small differences may not be meaningful. Attempt to minimize reflections on personal experiences. When people go there, ask them:
“OK, so how would you weigh the experiences of your family, friends, yourself, compared to this type of information when selecting a health plan?”
When an opportunity to discuss trust in data occurs, ask:“As I mentioned before, some information here comes from medical records and some comes from patient surveys. What do you think of the different types of data? Which do you think is more trustworthy, accurate, useful?”
When an opportunity to discuss value of quality information compared to cost, ask:“How would you weigh the information here compared to information about how much the HMO costs you in terms of co-payments and premiums and prescriptions?”“If you could pick a plan that did really well on these measures, would you choose it even if it was going to cost more?”
Repeat the questions and discussion above for each of the 5 quality categories (i.e., which measure is most and least useful – each member states their ideas, review detailed chart for at least one specific measure, how would they weigh this data in their decision).
Feedback and evaluation of star chart and opening page for Medical Groups “Please turn to page 6 ‘Medical Group Quality – Sacramento and Central California”. Go to the web page or slide with that title showing the 4 quality categories.”
“Ok, now I would like to show you the information that goes into assigning those stars to the Medical Groups. For medical groups, there are 4 quality categories, and just as for the HMOs, there are several different measures or data elements that have been summarized into the ‘star’. I would like to show you some of this more detailed information and hear what you think about it”.“What do you think of the 4 measures of Medical Group quality?” “Which measures seems the best/worst, most/least useful?”
• Overall Rating of Care• Getting Treatment and Specialty Care• Communicating with Patients• Timely Care and Service
Evaluation of California’s Quality of Care Report Card54
Note that the category ‘Overall Rating of Care’ contains only a single specific measure – ‘health care highly rated’. This is the only category that has only one specific measure. It is not as important to discuss it in detail, but groups should be given a chance to view the results here. Then move on to the discussion of the other 3 categories.
Feedback on specific measures for Medical Groups“Here are the # pieces of information that are summarized into the star for the category ‘Getting Treatment and Specialty Care.” Go to the web page with that title and read the header for the page.
“Which of these more specific pieces of information is most interesting or useful to you?” “If you had to pick one item to take a closer look at or would give more weight to in making a decision about which medical group is best, which would it be?” Go around the room and give everyone a chance to say which measure they would look at.
“If you had to pick one item that you probably would ignore or give no weight to in making a decision about which medical group is best, which would it be?” Go around the room and give everyone a chance to say which measure they would NOT look at.
“Ok, since most people said they were interested in (specific measure), let’s take a look at how the medical groups in (Sacramento) do on that measure” Go to web page or slide with the specific results (bar chart with percentages) for measure selected by most group members. Go to more than one if no clear preference.
“What does this chart tell you about the medical groups? Is it what you expected? How helpful would this information be for you if you were selecting a medical group or doctor? Even if you were not in the process of selecting a medical group or doctor, would you want to know this about your HMO?”
Listen for or probe for feedback on issues such as source of the data, trust in the data, misunderstandings of what the measure or percentages mean, small differences may not be meaningful. Attempt to minimize reflections on personal experiences. When people go there, ask them:
“OK, so how would you weigh the experiences of your family, friends, yourself, compared to this type of information when selecting a medical group or doctor?”
When an opportunity to discuss value of quality information compared to cost, ask:How would you weight the information here compared to information about how much the medical group costs you in terms of co-payments and prescriptions? If you could pick a plan that did really well on these measures, would you choose it even if it was going to cost more?”
When an opportunity to discuss trust in data occurs, ask:“As I mentioned before, some information here comes from medical records and some comes from patient surveys. All of the data on the medical groups comes from surveys of patients. What do you think of this? Do you think patient surveys are more or less trustworthy, accurate, useful?”
Repeat the questions and discussion above for each of the other 2 medical group quality categories (i.e., which measure is most and least useful – each member states their ideas, review detailed chart for at least one specific measure, how would they weigh this data in their decision).
55Appendix – Data Collection Instruments
PART IV – ADDITIONAL DISCUSSION IF TIME AVAILABLE.“If you had a choice, would you rather see this information in the printed booklet or access it on the web site?”
“How do you think the State should make this available to consumers? Right now, it is available on request, or through Walgreens and public libraries.”
PART V – FURTHER SUGGESTIONS, CLOSING(10-15 minutes)
“Thinking now about all that we’ve discussed, is there anything you would like to add or to clarify that you may have thought about during our discussion?”
Thank you.
57Appendix – Data Collection Instruments
Appendix – Data Collection Instruments
Key Informant Interview Guide
OBTAIN VERBAL CONSENT OF PARTICIPANT:
Date of Interview: _______________________ Time of Interview (Start): ________
I want to verify with you that you are aware that:• this is a research project about your use of California’s Quality Report Card: YES NO• nothing that identifies you or your organization will appear in any analyses, tabulations, publications, or presentations emanating from this research: YES NO• you give your consent to participate in this interview: YES NO
Time of Consent ________________________ Interviewers Initials: ________
Time of Interview (Finish) __________
PART I – INTRODUCTION & FAMILIARITY WITH REPORT CARDI have a number of questions about California’s Quality Report Card, available in print and on the web site: www.opa.ca.gov/report_card. The California Office of the Patient Advocate produces the Report Card as a tool for consumers in selecting managed health plans. The State has contracted with UC Davis, Center for Health Services Research, to conduct a comprehensive evaluation of California’s Quality Report Card. As part of the evaluation, we are interviewing representatives of the organizations whose performance is included in the report. We are interested in your opinion about the publication of this information and whether it has had any impact on your organization.
1. Are you familiar with the Quality Report Card? If no, skip to Part II. If yes, a. Do you recall seeing the booklet or accessing the website when it was released at the end of the fall 2003? b. How much time did you spend looking at the booklet or the information on the website? c. Do you recall whether you discussed the Report Card or shared your organization’s results with anyone else? Who
did you discuss it with (e.g., medical staff, quality improvement, board of directors, public relations)?
Part II - USEFULNESS FOR QUALITY IMPROVEMENT (Primary respondent – quality improvement director or medical director)We are interested in whether the information in the Report Card has an impact on quality improvement in managed care organizations. I am going to read the list of measures included in the Report Card and I would like you to tell me whether you think the measure is a useful one for quality improvement efforts in your organization. I would like you to use a scale of 1 to 6, where 1 is “not at all useful for quality improvement” and 6 is “extremely useful for quality improvement”.
Evaluation of California’s Quality of Care Report Card58
1. How useful do you think the following information in the Quality Report Card is for quality improvement?
For Interviewees from HMOs:Care for Staying Healthy – How well HMOs and their doctors help members avoid illness and find problems early. Adolescent immunizationsBreast cancer screeningCervical cancer screeningChildhood immunizationsChlamydia screening age 16-20Chlamydia screening age 21-26Visits after deliveryVisits during pregnancy
Care for Getting Better – How well HMOs and their doctors help members get the right treatment to recover from serious illness such as heart disease and depression. Anti-depressant medication – initial treatmentAnti-depressant medication – ongoing treatmentControlling cholesterol for patients with heart problemsFollow-up visit after mental illness hospital stayHeart attack medicationTesting cholesterol for patients heart problemsTreatment visits for depression
Care for Living with Illness - How well HMOs and their doctors take care of members who have chronic illnesses such as high blood pressure, asthma, and diabetes.Asthma medicine for adolescentsAsthma medicine for adultsAsthma medicine for childrenControlling blood sugar for patients with diabetesControlling cholesterol for patients with diabetesControlling high blood pressureEye exam for patients with diabetesTesting blood sugar for patients with diabetesTesting cholesterol for patients with diabetesTesting kidney function for patients with diabetes
Doctor Communication and Services – Patients’ ratings of the quality of communication and service received from the HMO’s doctors and their staffs. Doctor communications (listen carefully, explain clearly)Getting care quicklyHealth care highly ratedHelpful office staffPersonal doctor highly ratedSpecialist highly rated
Plan Service – Patients’ ratings of how well HMOs help members get the care they need and provide customer service to help avoid “insurance hassles”.Complaints handled quickly (within one week)Customer service (helpful staff, clear materials, no paperwork problems)Getting needed care (no delays)Overall plan ratingPaying claims
59Appendix – Data Collection Instruments
For Interviewees from medical groups:-
Getting Treatment and Specialty Care – How patients rated the medical group in ease of getting tests or treatments and seeing a specialist. Aware of your specialty careEasy to see a specialistGetting tests and treatmentGetting to specialist: Routine careGetting to specialist: Urgent Care
Communicating with Patients – How patients rated the group’s doctors and staff in listening carefully, explaining clearly and spending enough time with them.Call back about your test resultsDoctor explains clearly Doctor instructs patient about careDoctor listens carefullyDoctor spends time with patient
Timely Care and Service – How patients rated the medical group for scheduling and keeping appointments on time, getting care after hours and by phone, and seeing the doctor when needed.Getting appointments soonAfter hours helpHelp over the phoneHelpful office staffSeeing doctor quickly: Urgent careSeeing doctor soon: Routine careSeeing doctor: Preventive careUrgent problems seen quickly Visits start on time
Overall Care Rating – How patients rated the care overall from the doctors and other staff at the medical group Health Care Highly Rated
2. We are interested in any quality improvement activities undertaken by your organization in the year prior to the release of the Quality Report Card or in the 6 months since the Report Card was released (Sept 30, 2003). These might be activities in the areas covered by the report card or other areas. Some examples of quality improvement activities would be providing guidelines for “best practices” or sharing benchmark information with providers, sending reminders for preventative care to providers or patients, collecting data from medical records and sharing results with providers, instituting a new or revised process of care, changing the way data are reported or how frequently, board or staff discussions about quality, instituting the use of cross-functional work groups, workshops or trainings in doctor/provider communication, and using incentives, rewards, and recognition to support quality improvement efforts.
a. Please describe any quality improvement activities that you recall in the last 18 months.
b. Do you feel that any of these activities were undertaken as a response to your organizations performance in the Quality Report Card?
c. If the following have not been mentioned, ask: Are there any quality improvement activities in your organization related to any of the following: - computerized physician order entry? - computerized medical records? - other information systems infrastructure?
Evaluation of California’s Quality of Care Report Card60
3. On a scale of 1 to 6, where 1 is “not at all useful” and 6 is “very useful”, how useful overall do you think the information in the Quality Report Card is for quality improvement?
4. How do you expect your organization to perform in next years Quality Report Card (September 2004)? Do you think your score will improve compared to 2003, be worse than 2003, be about the same, or are you not sure?
Part III - IMPACT ON MARKET SHARE AND REPUTATION (Primary respondent –CEO or medical director)
I would like to ask you about some ways in which your organization may have used the information in the Quality Report Card.
1. Do you recall any marketing or advertising of your organization’s performance in the Quality Report Card? If yes, please describe. If no, why do you think your organization did not use the information in the Report Card for marketing or
advertising?
2. Do you recall any newspaper or TV or other media coverage of your organization’s performance in the Quality Report Card?
If yes, please describe. If no, why do you think there was no media coverage of your organization’s performance in the Report Card?
3. Do you think the Quality Report Card will enhance or detract from your organizations public image? On a scale of 1 to 6, where 1 is “very likely to detract” and 6 is “very likely to enhance”, do you think the Quality Report Card detracts from your organizations public image or does it enhance your organizations public image?
4. Do you think the Quality Report Card will enhance or detract from your organizations market share? On a scale of 1 to 6, where 1 is “very likely to detract” and 6 is “very likely to enhance”, do you think the Quality Report Card detracts from your organizations market share or does it enhance your organizations market share?
PART IV – GENERAL EVALUATION AND ATTITUDES1. On a scale of 1 to 6, where 1 is “not at all” and 6 is “extremely”, how valid do you think the data in the Quality
Report Card are?
2. On a scale of 1 to 6, where 1 is “not at all” and 6 is “extremely well”, how well do you think the data in the Quality Report Card reflect the actual performance of your organization / group?
3. On a scale of 1 to 6, where 1 is “not at all” and 6 is “extremely appropriate”, how appropriate do you think the information in the Quality Report Card is for the public’s use?
4. What suggestions do you have for improving the Quality Report Card?
5. Who do you think should be responsible for reporting provider quality data to consumers?
6. What do you think is in the future for public reporting of quality information in health care?
7. Thinking now about all that we’ve discussed, is there anything you would like to add or to clarify that you may have thought about during our discussion?
Thank you.
Evaluation of California’s Quality of Care Report Card62
Table 1: HMO Quality Indicators: Specific Results Pages Viewed - California’s Quality of Care Report Card 2003/2004 Website
Specific Measure Description # ViewsQuality Category
Health Topic
Overall Plan Rating% of members who rated their health plan highly overall—8, 9 or 10 on a 0-10 scale.
1324 Plan Service
Treatment Visits For Depression
% of depressed patients who were seen at least 3 times during the 12-week initial treatment phase
1152Care for Getting Better
Mental Health
Complaints Handled Quickly
% of members who reported that the plan resolved their complaint within one week.
996 Plan Service
Getting Needed Care
Members ratings of their HMOs on helping members get the care they need
965 Plan Service
Breast Cancer Screening
% of women enrolled in the HMO, ages 52-69, who had a mammogram to test for breast cancer during the past two years
954Care for Staying Healthy
Women’s Health
Customer ServiceMembers ratings of their HMOs on providing good customer service
934 Plan Service
Controlling Cholesterol
% of members’ whose cholesterol levels were well controlled after a heart attack or other serious heart problem/surgery
857Care for Getting Better
Heart Care
Anti-depressant Medication Ongoing Treatment
% of depressed patients who remained on anti-depressant medication for a 6-month on-going care period that followed the initial treatment
820Care for Getting Better
Mental Health
Paying ClaimsMembers ratings of their HMOs on paying claims correctly and quickly
809 Plan Service
Personal Doctor Highly Rated
% of members who rated their personal doctor highly — 8, 9 or 10 on a 0-10 scale.
808Doctor Communication and Services
Controlling Blood Sugar
% of patients with diabetes who had well-controlled blood sugar levels
788Care for Living with Illness
Diabetes
Getting Care Quickly
Members ratings on how quickly and easily they got care and service from their doctors and office staff.
781Doctor Communication and Services
Anti-depressant Medication Initial Treatment
% of HMO enrollees who were treated for depression that remained on anti-depressant medication for a 12-week initial treatment phase
751Care for Getting Better
Mental Health
Heart Attack Medication
% of HMO members who had a heart attack that received beta blocker drugs after the attack to help avoid a repeat heart attack or stroke or to ease pain
735Care for Getting Better
Heart Care
Specialist Highly Rated
% of members who rated their specialist doctor highly — 8, 9 or 10 on a 0-10 scale.
690Doctor Communication and Services
Cervical Cancer Screening
% of women enrolled in the HMO, ages 21-64, who had a Pap smear to test for cervical cancer during the past three years
672Care for Staying Healthy
Women’s Health
Doctor Communications
Members ratings of how well their doctors communicate with them
638Doctor Communication and Services
Health Care Highly Rated
% of members who rated their health care highly — 8, 9 or 10 on a 0-10 scale.
632Doctor Communication and Services
63Appendix – Data Tables
Testing Cholesterol% of members who had their cholesterol level checked after a heart attack or other serious heart problem/surgery
619Care for Getting Better
Heart Care
Visits During Pregnancy
% of pregnant women enrolled in the HMO who began prenatal care during the first 13 weeks of pregnancy
616Care for Staying Healthy
Women’s Health
Eye Exam% of patients with diabetes who had an eye exam to watch for disease that can lead to blindness
588Care for Living with Illness
Diabetes
Follow-up Visit After Mental Illness Hospital Stay
% of HMO enrollees who have been hospitalized for a mental illness that were seen by a mental health provider within 30 days after leaving the hospital
554Care for Getting Better
Mental Health
Testing Kidney Function
% of patients with diabetes who had their kidney function tested to watch for signs of kidney damage
524Care for Living with Illness
Diabetes
Testing Blood Sugar% of patients with diabetes who had their blood sugar level tested to help manage their disease
509Care for Living with Illness
Diabetes
Controlling Cholesterol for Patients with Diabetes
% of patients with diabetes who had well-controlled cholesterol levels.
478Care for Living with Illness
Diabetes
Visit After Delivery% of women had a postpartum visit 21-56 days after delivery
475Care for Staying Healthy
Women’s Health
Controlling High Blood Pressure
% of members diagnosed with high blood pressure who have had their blood pressure brought under control
425Care for Living with Illness
Helpful Office StaffMembers ratings of the helpfulness of their doctor’s office staff
398Doctor Communication and Services
Testing Cholesterol for Patients with Diabetes
% of patients with diabetes who had their cholesterol level checked to watch for signs of heart disease
393Care for Living with Illness
Diabetes
Childhood Immunizations
% of children enrolled in the HMO who received, by age two, the four vaccinations recommended by the CDC and AAP
375Care for Staying Healthy
Adolescent Immunizations
% of adolescents enrolled in the HMO who received, by age 13, the second booster dose of measles, mumps and rubella (MMR) and Hepatitis B vaccinations
306Care for Staying Healthy
Chlamydia Screening Age 16-20
% of sexually active women enrolled in the HMO ages 16-20 who were tested for chlamydia
262Care for Staying Healthy
Women’s Health
Asthma Medicine for Adults
% of adult members with asthma who got the right medicine—called anti-inflammatories—for their asthma
260Care for Living with Illness
Chlamydia Screening Age 21-26
% of sexually active women enrolled in the HMO ages 21-26 who were tested for chlamydia
251Care for Staying Healthy
Women’s Health
Asthma Medicine for Children
% of child members with asthma who got the right medicine — called anti-inflammatories — for their asthma
203Care for Living with Illness
Asthma Medicine for Adolescents
% of adolescent members with asthma who got the right medicine — called anti-inflammatories — for their asthma
95Care for Living with Illness
Evaluation of California’s Quality of Care Report Card64
Table 2: Medical Group Quality Indicators: Specific Results Pages Viewed California’s Quality of Care Report Card 2003/2004 Website
Specific Measure Description # Views Quality Category
Easy to See a Specialist% of patients who reported not have a problem seeing a specialist
780Getting Treatment and Specialty Care
After Hours Help
% of patients who reported getting the care that they needed from their doctor’s office after it was closed for the day
695 Timely Care and Service
Getting Tests and Treatment% of patients who reported not have a problem getting care or tests that they or a doctor believed necessary
600Getting Treatment and Specialty Care
Getting Appointments Soon% of patients who reported getting appointments as soon as they wanted.
595 Timely Care and Service
Getting to Specialist: Routine Care
% of patients who reported being seen by a specialist for routine care as soon as they needed.
471Getting Treatment and Specialty Care
Urgent Problems Seen Quickly
% of patients who reported getting care as soon as they wanted for an illness or injury.
449 Timely Care and Service
Aware of Your Specialty Care
% of patients who reported that their personal doctor was informed and up-to-date about the patient’s specialty care
432Getting Treatment and Specialty Care
Getting to Specialist: Urgent Care
% of patients who reported being seen by specialist for an urgent problem as soon as they needed
424Getting Treatment and Specialty Care
Doctor Spends Time with Patient
% of patients who reported that their doctors spend enough time with them.
413 Communicating with Patients
Seeing Doctor Quickly: Urgent Care
% of patients who reported getting illness or injury care from their personal doctor as soon as they wanted
368 Timely Care and Service
Seeing Doctor Soon: Routine Care
% of patients who reported getting routine care from their personal doctor as soon as they wanted
367 Timely Care and Service
Doctor Listens Carefully% of patients who reported that their doctors listen carefully to them
366 Communicating with Patients
Visits Start on Time
% of patients who reported waiting in the doctor’s office fewer than 15 minutes past the appointment time to begin their visit
364 Timely Care and Service
Call Back About Test Results% of patients who reported that their doctor or the office staff follow-up to give them their test results
360 Communicating with Patients
Help Over the Phone% of patients who reported getting the advice or help that they needed over the phone during regular office hours
327 Timely Care and Service
Doctor Explains Clearly% of patients who reported that their doctors explain matters clearly to them.
321 Communicating with Patients
65Appendix – Data Tables
Health Care Highly RatedHow patients rated their health care overall
307 Overall health care score
Helpful Office Staff % of patients who reported that the doctor’s office staff was helpful
291 Timely Care and Service
Seeing Doctor: Preventive Care
% of patients who reported getting preventive care exams and screenings from their personal doctor as soon as they wanted
284 Timely Care and Service
Doctor Instructs Patient About Care
% of patients who reported that their doctor or nurse gives clear instruction about how to take care of their health problem
179 Communicating with Patients
Evaluation of California’s Quality of Care Report Card66
Table 3: HMO Informants’ Ratings of the Usefulness of Quality Indicators included in California’s Quality of Care Report Card
Quality Category Measure Description
Usefulness for Quality Improvement
(% rating measure as “very” or “extremely”
useful)
Plan Service Customer ServiceMembers ratings of their HMOs on providing good customer service
60
Plan ServiceOverall Plan Rating
% of members who rated their health plan highly overall—8, 9 or 10 on a 0-10 scale.
50
Plan ServiceGetting Needed Care
Members ratings of their HMOs on helping members get the care they need
50
Plan ServiceComplaints Handled Quickly
% of members who reported that the plan resolved their complaint within one week.
40
Plan Service Paying ClaimsMembers ratings of their HMOs on paying claims correctly and quickly
20
Care for Getting Better
Controlling Cholesterol
% of members’ whose cholesterol levels were well controlled after a heart attack or other serious heart problem/surgery
50
Care for Getting Better
Testing Cholesterol% of members who had their cholesterol level checked after a heart attack or other serious heart problem/surgery
50
Care for Getting Better
Follow-up Visit After Mental Illness Hospital Stay
% of HMO enrollees who have been hospitalized for a mental illness that were seen by a mental health provider within 30 days after leaving the hospital
50
Care for Getting Better
Heart Attack Medication
% of HMO members who had a heart attack that received beta blocker drugs after the attack to help avoid a repeat heart attack or stroke or to ease pain
40
Care for Getting Better
Anti-depressant Medication Ongoing Treatment
% of depressed patients who remained on anti-depressant medication for a 6-month on-going care period that followed the initial treatment
30
Care for Getting Better
Anti-depressant Medication Initial Treatment
% of HMO enrollees who were treated for depression that remained on anti-depressant medication for a 12-week initial treatment phase
30
Care for Getting Better
Treatment Visits For Depression
% of depressed patients who were seen at least 3 times during the 12-week initial treatment phase
20
Doctor Communication and Services
Getting Care Quickly
Members ratings on how quickly and easily they got care and service from their doctors and office staff.
70
Doctor Communication and Services
Specialist Highly Rated
% of members who rated their specialist doctor highly — 8, 9 or 10 on a 0-10 scale.
60
Doctor Communication and Services
Doctor Communications
Members ratings of how well their doctors communicate with them
60
Doctor Communication and Services
Personal Doctor Highly Rated
% of members who rated their personal doctor highly — 8, 9 or 10 on a 0-10 scale.
50
67Appendix – Data Tables
Doctor Communication and Services
Helpful Office StaffMembers ratings of the helpfulness of their doctor’s office staff
40
Care for Staying Healthy
Breast Cancer Screening
% of women enrolled in the HMO, ages 52-69, who had a mammogram to test for breast cancer during the past two years
60
Care for Staying Healthy
Cervical Cancer Screening
% of women enrolled in the HMO, ages 21-64, who had a Pap smear to test for cervical cancer during the past three years
50
Care for Staying Healthy
Visits During Pregnancy
% of pregnant women enrolled in the HMO who began prenatal care during the first 13 weeks of pregnancy
50
Care for Staying Healthy
Chlamydia Screening Age 16-20
% of sexually active women enrolled in the HMO ages 16-20 who were tested for chlamydia
50
Care for Staying Healthy
Visit After Delivery% of women had a postpartum visit 21-56 days after delivery
40
Care for Staying Healthy
Childhood Immunizations
% of children enrolled in the HMO who received, by age two, the four vaccinations recommended by the CDC and AAP
40
Care for Staying Healthy
Adolescent Immunizations
% of adolescents enrolled in the HMO who received, by age 13, the second booster dose of measles, mumps and rubella (MMR) and Hepatitis B vaccinations
40
Care for Staying Healthy
Chlamydia Screening Age 21-26
% of sexually active women enrolled in the HMO ages 21-26 who were tested for chlamydia
40
Care for Living with Illness
Controlling Blood Sugar
% of patients with diabetes who had well-controlled blood sugar levels
50
Care for Living with Illness
Testing Cholesterol for Patients with Diabetes
% of patients with diabetes who had their cholesterol level checked to watch for signs of heart disease
50
Care for Living with Illness
Testing Blood Sugar
% of patients with diabetes who had their blood sugar level tested to help manage their disease
50
Care for Living with Illness
Controlling Cholesterol for Patients with Diabetes
% of patients with diabetes who had well-controlled cholesterol levels.
50
Care for Living with Illness
Asthma Medicine for Children
% of child members with asthma who got the right medicine — called anti-inflammatories — for their asthma
50
Care for Living with Illness
Controlling High Blood Pressure
% of members diagnosed with high blood pressure who have had their blood pressure brought under control
40
Care for Living with Illness
Eye Exam% of patients with diabetes who had an eye exam to watch for disease that can lead to blindness
40
Care for Living with Illness
Testing Kidney Function
% of patients with diabetes who had their kidney function tested to watch for signs of kidney damage
40
Care for Living with Illness
Asthma Medicine for Adults
% of adult members with asthma who got the right medicine—called anti-inflammatories—for their asthma
40
Evaluation of California’s Quality of Care Report Card68
Table 4: Medical Group Informants’ Ratings of the Usefulness of Quality Indicators included in California’s Quality of Care Report Card
Quality Category Measure Description
Usefulness for Quality Improvement (% rating measure as “very” or “extremely” useful)
Overall health care score
Health Care Highly Rated
How patients rated their health care overall
Getting Treatment and Specialty Care
Getting Tests and Treatment
% of patients who reported not have a problem getting care or tests that they or a doctor believed necessary
61
Getting Treatment and Specialty Care
Getting to Specialist: Routine Care
% of patients who reported being seen by a specialist for routine care as soon as they needed.
50
Getting Treatment and Specialty Care
Easy to See a Specialist% of patients who reported not have a problem seeing a specialist
54
Getting Treatment and Specialty Care
Getting to Specialist: Urgent Care
% of patients who reported being seen by specialist for an urgent problem as soon as they needed
50
Getting Treatment and Specialty Care
Aware of Your Specialty Care
% of patients who reported that their personal doctor was informed and up-to-date about the patient’s specialty care
39
Timely Care and Service
After Hours Help
% of patients who reported getting the care that they needed from their doctor’s office after it was closed for the day
73
Timely Care and Service
Help Over the Phone
% of patients who reported getting the advice or help that they needed over the phone during regular office hours
70
Timely Care and Service
Seeing Doctor Quickly: Urgent Care
% of patients who reported getting illness or injury care from their personal doctor as soon as they wanted
66
Timely Care and Service
Seeing Doctor: Preventive Care
% of patients who reported getting preventive care exams and screenings from their personal doctor as soon as they wanted
66
Timely Care and Service
Seeing Doctor Soon: Routine Care
% of patients who reported getting routine care from their personal doctor as soon as they wanted
62
Timely Care and Service
Getting Appointments Soon
% of patients who reported getting appointments as soon as they wanted.
58
Timely Care and Service
Urgent Problems Seen Quickly
% of patients who reported getting care as soon as they wanted for an illness or injury
55
Timely Care and Service
Helpful Office Staff % of patients who reported that the doctor’s office staff was helpful
55
69Appendix – Data Tables
Timely Care and Service
Visits Start on Time
% of patients who reported waiting in the doctor’s office fewer than 15 minutes past the appointment time to begin their visit
42
Communicating with Patients
Doctor Explains Clearly% of patients who reported that their doctors explain matters clearly to them.
78
Communicating with Patients
Call Back About Test Results
% of patients who reported that their doctor or the office staff follow-up to give them their test results
74
Communicating with Patients
Doctor Listens Carefully
% of patients who reported that their doctors listen carefully to them
70
Communicating with Patients
Doctor Spends Time with Patient
% of patients who reported that their doctors spend enough time with them.
70
Communicating with Patients
Doctor Instructs Patient About Care
% of patients who reported that their doctor or nurse gives clear instruction about how to take care of their health problem