Proceedings of the International Symposium on Room Acoustics, ISRA 2010 29–31 August 2010, Melbourne, Australia Evaluation of concert hall auralization with virtual symphony orchestra Jukka Pätynen and Tapio Lokki Aalto University School of Science and Technology, Department of Media Technology, P.O.Box 15400, FI-00076 Aalto, Finland PACS: 43.55.Ka, 43.55.Ta, 43.55.Gx ABSTRACT Authenticity of the simulation of room acoustics is evaluated by comparing auralizations with real recordings. Impulse responses are recorded in two concert halls with 34 loudspeakers positioned on the stage in the shape of an orchestra and a 3D microphone probe for spatial reproduction. The acoustics of the same concert halls are simulated with acoustics modeling software. B-format impulse responses are calculated by using the identical source and receiver positions as in the real halls. Additionally, two processing methods are applied to the simulated responses in order to decrease the difference in acoustical impression. Objective room acoustic parameters between the real and simulated halls are compared, and a listening test utilizing convolutions with anechoic orchestral music is organized. The results suggest that the subjects can be categorized in two groups having preference of brightness or naturalness. Depending on the music style, auralizations with processed responses are assessed equal or better than the real hall in terms of instrument balance and brightness. INTRODUCTION Many current acoustic design products offer auralization capa- bilities. Applicable cases for auralization can be for instance industry and noise transmission, acoustics in public spaces, or ultimately, concert hall design. In the latter use, the require- ments for authenticity are very high. Previously, it has been claimed that auralization can provide authentic results with hardly audible differences [1]. In spite of the gradual improvements in the modeling techniques, authenticity of the auralizations produced by modeling software is a subject for debate on the practical field. Presuming that such auralizations have defects, this study aims to resolve the auralization shortcomings with regard to the authenticity, i.e., what are the existing major flaws and what kind of issues should be improved. Evaluation of the auralization quality is a multidimensional problem. An overview discussing various issues, including lis- tening test methodology, reference measurements, anechoic stimuli, modeling, and reproduction, has been published by Lokki and Savioja [2]. Lokki [3] has collected a summary of the previous studies on auralization evaluations. Some recent related research is presented in the following. Related work Choi and Fricke [4] have performed a comparison between two real concert halls and auralizations. Room acoustical pa- rameters were analyzed, and measured and simulated binau- ral room impulse responses were convolved with a segment of single-channel monaural anechoic music. The convolved stimuli were presented to the subjects with headphones. They found significant differences between subjective preferences for auralizations and recorded music, while the results were inconclusive. Saher et al. [5] have studied the quality of auralization by com- paring binaural in-situ recordings and computer simulations of speech in a small room. Subjective descriptors such as "sense of space", "timbre", and "reverberance" were used, and spatial and sound color differences were found between the auralizations and in-situ recordings. Nilsson and Ekman [6] have compared auralizations and in-situ recordings with a single source in a classroom and an audi- torium. Subjects assessed the samples by realism, similarity, intelligibility and sound quality. Auralized sound was consid- ered harder, less full, less dull and more metallic than in-situ recordings. Vigeant et al. have presented a comparison between auraliza- tions having various source type and orchestra configurations [7]. Results were investigated by objective parameters and sub- jective evaluations. Auralizations were found to be more realis- tic when multiple sources are used instead of a single source. In short, previous research has been concentrating on comparing in-situ recording with an auralization using a single source. On the other hand, comparisons with more complex configurations have been made only between different auralizations. Here, a large orchestra-like sound source is compared between real halls and their auralized counterparts. This paper presents first the used concert halls, the loudspeaker orchestra and their simulated counterparts. Second, two meth- ods devised for improving the realism in auralization are de- scribed, after which the objective comparison is summarized. Finally, the listening test method and the obtained subjective results are presented and discussed. ISRA 2010 1
Transcript
Proceedings of the International Symposium on Room Acoustics, ISRA 2010
29–31 August 2010, Melbourne, Australia
Evaluation of concert hall auralization with virtualsymphony orchestra
Jukka Pätynen and Tapio LokkiAalto University School of Science and Technology,
Department of Media Technology, P.O.Box 15400, FI-00076 Aalto, Finland
PACS: 43.55.Ka, 43.55.Ta, 43.55.Gx
ABSTRACT
Authenticity of the simulation of room acoustics is evaluated by comparing auralizations with real recordings. Impulseresponses are recorded in two concert halls with 34 loudspeakers positioned on the stage in the shape of an orchestra anda 3D microphone probe for spatial reproduction. The acoustics of the same concert halls are simulated with acousticsmodeling software. B-format impulse responses are calculated by using the identical source and receiver positionsas in the real halls. Additionally, two processing methods are applied to the simulated responses in order to decreasethe difference in acoustical impression. Objective room acoustic parameters between the real and simulated halls arecompared, and a listening test utilizing convolutions with anechoic orchestral music is organized. The results suggestthat the subjects can be categorized in two groups having preference of brightness or naturalness. Depending on themusic style, auralizations with processed responses are assessed equal or better than the real hall in terms of instrumentbalance and brightness.
INTRODUCTION
Many current acoustic design products offer auralization capa-bilities. Applicable cases for auralization can be for instanceindustry and noise transmission, acoustics in public spaces, orultimately, concert hall design. In the latter use, the require-ments for authenticity are very high. Previously, it has beenclaimed that auralization can provide authentic results withhardly audible differences [1].
In spite of the gradual improvements in the modeling techniques,authenticity of the auralizations produced by modeling softwareis a subject for debate on the practical field. Presuming thatsuch auralizations have defects, this study aims to resolve theauralization shortcomings with regard to the authenticity, i.e.,what are the existing major flaws and what kind of issues shouldbe improved.
Evaluation of the auralization quality is a multidimensionalproblem. An overview discussing various issues, including lis-tening test methodology, reference measurements, anechoicstimuli, modeling, and reproduction, has been published byLokki and Savioja [2]. Lokki [3] has collected a summary ofthe previous studies on auralization evaluations. Some recentrelated research is presented in the following.
Related work
Choi and Fricke [4] have performed a comparison betweentwo real concert halls and auralizations. Room acoustical pa-rameters were analyzed, and measured and simulated binau-ral room impulse responses were convolved with a segmentof single-channel monaural anechoic music. The convolvedstimuli were presented to the subjects with headphones. Theyfound significant differences between subjective preferencesfor auralizations and recorded music, while the results wereinconclusive.
Saher et al. [5] have studied the quality of auralization by com-paring binaural in-situ recordings and computer simulations ofspeech in a small room. Subjective descriptors such as "sense ofspace", "timbre", and "reverberance" were used, and spatial andsound color differences were found between the auralizationsand in-situ recordings.
Nilsson and Ekman [6] have compared auralizations and in-siturecordings with a single source in a classroom and an audi-torium. Subjects assessed the samples by realism, similarity,intelligibility and sound quality. Auralized sound was consid-ered harder, less full, less dull and more metallic than in-siturecordings.
Vigeant et al. have presented a comparison between auraliza-tions having various source type and orchestra configurations[7]. Results were investigated by objective parameters and sub-jective evaluations. Auralizations were found to be more realis-tic when multiple sources are used instead of a single source.
In short, previous research has been concentrating on comparingin-situ recording with an auralization using a single source. Onthe other hand, comparisons with more complex configurationshave been made only between different auralizations. Here, alarge orchestra-like sound source is compared between realhalls and their auralized counterparts.
This paper presents first the used concert halls, the loudspeakerorchestra and their simulated counterparts. Second, two meth-ods devised for improving the realism in auralization are de-scribed, after which the objective comparison is summarized.Finally, the listening test method and the obtained subjectiveresults are presented and discussed.
ISRA 2010 1
29–31 August 2010, Melbourne, Australia Proceedings of the International Symposium on Room Acoustics, ISRA 2010
b)
a)
0 m5152025 10
+ P1
+ P2
+ P3
+ P1
+ P2
+ P3
47 16
2221
2324
1920
110
13
14
15 1718
23
1112
56
89
24
47 16
2221
2324
1920
110
13
14
15 1718
23
1112
56
89
24
Figure 1: Plans of the concert halls with receiving positionsP1-P3. The loudspeaker orchestra layout is shown on the stages.a) Sello hall. b) Konservatorio hall.
HALL MEASUREMENTS
Two shoebox-type concert halls are used in this study. Thehalls are relatively small, but the stages are large enough toaccommodate a symphony orchestra. The Sello hall has 397seats, and the audience area has an ascending section. Thereis no balcony in this hall. The second hall, Konservatorio, hasslightly less seats, 354, on the main floor. The balcony canaccommodate 116 listeners. Floor plans of both halls are shownin equal scale in Fig. 1. The most prominent difference betweenthe halls is the more inclined main floor in the Sello hall. Inaddition, the Konservatorio hall walls have a dense, diffusingstructure pattern, while in Sello hall the otherwise smooth wallshave extrusions of different sizes (see Fig. 2).
The source used in the halls was a loudspeaker orchestra thatconsists of 34 loudspeakers positioned on a stage in a pre-defined form of a symphony orchestra (see Fig. 1). The principleof the loudspeaker orchestra is to function as a large sourcecapable of producing repeatable orchestral music. Details ofthe original version of the loudspeaker orchestra have beenpreviously presented in [8].
Here the loudspeaker orchestra was used for measuring the im-pulse responses from each of the 24 independent loudspeakerchannels. Few improvements were made to the original loud-speaker orchestra concept. Principally, nearly all loudspeakerspointed into the direction of the conductor. Two loudspeakersrepresenting the French horns were aligned to point backwardsto the characteristic direction of the instrument bell. In partof the channels representing the string instruments, two loud-speakers shared the same channel, the assisting loudspeakerwas on the stage floor pointing upwards. Therefore there were34 loudspeakers but only 24 channels. This arrangement waschosen for distributing the radiated sound energy more evenlyand thus improving the overall directivity closer to that of thereal string instruments [9].
The loudspeaker orchestra incorporated 26 Genelec 1029A, six
8030A, and two larger 1032A loudspeakers. 8030A and 1032Aloudspeakers were dedicated to the low frequency instrumentsdue to their better response at low frequencies. An overview ofthe installed loudspeaker orchestra is shown in Fig. 3b.
Room impulse responses were measured using a GRAS vectorintensity probe Type 50 VI-1 [10]. The probe enables the useof different distances between the microphone capsules. Twomeasurements were performed in each position using 25 mmand 100 mm spacers. The advantage here is that better figure-of-eight directivity patterns can be obtained for extended frequencyrange compared to the use of a single spacer. The two inten-sity probe measurements were converted to a pair of B-formatresponses.
Three receiving positions were used in both halls. The positionswere at corresponding distances from the loudspeaker orchestrain both halls. The locations for the receiving positions were alsoidentical in both halls with regard to the loudspeaker orchestra.Thus, the only variable being the surrounding concert hall (seeFig. 1). In the following, the analysis is concentrated mostly intotwo receiving positions, Sello P1 and Konservatorio P3. In SelloP1 the distance to the sources is small, while in KonservatorioP3 the sound field is very diffuse. Therefore they representdifferent conditions in hall acoustics. They are also used in theconsequent listening test.
The performance of the loudspeaker orchestra is shown in Fig. 4.The magnitude responses of music played with the loudspeakerorchestra is compared with an authentic, full-size professionalsymphony orchestra. The analyzed music piece is a 13 s passageform Beethoven’s Symphony no. 8, 1st movement, bars 13-17[11]. Both samples were recorded in Sello hall at position P2without audience. AKG C480K microphone with omnidirec-tional capsule was used for recording the authentic orchestra[12]. The figure indicates that the magnitude response of theloudspeaker orchestra is comparable to a real symphony orches-tra. The fundamental frequency of the lowest notes written inthe passage is approximately 52 Hz (G]1 with double basses).The largest difference is found at the lowest octave. The au-thentic orchestra had six double basses, while the loudspeakerorchestra contained only four double bass tracks.
Due to the applied solutions in the source and receiving config-urations, the measured room impulse responses are not exactlyimpulse responses in the standardized sense [13]. However forsimplicity, the measured and simulated responses are referredin the following as impulse responses.
HALL SIMULATIONS
The acoustic 3-D models were available from both Sello andKonservatorio halls. Odeon software [14] version 10.1 wasused to simulate the acoustics of the two concert halls. Themodels were obtained directly from the acoustic consultants,and the same models were used in the actual design process,e.g. for estimating room acoustical parameters, reflection paths,and simulating energy distribution in the halls. The materialsassigned to the major model surfaces were corresponding towooden floor on joists, and painted concrete for the stage andthe walls, respectively.
The walls in the Konservatorio were modeled as flat, although inreality there are a diffusing surface (see Fig. 2a). Such surfaceswere modeled by using the scattering coefficient of 0.7. Theextruding slots in the Sello hall were modeled as such, however,the scattering coefficient of 0.7 was used also in this case (seeFig. 2b).
The loudspeaker orchestra was recreated in the Odeon models
2 ISRA 2010
Proceedings of the International Symposium on Room Acoustics, ISRA 2010 29–31 August 2010, Melbourne, Australia
(a) Konservatorio hall, receiving position P3. (b) Sello hall, receiving position P3.
Figure 2: Corresponding views of the two measured halls.
(a) (b)
Figure 3: (a) Odeon 3D rendering of Konservatorio hall, P3. (b) The loudspeaker orchestra in Sello hall as seen from receiving positionP1.
using the actual positions and orientations for the loudspeakerson the stage. Directivity patterns were measured for each of thethree types of loudspeakers, and the directivities were appliedto the corresponding point sources in the Odeon model. Theaverage power responses of the measured loudspeakers wereconfirmed to correspond to the manufacturer specifications [8].Thus, the same setup existed for real and simulated acoustics.Additionally, the impulse responses from the same positionswere also calculated with omnidirectional point sources. Fol-lowing rendering options were used: Number of rays 50000,Impulse response resolution 1.0 ms, Transition order 2, Desiredreflection density 999999/ms. The impulse responses were ex-ported in B-format for spatial reproduction.
IMPULSE RESPONSE PROCESSING
In preliminary ad-hoc listening two prominent problems werenoticed with the auralized signals when compared to the convo-lutions with the responses from the real hall. First, depending onthe position in the hall, the balance between the instruments wasnoticed to vary strongly. This was the most pronounced when us-ing natural directivity patterns, whether they were directivitiesof loudspeakers or actual instruments. Second, the frequency re-sponses were much flatter compared to the measured responses.Especially the high frequencies were pronounced, which re-sulted in an unnaturally bright timbre in the auralizations.
In order to improve the deficiencies observed with informal
listening in the auralizations, two methods were devised inorder to bring the auralizations closer to the real hall.
First, the overall balance between the sources or, instruments,were equalized. This was accomplished by calculating the soundenergy of the A-weighted impulse responses per-channel basis.The reference value was obtained from the measured B-formatomnidirectional response. Simulated impulse responses fromOdeon were amplified or attenuated so that the A-weighted en-ergy was equal to the corresponding reference. This procedureis referred in the following as channel balance correction.
Second, filtering was applied for reducing the difference inthe frequency responses between the measured and simulatedhalls. A straightforward method is to design a filter to reducethe difference between the measured and simulated magnituderesponses. However, this is not feasible due to the time-varyingmagnitude responses, i.e. frequency band dependent reverbera-tion time. Such a filtering would result in a very dull sound, asthe filter with lowpass characteristics would affect greatly to thedirect sound. For this reason, the following filtering approachwith time-frequency processing was applied.
The corresponding measured and simulated responses werealigned with regard to the direct sound using the omnidirec-tional B-format channel. Short-time Fourier transform (STFT)was applied to both responses with FFT length of 4096 samplesand four-time overlap, producing a spectrogram. Then, a differ-
ISRA 2010 3
29–31 August 2010, Melbourne, Australia Proceedings of the International Symposium on Room Acoustics, ISRA 2010
100 1000 10k−50
−45
−40
−35
−30
−25
−20
−15
−10
−5
0
Rel
ativ
e m
agni
tude
[dB
]
Frequency [Hz]
Comparison of magnitude responsesSello, P2
Authentic orchestraLoudspeaker orchestraOdeon, omni0.0 (balance corrected)Odeon, lps0.5, (balance and filtering)
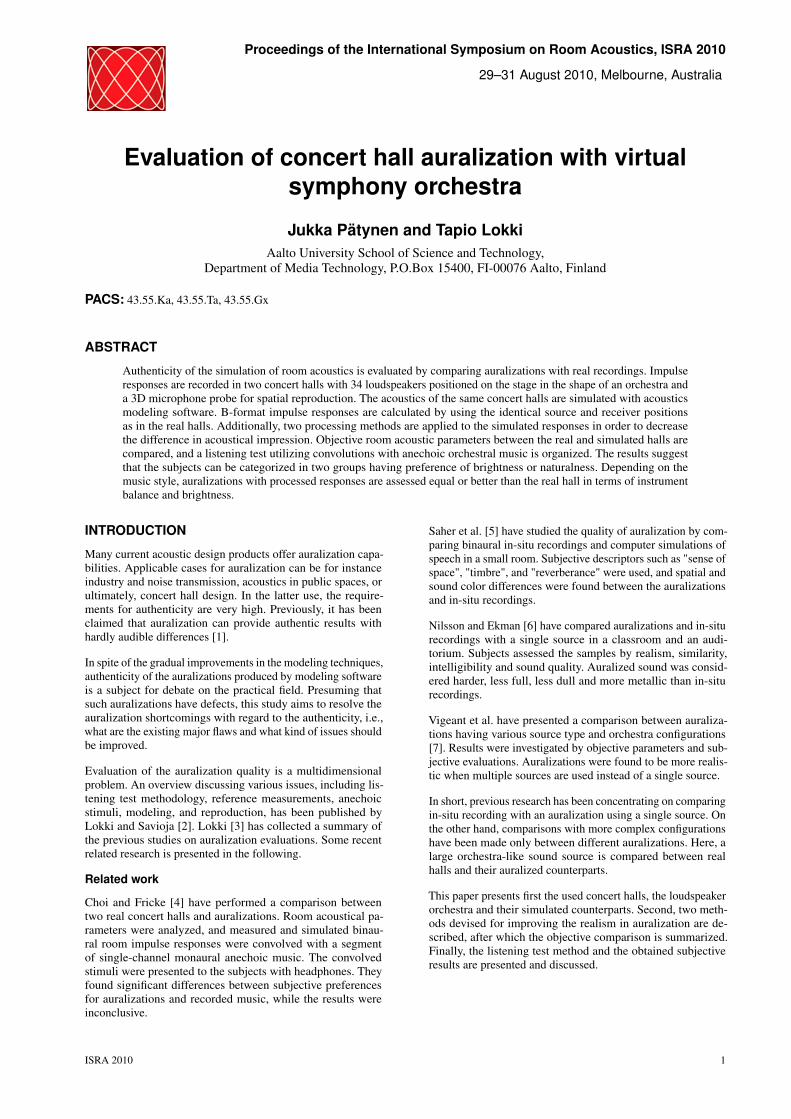
Figure 4: Comparison of the magnitude responses from a record-ing of an authentic orchestra and the loudspeaker orchestra atSello P2. A same passage from Beethoven’s Symphony no. 8was analyzed in both cases. Lower curves show the correspond-ing magnitude responses for auralizations with two differenttypes of processed responses (see Table 1). The responses areshown with octave smoothing.
ence magnitude matrix was calculated frame-wise between thetwo spectgrograms. Moderate smoothing was applied to eachdifference frame in order to prevent colorations. Finally, eachchannel of the spatial impulse responses were multiplied in theSTFT-domain with the difference spectrogram. In addition, pa-rameter α = [0...1] was used for controlling the strength of thefiltering operation. With α = 0 STFT filtering has no effect andwith α = 1 the spectrogram of the measured impulse responseis transferred in whole to the simulated response.
It should be noted that a shorter FFT length would provide betteraccuracy of the details and individual reflections in the impulseresponse. However, the low frequencies in the signal after in-verse STFT would suffer considerably from FFT lengths below4096 samples. The chosen values result in a time resolution of21.3 ms in the processing.
Two versions of processing methods combining the channelbalance correction and the STFT filtering are used in this study.With the original simulated responses from Odeon using pointsources with omnidirectional or loudspeaker directivity pattern,this results in a total of six simulation methods. They are listedin Table 1.
COMPARISON OF OBJECTIVE PARAMETERS
Two most obvious differences between the impulse responsesfrom Odeon simulations and the hall measurements were, first,the variation of gain in source positions and, second, the bright-ness or timbre. In the auralization experiments preceding this
Table 1: List of the simulated impulse responses with appliedprocessing methods. α denotes the strength parameter in STFTfiltering method.
Title Source directivity A-weighted eq. α
omni omni no 0omni0.0 omni yes 0omni0.5 omni yes 0.5lps measured LPS no 0lps0.0 measured LPS yes 0lps0.5 measured LPS yes 0.5real LPS (reference) -
I vl
II vl
vla
vckb
woo
dsbr
ass
ps
Loudspeaker dir.
Sello, P1 Kons., P3
Omnidirectional
Sello, P1 Kons., P3
A−
wei
ghte
d di
ffere
nce
[dB
]
−20
−15
−10
−5
0
5
10
15
20
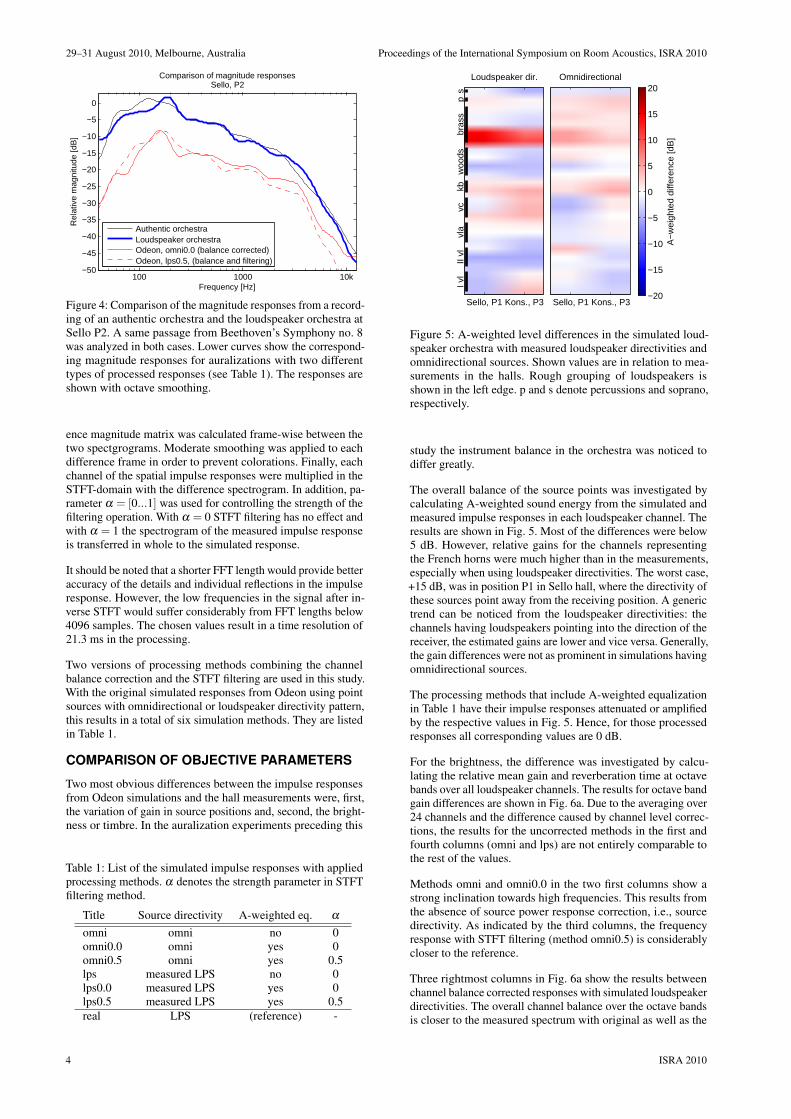
Figure 5: A-weighted level differences in the simulated loud-speaker orchestra with measured loudspeaker directivities andomnidirectional sources. Shown values are in relation to mea-surements in the halls. Rough grouping of loudspeakers isshown in the left edge. p and s denote percussions and soprano,respectively.
study the instrument balance in the orchestra was noticed todiffer greatly.
The overall balance of the source points was investigated bycalculating A-weighted sound energy from the simulated andmeasured impulse responses in each loudspeaker channel. Theresults are shown in Fig. 5. Most of the differences were below5 dB. However, relative gains for the channels representingthe French horns were much higher than in the measurements,especially when using loudspeaker directivities. The worst case,+15 dB, was in position P1 in Sello hall, where the directivity ofthese sources point away from the receiving position. A generictrend can be noticed from the loudspeaker directivities: thechannels having loudspeakers pointing into the direction of thereceiver, the estimated gains are lower and vice versa. Generally,the gain differences were not as prominent in simulations havingomnidirectional sources.
The processing methods that include A-weighted equalizationin Table 1 have their impulse responses attenuated or amplifiedby the respective values in Fig. 5. Hence, for those processedresponses all corresponding values are 0 dB.
For the brightness, the difference was investigated by calcu-lating the relative mean gain and reverberation time at octavebands over all loudspeaker channels. The results for octave bandgain differences are shown in Fig. 6a. Due to the averaging over24 channels and the difference caused by channel level correc-tions, the results for the uncorrected methods in the first andfourth columns (omni and lps) are not entirely comparable tothe rest of the values.
Methods omni and omni0.0 in the two first columns show astrong inclination towards high frequencies. This results fromthe absence of source power response correction, i.e., sourcedirectivity. As indicated by the third columns, the frequencyresponse with STFT filtering (method omni0.5) is considerablycloser to the reference.
Three rightmost columns in Fig. 6a show the results betweenchannel balance corrected responses with simulated loudspeakerdirectivities. The overall channel balance over the octave bandsis closer to the measured spectrum with original as well as the
4 ISRA 2010
Proceedings of the International Symposium on Room Acoustics, ISRA 2010 29–31 August 2010, Melbourne, Australia
Sello, P1
Oct
ave
band
[Hz]
Method
−6.9 −6.2 −4.0 −1.4 −0.5 −1.1
−4.5 −4.1 −1.8 −0.8 −0.1 +0.1
−2.5 −2.5 −0.4 −1.1 −0.8 +0.2
−1.5 −1.5 −0.1 −2.0 −2.0 −0.3
+1.6 +1.6 +1.2 −1.3 −1.4 −0.2
+3.0 +2.6 +1.1 −0.4 −1.0 −0.6
+10.9 +10.0 +3.9 +7.0 +5.7 +1.9
omni omni0.0omni0.5 lps lps0.0 lps0.5
125
250
500
1k
2k
4k
8k
Konservatorio, P3
Method
−3.8 −3.2 −1.6 +1.1 +1.8 +0.9
−4.0 −3.9 −1.7 −0.6 −0.2 +0.1
−3.3 −3.3 −1.4 −2.2 −2.0 −1.0
−3.1 −3.0 −1.5 −3.7 −3.7 −1.8
+0.6 +0.5 +0.4 −1.9 −2.2 −0.9
+2.8 +2.8 +1.4 −0.2 −0.4 −0.1
+10.8 +10.2 +4.4 +7.5 +6.8 +2.8
omni omni0.0omni0.5 lps lps0.0 lps0.5
125
250
500
1k
2k
4k
8k
Rel
ativ
e ga
in d
iffer
ence
[dB
]
−10
−8
−6
−4
−2
0
2
4
6
8
10
(a) Gain difference
Sello, P1
Oct
ave
band
[Hz]
Method
1.64+0.06 −0.03 −0.02 +0.11*
+0.00 +0.03
1.87−0.06 −0.11*
−0.08 −0.03 −0.14*
−0.12*
1.81−0.22**
−0.19**
−0.16*
−0.20**
−0.21**
−0.17*
1.75−0.09*
−0.06 −0.03 −0.12*
−0.06 −0.05
1.58+0.00 +0.01 +0.01 +0.00 +0.03 +0.01
1.24+0.13**
+0.16**
+0.13**
+0.11*
+0.17**
+0.14**
0.85+0.19****
+0.22*****
+0.15***
+0.12**
+0.21****
+0.15***
omni omni0.0omni0.5 lps lps0.0 lps0.5 real
125
250
500
1k
2k
4k
8k
Konservatorio, P3
Method
2.38+0.02 −0.03 −0.01 +0.11 +0.06 +0.04
2.24+0.18*
+0.15*
+0.08 +0.24**
+0.18*
+0.09
2.18−0.05 −0.02 −0.02 −0.02 −0.01 −0.02
2.26−0.16*
−0.13*
−0.08 −0.21*
−0.16*
−0.09
2.16−0.15*
−0.13*
−0.08 −0.23**
−0.17*
−0.10
1.83+0.00 +0.00 +0.02 −0.07 −0.03 +0.00
1.40+0.16**
+0.17**
+0.09*
+0.18**
+0.13*
+0.08*
omni omni0.0omni0.5 lps lps0.0 lps0.5 real
125
250
500
1k
2k
4k
8k
ED
T d
iffer
ence
[s]
−0.5
−0.4
−0.3
−0.2
−0.1
0
0.1
0.2
0.3
0.4
0.5
(b) Early decay time difference
Figure 6: Comparison of the gain and reverberation time in the halls at octave bands. Values shown in (a) are in relation to thecorresponding measured values. JND is 1 dB [13]. Difference to the reference in JNDs for EDT is visualized with the respective numberof small dots in (b). Positive values indicate excess gain or reverberation in the simulations.
channel balance corrected simulations (lps and lps0.0). How-ever, the 8 kHz octave band still exhibits a noticeable peak inboth positions. Again, applying the STFT filtering in the lastcolumn brings the spectrum closer to the measured reference.Between 250-4000 Hz, the values are within 0.8 dB in Sello P1and within 1.9 dB in Konservatorio P3.
A similar comparison with early decay times is shown in Fig. 6b.The general trend is that the balance correcting does not changeEDT estimates, while the STFT filtering improves values closerto the reference. Compared to the standard 5% JND, responseswith the balance correcting and the STFT filtering have differ-ences below 1 JND in many cases (see Fig. 6b).
Values for reverberation time follow the same pattern as seenwith EDT. However, the effect of the filtering is even morepronounced. The improvement with T30 values is circa 30-50%in both halls. With method lps0.5, the largest deviations fromthe reference at the 250-4000 Hz octave bands are 0.07 s inSello P1 and 0.16 s in Konservatorio P3.
Although the estimates for T30 show larger improvements, EDTvalues are shown in Fig. 6 for the reason that the listening testemploys continuous signals. EDT is regarded to correspondbetter with the perceived reverberation during running music[13].
Regarding lateral energy (LF), either the channel balance cor-
rection or the STFT filtering do not present any changes in thevalues, as all B-format channels are treated equally. In SelloP1, LF values have major differences only at the 125 Hz octaveband, or at Konservatorio P3 at 250 Hz. These observations arein effect also for clarity (C80).
In general, the channel balance correction and STFT filteringcan be noticed to have the desired effect on the impulse responseenergy parameters.
For reference, discussions with the involved consultants haverevealed that at the time of completing the building of the twohalls, the estimates on the gain and reverberation parametersfrom the simulations proved out to be lower than measured inthe finished halls. The same observation is made in this study aswell. At the 500-1000 Hz octave bands EDT and T30 estimateswere lower in all cases compared to the measured values.
SUBJECTIVE EVALUATION
The principal objective in this study is to find the most promi-nent deficiencies or differences between the auralization andthe real hall. As for the subjective evaluation, this could beaccomplished by a pair-wise comparison between auralizationsand the real hall as a reference. However, the authors decidedin favor for a parallel evaluation with a hidden reference, asthis could potentially give results where the auralization wasthought better than the real hall. With given reference this would
ISRA 2010 5
29–31 August 2010, Melbourne, Australia Proceedings of the International Symposium on Room Acoustics, ISRA 2010
be unlikely.
Anechoic stimuli and processing
For the listening test, anechoic orchestral recordings were usedin the auralizations. As discussed in [11], one musician playedall the parts of a particular instrument in the anechoic cham-ber. Unlike for wind instruments and percussions, this can beconsidered problematic with the strings. In a typical symphonyorchestra, the number of string instrument players can varygreatly from few up to 18 per part. Individual musicians and in-struments have their own character, tone and interpretation. Thisvariation was not retained in the recording process. Thereforethe string tracks require certain processing in order to improvethe authenticity before convolving the tracks with impulse re-sponses for the listening test.
A few methods have been proposed in recent auralization stud-ies. For instance, Vigeant et al. have used constant prime numberdelays up to 23 ms on up to seven copies of a single track [7].Lokki has applied pitch synchronous overlap-add algorithm andphase scrambling for copied signals [15]. Following the intu-itive concept on a string section, the authors have proposed acombination of constant delays and pitch shifting for producinga more natural sound of the strings [16].
This idea has been refined yet further by novel methods. Re-cently, the authors have collected data on the asynchronousnature of bowing during performance with video tracking. Suchdata is then utilized to generate pseudo-random time differenceswith continuous variation for each copied track. The time dif-ferences follow the distribution obtained from video tracking.Furthermore, employing recorded signals from various direc-tions and amplitude modulation have been noticed to improvethe naturalness of a section sound in informal listening. Theconvolved string tracks were processed with the combinationof methods described above.
The original recordings were performed with fixed input gainsover the whole recording period [11]. Therefore the balancebetween instruments should be considered nearly or entirelyauthentic without any need for adjusting the sound levels.
The following two short excerpts of symphonic music wereused in the listening test. Simulated string section sizes areindicated as I violins / II violins / violas / cellos / double basses.
• W. A. Mozart (1756-1791) An aria of Donna Elvira, DonGiovanni, bars 110-116 (strings: 8/8/6/6/4). Duration 11seconds.
The excerpts represent very different styles on purpose. Mozart’saria has a soprano soloist, and represents typical classical style,while Mahler’s symphony is more complex music. In the Mahlerthe brass section has several short chords. On the contrary, theMozart passage is more of a flowing type.
Listening test setup
The listening test was arranged in a large, dimmed, semi-anechoic environment where the walls and ceiling are of absorb-ing structure. The reproduction of the stimuli was accomplishedwith a 2D loudspeaker setup having eight Genelec 1029A loud-speakers with 45 degrees intervals around the subject at 2.0 mradius. The overall output levels at the listening position werematched within ±1 dB and the magnitude responses were in-spected for anomalies.
B-format impulse responses from the measurements and simula-tions were first converted to spatial impulse responses for each
reproduction loudspeaker by using Spatial Impulse ResponseRendering [17, 18]. It should be noted that the channel balancecorrection and the STFT filtering was performed individuallyto each of the eight spatial responses in order to prevent faultsin the spatial conversion. Finally the anechoic samples wereconvolved with the responses for spatial reproduction.
A total of 28 different stimuli were created for the listeningtest (2 music pieces × 2 receiving positions × 7 cases). Theseventh case was the convolution with the measured responsesas a hidden reference (see Table 1). One test cycle consisted offour pages, each containing the seven cases.
The stimuli were presented to the subjects with a user interfacebuilt with MAX/MSP software running on a Macbook Pro. Theinterface allowed to play the stimuli synchronously in paral-lel for easy comparison. Selective looping of the stimuli waspossible.
Subjective evaluation and analysis
The evaluation was performed by asking the rating of the stim-uli on a single attribute, preference, with the continuous scaleof worst—best. The subjects were instructed to concentrate onthe acoustics of the stimuli. As the preference can vary muchbetween subjects, verbal and written comments on their assess-ment criteria were collected after completing each round of thetest.
The same test was repeated three times in a row with eachsubject in order to ensure the consistency of the answers. Thesubjects were not told that the three rounds consisted of thesame samples in randomized order. Instead, the subjects wereencouraged to use new criteria for each round if necessary.This way it was possible to monitor the learning effect withthe stimuli and the refinement of the criteria. Ultimately, thesubjective criteria for individual preferences could be resolvedand simultaneously gather information on the most prominentdifferences.
Eleven experienced listeners participated into the listening test.Ten of the subjects were males. The subjects were mostly grad-uate or post-graduate students in acoustics, music and/or spatialaudio. All subjects had at least moderate musical experience.With three identical test cycles completed with each subject,this resulted in 33 evaluations for each stimuli.
The subjects were instructed to make use of the full scale ofworst—best. While most subjects followed this instruction, con-tinuous scaling between 0...1 was applied in order to ensurethe use of the full scale. The test results were analyzed withANOVA and five factors: method in Table 1, hall and position(Sello P1 or Konservatorio P3), music (Mozart or Mahler), testround, and the subject.
Results
Analysis with Matlab using anovan-function yielded the fol-lowing results. The subjects’ consecutive test rounds do nothave significant differences (F(20,923) = 0.5, p = 0.97). Sig-nificant differences were found with significance level of 0.05in the main effects of the method (F(6,923) = 89.49, p =0), music (F(1,923) = 4.04, p = 0.045), and subject number(F(10,923) = 2.21, p = 0.017). The significant differences be-tween subjects and between methods are rather self-explanatory.However, it is interesting to notice that the music is not aninsignificant factor.
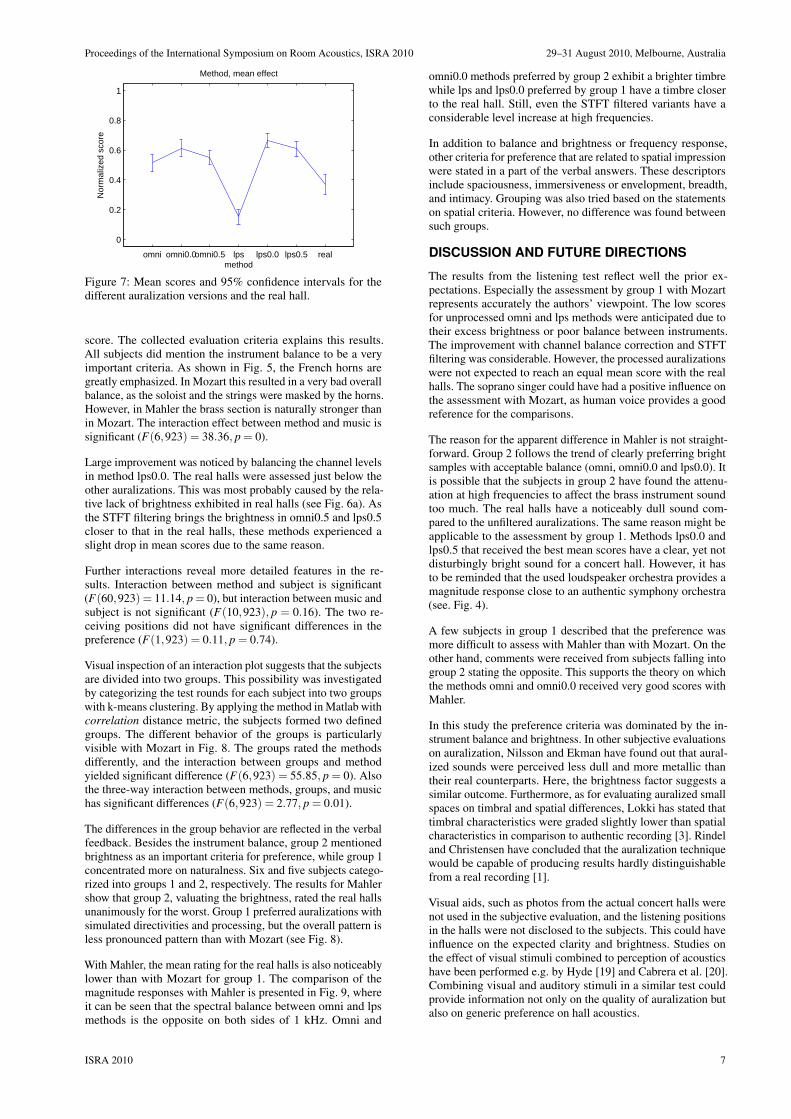
Main effect for method factor is shown in Fig. 7. The meansand confidence intervals are based on 132 assessments. Mostprominently, the lps method received clearly the worst mean
6 ISRA 2010
Proceedings of the International Symposium on Room Acoustics, ISRA 2010 29–31 August 2010, Melbourne, Australia
omni omni0.0omni0.5 lps lps0.0 lps0.5 real
0
0.2
0.4
0.6
0.8
1
Method, mean effect
method
Nor
mal
ized
sco
re
Figure 7: Mean scores and 95% confidence intervals for thedifferent auralization versions and the real hall.
score. The collected evaluation criteria explains this results.All subjects did mention the instrument balance to be a veryimportant criteria. As shown in Fig. 5, the French horns aregreatly emphasized. In Mozart this resulted in a very bad overallbalance, as the soloist and the strings were masked by the horns.However, in Mahler the brass section is naturally stronger thanin Mozart. The interaction effect between method and music issignificant (F(6,923) = 38.36, p = 0).
Large improvement was noticed by balancing the channel levelsin method lps0.0. The real halls were assessed just below theother auralizations. This was most probably caused by the rela-tive lack of brightness exhibited in real halls (see Fig. 6a). Asthe STFT filtering brings the brightness in omni0.5 and lps0.5closer to that in the real halls, these methods experienced aslight drop in mean scores due to the same reason.
Further interactions reveal more detailed features in the re-sults. Interaction between method and subject is significant(F(60,923) = 11.14, p = 0), but interaction between music andsubject is not significant (F(10,923), p = 0.16). The two re-ceiving positions did not have significant differences in thepreference (F(1,923) = 0.11, p = 0.74).
Visual inspection of an interaction plot suggests that the subjectsare divided into two groups. This possibility was investigatedby categorizing the test rounds for each subject into two groupswith k-means clustering. By applying the method in Matlab withcorrelation distance metric, the subjects formed two definedgroups. The different behavior of the groups is particularlyvisible with Mozart in Fig. 8. The groups rated the methodsdifferently, and the interaction between groups and methodyielded significant difference (F(6,923) = 55.85, p = 0). Alsothe three-way interaction between methods, groups, and musichas significant differences (F(6,923) = 2.77, p = 0.01).
The differences in the group behavior are reflected in the verbalfeedback. Besides the instrument balance, group 2 mentionedbrightness as an important criteria for preference, while group 1concentrated more on naturalness. Six and five subjects catego-rized into groups 1 and 2, respectively. The results for Mahlershow that group 2, valuating the brightness, rated the real hallsunanimously for the worst. Group 1 preferred auralizations withsimulated directivities and processing, but the overall pattern isless pronounced pattern than with Mozart (see Fig. 8).
With Mahler, the mean rating for the real halls is also noticeablylower than with Mozart for group 1. The comparison of themagnitude responses with Mahler is presented in Fig. 9, whereit can be seen that the spectral balance between omni and lpsmethods is the opposite on both sides of 1 kHz. Omni and
omni0.0 methods preferred by group 2 exhibit a brighter timbrewhile lps and lps0.0 preferred by group 1 have a timbre closerto the real hall. Still, even the STFT filtered variants have aconsiderable level increase at high frequencies.
In addition to balance and brightness or frequency response,other criteria for preference that are related to spatial impressionwere stated in a part of the verbal answers. These descriptorsinclude spaciousness, immersiveness or envelopment, breadth,and intimacy. Grouping was also tried based on the statementson spatial criteria. However, no difference was found betweensuch groups.
DISCUSSION AND FUTURE DIRECTIONS
The results from the listening test reflect well the prior ex-pectations. Especially the assessment by group 1 with Mozartrepresents accurately the authors’ viewpoint. The low scoresfor unprocessed omni and lps methods were anticipated due totheir excess brightness or poor balance between instruments.The improvement with channel balance correction and STFTfiltering was considerable. However, the processed auralizationswere not expected to reach an equal mean score with the realhalls. The soprano singer could have had a positive influence onthe assessment with Mozart, as human voice provides a goodreference for the comparisons.
The reason for the apparent difference in Mahler is not straight-forward. Group 2 follows the trend of clearly preferring brightsamples with acceptable balance (omni, omni0.0 and lps0.0). Itis possible that the subjects in group 2 have found the attenu-ation at high frequencies to affect the brass instrument soundtoo much. The real halls have a noticeably dull sound com-pared to the unfiltered auralizations. The same reason might beapplicable to the assessment by group 1. Methods lps0.0 andlps0.5 that received the best mean scores have a clear, yet notdisturbingly bright sound for a concert hall. However, it hasto be reminded that the used loudspeaker orchestra provides amagnitude response close to an authentic symphony orchestra(see. Fig. 4).
A few subjects in group 1 described that the preference wasmore difficult to assess with Mahler than with Mozart. On theother hand, comments were received from subjects falling intogroup 2 stating the opposite. This supports the theory on whichthe methods omni and omni0.0 received very good scores withMahler.
In this study the preference criteria was dominated by the in-strument balance and brightness. In other subjective evaluationson auralization, Nilsson and Ekman have found out that aural-ized sounds were perceived less dull and more metallic thantheir real counterparts. Here, the brightness factor suggests asimilar outcome. Furthermore, as for evaluating auralized smallspaces on timbral and spatial differences, Lokki has stated thattimbral characteristics were graded slightly lower than spatialcharacteristics in comparison to authentic recording [3]. Rindeland Christensen have concluded that the auralization techniquewould be capable of producing results hardly distinguishablefrom a real recording [1].
Visual aids, such as photos from the actual concert halls werenot used in the subjective evaluation, and the listening positionsin the halls were not disclosed to the subjects. This could haveinfluence on the expected clarity and brightness. Studies onthe effect of visual stimuli combined to perception of acousticshave been performed e.g. by Hyde [19] and Cabrera et al. [20].Combining visual and auditory stimuli in a similar test couldprovide information not only on the quality of auralization butalso on generic preference on hall acoustics.
ISRA 2010 7
29–31 August 2010, Melbourne, Australia Proceedings of the International Symposium on Room Acoustics, ISRA 2010
omni omni0.0omni0.5 lps lps0.0 lps0.5 real
0
0.2
0.4
0.6
0.8
1
Method
Nor
mal
ized
sco
re
Mozart
Group 1Group 2
omni omni0.0omni0.5 lps lps0.0 lps0.5 real
0
0.2
0.4
0.6
0.8
1
Method
Mahler
Group 1Group 2
Figure 8: Mean scores and 95% confidence intervals for the two groups with separated music excerpts. Group 1 preferred natural toneand group 2 preferred brightness.
Figure 9: Difference of magnitude responses in auralization for Mahler in relation to the real hall.
CONCLUSIONS
A study comprising of comparisons between authentic hallsand auralizations has been presented. The simulations wereperformed using the same acoustic models as in the actual halldesign. The sound source used in the comparisons on objectiveacoustic parameters and in a subjective evaluation was a setupof 34 loudspeakers on the stage in a shape of an orchestra. Mea-sured source directivities were applied in the simulations. Largedeviations were noticed in the objective parameters between thesimulations and hall measurements across the source positionson the stage. The subjective evaluation was performed with alistening test with the real hall as a hidden reference. The majorevaluation criteria for the preference was established on theinstrument balance and frequency response. The subjects couldbe categorized into two groups according to the preference onthe timbre. The first group preferred naturalness whereas thesecond group preferred a brighter tone. In all cases the aural-ization was improved by correcting the overall sound level ineach point source, i.e. an orchestra instrument. Depending onthe preference and the music excerpt, further improvement wasgained with filtering in time-frequency domain. At best, theauralizations were considered as good as the real hall.
ACKNOWLEDGMENTS
The authors wish to thank Henrik Möller at Akukon Oy forproviding the models and for the discussions. The research lead-ing to these results has received funding from the Academy ofFinland, project nos. [119092 and 218238] and the EuropeanResearch Council under the European Community’s SeventhFramework Programme (FP7/2007-2013) / ERC grant agree-
ment no. [203636]. J. Pätynen wishes to thank and the FinnishFoundation for Technology Promotion and the Nokia Founda-tion for funding.
REFERENCES
1 J.H. Rindel and C.L. Christensen. Room acoustic simu-lation and auralization - how close can we get to the realroom? In Proc. Eighth Western Pacific Acoustics Con-ference, Melbourne, Australia, Apr. 7-9 2003. KeynoteLecture; CD-ROM, 8 pp.
2 T. Lokki and L. Savioja. Evaluation of auralization results.In Forum Acusticum 2005, Budapest, Hungary, Aug. 29 -Sep. 2 2005. Paper 471-0.
3 T. Lokki. Physically-based Auralization - Design, Imple-mentation, and Evaluation. PhD thesis, Helsinki Universityof Technology, Telecommunications Software and Multi-media Laboratory, report TML-A5, 2002. Available athttp://lib.hut.fi/Diss/2002/isbn9512261588/.
4 Y. J. Choi and F. R. Fricke. A Comparison of SubjectiveAssessments of Recorded Music and Computer SimulatedAuralizations in Two Auditoria. Acta Acustica united withAcustica, 92(4):604–611, 2006.
5 K. Saher, J.H. Rindel, and L. Nijs. Comparisons betweenBinaural In-situ Recordings and Auralizations. In 120thConvention of Audio Engeneering Society, Paris, France,May 20-23 2006. Paper no. 6744.
6 M. E. Nilsson and M. Ekman. Perceptual evaluation of areal time auralization tool. In Euronoise 2009, Edinburgh,Ireland, Oct. 26-28 2009.
7 M. Vigeant, L. Wang, and J. H. Rindel. Investigations oforchestra auralizations using the multi-channel multi-source
8 ISRA 2010
Proceedings of the International Symposium on Room Acoustics, ISRA 2010 29–31 August 2010, Melbourne, Australia
auralization technique. Acta Acustica united with Acustica,94(6):866–882, Dec. 2008.
8 J. Pätynen, S. Tervo, and T. Lokki. A loudspeaker orches-tra for concert hall studies. In The Seventh InternationalConference On Auditorium Acoustics, pages 45–52, Oslo,Norway, October 3-5 2008. Institute of Acoustics. Alsopublished in Acoustics Bulletin 2009, 34(6), pp. 32-37.
9 J. Pätynen and T. Lokki. Directivities of Symphony Orches-tra Instruments. Acta Acustica united with Acustica, 96(1):138–167, 2010.
10 GRAS Type 50VI specifications, 2010. URL:http://www.grasinfo.dk/documents/.
11 J. Pätynen, V. Pulkki, and T. Lokki. Anechoic recordingsystem for symphony orchestra. Acta Acustica united withAcustica, 94(6):856–865, Dec. 2008.
12 AKG CK 62-ULS specifications, 2010. URL:http://www.akg.com/mediendatenbank2/psfile/datei/50/ULS_Series4055c282bda80.pdf.
13 ISO 3382-1:2009. Acoustics – Measurement of room acous-tic parameters – Part 1: Performance spaces. InternationalStandards Organization, 2009.
15 T. Lokki. How many point sources is needed to representstrings in auralization? In the International Symposium onRoom Acoustics (ISRA’2007), Seville, Spain, Sep. 10-122007. Paper P11.
16 T. Lokki and J. Pätynen. Applying anechoic recordingsin auralization. In The EAA Symposium on Auralization,Espoo, Finland, Jun. 15-17 2009.
17 J. Merimaa and V. Pulkki. Spatial impulse response render-ing I: Analysis and synthesis. J. Audio Eng. Soc., 53(12):1115–1127, 2005.
18 V. Pulkki and J. Merimaa. Spatial impulse response render-ing II: Reproduction of diffuse sound and listening tests. J.Audio Eng. Soc., 54(1):3–20, 2006.
19 J. Hyde. Acoustical intimacy in concert halls: Does visualinput affect the aural experience? In Proceedings of theInstitute of Acoustics, volume 24, London, England, July2002.
20 D. Cabrera, A. Nguyen, and Y. Choi. Auditory versus visualspatial impression: a study of two auditoria. In Proc. TenthMeeting of the Int. Conf on Auditory Display ICAD 04,Sydney, Australia, Jul. 6-9 2004.