Page 1
EVALUATION OF CONCRETE MIX DESIGNS TO MITIGATE EARLY-AGE
SHRINKAGE CRACKING IN BRIDGE DECKS
By
JIANMIN ZHUANG
A dissertation/thesis submitted in partial fulfillment of the requirements for the degree of
MASTER OF SCIENCE IN CIVIL ENGINEERING
WASHINGTON STATE UNIVERSITY Department of Civil and Environmental Engineering
AUGUST 2009
Page 2
ii
To the Faculty of Washington State University:
The members of the Committee appointed to examine the
dissertation/thesis of JIANMIN ZHUANG find it satisfactory and recommend that
it be accepted.
___________________________________ Pizhong Qiao, Ph.D., Chair
___________________________________ David I. McLean, Ph.D., Co-Chair
___________________________________ Shihui Shen, Ph.D.
Page 3
iii
ACKNOWLEGEMENT
I express my gratitude to my advisor and committee chair, Dr. Pizhong Qiao, for his
support and help during my two years of graduate study. His great insight, guidance and
knowledge have always enlightened me. I also want to thank Dr. David I. McLean for sharing
with me his knowledge and for teaching me how to use all the test equipment. I also thank Dr.
Shihui Shen for her interest in my study and serving as my committee member.
This study is supported by the Washington State Department of Transportation
(WSDOT). I thank Mohammad Sheikhizadeh, Kim Willoughby, and WSDOT for their technical
support on this research. Majority of the materials used in this study are generously donated by
Central Pre-Mix Concrete Co. of Spokane, WA (Craig L. Matteson), Cadman, Inc. of Redmond,
WA (Dick Boss), and Lafarge NA – PNW District (Tom McGraw), and their generosity are
gratefully acknowledged.
I also appreciate the technical input and data acquisition system provided by Profs. Julio
F. Davalos and Indrajit Ray of West Virginia University. I thank my officemates Fan Wei,
Fangliang Chen, and Xuping Huo for their involvement and assistance in the experimental
portion of this study, and without their unselfish support and hard work, it is impossible for me
to accomplish all the making of concrete and testing program.
I also want to thank Robert Duncan, Scott Lewis, Brent Olson from the Wood Materials
and Engineering Laboratory and Bill Elliott, Vicki Ruddick, Lola Gillespie, Tom Weber from the
Department of Civil and Environmental Engineering for their generous support of my research
project.
I thank all my friends who have given me emotional support. Special thanks are given to
my parents and my younger brother for their love.
Page 4
iv
EVALUATION OF CONCRETE MIX DESIGNS TO MITIGATE EARLY-AGE
SHRINKAGE CRACKING IN BRIDGE DECKS
Abstract
by Jianmin Zhuang, M.S. Washington State University
August 2009
Chair: Pizhong Qiao
Early-age shrinkage cracking has been observed in many concrete bridge decks in
Washington State and elsewhere around the U.S. The cracking increases the effects of freeze-
thaw damage, spalling, and corrosion of steel reinforcement, thus resulting in premature
deterioration and structural deficiency of the bridges. In this study, the main causes of the early-
age cracking in the decks are identified, and concrete mix designs as a strategy to prevent or
minimize the shrinkage cracking are evaluated. Different sources (Eastern and Western
Washington) and sizes of aggregates are considered, and the effects of paste content,
cementitious materials (cement, fly ash, silica fume, slag), and shrinkage reducing admixture
(SRA) are evaluated. A series of concrete shrinkage and mechanical property tests are
performed. The outcomes of this study identify optimum concrete mix designs as appropriate
mitigation strategies to reduce or eliminate early-age shrinkage cracking and thus help minimize
shrinkage-associated cracking in the concrete bridge decks, potentially leading to a great
deduction in bridge deck maintenance costs.
Page 5
v
TABLE OF CONTENTS
Page
ACKNOWLEDGEMENTS.................................................................................................. ......... iii
ABSTRACT ....................................................................................................................... ......... . iv
TABLE OF CONTENTS.................................................................................................. .............. v
LIST OF TABLES............................................................................................................ .............. x
LIST OF FIGURES ......................................................................................................... ............ xii
CHAPTER
1. INTRODUCTION ............................................................................................................... 1
1.1 Problem Statement………………………………………………………………….. 1
1.2 Objectives and Scope of Study…………………………………………….…….. .... 3
1.3 Organizations…………………………………………………….…….. .................. 3
2. LITERATURE REVIEW .................................................................................................... 5
2.1 Introduction………………………………………………………………….. .......... 5
2.2 Types of Shrinkage…………………………………………………….……............ 5
2.2.1 Plastic Shrinkage…………………………………………………................... 6
2.2.2 Autogenous Shrinkage…………………………………………….. ................ 6
2.2.3 Drying Shrinkage………………………………………………...... ................ 7
2.2.4 Creep………………………………………………........................ ................. 7
2.3 Effect of Concrete Properties on Deck Cracking…………………………….. ......... 8
2.3.1 Paste Content and Water-to-cement Ratio………………………… ................ 8
2.3.2 Cement Type …………………….…………………….………….. ................ 8
2.3.3 Aggregates Size and Type…………………….……………..……. ................ 9
Page 6
vi
2.3.4 Air Content…………………….……………………………….…. .............. 10
2.3.5 Slump…………………….…………………….……………….…. .............. 10
2.4 Cementitious Materials and Admixtures in Concrete .............................................. 10
2.4.1 Silica Fume ..................................................................................................... 10
2.4.2 Fly Ash ............................................................................................................ 11
2.4.3 Ground Granulated Blast-Furnace Slags (GGBFS) ........................................ 12
2.4.4 Shrinkage-Reducing Admixtures .................................................................... 12
2.4.5 Fiber Admixture .............................................................................................. 13
2.5 Other Factors Related to Shrinkage Cracking .......................................................... 13
2.5.1 Restraint Type ................................................................................................. 13
2.5.2 Construction Method ...................................................................................... 14
2.5.3 Environmental Conditions .............................................................................. 14
2.6 Test Methods ............................................................................................................ 15
2.6.1 General Review on Test Methods of Concrete Shrinkage Cracking .............. 15
2.6.2 Cracking Frame and Fracture Energy ............................................................. 16
2.6.3 Ring Test Method ........................................................................................... 18
2.6.3.1 AASHTO Ring Test ............................................................................. 19
2.6.3.2 ASTM Ring Test .................................................................................. 21
2.6.3.3 Comparison between AASHTO Ring Test and ASTM Ring Test ....... 22
2.6.3.4 The Effect of Geometry of the Ring Test ............................................. 23
2.6.4 Summary of Test Methods .............................................................................. 24
2.7 Other Related Work ................................................................................................. 24
2.8 Potential Causes of Early-Age Shrinkage Cracking ................................................ 28
Page 7
vii
2.9 Remedies of Enhancing Shrinkage Cracking Resistance ......................................... 29
2.10 Review of Adopted Test Methods ........................................................................... 31
3. MATERIALS AND SELECTION OF CONCRETE MIX DESIGNS ............................. 33
3.1 Introduction .............................................................................................................. 33
3.2 Materials ................................................................................................................... 33
3.2.1 Cementitious Materials .................................................................................. 33
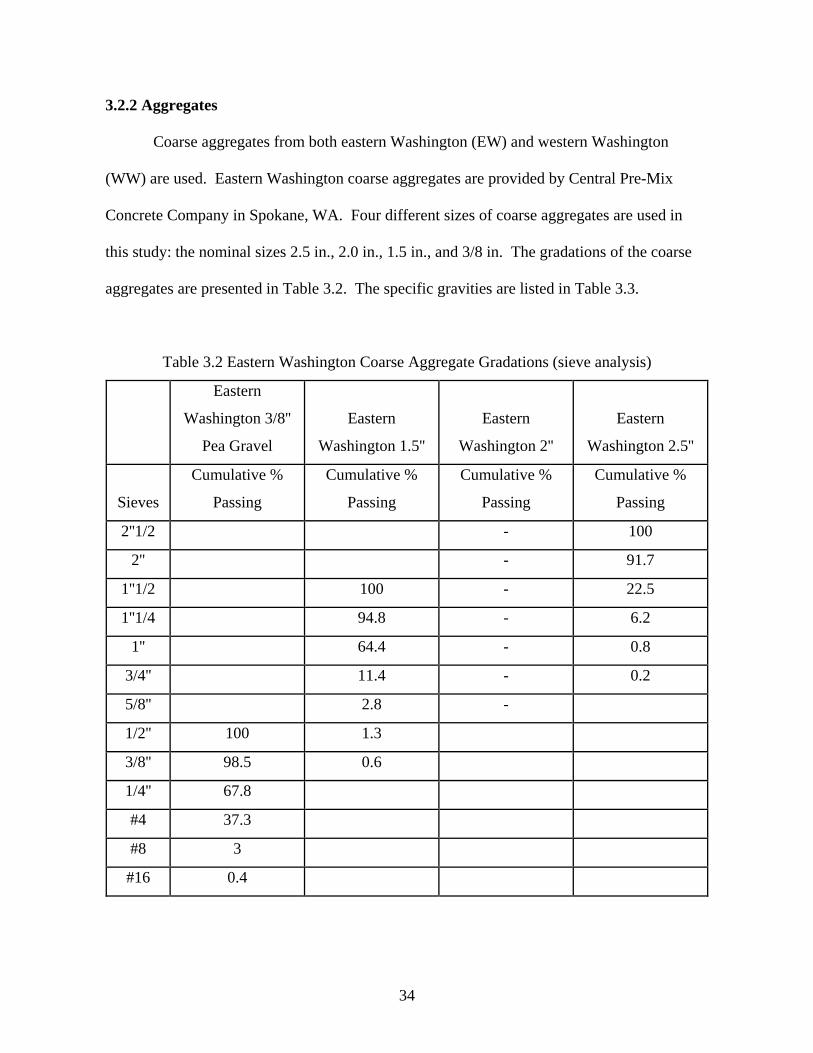
3.2.2 Aggregates ..................................................................................................... 34
3.2.3 Chemical Admixtures .................................................................................... 36
3.3 Mix Design Rationale and Considerations ............................................................... 37
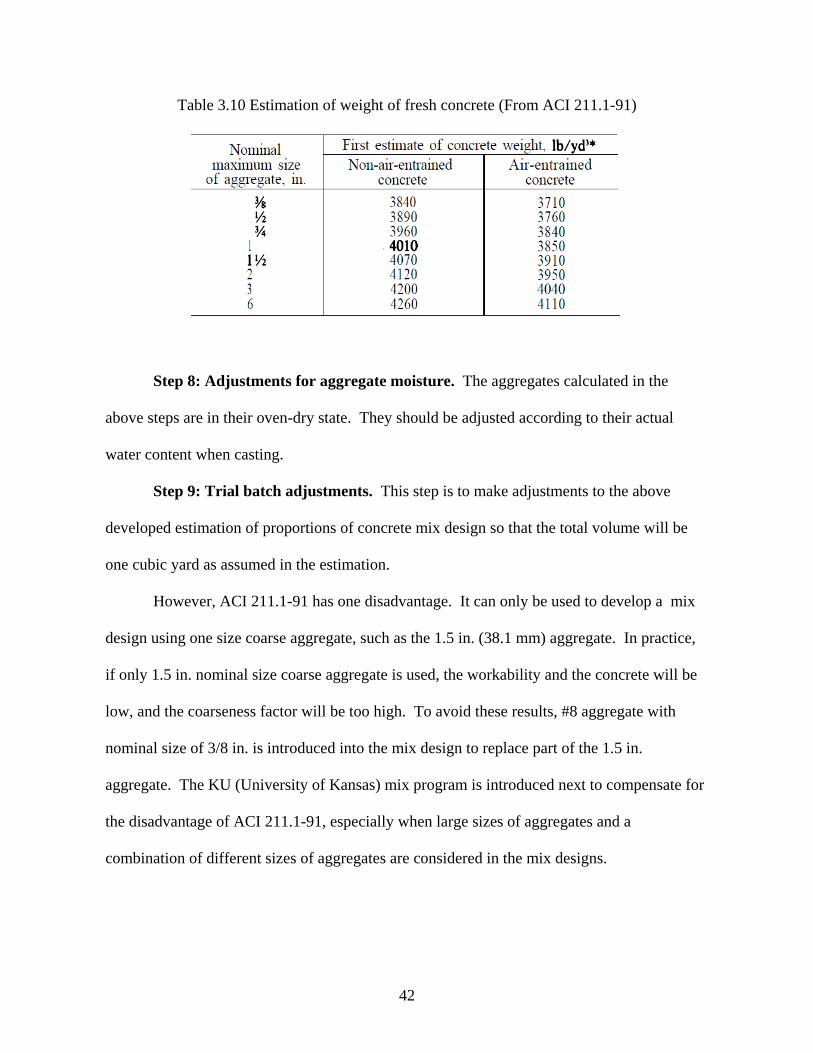
3.4 Mix Design and Procedures by ACI 211.1-91 ......................................................... 38
3.5 Mix Optimization and Analysis by KU Program ..................................................... 43
3.6 Finalized Mix Designs ............................................................................................. 46
3.7 Concluding Remarks ................................................................................................ 46
4. TEST METHODS .............................................................................................................. 49
4.1 Introduction .............................................................................................................. 49
4.2 Concrete Mix Procedures ......................................................................................... 49
4.3 Fresh Property Tests ................................................................................................. 50
4.3.1 Slump Test ..................................................................................................... 50
4.3.2 Air Content Test............................................................................................. 52
4.4 Mechanical Property Tests ....................................................................................... 53
4.4.1 Compressive Test and Young’s Modulus Test .............................................. 53
4.4.2 Flexural Strength Test .................................................................................... 55
4.5 Shrinkage Property Tests ......................................................................................... 56
Page 8
viii
4.5.1 Free Shrinkage Test ....................................................................................... 56
4.5.2 Restrained Shrinkage Test ............................................................................. 57
5. PERFORMANCE OF MIX DESIGNS WITH EASTERN WASHINGTON
AGGREGATES ................................................................................................................. 61
5.1 Introduction .............................................................................................................. 61
5.2 Fresh Property Tests ................................................................................................. 61
5.2.1 Slump Test ..................................................................................................... 61
5.2.2 Air Content Test............................................................................................. 62
5.2.3 Test Results of Fresh Concrete Properties ..................................................... 63
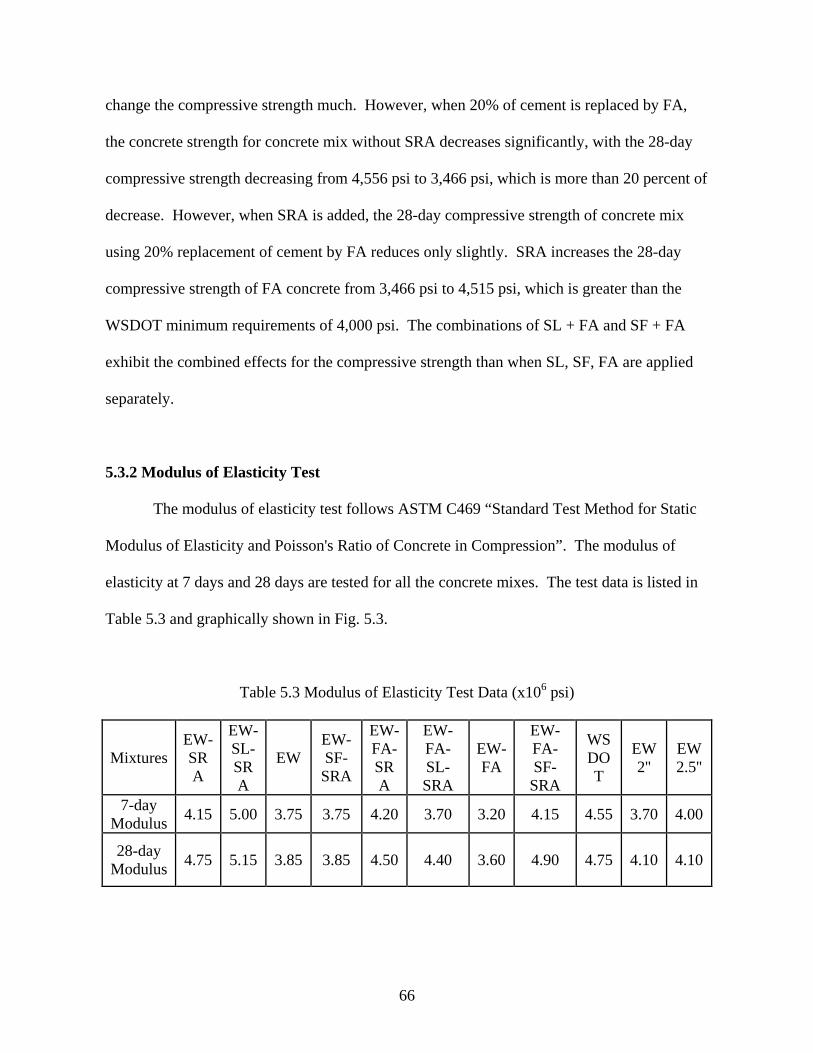
5.3 Mechanical Property Tests ....................................................................................... 63
5.3.1 Compressive Strength Test ............................................................................ 63
5.3.2 Modulus of Elasticity Test ............................................................................. 66
5.3.3 Flexural Strength Test .................................................................................... 67
5.4 Shrinkage Property Tests ......................................................................................... 70
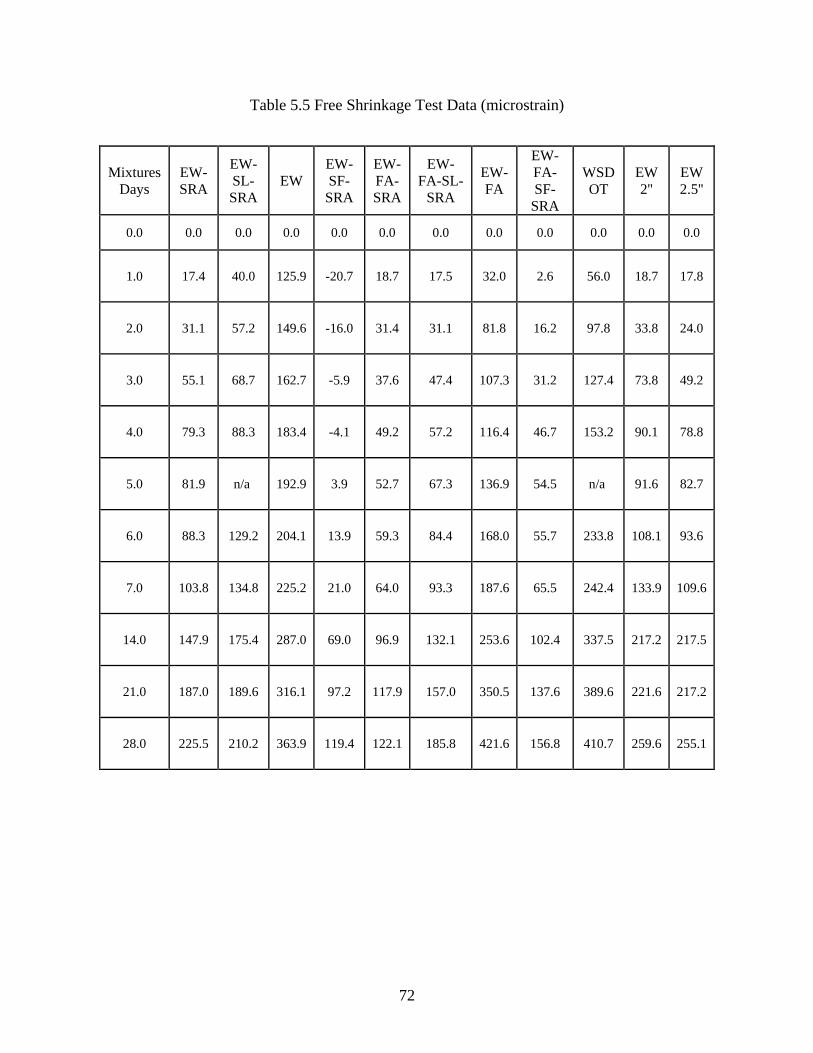
5.4.1 Free Shrinkage Test ....................................................................................... 70
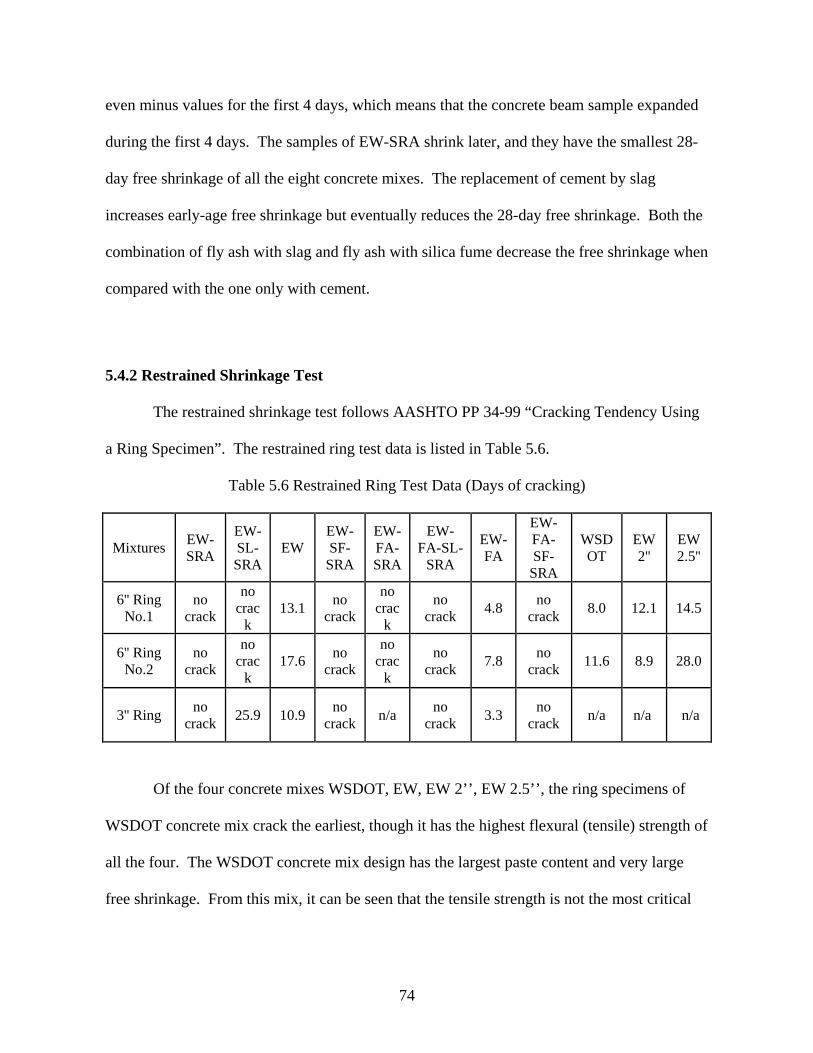
5.4.2 Restrained Shrinkage Test ............................................................................. 74
5.5 Concluding Remarks ................................................................................................ 75
6. PERFORMANCE OF MIX DESIGNS WITH WESTERN WASHINGTON
AGGREGATES ................................................................................................................. 77
6.1 Introduction .............................................................................................................. 77
6.2 Fresh Property Tests ................................................................................................. 77
6.3 Mechanical Property Tests ....................................................................................... 78
6.3.1 Compressive Strength Test ............................................................................. 78
Page 9
ix
6.3.2 Modulus of Elasticity Test ............................................................................. 80
6.3.3 Flexural Strength Test .................................................................................... 82
6.4 Shrinkage Property Tests ......................................................................................... 84
6.4.1 Free Shrinkage Test ........................................................................................ 84
6.4.2 Restrained Shrinkage Test ............................................................................. 88
6.5 Concluding Remarks ................................................................................................ 89
7. CONCLUSIONS AND RECOMMENDATIONS ............................................................ 90
7.1 Concluding Remarks and Discussions ..................................................................... 90
7.2 Recommendations .................................................................................................... 92
BIBLIOGRAPHY ......................................................................................................... ............... 93
APPENDIX
A. Mechanical Test Data ........................................................................................................ 98
B. Concrete Mix Designs by KU Mix Program ................................................................... 101
C. Restrained Ring Strain Data ............................................................................................ 117
Page 10
x
LIST OF TABLES
2.1 Fresh and Hardened Property Tests………………………………………………………. ... 32
3.1 Properties and Chemical Contents of Cementitious Materials ............................................... 33
3.2 Eastern Washington Coarse Aggregate Gradations (sieve analysis) ...................................... 34
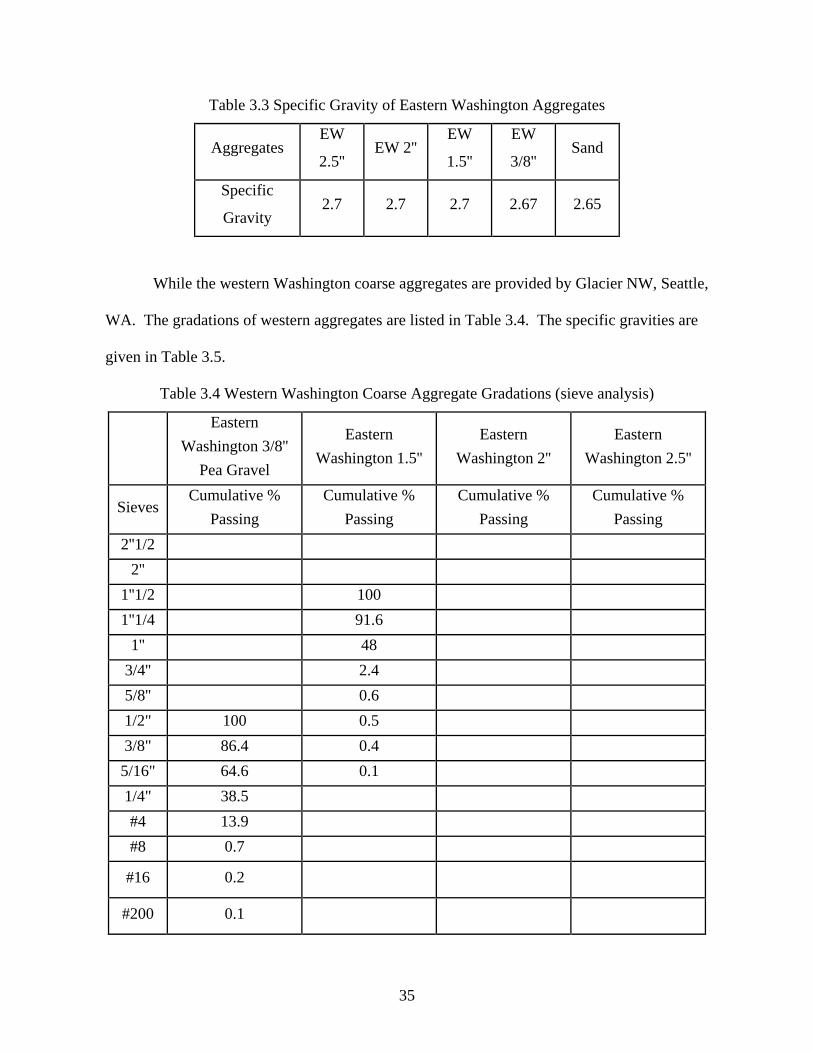
3.3 Specific Gravity of Eastern Washington Aggregates ............................................................. 35
3.4 Western Washington Coarse Aggregate Gradations (sieve analysis) ..................................... 35
3.5 Specific Gravities of Western Washington Coarse Aggregates ............................................. 36
3.6 Fine aggregate gradation (sieve analysis) ............................................................................... 36
3.7 Recommended slumps for various types of construction (From ACI 211.1-91)…………….39
3.8 Approximate mixing water and air content requirements for different slumps and nominal
sizes of aggregates (From ACI211.1-91)…………………………………………………… 40
3.9 Volume of coarse aggregate per unit of volume of concrete (From ACI 211) ....................... 41
3.10 Estimation of weight of fresh concrete (From ACI 211) ...................................................... 42
3.11 Mix designs ........................................................................................................................... 47
5.1 Slump and Air Content Data for Eastern Washington Aggregates ........................................ 63
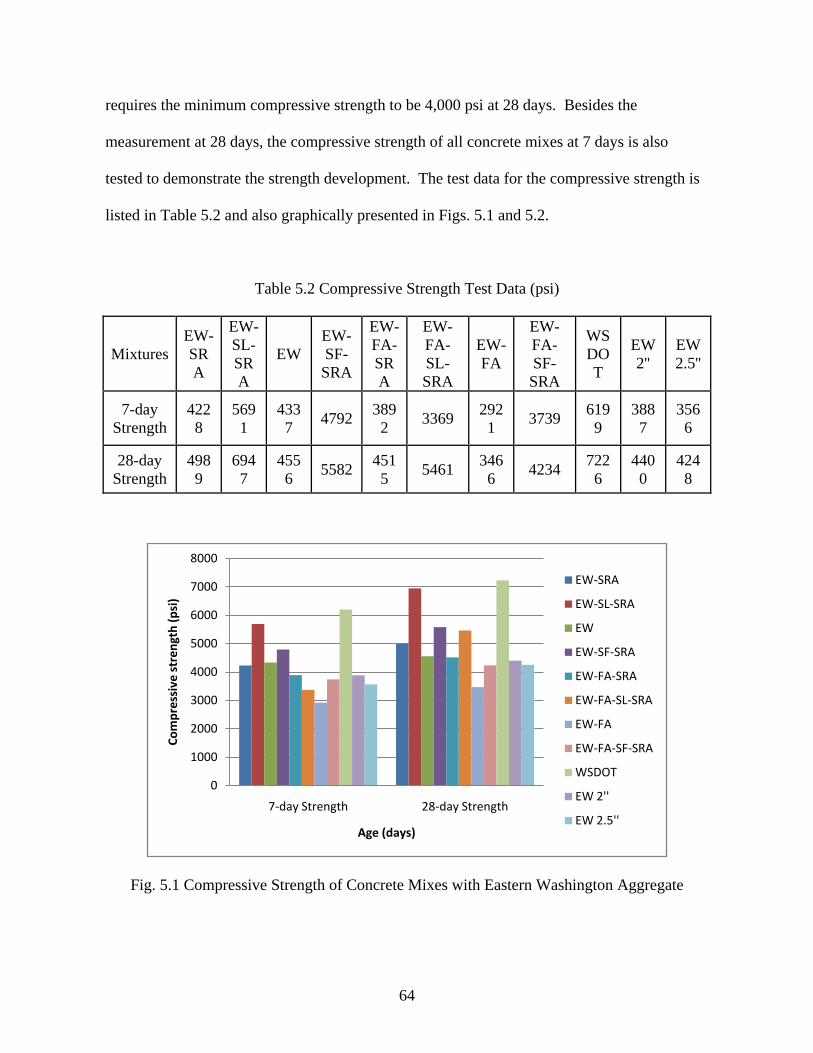
5.2 Compressive Strength Test Data for Eastern Washington Aggregates (psi) .......................... 64
5.3 Modulus of Elasticity Test Data for Eastern Washington Aggregates ................................... 66
5.4 Flexural Strength Test Data for Eastern Washington Aggregates .......................................... 68
5.5 Free Shrinkage Test Data for Eastern Washington Aggregates ............................................. 72
5.6 Restrained Ring Test Data for Eastern Washington Aggregates ............................................ 74
6.1 Slump and Air Content Data for Western Washington Aggregates ....................................... 78
6.2 Compressive Strength Test Data for Western Washington Aggregates ................................. 78
Page 11
xi
6.3 Modulus of Elasticity Test Data for Western Washington Aggregates .................................. 81
6.4 Flexural Strength Test Data for Western Washington Aggregates ......................................... 82
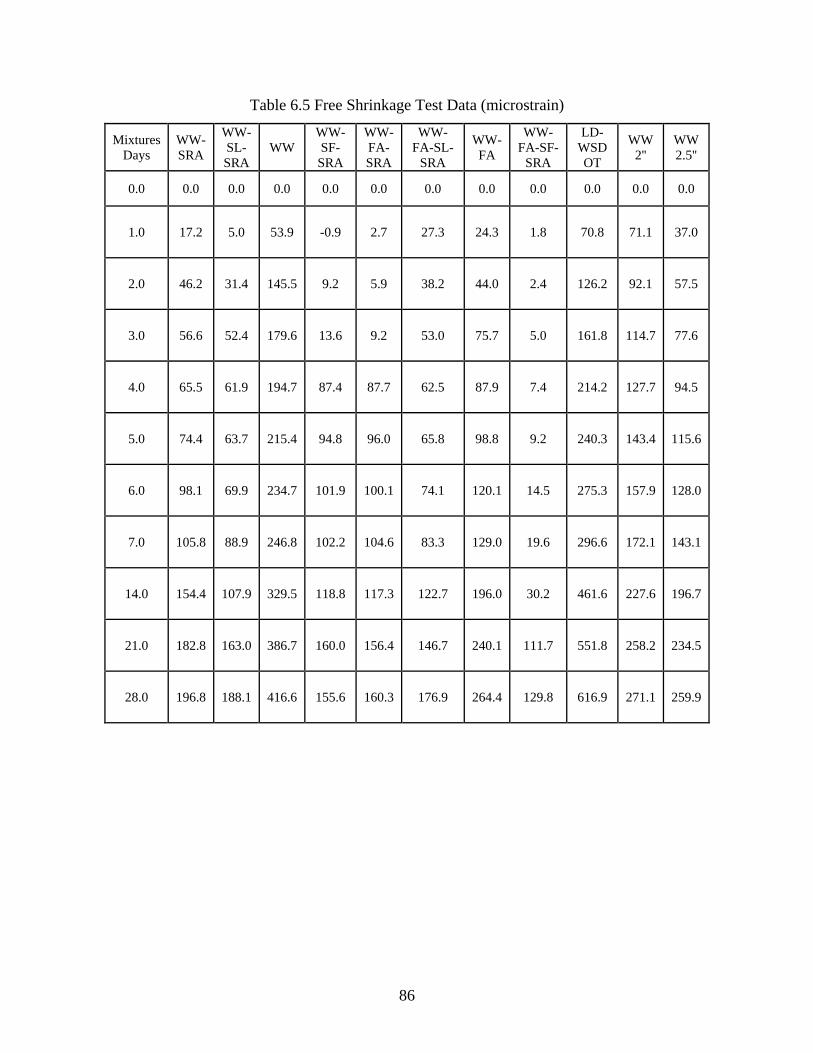
6.5 Free Shrinkage Test Data for Western Washington Aggregates ............................................ 86
6.6 Restrained Ring Test Data for Western Washington Aggregates ........................................... 88
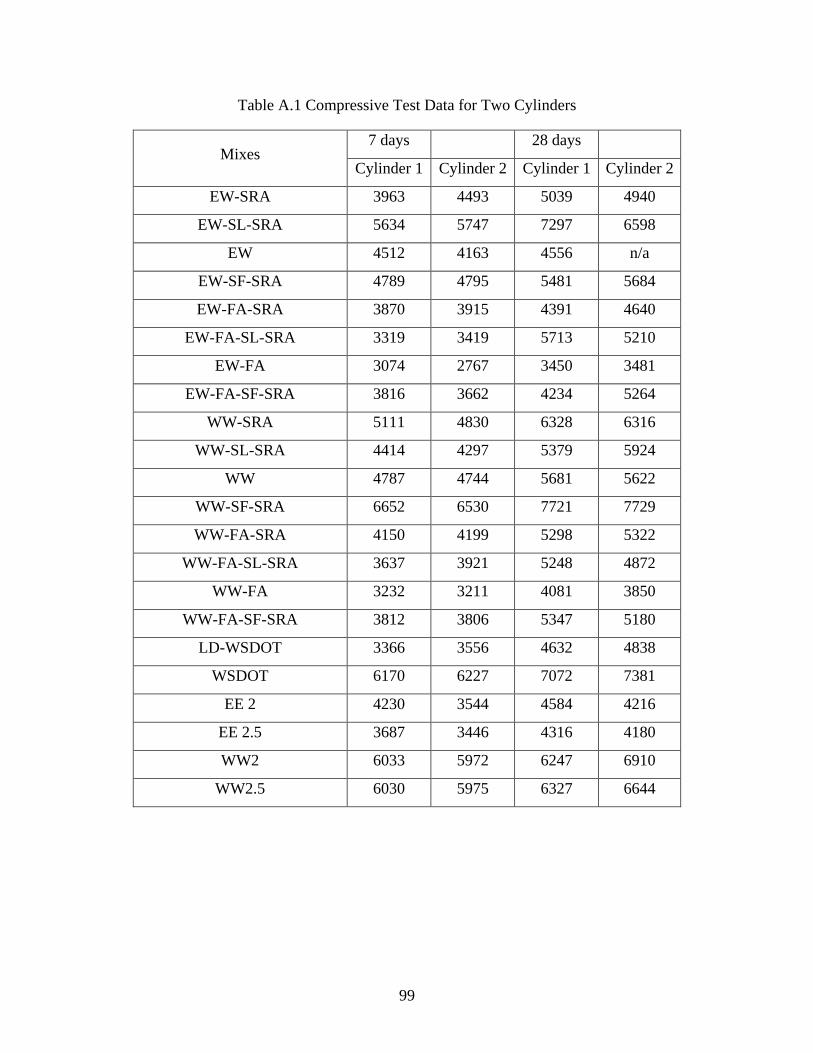
A.1 Compressive Test Data for Two Cylinders ............................................................................ 99
A.2 Flexural Test Data for Two Beams ...................................................................................... 100
Page 12
xii
LIST OF FIGURES
Fig. 1.1 Mechanism of cracking (From Neville, 1996)…… .......................................................... 2
Fig. 1.2 Early-age shrinkage cracking in concrete bridge decks (Crowl and Sutak 2002)…… ..... 2
Fig. 1.3 Transverse, full-depth cracks developed within 48-hour of pouring………………… .... 3
Fig. 2.1 Cracking frame (Springenschmid et al., 1994) ................................................................ 17
Fig. 2.2 Diagrams of ring specimens (Reprinted from AASHTO PP34-99) ................................ 20
Fig. 3.1 KU interface (From KU Mix Program))…… ................................................................. 43
Fig. 3.2 Concrete mix design by KU Mix Program…… .............................................................. 45
Fig. 4.1 Slump Test…… ............................................................................................................... 51
Fig. 4.2 Air Content Test by Pressure Method…… ..................................................................... 51
Fig. 4.3 Device for Air Content Test by Volumetric Method…… ............................................... 52
Fig. 4.4 Compressive and Modulus of Elasticity Test .................................................................. 54
Fig. 4.5 Flexural Strength Test ..................................................................................................... 55
Fig. 4.6 Free Shrinkage Test ......................................................................................................... 57
Fig. 4.7 Diagrams of Ring Specimen (Reprinted from AASHTO PP34-99) ............................... 58
Fig. 4.8 Restrained Shrinkage Ring Apparatus ............................................................................. 59
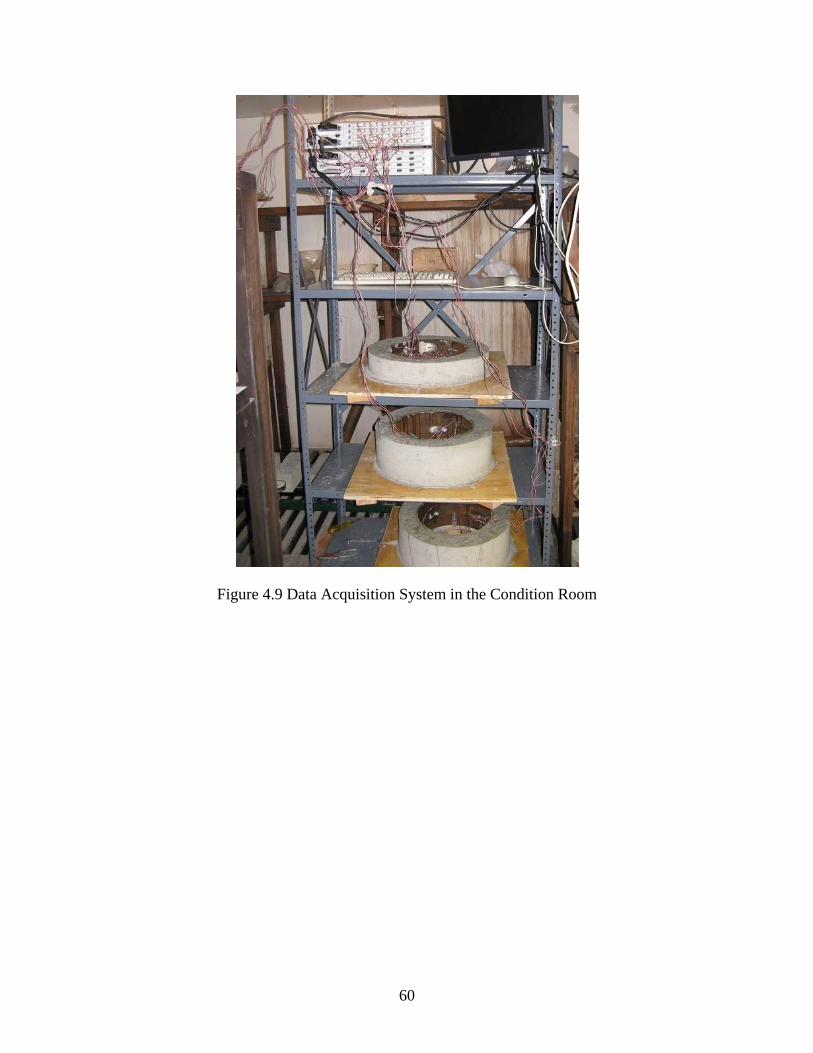
Fig. 4.9 Data Acquisition System in the Condition Room ........................................................... 60
Fig. 5.1 Compressive Strength of Concrete Mixes with Eastern Washington Aggregates .......... 64
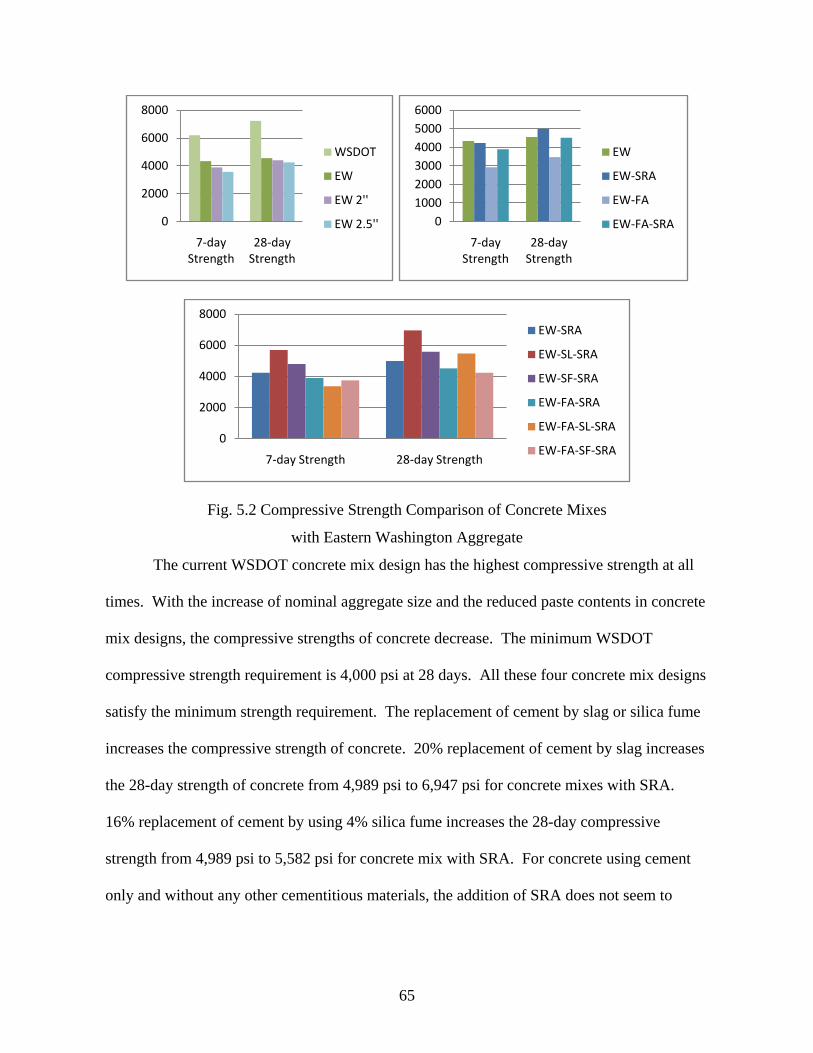
Fig. 5.2 Compressive Strength Comparison of Concrete Mixes with Eastern Washington
Aggregates ....................................................................................................................... 65
Fig. 5.3 Modulus of Elasticity of Concrete Mixes with Eastern Washington Aggregates ........... 67
Fig. 5.4 Flexural Strength of Concrete Mixes with Eastern Washington Aggregates .................. 68
Page 13
xiii
Fig. 5.5 Flexural Strength Comparison of Concrete Mixes with Eastern Washington Aggregates
......................................................................................................................................... 69
Fig. 5.6 Free Shrinkage of WSDOT, EW, EW2, EW2.5 .............................................................. 71
Fig. 5.7 Free Shrinkage of EW, EW-SRA, EW-FA and EW-FA-SRA ........................................ 71
Fig. 5.8 Free Shrinkage of Eastern Concrete Mixes with SRA .................................................... 73
Fig. 6.1 Compressive Strength of Western Concrete Mixes ......................................................... 79
Fig. 6.2 Compressive Strength Comparison ................................................................................. 79
Fig. 6.3 Modulus of Elasticity of Western Concrete Mixes ......................................................... 81
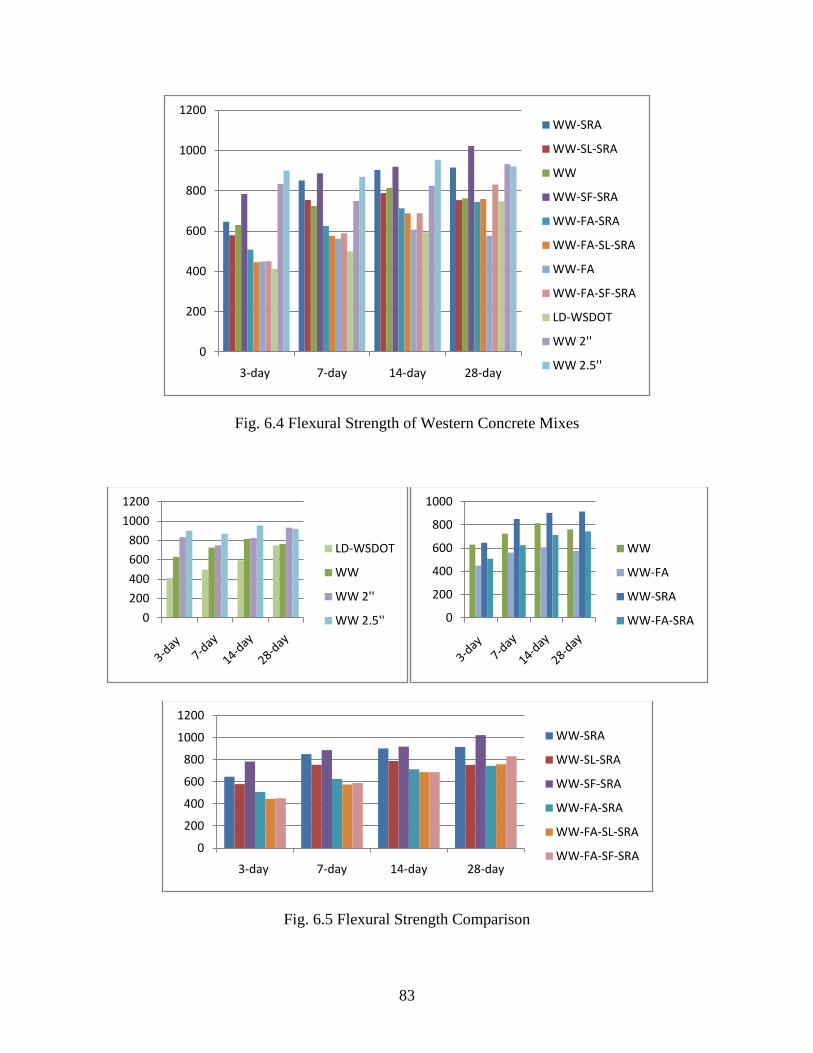
Fig. 6.4 Flexural Strength of Western Concrete Mixes ................................................................ 83
Fig. 6.5 Flexural Strength Comparison ......................................................................................... 83
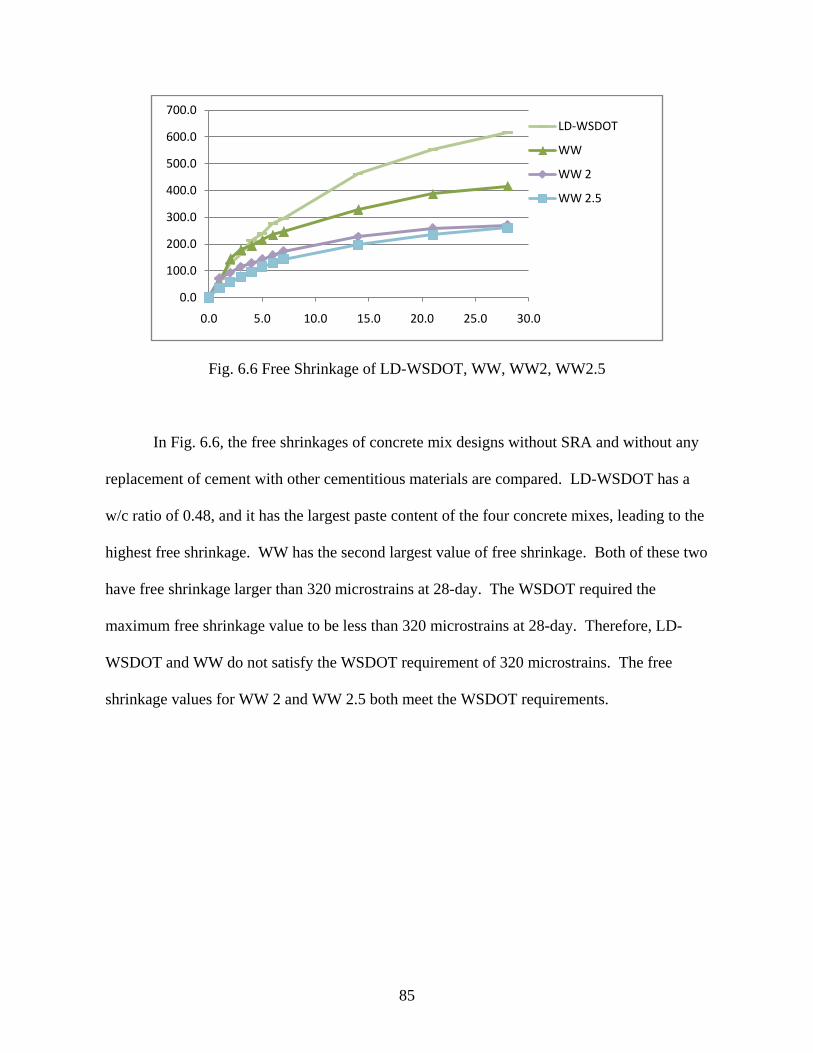
Fig. 6.6 Free Shrinkage of LD-WSDOT, WW, WW2, WW2.5 ................................................... 85
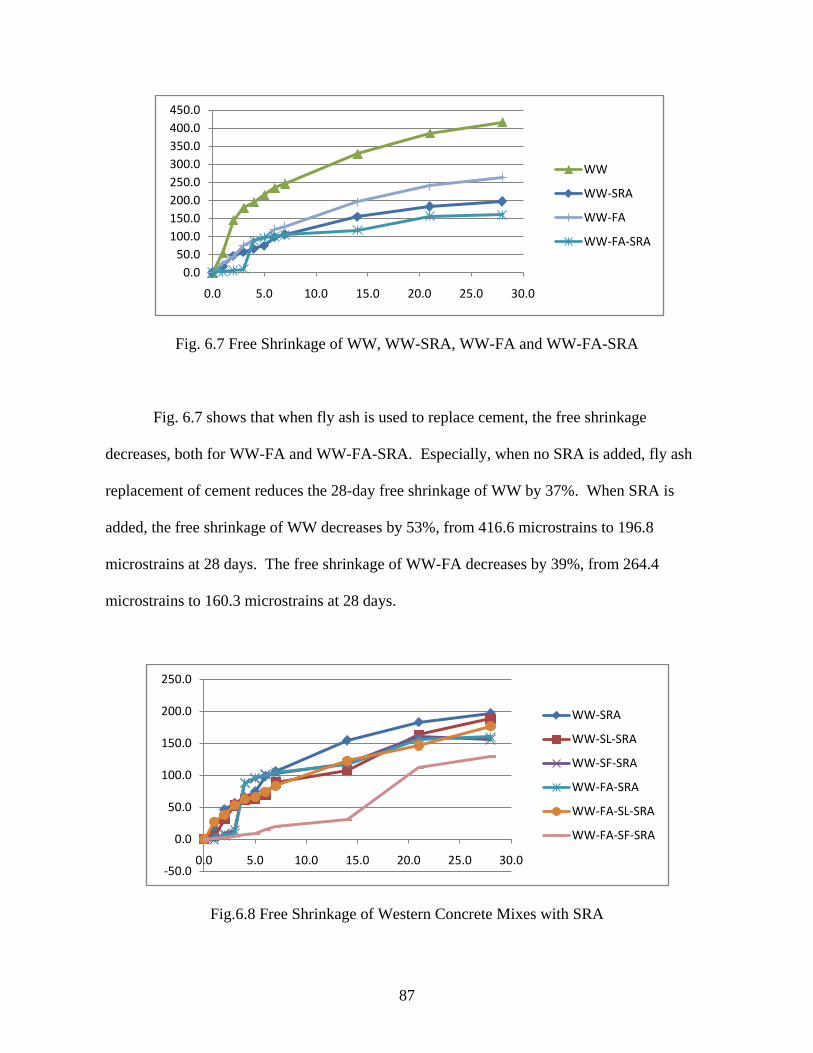
Fig. 6.7 Free Shrinkage of WW, WW-SRA, WW-FA and WW-FA-SRA .................................. 87
Fig. 6.8 Free Shrinkage of Western Concrete Mixes with SRA ................................................... 87
Fig. B.1 Concrete Mix Design for EW-SRA .............................................................................. 101
Fig. B.2 Concrete Mix Design for EW-SL-SRA ........................................................................ 102
Fig. B.3 Concrete Mix Design for EW ....................................................................................... 103
Fig. B.4 Concrete Mix Design for EW-SF-SRA ........................................................................ 104
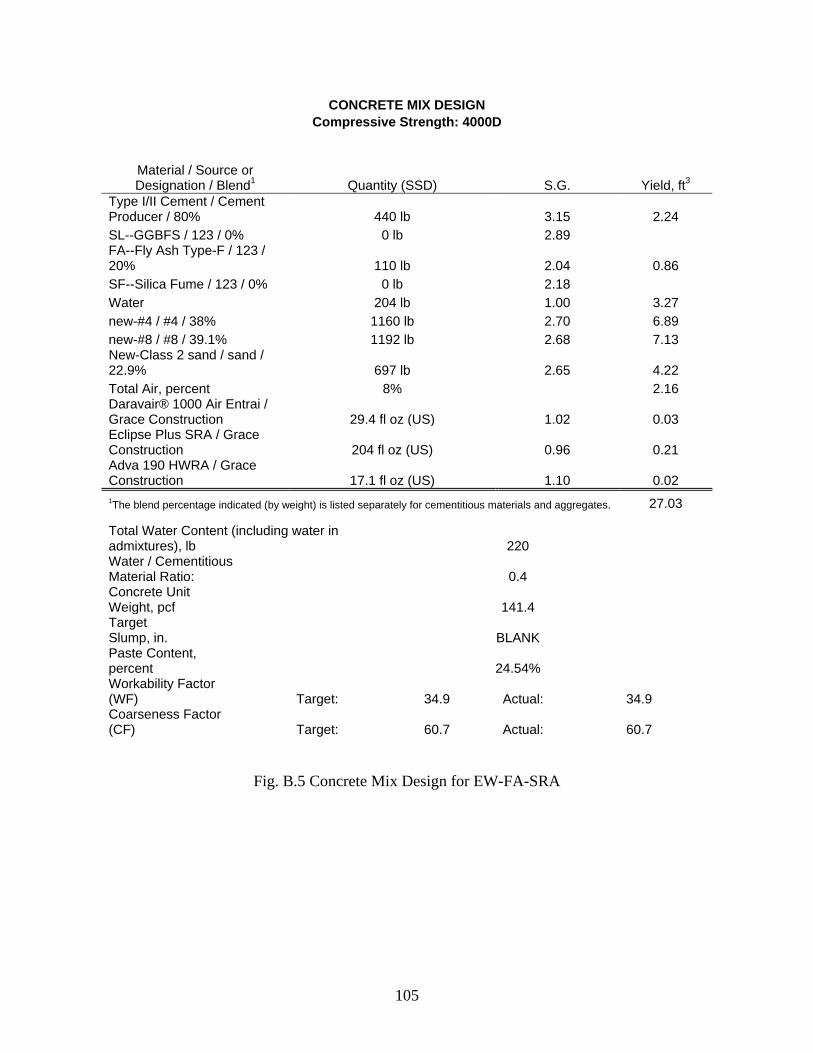
Fig. B.5 Concrete Mix Design for EW-FA-SRA ........................................................................ 105
Fig. B.6 Concrete Mix Design for EW-FA-SL-SRA .................................................................. 106
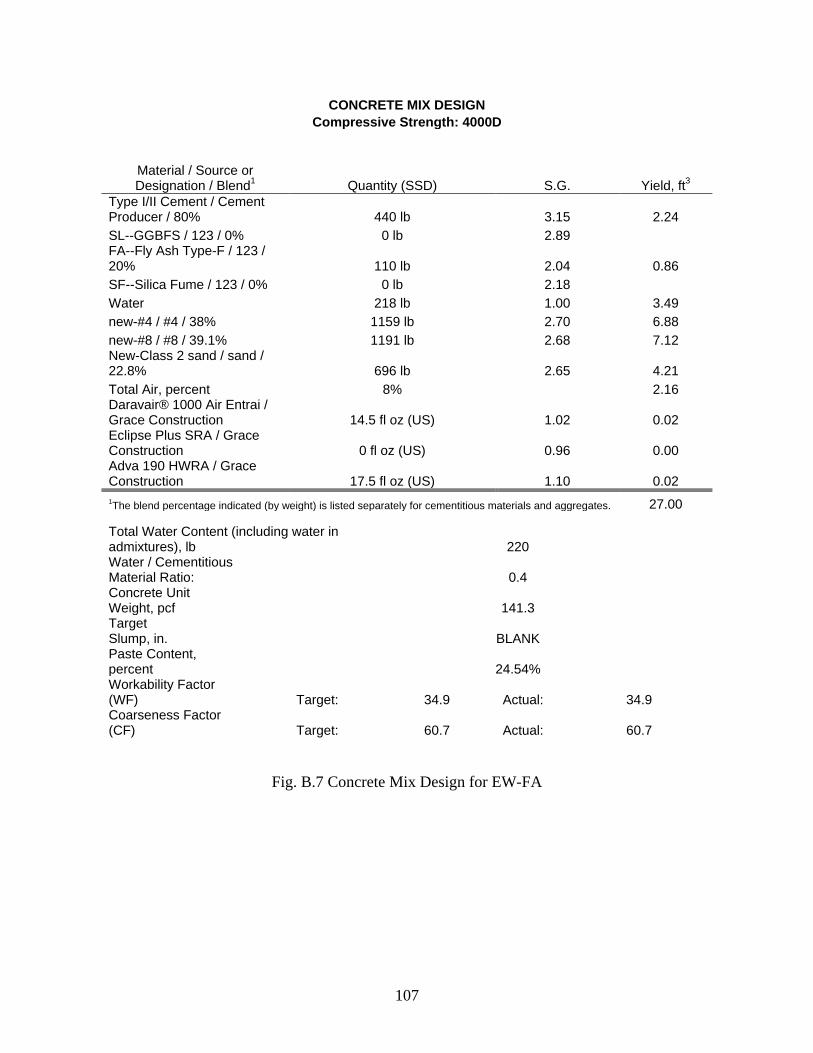
Fig. B.7 Concrete Mix Design for EW-FA ................................................................................. 107
Fig. B.8 Concrete Mix Design for EW-FA-SF-SRA .................................................................. 108
Fig. B.9 Concrete Mix Design for WW-SRA ............................................................................. 109
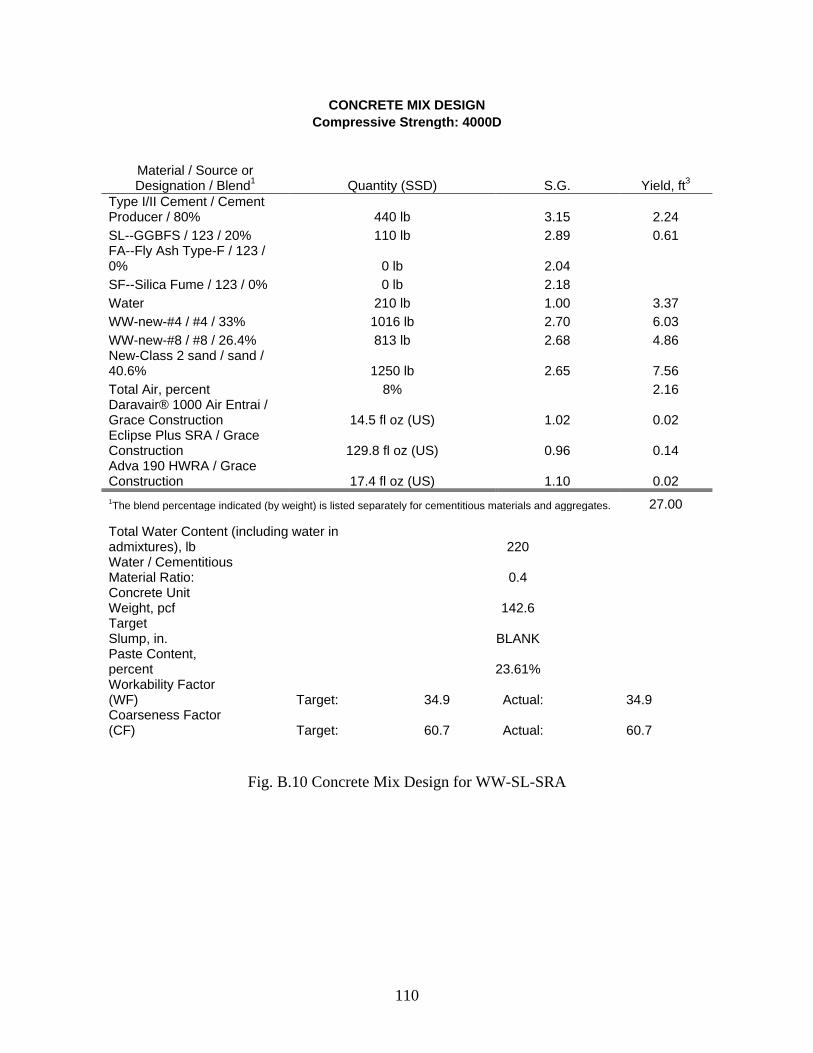
Fig. B.10 Concrete Mix Design for WW-SL-SRA ..................................................................... 110
Page 14
xiv
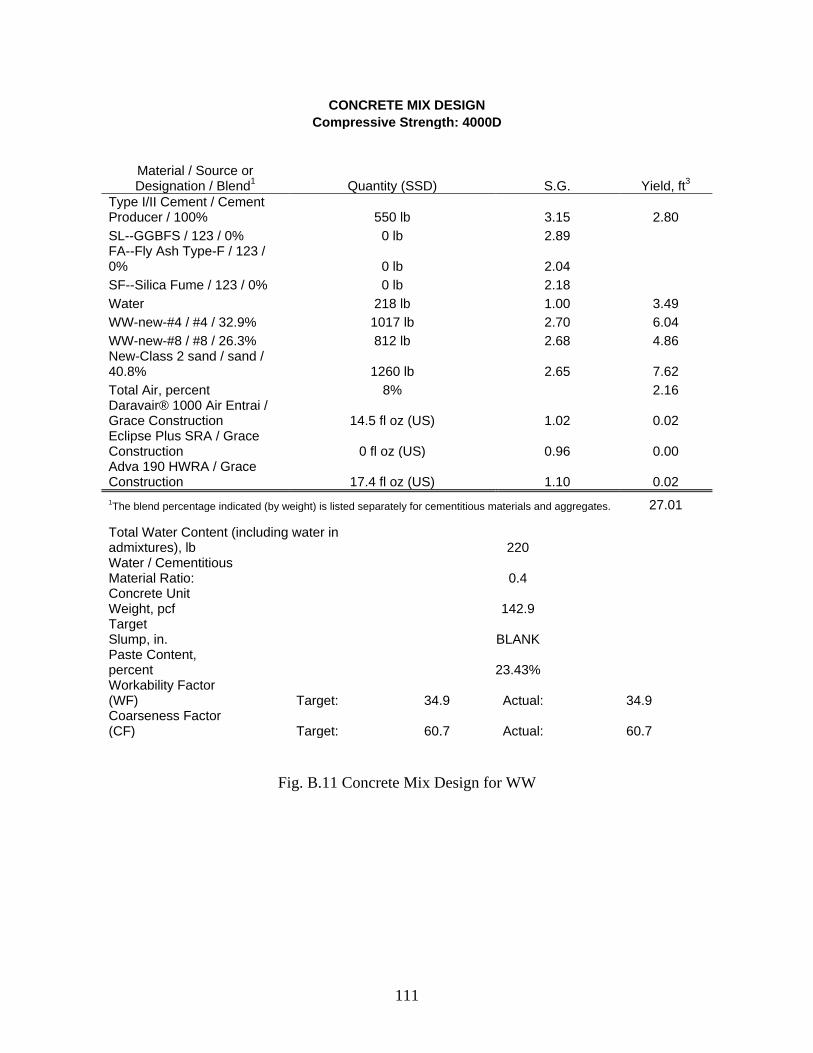
Fig. B.11 Concrete Mix Design for WW .................................................................................... 111
Fig. B.12 Concrete Mix Design for WW-SF-SRA ..................................................................... 112
Fig. B.13 Concrete Mix Design for WW-FA-SRA .................................................................... 113
Fig. B.14 Concrete Mix Design for WW-FA-SL-SRA .............................................................. 114
Fig. B.15 Concrete Mix Design for WW-FA ............................................................................. 115
Fig. B.16 Concrete Mix Design for WW-FA-SF-SRA .............................................................. 116
Fig. C.1a Ring Test for EW-SRA, 6 in. Ring A, from day 1 ...................................................... 117
Fig. C.1b Ring Test for EW-SRA, 6 in. Ring B,, from day 1 ..................................................... 117
Fig. C.1c Ring Test for EW-SRA, 3 in. Ring, from day 1 .......................................................... 117
Fig. C.2a Ring Test for EW-SL-SRA, 6 in. Ring A, from day 1 ................................................ 118
Fig. C.2b Ring Test for EW-SL-SRA, 6 in. Ring B, from day 1 ................................................ 118
Fig. C.2c Ring Test for EW-SL-SRA, 3 in. Ring, from day 1 .................................................... 118
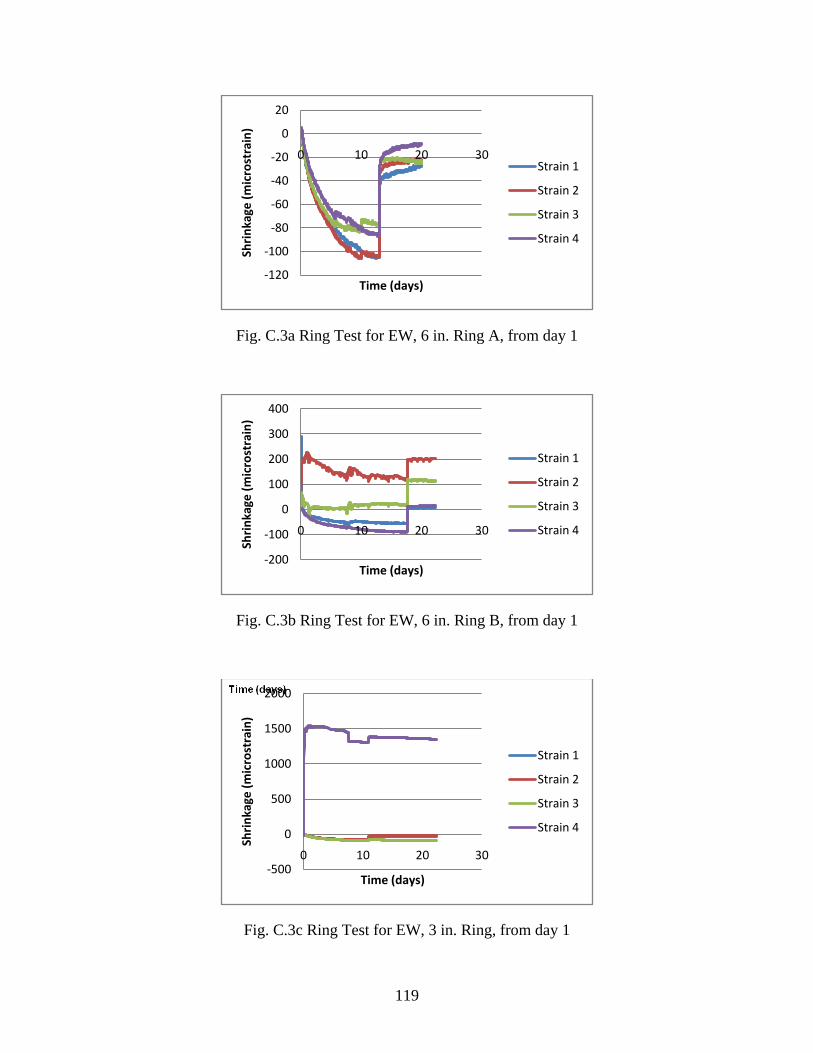
Fig. C.3a Ring Test for EW, 6 in. Ring A, from day 1 ............................................................... 119
Fig. C.3b Ring Test for EW, 6 in. Ring B, from day 1 ............................................................... 119
Fig. C.3c Ring Test for EW, 3 in. Ring, from day 1 ................................................................... 119
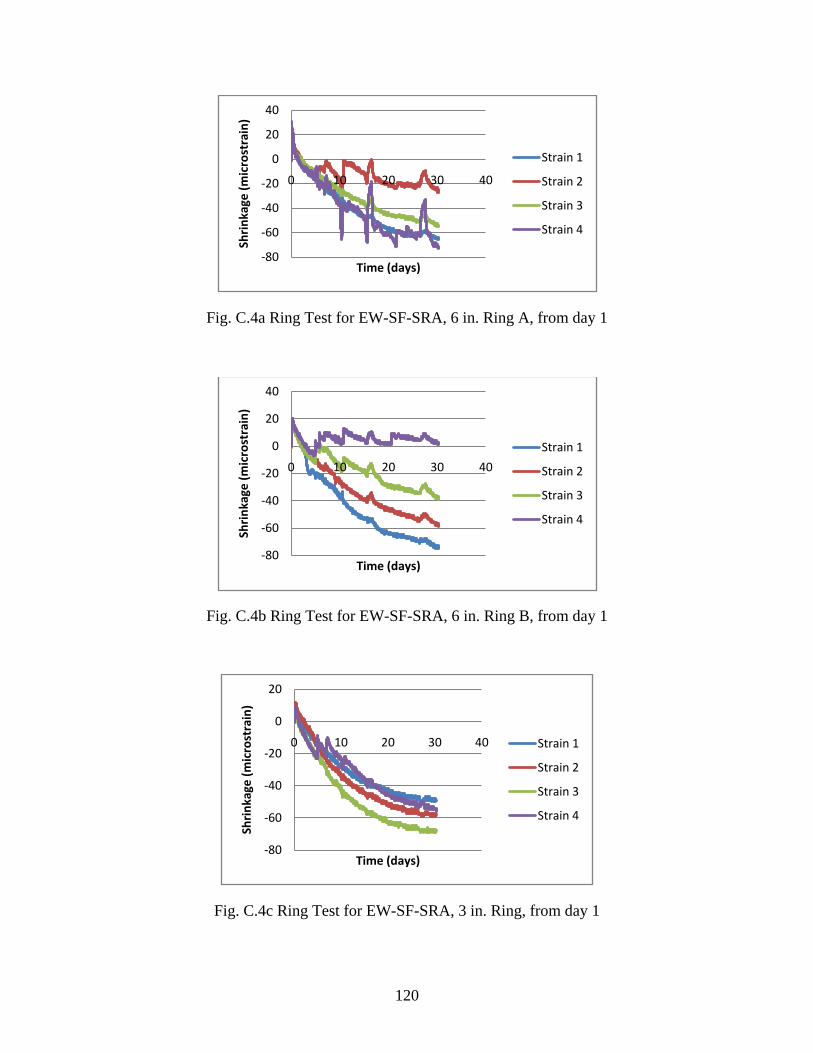
Fig. C.4a Ring Test for EW-SF-SRA, 6 in. Ring A, from day 1 ................................................ 120
Fig. C.4b Ring Test for EW-SF-SRA, 6 in. Ring B, from day 1 ................................................ 120
Fig. C.4c Ring Test for EW-SF-SRA, 3 in. Ring, from day 1 .................................................... 120
Fig. C.5a Ring Test for EW-FA-SRA, 6 in. Ring A, from day 1 ............................................... 121
Fig. C.5b Ring Test for EW-FA-SRA, 6 in. Ring B, from day 1 ............................................... 121
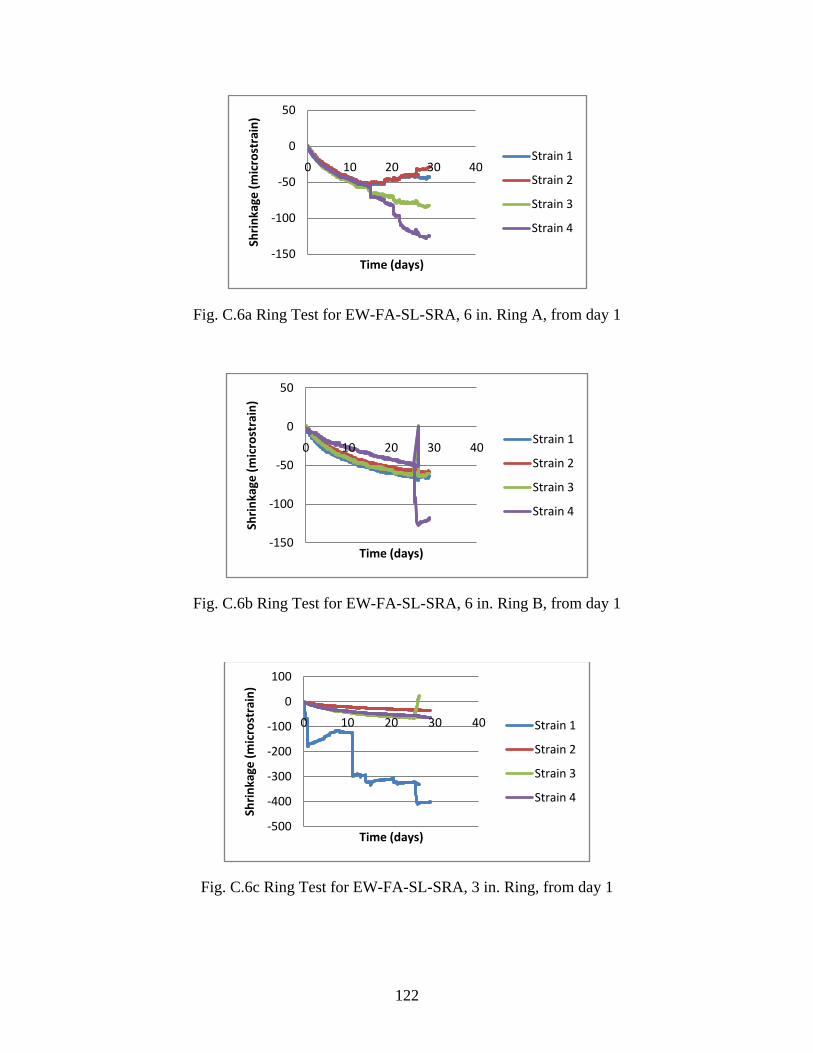
Fig. C.6a Ring Test for EW-FA-SL-SRA, 6 in. Ring A, from day 1 ......................................... 122
Fig. C.6b Ring Test for EW-FA-SL-SRA, 6 in. Ring B, from day 1 ......................................... 122
Fig. C.6c Ring Test for EW-FA-SL-SRA, 3 in. Ring, from day 1 ............................................. 122
Page 15
xv
Fig. C.7a Ring Test for EW-FA, 6 in. Ring A, from day 1 ........................................................ 123
Fig. C.7b Ring Test for EW-FA, 6 in. Ring B, from day 1 ........................................................ 123
Fig. C.7c Ring Test for EW-FA, 3 in. Ring, from day 1 ............................................................ 123
Fig. C.8a Ring Test for EW-FA-SF-SRA, 6 in. Ring A, from day 1 ......................................... 124
Fig. C.8b Ring Test for EW-FA-SF-SRA, 6 in. Ring B, from day 1 ......................................... 124
Fig. C.8c Ring Test for EW-FA-SF-SRA, 3 in. Ring, from day 1 ............................................. 124
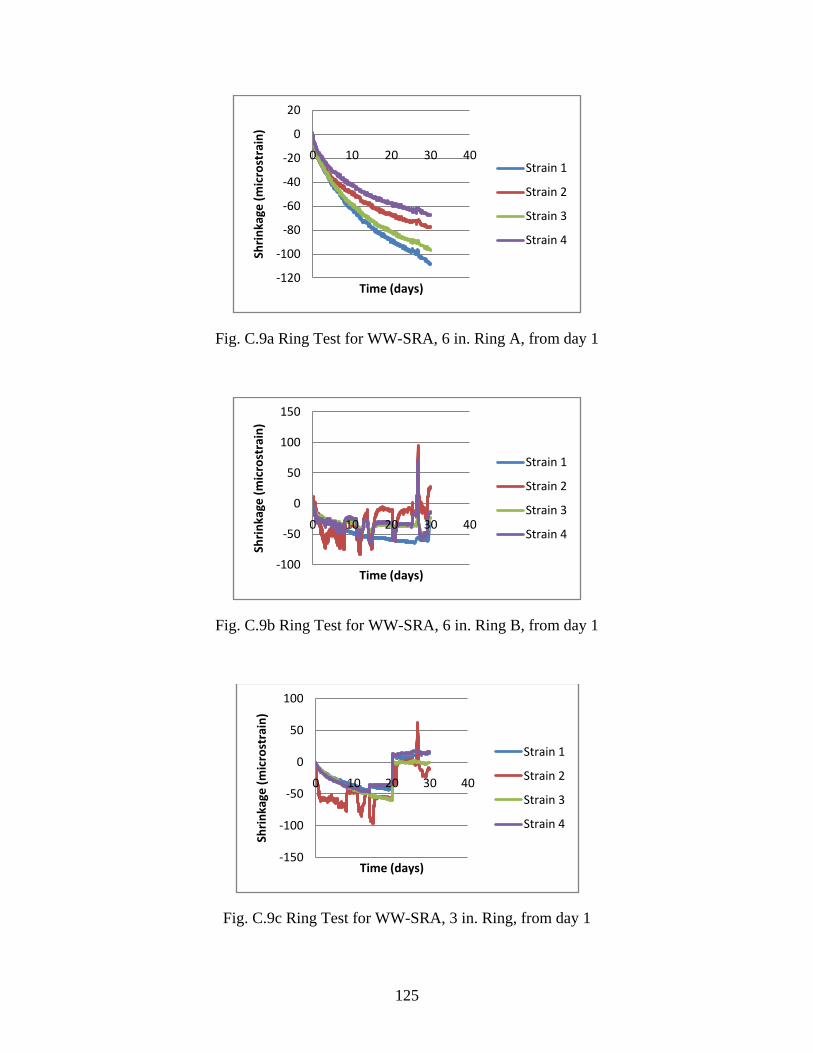
Fig. C.9a Ring Test for WW-SRA, 6 in. Ring A, from day 1 .................................................... 125
Fig. C.9b Ring Test for WW-SRA, 6 in. Ring B, from day 1 .................................................... 125
Fig. C.9c Ring Test for WW-SRA, 3 in. Ring, from day 1 ........................................................ 125
Fig. C.10a Ring Test for WW-SF-SRA, 6 in. Ring A, from day 1 ............................................. 126
Fig. C.10b Ring Test for WW-SF-SRA, 6 in. Ring B, from day 1 ............................................. 126
Fig. C.10c Ring Test for WW-SF-SRA, 3 in. Ring, from day 1 ................................................ 126
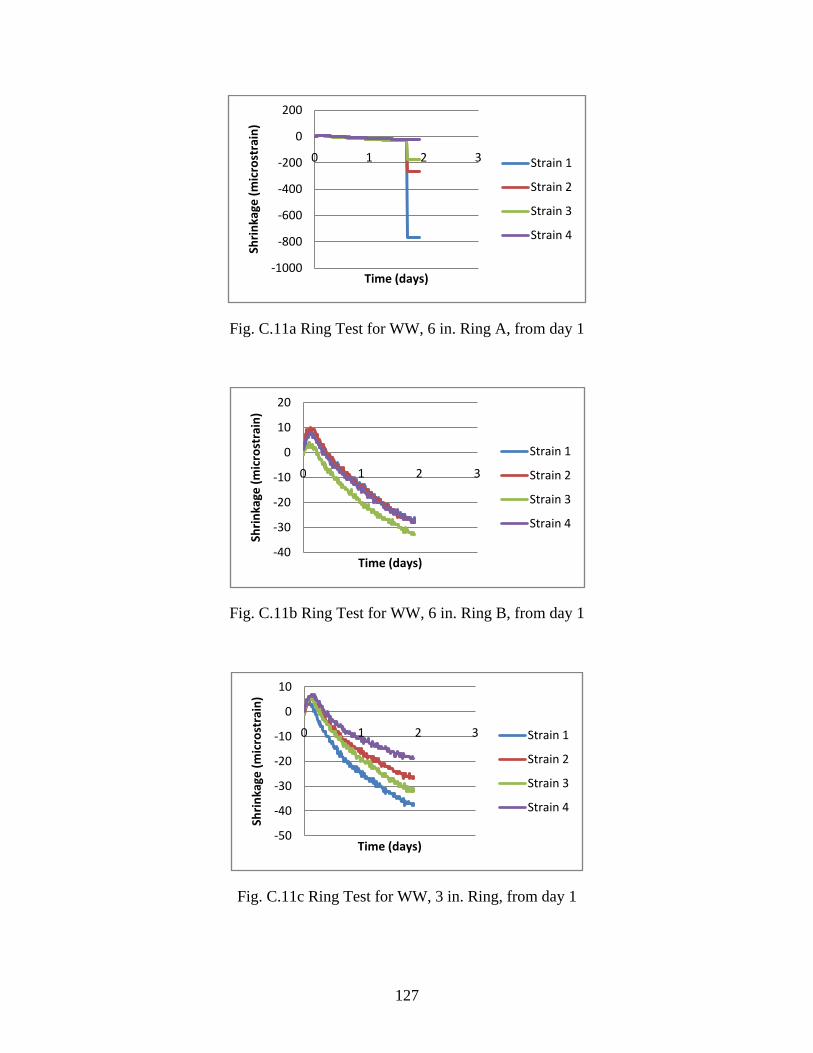
Fig. C.11a Ring Test for WW, 6 in. Ring A, from day 1 ........................................................... 127
Fig. C.11b Ring Test for WW, 6 in. Ring B, from day 1 ........................................................... 127
Fig. C.11c Ring Test for WW, 3 in. Ring, from day 1 ............................................................... 127
Fig. C.11d Ring Test for WW, 6 in. Ring A, from day 4 ........................................................... 128
Fig. C.11e Ring Test for WW, 6 in. Ring B, from day 4 ............................................................ 128
Fig. C.11f Ring Test for WW, 3 in. Ring, from day 4 ................................................................ 128
Fig. C.12a Ring Test for WW-SF-SRA, 6 in. Ring A, from day 1 ............................................. 129
Fig. C.12b Ring Test for WW-SF-SRA, 6 in. Ring B, from day 1 ............................................. 129
Fig. C.12c Ring Test for WW-SF-SRA, 3 in. Ring, from day 1 ................................................ 129
Fig. C.13a Ring Test for WW-FA-SRA, 6 in. Ring A, from day 1 ............................................ 130
Fig. C.13b Ring Test for WW-FA-SRA, 6 in. Ring B, from day 1 ............................................ 130
Page 16
xvi
Fig. C.13c Ring Test for WW-FA-SRA, 3 in. Ring, from day 1 ................................................ 130
Fig. C.14a Ring Test for WW-FA-SL-SRA, 6 in. Ring A, from day 1 ...................................... 131
Fig. C.14b Ring Test for WW-FA-SL-SRA, 6 in. Ring B, from day 1 ...................................... 131
Fig. C.15a Ring Test for WW-FA, 6 in. Ring A, from day 1 ..................................................... 132
Fig. C.15b Ring Test for WW-FA, 6 in. Ring B, from day 1 ..................................................... 132
Fig. C.15c Ring Test for WW-FA, 3 in. Ring, from day 1 ......................................................... 132
Fig. C.15d Ring Test for WW-FA, 6 in. Ring A, from day 4 ..................................................... 133
Fig. C.15e Ring Test for WW-FA, 6 in. Ring B, from day 4 ..................................................... 133
Fig. C.15f Ring Test for WW-FA, 3 in. Ring, from day 4 ......................................................... 133
Fig. C.16a Ring Test for WW-FA-SF-SRA, 6 in. Ring A, from day 1 ...................................... 134
Fig. C.16b Ring Test for WW-FA-SF-SRA, 6 in. Ring B, from day 1 ...................................... 134
Fig. C.16c Ring Test for WW-FA-SF-SRA, 3 in. Ring, from day 1 .......................................... 134
Fig. C.17a Ring Test for LD-WSDOT, 6 in. Ring A, from day 1 .............................................. 135
Fig. C.17b Ring Test for LD-WSDOT, 6 in. Ring B, from day 1 .............................................. 135
Fig. C.17c Ring Test for LD-WSDOT, 3 in. Ring, from day 1 .................................................. 135
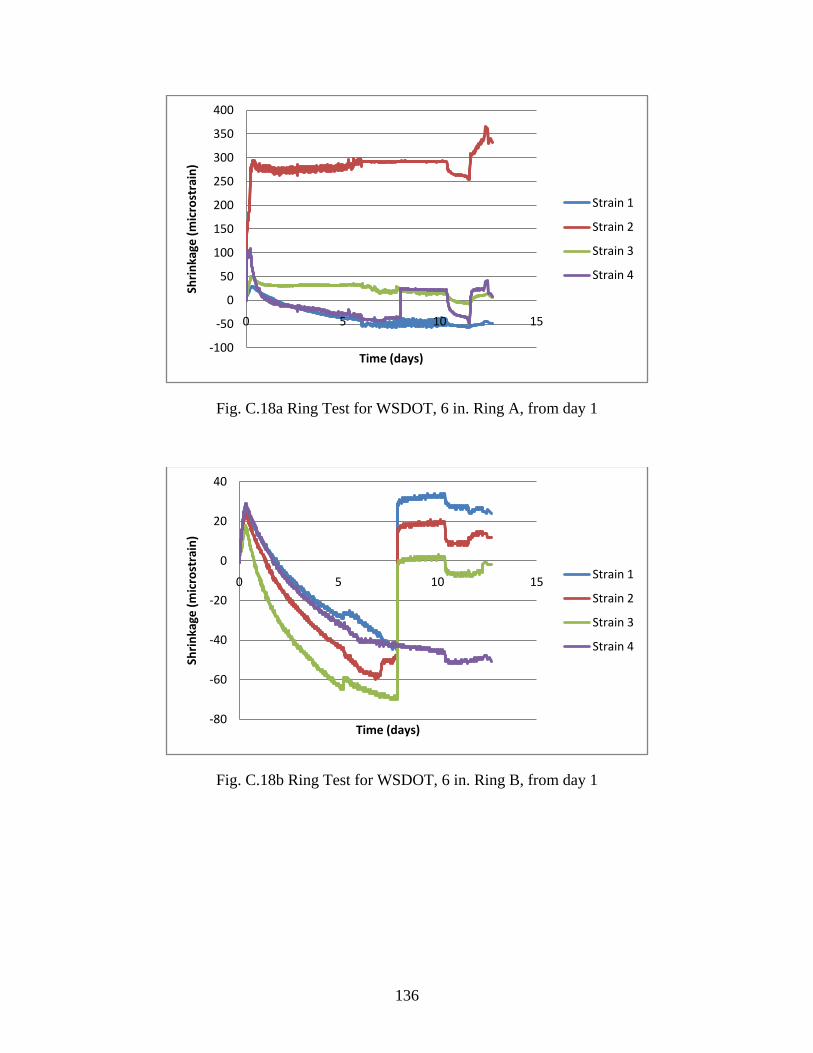
Fig. C.18a Ring Test for WSDOT, 6 in. Ring A, from day 1 ..................................................... 136
Fig. C.18b Ring Test for WSDOT, 6 in. Ring B, from day 1 ..................................................... 136
Fig. C.19a Ring Test for EW 2, 6 in. Ring A, from day 1 .......................................................... 137
Fig. C.19b Ring Test for EW 2, 6 in. Ring B, from day 1 .......................................................... 137
Fig. C.20a Ring Test for EW 2.5, 6 in. Ring A, from day 1 ....................................................... 138
Fig. C.20b Ring Test for EW 2.5, 6 in. Ring B, from day 1 ....................................................... 138
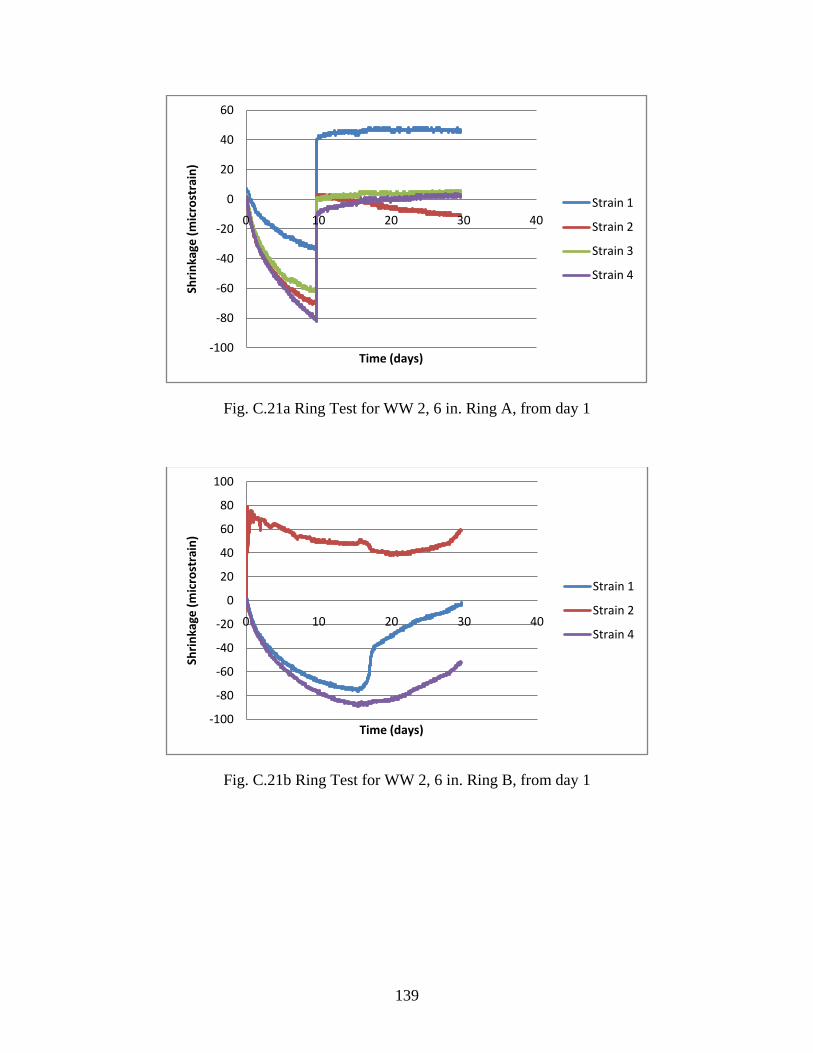
Fig. C.21a Ring Test for WW 2, 6 in. Ring A, from day 1 ........................................................ 139
Fig. C.21b Ring Test for WW 2, 6 in. Ring B, from day 1 ........................................................ 139
Page 17
xvii
Fig. C.22a Ring Test for WW 2.5, 6 in. Ring A, from day 1 ..................................................... 140
Fig. C.22b Ring Test for WW 2.5, 6 in. Ring B, from day 1 ..................................................... 140
Page 18
xviii
Dedication
This thesis is dedicated to my family
who have always given me emotional support.
Page 19
1
CHAPTER ONE
INTRODUCTION
1.1 Problem Statement
Early-age shrinkage cracking of concrete bridge decks is a common problem in the
U.S. When the induced tensile stress is larger than the tensile strength of the concrete,
cracking occurs (Fig. 1.1). According to a survey conducted by Krauss and Rogalla (1996),
more than 100,000 bridges in the U.S. experienced early-age transverse cracking problem
(Fig. 1.2).
The presence of early-age cracking in concrete bridge decks increases the effects of
freeze-thaw damage, spalling due to sulfate and chloride penetration, and corrosion of steel
reinforcement, thus resulting in premature deterioration and structural deficiency of the
bridges. A recent investigation by the Washington State Department of Transportation
(WSDOT) found transverse, full-depth cracks (Fig. 1.3) in the decks of all inspected bridges
developed as a result of early-age concrete shrinkage (occurring within 48 hours after the
deck concrete is poured). These cracks in the bridge decks provide an avenue for water, de-
icing chemicals, sulfates, and other corrosive agents to penetrate into the concrete and
substantially diminish the decks’ service life. Concrete deck repair is expensive and can
result in significant traffic delays. Accordingly, there is an urgent need to reduce the extent of
this cracking and thereby prevent the premature deterioration. Although the concrete
materials, concrete mix designs, design specifications and construction technologies have
changed a lot over the years, shrinkage cracking still remains a significant problem and is
prevalent in construction.
Page 20
2
Fig. 1.1 Mechanism of Cracking (From Neville, 1996)
Fig. 1.2 Early-age Shrinkage Cracking in Concrete Bridge Decks (Crowl and Sutak 2002)
Page 21
3
Fig. 1.3 Transverse, Full-depth Cracks Developed within 48-hour of Pouring
1.2 Objectives and Scope of Study
The objectives of the proposed study are five-fold: (1) to determine the primary causes
of the transverse shrinkage cracking, (2) to identify appropriate mitigation strategies to reduce
or eliminate early-age shrinkage cracking in the concrete bridge decks, (3) to evaluate current
WSDOT concrete mix designs for their mechanical and shrinkage related properties, (4) to
develop and evaluate new concrete mix designs using local materials from Washington for
their mechanical and shrinkage related properties, and (5) to recommend the improved mix
designs and practices to mitigate early-age shrinkage cracking.
1.3 Organizations
Seven chapters are included in this study. Chapter one introduces the problem
statement and objectives of this study. Chapter two provides a literature review on the past
research related to the early-age shrinkage cracking. Chapter three presents the method of
developing new concrete mix designs and the finalized concrete mix designs used in this
Page 22
4
study. Chapter four introduces all the test methods that are adopted in this study. Chapter
five summarizes the test results of concrete mix designs with Eastern Washington aggregates,
while Chapter six is concerned with the test results of concrete mix designs with Western
Washington aggregates. Chapter seven offers concluding remarks and recommendations.
Page 23
5
CHAPTER TWO
LITERATURE REVIEW
2.1 Introduction
This literature review reviews past studies related to this study, identifies the causes of
the early-age cracking in concrete bridge decks and develops recommendations for
appropriate strategies to prevent or minimize this cracking.
Shrinkage cracking of bridge deck can be caused by many different reasons, such as
material properties, restraint types, construction methods, environmental conditions, etc.
Many researchers have performed laboratory studies and literature reviews on shrinkage and
cracking potentials of concrete using different kinds of methods. Also, the American
Association of State Highway and Transportation Officials (AASHTO) and the American
Society for Testing and Materials (ASTM) provide test methods and specifications that can be
used to analyze the behavior of concrete. In this chapter, the previous studies and test
methods are reviewed, and recommendations for the experimental research of this study are
provided.
2.2 Types of Shrinkage
Generally there are three different kinds of shrinkage for concrete: plastic shrinkage,
autogenous shrinkage and drying shrinkage. Plastic shrinkage and autogenous shrinkage
happen at an early age of the concrete, while drying shrinkage takes place over a long period
of time.
Page 24
6
2.2.1 Plastic Shrinkage
Plastic shrinkage is caused by a rapid loss of water on the concrete surface before the
concrete hardens. This loss of water can be caused by many reasons, such as evaporation or
suction by a dry sub-base. In the fresh concrete, concrete materials have not formed into a
whole body and are still surrounded by water. When too much water rapidly evaporates, the
water that remains in the concrete will not be sufficient, and voids occur within concrete,
leading to the occurrence of plastic shrinkage cracking.
According to Schaels and Hoover (1988), environmental conditions, such as wind and
temperature, have great influence on plastic shrinkage cracking of concrete. To reduce plastic
shrinkage, the rate of water evaporation should be reduced. Therefore, when there is a high-
speed wind, concrete casting should be avoided, or wind breaks and fogging should be used to
prevent water loss. Because water evaporation only happens at the surface, plastic shrinkage
cracking only occurs at the surface, and it is usually small.
2.2.2 Autogenous Shrinkage
Autogenous shrinkage happens when the concrete begins to hydrate. It is caused by
the self-desiccation of concrete during the hydration process due to lack of water in concrete
that has a low water-cement ratio. Autogenous shrinkage is also usually small. But for
concrete using high-range-water-reducing admixture (HRWRA) and fine materials, such as
silica fume, it may become an important factor leading to shrinkage cracking (Paillere et al.
1989).
To prevent autogenous shrinkage, low water-cement ratios are not preferred because
there is not enough water for the cement to hydrate. When it is necessary to use low water-
Page 25
7
cement ratio, other methods should be used to compensate for the lack of water due to the low
water-cement ratio in the concrete mix design.
2.2.3 Drying Shrinkage
Indicated by the pattern of early-age transverse cracking, drying shrinkage is present at
bridge decking shrinkage cracking (Krauss and Rogalla, 1996). It is caused by loss of water
in hardened concrete. Drying shrinkage can be explained by three main mechanisms:
capillary stress, disjoining pressure and surface tension, each of which plays an important role
within a certain range of relative humidity (Mindess et al. 2003). Normally bridge decks will
experience relative humidity from 45% to 90%, which is when the capillary stress mechanism
plays the important role.
Many factors can directly affect the drying shrinkage of concrete, such as paste
volume, water-cement ratio, aggregates type, environment conditions and curing methods. Of
all these factors, paste volume is the most important one. Drying shrinkage will be greatly
reduced if the paste volume is reduced (Xi et al. 2003; Tritsh et al. 2005; Darwin et al. 2007;
Delatte et al. 2007).
2.2.4 Creep
While early-age cracking in bridge deck is mainly due to concrete shrinkage, creep
helps to relax shrinkage. The study by Altoubat et al. (2001) found that the tensile creep
relaxes the shrinkage stress by 50% and doubles the failure strain capacity. It is generally
believed that creep will help reduce shrinkage of concrete, as the mechanism shown in Fig.
1.1.
Page 26
8
2.3 Effect of Concrete Properties on Deck Cracking
2.3.1 Paste Content and Water-to-cement Ratio
As aforementioned, paste content is a very important factor that affects the shrinkage
behavior of bridge decks, since it leads to volume changes. Reducing paste content results in
a decrease in free shrinkage (Bissonnette et al. 1999; Darwin et al. 2007). Water content
plays two roles. Increasing water content increases the shrinkage tendency of concrete, and at
the same time increases creep. Creep can help reduce shrinkage.
Decreasing the water-to-cement ratio can decrease drying shrinkage but at the same
time it increases autogenous shrinkage. Bissonnette et al. (1999) and Darwin et al. (2007)
stated that free shrinkage is not significantly influenced by the water-to-cement ratio.
However, Weiss et al. (1999) concluded that the concrete with a low water-to-cement ratio
may be more likely to develop early-age cracking due to increased autogenous shrinkage.
There is no definitive conclusion of the effect of water-cement ratio. It is generally believed
that a very high water-to-cement ratio will cause more shrinkage.
As a result, the cement content and the water-to-cement ratio are limited to reduce the
risk of shrinkage cracking. Literature indicates that a minimum cement content should be
suggested to reduce cracking (Brown et al. 2001). The experimental study by Xi et al. (2003)
showed that a concrete mix with a cement content of about 470 lb/yd3 and water-to-cement
ratio of about 0.4 could be a possible optimum mix.
2.3.2 Cement Type
Cement type also plays an important role in shrinkage cracking of bridge decks, as the
drying shrinkage of concrete is affected by the cement fineness. Finer cement particles
Page 27
9
generate greater heat of hydration and require a greater amount of water during the hydration
process, which may lead to the increased risk of cracking in the concrete. As a result, Type II
Portland cement is preferred to reduce cracking. Replacing Type I/II Portland cement with
Type II Portland coarse-ground cement lowers the free shrinkage and shrinkage rate, and
adding a shrinkage-reducing admixture significantly reduces these values (Tritsch et al. 2005).
2.3.3 Aggregates Size and Type
The properties of concrete depend on cement paste and aggregates. In contrast to the
cement paste, aggregates do not shrink or creep. When cement paste shrinks, aggregates
provide restraint. Krauss and Rogalla (1996) found that aggregate type is the most significant
factor affecting concrete cracking. It is generally believed that larger aggregates decrease the
cracking tendency of bridge decks. Large aggregates can form a rigid frame in the concrete,
which prevent cement paste from shrinking freely. However, as bridge decks are becoming
thinner, the optimized aggregate size to both resist shrinkage cracking and satisfy workability
requirements should be studied. The properties of aggregates determine the amount of
restraints that will be applied to cement paste.
Burrows (1998) found that limestone aggregate has higher resistance to cracking than
other types of aggregates. It has the best restraint when the aggregate does not shrink at all.
Also, the ratio of elastic moduli of aggregate and cement is important on the shrinkage of
concrete. If the ratio cementaggregate EE / is higher, then the concrete has lower shrinkage
potential (Troxell et al. 1958).
Page 28
10
2.3.4 Air Content
Past literature shows no definite conclusion about the effect of air content on the
shrinkage cracking of bridge decks (Xi et al. 2003). Schmitt and Darwin (1995) suggested
that an air content of 6% by volume or more should be considered.
2.3.5 Slump
Slump is used as an indicator of concrete workability. If there is an excessive slump
caused by high water-to-cement ratio, the concrete will have a high shrinkage. Krauss and
Rogalla (1996) found that concrete mixes with a low water-to-cement ratio, low cement
content, and low slump performed best. Generally, the slump of concrete is controlled within
a reasonable range, and there is no definite relation between the change of slump and the
change of cracking tendency of concrete.
2.4 Cementitious Materials and Admixtures in Concrete
2.4.1 Silica Fume
Silica fume is a pozzolanic material, and its particle size is about 1.0 µm. The use of
silica fume in concrete can achieve a lower permeability, which is good for the durability
issues of bridge decks. However, it has a high hydration heat so that it has a higher tendency
of plastic shrinkage cracking. Autogenous shrinkage may be aggravated by the use of silica
fume as well (Mindess et al. 2003).
NCHRP Report 410, “Silica Fume Concrete for Bridge Decks,” concluded that
cracking tendency of concrete was influenced by the addition of silica fume only when the
concrete was improperly cured. When concrete is cured for 7 days under continuously moist
Page 29
11
conditions, there is no statistically significant effect of silica fume on the tendency of the
concrete to exhibit early-age cracking. Darwin et al. (2007) stated that when cast with a high-
absorption coarse aggregate, the addition of silica fume results in a reduction in shrinkage at
all ages. Mazloom et al. (2004) studied the replacement of cement with 0%, 6%, 10%, and
15% of silica fume and concluded that the percentage of silica fume replacement did not have
a significant influence on the total shrinkage of concrete, but the autogenous shrinkage
increased as the increase of silica fume. Krauss and Rogalla (1996) contended that the effect
on early-age shrinkage cracking of silica fume is still not clear. Thus, the moderate content of
silica fume in a range of 6-8% by mass of cementitious materials in concrete was
recommended. When it is used, fog sprays or keeping moist after the placement of concrete is
suggested for 7 days continuously (Schmitt and Darwin 1995).
2.4.2 Fly Ash
Fly ash is also a pozzolanic material. It is used to replace part of the Portland cement
in the concrete mixture so that the rate of concrete hydration will slow down. Thus, the rate
of early-age strength gain is also reduced, which leads to less cracking tendency. Fly ash also
improves the workability of concrete, such as enhancing the ultimate strength of concrete and
reducing the permeability of concrete. However, Darwin et al. (2007) stated that when cast
with a high-absorption coarse aggregate, the addition of fly ash increases initial shrinkage and
only slightly reduced ultimate shrinkage.
The percentage replacement of fly ash for Portland cement should be concerned
during the application of fly ash as different amount of fly ash in a concrete mix affects the
Page 30
12
properties of the concrete. Fly ash is now commonly used as one additive in concrete
mixtures as many state DOTs use it in their concrete mix design.
Generally, there are two types of fly ash, Class F and Class C. Class F fly ash
possesses pozzolanic properties but does not have self-cementing properties. Class C fly ash
has both pozzolanic and self-cementing properties. Based on the specific cement, the
percentage replacement of portland cement should be determined accordingly (Xi et al. 2003).
2.4.3 Ground Granulated Blast-Furnace Slag (GGBFS)
Ground granulated blast-furnace slag (GGBFS) is added to Portland cement to
increase the concrete strength and durability. The use of GGBFS can improve the strength as
well as the durability of concrete. NCHRP Report 566 “Guidelines for Concrete Mixtures
Containing Supplementary Cementitious Materials to Enhance Durability of Bridge Decks,”
recommended that the addition of fly ash or GGBFS to the concrete does not generally affect
the cracking tendency of the concrete greatly if the total cementitious volume is not changed.
Cracking (drying shrinkage) might be reduced if the improved workability of the mixture
containing the fly ash or GGBFS contributes to reduced water demand and reduced paste
volume (Lawler et al. 2007).
2.4.4 Shrinkage-Reducing Admixtures
As discussed before, bridge decks will normally experience relative humidity from
45% to 90%, which is when the capillary stress mechanism plays the important role.
Shrinkage-reducing admixtures (SRA) can lower the surface tension of pore water, thus
reducing drying shrinkage.
Page 31
13
Many researchers have found that the use of SRA in concrete reduced the shrinkage
and cracking tendency (Shah et al. 1992; Brown et al. 2001; Tritsch et al. 2005; Brown et al.
2007). Weiss et al. (2002; 2003) stated that SRA significantly enhanced the cracking
resistance of concrete by reducing the rate of shrinkage and the overall magnitude of
shrinkage. SRA reduced the surface energy of the water so there is less tension to make the
concrete shrink. However, research (Folliard and Berke 1997; Weiss et al. 2003) also found
that SRA may cause a slight decrease in the compressive strength of concrete.
2.4.5 Fiber Admixture
When fiber is added to concrete, the property of concrete changes in relation with the
amount of fiber added. Steel fiber can improve the strength of concrete. Shah and Weiss
(2006) stated that the inclusion of randomly distributed steel fibers can slightly delay the age
of visible cracking. Because fibers act as restraint inside the concrete, they can reduce the
amount of cracking (Sun et al. 2000; Banthia 2000). The fibers only play a role when
cracking is developed, and they are thus useful for post-cracking control.
2.5 Other Factors Related to Shrinkage Cracking
2.5.1 Restraint Type
After concrete hardens, the concrete deck endures restraint from both inside and
outside the concrete. The outside supporting girders apply strong restraint to the concrete
bridge deck, which constrains the shrinkage deformation of the deck. At the same time, the
internal reinforcement of the concrete deck also constrain the shrinkage of the concrete.
Therefore, the concrete deck experiences high stress, which may lead to its cracking. French
Page 32
14
et al. (1999) found that bridge decks on simple-supported prestressed girders showed
significantly less cracking than decks on continuous steel girders in their field study. Krauss
and Rogalla (1996) found that decks supported by steel girders usually have higher risks of
transverse deck cracking and higher tensile stresses than the ones with concrete girder
construction. Rogalla et al. (1995) found that larger girder and closer spacing tend to be more
prone to cracking. So using smaller girder and wider spacing will reduce the cracking
tendency.
2.5.2 Construction Method
Construction method may have a very large influence on the early-age shrinkage
cracking of concrete bridge decks. It is suggested that placing positive moment regions
successively on one day and then after three days placing negative moment regions may
minimize cracking (Issa 1999).
Finishing is also a factor that affects early-age bridge deck shrinkage cracking. The
literature stated that a delayed finishing can cause concrete to crack more easily (Krauss and
Rogalla 1996).
Curing is also an important factor that influences early-age bridge deck shrinkage
cracking. Immediately after finishing, use of wet curing should be applied (Babaei and Purvis
1996).
2.5.3 Environmental Conditions
Concrete should be placed during cool weather to reduce cracking, because the
hydration reaction will slow down in low temperature, thus reducing the heat that is generated
Page 33
15
from the hydration process. So the thermal stress is controlled to be a small amount, which
will help to reduce early-age thermal cracking. Other times that will increase the temperature
in concrete during the hydration process should also be avoided, such as the time around
noon. The study by French et al. (1999) recommended that the ambient air temperature
ranged between highs of approximately 18 to 21 Co (65 to 70 Fo ) and lows of approximately
7 to 10 Co (45 to 50 Fo ).
When the wind is strong, windbreaks should be used to keep the concrete moist and
prevent high evaporation of concrete surface water. Windbreaks or fogging should be used if
the wind speed is more than 0.2 lb/ft2/hr.
2.6 Test Methods
2.6.1 General Review on Test Methods of Concrete Shrinkage Cracking
Many researchers have developed different methods of evaluating the shrinkage
cracking
tendency of concrete using a wide range of test apparatus. Tritsch et al. (2005) divided these
restrained shrinkage tests into three categories: plate tests, linear tests, and ring tests.
In the plate tests, flat concrete specimens were tested. Different researchers used
different specimen dimensions and different test details. But usually those specimens are thin
and the maximum aggregate sizes are small or no coarse aggregates are used. In some tests
the results were inconsistent and conflicted with each other. Free shrinkage tests are also
considered as an addition to these restrained tests.
The linear test used specimens of rectangular cross section. Specimens of many
different dimensions were used in these tests, such as 8.5 x 12 x 150 cm (3.4 x 4.7 x 59 in.)
Page 34
16
(Paillère et al. 1989), and 40 x 40 x 1,000 cm (1.6 x 1.6 x 39.4 in.) (Bloom and Bentur 1995).
In these linear tests, one end of the concrete specimen is fixed, and the other end is connected
to an instrument that applies and records the force that is required to keep the specimen in its
original length. A companion specimen with the same dimension is also cast, with one end
fixed and the other free to shrink, as a control specimen to the restrained one.
The ring test was used by many researchers to evaluate the shrinkage cracking
tendency and behavior of concrete and cement-based materials under restraint. It is the most
common test method used. Many different concrete rings were tested under a variation of
restrained conditions. The dimensions of the concrete ring as well as the test procedure vary
greatly from each other. More details on the ring tests are presented in Section 1.6.3.
2.6.2 Cracking Frame and Fracture Energy
Réunion Internationale des Laboratoires d'Essais et de recherche sur les Matériaux et
les Constructions (RILEM) uses the cracking frame method as a standard test TC 119 for
cracking evaluation. The cracking frame as shown in Fig. 2.1 was developed by
Springenschmid (1994) after an extensive research on the test methods for restrained
shrinkage of concrete was conducted.
Page 35
17
Fig. 2.1 Cracking Frame (Springenschmid et al. 1994)
The cracking frame can be used for the contraction test as well as the expansion test of
concrete, and the restraint stresses are recorded continuously. Comparing with the ring test,
the cracking frame can represent the actual restraint conditions of the concrete bridge decks
caused by the restraint from girders. As shown in Fig. 2.1, the test is made up of a concrete
beam and two surrounding steel bars in the longitudinal direction and also two steel cross-
heads at each end. In the cracking frame, the concrete can be cooled to the surrounding
temperature. It is first inspected for four days. If it does not crack in four days, its
temperature is decreased at a fixed rate until cracking occurs. The temperature that cracking
occurs is recorded as an indication of the cracking resistance property of the concrete mix in
actual service conditions. The lower this temperature can be, the better the cracking
resistance.
Fracture energy of concrete can be used to evaluate the drying shrinkage cracking
property of concrete. Guo and Gilbert (2000) showed that the fracture energy can represent
the actual amount of energy that is needed for a crack to occur upon unit area or fracture
Page 36
18
surface. In this test, a three-point bending test is performed upon a notched beam, and the
displacement of the beam and corresponding applied load are recorded. By using the
recorded load-displacement curve and some data reduction equations, the fracture energy of
the beam can be calculated, from which the relation between the fracture energy and the
cracking resistance behavior of the beam can be established.
2.6.3 Ring Test Method
As aforementioned, the ring test method is used to evaluate the relative drying
shrinkage cracking tendency of different concrete mixes under different conditions. The ring
test restrains the concrete using a steel ring, thus inducing a stress on the surrounding concrete
ring. When this stress becomes larger than the tensile strength of the concrete ring, the
concrete ring will crack. The times that it takes for rings made of different concrete mixes to
crack are recorded and then compared with each other. The longer it takes a concrete ring
specimen to crack, the lower tendency of drying shrinkage cracking it has.
The ring test is simple and easy to conduct. Also, it evaluates most of the important
factors that affect the drying shrinkage cracking tendency at one time. Furthermore, the
cracking in the concrete ring is easily recognized and recorded. Therefore, the ring test
method has become the most popular method for evaluating the restrained drying shrinkage of
concrete.
Both the American Association of State Highway and Transportation Officials
(AASHTO) and the American Society for Testing and Materials (ASTM) have a developed
ring test as one of their standard tests, and they are:
• AASHTO PP34-99. “Practice for Estimating the Crack Tendency of Concrete”.
Page 37
19
• ASTM C 1581-04. “Standard Test Method for Determining Age at Cracking and
Induced Tensile Stress Characteristics of Mortar and Concrete under Restrained
Shrinkage”.
2.6.3.1 AASHTO Ring Test
The AASHTO ring test is used to compare the relative restrained shrinkage cracking
tendency of different concrete mix designs. It can be used to compare factors such as cement
paste content and water-to-cement ratio, cement type, aggregates size and type, air content,
slump and admixtures in concrete as related to the time and cracking relation of concrete.
However, it does not take the specific restraint type, the construction method and
environmental conditions into consideration, so it cannot predict the concrete cracking in
actual service. The standard utilizes the following apparatus as shown in Fig. 2.2.
Page 38
20
Fig. 2.2 Diagrams of Ring Specimen (Reprinted from AASHTO PP34-99)
The standard inside steel ring has a wall thickness of 12.7 ± 0.4 mm (1/2 ± 1/64
in.), an outside diameter of 305 mm (12 in.), and a height of 152 mm (6 in.). However,
structural steel pipe conforming to ASTM A 501 or A 53M/A 53 12-in. extra-strong pipe with
an outside diameter of 324 mm (12 ¾ in.) and wall thickness 13 mm (1/2 in.) may be
substituted. The outer ring can be made of 6.4 mm thick (1/4 in.) cardboard form tube
(sonotube) with an inside diameter of 457 mm (18 in.). Four strain gages are mounted on the
inner surface of the steel ring at equidistant points at midheight. Data acquisition equipment
A
A
Wooden Base
Concrete Specimen
Steel
280 mm
305 mm
457 mm
152 mm
Section A-A
Page 39
21
shall be compatible with the strain instrumentation and automatically record each strain gage
independently. Forms can be made of 24 in. by 24 in., 5/8 in. thick (0.6 x 0.6 x 0.016 m)
plywood sheet; or resin-coated or polyethylene-coated plywood. Curing can be applied by
using prewetted burlap covered with plastic.
The outer forms are removed at an age of 24±1 hr, and then the specimens are moved
to the condition room with a constant air temperature of 73.5 ± 3.5 Fo (23 ± 2 Co ) and 50 ± 5
% relative humidity. The time and strain from the strain gages are recorded every 30 minutes,
and review of the strain and visual inspection of cracking is conducted every 2 or 3 days. A
sudden strain decrease of more than 30 micro strain in one or more strain gages usually
indicates cracking. After the concrete ring cracks, record the time and the cracking length and
width on the exterior radial face.
2.6.3.2 ASTM Ring Test
Similarly, the ASTM ring test is also used to evaluate the relative drying shrinkage
cracking tendency of concrete under restraint. It can also be used to compare factors such as
cement paste content and water-cement ratio, cement type, aggregates size and type, air
content, slump and admixtures in concrete as related to the time and cracking relation of
concrete. As with the AASHTO ring test, the ASTM ring test does not take the specific
restraint type, construction method and environmental conditions into consideration, and
therefore, it cannot predict the concrete cracking in actual service.
The standard inside steel ring has a wall thickness of 0.50 ± 0.05 in. (13± 0.12mm), an
outer diameter of 13.0 ± 0.12 in. (330 ± 3.3mm) and a height of 6.0 ± 0.25 in. (152 ± 6mm).
At least two electrical resistance strain gages are wired in a quarter-bridge configuration.
Page 40
22
Data acquisition system should be compatible with strain instrumentation and automatically
record each strain gage independently with resolution ± 0.0000005 in./in. at intervals no
greater than 30 minutes. The base can be made of epoxy coated plywood or other non-
absorptive and non-reactive surface. The outer ring can be made of PVC pipe or Steel outer
ring or other, in accordance with F441, with 16.0 ± 0.12 in. (406 ± 3 mm) inside diameter and
6.0 ± 0.25 in. (152 ± 6 mm) height. The testing environment has the condition of 73.5 ± 3.5
Fo (23.0 ± 2.0 Co ) and 50 ± 4% relatively humidity. The dates and strain from the strain
gages must be recorded at least every 30 minutes. Record ambient temperature and relatively
humidity every day. A sudden decrease of more than 30 microstrain in compressive strain in
one or both strain gages indicate cracking. After the concrete ring cracks, record the time and
the cracking length and width on the exterior radial face. Monitor the specimen for two
additional weeks after cracking.
2.6.3.3 Comparison between the AASHTO and ASTM Ring Tests
In general, both the AASHTO Ring Test and the ASTM Ring Test use the same
theory and procedures. However, there are some differences between the two methods. The
main differences between them are the concrete ring dimensions and the maximum size of
aggregates allowed. The AASHTO standard concrete ring is 3 in. thick, with inner diameter
of 12 in. and outer diameter of 18 in., whereas the ASTM concrete ring is 1.5 thick, with inner
diameter of 13 in. and outer diameter of 16 in. The ASTM requires that the maximum size of
aggregate should be less than 1/2 in., while there is no specific requirement in the AASHTO.
Because the concrete ring is thicker in AASHTO than in ASTM, AASHTO allows greater
aggregate size. Also, the duration of the ASTM test is 28 days; while there is no specified
Page 41
23
duration in AASHTO. Because the AASHTO concrete ring is thicker, it will need more time
to crack. So typically the AASHTO ring test may last for 56 days to 90 days (Delatte et al.
2007). The curing conditions are also slightly different between the two test methods.
2.6.3.4 Effect of Geometry of the Ring Test
As mentioned previously, ring tests of many different dimensions have been
conducted in the past, and the results are not the same. The dimensions play an important role
in determining the properties of concrete mixes in the ring test. A finite element analysis was
performed by Krauss and Rogalla (1996) on the ring test. Their analysis showed that when
the inner steel rings have the thicknesses between 13 mm (1/2 in.) and 25 mm (1 in.), the
stress and drying shrinkage tendency of concrete are not very different. A thinner inner steel
ring induces larger steel stress, and a thicker inner steel ring induces larger concrete stress.
Also, the concrete shrinkage stress reduces when the height of the concrete ring increases
from 76 mm (3 in.) to 152 mm (6 in.). Thus, a thicker and shallower steel ring induces high
stress in concrete as expected.
Delatte et al. (2007) compared the ring geometry using two sets of specimens. Both
sets used two 406 mm (16 in.) and two 457 mm (18 in.) outer diameter concrete rings cast
around inner steel ring of 12 in. diameter at the same time from the same mixture. From their
study, they developed an equation for time-to-crack versus ratio of ring radii:
3188.013.00025.0 2
i
o ++−= ttRR
(1.1)
where
oR is the outside radius of concrete ring;
Page 42
24
iR is the inside radius of the concrete ring; and
t is the time to crack.
2.6.4 Summary of Test Methods
As reviewed in this section, several test methods have been developed for measuring
the drying shrinkage cracking tendency of specimens consisting of different concrete mixes or
other different conditions. Among these methods, the ring test method is simple and easy to
conduct, and it can be used to compare most of the factors that affect the cracking tendency of
concrete at the same time. Also, it is easier for the concrete to develop visual cracks.
Because of these merits, the ring test method was adopted by many researchers. However, it
should be noticed that the ring test method only reflects the relative cracking tendency of
concrete with different mixes and different conditions, and it cannot represent the concrete in
actual service life.
The ring test method will be adopted in this study. The AASHTO PP34-99 will be
considered using structural pipe with an outside diameter of 324 mm (12.75 in.). The
AASHTO ring test for this study produces concrete ring thickness of 66.5 mm (2.625 in.).
The ASTM ring test produces concrete rings of 38 mm (1.5 in.), which limited the maximum
size of aggregate to be 13 mm (1/2 in.). In this study, we will include aggregates with
maximum nominal size of 1.5 in. or larger.
2.7 Other Related Work
Folliard and Berke (1997) evaluated the effect of shrinkage-reducing admixture
(SRA) on high-performance concrete properties. The mechanical properties, free shrinkage
Page 43
25
and restrained shrinkage cracking were investigated. For the restrained ring test, a concrete
ring with 50 mm (2 in.) thickness and 150 mm (6 in.) height was cast around a steel pipe with
inner diameter of 250 mm (10 in.) and outer diameter of 300 mm (12 in.). Then, the
specimens were put into drying condition of 20 Co and 50% RH. Free shrinkage concrete
prisms were 75 x 75 x 285 mm (3 x 3 x 11.2 in.). Their study concluded that the use of SRA
greatly reduced drying shrinkage cracking in laboratory ring specimens, despite concrete
containing SRA exhibited lower early strengths than companion mixtures without SRA.
Xi et al. (2001) studied the development of optimal concrete mix design for bridge
decks. Four different tests (i.e., compressive strength test, rapid chloride permeability test,
restrained ring test, free shrinkage test) were performed to evaluate the properties of concrete.
The AASHTO ring test was adopted with modification. Two concrete rings of 6 in. height
with 12 in. and 18 in. inner and outer diameters were cast for each concrete mix. After one
day of curing, the specimens were put in the lab with temperature of 72 Fo and relative
humidity of 35%. Two concrete beams of 3 x 3 x 12 in. were made for the free shrinkage test
for drying shrinkage test. Their study included two phases. 18 mix designs were formulated
in Phase I to get some good mixes that satisfied requirements. Phase II was to finalize the
good mix designs from Phase I to be used in the field. It was found that cracking was related
to the cement content. A proper increase of coarse aggregate could reduce cracking
potentially; Class F fly ash had better cracking resistance than Class C fly ash.
Tritsch et al. (2005) evaluated the shrinkage and cracking behavior of concrete using
the restrained ring and free shrinkage tests. Their study was made of a series of preliminary
tests and three test programs. The steel ring had a thickness of 13 mm (1/2 in.) with an
outside diameter of 304 mm (12 in.). The concrete ring specimens were 76 mm (3 in.) or 51
Page 44
26
mm (2 in.) thick. Both the steel and concrete rings were 76 mm (3 in.) tall. In each program,
the concrete was exposed to drying condition of about 21 Co (70 Fo ) and 50% relative
humidity. Free shrinkage specimens of 76 x 76 x 286 mm (3 x 3 x 11 in.) dimension were
also casted. Their concrete mix design included a typical mix from both the Kansas DOT and
Missouri DOT and seven laboratory mixes. The results showed that the ultimate free
shrinkage increased as the paste content of concrete increased. Adding a shrinkage reducing
admixture (SRA) significantly decreased the free shrinkage and shrinkage rate. Early-age free
shrinkage was reduced by increasing the curing time, although curing time did not have
influence on the restrained shrinkage rate at the start of drying. Surface to volume ratio
influenced shrinkage in the way that the increase of surface to volume ratio caused the
increase of free shrinkage and restrained shrinkage. Of the 39 restrained rings in their study,
only the Missouri DOT mix cracked, which had the highest paste content and highest
shrinkage rate of all. As a result of this study, they recommended that the concrete mix with
lower paste content should be used; the shrinkage reducing admixtures (SRA) can be used to
reduce shrinkage cracking.
Gong (2006) investigated the cracking behavior of high-performance concrete using
restrained ring test, fracture test and numerical analysis method. They used the AASHTO
type ring specimen test to study the restrained cracking characteristics of different concrete
mixtures. The steel ring had inside and outside diameters of 280 and 305 mm (11 and 12 in.),
respectively. The outside diameter of the concrete was 457 mm (18 in.). The heights of both
steel ring and concrete ring were 152 mm (6 in.). Four strain gages were used at four
equidistant mid-height locations on the interior side of the steel ring to monitor the strain. A
strain drop of 30 microstrains would indicate cracking development. The concrete ring was
Page 45
27
cured for 24 hours and then moved to a condition chamber with constant air temperature of 23
Co (73 Fo ) and relative humidity of 50%. Free shrinkage and the mechanical properties, such
as direct tensile strength, compressive strength, as well as modulus of elasticity, were also
studied. They concluded that the AASHTO ring test could capture the cracking onset of high-
performance concrete with reasonable accuracy. The test results showed that under the same
condition, the gravel generally had better cracking resistance than limestone. High
cementitious materials and low w/cm leaded to earlier cracking. A cracking index was
recommended,
2.1
101'100
EfC
free
cind ε
×= (1.2)
where: 'cf is the standard 28-day compressive strength,
freeε is the 90-day free shrinkage strain,
E is the modulus of elasticity at 28 days.
Based on the data of real-life field, the cracking index was estimated and used to get a
threshold cracking onset day to assess the cracking potential of different mix designs using
gravel. Their study also stated that more experimental work is needed to establish a more
reliable relationship between the cracking index and the basic properties of concrete.
Delatte et al. (2007) studied the effect of using high-absorptive materials to improve
internal curing of low permeability concrete to reduce shrinkage cracking using free shrinkage
and restrained ring tests. Besides field observation, they conducted experimental research in
four phases: concrete mixtures using traditional Ohio DOT materials and mixture designs,
concrete mixtures using high absorption fine lightweight aggregate, concrete mixtures using
Page 46
28
coarse aggregate with a larger nominal size in blended mixture, and field testing. For
restrained ring test, they used a 330 mm (13 in.) outside diameter steel tube acted as restraint,
which has a thickness of 13 mm (1/2 in.). The diameter of the outer form for the concrete ring
was either 406 mm (16 in.) or 457 mm (18 in.) with a height of 152 mm (6 in.). The outer
form was removed 24 hours after casting. Specimens were moved to an environmental
chamber at a temperature of 22 Co and a relative humidity of 50%. Two strain gages were
mounted at opposite mid-height of the inner surface of the steel ring to monitor the strain
development. The unrestrained or free shrinkage specimens were 76.2 x 76.2 x 254 mm (3 x
3 x 10 in.) beams. Two sets of beams were made, one set kept in water bath and the other at
the environmental chamber. Their research concluded that the strongest effect on cracking
was to replace a small maximum size coarse aggregate (#8) with an aggregate blend of #57
and #8. Increasing the coarse aggregate absorption level from low to medium was less
effective in reducing shrinkage cracking. The introduction of light weight aggregate for
internal curing also had a less effect on shrinkage cracking. Thus, the use of a larger size
aggregate (e.g., #57) or a blend of sizes was recommended for reducing shrinkage cracking of
bridge decks.
2.8 Potential Causes of Early-age Shrinkage Cracking
Several state DOTs have conducted studies (Folliard et al. 2003; Delatte et al. 2007)
on early-age cracking in concrete bridge decks and identified some potential causes and
remedies. Based on a survey of the available studies, the early-age shrinkage cracking in
concrete bridge decks can be caused by a number of mechanisms, including one or more of
the following:
Page 47
29
• Delay in curing, wind, low humidity and hot weather causing plastic shrinkage.
• High strength or high-performance decks with low water-cementitious material ratio
resulting in autogenous shrinkage due to self-desiccation.
• Improper mix design with high cement content or high quantity of water, resulting in
high drying shrinkage.
• Restraint from deep longitudinal girders and their connections (e.g., shear studs)
increasing the restrained shrinkage stresses.
• Low tensile strength resulting in less resistance to cracking.
• High modulus of elasticity of concrete causing high stresses for a given shrinkage
strain.
• Low creep properties that do not allow for stress relaxation.
• Temperature differential between the newly placed deck and supporting girders with
different shrinkage rates causing induced stress in concrete.
• High curing temperatures causing excessive evaporation of water.
2.9 Remedies for Enhancing Shrinkage Cracking Resistance
To reduce and/or eliminate shrinkage cracks, a variety of strategies have been
employed, and they include:
• Improved curing practices to prevent excessive loss of water due to evaporation (e.g.,
using continuous fogging and wind breaks in construction immediately after
finishing).
• Internal curing strategies (Delatte et al. 2007) - (a) Using an optimized combination of
coarse aggregate gradation (e.g., replacing a small maximum size coarse aggregate
Page 48
30
with a blend of small and large aggregates); (b) Utilizing high absorption aggregate
(e.g., absorption level > 1%); (c) Replacing fine aggregate with light weight aggregate
(LWA) of high water absorption; and (d) Employing super absorbent polymer
particles (SAP) as an alternative to moderately absorptive aggregate or expanded shale
structural lightweight aggregate particle replacement.
• Improved mix designs and reduce the paste content- mixture proportion optimization
with locally-available materials (e.g., decreasing the volume of water and cement and
maintaining an air content above 6%). Use larger size aggregates with optimized
gradation to reduce the need of water and cementitous materials in concrete.
• Improved construction methods to reduce the shrinkage restraint.
• Addition of single or hybrid fibers (specific fiber types and mix combinations need to
be matched to achieve the desired characteristics) to increase the bonding strength of
concrete to resist concrete shrinkage cracking.
• Incorporation of shrinkage-reducing admixtures (SRA). SRA reduces the surface
tension of water and were found to reduce concrete free shrinkage greatly by many
researches. Currently SRA has not been used in concrete bridge decks in Washington
State. So SRA will be evaluated with local Washington State materials.
• If shrinkage reducing admixtures and/or synthetic fibers are used in the mix design, a
compatibility study is needed. As a chemical additive, shrinkage reducing admixtures
may cause changes in the mechanical properties of concrete, such as flexural strength,
compressive strength, etc.
• Inclusion and effects of fly ash (C and F), slag, and silica fume. The replacement of
cement using fly ash will slow down the hydration process of concrete, and it reduces
Page 49
31
the early-age strength of concrete.
Based on the above remedies, the improvement of concrete mix designs is considered
in this study as a viable strategy to mitigate the early-age shrinkage cracking. Several factors
in mix designs, such as paste content, cementitious materials (admixtures) (fly ash, silica
fume, slag), SRA, size and type of aggregates, etc., will be investigated in order to arrive at
the optimum mix designs with reduced or eliminated early-age shrinkage cracking problem.
2.10 Review of Adopted Test Methods
In order to evaluate the factors in the concrete mix designs that affect the shrinkage
cracking of concrete, a number of tests must be conducted. According to the state of the
concrete when it is being tested, these tests can be put into two classes: (1) fresh concrete
tests, and (2) hardened concrete tests.
Fresh concrete property tests evaluate the following properties of concrete: air content,
slump, and unit weight. The hardened concrete property tests can be further divided into two
sub-classes. The first one is about the early-age properties, such as the compression strength
of concrete, the flexural strength of concrete, and the modulus of elasticity of concrete. The
second is the drying shrinkage of concrete, which include the free shrinkage and the restrained
shrinkage. Depending on the importance of other properties and applications, some additional
tests (e.g., permeability, freeze/thaw, scaling) may also be conducted for the finalized
candidate mixture(s) with the best shrinkage cracking resistance in order to develop a concrete
mix performance matrix. For each concrete mix, the tests considered in this study are
summarized in Table 2.1.
Page 50
32
Table 2.1 Fresh and hardened property tests
Properties of Concrete Test Methods
Fresh Properties of Concrete
Air content ASTM C 231/AASHTO T 152
Slump ASTM C 143/AASHTO T 119
Unit Weight ASTM C 138
Hardened Properties of Concrete
Compression Strength of Concrete ASTM C 39/AASHTO T 22 Flexural Strength of Concrete ASTM C 78/AASHTO T97
Splitting Tensile Strength of Concrete ASTM C 496/AASHTO T 198
Modulus of Elasticity of Concrete ASTM C 496
Unsealed Free Shrinkage ASTM C 157 AASHTO T 160 Sealed Free Shrinkage ASTM C 1090
Restrained Shrinkage of Concrete AASHTO PP34-99
Page 51
33
CHAPTER THREE
MATERIALS AND SELECTION OF CONCRETE MIX DESIGNS
3.1 Introduction
The primary goal of this study is to develop and evaluate different concrete mix
designs using large nominal size aggregates, different cementitious and admixture material
proportions, and different sources of aggregates to identify the concrete mix designs that will
have the best cracking resistance as well as good mechanical properties.
3.2 Materials
3.2.1 Cementitious Materials
The cementitious materials, including Portland cement, fly ash (FA), silica fume (SF),
and slag (SL), are provided by Lafarge NA – PNW District. The properties and chemical
contents are listed in Table 3.1.
Table 3.1 Properties and chemical contents of cementitious materials
Cement Fly Ash Silica Fume Slag
Specific Gravity 3.15 2.04 2.2 2.89
SiO2, % 20 53.3 Al2O3, % 4.6 23.1 Fe2O3, % 3.3 3.4 CaO, % 64.6 10 MgO, % 0.8 1.1 SO3, % 2.7 0.1
Loss on Ignition 2.6 0.4 Limestone 3
Page 52
34
3.2.2 Aggregates
Coarse aggregates from both eastern Washington (EW) and western Washington
(WW) are used. Eastern Washington coarse aggregates are provided by Central Pre-Mix
Concrete Company in Spokane, WA. Four different sizes of coarse aggregates are used in
this study: the nominal sizes 2.5 in., 2.0 in., 1.5 in., and 3/8 in. The gradations of the coarse
aggregates are presented in Table 3.2. The specific gravities are listed in Table 3.3.
Table 3.2 Eastern Washington Coarse Aggregate Gradations (sieve analysis)
Eastern
Washington 3/8''
Pea Gravel
Eastern
Washington 1.5''
Eastern
Washington 2''
Eastern
Washington 2.5''
Sieves
Cumulative %
Passing
Cumulative %
Passing
Cumulative %
Passing
Cumulative %
Passing
2''1/2
- 100
2''
- 91.7
1''1/2
100 - 22.5
1''1/4
94.8 - 6.2
1''
64.4 - 0.8
3/4''
11.4 - 0.2
5/8''
2.8 -
1/2'' 100 1.3
3/8'' 98.5 0.6
1/4'' 67.8
#4 37.3
#8 3
#16 0.4
Page 53
35
Table 3.3 Specific Gravity of Eastern Washington Aggregates
Aggregates EW
2.5'' EW 2''
EW
1.5''
EW
3/8'' Sand
Specific
Gravity 2.7 2.7 2.7 2.67 2.65
While the western Washington coarse aggregates are provided by Glacier NW, Seattle,
WA. The gradations of western aggregates are listed in Table 3.4. The specific gravities are
given in Table 3.5.
Table 3.4 Western Washington Coarse Aggregate Gradations (sieve analysis)
Eastern Washington 3/8''
Pea Gravel
Eastern Washington 1.5''
Eastern Washington 2''
Eastern Washington 2.5''
Sieves Cumulative %
Passing Cumulative %
Passing Cumulative %
Passing Cumulative %
Passing 2''1/2
2''
1''1/2
100
1''1/4
91.6
1''
48
3/4''
2.4
5/8''
0.6
1/2" 100 0.5
3/8" 86.4 0.4
5/16" 64.6 0.1
1/4" 38.5
#4 13.9
#8 0.7
#16 0.2
#200 0.1
Page 54
36
Table 3.5 Specific Gravities of Western Washington Coarse Aggregates
Aggregates WW 2.5'' WW 2'' WW 1.5'' WW 3/8''
Specific Gravity 2.7 2.7 2.7 2.67
Fine aggregate is provided by Central Pre-Mix Concrete Company in Spokane, WA.
The fine aggregate meets Class 1 WSDOT Sand requirements. The specific gravity of five
aggregate is also listed in Table 3.3. The detailed gradation is listed in Table 3.6.
Table 3.6 Fine Aggregate Gradation (sieve analysis)
Fine Aggregate
Sieves Individual % Retained Cumulative % Passing
3/8'' 0 100
1/4'' 0.5 99.5
#4 1.8 97.7
#8 13.4 84.3
#16 23.3 61
#30 18.8 42.2
#50 24.5 17.7
#100 13.6 4.1
#200 1.9 2.2
3.2.3 Chemical Admixtures
Three types of chemical admixtures are used: air entraining admixture (AEA),
shrinkage reducing admixture (SRA), and high range water reducing admixture (HRWRA).
Page 55
37
DARAVAIR 1000 air-entraining admixture from Grace Construction Products is used
to ensure proper air content in all the concrete mixes. According to the information from the
product instructions, it is based on a high-grade saponified rosin formulation and chemically
similar to vinsol-based products. The adding amount is decided by the recommended addition
rate from the product instructions and adjusted according to practice.
ADVA 190 high-range water-reducing admixtures from Grace Construction Products
is adopted to achieve the desired slump value as well as reducing the water content in all
concrete mixes. It is a polycarboxlate-based admixture specifically designed for concrete
industry. Its adding rate is also determined according to the product instructions and adjusted
by practice.
Eclipse Plus shrinkage reducing admixture (SRA) from Grace Construction Products
is added to some of the concrete mixes to reduce concrete drying shrinkage. Eclipse Plus
decreases drying shrinkage by reducing the surface tension of water, which causes a force
pulling in on the walls of the pores in concrete. Its adding rate is also decided by its
recommended amount and by practice. When Eclipse Plus shrinkage reducing admixture
(SRA) is added, the same amount of water is taken out.
3.3 Mix Design Rationale and Considerations
In order to evaluate the concrete mix designs for mitigating shrinkage cracking, a
number of factors in the mix designs are considered. First, the mix designs take different
selections and proportions of cementitious materials and chemicals into consideration.
Supplementary cementitious materials (SCM), such as fly ash (FA), silica fume (SF), and slag
(SL), are being used by many DOTs to partially replace cement in a concrete mix. Single
Page 56
38
replacements of cement by SCM are evaluated. To further reduce the cement content, the
replacements of cement by binary combination of SCM is also performed. Based on the
literature review, the single replacement of cement is selected as 20% by fly ash or slag, and
4% by silica fume.
Second, larger sizes of aggregates are considered in the mix designs as well to reduce
paste content as suggested by the literature review and to reduce shrinkage cracking tendency
of concrete. As suggested by the WSDOT, aggregates with nominal size of 1.5 in. (38.1 mm)
are used to replace the current WSDOT normal use, of which the nominal size aggregates of 1
in. (24.5 mm). When the larger sizes of aggregates are used, the paste contents of concrete
mix designs are correspondingly reduced compared with small size aggregates. In this study,
the large sizes of aggregates of 1.5 in. (38.1 mm), 2.0 in. (50.8 mm), and 2.5 in. (63.5 mm) are
evaluated, along with two sources of aggregates, i.e., Eastern and Western Washington
aggregates.
Shrinkage reducing admixture (SRA) was also used as suggested by the literature
review to reduce the drying shrinkage of concrete.
3.4 Mix Design and Procedures by ACI 211.1-91
ACI Standard Practice for Selecting Proportions for Normal, Heavyweight, and Mass
Concrete (ACI 211.1-91) provides the procedures for developing proportions for hydraulic
cement concrete. Basically, concrete is composed of Portland cement, aggregates, sand and
water. It may also contain other kinds of cementitious materials, such as fly ash, silica fume,
and slag, as well as some chemicals such as air entrainer, water reducer, and shrinkage
reducer. In ACI 211.1-91, a series of requirements are followed, and then the intended mix
Page 57
39
designs are developed according to these requirements. The following are the procedures that
the mix designs in this study are developed using the aggregates of nominal size 1.5 in. (38.1
mm).
Step 1: Choice of Slump. For pavements and slabs, the slumps recommended by
ACI 211 are 1 to 3 in. (25.4 to 76.2 mm) (see Table 3.7). Also, it states that if chemical
admixtures are used in the mix and the water-cement ratio does not increase, slump may be
increased as long as the concrete does not have segregation or excessive bleeding.
Table 3.7 Recommended slumps for various types of construction (From ACI 211.1-91)
Step 2: Choice of maximum size of aggregate. Compared with WSDOT current
applications, larger sizes of aggregates are considered in this study, and the maximum size of
aggregate is 1.5 in (38.1 mm) or larger.
Step 3: Estimation of mixing water and air content. According to ACI 211.1-91
(Table 3.8), for concrete with slump of 1 to 3 in. and a maximum size aggregate of 1.5 in.
(38.1 mm), water content of 250 to 275 lbs and air content of 5.5% are recommended. Also,
it states that when water reducer is used, the water content can be reduced by 5% or more.
Page 58
40
And when the rounded aggregate is used, the water content can be reduced by 25 lbs for air
entrained concrete. Based on these criteria, the water content for this study will be 212.5 to
236.5 lbs. Thus, 220 lbs of water is chosen in this study.
Table 3.8 Approximate mixing water and air content requirements for different slumps and
nominal sizes of aggregates (From ACI 211.1-91)
Step 4: Selection of water-cement or water-cementitious materials ratio. Based
on most studies in the literature, a water-cementitious materials ratio of 0.4 is used in this
study.
Step 5: Calculation of cementitious materials. When a water content of 220 lbs
(Step 3) and a water-cementitious material ratio of 0.4 (Step 4) are used, the total of
cementitious materials is calculated to be 550 lbs.
Page 59
41
Step 6: Estimation of coarse aggregate content. According to ACI 211.1-91, the
volume of aggregates can be determined by considering the nominal maximum aggregate size
and the fineness modulus of fine aggregate. The fine aggregate modulus is 2.7, and the
nominal size of aggregate considered in this study is 1.5 in. (38.1 mm). Therefore, the
volume ratio of aggregate is 0.72, resulting in 1,847 lbs of course aggregate per cubic yard of
concrete.
Table 3.9 Volume of coarse aggregate per unit of volume of concrete (From ACI 211.1-91)
Step 7: Estimation of fine aggregate content. Two methods are provided to
calculate the amount of fine aggregate needed: the weight deduction method and the volume
method. The weight deduction method uses the total estimated weight of fresh concrete
(Table 3.10) to deduct all the other materials to obtain the amount of fine aggregate needed.
The volume method is based on the volume of the amount of fine aggregate needed, which is
calculated by using the total volume to deduct the volume of all the other materials.
Page 60
42
Table 3.10 Estimation of weight of fresh concrete (From ACI 211.1-91)
Step 8: Adjustments for aggregate moisture. The aggregates calculated in the
above steps are in their oven-dry state. They should be adjusted according to their actual
water content when casting.
Step 9: Trial batch adjustments. This step is to make adjustments to the above
developed estimation of proportions of concrete mix design so that the total volume will be
one cubic yard as assumed in the estimation.
However, ACI 211.1-91 has one disadvantage. It can only be used to develop a mix
design using one size coarse aggregate, such as the 1.5 in. (38.1 mm) aggregate. In practice,
if only 1.5 in. nominal size coarse aggregate is used, the workability and the concrete will be
low, and the coarseness factor will be too high. To avoid these results, #8 aggregate with
nominal size of 3/8 in. is introduced into the mix design to replace part of the 1.5 in.
aggregate. The KU (University of Kansas) mix program is introduced next to compensate for
the disadvantage of ACI 211.1-91, especially when large sizes of aggregates and a
combination of different sizes of aggregates are considered in the mix designs.
Page 61
43
3.5 Mix Optimization and Analysis by the KU Mix Program
The KU Mix program developed by the researchers at University of Kansas
(http://www.silicafume.org/ku-mix.html) is based on Microsoft Excel to design concrete
mixes, and it includes function for aggregate optimization. It also includes a series of
procedures to develop a concrete mix. The following is how the KU mix program works.
Fig. 3.1 KU Interface (From KU Mix Program)
Page 62
44
Step 1: Input Materials. Before using the KU Mix program to design a concrete mix
(see Fig. 3.1), the material properties must be first input. Four basic materials are required:
cementitious materials, aggregates, air entraining agents, and other admixtures. After all
material information is input, the design procedure can be started.
Step 2: Design Concrete Mix. There are four parts in this step. First, the
cementitous materials, water-cementitous materials ratio, and air content are selected and their
amounts are entered. Second, aggregates are selected from previously entered ones (in Step
1). Third, chemical admixtures are selected and their amounts are entered. After all these
three sub-steps, click “Optimize Mix Design”. The mix design is then accomplished, and it
can be viewed through “View Mix Design”, as shown in Fig. 3.2.
Besides the use for developing a mix design, the KU Mix also provides the gradation
details of aggregates and sand. And the workability factor and coarseness factor are given.
As aforementioned, the ACI 211.1-91 is only capable of developing a mix design
using one coarse aggregate. While in the KU Mix, different sizes of coarse aggregates can be
selected to compose a concrete mix. Therefore, by introducing the KU Mix program to
supplement the shortcoming of ACI 211.1-91, a better and optimized mix design can be
developed. The concept is to first use ACI 211 to determine the water-cementitous materials
ratio, water content, cementitious material contents, and air content. The KU Mix is then
utilized to determine the amount of aggregates needed.
The following is a two-step guideline on how to develop a viable mix design using a
combined ACI 211.1-91 and the KU Mix program.
Step 1: Using ACI 211.1-91 to preliminarily select basic amount of constituent
materials. As previously introduced, for aggregate with nominal size of 1.5 in. in this study,
Page 63
45
the water content of 220 lbs, the cementitious material content of 550 lbs, and air content of
5.5% are preliminarily selected following ACI 211.1-91. However, per the WSDOT
recommendations, the air content should be in the range from 6.5% to 9%. Thus, the targeted
value for the air content is chosen to be 8%.
Step 2: Using the KU Mix to finalize the concrete mix design. Input all material
information into the KU Mix, and also enter the values obtained from Step 1. In the “Select
Aggregates” procedure, select both 1.5 in. and 3/8 in. coarse aggregates as well as sand.
Thus, more than one kind of coarse aggregates are introduced into the concrete mix design.
Then, by following the procedures discussed for the KU Mix program, a concrete mix design
is developed.
Fig. 3.2 Concrete Mix Design by KU Mix Program
Page 64
46
The concrete mix designs developed using KU Mix program are given in the
appendix.
3.6 Mix Designs
By combining the ACI 211.1-91 and the KU Mix program, the mix designs for this
study are developed and summarized in Table 3.11 along with the benchmark mix design
from the WSDOT.
3.7 Concluding Remarks
In this chapter, the rationale and procedures for coming up all the mix designs using
ACI 211.1-91 and the KU Mix program are provided and discussed. In these mix designs, the
effects of adding different SCMs, such as fly ash, silica fume, and slag, to concrete mix
design to partially replace cement are discussed. In comparison with the current WSDOT
practice of using #67 aggregate, the newly developed mix designs with a large size of
aggregates (e.g., #4 aggregate) using ACI 211.1-91 and the KU Mix program are elaborated.
Page 65
47
Table 3.11 Mix Designs
A. Phase One
Mixtures Cement FA SF Slag Paste (%)
#4 #8 Sand w/cm Air Water
EW-SRA 550 0 0 0 23.43 1161 1177 759 0.4 8 220
EW-SL-SRA 440 0 0 110 23.61 1161 1180 749 0.4 8 220
EW 550 0 0 0 23.43 1161 1177 759 0.4 8 220
EW-SF-SRA 462 0 22 0 20.79 1154 969 1087 0.4 8 193.6
EW-FA-SRA
440 110 0 0 24.54 1160 1192 697 0.4 8 220
EW-FA-SL-SRA
330 110 0 110 24.72 1159 1194 686 0.4 8 220
EW-FA 440 110 0 0 24.54 1160 1192 697 0.4 8 220
EW-FA-SF-SRA
352 110 22 0 21.9 1187 1205 772 0.4 8 193.6
WW-SRA 550 0 0 0 23.43 1017 811 1259 0.4 8 220
WW-SL-SRA
440 0 0 110 23.61 1016 813 1250 0.4 8 220
WW 550 0 0 0 23.43 1017 812 1260 0.4 8 220
WW-SF-SRA
462 0 22 0 20.79 1044 822 1342 0.4 8 193.6
WW-FA-SRA
440 110 0 0 24.54 1014 821 1203 0.4 8 220
WW-FA-SL-SRA
330 110 0 110 24.72 1013 822 1194 0.4 8 220
WW-FA 440 110 0 0 24.54 1014 821 1204 0.4 8 220
WW-FA-SF-SRA
352 110 22 0 21.9 1041 832 1286 0.4 8 193.6
Note: EW=Eastern Washington Coarse Aggregates, SRA=Shrinkage-Reducing Admixtures,
SL=Slag, SF=Silica Fume, FA=Fly Ash, and WW=Western Washington Coarse Aggregates.
Page 66
48
B. Control Mixes
Mixtures
Cement
(lb/yd3)
Fly Ash
(lb/yd3)
Slica fume
(lb/yd3)
Slag (lb/yd3
)
3/4'' Aggregat
e (lb/yd3)
Sand (lb/yd3
)
w/cm
Air Content (%)
Water (lb)
WSDOT 660 75 1730 1250 0.34 6.5 250
LD-WSDO
T 564 1830 1270 0.48 4.8 270
C. Phase Two
Mixtures Cement
(lb/yd3)
2.5''
Aggregate
(lb/ yd3)
2''
Aggregate
(lb/ yd3)
3/8''
Aggregate
(lb/ yd3)
Sand
(lb/
yd3)
w/cm air water
EW 2 525 - 1072.6 850 1240 0.4 8 210
EW 2.5 500 1125 - 850 1240 0.4 8 200
WW 2 525 - 1072.6 850 1240 0.4 8 210
WW 2.5 500 1125 - 850 1240 0.4 8 200
Page 67
49
CHAPTER FOUR
TEST METHODS
4.1 Introduction
This chapter describes the test methods considered in this study for the fresh,
hardened, and shrinkage properties in concrete mix designs.
4.2 Concrete Mixing Procedures
Concrete mixing procedures are developed based on concrete mixing guidelines and
the literature, following the relevant AASHTO and ASTM standards. The following steps are
the concrete mixing procedures used in this study:
1. All the materials are batched by weight.
2. Two pounds of water and two pounds of cement are mixed together and then used to
wet the inside drum of the concrete mixer. Then, the paste is dumped.
3. All the pre-weighted aggregates and sand are added into the mixer and mixed for 1/2
minute.
4. All the pre-weighted cementitious materials (cement, fly ash, silica fume or slag) are
added into the mixer. The air-entraining admixture (AEA) is added into half of the
water, and the water solution is then added into the mixer. They are mixed for 3
minutes;
5. The rest water is added, and they are mixed for 2 minutes;
6. Water reducing admixture (WRA) and SRA are added separately, and they are then
mixed for 3 minutes;
Page 68
50
7. The mix is rested for 2 minutes;
8. It is mixed for the final 2 minutes;
9. The slump test is first conducted;
10. The air content test is then conducted; and
11. Necessary adjustments of WRA and AEA are made until the targeted slump and air
content are achieved.
4.3 Fresh Property Tests
Slump and air content are tested for every trail mix design following the standards of:
(1) AASHTO T 119/ASTM C 143-08 Slump of Hydraulic Cement Concrete, (2) AASHTO T
152/ASTM C 231 -08 Air Content of Freshly Mixed Concrete by the Pressure Method, and
(3) AASHTO T 196/ASTM C 173 Air Content of Freshly-mixed Concrete by the Volumetric
Method.
4.3.1. Slump Test
The slump test (Fig. 4.1) is performed immediately after the mixing procedures to
avoid loss of slump. The procedures for conducting slump test are as follows:
1. The mold is dampened and placed on a required surface.
2. Fill the mold with three layers of concrete.
3. Rod each layer with 25 strokes of the tamping rod.
4. In filling and rodding the top layer, heap the concrete above the mold.
5. Slump is immediately measured by determining the vertical difference between the top
of the mold and the displaced original center of the top surface of the specimen.
Page 69
51
Fig. 4.1 Slump Test
Fig. 4.2 Air Content Test by Pressure Method
Page 70
52
Fig. 4.3 Device for Air Content Test by Volumetric Method
4.3.2 Air Content Test
Air content test (Figs. 4.2 and 4.3) is performed to measure the air content in the fresh
concrete. The procedures for air content test using the pressure method (Fig. 4.2) are as
follows:
1. Dampen the interior of the measuring bowl and place it on required surface.
2. Fill the mold with three layers of concrete.
3. Rod each layer with 25 strokes of the tamping rod.
4. Strike off the top surface till the bowl is just level full.
5. Assemble the apparatus and measure the air content.
Page 71
53
The procedures for air content test using the volumetric method (Fig. 4.3) are as
follows:
1. Dampen the interior of the measuring bowl and place it on required surface.
2. Fill the mold with two layers of concrete.
3. Rod each layer with 25 strokes of the tamping rod.
4. Strike off the top surface till the bowl is just level full.
5. Add water according to the standards.
6. Displace the volume of air and measure the air content according to the standards.
4.4 Mechanical Property Tests
4.4.1 Compressive Test and Young’s Modulus Test
ASTM C 39/AASHTO T 22 is used to measure the compressive strength of the
concrete mixes. ASTM C 469 is used to measure the static modulus of elasticity. For every
mix, four cylinder specimens of 6 in. diameter x 12 in. height are cast. Two are tested at the
age of 7 days, and two at 28 days. The test is conducted using a hydraulic machine (Fig. 4.4)
at a constant load rate of 35±7 psi/s. The cylinder specimens are first loaded till about 40% of
its ultimate strength and then unloaded. After that, the displacements and responding loads
are recorded to calculate the Young’s modulus. Then, the specimens are unloaded again and
then reloaded till failure, with all displacements and loads data being recorded.
The test procedures for the Young’s modulus and compressive strength include:
1. Remove specimen from curing environment.
2. Place specimen into testing apparatus ensuring clean surfaces and center the specimen
under the center of the thrust.
Page 72
54
3. The load indicator is zeroed and the loading plate bears on the specimen
4. Apply the load continuously and without shock till 40% of the estimated ultimate load
to make sure that the setup is connected correctly then unload.
5. Apply till 40% of the estimated ultimate load and record the dial meter readings at
every 5,000 lbs of force increase.
6. Unload and then reload till the cylinder fails. Record the maximum load.
7. Calculate the modulus of elasticity and the compressive strength of the specimen.
Fig. 4.4 Compressive and Modulus of Elasticity Test
Page 73
55
4.4.2 Flexural Strength Test
ASTM C 78/AASHTO T97 procedures are followed for measuring the flexural
strength of the concrete beam specimens. The concrete beam has a dimension of 4 in x 4 in x
15 in. A 12 in. span is used, which made the height of the beam of 4 in., i.e., 1/3 of the span,
following the standards. This test is also conducted using the same hydraulic machine (see
Fig. 4.5), using the loading rate of 125-175 psi/min.
Fig. 4.5 Flexural Strength Test
The procedures for measuring the flexural strength of concrete are as follows:
1. Remove specimen from curing environment, and kept it moist until specimen is tested.
2. Place specimen in loading apparatus.
Page 74
56
3. Load to 3-6% of estimated load, and check to make sure that load applying or support
blocks are touching the specimen fully.
4. Load specimen continuously and without shock at 125-175 psi/min. Calculate loading
rate using:
LSbdr
2
=
where:
r = loading rate, lb/min
S = rate of stress, psi
b = avg width, in.
d = avg depth, in.
L = span length, in.
5. After failure, measure specimen dimensions: b and d
6. Calculate the modulus of rupture for flexure.
4.5 Shrinkage Property Tests
4.5.1 Free Shrinkage Test
The free shrinkage test is carried out following ASTM C157/C157M and AASHTO
T160 “Length Change of Hardened Hydraulic-Cement Mortar and Concrete”. Three 4 in x 4
in x 11.25 in prisms are cast using the concrete batch for both the free shrinkage and
restrained shrinkage specimens in every mix design. The prisms are put into the condition
room at the same time as the ring specimens, and they are demolded 24 hours after casting.
The condition room is maintained at a temperature of 76 ± 3oF and a relative humidity
Page 75
57
of 50 ± 4%.
A shrinkage frame with three dial meters is made in order to monitor the free
shrinkage, as shown in Fig. 4.6. The shrinkage frame uses rollers to support the specimens so
that they are able to shrink free of abrasion, and the dial meters are installed to record the
shrinkage value continuously. The specimens are put onto the shrinkage frame immediately
after demolding. And the initial readings of the dial meters are recorded. Readings are then
taken every 24 hours for the first 7 days, and then on the 14th, 21st, and 28th days.
Fig. 4.6 Free Shrinkage Test
4.5.2 Restrained Shrinkage Test
As aforementioned in Chapter 2, the restrained shrinkage test adopts the AASHTO
ring and follows the standards AASHTO PP34-99 “Estimating the Cracking Tendency of
Concrete”. Test apparatus is fabricated as discussed in the literature review (see Section 2.6.3
in Chapter 2).
Page 76
58
Fig. 4.7 Diagrams of Ring Specimen Used (Reprinted from AASHTO PP34-99)
Structural steel pipe conforming to ASTM A 501 or A 53M/A 53 12-in. extra-strong
pipe with an outside diameter of 324 mm (12 ¾ in.) and wall thickness 13 mm ( 1/2 in.) is
used for fabricating the inner steel ring (see Figs. 3.4 and 3.5). The outer ring is made of
polyethylene board with an inside diameter of 457 mm (18 in.). Four strain gages are
mounted on the inner surface of the steel ring at equidistant points at midheight (see Figs. 4.7
and 4.8). Data acquisition equipment from Vishay Company is used for the strain
instrumentation, and it automatically records each strain gage every second independently.
A
A
Wooden Base
Concrete Specimen
Steel
11.75 in
12.75 in
18 in
6 in
Section A-A
Page 77
59
Wooden forms are made of 24 in. by 24 in., 5/8 in. thick (0.6 x 0.6 x 0.016 m) plywood sheet,
and the top surface is coated with epoxy to ensure that the concrete rings are able to shrinkage
freely.
Three ring specimens are cast for most of mix designs, two 6 in. tall rings and one 3
in. tall ring. The outer forms are removed at an age of 8 h., and then the specimens are moved
to the conditional room (Fig. 4.9) with a constant air temperature of 75 ± 3.5 Fo and 50 ± 4 %
relative humidity. The data from the strain gages are recorded every second, and review of
the strain and visual inspection of cracking are conducted every 2 or 3 days.
Fig. 4.8 Restrained Shrinkage Ring Apparatus
Page 78
60
Figure 4.9 Data Acquisition System in the Condition Room
Page 79
61
CHAPTER FIVE
PERFORMANCE OF MIX DESIGNS WITH EASTERN WASHINGTON
AGGREGATES
5.1 Introduction
This chapter reports on concrete mix designs using aggregates from eastern
Washington. Two phases are carried out. Phase one is composed of eight concrete mixes
designed in this study and one current WSDOT concrete mix design, which serves as a
benchmark mix. Phase two includes two concrete mix designs using two larger sizes of
aggregates (i.e., 2 in. and 2.5 in.). In this chapter, the materials and test results for concrete
mixes using eastern Washington aggregates are presented. The eight concrete in Phase one
mixes use the eastern Washington aggregates with a nominal size of 1.5 in. In contrast, the
current WSDOT concrete mix design uses aggregates with a nominal size of ¾ in. The two
concrete mix designs using the larger size aggregates consider aggregates with nominal sizes
of 2 in. and 2.5 in. Fresh, hardened, and shrinkage properties are evaluated.
5.2 Fresh Property Tests
Following the test methods given in Chapter 4, the slump test and air content test are
performed for each concrete mix to evaluate the workability.
5.2.1 Slump Test
The slump test follows ASTM C 143/AASHTO T 119 “Slump of hydraulic cement
concrete”. Based on ACI 211.1-91 “Standard Practice for Selecting Proportions for Normal
Page 80
62
Heavyweight, and Mass Concrete” and also the recommendations of WSDOT, the slump
value of at least 3 in. is selected. However, as stated in ACI 211.1-91, when chemical
admixtures are used and this chemical admixture-treated concrete has the same or lower
water-cementitous materials ratio and does not exhibit segregation potential or excessive
bleeding, the slump value may be accordingly increased. In this study, the High Range Water
Reducing Admixture (HRWRA or superplasticizer) is used to increase the slump value since
the cement paste content chosen in all the concrete mixes are low.
5.2.2 Air Content Test
Two methods of air content test are conducted, the pressure method and the
volumetric method. The pressure method follows AASHTO T 152/ASTM C 231 “Air
Content of Freshly-mixed Concrete by the Pressure Method”, while the volumetric method
follows AASHTO T 196/ASTM C 173 “Air Content of Freshly-mixed Concrete by the
Volumetric Method”. As stated in the AASHTO standards, the pressure method applies to
concretes and mortars made with relatively dense aggregates, and it does not apply to concrete
with light-weight aggregates, air-cooled blast-furnace slag, or aggregates of high porosity. In
this study, dense aggregates are used. So the pressure method is performed for most concrete
mixes except for those including slag in them, in which case the volumetric method is
utilized, due to the porous nature of the added slag in the mix. The ACI recommended value
for air content is 5.5 percent for severe exposure when the nominal maximum aggregate size
is 1.5 in. However, in a recent WSDOT bridge deck project, the WSDOT requires the air
content to be a minimum of 6.5 percent and a maximum of 9.5 percent. Therefore, the desired
air content in this study is chosen as 8 percent whenever possible.
Page 81
63
5.2.3 Test Results of Fresh Concrete Properties
The slump test and air content test data are listed in Table 5.1. The slump values are
in the range of 3 to 6 in., which indicates good workability of all the concrete mixes. The air
contents are also within the desired range for most of the concrete mixes. For concrete mix
with EW-FA-SRA, it is lower than the desired value. However, the use of several chemicals
made the desired concrete properties difficult to achieve, especially when the three chemicals
are all used in one concrete mix.
Table 5.1 Slump and Air Content Data
Mixtures
EW-SRA
EW-SL-SRA
EW EW-SF-SRA
EW-FA-SRA
EW-FA-SL-
SRA
EW-FA
EW-FA-SF-
SRA
WSDOT
EW 2''
EW 2.5''
Slump (in.) 4.8 6.5 3.7 3.3 4.6 6 5.8 3.5 4 5 5.5
Air Content (%)
7.2 n/a* 7.8 7.8 3 n/a* 10 7.5 6.5 7 10
Note: In the air content test of mix designs with slag (SL), the invalid pressure method is used.
5.3 Mechanical Property Tests
Three basic mechanical properties are evaluated for all the concrete mixes: the
compressive strength, the modulus of elasticity, and the flexural strength. These tests are
conducted to ensure that the designed concrete meets the requirements for the intended
applications.
5.3.1 Compressive Strength Test
The compressive strength test follows ASTM C 39/AASHTO T 22 “Compressive
Strength of Cylindrical Concrete Specimens”. For bridge deck applications, the WSDOT
Page 82
64
requires the minimum compressive strength to be 4,000 psi at 28 days. Besides the
measurement at 28 days, the compressive strength of all concrete mixes at 7 days is also
tested to demonstrate the strength development. The test data for the compressive strength is
listed in Table 5.2 and also graphically presented in Figs. 5.1 and 5.2.
Table 5.2 Compressive Strength Test Data (psi)
Mixtures EW-SRA
EW-SL-SRA
EW EW-SF-SRA
EW-FA-SRA
EW-FA-SL-SRA
EW-FA
EW-FA-SF-SRA
WSDOT
EW 2''
EW 2.5''
7-day Strength
4228
5691
4337 4792 389
2 3369 2921 3739 619
9 3887
3566
28-day Strength
4989
6947
4556 5582 451
5 5461 3466 4234 722
6 4400
4248
Fig. 5.1 Compressive Strength of Concrete Mixes with Eastern Washington Aggregate
0
1000
2000
3000
4000
5000
6000
7000
8000
7-day Strength 28-day Strength
Com
pres
sive
str
engt
h (p
si)
Age (days)
EW-SRA
EW-SL-SRA
EW
EW-SF-SRA
EW-FA-SRA
EW-FA-SL-SRA
EW-FA
EW-FA-SF-SRA
WSDOT
EW 2''
EW 2.5''
Page 83
65
Fig. 5.2 Compressive Strength Comparison of Concrete Mixes
with Eastern Washington Aggregate
The current WSDOT concrete mix design has the highest compressive strength at all
times. With the increase of nominal aggregate size and the reduced paste contents in concrete
mix designs, the compressive strengths of concrete decrease. The minimum WSDOT
compressive strength requirement is 4,000 psi at 28 days. All these four concrete mix designs
satisfy the minimum strength requirement. The replacement of cement by slag or silica fume
increases the compressive strength of concrete. 20% replacement of cement by slag increases
the 28-day strength of concrete from 4,989 psi to 6,947 psi for concrete mixes with SRA.
16% replacement of cement by using 4% silica fume increases the 28-day compressive
strength from 4,989 psi to 5,582 psi for concrete mix with SRA. For concrete using cement
only and without any other cementitious materials, the addition of SRA does not seem to
0
2000
4000
6000
8000
7-day Strength
28-day Strength
WSDOT
EW
EW 2''
EW 2.5'' 0100020003000400050006000
7-day Strength
28-day Strength
EW
EW-SRA
EW-FA
EW-FA-SRA
0
2000
4000
6000
8000
7-day Strength 28-day Strength
EW-SRA
EW-SL-SRA
EW-SF-SRA
EW-FA-SRA
EW-FA-SL-SRA
EW-FA-SF-SRA
Page 84
66
change the compressive strength much. However, when 20% of cement is replaced by FA,
the concrete strength for concrete mix without SRA decreases significantly, with the 28-day
compressive strength decreasing from 4,556 psi to 3,466 psi, which is more than 20 percent of
decrease. However, when SRA is added, the 28-day compressive strength of concrete mix
using 20% replacement of cement by FA reduces only slightly. SRA increases the 28-day
compressive strength of FA concrete from 3,466 psi to 4,515 psi, which is greater than the
WSDOT minimum requirements of 4,000 psi. The combinations of SL + FA and SF + FA
exhibit the combined effects for the compressive strength than when SL, SF, FA are applied
separately.
5.3.2 Modulus of Elasticity Test
The modulus of elasticity test follows ASTM C469 “Standard Test Method for Static
Modulus of Elasticity and Poisson's Ratio of Concrete in Compression”. The modulus of
elasticity at 7 days and 28 days are tested for all the concrete mixes. The test data is listed in
Table 5.3 and graphically shown in Fig. 5.3.
Table 5.3 Modulus of Elasticity Test Data (x106 psi)
Mixtures EW-SRA
EW-SL-SRA
EW EW-SF-SRA
EW-FA-SRA
EW-FA-SL-SRA
EW-FA
EW-FA-SF-SRA
WSDOT
EW 2''
EW 2.5''
7-day Modulus 4.15 5.00 3.75 3.75 4.20 3.70 3.20 4.15 4.55 3.70 4.00
28-day Modulus 4.75 5.15 3.85 3.85 4.50 4.40 3.60 4.90 4.75 4.10 4.10
Page 85
67
Fig. 5.3 Modulus of Elasticity of Concrete Mixes with Eastern Washington Aggregate
As for compressive strength, EW-SL-SRA has very high modulus of elasticity. The
replacement of cement by slag increases both the compressive strength and the modulus of
elasticity of concrete. The inclusion of SRA increases the modulus of elasticity of both EW
and EW-FA. EW-FA has the lowest modulus, just as it has the lowest compressive strength.
EW has a lower modulus than that of the control WSDOT mix. However, EW 2.0 and EW
2.5 have slightly higher modulus than EW.
5.3.3 Flexural Strength Test
The flexural strength test follows AASHTO T 97/ASTM C 78 “Standard Method of
Test for Flexural Strength of Concrete (Using Simple Beam with Third-Point Loading)”. In
order to get the flexural strength development, the flexural strength tests are conducted at 3, 7,
0
1000000
2000000
3000000
4000000
5000000
6000000
7-day Modulus 28-day Modulus
Mod
ulus
of e
last
icit
y (p
si)
Age (days)
EW-SRA
EW-SL-SRA
EW
EW-SF-SRA
EW-FA-SRA
EW-FA-SL-SRA
EW-FA
EW-FA-SF-SRA
WSDOT
EW 2''
EW 2.5''
Page 86
68
14, and 28 days for all the concrete mixes. The test data is listed in Table 5.4 and also
graphically in Figs. 5.4 and 5.5.
Table 5.4 Flexural Strength Test Data (psi)
Mixtures EW-SRA
EW-SL-SRA
EW EW-SF-SRA
EW-FA-SRA
EW-FA-SL-SRA
EW-FA
EW-FA-SF-SRA
WSDOT
EW 2''
EW 2.5''
3-day 699 748 575 638 574 436 549 544 867 636 523
7-day 793 863 709 673 713 517 602 678 939 633 612
14-day 955 961 740 858 789 681 563 763 1032 687 696
28-day 823 944 709 820 760 762 634 844 1070 700 546
Fig. 5.4 Flexural Strength of Concrete Mixes with Eastern Washington Aggregate
0
200
400
600
800
1000
1200
3-day 7-day 14-day 28-day
Flex
ural
str
engt
h (p
si)
Age (days)
EW-SRA
EW-SL-SRA
EW
EW-SF-SRA
EW-FA-SRA
EW-FA-SL-SRA
EW-FA
EW-FA-SF-SRA
WSDOT
EW 2''
EW 2.5''
Page 87
69
Fig. 5.5 Flexural Strength Comparison of Concrete Mixes with Eastern Washington
Aggregate
For the early-age shrinkage cracking, the early-age flexural strength plays an
important role. For the mix designs of WSDOT, EW, EW 2’’ and EW 2.5’’, the trends of
flexural strength are similar to the compressive strength except that the flexural strength of
EW is higher than that of WSDOT at 3 days. By comparing two pairs of the mixes with and
without SRA, i.e., EW-SRA with EW and EW-FA-SRA with EW-FA, the data show that
when SRA is used, the early-age flexural strength increases. SRA not only increases the
early-age flexural strength, but also later strength. For the 28-day strength, the addition of
SRA increases the flexural strength of mix EW by 16% and increases the flexural strength of
EW-FA by 20%. The replacement of cement by FA decreases the flexural strength of
concrete at all ages, both for the EW-FA mix and for the EW-FA-SRA mix. The replacement
of cement by slag increases the flexural strength of concrete at all ages for EW-SL-SRA.
However, when combined with fly ash, the flexural strength decreases at all ages for EW-FA-
SL-SRA when compared with EW-SRA. The replacement of cement by silica fume also
0
200
400
600
800
1000
1200
3-day 7-day 14-day28-day
WSDOT
EW
EW 2''
EW 2.5'' 0200400600800
10001200
EW
EW-FA
EW-SRA
EW-FA-SRA
Page 88
70
decreases the flexural strength of EW-SF-SRA when compared with EW-SRA. This is
probably caused by the low paste content considered in all the mix designs, since there is not
a strong bond between the paste and aggregates. On the other hand, the low paste content can
reduce the shrinkage tendency as demonstrated in the shrinkage property tests.
5.4 Shrinkage Property Tests
Two tests on shrinkage properties of all the concrete mixes are conducted: free
shrinkage and restrained shrinkage. The free shrinkage test shows the basic shrinkage
property of concrete without any restraint; while the restrained shrinkage test illustrates the
combination of concrete tensile strength and shrinkage properties and relatively mimics the
condition of concrete deck being restrained by girders.
5.4.1 Free Shrinkage Test
Free shrinkage test follows AASHTO T 160 (ASTM C 157) “Length Change of
Hardened Hydraulic Cement Mortar and Concrete”. Free shrinkage data are collected at 1, 2,
3, 4, 5, 6, 7, 14, 21, and 28 days, respectively, from which the free shrinkage tendency
diagrams are drawn for all concrete mixes. According to a recent WSDOT bridge deck
construction regulation, the free shrinkage at 28 days should be less than 320 microstrains.
The free shrinkage data is listed in Table 5.5, and their tendency diagrams are shown in Figs.
5.6 to 5.8.
Page 89
71
Fig. 5.6 Free Shrinkage of WSDOT, EW, EW2, EW2.5
Fig. 5.7 Free Shrinkage of EW, EW-SRA, EW-FA and EW-FA-SRA
0.0
50.0
100.0
150.0
200.0
250.0
300.0
350.0
400.0
450.0
0.0 5.0 10.0 15.0 20.0 25.0 30.0
Free
shr
inka
ge (m
icro
stra
ins)
Age (days)
WSDOT
EW
EW 2
EW 2.5
0.0
50.0
100.0
150.0
200.0
250.0
300.0
350.0
400.0
450.0
0.0 5.0 10.0 15.0 20.0 25.0 30.0
Free
shr
inka
ge (m
icro
stra
ins)
Age (days)
EW
EW-SRA
EW-FA
EW-FA-SRA
Page 90
72
Table 5.5 Free Shrinkage Test Data (microstrain)
Mixtures Days
EW-SRA
EW-SL-SRA
EW EW-SF-
SRA
EW-FA-SRA
EW-FA-SL-
SRA
EW-FA
EW-FA-SF-
SRA
WSDOT
EW 2''
EW 2.5''
0.0 0.0 0.0 0.0 0.0 0.0 0.0 0.0 0.0 0.0 0.0 0.0
1.0 17.4 40.0 125.9 -20.7 18.7 17.5 32.0 2.6 56.0 18.7 17.8
2.0 31.1 57.2 149.6 -16.0 31.4 31.1 81.8 16.2 97.8 33.8 24.0
3.0 55.1 68.7 162.7 -5.9 37.6 47.4 107.3 31.2 127.4 73.8 49.2
4.0 79.3 88.3 183.4 -4.1 49.2 57.2 116.4 46.7 153.2 90.1 78.8
5.0 81.9 n/a 192.9 3.9 52.7 67.3 136.9 54.5 n/a 91.6 82.7
6.0 88.3 129.2 204.1 13.9 59.3 84.4 168.0 55.7 233.8 108.1 93.6
7.0 103.8 134.8 225.2 21.0 64.0 93.3 187.6 65.5 242.4 133.9 109.6
14.0 147.9 175.4 287.0 69.0 96.9 132.1 253.6 102.4 337.5 217.2 217.5
21.0 187.0 189.6 316.1 97.2 117.9 157.0 350.5 137.6 389.6 221.6 217.2
28.0 225.5 210.2 363.9 119.4 122.1 185.8 421.6 156.8 410.7 259.6 255.1
Page 91
73
The influence of SRA on the free shrinkage is shown in Fig. 5.6. For EW and EW-
FA, no SRA is added, and their free shrinkages at 28 days are all more than 320 microstrains.
For EW and EW-FA, the replacement of cement by fly ash reduces the early age free
shrinkage, especially in the first 14 days. However, it increases later, making the 28-day free
shrinkage larger than the one without fly ash. When SRA is used, the free shrinkages of both
of EW-SRA and EW-FA-SRA are reduced considerably, especially for EW-FA-SRA. For
EW and EW-FA, the addition of SRA reduces their 28-day free shrinkage by 38% and 71%,
respectively. The combination of fly ash and SRA has a greatest effect, reducing the free
shrinkage value of that mix to 122.1 microstrains, which is far below the WSDOT limit of
320 microstrains.
Fig. 5.8 Free Shrinkage of Eastern Washington Concrete Mixes with SRA
When SRA is used, the mix EW-SRA without using any cementitious materials except
cement has the largest 28-day free shrinkage. For EW-SF-SRA, the free shrinkage values are
-50.0
0.0
50.0
100.0
150.0
200.0
250.0
0.0 5.0 10.0 15.0 20.0 25.0 30.0
Free
shr
inka
ge (m
icro
stra
ins)
Age (days)
EW-SRA
EW-FA-SRA
EW-SL-SRA
EW-SF-SRA
EW-FA-SL-SRA
EW-FA-SF-SRA
Page 92
74
even minus values for the first 4 days, which means that the concrete beam sample expanded
during the first 4 days. The samples of EW-SRA shrink later, and they have the smallest 28-
day free shrinkage of all the eight concrete mixes. The replacement of cement by slag
increases early-age free shrinkage but eventually reduces the 28-day free shrinkage. Both the
combination of fly ash with slag and fly ash with silica fume decrease the free shrinkage when
compared with the one only with cement.
5.4.2 Restrained Shrinkage Test
The restrained shrinkage test follows AASHTO PP 34-99 “Cracking Tendency Using
a Ring Specimen”. The restrained ring test data is listed in Table 5.6.
Table 5.6 Restrained Ring Test Data (Days of cracking)
Mixtures EW-SRA
EW-SL-SRA
EW EW-SF-
SRA
EW-FA-SRA
EW-FA-SL-
SRA
EW-FA
EW-FA-SF-
SRA
WSDOT
EW 2''
EW 2.5''
6'' Ring No.1
no crack
no crac
k 13.1 no
crack
no crac
k
no crack 4.8 no
crack 8.0 12.1 14.5
6'' Ring No.2
no crack
no crac
k 17.6 no
crack
no crac
k
no crack 7.8 no
crack 11.6 8.9 28.0
3'' Ring no crack 25.9 10.9 no
crack n/a no crack 3.3 no
crack n/a n/a n/a
Of the four concrete mixes WSDOT, EW, EW 2’’, EW 2.5’’, the ring specimens of
WSDOT concrete mix crack the earliest, though it has the highest flexural (tensile) strength of
all the four. The WSDOT concrete mix design has the largest paste content and very large
free shrinkage. From this mix, it can be seen that the tensile strength is not the most critical
Page 93
75
factor in preventing early-age shrinkage cracking. None of the 6 in. ring specimens
containing SRA cracked within 28 days, even for the concrete mixes that have low flexural
and compressive strengths. No shrinkage cracking of the concrete ring is closely associated
with the low free shrinkage of all the concrete mixes using SRA. The cracking of a ring
specimen is the mutual effects of concrete free shrinkage and concrete flexural (tensile)
strength. When the free shrinkage values are low, the induced tensile stresses on specimens in
the ring are low. For EW and EW-FA, the free shrinkages are large, and the flexural strengths
are low, leading to the cracking of the rings early or within 28 days. Although the early-age
free shrinkage of EW-FA is smaller than EW, its flexural strength is smaller than EW, and
consequently, EW-FA cracks earlier than EW does.
5.5 Concluding Remarks
From a material point of view, the cracking potential of concrete is the combined
effects of its mechanical property (i.e., primarily its tensile strength) and its shrinkage
property (i.e., shrinkage strain). The concrete mix design with a high flexural (tensile)
strength and low free shrinkage has the best cracking resistance. The current WSDOT
concrete mix design with eastern Washington aggregate has very high flexural strength.
However, its free shrinkage is also very large. As a result, its ring specimens cracked early
and before 28 days. For the concrete mix design EW in this research using aggregates of
nominal size 1.5 in., the paste volumes is reduced when compared with the current WSDOT
mix. Although its strength is correspondingly reduced a lot when compared with the WSDOT
design, it cracks later since it has a small early-age free shrinkage. The replacement of
cement by slag and by silica fume increases the strength of concrete, while the replacement of
Page 94
76
cement by fly ash decreases the early-age strength of concrete significantly. The ring
specimens of EW-FA crack earlier than those of EW. When SRA is added to the concrete
mixes, the free shrinkage for all the mixes is dramatically reduced. None of 6 in. tall ring of
the mix designs containing SRA cracks within 28 days. SRA is highly recommended to be
used in concrete applications to mitigate the early-age cracking in concrete bridge decks.
Trial batches are recommended to be cast and tested for quality control purpose before any
field application.
Page 95
77
CHAPTER SIX
PERFORMANCE OF MIX DESIGNS WITH WESTERN WASHINGTON
AGGREGATES
6.1 Introduction
This chapter reports on test results for concrete cast using coarse aggregates from
western Washington. All the materials and the experimental procedures are the same as those
introduced in Chapter 5 for the eastern Washington aggregate, except that all the coarse
aggregates used are from western Washington.
6.2 Fresh Property Tests
As for eastern Washington aggregates, the slump test and air content test are
conducted as quality control of concrete fresh properties. The slump test follows ASTM C
143/AASHTO T 119 “Slump of hydraulic cement concrete and for air content test”. Two
methods are considered. The pressure method follows AASHTO T 152/ASTM C 231 “Air
Content of Freshly-mixed Concrete by the Pressure Method”, and the volumetric method
follows AASHTO T 196/ASTM C 173 “Air Content of Freshly-Mixed Concrete by the
Volumetric Method”.
The slump test results are from 3.25 in. to 6.5 in., and the air content test results are
from 4.5% to 10% (see Table 6.1). Because several chemicals are added to the concrete mix,
it is difficult to achieve the preferable air content range of 6.5% to 9.5% for some concrete
mixes with Western Washington aggregate. The test results are listed in Table 6.1.
Page 96
78
Table 6.1 Slump and Air Content Data
Mixtures WW-SRA
WW-SL-SRA
WW WW-SF-
SRA
WW-FA-SRA
WW-FA-SL-
SRA
WW-FA
WW-FA-SF-
SRA
LD-WSDOT
WW 2''
WW 2.5''
Slump (in.) 4.2 3.8 3.6 5 3.25 6.5 3.8 5.3 4 3.3 5.8
Air Content (%) 4.8 5.5 8.8 6.2 5 4.5 8 7.1 4.8 9.8 10
6.3 Mechanical Property Tests
The compressive strength, modulus of elasticity, and flexural strength are tested for
each concrete mix design.
6.3.1 Compressive Strength Test
ASTM C 39/AASHTO T 22 “Compressive Strength of Cylindrical Concrete
Specimens” is followed for the compressive test of concrete cylinder specimens. The
compressive strength test ensures that the designed/tested concrete mix designs meet the
minimum WSDOT 28-day compressive strength requirements of 4,000 psi. The test results
are presented in Table 6.2 and graphically in Figs. 6.1 and 6.2.
Table 6.2 Compressive Strength Test Data (psi)
Mixtures
WW-
SRA
WW-SL-SRA WW
WW-SF-
SRA
WW-FA-SRA
WW-FA-SL-
SRA WW-FA
WW-FA-SF-
SRA
LD-WS
DOT WW
2 WW 2.5
7-day Strength
4971 4356 4766 6591 4175 3779 3221 3809 3461 6002 6003
28-day Strength 6322 5651 5652 7725 5310 5060 3966 5263 4432 6578 6485
Page 97
79
Fig. 6.1 Compressive Strength of Western Washington Concrete Mixes (psi)
Fig. 6.2 Compressive Strength Comparisons
0
1000
2000
3000
4000
5000
6000
7000
8000
9000
7-day Strength 28-day Strength
WW-SRA
WW-SL-SRA
WW
WW-SF-SRA
WW-FA-SRA
WW-FA-SL-SRA
WW-FA
WW-FA-SF-SRA
LD-WSDOT
WW 2''
WW 2.5''
01000200030004000500060007000
7-day Strength
28-day Strength
LD-WSDOT
WW
WW 2''
WW 2.5'' 01000200030004000500060007000
7-day Strength
28-day Strength
WW
WW-SRA
WW-FA
WW-FA-SRA
0
2000
4000
6000
8000
10000
7-day Strength 28-day Strength
WW-SRA
WW-SL-SRA
WW-SF-SRA
WW-FA-SRA
WW-FA-SL-SRA
WW-FA-SF-SRA
Page 98
80
The comparisons among LD-WSDOT, WW, WW2’’, and WW 2.5’’ show that LD-
WSDOT had the lowest compressive strength at all ages. LD-WSDOT used the w/c ratio of
0.48, and its paste volume is 25.8%. Its high w/c ratio leads to its low strength. The nominal
size 2’’ aggregates for WW 2’’ include both the larger size aggregates and are well graded.
The aggregates for WW 2’’ and WW 2.5’’ are similar except for that WW 2.5’’has around
8% more larger size aggregates. Well graded aggregates require less paste to achieve good
workability and thus have better bonding between aggregates and cement paste. Therefore,
the compressive strength of WW 2’’ and WW 2.5’’ are similar, and both are larger than that
of WW.
The addition of SRA increases the 28-day compressive strength of both WW and
WW-FA, which is consistent with the observation for the eastern Washington aggregate data.
Also, the replacement of cement using FA reduces the strength of concrete both with and
without the addition of SRA. WW-FA has the lowest compressive strength of all the mixes,
and its compressive strength is below the WSDOT minimum requirement of 4,000 psi at 28
days.
The mix design WW-SF, i.e., the replacement of cement by silica fume, has the
highest compressive strength at all ages. The replacements of cement by other cementitious
materials, such as fly ash, slag, and the combination of two cementitous materials, are all
lower than that of WW.
6.3.2 Modulus of Elasticity Test
ASTM C469 “Standard Test Method for Static Modulus of Elasticity and Poisson's
Ratio of Concrete in Compression” is followed for modulus of elasticity test of cylinder
Page 99
81
specimens. The test results are presented in Table 6.3 and shown graphically in Fig. 6.3.
Table 6.3 Modulus of Elasticity Test Data (x106 psi)
Mixtures WW-SRA
WW-SL-SRA
WW WW-SF-
SRA
WW-FA-SRA
WW-FA-SL-
SRA
WW-FA
WW-FA-SF-
SRA
LD-WSDOT
WW 2''
WW 2.5''
7-day Modulus
4.15 3.7 4.55 5.1 4 4 3.6 4 2.95 4.85 4.45
28-day Modulus 4.65 3.95 4.7 5.35 4.8 4.3 3.95 4.45 3.4 5.15 5.25
Fig. 6.3 Modulus of Elasticity of Western Concrete Mixes
The replacement of cement by silica fume has the highest modulus among all these
western mixes. The LD-WSDOT has the lowest. WW 2 and WW 2.5 have a higher modulus
than that of WW, which is consistent with the compressive strength comparison. Unlike in
0
1
2
3
4
5
6
7-day Modulus 28-day Modulus
WW-SRA
WW-SL-SRA
WW
WW-SF-SRA
WW-FA-SRA
WW-FA-SL-SRA
WW-FA
WW-FA-SF-SRA
LD-WSDOT
WW 2
WW 2.5
Page 100
82
eastern concrete mixes, the replacement of cement by slag decreases the modulus of original
concrete mix.
6.3.3 Flexural Strength Test
AASHTO T 97/ASTM C 78 “Standard Method of Test for Flexural Strength of
Concrete (Using Simple Beam with Third-Point Loading)” is followed for the flexural
strength test of beam specimens. The flexural strength of all the concrete mix designs at 3, 7,
14, and 28 days are tested. The test results are shown in Table 6.4 and also graphically in
Figs. 6.4 and 6.5.
Table 6.4 Flexural Strength Test Data (psi)
Mixture
s
WW-
SRA
WW-
SL-
SRA
WW
WW-
SF-
SRA
WW-
FA-
SRA
WW-
FA-SL-
SRA
WW-
FA
WW-
FA-SF-
SRA
LD-
WSD
OT
WW
2''
WW
2.5''
3-day 646 579 630 784 508 445 449 451 412 833 900
7-day 851 754 725 887 625 576 562 589 499 749 869
14-day 903 788 814 919 713 688 607 688 594 825 954
28-day 915 753 762 1022 744 759 577 831 748 932 921
Page 101
83
Fig. 6.4 Flexural Strength of Western Concrete Mixes
Fig. 6.5 Flexural Strength Comparison
0
200
400
600
800
1000
1200
3-day 7-day 14-day 28-day
WW-SRA
WW-SL-SRA
WW
WW-SF-SRA
WW-FA-SRA
WW-FA-SL-SRA
WW-FA
WW-FA-SF-SRA
LD-WSDOT
WW 2''
WW 2.5''
0
200
400
600
800
1000
1200
LD-WSDOT
WW
WW 2''
WW 2.5'' 0
200
400
600
800
1000
WW
WW-FA
WW-SRA
WW-FA-SRA
0
200
400
600
800
1000
1200
3-day 7-day 14-day 28-day
WW-SRA
WW-SL-SRA
WW-SF-SRA
WW-FA-SRA
WW-FA-SL-SRA
WW-FA-SF-SRA
Page 102
84
Among the four concrete mix designs of LD-WSDOT, WW, WW 2’’, and WW 2.5’’,
the flexural strength trend is similar to that of the compressive strength. LD-WSDOT has the
lowest flexural strength, and WW 2’’ and WW 2.5’’ have the highest. Also, the addition of
SRA increases the flexural strength of both WW and WW-FA. And the replacement of
cement by fly ash reduces the flexural strength at all ages. Among those mix designs
containing SRA, the replacement of cement by silica fume has the highest flexural strength at
all ages. The replacements of cement by other cementitious materials, such as fly ash, slag, or
the combination of different cementitious materials, all have smaller flexural strengths than
that of WW-SRA.
6.4 Shrinkage Property Tests
Similarly to the tests performed for the mix designs with the eastern Washington
aggregate, the free shrinkage and restrained shrinkage tests are conducted for all concrete
mixes using the western coarse aggregates.
6.4.1 Free Shrinkage Test
AASHTO T 160 (ASTM C 157) “Length Change of Hardened Hydraulic Cement
Mortar and Concrete” is followed for the free shrinkage test using beam specimens. The
same test methods are adopted as in Chapter 5 for the eastern Washington aggregates. The
free shrinkage test results are presented in Table 6.5 and graphically shown in Figs. 6.6 and
6.7.
Page 103
85
Fig. 6.6 Free Shrinkage of LD-WSDOT, WW, WW2, WW2.5
In Fig. 6.6, the free shrinkages of concrete mix designs without SRA and without any
replacement of cement with other cementitious materials are compared. LD-WSDOT has a
w/c ratio of 0.48, and it has the largest paste content of the four concrete mixes, leading to the
highest free shrinkage. WW has the second largest value of free shrinkage. Both of these two
have free shrinkage larger than 320 microstrains at 28-day. The WSDOT required the
maximum free shrinkage value to be less than 320 microstrains at 28-day. Therefore, LD-
WSDOT and WW do not satisfy the WSDOT requirement of 320 microstrains. The free
shrinkage values for WW 2 and WW 2.5 both meet the WSDOT requirements.
0.0
100.0
200.0
300.0
400.0
500.0
600.0
700.0
0.0 5.0 10.0 15.0 20.0 25.0 30.0
LD-WSDOT
WW
WW 2
WW 2.5
Page 104
86
Table 6.5 Free Shrinkage Test Data (microstrain)
Mixtures Days
WW-SRA
WW-SL-SRA
WW WW-SF-SRA
WW-FA-SRA
WW-FA-SL-
SRA
WW-FA
WW-FA-SF-
SRA
LD-WSDOT
WW 2''
WW 2.5''
0.0 0.0 0.0 0.0 0.0 0.0 0.0 0.0 0.0 0.0 0.0 0.0
1.0 17.2 5.0 53.9 -0.9 2.7 27.3 24.3 1.8 70.8 71.1 37.0
2.0 46.2 31.4 145.5 9.2 5.9 38.2 44.0 2.4 126.2 92.1 57.5
3.0 56.6 52.4 179.6 13.6 9.2 53.0 75.7 5.0 161.8 114.7 77.6
4.0 65.5 61.9 194.7 87.4 87.7 62.5 87.9 7.4 214.2 127.7 94.5
5.0 74.4 63.7 215.4 94.8 96.0 65.8 98.8 9.2 240.3 143.4 115.6
6.0 98.1 69.9 234.7 101.9 100.1 74.1 120.1 14.5 275.3 157.9 128.0
7.0 105.8 88.9 246.8 102.2 104.6 83.3 129.0 19.6 296.6 172.1 143.1
14.0 154.4 107.9 329.5 118.8 117.3 122.7 196.0 30.2 461.6 227.6 196.7
21.0 182.8 163.0 386.7 160.0 156.4 146.7 240.1 111.7 551.8 258.2 234.5
28.0 196.8 188.1 416.6 155.6 160.3 176.9 264.4 129.8 616.9 271.1 259.9
Page 105
87
Fig. 6.7 Free Shrinkage of WW, WW-SRA, WW-FA and WW-FA-SRA
Fig. 6.7 shows that when fly ash is used to replace cement, the free shrinkage
decreases, both for WW-FA and WW-FA-SRA. Especially, when no SRA is added, fly ash
replacement of cement reduces the 28-day free shrinkage of WW by 37%. When SRA is
added, the free shrinkage of WW decreases by 53%, from 416.6 microstrains to 196.8
microstrains at 28 days. The free shrinkage of WW-FA decreases by 39%, from 264.4
microstrains to 160.3 microstrains at 28 days.
Fig.6.8 Free Shrinkage of Western Concrete Mixes with SRA
0.050.0
100.0150.0200.0250.0300.0350.0400.0450.0
0.0 5.0 10.0 15.0 20.0 25.0 30.0
WW
WW-SRA
WW-FA
WW-FA-SRA
-50.0
0.0
50.0
100.0
150.0
200.0
250.0
0.0 5.0 10.0 15.0 20.0 25.0 30.0
WW-SRA
WW-SL-SRA
WW-SF-SRA
WW-FA-SRA
WW-FA-SL-SRA
WW-FA-SF-SRA
Page 106
88
Fig. 6.8 shows the free shrinkage of concrete mixes when SRA is included in the mix.
All the free shrinkage values are less than 200 microstrains at 28 days. The replacement of
cement by other cementitous materials further reduces the free shrinkage of concrete mixes
with SRA.
6.4.2 Restrained Shrinkage Test
AASHTO PP 34-99 Cracking Tendency Using a Ring Specimen is followed for the
restrained shrinkage test. The test results are presented in Table 6.6.
Table 6.6 Restrained Ring Test Data (cracking days)
Mixtures Days
WW-SRA
WW-SL-SRA
WW WW-SF-SRA
WW-FA-SRA
WW-FA-SL-
SRA
WW-FA
WW-FA-SF-
SRA
LD-WSDOT
WW 2''
WW 2.5''
6'' Ring No.1
no crack
no crack 9.4
no crack
no crack no crack 7.8
no crack 6.7 9.7 10.9
6'' Ring No.2
no crack
no crack 13.0
no crack
no crack no crack 6.3
no crack 8.5 15.4
no crack
3'' Ring 20.6 no
crack 3.7 no
crack no
crack no crack 5.3 no
crack 5.9 n/a n/a
Of the four mixes (LD-WSDOT, WW, WW 2, and WW 2.5), LD-WSDOT cracks the
earliest. LD-WSDOT has the smallest flexural strength at all ages. And its free shrinkage
values are always the highest. WW 2 seems to crack a little later than WW, while WW 2.5
has the best cracking resistance of four mix designs. Be aware that the nominal size of
aggregates used in WW 2 and WW 2.5 are already closed to the concrete ring thickness in the
ring test. Although WW-FA has smaller free shrinkage than that of WW at all ages, both of
the 6 in. tall ring specimens of WW-FA crack earlier than those of the WW concrete mix.
Page 107
89
This is caused by the low flexural strength of WW-FA. None of the 6 in. rings for all the
concrete mixes with SRA addition cracked within 28 days.
6.5 Concluding Remarks
In this chapter, both the fresh concrete, mechanical, and shrinkage properties of mix
designs with western Washington aggregate are characterized. The use of SRA significantly
reduces the free shrinkage of all concrete mixes. At the same time, the flexural and
compressive strength values are larger than those without SRA. The combined effects of the
improved strength properties and free shrinkage allow the concrete mixes with SRA to have a
high shrinkage cracking resistance. Fly ash replacement of cement decreases the strength of
concrete a lot, making the concrete with fly ash more shrinkage cracking vulnerable.
Although WW 2 has low free shrinkage and high flexural strength, the ring still cracks within
28 days. However, due to the limitation of ring test apparatus in this research, more research
on larger size aggregates is recommended. SRA is again recommended to be used to mitigate
early-age cracking problems in bridge deck applications.
Page 108
90
CHATPER SEVEN
CONCLUSIONS AND RECOMMENDATIONS
The goal of this study is to find the mitigations strategies for early-age shrinkage
cracking in concrete bridge decks. A comprehensive literature is first conducted. Based on
the literature and also the recommendations from the WSDOT, 20 concrete mixes are
designed. Two current WSDOT concrete mixes are also included as benchmarks for
comparisons with other newly developed concrete mix designs. Fresh properties, hardened
properties, and shrinkage properties are evaluated for all the 22 groups of concrete mixes. In
this chapter, the conclusions and recommendations are presented.
7.1 Conclusions
Based on the experimental evaluation of different mix designs conducted in this study,
the following conclusions are obtained.
1. The use of SRA significantly reduces the free shrinkage of all concrete mixes using
aggregates from Washington State. It also decreases the restrained shrinkage cracking
tendency of all concrete mixes. The laboratory test data show that none of the 6 in.
tall concrete ring specimens in the restrained ring test with inclusion of SRA crack
within 28 days.
2. The replacement of cement by fly ash decreases the strength of concrete. In the
concrete mixes with both the eastern Washington aggregates and western aggregates,
concrete containing fly ash cracks earlier than the corresponding concrete without fly
ash.
Page 109
91
3. Paste volume plays an important role in the free shrinkage of concrete. Concrete
mixes with a small paste volume have small tendency of shrinkage cracking. The use
of larger size aggregates reduces the paste volume in concrete mix. From the control
concrete mixes to concrete using the nominal size of 2.5 in. aggregates, less paste
volume are used. Free shrinkage became smaller, and the ring specimens delay the
cracking.
4. When SRA is added, the replacements of cement by fly ash, silica fume, and slag
further reduce the free shrinkage of concrete. However, they play a less important role
than SRA.
5. Concrete cracking resistance is the combined effects of both its flexural (tensile)
strength and its free shrinkage property. The concrete mix that has an acceptable
tensile strength and low free shrinkage strain is anticipated to have relatively good
cracking resistance.
6. ADVA 190 high-range water-reducing admixtures have a great effect on adjusting the
workability of concrete. It is able to change the slump test value from almost zero to a
high value to achieve the desired workability.
7. When several chemicals are used in one concrete mix, it is difficult to achieve the
desired fresh concrete properties, such as air content.
8. Both the size of coarse aggregates and the source of coarse aggregates played a very
important role in the property of concrete. As the size of coarse aggregates increases,
both the free shrinkage and restrained shrinkage properties are improved.
Page 110
92
7.2 Recommendations
Based on the comprehensive experimental program conducted in this study, the
following recommendations are suggested for improved concrete design to mitigate the
shrinkage cracking in concrete.
1. SRA is recommended to be used in concrete mix to mitigate early-age shrinkage
cracking in concrete bridge decks. However, trial batches are recommended to be
conducted first before any field applications.
2. Fly ash is not recommended to be used due to its low early-age strength.
3. Concrete designs with less paste volume are recommended to be used to increase the
cracking resistance.
4. Large sizes of coarse aggregates are recommended in construction.
5. When several cementitous materials and chemical admixtures are used in the same
concrete mix, trial batches are recommended to be evaluated before field applications.
Page 111
93
BIBLIOGRAPHY
AASHTO PP34-99 (2006) “Standard Practice for Estimating the Crack Tendency of Concrete,” AASHTO Provisional Standards, Washington D.C.
Akkaya, Y., Ouyang, C. and Shah, S. P. (2007) “Effect of Supplementary Cementitious Materials on Shrinkage and Crack Development in Concrete,” Cement and Concrete Composites, Vol. 29, Issue 2, Feb. 2007, pp 117-123
Altoubat, S. A., and Lange, D. A. (2001) “Creep, Shrinkage, and Cracking of Restrained Concrete at Early Age”, ACI Materials Journal, V. 98, No. 4, July-Aug., pp. 323-331
ASTM C1581-04, (2007) “Standard Test Method for Determining Age at Cracking and Induced Tensile Stress Characteristics of Mortar and Concrete under Restrained Shrinkage”, ASTM International, Vol. 04.02, pp 791-796.
Babaei, K, and Purvis, R.L. (1996) “Premature Cracking of Concrete Bridge Decks: Cause and Methos of prevention”, Proceedings, 4th International Bridge Engineering Conference
Banthia, N. (2000). “Crack Growth Resistance of High Performance Hybrid Fiber Reinforced Cement Composites”, High Performance Concrete – Workability, Strength and Durability, Proc. of the Int. Sym., Editors, Leugn, C., Li, Z., and Ding, J.T., Dec., Hong Kong, pp. 403-409.
Bissonnette, B., Pierre, P., and Pigeon, M. (1999) “Influence of Key Parameters on Drying Shrinkage of Cementitious Materials”, Cement and Concrete Research, Vol. 29, pp. 1655-1662.
Bloom, R. and Bentur, A. (1995) “Free and Restrained Shrinkage of Normal and High-strength Concretes,” ACI Materials Journal, Vol. 92, No. 2, Mar.-Apr., pp. 211-217.
Brown, M.D., Sellers, G., Folliard, K.J., and Fowler, D.W. (2001) “Restrained Shrinkage Cracking of Concrete Bridge Decks: State-of-the-Art Review”, Center for Transportation Research, The University of Texas at Austin, FHWA/TX-0-4098-1.
Brown, M.D., Smith, C.A., Sellers, G., Folliard, K.J., and Breen, J.E.(2007) “Use of Alternative Materials to Reduce Shrinkage Cracking in Bridge Decks”, American Concrete Institute (ACI) Materials Journal, Novembe, Volume 104, Issue 6, pp. 629-637
Burrows, R.W. (1998) “The Visible and Invisible Cracking of Concrete”, American Concrete Monograph No. 11.
Page 112
94
Darwin, D., Lindquist, W.D., McLeod, H. A. K., and Browning, J. (2007) “Mineral Admixtures, Curing, and Concrete Shrinkage”, Ninth Canmet/ACI International Conference on Fly Ash, Silica Fume, Slag and Natural Pozzolans in Concrete, Warsaww, Poland.
Delatte, N., Mack, E., and Cleary, J. (2007) “Evaluation of High Absorptive Materials to Improve Internal Curing of Low Permeability Concrete”, State Job Number 134227, Final Report, Cleveland State University, Cleveland, OH.
Edward, G. Nawy (2001) “Fundamentals of High Performance Concrete”, 2nd Edition, John Wiley & Sons, N.Y., 445 pp.
Folliard, K.J., and Berke, N.S. (1997) “Properties of High-Performance Concrete Containing Shrinkage-Reducing Additives”, Cement and Concrete Research, Vol.24, No. 3, pp. 424–432.
Folliard, K.J. and Berke, N.S.(1997) “Properties of High-Performance Concrete Containing Shrinkage-Reducing Additives”, Cement and Concrete Research, Vol. 27, No. 9, pp. 1357-1364.
Folliard, K. J.; Smith, C. A.; Sellers, J. G.; Brown, M. D.; and Breen, J. E.(2003) “Evaluation of Alternative Materials to Control Drying Shrinkage Cracking in Concrete Bridge Decks”, Research Report 0-4098-4, Center for Transportation Research, University of Texas at Austin, Austin, TX, Oct., 170 pp
French, C.; Eppers, L.; Le, Q.; and Hajjar, J. F. (1999) “Transverse Cracking in Concrete Bridge Decks”, Transportation Research Record 1688, National Research Council, Washington, D.C., pp. 21-29.
Gong, Z. (2006) “Cracking Studies of High-Performance Concrete for Bridge Decks”, Thesis (PhD), West Virginia University, Morgantown, WV, 223 pp
Guo, X. H, and Gilbert, R. I. (2000) “The Effect of Specimen Size on the Fracture Energy and Softening Function of Concrete”, Materials and Structures, V. 33, pp. 309-316.
Issa, M. (1999) “Investigation of Cracking in Concrete Bridge Decks at Early Ages”, Journal of Bridge Engineering, Vol. 4 No. 2
Krauss, P.D., and Rogalla, E.A. (1996) “Transverse Cracking in Newly Constructed Bridge Decks”, National Cooperative Highway Research Program (NCHRP) Report 380, Transportation Research Board.
Lawler, J., Connolly, J.D., Krauss P.D., Tracy, S.L. Ankenman, B.E. (2007) “Guidelines for Concrete Mixtures Containing Supplementary Cementitious Materials to Enhance Durability of Bridge Decks”, NCHRP Report 566, Transportation Research Board.
Page 113
95
Mazloom, M., Ramezanianpour, A.A., and Brooks, J.J. (2004) “Effect of silica fume on mechanical properties of high-strength concrete”, Cement and Concrete Composites, Vol. 26, pp. 347–357.
Mindess, S., Young, J.F. and Darwin, D. (2003) “Concrete”, 2nd edition, Prentice-Hall, Upper Saddle River, N.J., 644 pp.
Paillère, A. M., Buil, M., and Serrano, J. J. (1989) “Effect of Fiber Addition on the Autogenous Shrinkage of Silica Fume Concrete”, ACI Materials Journal, Vol. 86, No. 2, Mar.-Apr., pp. 139-144.
Schaels, C. A., and K. C. Hover. (1988) “Influence of Mix Proportions and Construction Operations on Plastic Shrinkage Cracking in Thin Slabs”, ACI Materials Journal, Vol. 85, pp. 495–504.
Schmitt, T.R. and Darwin D. (1995) “Cracking in Concrete Bridge Decks”, Report No. KTran:KU-94-1, Kansas Department of Transportation, Topeka, Kansas.
See, H. T., Attiogbe, E.K., and Miltenberger, M.A. (2003) “Shrinkage Cracking Characteristics of Concrete Using Ring Specimens”, ACI Materials Journal, Vol. 100, No.3, May-June, pp.239–245.
Shah, H. R. and Weiss, W. J. (2006) “Quantifying Shrinkage Cracking in Fiber Reinforced Concrete Using the Ring Test”, RILEM Materials and Structures, vol 39, no 9, pp. 887-899.
Shah, S.P., Karaguler, M.E., and Sarigaphuti, M. (1992) “Effects of Shrinkage-Reducing Admixtures on Restrained Shrinkage Cracking of Concrete”, ACI Materials Journal, Vol. 89, No. 3, May-June, pp. 289-295
Springenschmid, R.; Breitenbucher, R., and Mangold, M. (1994) “Development of Cracking Frame and the Temperature Stress Testing Machine”, Thermal Cracking in Concrete at Early Age, Edited by Springenschmid, R., E&FN Spon, London, pp. 137-144.
Sun, W., Chen, H., Luo, X., and Qian, H. (2000) “Influence of Hybrid Fibers and Expansive Agent on the Physical and Mechanical Properties of High Performance Concrete”, High Performance Concrete – Workability, Strength and Durability, Proc. of the Int. Sym., Editors, Leugn, C., Li, Z., and Ding, J.T., Dec., Hong Kong, pp. 209-218
Tia, M., Subramanian, R., Brown, D., Broward, C. (2005) "Evaluation of Shrinkage Cracking Potential of Concrete Used in Bridge Decks in Florida," Research Report, University of Florida, Sep., 129 pages.
Tritsch, N., Darwin, D. and Browning J. (2005) “Evaluating Shrinkage and Cracking Behavior of Concrete Using Restrained Ring and Free Shrinkage Tests”, The Transportation
Page 114
96
Pooled Fund Program Project No. TPF-5(051), Structural Engineering and Engineering Materials SM Report No.77, The University of Kansas Center for Research, Inc. at Kansas
Troxell, G. E.; Raphael, J. M.; and Davis, R. E. (1958) “Long-Time Creep and Shrinkage Tests of Plain and Reinforced Concrete”, Proceedings, ASTM, V. 58, pp. 1101-1120.
Weiss, W.J., Yang, W., and Shah, S.P. (1998) “Shrinkage Cracking – Can it be Prevented?” Concrete International, April, pp. 51–55,
Weiss, W. J., Yang, W., and Shah, S. P. (1999) “Factors Influencing Durability and Early-Age Cracking in High Strength Concrete Structures”, SP 189-22 High Performance Concrete: Research to Practice, Farmington Hills MI, pp. 387-409
Weiss, W.J., and Shah, S. P. (2002) “Restrained Shrinkage Cracking: The Role of Shrinkage Reducing Admixtures and Specimen Geometry” Materials and Structures, March, VOL. 35 - NO 246, pp. 85-91
Weiss, W. J., and Berke, N. S. (2003) “Admixtures for Reduction of Shrinkage and cracking”, Early Age Cracking In Cementitious Systems, Chapter 7.5, RILEM Report 25, A. Bentur, ed., Bagneux, France, pp. 323-338.
Whiting, D., and Detwiler, R. (1998) “Silica Fume Concrete for Bridge Decks”, NCHRP Report 410, Transportation Research Board, 115 pp.
Xi, Y., Shing, B., and Xie, Z. (2001) “Development of Optimal Concrete Mix Designs for Bridge Decks”, Report No. CDOT-DTD-R-2001-11, sponsored by the Colorado Department of Transportation, Jun., 60 pp.
Xi, Y.P., Shing, B.S., Abu-Hejleh, N. and Asiz, A., Suwito, A., Xie, Z.H., and Ababneh, A. (2003) “Assessment of the Cracking Problem in Newly Constructed Bridge Decks in Colorado”, Report No. CDOT-DTD-R-2003-3 Final Report, University of Colorado at Boulder.
Page 116
98
Appendix A. Mechanical Test Data
The primary goal of this study is to evaluate the current WSDOT concrete mix designs in
bridge deck applications for their shrinkage cracking resistance and to develop and evaluate new
concrete mix designs to mitigate early-age shrinkage cracking in concrete bridge decks. With
the main focus on shrinkage properties, mechanical properties are also evaluated in parallel to
shrinkage properties.
Table A.1 shows the test data for compressive strength of all the concrete mixes
evaluated in this study. In most of the concrete mixes, the compressive strengths of the two
cylinders sampled from the same concrete mix and tested at the same age are very close to each
other. Some of the cylinders sampled from the same concrete mix and tested at the same age
show slightly differences due to the sample variations and concrete mix properties.
Table A.2 shows the test data for two beams sampled from the same concrete mix and
tested at the same age for flexural strength of the evaluated concrete mix. As in compressive
cylinders, some of the data show a relatively large variation of flexural strengths. However, they
can still indicate the effects of different concrete mixes on the flexural strength of concrete.
Page 117
99
Table A.1 Compressive Test Data for Two Cylinders
Mixes 7 days
28 days
Cylinder 1 Cylinder 2 Cylinder 1 Cylinder 2
EW-SRA 3963 4493 5039 4940
EW-SL-SRA 5634 5747 7297 6598
EW 4512 4163 4556 n/a
EW-SF-SRA 4789 4795 5481 5684
EW-FA-SRA 3870 3915 4391 4640
EW-FA-SL-SRA 3319 3419 5713 5210
EW-FA 3074 2767 3450 3481
EW-FA-SF-SRA 3816 3662 4234 5264
WW-SRA 5111 4830 6328 6316
WW-SL-SRA 4414 4297 5379 5924
WW 4787 4744 5681 5622
WW-SF-SRA 6652 6530 7721 7729
WW-FA-SRA 4150 4199 5298 5322
WW-FA-SL-SRA 3637 3921 5248 4872
WW-FA 3232 3211 4081 3850
WW-FA-SF-SRA 3812 3806 5347 5180
LD-WSDOT 3366 3556 4632 4838
WSDOT 6170 6227 7072 7381
EE 2 4230 3544 4584 4216
EE 2.5 3687 3446 4316 4180
WW2 6033 5972 6247 6910
WW2.5 6030 5975 6327 6644
Page 118
100
Table A.2 Flexural Test Data for Two Beams
Mixes 3 days 7 days 14 days 28 days
Beam
1
Beam
2
Beam
1
Beam
2
Beam
1
Beam
2
Beam
1
Beam
2
EW-SRA 766 631 829 757 809 1102 782 864
EW-SL-SRA 785 711 920 806 1011 910 1034 854
EW 519 632 673 746 784 696 709 708
EW-SF-SRA 678 598 736 609 823 893 800 839
EW-FA-SRA 629 519 741 685 758 819 802 718
EW-FA-SL-SRA 438 435 523 511 748 614 723 801
EW-FA 549 549 620 584 583 543 664 603
EW-FA-SF-SRA 474 614 715 640 725 800 843 846
WW-SRA 672 620 828 874 914 891 868 962
WW-SL-SRA 583 574 729 779 842 734 687 818
WW 657 604 758 693 859 769 790 735
WW-SF-SRA 765 804 874 900 974 865 1040 1003
WW-FA-SRA 530 486 640 610 714 711 731 757
WW-FA-SL-SRA 448 442 562 590 689 687 753 765
WW-FA 518 381 611 513 557 657 567 586
WW-FA-SF-SRA 459 442 589 589 714 661 907 755
LD-WSDOT 437 387 478 520 524 663 752 743
WSDOT 878 856 871 1006 1033 1030 1039 1101
EE2 664 609 695 571 679 695 787 613
EE2.5 575 471 607 616 694 697 568 524
WW2 831 834 768 731 778 871 898 967
WW2.5 908 893 878 860 968 940 986 857
Page 119
101
Appendix B. Concrete Mix Designs by KU Mix Program
CONCRETE MIX DESIGN
Compressive Strength: 4000D
Material / Source or
Designation / Blend1 Quantity (SSD) S.G. Yield, ft3 Type I/II Cement / Cement Producer / 100% 550 lb 3.15 2.80 SL--GGBFS / 123 / 0% 0 lb 2.89
FA--Fly Ash Type-F / 123 / 0% 0 lb 2.04
SF--Silica Fume / 123 / 0% 0 lb 2.18 Water 207 lb 1.00 3.32
new-#4 / #4 / 37.5% 1161 lb 2.70 6.89 new-#8 / #8 / 38% 1177 lb 2.68 7.04 New-Class 2 sand / sand / 24.5% 759 lb 2.65 4.59 Total Air, percent 8%
2.16
Daravair® 1000 Air Entrai / Grace Construction 38.6 fl oz (US) 1.02 0.04 Eclipse Plus SRA / Grace Construction 129.8 fl oz (US) 0.96 0.14 Adva 190 HWRA / Grace Construction 28.6 fl oz (US) 1.10 0.03 1The blend percentage indicated (by weight) is listed separately for cementitious materials and aggregates. 27.01
Total Water Content (including water in admixtures), lb 220
Water / Cementitious Material Ratio:
0.4
Concrete Unit Weight, pcf
143.2
Target Slump, in.
BLANK
Paste Content, percent
23.43%
Workability Factor (WF)
Target: 34.9 Actual: 34.9
Coarseness Factor (CF)
Target: 60.9 Actual: 60.9
Fig. B.1 Concrete Mix Design for EW-SRA
Page 120
102
CONCRETE MIX DESIGN Compressive Strength: 4000D
Material / Source or
Designation / Blend1 Quantity (SSD) S.G. Yield, ft3 Type I/II Cement / Cement Producer / 80% 440 lb 3.15 2.24 SL--GGBFS / 123 / 20% 110 lb 2.89 0.61 FA--Fly Ash Type-F / 123 / 0% 0 lb 2.04
SF--Silica Fume / 123 / 0% 0 lb 2.18 Water 207 lb 1.00 3.32
new-#4 / #4 / 37.6% 1160 lb 2.70 6.89 new-#8 / #8 / 38.2% 1179 lb 2.68 7.05 New-Class 2 sand / sand / 24.2% 748 lb 2.65 4.52 Total Air, percent 8%
2.16
Daravair® 1000 Air Entrai / Grace Construction 33.4 fl oz (US) 1.02 0.04 Eclipse Plus SRA / Grace Construction 129.8 fl oz (US) 0.96 0.14 Adva 190 HWRA / Grace Construction 35.2 fl oz (US) 1.10 0.04 1The blend percentage indicated (by weight) is listed separately for cementitious materials and aggregates. 27.00
Total Water Content (including water in admixtures), lb 220
Water / Cementitious Material Ratio:
0.4
Concrete Unit Weight, pcf
142.9
Target Slump, in.
BLANK
Paste Content, percent
23.61%
Workability Factor (WF)
Target: 34.9 Actual: 34.9
Coarseness Factor (CF)
Target: 60.9 Actual: 60.9
Fig. B.2 Concrete Mix Design for EW-SL-SRA
Page 121
103
CONCRETE MIX DESIGN Compressive Strength: 4000D
Material / Source or
Designation / Blend1 Quantity (SSD) S.G. Yield, ft3 Type I/II Cement / Cement Producer / 100% 550 lb 3.15 2.80 SL--GGBFS / 123 / 0% 0 lb 2.89
FA--Fly Ash Type-F / 123 / 0% 0 lb 2.04
SF--Silica Fume / 123 / 0% 0 lb 2.18 Water 218 lb 1.00 3.49
new-#4 / #4 / 37.5% 1160 lb 2.70 6.89 new-#8 / #8 / 38% 1177 lb 2.68 7.04 New-Class 2 sand / sand / 24.5% 759 lb 2.65 4.59 Total Air, percent 8%
2.16
Daravair® 1000 Air Entrai / Grace Construction 14.5 fl oz (US) 1.02 0.02 Eclipse Plus SRA / Grace Construction 0 fl oz (US) 0.96 0.00 Adva 190 HRWRA / Grace Construction 17.4 fl oz (US) 1.10 0.02 1The blend percentage indicated (by weight) is listed separately for cementitious materials and aggregates. 27.01
Total Water Content (including water in admixtures), lb 220
Water / Cementitious Material Ratio:
0.4
Concrete Unit Weight, pcf
143.2
Target Slump, in.
BLANK
Paste Content, percent
23.43%
Workability Factor (WF)
Target: 34.9 Actual: 34.9
Coarseness Factor (CF)
Target: 60.9 Actual: 60.9
Fig. B.3 Concrete Mix Design for EW
Page 122
104
CONCRETE MIX DESIGN Compressive Strength: 4000D
Material / Source or
Designation / Blend1 Quantity (SSD) S.G. Yield, ft3 Type I/II Cement / Cement Producer / 95.5% 462 lb 3.15 2.35 SL--GGBFS / 123 / 0% 0 lb 2.89
FA--Fly Ash Type-F / 123 / 0% 0 lb 2.04
SF--Silica Fume / 123 / 4.5% 22 lb 2.18 0.16 Water 182 lb 1.00 2.92 new-#4 / #4 / 36% 1154 lb 2.70 6.85 new-#8 / #8 / 30.2% 969 lb 2.68 5.79 New-Class 2 sand / sand / 33.9% 1087 lb 2.65 6.57 Total Air, percent 8%
2.16
Daravair® 1000 Air Entrai / Grace Construction 26 fl oz (US) 1.02 0.03 Eclipse Plus SRA / Grace Construction 129.8 fl oz (US) 0.96 0.14 Adva 190 HWRA / Grace Construction 26.7 fl oz (US) 1.10 0.03 1The blend percentage indicated (by weight) is listed separately for cementitious materials and aggregates. 26.99
Total Water Content (including water in admixtures), lb 194
Water / Cementitious Material Ratio:
0.4
Concrete Unit Weight, pcf
144.0
Target Slump, in.
BLANK
Paste Content, percent
20.79%
Workability Factor (WF)
Target: 34.8 Actual: 39.4
Coarseness Factor (CF)
Target: 61.1 Actual: 64.8
Fig. B.4 Concrete Mix Design for EW-SF-SRA
Page 123
105
CONCRETE MIX DESIGN Compressive Strength: 4000D
Material / Source or
Designation / Blend1 Quantity (SSD) S.G. Yield, ft3 Type I/II Cement / Cement Producer / 80% 440 lb 3.15 2.24 SL--GGBFS / 123 / 0% 0 lb 2.89
FA--Fly Ash Type-F / 123 / 20% 110 lb 2.04 0.86 SF--Silica Fume / 123 / 0% 0 lb 2.18
Water 204 lb 1.00 3.27 new-#4 / #4 / 38% 1160 lb 2.70 6.89 new-#8 / #8 / 39.1% 1192 lb 2.68 7.13 New-Class 2 sand / sand / 22.9% 697 lb 2.65 4.22 Total Air, percent 8%
2.16
Daravair® 1000 Air Entrai / Grace Construction 29.4 fl oz (US) 1.02 0.03 Eclipse Plus SRA / Grace Construction 204 fl oz (US) 0.96 0.21 Adva 190 HWRA / Grace Construction 17.1 fl oz (US) 1.10 0.02 1The blend percentage indicated (by weight) is listed separately for cementitious materials and aggregates. 27.03
Total Water Content (including water in admixtures), lb 220
Water / Cementitious Material Ratio:
0.4
Concrete Unit Weight, pcf
141.4
Target Slump, in.
BLANK
Paste Content, percent
24.54%
Workability Factor (WF)
Target: 34.9 Actual: 34.9
Coarseness Factor (CF)
Target: 60.7 Actual: 60.7
Fig. B.5 Concrete Mix Design for EW-FA-SRA
Page 124
106
CONCRETE MIX DESIGN Compressive Strength: 4000D
Material / Source or
Designation / Blend1 Quantity (SSD) S.G. Yield, ft3 Type I/II Cement / Cement Producer / 60% 330 lb 3.15 1.68 SL--GGBFS / 123 / 20% 110 lb 2.89 0.61 FA--Fly Ash Type-F / 123 / 20% 110 lb 2.04 0.86 SF--Silica Fume / 123 / 0% 0 lb 2.18
Water 207 lb 1.00 3.32 new-#4 / #4 / 38.2% 1159 lb 2.70 6.88 new-#8 / #8 / 39.3% 1193 lb 2.68 7.13 New-Class 2 sand / sand / 22.6% 686 lb 2.65 4.15 Total Air, percent 8%
2.16
Daravair® 1000 Air Entrai / Grace Construction 33.4 fl oz (US) 1.02 0.04 Eclipse Plus SRA / Grace Construction 129.8 fl oz (US) 0.96 0.14 Adva 190 HWRA / Grace Construction 35.2 fl oz (US) 1.10 0.04 1The blend percentage indicated (by weight) is listed separately for cementitious materials and aggregates. 27.00
Total Water Content (including water in admixtures), lb 220
Water / Cementitious Material Ratio:
0.4
Concrete Unit Weight, pcf
141.0
Target Slump, in.
BLANK
Paste Content, percent
24.72%
Workability Factor (WF)
Target: 34.9 Actual: 34.9
Coarseness Factor (CF)
Target: 60.6 Actual: 60.6
Fig. B.6 Concrete Mix Design for EW-FA-SL-SRA
Page 125
107
CONCRETE MIX DESIGN Compressive Strength: 4000D
Material / Source or
Designation / Blend1 Quantity (SSD) S.G. Yield, ft3 Type I/II Cement / Cement Producer / 80% 440 lb 3.15 2.24 SL--GGBFS / 123 / 0% 0 lb 2.89
FA--Fly Ash Type-F / 123 / 20% 110 lb 2.04 0.86 SF--Silica Fume / 123 / 0% 0 lb 2.18
Water 218 lb 1.00 3.49 new-#4 / #4 / 38% 1159 lb 2.70 6.88 new-#8 / #8 / 39.1% 1191 lb 2.68 7.12 New-Class 2 sand / sand / 22.8% 696 lb 2.65 4.21 Total Air, percent 8%
2.16
Daravair® 1000 Air Entrai / Grace Construction 14.5 fl oz (US) 1.02 0.02 Eclipse Plus SRA / Grace Construction 0 fl oz (US) 0.96 0.00 Adva 190 HWRA / Grace Construction 17.5 fl oz (US) 1.10 0.02 1The blend percentage indicated (by weight) is listed separately for cementitious materials and aggregates. 27.00
Total Water Content (including water in admixtures), lb 220
Water / Cementitious Material Ratio:
0.4
Concrete Unit Weight, pcf
141.3
Target Slump, in.
BLANK
Paste Content, percent
24.54%
Workability Factor (WF)
Target: 34.9 Actual: 34.9
Coarseness Factor (CF)
Target: 60.7 Actual: 60.7
Fig. B.7 Concrete Mix Design for EW-FA
Page 126
108
CONCRETE MIX DESIGN Compressive Strength: 4000D
Material / Source or
Designation / Blend1 Quantity (SSD) S.G. Yield, ft3 Type I/II Cement / Cement Producer / 72.7% 352 lb 3.15 1.79 SL--GGBFS / 123 / 0% 0 lb 2.89
FA--Fly Ash Type-F / 123 / 22.7% 110 lb 2.04 0.86 SF--Silica Fume / 123 / 4.5% 22 lb 2.18 0.16 Water 181 lb 1.00 2.90 new-#4 / #4 / 37.5% 1188 lb 2.70 7.05 new-#8 / #8 / 38.1% 1206 lb 2.68 7.21 New-Class 2 sand / sand / 24.4% 773 lb 2.65 4.67 Total Air, percent 8%
2.16
Daravair® 1000 Air Entrai / Grace Construction 33.4 fl oz (US) 1.02 0.04 Eclipse Plus SRA / Grace Construction 129.8 fl oz (US) 0.96 0.14 Adva 190 HWRA / Grace Construction 26 fl oz (US) 1.10 0.03 1The blend percentage indicated (by weight) is listed separately for cementitious materials and aggregates. 27.00
Total Water Content (including water in admixtures), lb 194
Water / Cementitious Material Ratio:
0.4
Concrete Unit Weight, pcf
142.4
Target Slump, in.
BLANK
Paste Content, percent
21.90%
Workability Factor (WF)
Target: 34.9 Actual: 34.9
Coarseness Factor (CF)
Target: 60.9 Actual: 60.9
Fig. B.8 Concrete Mix Design for EW-FA-SF-SRA
Page 127
109
CONCRETE MIX DESIGN Compressive Strength: 4000D
Material / Source or
Designation / Blend1 Quantity (SSD) S.G. Yield, ft3 Type I/II Cement / Cement Producer / 95.5% 462 lb 3.15 2.35 SL--GGBFS / 123 / 0% 0 lb 2.89
FA--Fly Ash Type-F / 123 / 0% 0 lb 2.04
SF--Silica Fume / 123 / 4.5% 22 lb 2.18 0.16 Water 183 lb 1.00 2.93 WW-new-#4 / #4 / 32.5% 1044 lb 2.70 6.20 WW-new-#8 / #8 / 25.6% 822 lb 2.68 4.92 New-Class 2 sand / sand / 41.8% 1342 lb 2.65 8.12 Total Air, percent 8%
2.16
Daravair® 1000 Air Entrai / Grace Construction 14.5 fl oz (US) 1.02 0.02 Eclipse Plus SRA / Grace Construction 129.8 fl oz (US) 0.96 0.14 Adva 190 HWRA / Grace Construction 17.4 fl oz (US) 1.10 0.02 1The blend percentage indicated (by weight) is listed separately for cementitious materials and aggregates. 27.01
Total Water Content (including water in admixtures), lb 194
Water / Cementitious Material Ratio:
0.4
Concrete Unit Weight, pcf
143.9
Target Slump, in.
BLANK
Paste Content, percent
20.79%
Workability Factor (WF)
Target: 34.9 Actual: 34.9
Coarseness Factor (CF)
Target: 61.0 Actual: 61.0
Fig. B.9 Concrete Mix Design for WW-SRA
Page 128
110
CONCRETE MIX DESIGN Compressive Strength: 4000D
Material / Source or
Designation / Blend1 Quantity (SSD) S.G. Yield, ft3 Type I/II Cement / Cement Producer / 80% 440 lb 3.15 2.24 SL--GGBFS / 123 / 20% 110 lb 2.89 0.61 FA--Fly Ash Type-F / 123 / 0% 0 lb 2.04
SF--Silica Fume / 123 / 0% 0 lb 2.18 Water 210 lb 1.00 3.37
WW-new-#4 / #4 / 33% 1016 lb 2.70 6.03 WW-new-#8 / #8 / 26.4% 813 lb 2.68 4.86 New-Class 2 sand / sand / 40.6% 1250 lb 2.65 7.56 Total Air, percent 8%
2.16
Daravair® 1000 Air Entrai / Grace Construction 14.5 fl oz (US) 1.02 0.02 Eclipse Plus SRA / Grace Construction 129.8 fl oz (US) 0.96 0.14 Adva 190 HWRA / Grace Construction 17.4 fl oz (US) 1.10 0.02 1The blend percentage indicated (by weight) is listed separately for cementitious materials and aggregates. 27.00
Total Water Content (including water in admixtures), lb 220
Water / Cementitious Material Ratio:
0.4
Concrete Unit Weight, pcf
142.6
Target Slump, in.
BLANK
Paste Content, percent
23.61%
Workability Factor (WF)
Target: 34.9 Actual: 34.9
Coarseness Factor (CF)
Target: 60.7 Actual: 60.7
Fig. B.10 Concrete Mix Design for WW-SL-SRA
Page 129
111
CONCRETE MIX DESIGN Compressive Strength: 4000D
Material / Source or
Designation / Blend1 Quantity (SSD) S.G. Yield, ft3 Type I/II Cement / Cement Producer / 100% 550 lb 3.15 2.80 SL--GGBFS / 123 / 0% 0 lb 2.89
FA--Fly Ash Type-F / 123 / 0% 0 lb 2.04
SF--Silica Fume / 123 / 0% 0 lb 2.18 Water 218 lb 1.00 3.49
WW-new-#4 / #4 / 32.9% 1017 lb 2.70 6.04 WW-new-#8 / #8 / 26.3% 812 lb 2.68 4.86 New-Class 2 sand / sand / 40.8% 1260 lb 2.65 7.62 Total Air, percent 8%
2.16
Daravair® 1000 Air Entrai / Grace Construction 14.5 fl oz (US) 1.02 0.02 Eclipse Plus SRA / Grace Construction 0 fl oz (US) 0.96 0.00 Adva 190 HWRA / Grace Construction 17.4 fl oz (US) 1.10 0.02 1The blend percentage indicated (by weight) is listed separately for cementitious materials and aggregates. 27.01
Total Water Content (including water in admixtures), lb 220
Water / Cementitious Material Ratio:
0.4
Concrete Unit Weight, pcf
142.9
Target Slump, in.
BLANK
Paste Content, percent
23.43%
Workability Factor (WF)
Target: 34.9 Actual: 34.9
Coarseness Factor (CF)
Target: 60.7 Actual: 60.7
Fig. B.11 Concrete Mix Design for WW
Page 130
112
CONCRETE MIX DESIGN Compressive Strength: 4000D
Material / Source or
Designation / Blend1 Quantity (SSD) S.G. Yield, ft3 Type I/II Cement / Cement Producer / 95.5% 462 lb 3.15 2.35 SL--GGBFS / 123 / 0% 0 lb 2.89
FA--Fly Ash Type-F / 123 / 0% 0 lb 2.04
SF--Silica Fume / 123 / 4.5% 22 lb 2.18 0.16 Water 183 lb 1.00 2.93 WW-new-#4 / #4 / 32.5% 1044 lb 2.70 6.20 WW-new-#8 / #8 / 25.6% 822 lb 2.68 4.92 New-Class 2 sand / sand / 41.8% 1342 lb 2.65 8.12 Total Air, percent 8%
2.16
Daravair® 1000 Air Entrai / Grace Construction 14.5 fl oz (US) 1.02 0.02 Eclipse Plus SRA / Grace Construction 129.8 fl oz (US) 0.96 0.14 Adva 190 HWRA / Grace Construction 17.4 fl oz (US) 1.10 0.02 1The blend percentage indicated (by weight) is listed separately for cementitious materials and aggregates. 27.01
Total Water Content (including water in admixtures), lb 194
Water / Cementitious Material Ratio:
0.4
Concrete Unit Weight, pcf
143.9
Target Slump, in.
BLANK
Paste Content, percent
20.79%
Workability Factor (WF)
Target: 34.9 Actual: 34.9
Coarseness Factor (CF)
Target: 61.0 Actual: 61.0
Fig. B.12 Concrete Mix Design for WW-SF-SRA
Page 131
113
CONCRETE MIX DESIGN Compressive Strength: 4000D
Material / Source or
Designation / Blend1 Quantity (SSD) S.G. Yield, ft3 Type I/II Cement / Cement Producer / 80% 440 lb 3.15 2.24 SL--GGBFS / 123 / 0% 0 lb 2.89
FA--Fly Ash Type-F / 123 / 20% 110 lb 2.04 0.86 SF--Silica Fume / 123 / 0% 0 lb 2.18
Water 210 lb 1.00 3.37 WW-new-#4 / #4 / 33.4% 1014 lb 2.70 6.02 WW-new-#8 / #8 / 27% 821 lb 2.68 4.91 New-Class 2 sand / sand / 39.6% 1203 lb 2.65 7.28 Total Air, percent 8%
2.16
Daravair® 1000 Air Entrai / Grace Construction 14.5 fl oz (US) 1.02 0.02 Eclipse Plus SRA / Grace Construction 129.8 fl oz (US) 0.96 0.14 Adva 190 HWRA / Grace Construction 17.4 fl oz (US) 1.10 0.02 1The blend percentage indicated (by weight) is listed separately for cementitious materials and aggregates. 27.01
Total Water Content (including water in admixtures), lb 220
Water / Cementitious Material Ratio:
0.4
Concrete Unit Weight, pcf
141.0
Target Slump, in.
BLANK
Paste Content, percent
24.54%
Workability Factor (WF)
Target: 34.9 Actual: 34.9
Coarseness Factor (CF)
Target: 60.5 Actual: 60.5
Fig. B.13 Concrete Mix Design for WW-FA-SRA
Page 132
114
CONCRETE MIX DESIGN Compressive Strength: 4000D
Material / Source or
Designation / Blend1 Quantity (SSD) S.G. Yield, ft3 Type I/II Cement / Cement Producer / 60% 330 lb 3.15 1.68 SL--GGBFS / 123 / 20% 110 lb 2.89 0.61 FA--Fly Ash Type-F / 123 / 20% 110 lb 2.04 0.86 SF--Silica Fume / 123 / 0% 0 lb 2.18
Water 210 lb 1.00 3.37 WW-new-#4 / #4 / 33.4% 1013 lb 2.70 6.01 WW-new-#8 / #8 / 27.1% 822 lb 2.68 4.92 New-Class 2 sand / sand / 39.4% 1194 lb 2.65 7.22 Total Air, percent 8%
2.16
Daravair® 1000 Air Entrai / Grace Construction 14.5 fl oz (US) 1.02 0.02 Eclipse Plus SRA / Grace Construction 129.8 fl oz (US) 0.96 0.14 Adva 190 HWRA / Grace Construction 17.4 fl oz (US) 1.10 0.02 1The blend percentage indicated (by weight) is listed separately for cementitious materials and aggregates. 27.00
Total Water Content (including water in admixtures), lb 220
Water / Cementitious Material Ratio:
0.4
Concrete Unit Weight, pcf
140.7
Target Slump, in.
BLANK
Paste Content, percent
24.72%
Workability Factor (WF)
Target: 34.9 Actual: 34.9
Coarseness Factor (CF)
Target: 60.4 Actual: 60.4
Fig. B.14 Concrete Mix Design for WW-FA-SL-SRA
Page 133
115
CONCRETE MIX DESIGN Compressive Strength: 4000D
Material / Source or
Designation / Blend1 Quantity (SSD) S.G. Yield, ft3 Type I/II Cement / Cement Producer / 80% 440 lb 3.15 2.24 SL--GGBFS / 123 / 0% 0 lb 2.89
FA--Fly Ash Type-F / 123 / 20% 110 lb 2.04 0.86 SF--Silica Fume / 123 / 0% 0 lb 2.18
Water 218 lb 1.00 3.49 WW-new-#4 / #4 / 33.4% 1014 lb 2.70 6.02 WW-new-#8 / #8 / 27% 821 lb 2.68 4.91 New-Class 2 sand / sand / 39.6% 1204 lb 2.65 7.28 Total Air, percent 8%
2.16
Daravair® 1000 Air Entrai / Grace Construction 14.5 fl oz (US) 1.02 0.02 Eclipse Plus SRA / Grace Construction 0 fl oz (US) 0.96 0.00 Adva 190 HWRA / Grace Construction 17.4 fl oz (US) 1.10 0.02 1The blend percentage indicated (by weight) is listed separately for cementitious materials and aggregates. 27.00
Total Water Content (including water in admixtures), lb 220
Water / Cementitious Material Ratio:
0.4
Concrete Unit Weight, pcf
141.1
Target Slump, in.
BLANK
Paste Content, percent
24.54%
Workability Factor (WF)
Target: 34.9 Actual: 34.9
Coarseness Factor (CF)
Target: 60.5 Actual: 60.5
Fig. B.15 Concrete Mix Design for WW-FA
Page 134
116
CONCRETE MIX DESIGN Compressive Strength: 4000D
Material / Source or
Designation / Blend1 Quantity (SSD) S.G. Yield, ft3 Type I/II Cement / Cement Producer / 72.7% 352 lb 3.15 1.79 SL--GGBFS / 123 / 0% 0 lb 2.89
FA--Fly Ash Type-F / 123 / 22.7% 110 lb 2.04 0.86 SF--Silica Fume / 123 / 4.5% 22 lb 2.18 0.16 Water 183 lb 1.00 2.93 WW-new-#4 / #4 / 33% 1041 lb 2.70 6.18 WW-new-#8 / #8 / 26.3% 832 lb 2.68 4.98 New-Class 2 sand / sand / 40.7% 1286 lb 2.65 7.78 Total Air, percent 8%
2.16
Daravair® 1000 Air Entrai / Grace Construction 14.5 fl oz (US) 1.02 0.02 Eclipse Plus SRA / Grace Construction 129.8 fl oz (US) 0.96 0.14 Adva 190 HWRA / Grace Construction 17.4 fl oz (US) 1.10 0.02 1The blend percentage indicated (by weight) is listed separately for cementitious materials and aggregates. 27.01
Total Water Content (including water in admixtures), lb 194
Water / Cementitious Material Ratio:
0.4
Concrete Unit Weight, pcf
142.1
Target Slump, in.
BLANK
Paste Content, percent
21.90%
Workability Factor (WF)
Target: 34.9 Actual: 34.9
Coarseness Factor (CF)
Target: 60.7 Actual: 60.7
Fig. B.16 Concrete Mix Design for WW-FA-SF-SRA
Page 135
117
Appendix C. Restrained Ring Strain Data
Fig. C.1a Ring Test for EW-SRA, 6 in. Ring A, from day 1
Fig. C.1b Ring Test for EW-SRA, 6 in. Ring B, from day 1
Fig. C.1c Ring Test for EW-SRA, 3 in. Ring, from day 1
-100
-80
-60
-40
-20
0
20
0 10 20 30 40 Strain 1
Strain 2
Strain 3
Strain 4
-80
-60
-40
-20
0
20
40
0 10 20 30 40
Strain 1
Strain 2
Strain 3
Strain 4
-100
-80
-60
-40
-20
0
20
0 10 20 30 40 Strain 1
Strain 2
Strain 3
Strain 4
Page 136
118
Fig. C.2a Ring Test for EW-SL-SRA, 6 in. Ring A, from day 1
Fig. C.2b Ring Test for EW-SL-SRA, 6 in. Ring B, from day 1
Fig. C.2c Ring Test for EW-SL-SRA, 3 in. Ring, from day 1
-600
-500
-400
-300
-200
-100
0
100
0 10 20 30 40
Shri
nkag
e (m
icro
stra
in)
Time (days)
Strain 1
Strain 2
Strain 3
Strain 4
-350
-300
-250
-200
-150
-100
-50
0
50
0 10 20 30 40
Shri
nkag
e (m
icro
stra
in)
Time (days)
Strain 1
Strain 2
Strain 3
Strain 4
-80
-60
-40
-20
0
20
40
60
80
0 10 20 30 40
Shri
nkag
e (m
icro
stra
in)
Time (days)
Strain 1
Strain 2
Strain 3
Strain 4
Page 137
119
Fig. C.3a Ring Test for EW, 6 in. Ring A, from day 1
Fig. C.3b Ring Test for EW, 6 in. Ring B, from day 1
Fig. C.3c Ring Test for EW, 3 in. Ring, from day 1
-120
-100
-80
-60
-40
-20
0
20
0 10 20 30
Shri
nkag
e (m
icro
stra
in)
Time (days)
Strain 1
Strain 2
Strain 3
Strain 4
-200
-100
0
100
200
300
400
0 10 20 30
Shri
nkag
e (m
icro
stra
in)
Time (days)
Strain 1
Strain 2
Strain 3
Strain 4
-500
0
500
1000
1500
2000
0 10 20 30
Shri
nkag
e (m
icro
stra
in)
Time (days)
Strain 1
Strain 2
Strain 3
Strain 4
Page 138
120
Fig. C.4a Ring Test for EW-SF-SRA, 6 in. Ring A, from day 1
Fig. C.4b Ring Test for EW-SF-SRA, 6 in. Ring B, from day 1
Fig. C.4c Ring Test for EW-SF-SRA, 3 in. Ring, from day 1
-80
-60
-40
-20
0
20
40
0 10 20 30 40
Shri
nkag
e (m
icro
stra
in)
Time (days)
Strain 1
Strain 2
Strain 3
Strain 4
-80
-60
-40
-20
0
20
40
0 10 20 30 40
Shri
nkag
e (m
icro
stra
in)
Time (days)
Strain 1
Strain 2
Strain 3
Strain 4
-80
-60
-40
-20
0
20
0 10 20 30 40
Shri
nkag
e (m
icro
stra
in)
Time (days)
Strain 1
Strain 2
Strain 3
Strain 4
Page 139
121
Fig. C.5a Ring Test for EW-FA-SRA, 6 in. Ring A, from day 1
Fig. C.5b Ring Test for EW-FA-SRA, 6 in. Ring B, from day 1
-70
-60
-50
-40
-30
-20
-10
0
10
20
30
40
0 10 20 30 40
Shri
nkag
e (m
icro
stra
in)
Time (days)
Strain 1
Strain 2
Strain 3
Strain 4
-100
-50
0
50
100
150
200
250
300
350
400
0 10 20 30 40
Shri
nkag
e (m
icro
stra
in)
Time (days)
Strain 1
Strain 2
Strain 3
Strain 4
Page 140
122
Fig. C.6a Ring Test for EW-FA-SL-SRA, 6 in. Ring A, from day 1
Fig. C.6b Ring Test for EW-FA-SL-SRA, 6 in. Ring B, from day 1
Fig. C.6c Ring Test for EW-FA-SL-SRA, 3 in. Ring, from day 1
-150
-100
-50
0
50
0 10 20 30 40
Shri
nkag
e (m
icro
stra
in)
Time (days)
Strain 1
Strain 2
Strain 3
Strain 4
-150
-100
-50
0
50
0 10 20 30 40
Shri
nkag
e (m
icro
stra
in)
Time (days)
Strain 1
Strain 2
Strain 3
Strain 4
-500
-400
-300
-200
-100
0
100
0 10 20 30 40
Shri
nkag
e (m
icro
stra
in)
Time (days)
Strain 1
Strain 2
Strain 3
Strain 4
Page 141
123
Fig. C.7a Ring Test for EW-FA, 6 in. Ring A, from day 1
Fig. C.7b Ring Test for EW-FA, 6 in. Ring B, from day 1
Fig. C.7c Ring Test for EW-FA, 3 in. Ring, from day 1
-80
-60
-40
-20
0
20
40
0 5 10 15 20
Shri
nkag
e (m
icro
stra
in)
Time (days)
Strain 1
Strain 2
Strain 3
Strain 4
-40
-20
0
20
40
60
0 5 10 15 20
Shri
nkag
e (m
icro
stra
in)
Time (days)
Strain 1
Strain 2
Strain 3
Strain 4
-100
-50
0
50
100
150
0 5 10 15 20
Shri
nkag
e (m
icro
stra
in)
Time (days)
Strain 1
Strain 2
Strain 3
Strain 4
Page 142
124
Fig. C.8a Ring Test for EW-FA-SF-SRA, 6 in. Ring A, from day 1
Fig. C.8b Ring Test for EW-FA-SF-SRA, 6 in. Ring B, from day 1
Fig. C.8c Ring Test for EW-FA-SF-SRA, 3 in. Ring, from day 1
-80
-60
-40
-20
0
20
40
0 10 20 30 40
Shri
nkag
e (m
icro
stra
in)
Time (days)
Strain 1
Strain 2
Strain 3
Strain 4
-60
-40
-20
0
20
0 10 20 30 40
Shri
nkag
e (m
icro
stra
in)
Time (days)
Strain 1
Strain 2
Strain 3
Strain 4
-100
-50
0
50
100
150
0 10 20 30 40
Shri
nkag
e (m
icro
stra
in)
Time (days)
Strain 1
Strain 2
Strain 3
Strain 4
Page 143
125
Fig. C.9a Ring Test for WW-SRA, 6 in. Ring A, from day 1
Fig. C.9b Ring Test for WW-SRA, 6 in. Ring B, from day 1
Fig. C.9c Ring Test for WW-SRA, 3 in. Ring, from day 1
-120
-100
-80
-60
-40
-20
0
20
0 10 20 30 40
Shri
nkag
e (m
icro
stra
in)
Time (days)
Strain 1
Strain 2
Strain 3
Strain 4
-100
-50
0
50
100
150
0 10 20 30 40
Shri
nkag
e (m
icro
stra
in)
Time (days)
Strain 1
Strain 2
Strain 3
Strain 4
-150
-100
-50
0
50
100
0 10 20 30 40
Shri
nkag
e (m
icro
stra
in)
Time (days)
Strain 1
Strain 2
Strain 3
Strain 4
Page 144
126
Fig. C.10a Ring Test for WW-SF-SRA, 6 in. Ring A, from day 1
Fig. C.10b Ring Test for WW-SF-SRA, 6 in. Ring B, from day 1
Fig. C.10c Ring Test for WW-SF-SRA, 3 in. Ring, from day 1
-100
-50
0
50
100
0 20 40
Shri
nkag
e (m
icro
stra
in)
Time (days)
Strain 1
Strain 2
Strain 3
Strain 4
-80
-60
-40
-20
0
20
40
0 20 40
Shri
nkag
e (m
icro
stra
in)
Time (days)
Strain 1
Strain 2
Strain 3
Strain 4
-60
-40
-20
0
20
40
60
80
100
0 20 40
Shri
nkag
e (m
icro
stra
in)
Time (days)
Strain 1
Strain 2
Strain 3
Strain 4
Page 145
127
Fig. C.11a Ring Test for WW, 6 in. Ring A, from day 1
Fig. C.11b Ring Test for WW, 6 in. Ring B, from day 1
Fig. C.11c Ring Test for WW, 3 in. Ring, from day 1
-1000
-800
-600
-400
-200
0
200
0 1 2 3
Shri
nkag
e (m
icro
stra
in)
Time (days)
Strain 1
Strain 2
Strain 3
Strain 4
-40
-30
-20
-10
0
10
20
0 1 2 3
Shri
nkag
e (m
icro
stra
in)
Time (days)
Strain 1
Strain 2
Strain 3
Strain 4
-50
-40
-30
-20
-10
0
10
0 1 2 3
Shri
nkag
e (m
icro
stra
in)
Time (days)
Strain 1
Strain 2
Strain 3
Strain 4
Page 146
128
Fig. C.11d Ring Test for WW, 6 in. Ring A, from day 4
Fig. C.11e Ring Test for WW, 6 in. Ring B, from day 4
Fig. C.11f Ring Test for WW, 3 in. Ring, from day 4
-40
-20
0
20
40
60
80
0 5 10 15 20
Shri
nkag
e (m
icro
stra
in)
Time (days)
Strain 1
Strain 2
Strain 3
Strain 4
-150
-100
-50
0
50
100
150
0 5 10 15 20
Shri
nkag
e (m
icro
stra
in)
Time (days)
Strain 1
Strain 2
Strain 3
Strain 4
-40
-20
0
20
40
60
80
100
0 5 10 15 20Shri
nkag
e (m
icro
stra
in)
Time (days)
Strain 1
Strain 2
Strain 3
Strain 4
Page 147
129
Fig. C.12a Ring Test for WW-SF-SRA, 6 in. Ring A, from day 1
Fig. C.12b Ring Test for WW-SF-SRA, 6 in. Ring B, from day 1
Fig. C.12c Ring Test for WW-SF-SRA, 3 in. Ring, from day 1
-100
-50
0
50
100
0 10 20 30 40Sh
rink
age
(mic
rost
rain
)
Time (days)
Strain 1
Strain 2
Strain 3
Strain 4
-40
-20
0
20
40
60
80
0 10 20 30 40
Shri
nkag
e (m
icro
stra
in)
Time (days)
Strain 1
Strain 2
Strain 3
Strain 4
-100
-80
-60
-40
-20
0
20
40
0 10 20 30 40
Shri
nkag
e (m
icro
stra
in)
Time (days)
Strain 1
Strain 2
Strain 3
Strain 4
Page 148
130
Fig. C.13a Ring Test for WW-FA-SRA, 6 in. Ring A, from day 1
Fig. C.13b Ring Test for WW-FA-SRA, 6 in. Ring B, from day 1
Fig. C.13c Ring Test for WW-FA-SRA, 3 in. Ring, from day 1
-1000
-500
0
500
1000
0 10 20 30 40
Shri
nkag
e (m
icro
stra
in)
Time (days)
Strain 1
Strain 2
Strain 3
Strain 4
-80
-60
-40
-20
0
20
40
60
0 10 20 30 40
Shri
nkag
e (m
icro
stra
in)
Time (days)
Strain 1
Strain 2
Strain 3
Strain 4
-100
-80
-60
-40
-20
0
20
0 10 20 30 40
Shri
nkag
e (m
icro
stra
in)
Time (days)
Strain 1
Strain 2
Strain 3
Strain 4
Page 149
131
Fig. C.14a Ring Test for WW-FA-SL-SRA, 6 in. Ring A, from day 1
Fig. C.14b Ring Test for WW-FA-SL-SRA, 6 in. Ring B, from day 1
-100
-80
-60
-40
-20
0
20
40
0 10 20 30 40Sh
rink
age
(mic
rost
rain
)
Time (days)
Strain 1 [21] Strain
Strain 2 [22] Strain
Strain 3 [23] Strain
Strain 4 [24] Strain
-800
-600
-400
-200
0
200
400
0 10 20 30 40
Shri
nkag
e (m
icro
stra
in)
Time (days)
Strain 1 [25] Strain
Strain 2 [26] Strain
Strain 3 [27] Strain
Strain 4 [28] Strain
Page 150
132
Fig. C.15a Ring Test for WW-FA, 6 in. Ring A, from day 1
Fig. C.15b Ring Test for WW-FA, 6 in. Ring B, from day 1
Fig. C.15c Ring Test for WW-FA, 3 in. Ring, from day 1
-50
-40
-30
-20
-10
0
10
20
0 1 2 3
Shri
nkag
e (m
icro
stra
in)
Time (days)
Strain 1
Strain 2
Strain 3
Strain 4
-70
-60
-50
-40
-30
-20
-10
0
10
0 1 2 3
Shri
nkag
e (m
icro
stra
in)
Time (days)
Strain 1
Strain 2
Strain 3
Strain 4
-100
0
100
200
300
400
500
0 1 2 3Shri
nkag
e (m
icro
stra
in)
Time (days)
Strain 1
Strain 2
Strain 3
Strain 4
Page 151
133
Fig. C.15a Ring Test for WW-FA, 6 in. Ring A, from day 4
Fig. C.15b Ring Test for WW-FA, 6 in. Ring B, from day 4
Fig. C.15c Ring Test for WW-FA, 3 in. Ring, from day 4
-40
-20
0
20
40
60
0 2 4 6 8Sh
rink
age
(mic
rost
rain
)
Time (days)
Strain 1
Strain 2
Strain 3
Strain 4
-60
-40
-20
0
20
0 2 4 6 8
Shri
nkag
e (m
icro
stra
in)
Time (days)
Strain 1
Strain 2
Strain 3
Strain 4
-40
-20
0
20
40
60
0 2 4 6 8
Shri
nkag
e (m
icro
stra
in)
Time (days)
Strain 1
Strain 2
Strain 3
Strain 4
Page 152
134
Fig. C.16a Ring Test for WW-FA-SF-SRA, 6 in. Ring A, from day 1
Fig. C.16b Ring Test for WW-FA-SF-SRA, 6 in. Ring B, from day 1
Fig. C.16c Ring Test for WW-FA-SF-SRA, 3 in. Ring, from day 1
-150
-100
-50
0
50
100
0 10 20 30 40
Shri
nkag
e (m
icro
stra
in)
Time (days)
Strain 1
Strain 2
Strain 3
Strain 4
-100
-50
0
50
100
150
200
250
0 10 20 30 40Shri
nkag
e (m
icro
stra
in)
Time (days)
Strain 1
Strain 2
Strain 3
Strain 4
-100
-80
-60
-40
-20
0
20
40
0 10 20 30 40
Shri
nkag
e (m
icro
stra
in)
Time (days)
Strain 1
Strain 2
Strain 3
Strain 4
Page 153
135
Fig. C.17a Ring Test for LD-WSDOT, 6 in. Ring A, from day 1
Fig. C.17b Ring Test for LD-WSDOT, 6 in. Ring B, from day 1
Fig. C.17c Ring Test for LD-WSDOT, 3 in. Ring, from day 1
-80
-60
-40
-20
0
20
40
0 5 10 15
Shri
nkag
e (m
icro
stra
in)
Time (days)
Strain 1
Strain 2
Strain 3
Strain 4
-80
-60
-40
-20
0
20
0 5 10 15
Shri
nkag
e (m
icro
stra
in)
Time (days)
Strain 1
Strain 2
Strain 3
Strain 4
-150
-100
-50
0
50
100
150
200
0 5 10 15
Shri
nkag
e (m
icro
stra
in)
Time (days)
Strain 1
Strain 2
Strain 3
Strain 4
Page 154
136
Fig. C.18a Ring Test for WSDOT, 6 in. Ring A, from day 1
Fig. C.18b Ring Test for WSDOT, 6 in. Ring B, from day 1
-100
-50
0
50
100
150
200
250
300
350
400
0 5 10 15
Shri
nkag
e (m
icro
stra
in)
Time (days)
Strain 1
Strain 2
Strain 3
Strain 4
-80
-60
-40
-20
0
20
40
0 5 10 15
Shri
nkag
e (m
icro
stra
in)
Time (days)
Strain 1
Strain 2
Strain 3
Strain 4
Page 155
137
Fig. C.19a Ring Test for EW 2, 6 in. Ring A, from day 1
Fig. C.19b Ring Test for EW 2, 6 in. Ring B, from day 1
-100
-80
-60
-40
-20
0
20
40
0 10 20 30 40Sh
rink
age
(mic
rost
rain
)
Time (days)
Strain 1
Strain 2
Strain 3
Strain 4
-1500
-1000
-500
0
500
1000
0 10 20 30 40
Shri
nkag
e (m
icro
stra
in)
Time (days)
Strain 1
Strain 2
Strain 3
Strain 4
Page 156
138
Fig. C.20a Ring Test for EW 2.5, 6 in. Ring A, from day 1
Fig. C.20b Ring Test for EW 2.5, 6 in. Ring B, from day 1
-400
-300
-200
-100
0
100
200
300
400
500
0 10 20 30 40
Shri
nkag
e (m
icro
stra
in)
Time (days)
Strain 1
Strain 2
Strain 3
Strain 4
-100
-80
-60
-40
-20
0
20
40
60
0 10 20 30 40
Shri
nkag
e (m
icro
stra
in)
Time (days)
Strain 1
Strain 2
Strain 3
Strain 4
Page 157
139
Fig. C.21a Ring Test for WW 2, 6 in. Ring A, from day 1
Fig. C.21b Ring Test for WW 2, 6 in. Ring B, from day 1
-100
-80
-60
-40
-20
0
20
40
60
0 10 20 30 40
Shri
nkag
e (m
icro
stra
in)
Time (days)
Strain 1
Strain 2
Strain 3
Strain 4
-100
-80
-60
-40
-20
0
20
40
60
80
100
0 10 20 30 40
Shri
nkag
e (m
icro
stra
in)
Time (days)
Strain 1
Strain 2
Strain 4
Page 158
140
Fig. C.22a Ring Test for WW 2.5, 6 in. Ring A, from day 1
Fig. C.22b Ring Test for WW 2.5, 6 in. Ring B, from day 1
-100
-80
-60
-40
-20
0
20
40
0 10 20 30 40Sh
rink
age
(mic
rost
rain
)
Time (days)
Strain 1
Strain 2
Strain 3
Strain 4
-100
-80
-60
-40
-20
0
20
0 10 20 30 40
Shri
nkag
e (m
icro
stra
in)
Time (days)
Strain 1
Strain 2
Strain 3
Strain 4