Evaluation of Dilatometer Based Methods for Liquefaction Potential Assessment Using Loma Prieta Earthquake Data Coutinho, R.Q. 1 & Mitchell, J.K. 2 1 Associate Professor, Civil Engineering, Federal University of Pernambuco, Brazil. 2 Edward G. and John R. Cahill Professor, Civil Engineering, University of California, Berkeley. Abstract The Loma Prieta earthquake caused extensive soil liquefaction in unimproved artificial fill deposits along the eastern shoreline areas of San Francisco Bay. Significant damage was observed in sites from the Oakland International Airport to the Port of Richmond, which are at distances of between 65 to 85Km from the northern end of the fault rupture. All of these sites present deposits of cohesionless hydraulic fill with zones of low penetration resistance overlying deep and primarily cohesive soil deposits which amplified bedrock motions. Post-earthquake investigations using a variety of in situ testing were done to provide a basis for evaluation of the ability of each different technique to correctly predict liquefaction resistance. This report is concerned with the basic results and liquefaction potential assessment evaluation obtained in the sites investigated using the Dilatometer test. The comparison between the observed and predicted behavior suggests that DMT test methods have the potential to provide a good means of assessing soil liquefaction. A slight correction in the Reyna and Chameau (1991) correlation is proposed to really segregate liquefiable from no liquefiable soils at Loma Prieta data. 1. Introduction During the Loma Prieta Earthquake of October 17, 1989, which was of magnitude M s =7.1 (U.S.Geological Survey), extensive soil liquefaction and associated ground deformations were observed in unimproved field deposits along the eastern shoreline of San Francisco Bay. Post-earthquake investigations using a variety of in situ testing, including standard penetration test (SPT), seismic piezocone test (SCPTU), and dilatometer test (DMT), were done through a joint research between UC Berkeley and Schimizu Corporation - Japan, to provide a basis for evaluation of the ability of each different technique to correctly predict liquefaction resistance. As an extension of the project, it was also planned to obtain, compare, and analyse soil properties from the in situ testing performed in the project. 1 Internal Report of Research Project (unpublished).
Transcript
Evaluation of Dilatometer Based Methods for Liquefaction Potential Assessment Using Loma Prieta Earthquake Data
Coutinho, R.Q.1 & Mitchell, J.K.2
1 Associate Professor, Civil Engineering, Federal University of Pernambuco, Brazil.
2 Edward G. and John R. Cahill Professor, Civil Engineering, University of California, Berkeley.
Abstract
The Loma Prieta earthquake caused extensive soil liquefaction in unimproved artificial fill deposits along the eastern shoreline areas of San Francisco Bay. Significant damage was observed in sites from the Oakland International Airport to the Port of Richmond, which are at distances of between 65 to 85Km from the northern end of the fault rupture. All of these sites present deposits of cohesionless hydraulic fill with zones of low penetration resistance overlying deep and primarily cohesive soil deposits which amplified bedrock motions.
Post-earthquake investigations using a variety of in situ testing were done to provide a basis for evaluation of the ability of each different technique to correctly predict liquefaction resistance. This report is concerned with the basic results and liquefaction potential assessment evaluation obtained in the sites investigated using the Dilatometer test. The comparison between the observed and predicted behavior suggests that DMT test methods have the potential to provide a good means of assessing soil liquefaction. A slight correction in the Reyna and Chameau (1991) correlation is proposed to really segregate liquefiable from no liquefiable soils at Loma Prieta data.
1. Introduction
During the Loma Prieta Earthquake of October 17, 1989, which was of magnitude Ms=7.1 (U.S.Geological Survey), extensive soil liquefaction and associated ground deformations were observed in unimproved field deposits along the eastern shoreline of San Francisco Bay. Post-earthquake investigations using a variety of in situ testing, including standard penetration test (SPT), seismic piezocone test (SCPTU), and dilatometer test (DMT), were done through a joint research between UC Berkeley and Schimizu Corporation - Japan, to provide a basis for evaluation of the ability of each different technique to correctly predict liquefaction resistance. As an extension of the project, it was also planned to obtain, compare, and analyse soil properties from the in situ testing performed in the project.
1
Internal Report of Research Project (unpublished).
The sites that were investigated, from Oakland Airport to the Port of Richmond,
are at distances of between 65 to 85 km from the northern end of the fault rupture, and represent the farthest occurrences of damaging liquefactin during the Loma Prieta earthquake. All of these sites present deposits of cohesionless hydraulic fill with zones of low resistance values, and deep and primarily cohesive underlying soil deposits which amplified bedrock motions. These coupled factors were the principal cause of liquefaction at these sites (Seed et al., 1990). A summary overview of the principal geotechnical engineering aspects and damage patterns of the Loma Prieta earthquake is given in Seed et al. (1990) and Kayen et al. (1992).
Peak horizontal accelerations on rock and stiff shallow soil sites in the east
bayshore region generally ranged from about amax= 0.08 to 0.12g, but amplification due to the presence of soft and/or deep cohesive soil deposits underlying the east bayshore fills produced peak accelerations between about amax = 0.11 to 0.29g at strong motion recording stations sited on bayshore fills in this region.
This report has the object to provide a summary of the basic results and
liquefaction potential assessment evaluation obtained using the Dilatometer test. Liquefaction analyses were done using the methods of Marchetti (1982), Robertson and Campanella (1986), and Reyna and Chameau (1991).
2. Tests, sites and Number of Measurements
The post-earthquake investigation was done using the following techniques: 1. Seismic Piezocone: Cone Penetration Test (CPTU) including Downhole seismic Measurement (DHS);
2. Surface Wave Survey (SWS); 3. Standard Penetration Test (SPT) including Uphole Seismic Measurement (UHS) ;
4. Dilatometer; 5. Crosshole Seismic Measurement (CHS); 6. Soil Sampling and Laboratory Test (SLT).
The sites investigated along the eastern shoreline of San Francisco Bay, with the
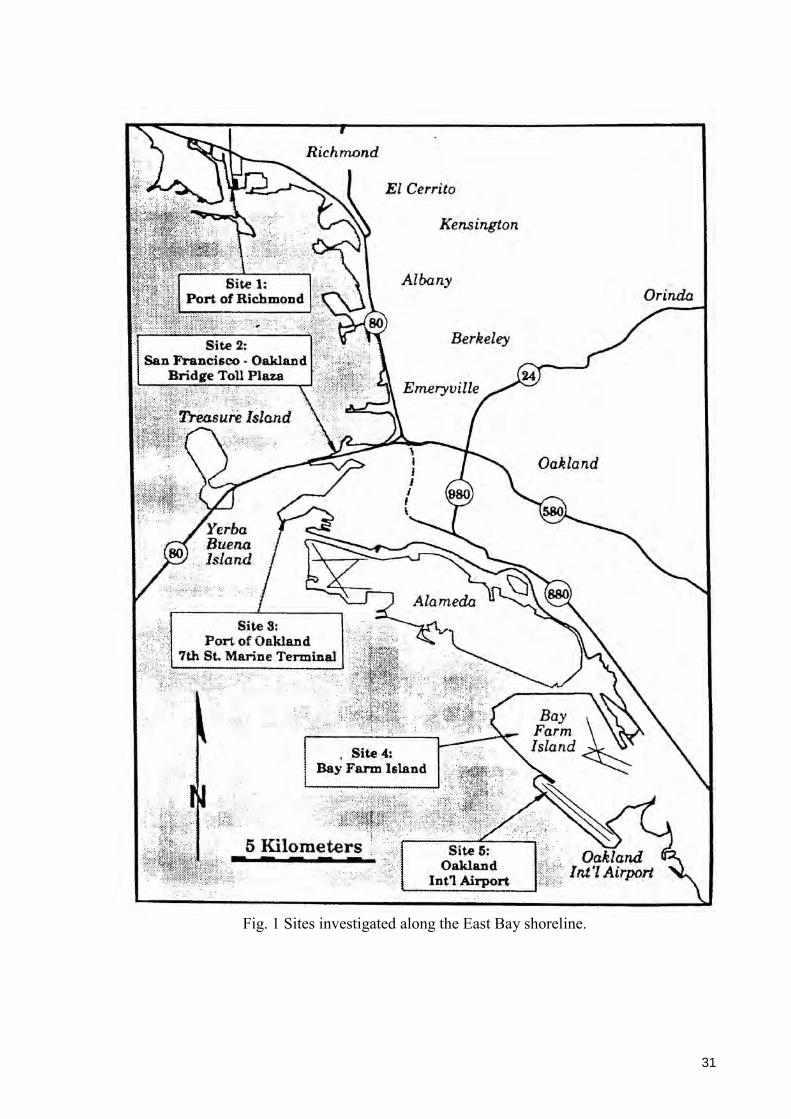
respective number of measurements (performed and planned), are presented in the Table 1 below (see also Fig. 1). Fig. 2 presents a summary of the, liquefaction and associated ground deformations observed in this region.
A summary of the results and the liquefaction potential analysis using the SPT,
CPT, and SCPT data are presented in Kayen et al. (1992). This report presents the results and liquefaction potential analysis using the DMT testing. The analysis concerning
2
Table 1 Number of measurements in each site
Note: * The soil samplings were obtained. The laboratory tests are in progress.
the behavior and soil parameters obtained from all the in situ tests performed will be presented later.
3. Description of Test sites
A brief description of the test sites where the dilatometer tests were performed is given in this report; more details can be seen in Kayen et al. (1992). Standard penetration tests and seismic cone penetration tests were also performed in close locations (2-3m apart) in all sites described in this report.
3.1 Port of Richmond
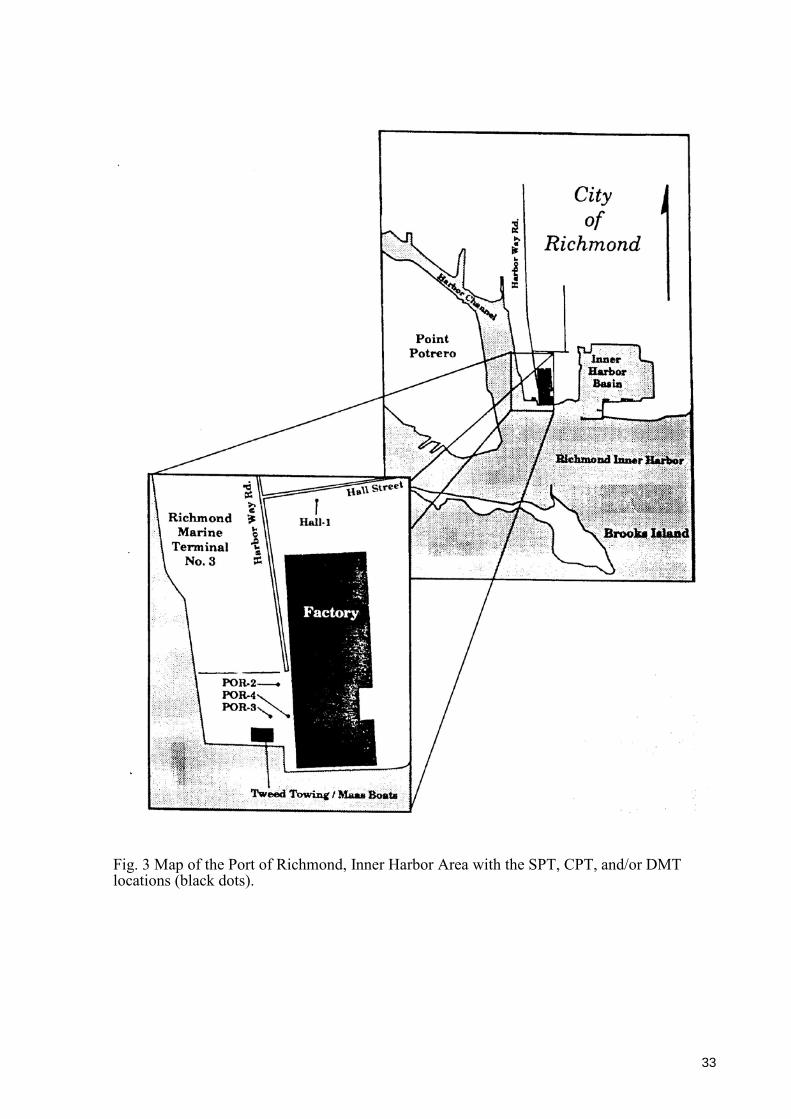
The site is located at the western portion of Richmond Inner Harbor as indicated in Fig. 1. The site is at approximate 85 kilometers north of the fault rupture and represents the most distant point from the zone of energy release to suffer soil liquefaction sufficient to damage structures during the Loma Prieta Earthquake. Fig. 3 shows the approximate locations of the in situ tests performed at this site in two areas close to Harbor Way Rd. The dilatometer soundings (DILPR1 and DILPR2) were performed close to the locations POR-2 and Hall-l. The first location (POR-2) is in the open space north of the Tweed Towing / Maas Boats Facility. The second one (Hall-l) is at the corner of Harbor Way Rd and Hall Street. In this last area no soil liquefaction was observed.
The soil condition at location POR-2 (see Fig. 4a) consists of about 2 m of an
oxidized tan-brown silty sand underlain by an tan-brown sandy clay to about 4 m. The water table was at a depth of approximately 2.5 meters during sampling. Below this layer is a reduced olive gray fine sandy silt hydraulic fill with shell fragments to 7.8m. This layer presents an extremely low cone penetration resistance of approximately qc = 1 to 3 MPa, low
3
friction ratios, and minor levels of pore pressure generation during cone penetration with the exception of one spike around 5m. SPT values vary between N= 2 to 11 blows-per-foot but are typically in the range of N= 2 to 5 blows-per-foot. This layer is considered to be responsible for the observed liquefaction on the surface, based also on correlations of SPT samples with samples of surface boil material recovered. Presence of fines was identified at depths around 5 meters. Below this loose layer is a thin deposit of soft Bay Mud to about 9.5m, and after that are dense sand deposits. Shear wave velocity (DHS) in the liquefied layer typically ranged between Vs = 140 to 170m/sec.
At the location Hall-1, the soil condition (see Fig. 4b) consists of 1.5m of a brown / brown-gray silty sand underlain by about 2 m of a very soft gray sandy clay -the sampler sank under its own weight. Below this layer, between the depths of 3.5m and 8.5m is a gray sandy silt hydraulic fill. Presence of fines was identified in some zones in this layer. SPT values in this layer vary between N= 2 to 14 blows-per-foot but are typically in the range of N= 5 to 11 blows-per-foot. Following this layer is a thin deposit of soft Bay Mud to 9.3m, below which are denser silty sand deposits. The water table was at a depth of approximately 2.5rn during profiling. In this site no soil liquefaction was observed. Seismic cone test was not performed in this location.
3.2 Port of Oakland
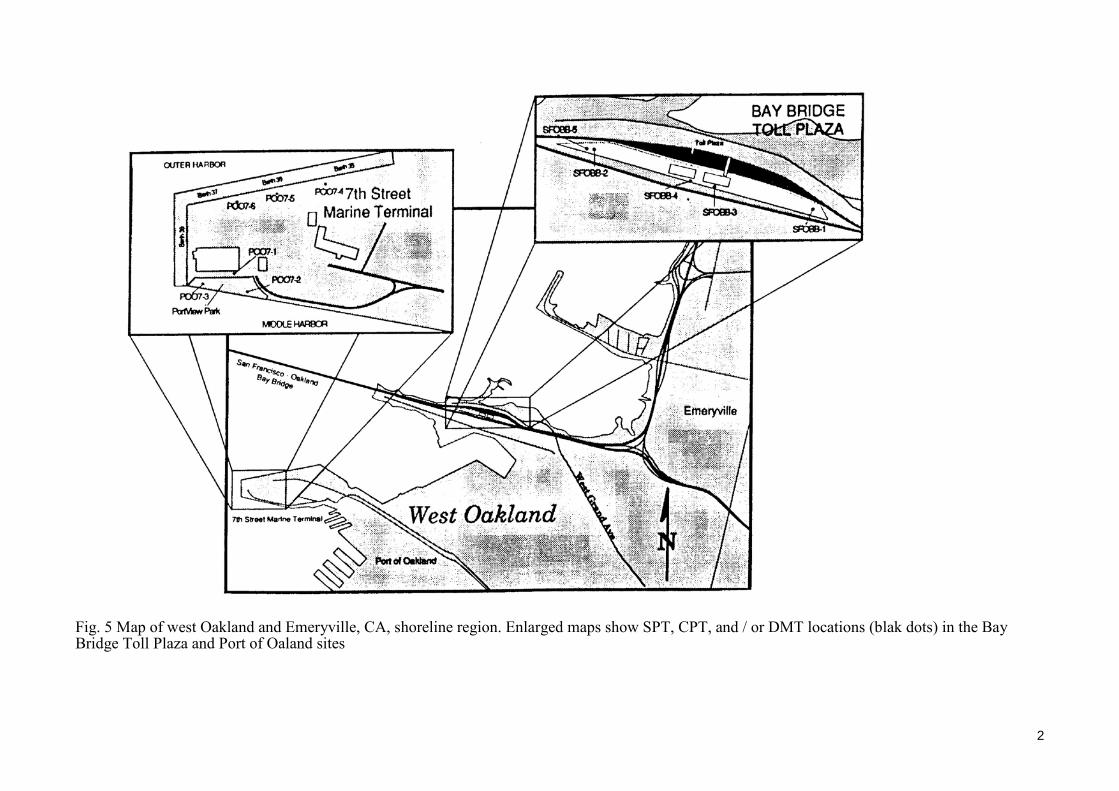
The test site in the Port of Oakland is located at the 7th Street Terminal (Fig. 1). This area was the one where the most severe damage to the Port facilities occurred. Fig. 5 shows the approximate locations of the in situ tests performed at this site. The dilatometer soundings DILPO1 and DILPO2 were performed close to the location POO7-2 and POO7-3, respectively.
The soil condition (see Figs. 4c and 4d) at the area where the tests were performed,
consists of 3 to 4 meters of sand fill with a high penetration resistance, specially in the location POO7-2, with typical cone resistance values between qc=25 and 35 MPa, and SPT values between N=25 and 35 blows-per-foot. The water table is located at approximately 3 meters in this layer. Below 4m, the fill consists of looser deposits of marine sands with cone resistance values between qc-=8 to 15 MPa, and SPT values that typically range between N=10 to 25 blows-per-foot. These lower sands exhibited low friction ratios and essentially no excess pore pressure generated during penetration. Liquefaction appears to have occured in the materials in the 4 to 8 meters depth range, based on correlations of SPT samples with samples of surface boil material recovered. Shear wave velocities (DHS) in the liquefied layer typically ranged from VS=150 to 170m/sec. At the location POO7-2, a deposit of soft Bay Mud occurs below the depth of 10.8m.
4
3.3 Bay Farm Island
The site is located immediately north of the Oakland International Airport (Fig. 1)
and suffered considerable liquefaction damage in some areas. Fig. 6 shows the approximate locations of the in situ tests performed at two tests sites in this area. The dilatometer soundings DILBFl1 was performed close to the location BFI-P6 and the dilatometer soundings DILBFI2 and DILBFI3 were performed close to the location BFICPT-1.
At the Harbor Bay Island Business Park, testing was performed in a parking area
on South Loop Road (location BFI-P6) .The upper part of a typical soil profile (see Fig. 7a) at this site consists of about 4 m of silty sand hydraulic fill with low penetration resistance. SPT values in this layer are in the range of N=11 to 19 blows-per-foot, and cone resistance values vary between qc=5 to 8 MPa. The average corresponding shear wave velocity (DHS) for this layer was 139m/sec. Below this layer, there is a deposit of about 5 m of soft Bay Mud, which is followed by a denser deposit of silty sand. The water table was recorded at 2 meters during sampling. Liquefaction in this site appears to have occurred in the upper sand layer in the range of 2 to 4 meters deep.
In the area on the south side of Bay Farm Slough, northwest of the intersection of
the Aughinbaugh Lane and Mecartney Rd. (location BFICPT-1), a typical profile consists of about 3 m of silty sand hydraulic fill underlain by about 3 m of soft Bay Mud deposit interbedded with a thin silty sand layer around the depth of 4m (see Fig. 7b). Below the Bay Mud is a deposit of silty sand that initially presents relatively low penetration resistance. The water table was recorded at approximately 2 meters during the test period. In the silty sand hydraulic fill cone penetration resistance values typically range from qc=2 to 16MPa, and SPT values are between N=8 and 18 blows-per-foot. Liquefaction appears to have occurred in this layer at 2 to 3 meters depth, where a lower penetration resistance range occurs.
3.4 San Francisco -Oakland Bay Bridge Mole
The site is located immediately south of Emeryville and is the peninsula approach fill to the San Francisco - Oakland Bay Bridge (Fig. 1). Extensively damage by soil liquefaction occurred in this area. Fig. 4 shows the approximate location of the in situ tests performed at the test site area in the Toll Plaza parking lot. The dilatometer sounding DILSOBB-1 was performed at the location SFOBB- 1.
The soil condition at that location (see Fig. 7c), consists of a moderate surface
crust of sand material between O and 2.8m (qc around 20MPa), followed by an apparently interbedded sequence of
5
silty sands and gravelly-silty sand deposits to 4.5 meters, presenting variations in local friction and penetration resistance (qc values typically between 2 to 17 MPa) .Below this layer, in the range of 4.5 and 7.5 meters, is a zone of silty and sandy soil of low penetration resistance, typically with cone resistance values of qc=5 to 7 MPa, and SPT values of N= 5 to 17 blows-per-foot. Shear wave velocities (DHS) in this layer were typically within the range of Vs=130 to 170m/sec. Below this loose zone, the cohesionless deposit presents higher penetration resistance to a depth of at least 14 meters. The zone of loose cohesionless material, at a depth of approximately 4.5 to 7.5 meters, is the layer where liquefaction appears to have occurred based on both the penetration resistance and correlation with surface boil material.
4. Dilatometer
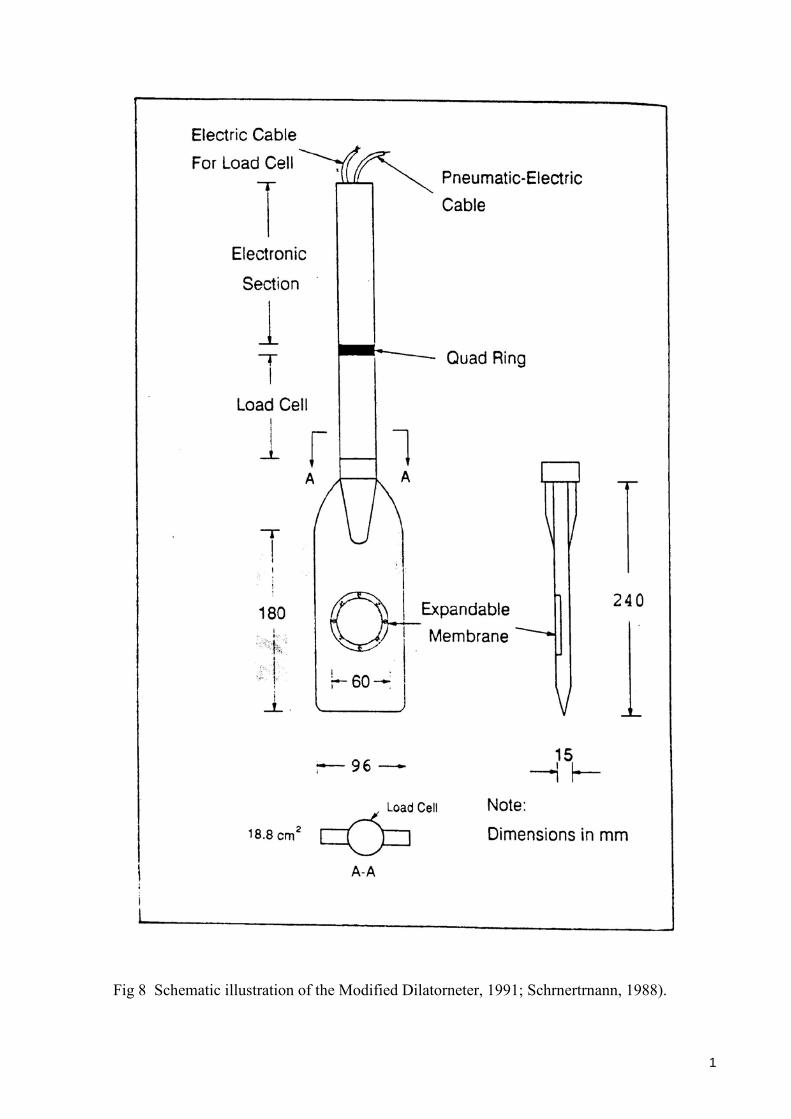
The dilatometer test (DMT) was developed by Marchetti for the estimation of in situ parameters and introduced into North America in 1980 (Marchetti, 1980). The initial standard dilatometer is a stainless steel flat blade 14mm thick, 95mm wide, and 220mm long. A flexible stainless steel membrane, 60mm in diameter, is located on one face of the blade. A more recent device (Schmertmann, 1988) has changes in the steel used for the blade and membrane and is slightly different in the dimensions: 15mm thick, 96mm wide, and 240mm long (see Fig. 8). These changes were done to improve the durability and resistance of the equipment. A detailed description of the equipment and test procedure is given in Schmertmann (1986a, 1988).
Campanella and Robertson (1991) (see also Kulhawy and Mayne, 1990) consider
that the main advantages of the DMT are (i) simplicity of operation and maintenance; (ii) repeatable test results that are operator independent; and (iii) near continuous data. The main limitations of the test are (i) blade and membrane are susceptible to damage, especially when penetrating dense sands or gravel soils; (ii) large pushing force required to penetrate dense soils; (iii) no pore pressure measurements; and (iv) limited evaluated experience relative to more well-established in situ tests, such as the cone penetration test (CPT).
The test is performed by pushing the blade to the desired test depth at a typical rate
of penetration of 20 mm/sec. Test depths may be taken as frequently as 200 mm. The dilatometer blade can be pushed with a CPT hydraulic jacking rig, the hydraulics of a rotary drilling rig, or a hammer and rod system as used in the SPT. The verticality of the dilatometer during penetration should be checked.
Once the dilatometer has been pushed to the required test depth, the vertical thrust
is removed, and the membrane is expanded using a pressure source at the ground surface. The membrane is
6
usually inflated using high-pressure nitrogen gas supplied by a tube prethreaded through the pushrods. Standard practice requires two pressure readings; the "A" reading corresponds to the pressure required to lift the membrane off the plate and the "B" reading corresponds to the pressure required to push the membrane 1.lmm into the soil. Some investigators recommend also to record the pressure at which the membrane recontacts the blade (closing pressure), denoted "C" readings. After deflating the membrane, the blade is advanced to the next test depth. In the recent years it has become common to measure the vertical thrust required to advance the dilatometer. The test is usually performed at each 200mm depth interval.
The whole expansion test, including the time between halting penetration and starting the test, should be completed within one to two-minute period, with 15 to 30 seconds being the time interval for taking the A, B, and C readings.
The readings A, B, and C are corrected for the membrane stiffness to determine the
pressures Po, Pl' P2. The following expressions are used. P0 = 1.05 (A - ZM + ΔA) - 0.05 (B - ZM - ΔB) Pl = B - ZM - ΔB P2 = C + ΔA
where ΔA = the gage gas pressure inside the membrane, in free air, required to move it
outward to a center- expansion of 0.05mm (a negative gage pressure, but recorded as positive).
ΔB = the gage gas pressure inside the membrane, in free air, required to move it outward to a center-expansion of 1.1mm.
ZM = gage reading when pressure is ventilated. Calibrations of membrane stiffness in the field should be done in air before and
after test. When in use of a new membrane, it is recommended to exercise it in air sufficiently to ensure constant membrane resistance throughout profiling. As many as 100 expansion cycles can be required (Lacasse and Lunne, 1988).
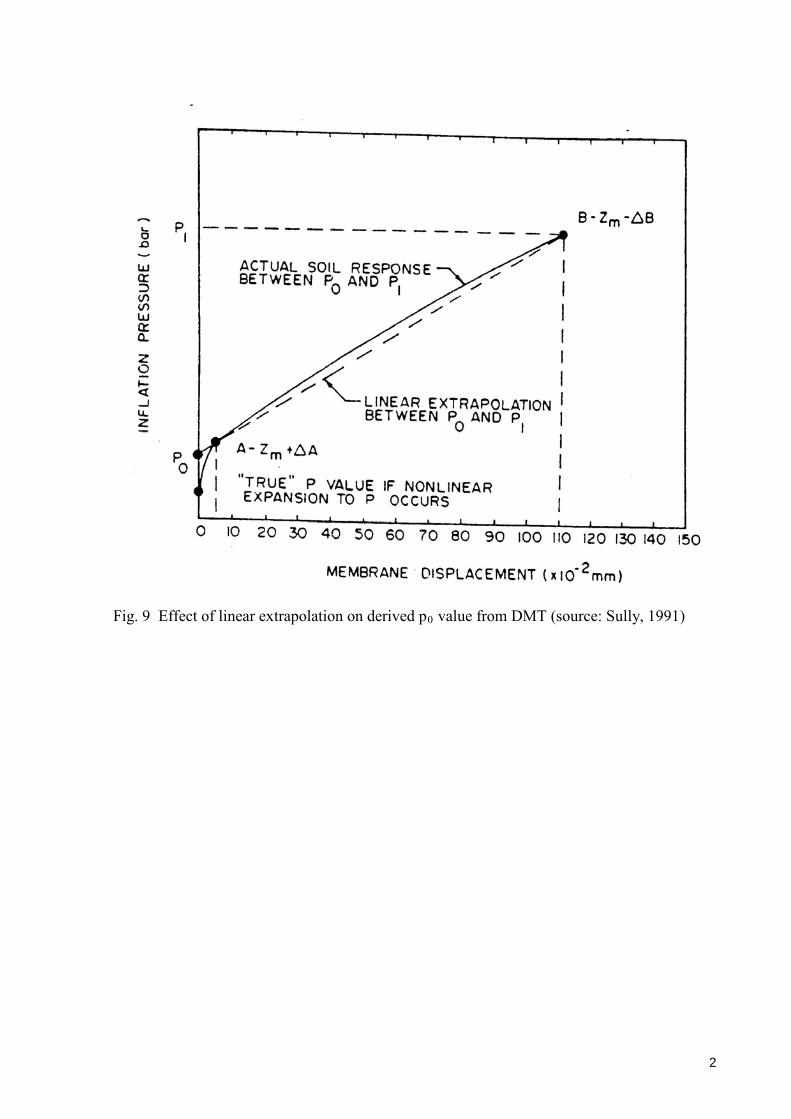
The pressure P0 represents the soil pressure against the membrane immediately
before its expansion into the soil (0.00mm expansion) .The Po value is determined by a linear extrapolation from P0 (0.05 mm displacement) back to zero displacement using the average gradient between P0 and Pl (Schmertmann, 1988). The use of the linear extrapolation shown in Fig. 9 affects the P0 estimate where the expansion curve is in reality nonlinear. Even though the
7
curve between Po and Pl may closely approximate a linear response, it is probably not the case for the initial pressure increase from 0 to 0.05mm displacement. However, since the interpretation of sail parameters from DMT data is based on empirical correlations, the effect may not be important. The deviation of the actual curve from the assumed linear form will be a function of sail characteristics and stress history. Sully (1991) presents some results and discussion of measured P0 (0.00mm displacement) and that obtained by standard procedure (extrapolation).
In sands, the pressure P2 has been shown to approximate to the in situ equilibrium pore pressure. In soft clays it reflects the excess pore pressure induced due to penetration (Robertson et al. 1988; Lutenegger, 1988).
Recently more elaborate procedure has been proposed to measure pressure with
time, p (t), and obtain a dissipation curve from a standard DMT, similar to the dissipation of excess pare pressures during a stop in penetration in a soft clay with the CPTU testing. Several methods have been suggested to estimate the coefficient of consolidation (ch) from these DMT results (Robertson and Campanella, 1988; Schmertmann, 1988; Marchetti and Totani, 1989; Campanella and Robertson, 1991).
The pressures P0, and P1, are used to determine the following three index
parameters (Marchetti, 1980): Material Index, ID = f (A,B,u0) = (Pl -P0) / (P0 -u0) Horizontal Stress Index, KD = f (A, u0 , σ' v) = (P0 - u0) / σ' v Dilatometer Modulus, ED = f (A,B) = 34.7 (P1 - P0)
Where
u0 = in situ initial pare pressure, usually considered hydrostatic condition. σ'v = in situ effective overburden pressure. An additional index using the pressure P2 has been proposed by Lutenegger and
Kabir (1988), referred to as the dilatometer pare pressure parameter, defined as: Pore Pressure Index, UD = (p2- u0) / (P0 -u0) Schmertmann (1988) has proposed another definition to the pare pressure index,
i.e., UD = (P2 - u0) / (σ'v, - u0). With the object to obtain a more fundamental understanding of the dilatometer test
and to increase its potential, recent improvements to the technique have been developed, including (Sully, 1991; Campanella and Robertson, 1991):
8
- The development of a piezodable for measuring in situ pore pressures. The
piezodable (Davidson and Boghrat, 1983) has exactly the same dimensions as the DMT, but instead of an expandable membrane, it contains a flush-mounted porous stone and pressure transducer.
- The development of research DMT equipment at the University of British
Columbia - UBC and ISMES in Italy. The device developed at UBC is identical in size, shape, and operation to the Marchetti blade but enables also measurement of: (i) pore water pressure at the centre of moving membrane; (ii) deflection at centre of membrane; (iii) gas pressure at the blade to activate membrane expansion; (iv) verticality of dilatometer blade during penetration; and (v) penetration force immediately above the blade, using a load cell.
- The development at the Norwegian Geotechnical Institute of an offshore DMT
where the pore pressures are measured on the rear side of the blade directly behind the membrane. The dimensions of the blade are slightly less than those of the standard (Marchetti) blade although it is slightly thicker in order to accommodate the pore pressure transducer (Lunne et al., 1987).
Testings using research DMT, piezodable, and CPTU, have been performed in
different types of soils to investigate the effects of induced pore pressures in DMT data (Lutenegger and Kabir, 1988; Lutenegger, 1988; Robertson et al., 1988; and Campanella and Robertson, 1991) .The results show that: (i) the DMT and SBPMT pressure expansion curves are very similar; (ii) tests in sand (at McDonald Farm) are drained with no excess pore pressures generated during installation of the blade or expansion of the membrane. The closure pressure, p2 after deflation is approximately equal to equilibrium pore pressure, u0; (iii) in clays DMT penetration pore pressures are very similar to penetration pore pressures measured behind the friction sleeve in the CPTU; (iv) tests in soft clay indicate high pore pressures exist immediately after penetration. Effective stresses are small and remain essentially constant throughout the test. The p2 closing pressure is similar to the DMT penetration pore pressure and to the CPTU penetration pore pressure measured behind the friction sleeve; (v) in stiff compacted clays, the induced excess pore pressure may be small or negative and the effective stress on the membrane may be large. The closure pressure (p2) appears to be unrelated to the equilibrium pore pressure or penetration pore pressure
The vertical force (Q) to penetrate the dilatometer blade is approximately twice the
force required by a standard 10cm2 cone penetrometer. In fact, this is not suprising because the total exposed end area of a flat dilatometer blade penetrating with 10 cm pushrods (see Fig. 8) is about 18.8 cm2. This can severely limit the penetration capacity for the dilatometer when using light penetration equipment (Campanella and Robertson, 1991).The
9
penetration resistance (qD) represents a summation of the forces on the base of the blade and on the exposed area of the pushrods at the neck of the blade plus the friction developed along the two faces of the blade. For this definition qD can be determined using the expression: qD= vertical force (Q) / total exposed end area (about 18.8 cm2) .Good comparisons between qD and qc in sands have been presented in the literature (Campanella and Robertson, 1991; Schmertmann, 1991). The results suggest that: qD = 1.1 qc ± 10%. Schmertmann (1991) considers that this relationship may be used tentatively in all soils. This near-equivalency between qD and qc, observed at least in sands, if true, can increase significantly the use of DMT data, opening up the use of various engineering performance correlations that use qc (Schmertmann, 1991).
The dilatometer was developed by Marchetti for the estimation of soil parameters. A set of empirical correlations between the index parameters and various soil parameters was proposed in Marchetti (1980). These initial correlations were based on laboratory data from 10 well-documented sites in Italy. Recently, many studies have been performed to evaluate and improve some of the original correlations (Jamiolkowski et al. 1985, 1988; Baldi et al., 1986, 1989; Schmertmann 1982, 1983, 1986b; Marchetti, 1985; Lacasse and Lunne, 1988i Lutenegger, 1988; Bellotti et al., 1989; Lunne et al., 1989; Masood, 1990; Kulhawy and Mayne, 1990; Campanella and Robertson 1991; Sully 1991).
Lunne et al. (1989), Kulhawy and Mayne (1990) and Kulhawy (1992) present
qualitative and quantitative informations about the overall applicability of most common in situ penetration tests, including the dilatometer, to estimate soil parameters. Kulhawy and Mayne (1990i page D-4) consider that the reliability of the Dilatometer is difficulty to determine precisely at the present time because of a shortage of detailed test data. However, the limited data to date are encouraging and suggested good reproducibility and relatively high reliability. Lunne et al. (1989) concluded that "The dilatometer test has gained much popularity in the last four years, mainly because of ease of operation and because of the many user-friendly correlations that already exist or that can be developed easily. The dilatometer, like cone/piezocone penetration, provides a number of soil parameters, but probably with less accuracy. The authors believe that the dilatometer can provide important information, but that it should always be supplemented with cone/piezocone testing and sampling, because the existing correlations are fairly new and, even if promising, need further validation. The dilatometer has the advantage over the cone/piezocone of providing an estimate of K0, but it cannot replace cone/piezocone nor sampling".
Whittle et al. (1991) use theoretical analyses to investigate the fundamental
mechanisms controlling, in cohesive soils, the performance of common in-situ penetration tests, including dilatometer. The topics studied include: the development of
10
analytical methods to predict pore pressures around three- dimensional penetrometers; fundamental analytical studies of the mechanics of flat plate penetration; evaluation of contact pressures measured by the dilatometer; and the estimate of engineering properties of clays (OCR; Su) .In the Summary, Whittle et al. concluded that "the analyses show that the stresses acting on the dilatometer membrane are not uniform due to the proximity of the membrane to the tip of the penetrometer. A systematic study of the predicted contact pressure has found that there are no simple linear correlations between the P0 and the undrained shear strength or preconsolidation pressure of the soil. Furthermore, the predictions show that even when pore pressures are measured on the dilatometer membrane (as proposed by a number of authors) there is no simple interpretation of engineering properties from contact conditions. Thus, the analyses imply serious limitations of the dilatometer for estimating engineering properties of clays". Some examples are also shown which it is considered that the dilatometer contact pressures exhibit significant scatter and that site specific correlations for estimating the preconsolidation pressure vary significantly for different types of clay.
5. Equipment and Testing Procedure . Equipment
The dilatometer used in the testing program belongs to the UC Berkeley, and it is the
last version of the device, described earlier, by Schmertmann (1988) (Fig. 8). A load cell, designed and assembled in UC Berkeley, is located immediately behind the dilatometer bladel to measure the vertical force during the penetration. The design load of the load cell is 10 tons. Details of the dilatometer device and the load cell is given in Masood (1991).
In this project, the load cell was recalibrated by axially loading in a standard
laboratory compression machine. The results obtained in the calibration, and used in the calculation of the tests, are presented in Fig. 10. The calibration factors were slightly different from the initial value obtained by Massod (1991).
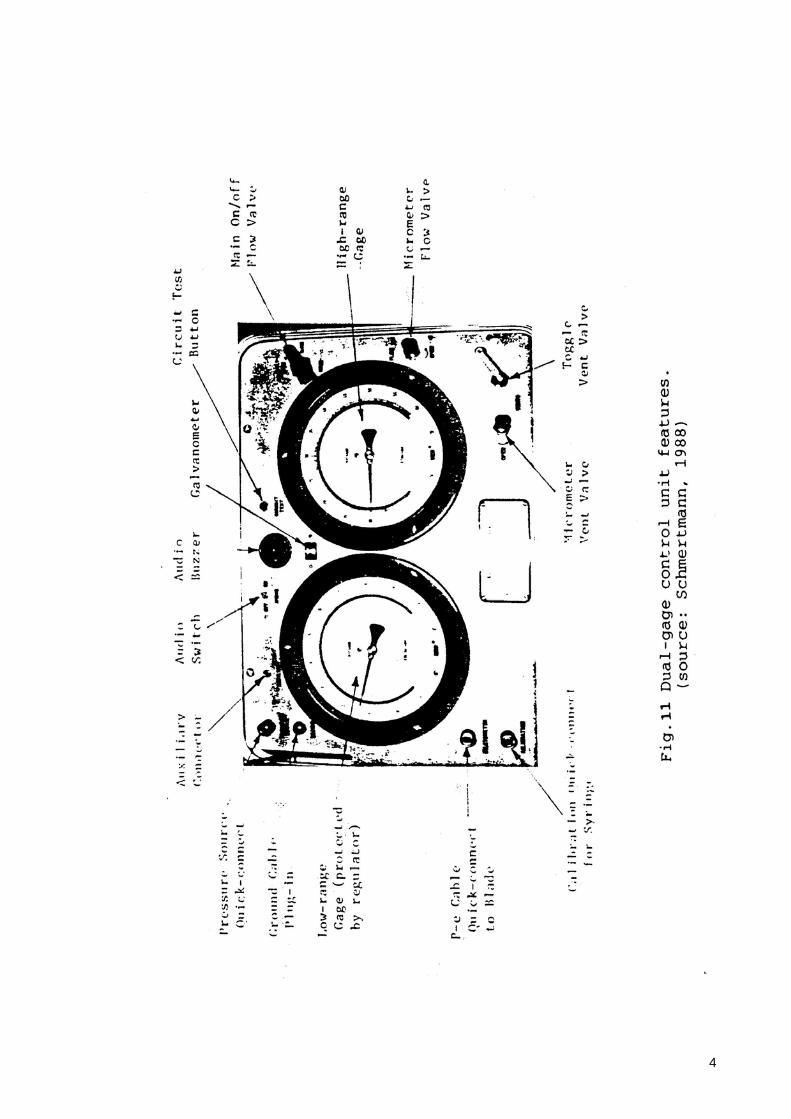
During a dilatometer test the three pressure readings, A, B, and C, are recorded
manually by using a control unit which is connected to the blade through electring -pneumatic tubing. The control unit consists of control valves, two pressure gauges, an electric beeper, and connections for the pressure source and the blade. The valves are used for controlled inflation of the membrane. The beeper indicates the position of the membrane corresponding to the readings A, B, and C. The control unit is shown in Fig. 11.
The data reading system used for the dilatometer load cell is
11
designed to supply power and receive data. The components of the system used in the tests are:
- An electronic board containing an amplifier located inside the electronic section of the load cell.
- A junction box containing power conditioning and signal conditioning circuits. - One 2-channel strip chart recorder. - A Hewlett-Packard 3465 digital multimeter (Ammeter, Ohmmeter and voltmeter).
The readings for each test depth are recorded manually. The maximum thrust required during the last 10mm of penetration are recorded to be
used in the calculations. The results measured through the strip chart recorder and the voltmeter were always very close.
. Test Procedure
The testing procedure used in this project was in accordance with that suggested by Schmertmann (1986a; 1988) (see also Masood, 1991), including also the recommendations described in the item 3.
The dilatometer was pushed into the ground at an approximate rate of 20 mm/s, using
a quasi static vertical thrust with the hydraulic of a rotary drilling rig or with a CPT hydraulic jacking rig. The penetration was stopped at each 200 mm depth interval to perform the test. The capacity of the rigs was between 5 to 8 tons.
Calibrations of membrane stiffness were done in the laboratory and in the field
(before and after test). New membranes were exercised (expansion cycles) in air sufficiently to obtain values within the expected ranges and ensure an approximate constant membrane resistance throughout profiling. Stronger membranes were used to avoid punch ring problems in coarse and dense sand materials. The “zero" reading of the load cell was also taken in the field before and after the test.
The delay between stop of penetration and start of membrane expansion was kept to
a minimum for all soils. It was attempted to complete the expansion test within one-minute period. The three pressures readings, A, B, and C, were recorded at each test depth. Pressure gauges with different sensitivities were used in function of the values measured. Attention was given to have verticality of the dilatometer during penetration.
The soundings were completed when the expected maximum depth was reached or
due to penetration refusal (indicative of a very hard material) .The dilatometer test data were reduced and interpreted
12
with a computer program using the methods recommended by Marchetti (1980), Schmertmann (1982, 1983) and others.
In general, the tests were performed satisfactorily and the data suggest good reproducibility and relatively high reliability. However, in one sounding (DILPO1), gas leakage was suspected to occur during profiling. Sometimes in this test, it was difficult to take the “B" reading. At the end of the test, it was found out that leakage could occur through the contact between the membrane and the blade when high pressure was applied. This condition was repaired layer at the laboratory. In the analysis of this test, some "B" readings were estimated using the relation pl, p0 vs qD observed (see Campanella and Robertson, 1991) .In other sounding (DILBFI1) , water went inside of the electronic section of the load cell when the blade penetrated in the soft clay layer, causing bad function of the load cell after this depth. This problem was repaired later at the laboratory.
6. Basic Results
The basic results obtained with the UC Berkeley DMT are: the pressures p0, p1 and p2; the vertical force (thrust) necessary to the penetration of the blade; the dilatometer penetration resistance, qD; and the four index parameters, ID, KD, ED, UD. It is also presented, for each test performed, the corresponding profile of the in situ effective overburden pressure (σ'vo) and the profile of the equilibrium water pressure (u0), considered hydrostatic.
The difference between P0 and Pl pressures is related to the soil type and the stiffness
of the soil. In sands, the difference between P0 and Pl pressure values is usually relatively large. In soft clays, the pressure values are closed to each other, giving a relatively small value to the material index, ID.
A dilatometer penetration resistance, qD, in this project, was calculated using the
penetration force, measured by the load cell located immediately above the flat blade, and an exposed end area of 18. 8 cm: (qD = Q/ 18. 8cm2) .This penetration resistance represents a summation of the forces on the base of the blade and on the exposed area of the pushrods at the neck of the blade plus the friction developed along the two faces of the blade.
In clean sands, the pressure P2 has been shown to approximate the in situ equilibrium
pore pressure. In soft clays it reflects the excess pore pressure induced due to penetration (Robertson et al. 1988; Lutenegger, 1988).
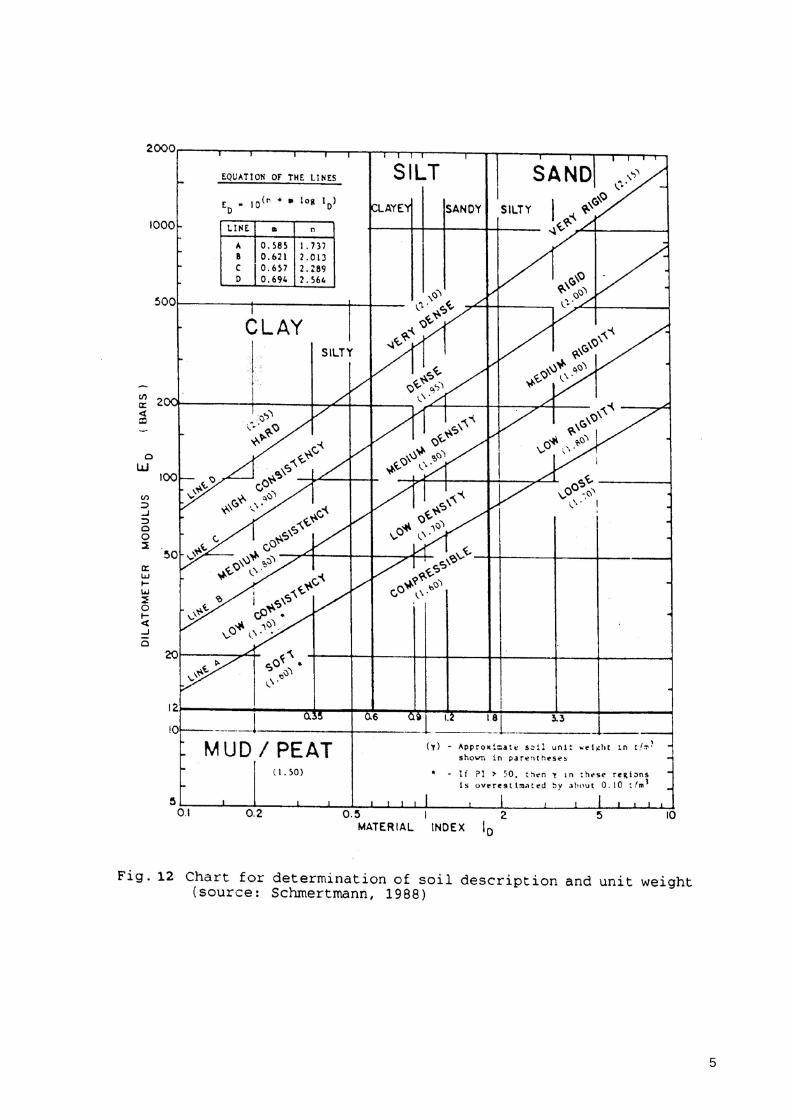
The material index, ID, is used to determine the soil type. The variations observed
within one profiling and from one test to another are indicative of the soil no homogeneity and the spatial variability within the deposit. Originally, soil type was defined
13
as a function of material index only, with ID < 0.6 - clay; 0.6 < ID < 1.8 - silt; and ID > 1.8 - sand. Later experience recommended to combine the knowledge from the material index and the dilatometer modulus, ED (see Fig. 12). In this project, in general the soil classification using DMT data are basically in agreement with the classification from the SPT samples and laboratory tests performed.
The horizontal stress index, KD is related to the in situ coefficient of earth pressure at rest, K0. The index is also used to obtain other soil parameters, such as, overconsolidation ratio, OCR, undrained strength, Su, and effective friction angle, 41, in sands. The horizontal stress index is also the parameter, from the DMT, that is used in the previously proposed methods to liquefaction potential assessment.
The dilatometer modulus, ED, characterizes the stress- displacement curve during the
1.1-mm expansion and is related to the stiffness of the soil. Correlations have been proposed to obtain the soil modulus, M, E'. and Gmax. The dilatometer modulus is also used to the soil classification.
The pore pressure index, UD, is considered to be useful for identifying site
stratigraphy. For a given soil, UD appears to be related to stress history via OCR. In combination with ID, the pore pressure index, UD, should be useful for specific soil classification (Lutenegger and Kabir, 1988; Schmertmann, 1988) .In this project it was used the definition of UD proposed by Lutenegger and Kabir (1988).
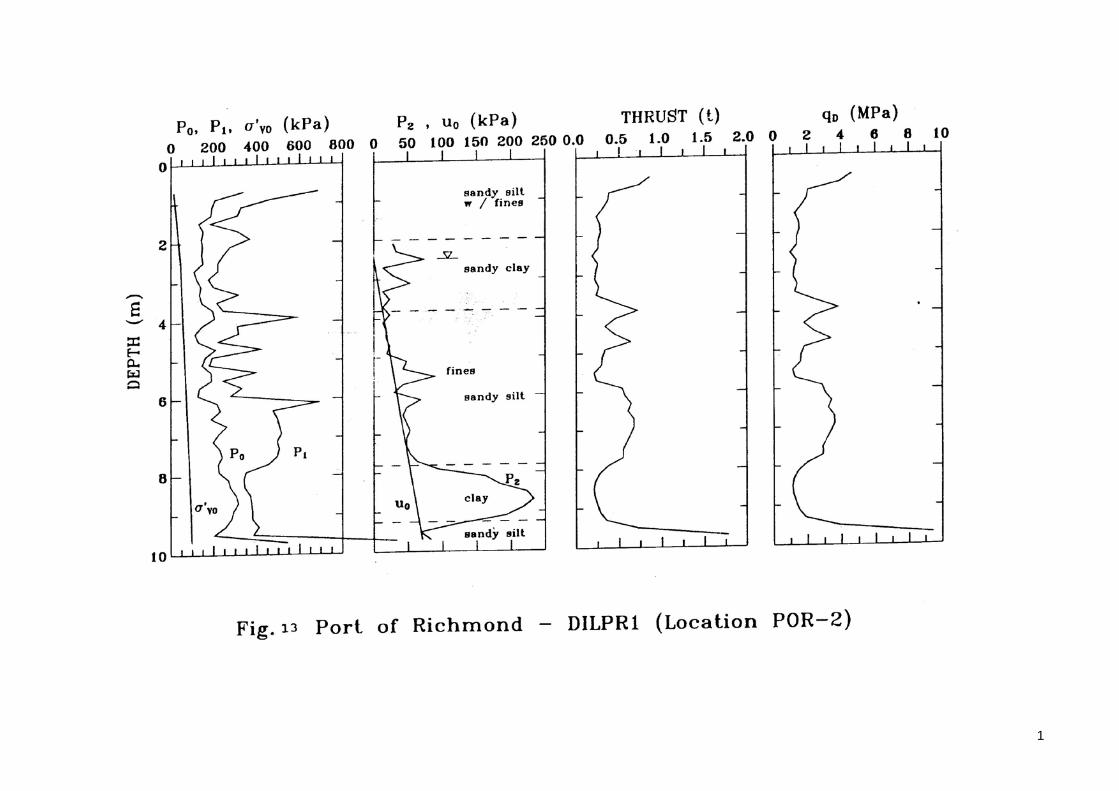
Port of Richmond
Figs. 13 to 16 present a summary of the DMT basic data for the tests DILPR1 and DILPR2 performed in two areas in this site (locations POR-2 and Hall-1).
The P0 and Pl profiles are basically in agreement with the different types of materials
and their corresponding penetration resistance. The presence of a non homogeneous deposit can be seen from the results. The occurrence of p1 < p0, which is contrary to normal expectations, in the depth of 5.5m in the DILPR2 test (Fig. 15), means that in this depth, the value of (B-A) was less than the value of (ΔA + ΔB). In fact, this problem was very unusual in the tests performed. To avoid this kind of problem, careful calibration of membrane stiffness was done, and also a gasket was used underneath the dilatometer membrane to reduce the magnitude of the corrections. This condition may have occurred because the soil tested is a very soft clay, and during the tests, it was used a hard membrane to avoid damage in the cohesionless dense soils. Another possible reason is that the pressure p0 obtained by standard procedure (extrapolation) is higher than the real pressure
14
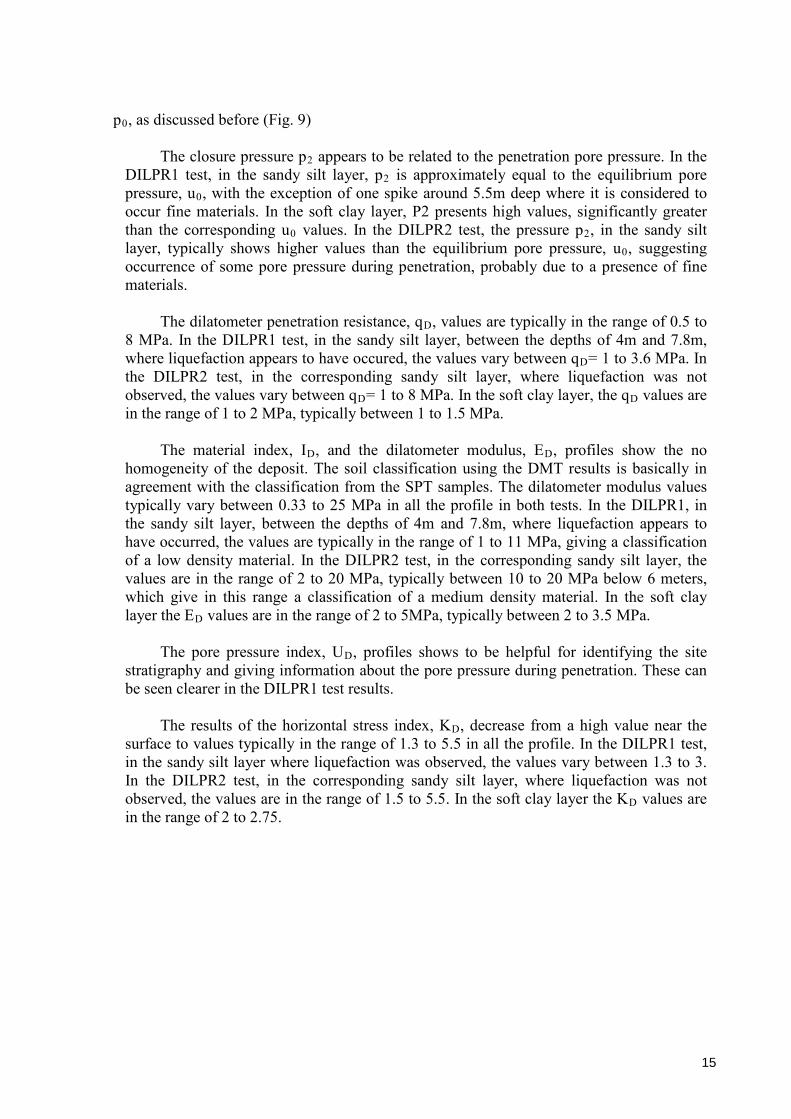
p0, as discussed before (Fig. 9)
The closure pressure p2 appears to be related to the penetration pore pressure. In the DILPR1 test, in the sandy silt layer, p2 is approximately equal to the equilibrium pore pressure, u0, with the exception of one spike around 5.5m deep where it is considered to occur fine materials. In the soft clay layer, P2 presents high values, significantly greater than the corresponding u0 values. In the DILPR2 test, the pressure p2, in the sandy silt layer, typically shows higher values than the equilibrium pore pressure, u0, suggesting occurrence of some pore pressure during penetration, probably due to a presence of fine materials.
The dilatometer penetration resistance, qD, values are typically in the range of 0.5 to
8 MPa. In the DILPR1 test, in the sandy silt layer, between the depths of 4m and 7.8m, where liquefaction appears to have occured, the values vary between qD= 1 to 3.6 MPa. In the DILPR2 test, in the corresponding sandy silt layer, where liquefaction was not observed, the values vary between qD= 1 to 8 MPa. In the soft clay layer, the qD values are in the range of 1 to 2 MPa, typically between 1 to 1.5 MPa.
The material index, ID, and the dilatometer modulus, ED, profiles show the no
homogeneity of the deposit. The soil classification using the DMT results is basically in agreement with the classification from the SPT samples. The dilatometer modulus values typically vary between 0.33 to 25 MPa in all the profile in both tests. In the DILPR1, in the sandy silt layer, between the depths of 4m and 7.8m, where liquefaction appears to have occurred, the values are typically in the range of 1 to 11 MPa, giving a classification of a low density material. In the DILPR2 test, in the corresponding sandy silt layer, the values are in the range of 2 to 20 MPa, typically between 10 to 20 MPa below 6 meters, which give in this range a classification of a medium density material. In the soft clay layer the ED values are in the range of 2 to 5MPa, typically between 2 to 3.5 MPa.
The pore pressure index, UD, profiles shows to be helpful for identifying the site
stratigraphy and giving information about the pore pressure during penetration. These can be seen clearer in the DILPR1 test results.
The results of the horizontal stress index, KD, decrease from a high value near the
surface to values typically in the range of 1.3 to 5.5 in all the profile. In the DILPR1 test, in the sandy silt layer where liquefaction was observed, the values vary between 1.3 to 3. In the DILPR2 test, in the corresponding sandy silt layer, where liquefaction was not observed, the values are in the range of 1.5 to 5.5. In the soft clay layer the KD values are in the range of 2 to 2.75.
15
Port of Oakland
A summary of the DMT basic data for the tests DILPO1 and DILPO2 performed in this site is presented in Figs. 17 to 20.
The P0 and Pl profiles are basically in accordance with the different types of
materials and their corresponding penetration resistance. Interruptions in the profiles were due to penetration refusal and are indicative of a very hard material.
The pressure P2 also in this site appears to be related to the penetration pore pressure.
In the DILPO1 test, with the exception of a small region in the sand layer around 4 m, the values are according to what is expected. In the DILPO2 test, the values are basically as they are expected, with the exception that the results suggest a little deeper water table in the silty sand layer. The pore pressure index, UD, profile also in this site shows to be helpful for identifying the site stratigraphy and pore pressure during penetration.
The dilatometer penetration resistance presents high values in the upper 4 meters,
specially in the DILPO1 test, with qD values of typically between 10 and 25 MPa (or higher). Below this layer, in the 4 to 10 meters range, a looser deposit occurs with DMT resistance values between qD= 4 to 16 MPa. This layer is considered to be responsible for the observed liquefaction on the surface. In the soft clay layer the qD values are basically in the range of 1 to 1.5MPa.
The material index profile, in the DILPO1 test, shows some variations in the values
and slight tendency to decrease with depth. In the cohesionless deposit, the material change from sand, in the upper part, to silty sand, in the range of 7 to 10.8 meters. The corresponding dilatometer modulus profile presents similar tendency, but with values basically constant, around 33 MPa, in the silty sand range of the cohesionless deposit. In the soft clay layer the ED values are typically between 2.5 to 3.5MPa. In the DILPO2 test, the material index profile presents basically results in the range of silty sand material. The dilatometer modulus results present small variations and slight tendency to increase with depth, with typically values in the range of 30 to 50MPa, except for some weaker zones, as observed at 7 and 10 meters deep where the values are below 20MPa.
In both tests the horizontal stress index profile decreases from high values near the
surface to values typically in the range of 2 to 6 below the depth of 5m. In the silty sand, between 5 and 10 meters, where liquefaction appears to have occurred, the values are typically in the range of 2 to 5.5. In the DILPO1 test, below this layer, in the soft clay deposit, the values are practically constant typically in the range of 2 to 2.6.
16
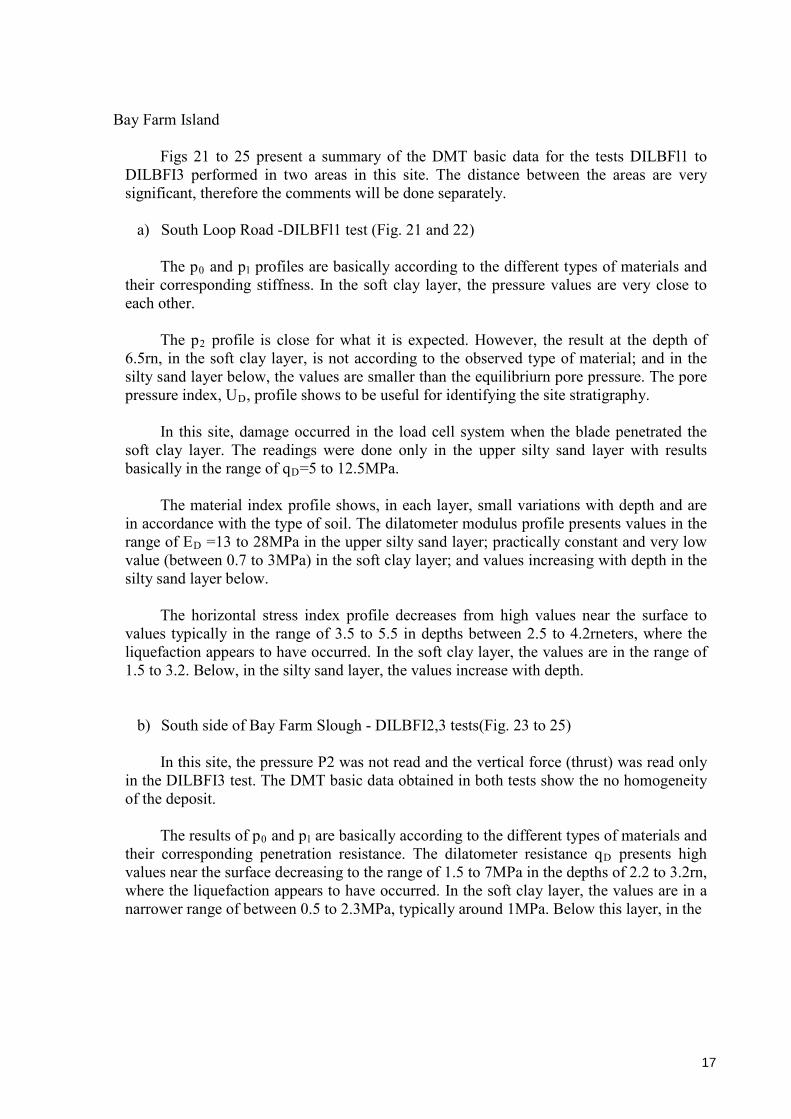
Bay Farm Island
Figs 21 to 25 present a summary of the DMT basic data for the tests DILBFl1 to DILBFI3 performed in two areas in this site. The distance between the areas are very significant, therefore the comments will be done separately.
a) South Loop Road -DILBFl1 test (Fig. 21 and 22)
The p0 and pl profiles are basically according to the different types of materials and their corresponding stiffness. In the soft clay layer, the pressure values are very close to each other.
The p2 profile is close for what it is expected. However, the result at the depth of
6.5rn, in the soft clay layer, is not according to the observed type of material; and in the silty sand layer below, the values are smaller than the equilibriurn pore pressure. The pore pressure index, UD, profile shows to be useful for identifying the site stratigraphy.
In this site, damage occurred in the load cell system when the blade penetrated the
soft clay layer. The readings were done only in the upper silty sand layer with results basically in the range of qD=5 to 12.5MPa.
The material index profile shows, in each layer, small variations with depth and are
in accordance with the type of soil. The dilatometer modulus profile presents values in the range of ED =13 to 28MPa in the upper silty sand layer; practically constant and very low value (between 0.7 to 3MPa) in the soft clay layer; and values increasing with depth in the silty sand layer below.
The horizontal stress index profile decreases from high values near the surface to
values typically in the range of 3.5 to 5.5 in depths between 2.5 to 4.2rneters, where the liquefaction appears to have occurred. In the soft clay layer, the values are in the range of 1.5 to 3.2. Below, in the silty sand layer, the values increase with depth.
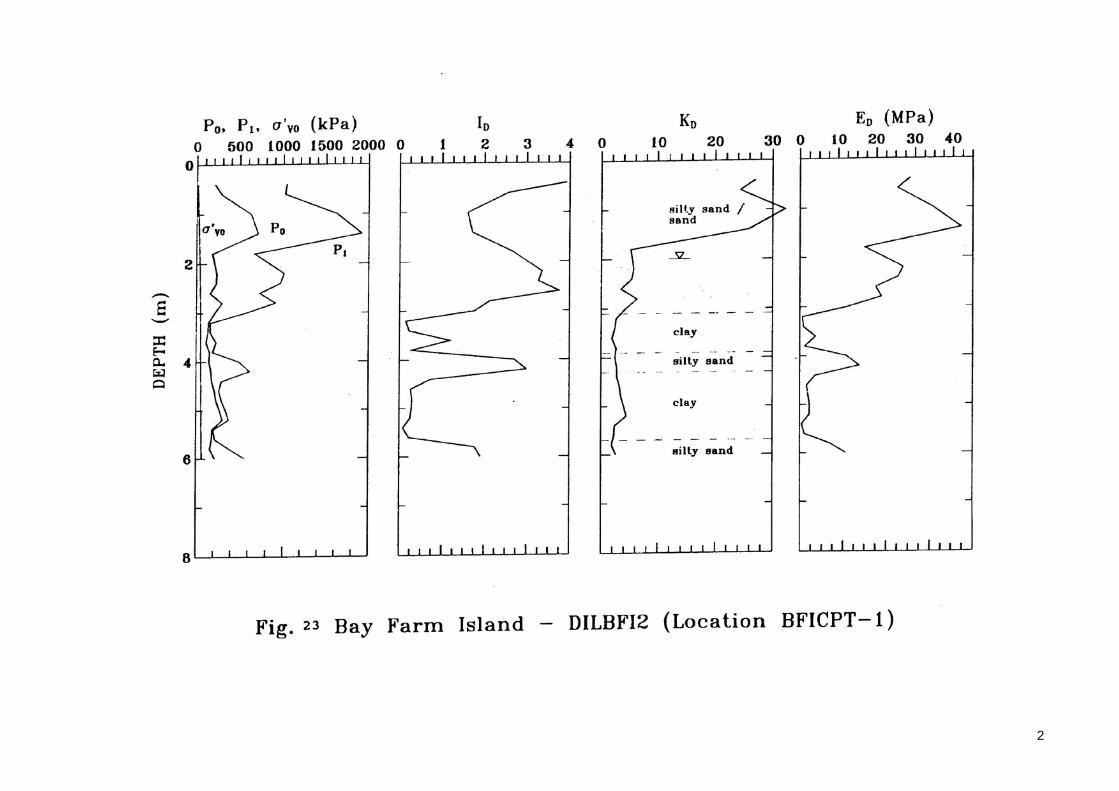
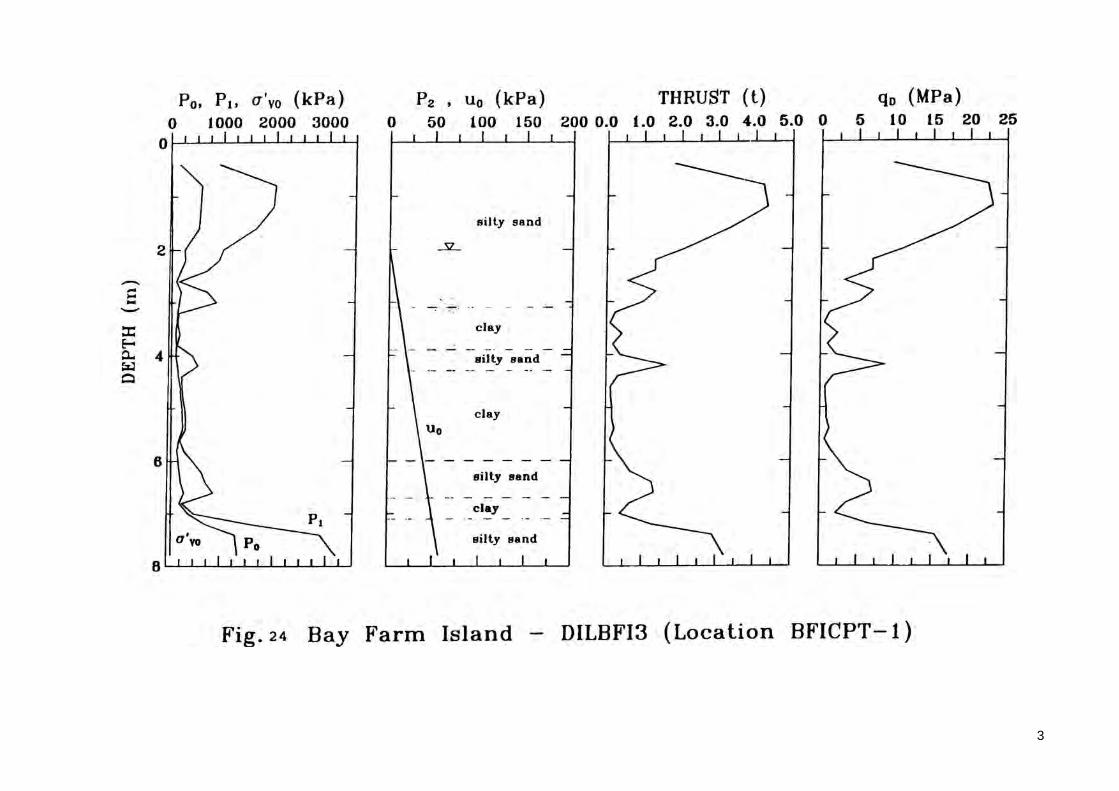
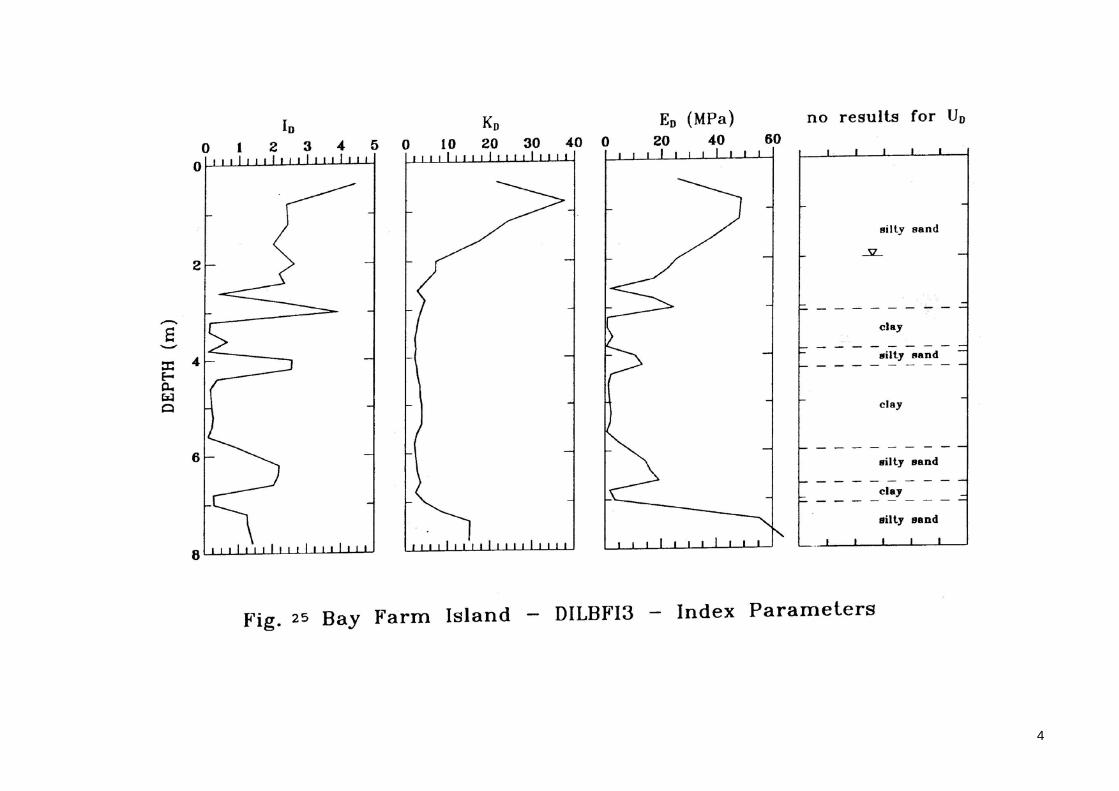
b) South side of Bay Farm Slough - DILBFI2,3 tests(Fig. 23 to 25)
In this site, the pressure P2 was not read and the vertical force (thrust) was read only in the DILBFI3 test. The DMT basic data obtained in both tests show the no homogeneity of the deposit.
The results of p0 and pl are basically according to the different types of materials and
their corresponding penetration resistance. The dilatometer resistance qD presents high values near the surface decreasing to the range of 1.5 to 7MPa in the depths of 2.2 to 3.2rn, where the liquefaction appears to have occurred. In the soft clay layer, the values are in a narrower range of between 0.5 to 2.3MPa, typically around 1MPa. Below this layer, in the
17
silty sand deposit the values increase with depth.
The material index profile is according to the types of soils and shows some significant variations in the upper layer (hydraulic fill). The material in this layer vary from silty sand to clean sand. The dilatometer modulus profile also presents some significant variation in this upper layer, with values in the range of ED =15 to 50MPa. In the soft clay layer, the ED values are very low in the range of 0.5 to 4 MPa, typically between 0.5 to 2.1 MPa.
The horizontal stress index profile decreases from high values near the surface to
values typically in the range of KD = 3 to 5.5 in depths between 2.2 to 3.2 meters, where the liquefaction appears to have occurred. In the soft clay layer, the values are in the range of KD = 2 to 4.5.
San Francisco - Oakland Bay Bridge Mole
Unfortunately, it was not possible to obtain the DMT data for this site. In the first DMT sounding, the dilatometer blade was lost. During the penetration using a CPT hydraulic jacking rig, the pushrod system was broken near the blade, probably due to a significant verticality deviation. It is considered that the cause of this problem was the presence of an apparently interbedded sequence of silty sand and gravelly-silty sand deposits, in the range of 2.8 to 4.5 meters. Apparently this problem occurred in very short time and it was not possible to be avoided. The cone penetration tests were performed before in this site without present difficulties.
7. Liquefaction Assessment
Liquefaction assessment from DMT data was done using the methods of Marchetti (1982), Robertson and Campanella (1986), and Reyna and Chameau (1991).
Marchetti (1982) suggested that the horizontal stress index, KD is a parameter well
suited to be used in correlations to assess the liquefaction resistance of sands under level ground conditions. Marchetti considers that KD appears to reflect to a certain extent the following soil variables: relative density, Dr; in situ stress, K0; stress history and pre-stressing; aging; and cementation. However, it is not possible to identify the individual responsibility of each factor. On the other hand, when KD is low, then none of these factors are high, i.e., the sand is loose, uncemented, in a low horizontal stress environment and has little stress history. A sand deposit under these conditions may be a source of liquefaction problems or develop large strains under cyclic loading, using liquefaction as defined by Seed et al.
18
(1983). Reyna and Chameau (1991) consider that an advantage of KD is that it is fairly reproducible, and a statistical analysis of cone and dilatometer data shows that the dilatometer parameters have less variability than the corresponding cone parameters for loose silty sands.
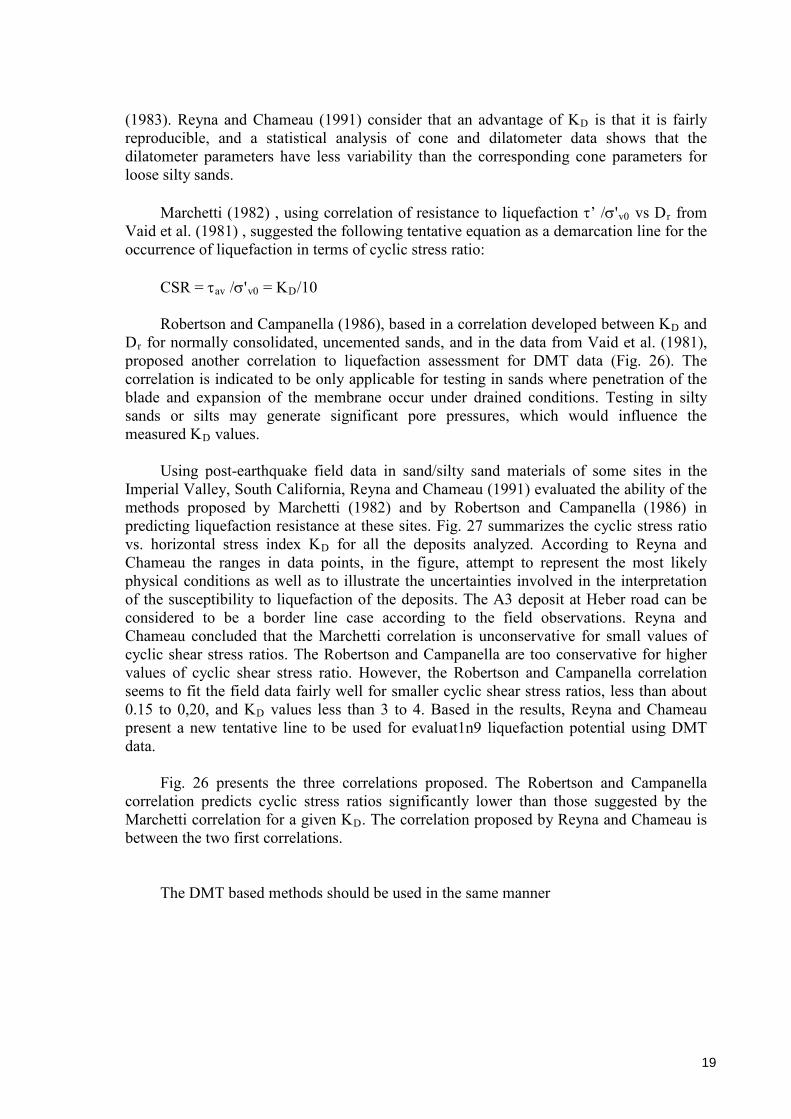
Marchetti (1982) , using correlation of resistance to liquefaction τ’ /σ'v0 vs Dr from Vaid et al. (1981) , suggested the following tentative equation as a demarcation line for the occurrence of liquefaction in terms of cyclic stress ratio:
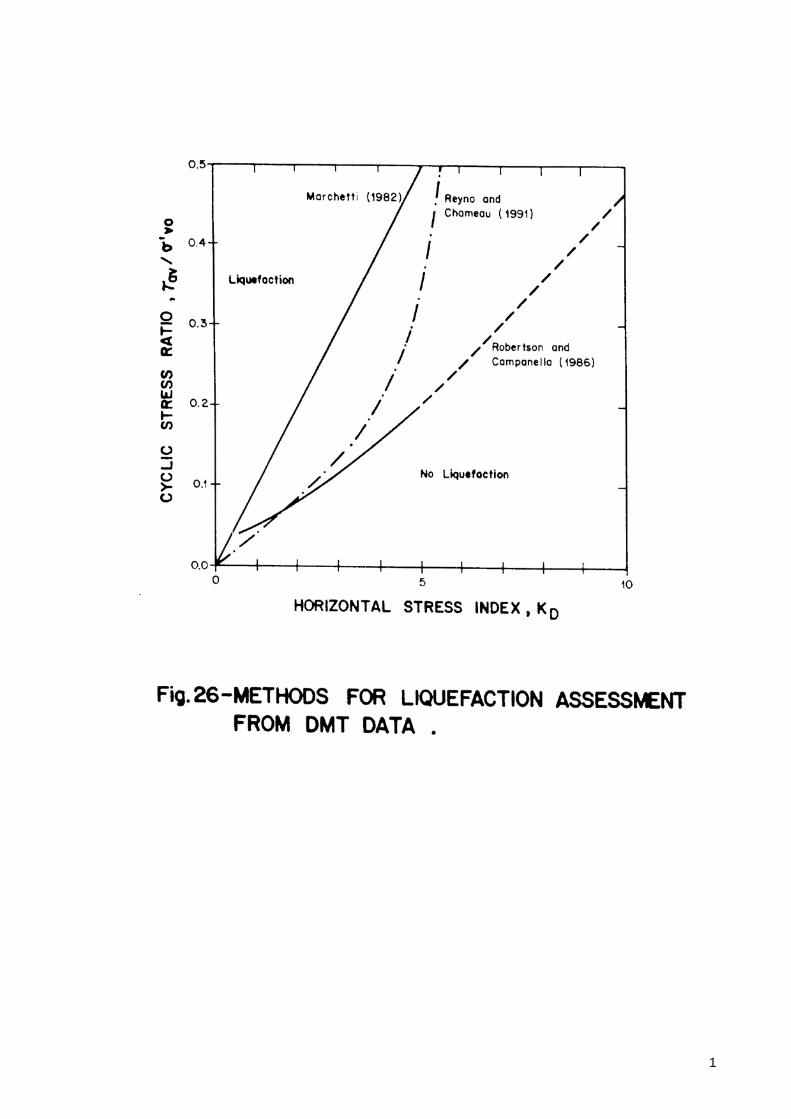
CSR = τav /σ'v0 = KD/10 Robertson and Campanella (1986), based in a correlation developed between KD and
Dr for normally consolidated, uncemented sands, and in the data from Vaid et al. (1981), proposed another correlation to liquefaction assessment for DMT data (Fig. 26). The correlation is indicated to be only applicable for testing in sands where penetration of the blade and expansion of the membrane occur under drained conditions. Testing in silty sands or silts may generate significant pore pressures, which would influence the measured KD values.
Using post-earthquake field data in sand/silty sand materials of some sites in the
Imperial Valley, South California, Reyna and Chameau (1991) evaluated the ability of the methods proposed by Marchetti (1982) and by Robertson and Campanella (1986) in predicting liquefaction resistance at these sites. Fig. 27 summarizes the cyclic stress ratio vs. horizontal stress index KD for all the deposits analyzed. According to Reyna and Chameau the ranges in data points, in the figure, attempt to represent the most likely physical conditions as well as to illustrate the uncertainties involved in the interpretation of the susceptibility to liquefaction of the deposits. The A3 deposit at Heber road can be considered to be a border line case according to the field observations. Reyna and Chameau concluded that the Marchetti correlation is unconservative for small values of cyclic shear stress ratios. The Robertson and Campanella are too conservative for higher values of cyclic shear stress ratio. However, the Robertson and Campanella correlation seems to fit the field data fairly well for smaller cyclic shear stress ratios, less than about 0.15 to 0,20, and KD values less than 3 to 4. Based in the results, Reyna and Chameau present a new tentative line to be used for evaluat1n9 liquefaction potential using DMT data.
Fig. 26 presents the three correlations proposed. The Robertson and Campanella
correlation predicts cyclic stress ratios significantly lower than those suggested by the Marchetti correlation for a given KD. The correlation proposed by Reyna and Chameau is between the two first correlations.
The DMT based methods should be used in the same manner
19
proposed by Seed et al. (1983, 1984) for level ground condition using the standard penetration test (SPT) based method. However, the DMT data does not require modification for in-situ effective overburden pressure since this is accounted for in the KD parameter (Robertson and Campanella, 1986).
The equivalent uniform cyclic shear stress ratio induced by the earthquake at any point in the ground can be estimated as (Seed and Idriss, 1982):
CSR = τav /σ'v0 = 0.65amx σv0 rd/σ'v0 g
where amax is the peak acceleration measured or estimated for the ground surface at the site; σv0 is the total overburden stress at the depth of consideration; σ’v0 is the effective overburden at the same depth; g is the gravitational acceleration (981 cm/sec2); and rd is a depth reduction factor, which can be estimated in the upper part 10 meters of the soil column by the following equation: rd = l - 0.012 z ; where z is the depth in meters. In fact, the cyclic shear stress parameter CSR represents a simplified approximation of the complex and irregular earthquake-induced stress time history as an equivalent series of cyclic loads of uniform amplitude.
Peak horizontal ground accelerations, in most of the sites investigated in this study, can be estimated from strong motion recording station near the shoreline. It appears that amax on the bayshore fills in the vicinity of Oakland International Airport, and Bay Farm Island were in the order of amax=0.27 to 0.29g, and the peak accelerations at the Toll Plaza of the San Francisco - Oakland Bay Bridge and 7th Street Marine Terminal (Port of Oakland) sites was probably about 0.28 to 0.29g. At the Port of Richmond, there was no strong motion recording nearby on similar soil conditions. site response analyses were performed using the program SHAKE90 (a modified version of the site response computer program SHAKE: Schnabel, Lysmer, and Seed,1972) .The analyses were based on regionally averaged rock motions, modified to account for the effects of soft and deep underlying cohesive deposits. These studies suggest that peak horizontal accelerations at the Port of Richmond were probably in the range of 0.13 to 0.18g (Kayen et al., 1992).
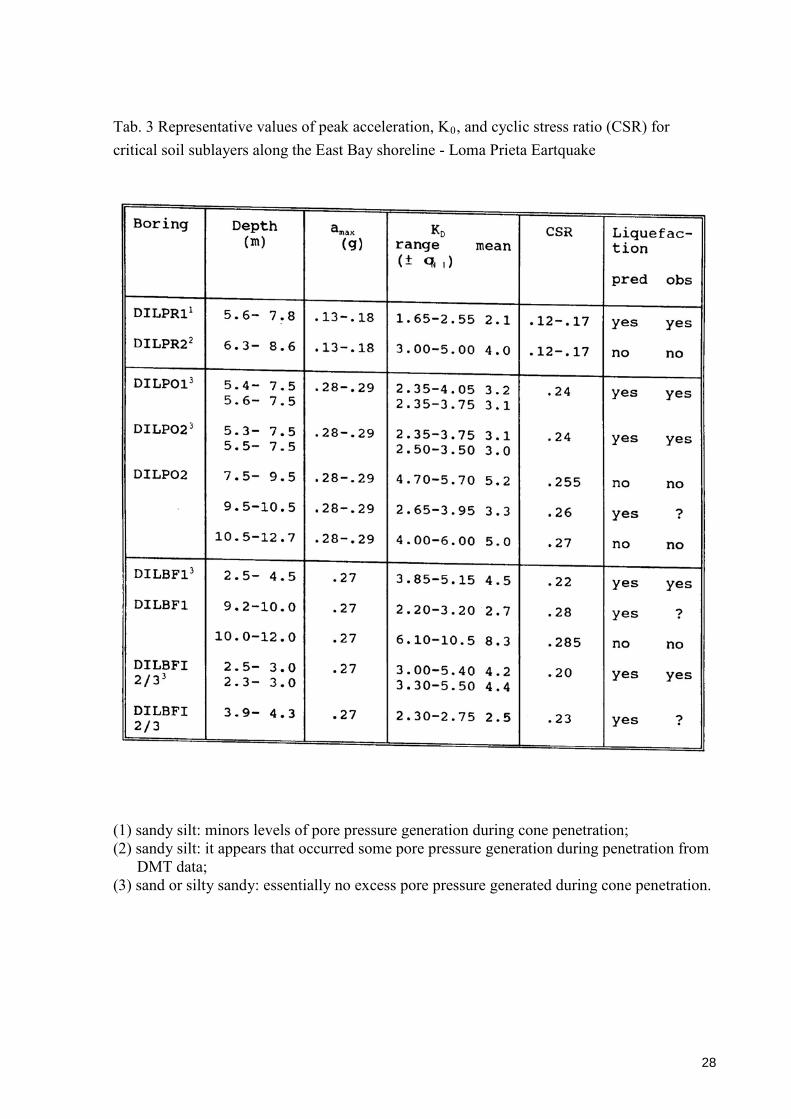
Tab. 3 presents a summary of the values used in the analyses of critical soil strata at
the East Bay sites studied with the DMT in this project. Fig. 28 summarizes the cyclic stress ratio vs. horizontal stress index KD for all the deposits analyzed. The ranges in data points in the figure attempt to represent the most likely results as well as to illustrate some uncertainties involved in the analysis.
The analysis of liquefaction was done considering the following assumptions: (1)
definition of the critical strata (weak cohesionless sublayer) where the liquefaction appears to have occurred; (2) use of the mean value of KD (± 1 standard deviation)
20
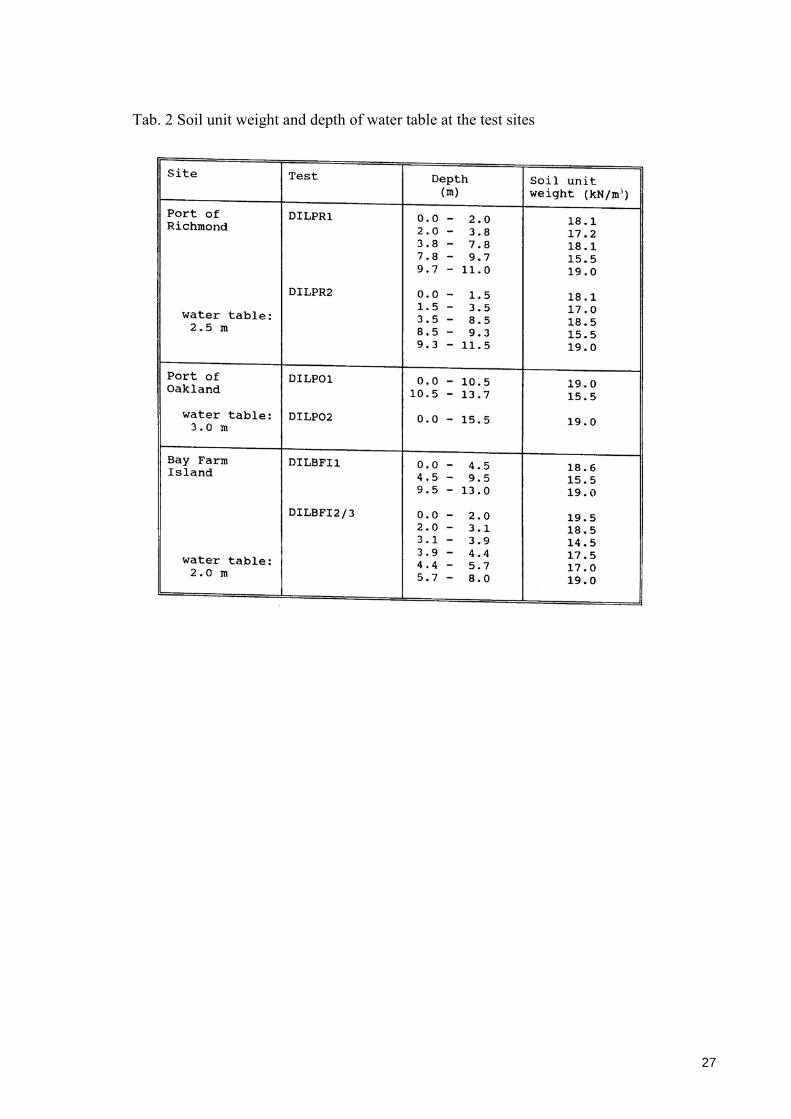
for each deposit; (3) unit weight of the soils estimated based in the SPT and DMT data (Tab. 2); (4) peak ground acceleration measured or estimated from strong motion recording station sited on bayshore fills in this region; (5) water table depth observed during the period of the tests (Tab. 2); (6) The cyclic shear stress calculated to the average depth of the sublayer considered.
The data in Fig. 28 are basically in accordance with the results of Reyna and Chameau (1991). The points of the liquefaction sites generally plot to the left of the boundary curve proposed, with the slight exception of the Bay Farm Island data. The more deeply buried dense layers at DILPO2, DILBFl1 and the sandy silt layer at DILPR2, that are not believed to have liquefied, plot to the right of the boundary curve. A slight correction in the Reyna and Chameau boundary curve is proposed in order to accommodate all the data and really segregate liquefiable soils from those non- liquefiable, to the Loma Prieta earthquake data. The correction leads the curve to be somewhat closer to the Robertson and Campanella boundary line, for cyclic shear stress ratio little above 0.20. The data in this project also suggest that the Marchetti correlation is unconservative, in special for small values of cyclic shear stress ratios, and the Robertson and Campanella correlation can be conservative for higher values of cyclic shear stress ratio. The Robertson and Campanella curve, however, fit the field data well for cyclic shear stress ratio about 0.20.
More field data is really needed to improve upon this chart, especially for higher
cyclic shear stress ratio. In addition, the influence of fine contents of the soil and the magnitude of the earthquake have to be considered in the analysis, as it is done with the SPT and CPT methods. The data published before was limited to earthquake magnitude of 5.5 to 6.5, and the Loma Prieta earthquake is of magnitude 7.1.
Some thinner deep cohesionless sub-layers at DILPO2, DILBFL1, and DILBFI2/3
(Tab. 3), are predicted to have liquefied, based in the Robertson and Campanella and Reyna and Chameau correlations. However, it is very difficult to establish what really the behaviour of these layers in the field was.
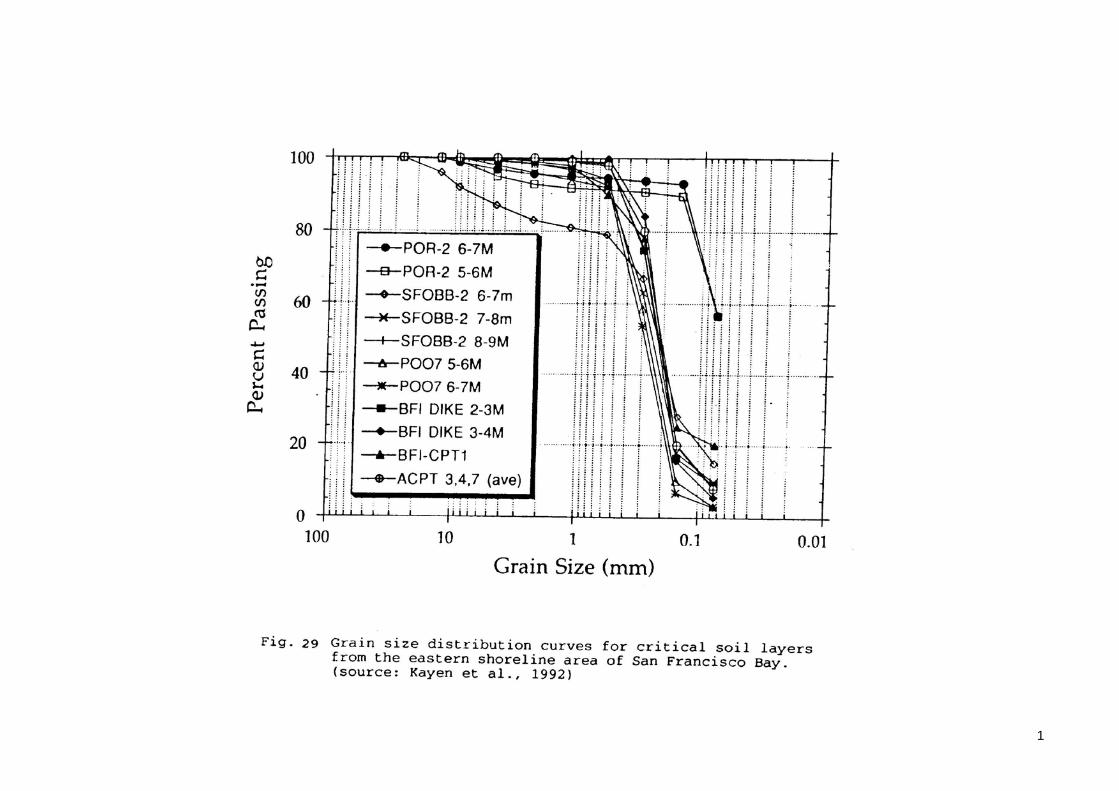
Fig. 29 presents grain size distribution curves for some samples from the sub-layers
where liquefaction appears to have occurred. The results show that the liquefiable layers at the Toll Plaza area, Port of Oakland, Bay Farm Island, and Oakland Airport present basically lower amount of fines content, typically around 10% or less, and can be characterized as clean sand with a mean- grain-diameter (D50) of about 0.25 mm. The Port of Richmond layer has significantly higher fines content, with D50 of approximately 0.06-0.07 mm, and it is classified as a sandy silt material. This last deposit perhaps can not be directly applicable to the Robertson and Campanella correlation, which is indicated for sands
21
where the penetration and expansion occur under drained conditions (see also Tab. 3).
Cyclic stress-based analyses of liquefaction potential were also done in this project using the SPT and CPT data (Kayen et al., 1992). The analyses show that the SPT- and CPT-base methods performed well in predicting soil liquefaction potential during the Loma Prieta Earthquake.
8. Conclusions
Soil liquefaction and associated ground deformations were observed during the Loma Prieta earthquake in unimproved field deposits along the East Bay from Oakland Airport to the Port of Richmond, between 65 and 85 Km from the northern end of the fault rupture. Post-earthquake investigations using a variety of in situ testing were done to evaluate the ability of each different technique to correctly predict liquefaction resistance. This report presents the results obtained using the dilatometer test (DMT) at four sites near the East Bay shoreline: Port of Richmond, Port of Oakland, Bay Farm Island, and San Francisco-Oakland Bay Bridge Toll Plaza. The soil conditions at these sites typically consist of deposits of cohesionless hydraulic fill with zones of low penetration resistance values underlain by a deep and primarily cohesive soil deposit which amplified bedrock motions. These coupled factors are considered to be the principal causes for liquefaction at these sites.
Liquefaction assessment from DMT data was done using the cyclic stress-based
analysis of Marchetti (1982), Robertson and Campanella (1986), and Reyna and Chameau (1991). The results obtained in this project are basically in accordance with the Reyna and Chameau correlation. However, a slight correction is proposed in the Reyna and Chameau boundary curve in order to really segregate liquefiable soils from those non-liquefiable to the Loma Prieta earthquake data. The Robertson and Campanella correlation fit the field data well for cyclic stress ratio about 0.20, but it can be conservative for higher values of cyclic stress ratio. The data in this project also suggest that the Marchetti correlation is unconservative, in special for small values of cyclic stress ratio.
The use of DMT data to liquefaction assessment is recent, and more field data is
really needed to improve upon this chart, especially for higher cyclic shear stress ratio. In addition, the influence of fine content of the soil, and the magnitude of the earthquake have to be considered in the analysis, as it is done with the SPT and CPT methods.
The basic results obtained with the UC Berkeley DMT in this project were
satisfactorily good, and they suggest relatively high
22
reliability. They are in agreement with the different types of materials, their corresponding penetration resistance, and the no homogeneity of the deposits. The closure pressure p2 appears to be related to the penetration pore pressure in the soils investigated, and the pore pressure index UD shows to be useful for identifying site stratigraphy. The soil classification using the DMT results are basically in agreement with the classification from the SPT and tube samples.
An important point to call attention in a program of in situ test is the importance of a good maintenance system and of an adequate penetration equipment to push the device into the ground. Careful attention during the penetration in special types of soils is also important to minimize the possibility of damage in the equipment.
REFERENCES Baldi, G., Bellotti, R., Ghioma, V.N., Jamiolkowski, M., Marchetti, S., and Pasqualini, E. (1986). Flat dilatometer tests in calibration chambers. Proceedings, In situ 186, ASCE Specialty Conference, Blacksburg, VA, p. 431. Baldi, G., Bellotti, R., Ghioma, V.N., Jamiolkowski, M., and Lo Presti, D.C.F. (1989) .Modulus of sands from CPTis and DMTis. 12th Int. Conf. on Soil Mechanics and Foundation Engineering, Session 2, Rio de Janeiro, Brazil. Bellotti, R., Ghioma, V.N., Jamiolkowski, M., and Robertson, P.K. (1989) .Design Parameters of cohesionless soils from in-situ tests. In-Situ Testing of Soil Properties for Transportation Facilities. National Research Council, Transportation Research Board. Washington D.C. USA. Campanella, R.G. and Robertson, P.K. (1991). Use and interpretation of a research dilatometer. Canadian Geotechnical Journal, vol. 28, pp. 113-126. Davidson, J.L. and Boghrat, A. (1983). Flat dilatometer testing in Florida, USA. Proc. ISIST, Paris, Vol. 2, pp. 251-255. Jamiolkowski, M., Ghionna, V.N. and Lancellotta, R. (1988). New correlations of penetration tests for design practice. Int. Symp. on Penetration Testing ISOPT-1. Orland, USA, Proc., Vol. 1,263-296. Jamiolkowski, M., Ladd, C.C., Germaine, J.T. and Lancellotta, R. (1985) .New developments in field and laboratory testing of soils. State-of-the-art report. 11th Int. Conf. on Soil Mechanics and Found. Eng., San Francisco, USA, Vol.1, pp. 57-153.
Kayen, R.E., Mitchell, J.K., Seed, R.B., Lodge, A., Nishio, S. and
23
Coutinho, R.Q. (1992) .Evaluation of SPT-,CPT- and Shear Wave-based methods for liquefaction potential assessment using Loma Prieta data. IV U.S. - Japan Worshop on Earthquake Resistance Design of Lifeline Facilities and Counter Measures against Soil Liquefaction, NCEER, Honolulu, HI, USA. Kulhawy, F.H. and Mayne, P.W. (1990) .Manual on estimating soil properties for foundation design. Cornell University, Final Research Report, Ithaca, N.Y. Lacasse, S. and Lunne, T. (1986). Dilatometer tests in sand. ASCE Spec. Conf. IN SITU '86, Blaksburg, VA, USA, pp. 686-699. Lacasse, S. and Lunne, T. (1988) .Calibration of dilatometer correlations. Int. Symp. on Penetration Testing ISOPT-1. Orland, Florida, USA, Vol. 1, pp. 539-548. Lunne, T., Jonsrud, R., Eidsmoen, T. and Lacasse, S. (1987) .The offshore dilatometer. 6th Int. Symp. on Offshore Engineering - Brasil Offshore '87, Rio de Janeiro. Lunne, T., Lacasse, S. Rad, N.S. (1989) .SPT, CPT, Pressuremeter testing and recent developments on in situ testing of soils. General Report Session 2, 12th Int. Conf. on Soil Mechanics and Found. Eng., Rio de Janeiro, Brazil. Lutenegger, A.J. (1988) .Current satatus of the Marchetti dilatometer test. Int. symp. on Penetration Testing ISOPT-1. Orlando, Florida, USA, Vol. 1, pp. 137-156. Lutenegger, A. J. and Kabir, M.G. (1988) .Dilatometer C-reading to help determine stratigraphy. Int. Symp. on Penetration Testing ISOPT-1. Orlando, Florida, USA, pp. 549-554.
Marchetti, S. (1980) .In situ tests by flat dilatometer. ASCE, Journal of Geotechnical Engineering. Vol. 106, GT3, pp. 299-321.
Marchetti, S. (1982) .Detection of liquefiable sand layers by means of quasi-static penetration tests. 2nd European Symp. on Penetration Testing. Amsterdam, Vol. 2, pp. 689-695. Marchetti, S. (1985) .On the field determination of K0 in sand; painel discussion. 11th International Conference on Soil Mechanics and Found. Eng., San Francisco, USA, Vol. 5, pp. 2667-2672. Marchetti, S. and Totani, G. (1989). ch evaluation from DMTA dissipation curves. 12th Int. Conf. on Soil Mechanics and Found. Eng., Session 2, Rio de Janeiro, Brazil. Masood, T. (1990). Determination of lateral earth pressure in soils by in-situ measurement. Ph.D. thesis, University of California Berkeley, Dept. civil Eng., Berkeley, CA, USA.
24
Reyna, F. and Chameau, J.L. (1991) .Dilatometer based liquefaction potential of sites in the Imperial Valley. II Int. Conf. on Recent Advances in Geotechnical Earthquake Engineering and Soil Dynamics. Vol. 1, pp. 385-392, st. Louis, Missouri, USA. Robertson, P.K. and Campanella, R.G. (1986) .Estimating liquefaction potential of sands using the flat plate dilatometer. Geotechnical Testing Journal, Vol. 9, No.1, pp. 38-40. Robertson, P.K., Campanella, R.G., Gillespie, D. and By, T. (1988). Excess pore pressures and the DMT. Int. Symp. on Penetration Testing, ISOPT-1, Vol. 1, pp. 567-577. Schmertmann, J. (1982). A method for determining the friction angle in sands from the Marchetti dilatometer test (DMT). 2nd European Symp. on Penetration Testing, Amsterdam, Vol. 2, p.853. Schmertmann, J. (1983). Revised procedure for calculating K0 and OCR from DMT's with ID > 1.2 and which incorporates the penetration force measurement to permit calculating the plane strain friction angle. DMT Diggest No.1, GPE inc., Gainesville, Florida, USA. Schmertmann, J. (1986a) .Suggested method for performing the flat dilatometer test. ASTM subcommittee 18.02. Geotechnical Testing Journal, ASTM, Vol. 9, No.2, pp. 99-101. Schmertmann, J. (1986b) Dilatometer to computer foundation settlement. ASCE Specialty Conf. In situ '86. Blacksburg, VA, p.303. Schmertmann, J. (1988). Guidelines for using the CPT, CPTU and Marchetti DMT for geotechnical design. Vol. 3: DMT test methods and data reduction. United States. Department of Transportation, Washington D.C., USA. Report FHWA-PA-024+84-24. 183 p. Schmertmann, J. (1991) .DMT Digest No.12, GPE. Inc., Gainesville, Florida, USA. Seed, H.B. and Idriss, I.M. (1982) Ground motions and soil liquefaction during earthquake. Earthquake Engineering Research Institute, Berkeley California, USA. Seed, H.B., Idriss, I.M., and Arango, (1983). Evaluation of liquefaction Potential using field performance data. ASCE, Journal of Geotechnical Engineering, Vol.109, No.3, pp. 458-482. Seed, H.B., Tokimatsu, K., Harder, L.II., and Chung, R.M., (1984). The influence of SPT procedure in soil liquefaction evaluations. Earthquake Engineering Research Center, Report No. UCB/EERC-84/15, University of California, Berkeley. Seed, R.B., Dickenson, R.B., Reimer, M.F., Bray, J.D., sitar, N.,
25
Mitchell, J.K., Idriss, I.M., Kayen, R.E., Kropp, A., Harder, L.F., Jr. Power, M.S. (1990) .Preliminary geotechnical aspects of the October 17, 1989 Loma Prieta earthquake. Earthquake Engineering Research Center, Report No. UCB/EERC-90/05, University of California, Berkeley. Sully, J.P. (1991) .Measurement of in situ lateral stress during full-displacement penetration tests. Ph.D. Dissertation, Depart. of civil Engineering, Univ. of British Columbia, Vancouver, Canada. Vaid, Y.P., Byrne, P.M. and Hughes, J.M.O. (1981). Dilation angle and liquefaction potential. ASCE Journal GED, Vol. 107, GT7, pp. 1003-1008. Whittle, A.J., Aubeny, C.P., Rafalovich, A., Ladd, C.C., Baligh, M.M. (1991) .Prediction and interpretation of in situ penetration tests in cohesive soils. Department of civil Engineering - MIT, Research Report R91-01.
26
Tab. 2 Soil unit weight and depth of water table at the test sites
27
Tab. 3 Representative values of peak acceleration, K0, and cyclic stress ratio (CSR) for critical soil sublayers along the East Bay shoreline - Loma Prieta Eartquake
(1) sandy silt: minors levels of pore pressure generation during cone penetration; (2) sandy silt: it appears that occurred some pore pressure generation during penetration from
DMT data; (3) sand or silty sandy: essentially no excess pore pressure generated during cone penetration.
28
Tab.4 Representative values of peak acceleration, qD1, and cyclic stress ratio (CSR) for critical soil sublayers along the East Bay shoreline - Lama Prieta Eartquake
(1) sandy silt: minors levels of pore pressure generation during cone penetration; (2) sandy silt: it appears that occurred some pore pressure generation during penetration from DMT data; (3) sand or silty sandy: essentially no excess pore pressure generated during cone penetration.
29
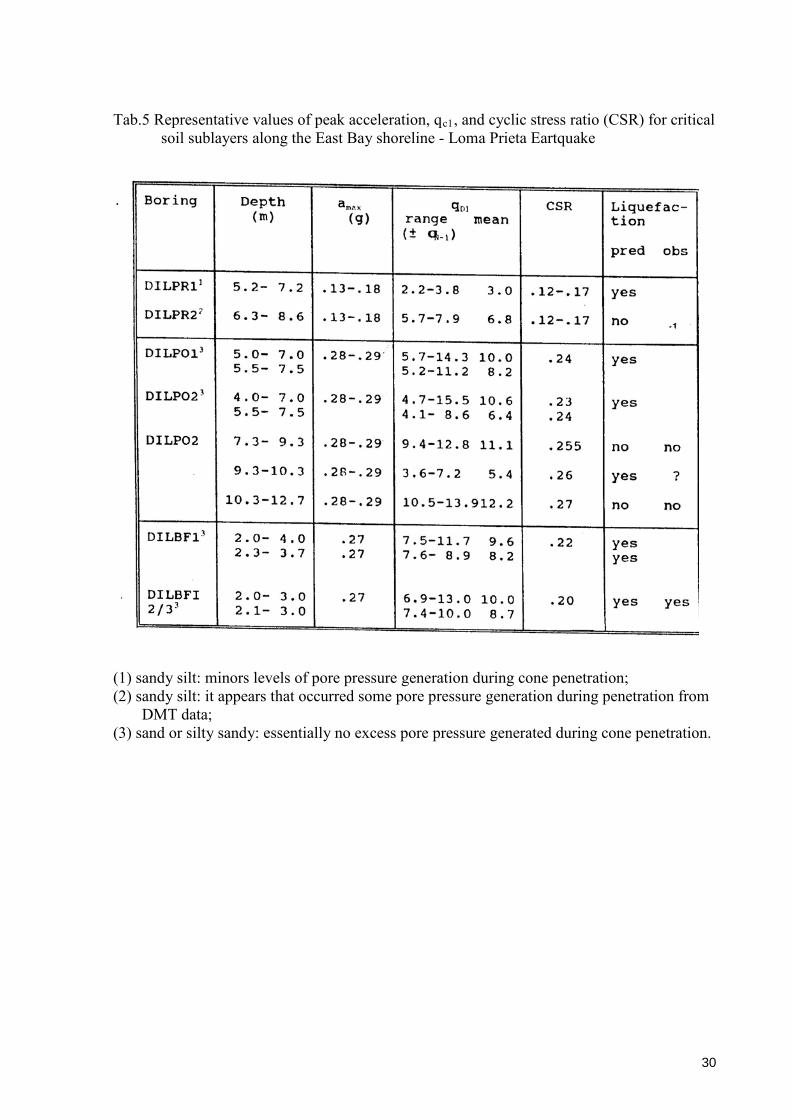
Tab.5 Representative values of peak acceleration, qc1, and cyclic stress ratio (CSR) for critical
soil sublayers along the East Bay shoreline - Loma Prieta Eartquake
(1) sandy silt: minors levels of pore pressure generation during cone penetration; (2) sandy silt: it appears that occurred some pore pressure generation during penetration from
DMT data; (3) sand or silty sandy: essentially no excess pore pressure generated during cone penetration.
30
Fig. 1 Sites investigated along the East Bay shoreline.
31
Fig. 2 Map showing sites where liquefaction was observed along the East Bay in Alameda
and Contra Costa Counties during the Loma Prieta Earthquake (source: Kayen et al., 1992).
32
Fig. 3 Map of the Port of Richmond, Inner Harbor Area with the SPT, CPT, and/or DMT locations (black dots).
33
Fig. 4 Soil Profile – Port of Richmond and Port of Oakland
1
Fig. 5 Map of west Oakland and Emeryville, CA, shoreline region. Enlarged maps show SPT, CPT, and / or DMT locations (blak dots) in the Bay Bridge Toll Plaza and Port of Oaland sites
2
Fig. 6 Map of study sites (SPT, CPT, and/or DMT) at Bay Farm Island and the northern
portion of Oakland International Airport.
1
1
Fig 8 Schematic illustration of the Modified Dilatorneter, 1991; Schrnertrnann, 1988).
1
Fig. 10 Calibralion of Dilatometer Load celr
Fig. 9 Effect of linear extrapolation on derived p0 value from DMT (source: Sully, 1991)