Page 1
Assessment of Dry Cooled Parabolic Trough (CSP) plants
1
„Evaluation of dry cooling option for parabolic trough (CSP) plants including related technical and economic
assessment”
“Case study CSP Plant in Ma’an/Jordan”
By
Ahmad Abdel-Latif Mohammad Liqreina
A Thesis Submitted in partial fulfillment of the requirements for the degree
Master of Science in “Renewable Energy and Energy Efficiency”
College of Engineering Kassel University Cairo University
Supervisors
Prof. Dr.Ing Adel khalil Prof. Dr. sc. techn. Dirk Dahlhaus Cairo University Kassel University
Dr. Louy Qoaider German Aerospace Center – DLR
Date of approval
March 15, 2012
Page 2
Assessment of Dry Cooled Parabolic Trough (CSP) plants
2
Acknowledgements
I would like to express my most sincere gratitude to my advisors, Dr. Adel khalil, Dr. Louy
Qoaider and Dr. Dirk Dahlhaus for their guidance and encouragement throughout this work. I
also like to thank Dr. Klaus Pottler, Dr. Christoph Richter, Dr. Marc Roeger, Mr.
FabianWolfertstetter, Mr. Stefan Wilbert and Mr. Christoph Prahl who with their advice and
kindness were great help during my stay in the German Aerospace Center – (DLR) in Almeria in
Spain. I would like to express my thanks to Dr. Ahmad al-Salaymeh from Jordan University and
Mr. Firas Alrimawi the manager of Ma’an Development Area (MDA) for their support. I would
like also to thank my professors and collogues from Birzeit University Dr.Allan Tubaileh, prof.
Hasan Shibleh, prof. Afif Hasan, Dr. Ahmad abu Haneia, Dr. Mohamad Karaeen and Mr.Sameh
abu Awwad who inspire me.
My special thanks go to my friends Alaa’, Anan, Ahmad, Mohammad, Ali, Hani, Rabee’, Tariq,
Hana, Nour, wala,Suad, Najah, Shadi, Osama, Rmai Ayman, Abdallah, Ashraf, Moath, Momen,
Zaher, Ibrahim, Karim, Mutaz Martin, Younis, Laith, Fadi, Noha, Rana for their support
throughout my study. Sincere thanks to my mother, Fatheia, my father, Abdelatif who brought
me up and always supported me, great thanks to my brothers Mohammad, Mahmoud, Montaser
and my sisters Abeer, Iman and Haneen, to my uncles Abdallah, Mustafa, Ibrahim, to my aunts
Fatima, Rasmia, Nihaya, and to my brother in law Anwar.
Page 3
Assessment of Dry Cooled Parabolic Trough (CSP) plants
3
Table of Contents Acknowledgements 2
Table of Contents 3
List of Tables 5
List of Figures 7
List of Symbols 9
Abstract 11
1. Introduction 13
1.1 Background ....................................................................................................................................... 13
1.2Research need .................................................................................................................................... 13
1.3 Objectives .......................................................................................................................................... 14
1.4 Methodology ..................................................................................................................................... 14
2. Parabolic trough power plants 15
2.1 Overview of CSP technologies ........................................................................................................... 15
2.1.1 Fresnel ........................................................................................................................................ 15
2.1.2Central receiver systems ............................................................................................................. 17
2.1.3 Dish‐Stirling ................................................................................................................................ 19
2.1.4 Parabolic Trough ......................................................................................................................... 21
2.2 Parabolic trough power plant ........................................................................................................... 23
2.2.1 Introduction ............................................................................................................................... 23
2.2.2 Solar field ................................................................................................................................... 24
2.2.3 Storage system ........................................................................................................................... 25
2.2.4 Power block ................................................................................................................................ 27
3. Site Assessment of the case study area 33
3.1 Site Location ...................................................................................................................................... 33
3.1.1 Best locations for CSP ................................................................................................................. 33
3.1.2 Ma’an Plant location .................................................................................................................. 35
3.2 Solar resources assessment .............................................................................................................. 38
3.2.1 Source and quality o f metrological data ................................................................................... 38
3.2.2 Solar recourses ........................................................................................................................... 40
3.3 Study of dry cooling as an option ...................................................................................................... 45
Page 4
Assessment of Dry Cooled Parabolic Trough (CSP) plants
4
4. Planning of the Ma’an power plant 48
4.1 Pre‐Design of Ma’an power plant ..................................................................................................... 48
4.2 Power cycle and cooling system ........................................................................................................ 50
4.3 Simulation Inputs .............................................................................................................................. 51
5. Simulation, optimization and comparison 57
5. 1 Simulation of base design (Andasol) ................................................................................................ 57
5.1.1 Andasol in Spain ......................................................................................................................... 57
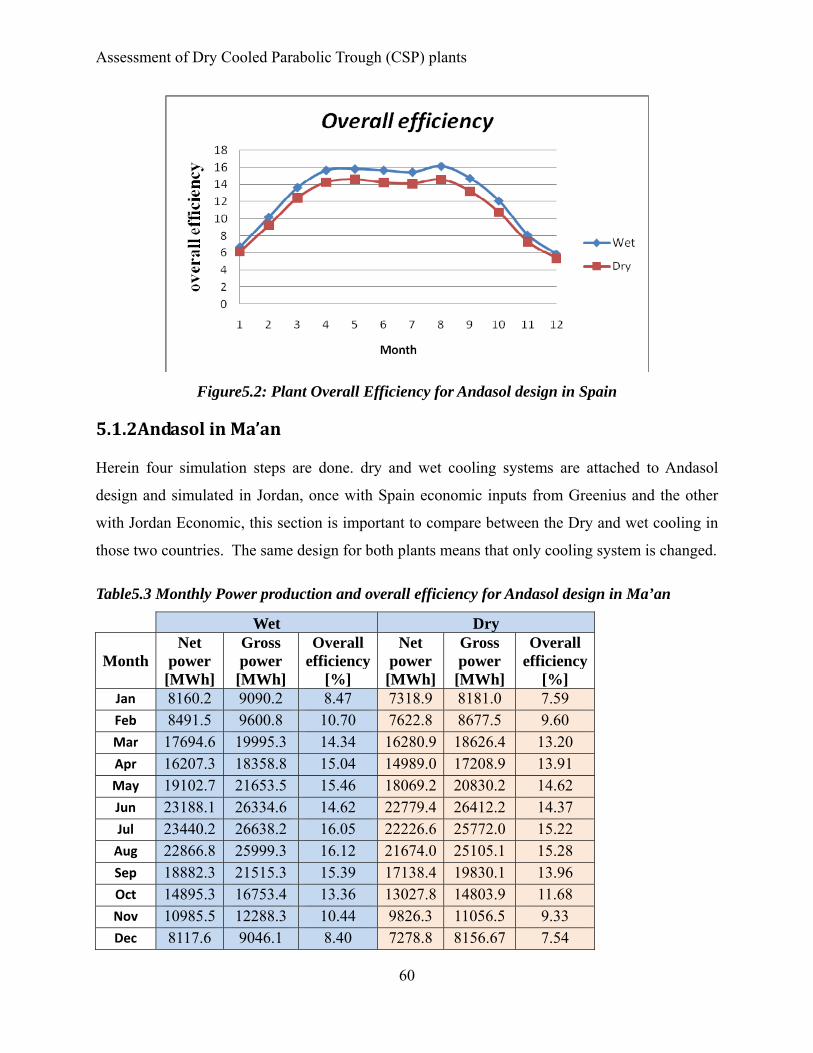
5.1.2Andasol in Ma’an ......................................................................................................................... 60
5.2 Optimization of Ma’an plant ............................................................................................................. 63
5.2.1 Wet Optimization ....................................................................................................................... 64
5.2.2 Dry Optimization ........................................................................................................................ 69
5.3 Technical Comparison between wet and dry cooling in Ma’an ......................................................... 74
5.3.1 Same design ............................................................................................................................... 75
5.3.2 Optimized design ........................................................................................................................ 77
5.4 Economic Comparison between wet and dry cooling in Ma’an ........................................................ 84
5.5 Suggestions to make the project economically feasible ................................................................... 87
5.5.1 Minimum required tariff ............................................................................................................ 88
5.5.2 Minimum required grant ............................................................................................................ 90
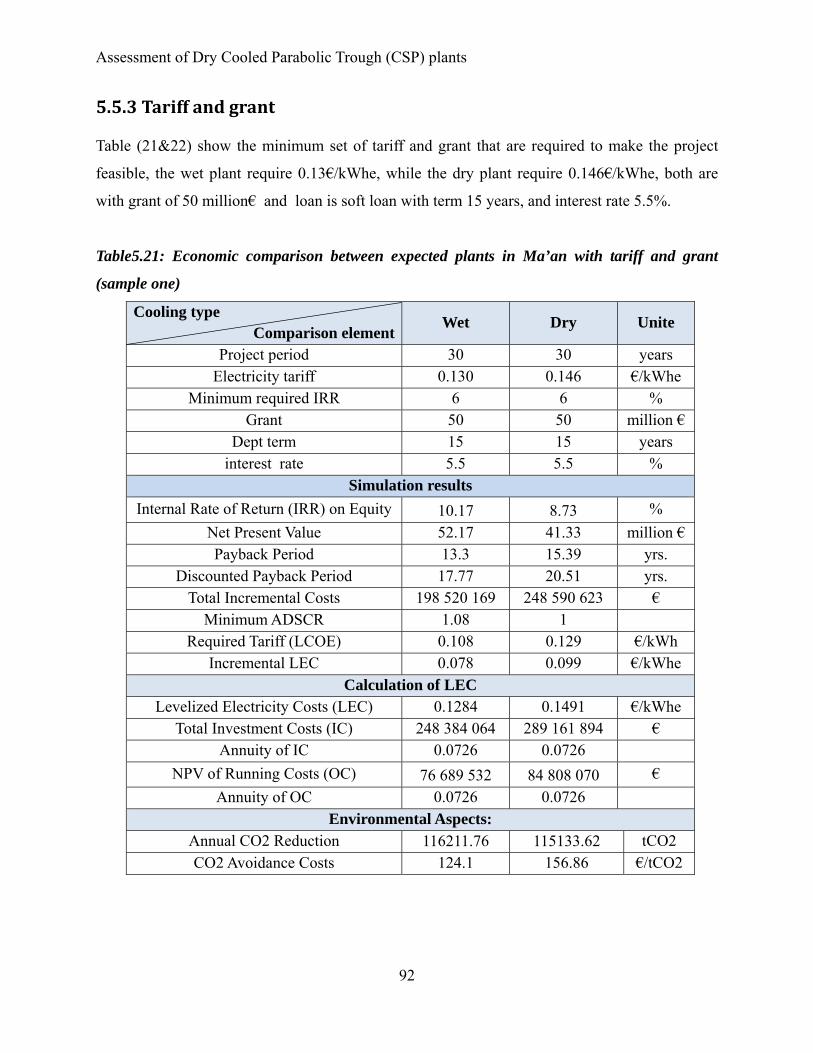
5.5.3 Tariff and grant ........................................................................................................................... 92
6. Economic Analysis 97
6.1 Introduction: ..................................................................................................................................... 97
6.2 Electricity Prices ................................................................................................................................ 97
6.3 Environmental impacts ..................................................................................................................... 97
6.3.1 Plant construction: ..................................................................................................................... 98
6.3.2 Plant operation: ......................................................................................................................... 98
6.3.3 CO2 emission reduction ........................................................................................................... 100
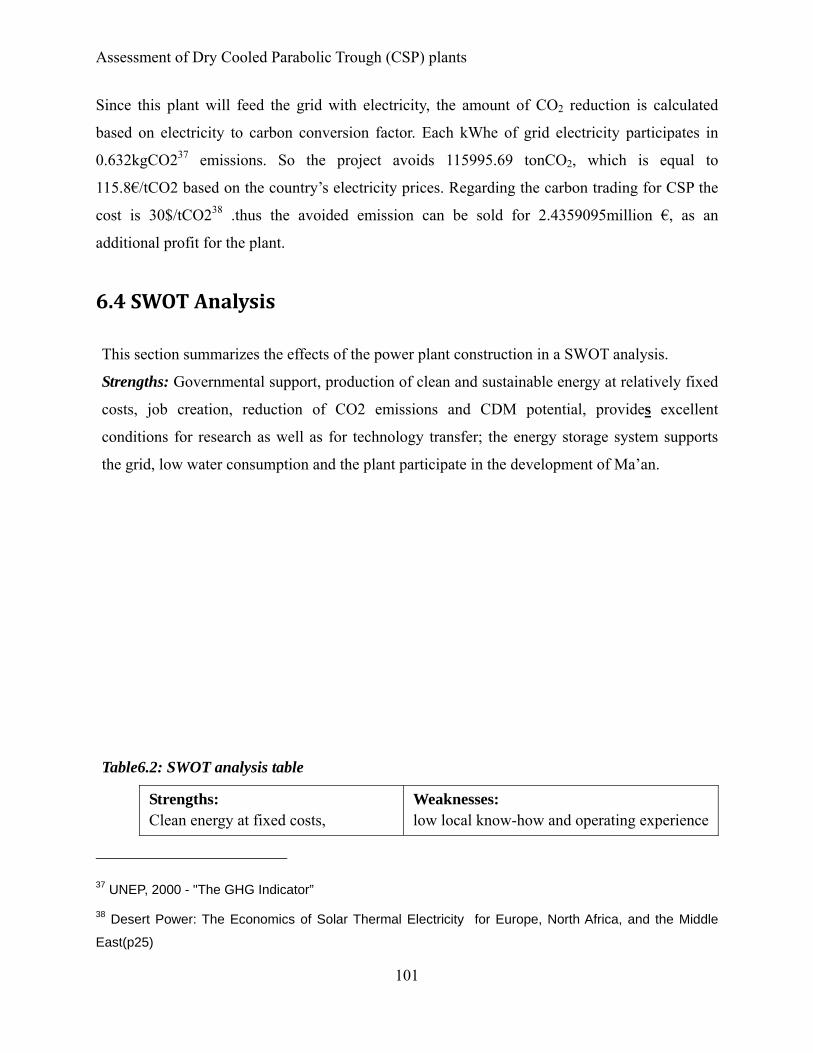
6.4 SWOT Analysis ................................................................................................................................. 101
6.5 sensitivity analysis ........................................................................................................................... 102
7. Conclusions 106
8. Recommendations 108
Page 5
Assessment of Dry Cooled Parabolic Trough (CSP) plants
5
List of Tables
Table2.1: Selected properties of SKAL‐ET150 collector. ................................................................ 25
Table4.1:Ma'an pre‐design similar to Andasol.............................................................................. 48
Table4.2: Power block design conditions for wet and dry ............................................................ 51
Table4.3: Simulation inputs for project site .................................................................................. 52
Table4.4: Simulation inputs for solar field .................................................................................... 54
Table4.5: Simulation inputs for Storage and Power Block ............................................................ 55
Table5.1 Simulation results of Andasol design in Spain ................................................................ 58
Table5.2 Monthly Power production and overall efficiency for Andasol design in Spain ............ 57
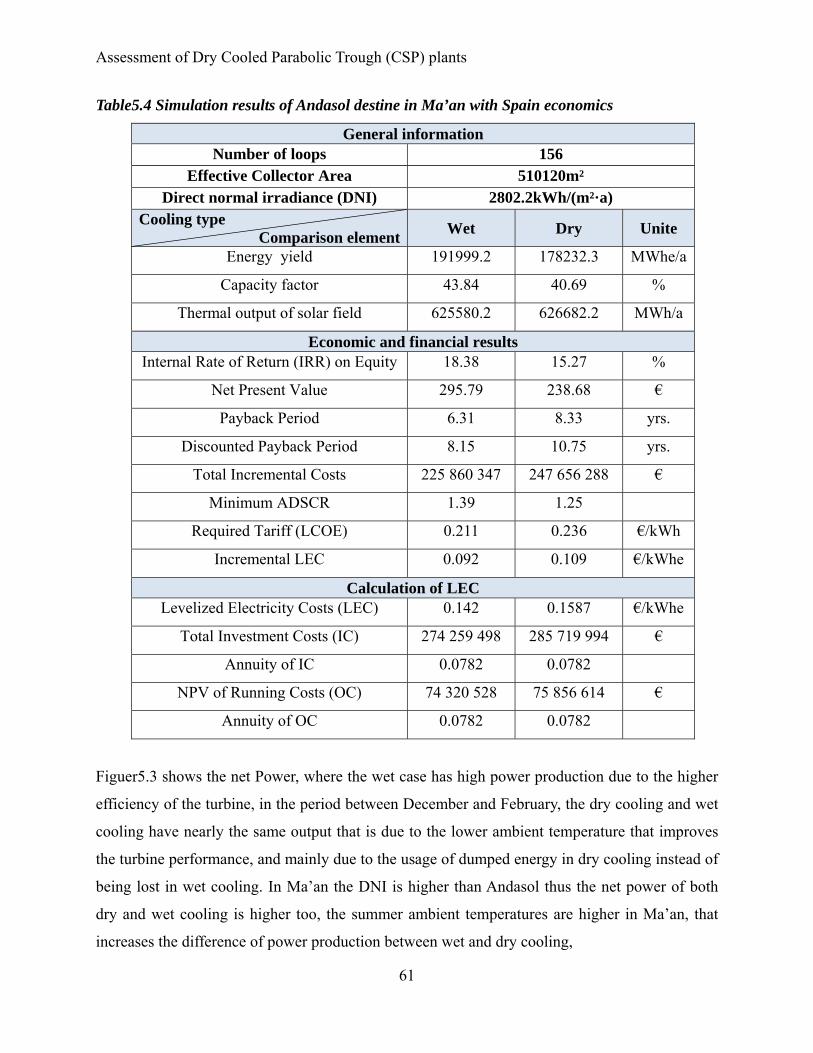
Table5.3 Simulation results of Andasol destine in Ma’an with Spain economics ......................... 61
Table5.4 Monthly Power production and overall efficiency for Andasol design in Ma’an ...... Error!
Bookmark not defined.
Table5.5: optimization steps of wet cooled case .......................................................................... 64
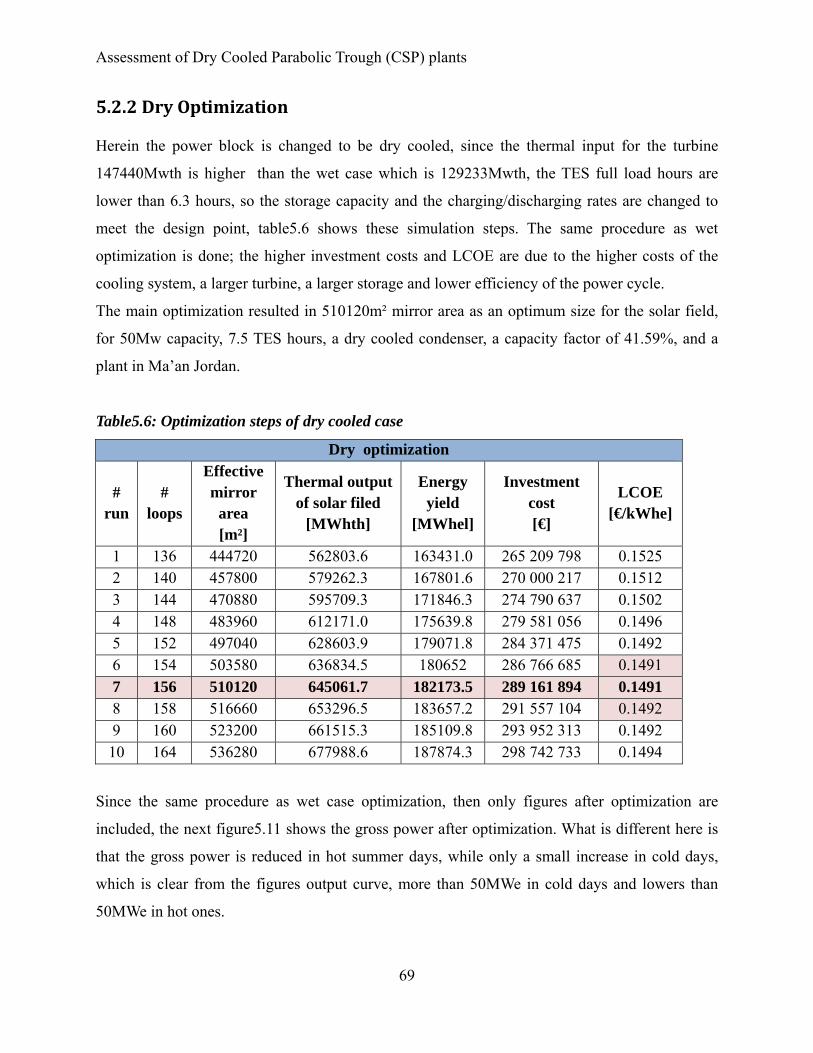
Table5.6: optimization steps of dry cooled case ........................................................................... 69
Table5.7: LCOE at different TES hours and solar multiple, for dry cooled plant in Ma’an ............ 72
Table5.8: Power output and overall plant efficiency for same design case. ................................. 75
Table5.9: Power output and overall plant efficiency for Optimized design case .......................... 78
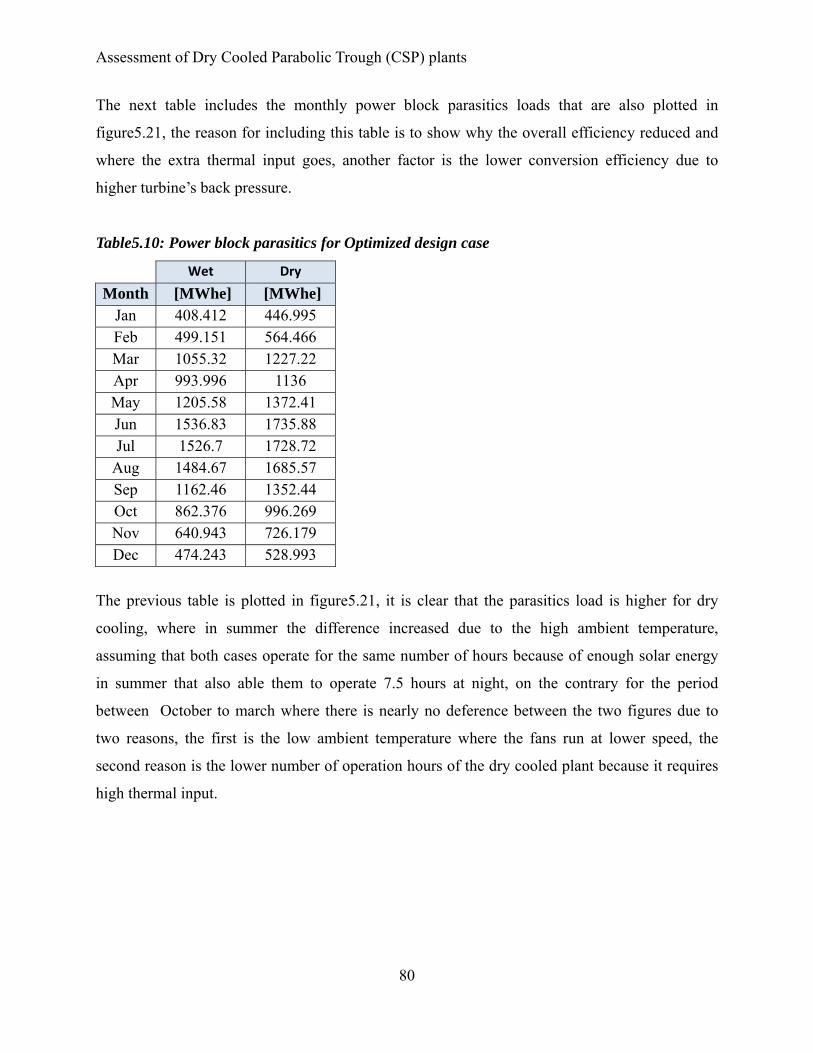
Table5.10: Power block parasitics for Optimized design case ....................................................... 80
Table5.11: Summary of all technical simulation results ............................................................... 82
Table5.12: Technical comparison between expected plants in Ma’an.......................................... 83
Table5.13: Economic Simulation inputs for Jordan (Costs, Financing, and Timing) ................... 85
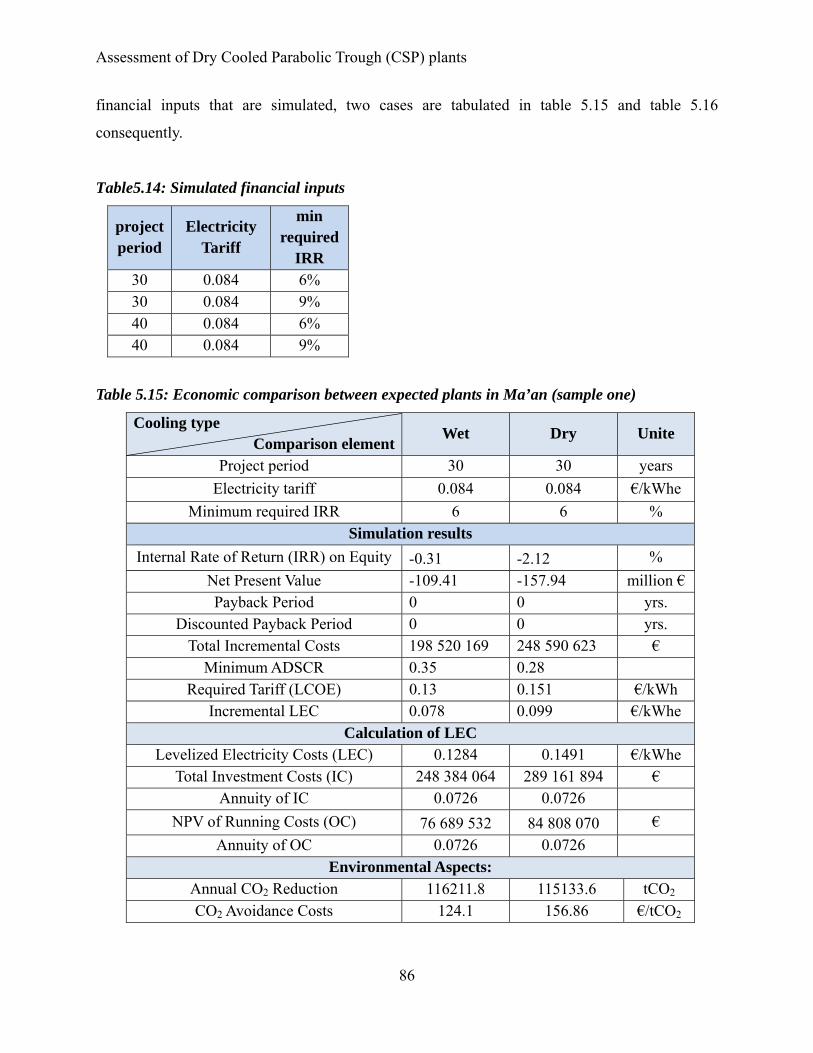
Table 5.15: Economic comparison between expected plants in Ma’an (sample one) .................. 86
Table5.16: Economic comparison between expected plants in Ma’an (sample two)................... 87
Table5.17: Economic comparison between expected plants in Ma’an with minimum required
tariff (sample one) ................................................................................................................ 88
Table5.18: Economic comparison between expected plants in Ma’an with minimum required
tariff (sample two) ................................................................................................................ 89
Table5.19: Economic comparison between expected plants in Ma’an with grant (sample one) . 90
Page 6
Assessment of Dry Cooled Parabolic Trough (CSP) plants
6
Table5.20: Economic comparison between expected plants in Ma’an with grant (sample two) . 91
Table5.21: Economic comparison between expected plants in Ma’an with tariff and grant
(sample one) ......................................................................................................................... 92
Table5.22: Economic comparison between expected plants in Ma’an with tariff and grant
(sample two) ......................................................................................................................... 93
Table5.23: Economic comparison between expected plants in Ma’an with tariff and grant
(sample three) ....................................................................................................................... 94
Table5.24: Economic comparison between expected plants in Ma’an with tariff and grant
(sample four) ......................................................................................................................... 95
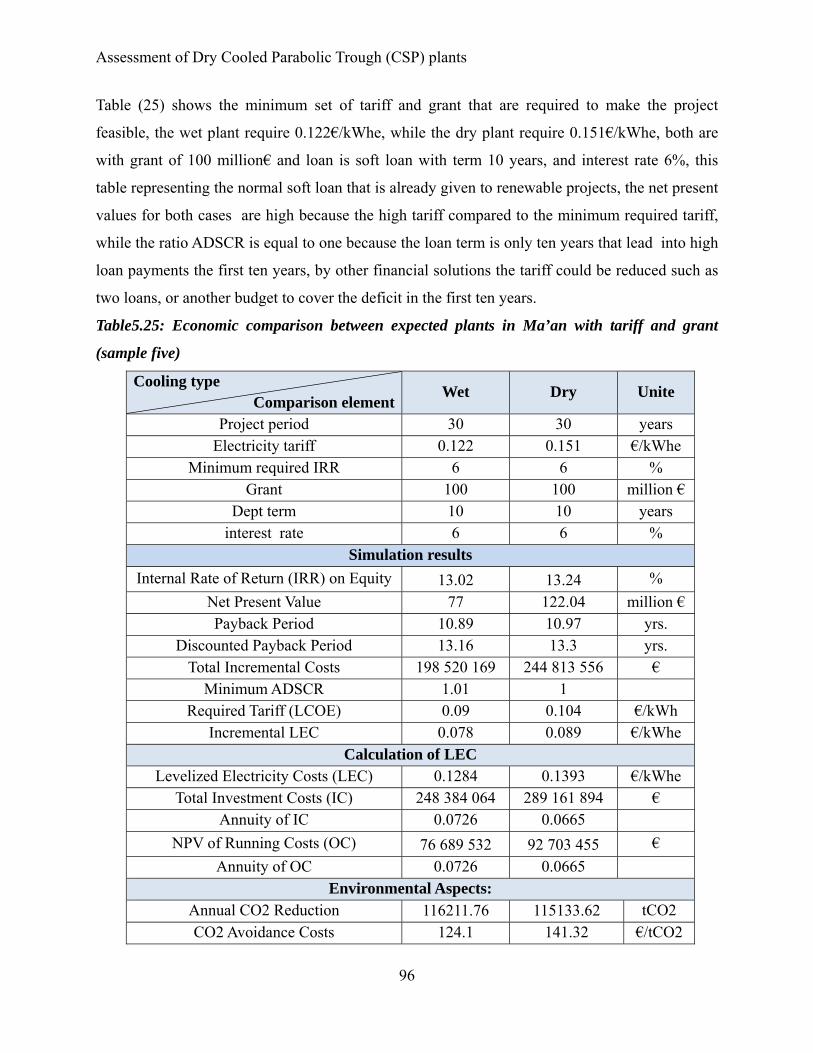
Table5.25: Economic comparison between expected plants in Ma’an with tariff and grant
(sample five) .......................................................................................................................... 96
Table6.1: Expected water consumption for Dry/Wet 50 MW with 7.5 TES in Ma’an‐Jordan ....... 99
Table6.4: Cost assumptions recommended by SAM software, adjusted to Greenius inputs ..... 103
Table6.5: Different simulation results for different specific solar filed cost, including the
recommended costs ............................................................................................................ 103
�
Page 7
Assessment of Dry Cooled Parabolic Trough (CSP) plants
7
List of Figures
Figure1.1: Fresnel lens based on the conventional lens ................................................................ 16
Figure1.2: Fresnel mirror based on the Fresnel lens ..................................................................... 16
Figure1.3: Fresnel collectors ......................................................................................................... 17
Figure1.4: Sketch of Tower Systems ............................................................................................ 18
Figure1.5: Central receiver filed and its receiver. Source DLR .................................................... 18
Figure1.6: Cavity receiver Pant and schematic of cavity receiver. (PS10, 20 Spain) ................... 19
Figure1.7: Sterling Generator Package. ........................................................................................ 20
Figure1.8: Sterling Dishes at PSA. ............................................................................................... 21
Figure1.9: Rays collecting mechanism ......................................................................................... 22
Figure1.10: Parabolic Trough collector, at PSA. .......................................................................... 23
Figure2.1: Schematic diagram of parabolic trough CSP plant with indirect two-tank storage. ... 24
Figure2.2: Two tanks molten salts storage of Andasol. ................................................................ 26
Figure2.3: Simple representation of a steam Rankine thermal power cycle. ................................ 28
Figure2.4: Schematic diagram of a cooling water system ........................................................... 29
Figure2.5: Cross flow natural draft cooling tower ........................................................................ 29
Figure2.6: Induced draft, double-flow crossflow tower. ............................................................... 30
Figure2.7: Direct dry cooled condenser ........................................................................................ 31
Figure2.8: Hybrid cooling systems use an air-cooled condenser and a wet-cooled condenser in
parallel. ................................................................................................................................. 32
Figure3.1: Best locations for CSP. ............................................................................................... 33
Figure3.2: Exclusion map for MENA region. ............................................................................... 34
Figure3.3: Plant location. .............................................................................................................. 35
Figure3.4: Picture from MDA site. ............................................................................................... 36
Figure3.5: Meteonorm main user window. ................................................................................... 40
Figure3.6: One day clear sky irradiance in Ma’an. ....................................................................... 41
Figure3.7: Mean Monthly Diurnal of DNI, based on enerMENA station ................................... 44
Figure3.8: Mean Monthly Diurnal of DNI, based on Meteonorm data ........................................ 44
Figure3.9: Monthly plot of hourly averaged dry bulb temperature in Ma’an. .............................. 46
Page 8
Assessment of Dry Cooled Parabolic Trough (CSP) plants
8
Figure3.10: Duration curve of dry bulb temperature. ................................................................... 47
Figure4.1: layout of Andasol plant ............................................................................................... 49
Figure4.2: Process Matrix for 50 MW Dry Cooled Power Block ................................................ 50
Figure4.3: Process for Greenius simulation .................................................................................. 51
Figure5.1: Monthly Net Power for Andasol design in Spain ........................................................ 59
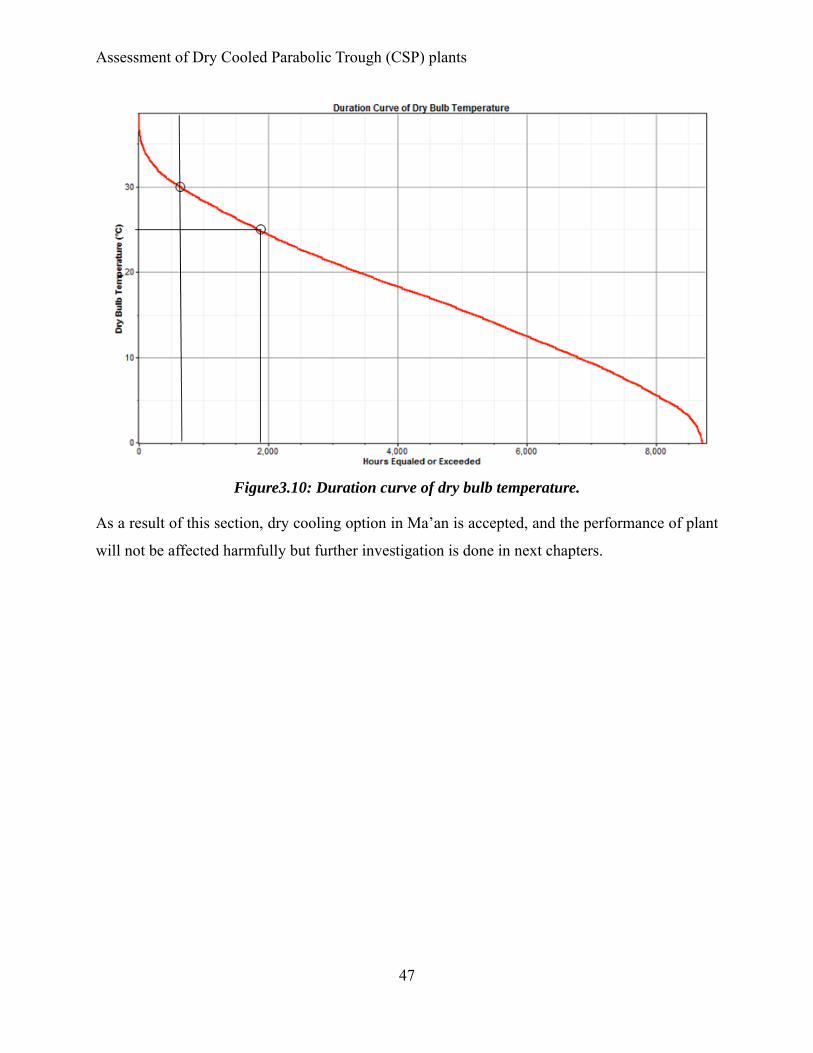
Figure5.2: Plant Overall Efficiency for Andasol design in Spain ................................................. 60
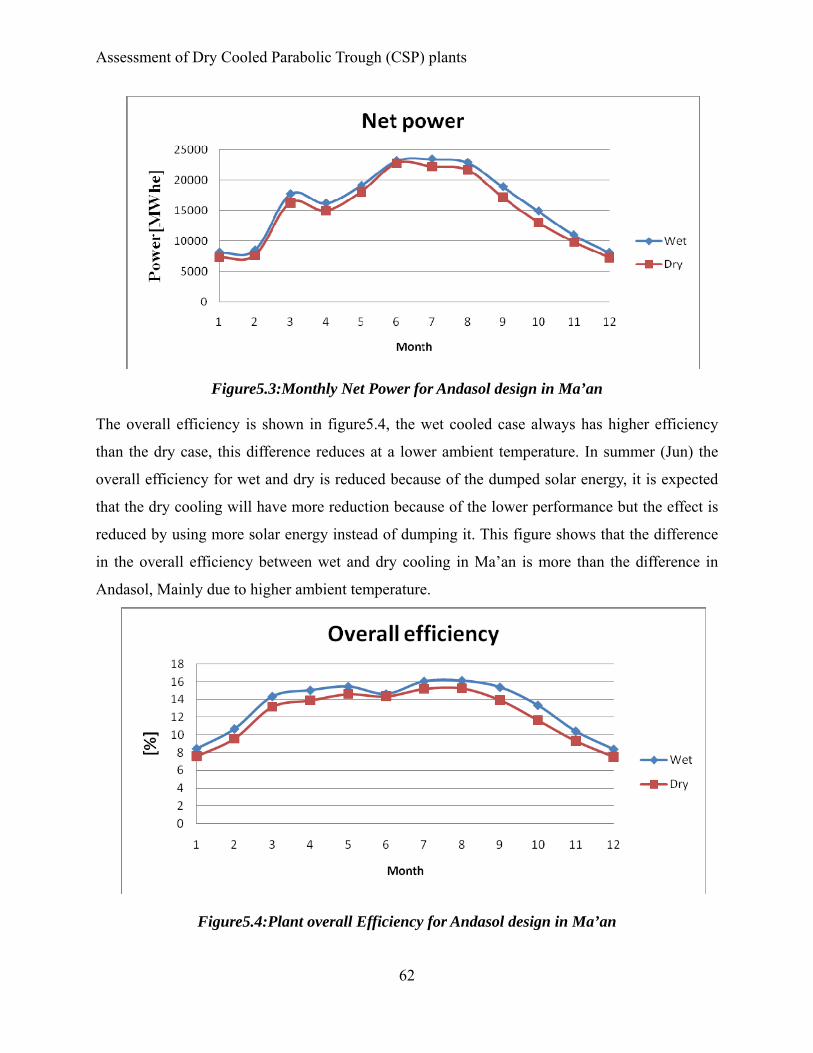
Figure5.3:Monthly Net Power for Andasol design in Ma’an ....................................................... 62
Figure5.4:Plant overall Efficiency for Andasol design in Ma’an ................................................. 62
Figure5.5:Gross electrical power of wet case,before optimization ............................................... 65
Figure5.6:Gross electrical power of wet case,after optimization ................................................. 65
Figure5.7:Dumped solar energy of wet case,before optimization ............................................... 66
Figure5.8:Dumped solar energy of wet case,after optimization .................................................. 67
Figure5.9:Charging and discharging of TES of wet case,before optimization ............................. 68
Figure5.10:Charging and discharging of TES of wet case,after optimization .............................. 68
Figure5.11:Gross electrical power of dry case,after optimization ................................................ 70
Figure5.12:Dumped solar energy of dry case,after optimization................................................. 70
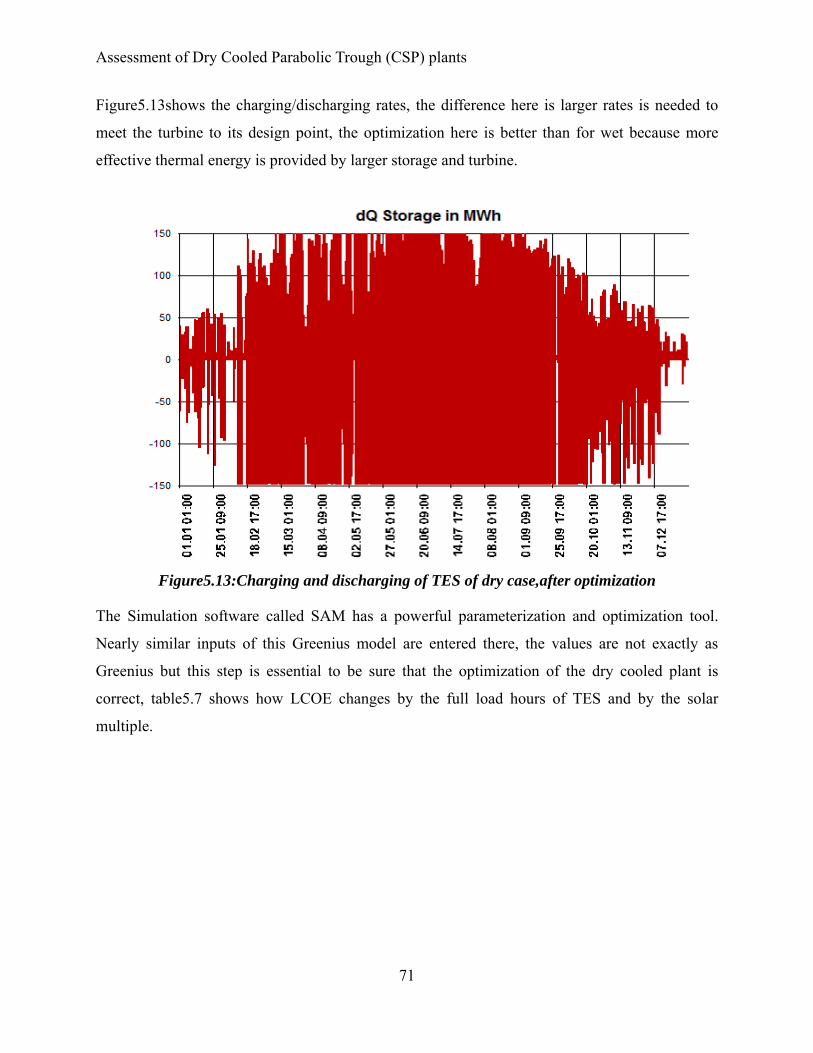
Figure5.13:Charging and discharging of TES of dry case,after optimization .............................. 71
Figure5.14: Contour representation of LCOE as function of solar multiple and storage hours ... 73
Figure5.15: plot of LCOE as function of solar multiple for each TES capacity .......................... 74
Figure5.16: Monthly Net power for same design ......................................................................... 76
Figure5.17: Monthly parasitics loads for same design ................................................................. 76
Figure5.18: Monthly overall efficiency for same design .............................................................. 77
Figure5.19: Monthly Net power for Optimized design case ......................................................... 79
Figure5.20: Monthly overall efficiency for Optimized design case ............................................. 79
Figure5.21: Dry cooled power block parasitics for Optimized design case ................................. 81
Figure5.22: main operational charctersitics of the expexted dry plant in ma’an,(23-Jun) ........... 84
Figure6.1: LCOE senstivity analysis .......................................................................................... 105
Page 9
Assessment of Dry Cooled Parabolic Trough (CSP) plants
9
List of Symbols
CSP Solar Thermal Power
CO2 Carbon dioxide
DAR Direct Absorption Receiver
DSCR Debt Service Coverage Ratio
Cp Specific Energy
GDP Gross Domestic Product
GHG Greenhouse Gas
Gw Gigawatt
Gwh Gigawatt hour
HTF Heat Transfer Fluid
HEX Heat exchanger
IPP Independent Power Producer
IRR Internal Rate of Return
K Kelvin
J Joule
KfW Kreditanstalt für Wiederaufbau
kg Kilogram
kv Kilovolt
Kilowatt hour (thermal / electrical) kWh ther / el
LCOE Levelized Cost of Electricity
LS Type of parabolic collector Luz system
MENA Middle East and North Africa
Mtoe Million ton oil equivalent
MW Megawatt
NERL National Renewable Energy Laboratory
NPV Net Present Value
O&M Operation & Maintenance
Page 10
Assessment of Dry Cooled Parabolic Trough (CSP) plants
10
PPA Power Purchasing Agreement
R&D Research and Development
RE Renewable Energy
SAM System Advisor Model
SST Siemens Steam Turbine
SWOT Strength, Weakness, Opportunity, Thread
T Temperature in Kelvin
TSO Transmission System Operator
TWh Tera watt hour
UNEP United Nations Environment Programme
W Watt
Page 11
Assessment of Dry Cooled Parabolic Trough (CSP) plants
11
Abstract
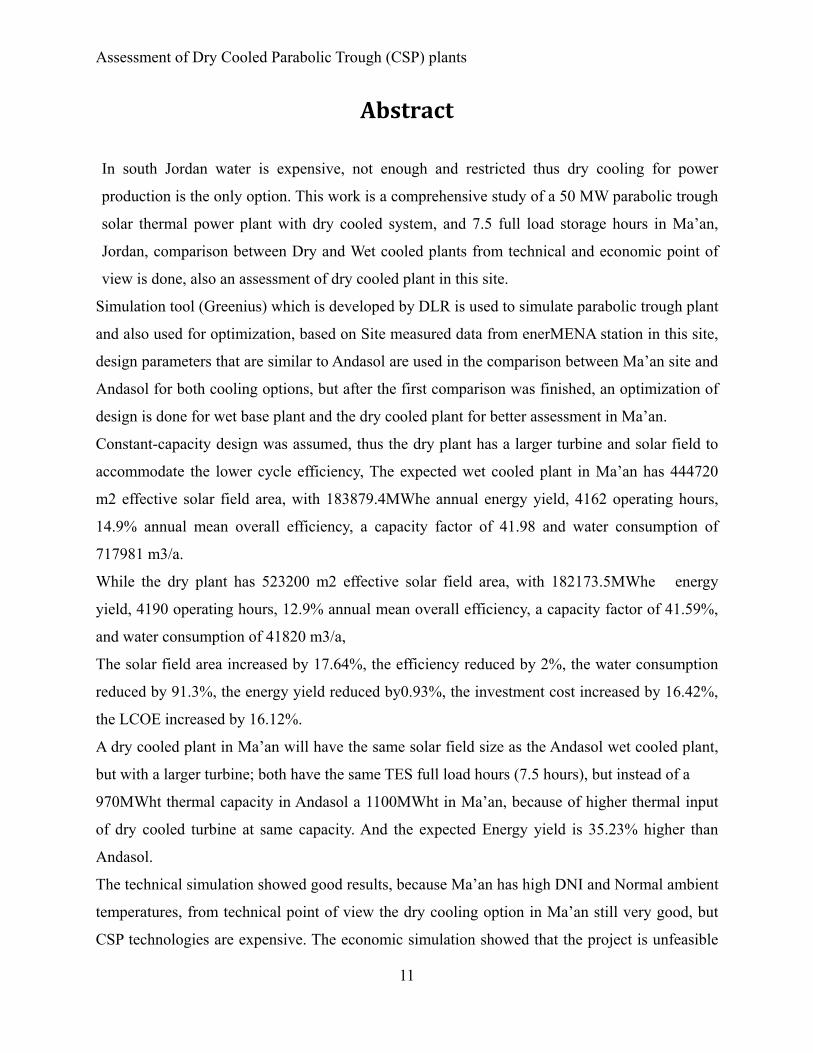
In south Jordan water is expensive, not enough and restricted thus dry cooling for power
production is the only option. This work is a comprehensive study of a 50 MW parabolic trough
solar thermal power plant with dry cooled system, and 7.5 full load storage hours in Ma’an,
Jordan, comparison between Dry and Wet cooled plants from technical and economic point of
view is done, also an assessment of dry cooled plant in this site.
Simulation tool (Greenius) which is developed by DLR is used to simulate parabolic trough plant
and also used for optimization, based on Site measured data from enerMENA station in this site,
design parameters that are similar to Andasol are used in the comparison between Ma’an site and
Andasol for both cooling options, but after the first comparison was finished, an optimization of
design is done for wet base plant and the dry cooled plant for better assessment in Ma’an.
Constant-capacity design was assumed, thus the dry plant has a larger turbine and solar field to
accommodate the lower cycle efficiency, The expected wet cooled plant in Ma’an has 444720
m2 effective solar field area, with 183879.4MWhe annual energy yield, 4162 operating hours,
14.9% annual mean overall efficiency, a capacity factor of 41.98 and water consumption of
717981 m3/a.
While the dry plant has 523200 m2 effective solar field area, with 182173.5MWhe energy
yield, 4190 operating hours, 12.9% annual mean overall efficiency, a capacity factor of 41.59%,
and water consumption of 41820 m3/a,
The solar field area increased by 17.64%, the efficiency reduced by 2%, the water consumption
reduced by 91.3%, the energy yield reduced by0.93%, the investment cost increased by 16.42%,
the LCOE increased by 16.12%.
A dry cooled plant in Ma’an will have the same solar field size as the Andasol wet cooled plant,
but with a larger turbine; both have the same TES full load hours (7.5 hours), but instead of a
970MWht thermal capacity in Andasol a 1100MWht in Ma’an, because of higher thermal input
of dry cooled turbine at same capacity. And the expected Energy yield is 35.23% higher than
Andasol.
The technical simulation showed good results, because Ma’an has high DNI and Normal ambient
temperatures, from technical point of view the dry cooling option in Ma’an still very good, but
CSP technologies are expensive. The economic simulation showed that the project is unfeasible
Page 12
Assessment of Dry Cooled Parabolic Trough (CSP) plants
12
if the energy to the grid is sold at the same price of Jordanian electricity 0.084€/kWhe, without
feed in tariff. Different suggested financial scenarios have been simulated to make the project
feasible. The minimum required tariff 0.17€/kWhe, or a grant of 163.3 million €, or
(0.146€/kWhe with 50 million €), or (0.13€/kWhe with 100 million €)
Page 13
Assessment of Dry Cooled Parabolic Trough (CSP) plants
13
Chapter 1
Introduction 1.1 Background The world population is increasing and the thus their needs, mainly power, food and water.
Electrical power has been generated for the last two hundred years depending on conventional
resources in relatively efficient ways. However, these resources are depleting and therefore
limited so that their costs increase steadily. Moreover the available conversion techniques are
associated with the emission of greenhouse gases. These restrictions and negative effects lead the
world to search for alternative resources. In this regard, the utilization of renewable energy
resources should be a good solution, in which some technologies are well developed and others
still under development. Solar energy that is represented by solar radiation is one of the most
promising renewable sources. Photovoltaic, which is direct conversion from light energy into
electricity, and concentrated solar thermal power called also concentrated solar power (CSP) are
the two known technology types to utilize the solar energy. While PV is suitable for small or off-
grid solutions, CSP showed attractive features to be installed in large scale. On-grid CSP power
plants with a thermal storage should stabilize the grid secure the dispatchability of power.
1.2Research need CSP direct normal irradiation which is very high in deserts rather than the cloudy and humid
coastal areas, but such as conventional plants, require water for cleaning. Normally conventional
plants are sited near good water sources coastal areas. If water is expensive not enough or
restricted, dry cooling an option, it is clear that the use of such a system is not to compete with
wet cooling but it be used in many attractive locations for CSP.
Previous studies done by NREL and DLR showed that dry cooling could save more than 90% of
water consumption1, on the other hand, the overall performance of such a power plant is reduced
under higher ambient temperatures. Such losses would be compensated inter alia by increasing
the thermal energy input, from the solar, field in CSP case by increasing its size, and through the
1 Water Use in Parabolic Trough Power Plants: Summary Results from WorleyParsons' Analyses.P(25)
Page 14
Assessment of Dry Cooled Parabolic Trough (CSP) plants
14
selection of turbines. Hence the design of a CSP plant, especially its solar field, depends also on
which cooling system is used; a bigger Solar field for dry cooling than of that for wet cooling for
the same power output. This results in higher investment costs for dry cooled power plants than
those for wet cooled plant with the same capacity.
CSP power plants require huge initial investments and any additional costs, e.g. the cooling
tower and a bigger solar field, are undesired and would threaten securing project finance. In this
context a trade-off between all options should be made for each specific site to know whether to
use dry cooling or not. For many locations, dry cooling is the only affordable option and
therefore must be considered.
1.3 Objectives The main objective of this master thesis is to evaluate the use of dry and wet cooled CSP
parabolic plants in Ma’an site in Jordan. This will be done by establishing a comparison between
both options. The comparison is held also for the technical performance and the economics of the
plant options, to show that high DNI could compensate for the defects of a dry plant. This is to
prove that a larger solar field produces more electricity in days of low ambient temperature,
finally an assessment for a dry cooled plant in Ma’an site will be resulted.
1.4 Methodology First of all a literature review is done, which are about comparison of cooling options for
parabolic trough CSP plants, assessment of power plants, site selection and simulation tools. Site
measured data from enerMENA station in Ma’an is used.
Simulation tool (Greenius) which is developed by DLR is used to simulate parabolic trough plant
and also used for optimization,
The pre-design parameters are decided to be similar to Andasol, that gave a good comparison
reference, but after the first comparison is finished, an optimization of design is done for better
assessment in Ma’an.
The Comparison between dry and wet is done based on identical input parameters, the weather
input data is only changed when comparing the other site which is Andasol in Spain.
Three steps are done, simulation of Andasol design in Spain and in Jordan as a reference,
optimization of wet/dry that made the design suitable to Ma’an site, and finally
Page 15
Assessment of Dry Cooled Parabolic Trough (CSP) plants
15
Chapter2
Parabolic trough power plants 2.1 Overview of CSP technologies Concentrated solar power technologies are categorized to point focus and line focus technologies
according to their focal point geometry. In the point focus the sun rays concentrated on one point
by three dimensional collectors, result in high rays density that lead to high temperature, two of
its main technologies are the tower and dish. The line focusing collectors concentrate incident
rays on a line resulting moderate temperatures, also two of its main types are the parabolic
trough and Fresnel.
The solar energy is then evacuated from the focus into the power cycle by heat transfer mediums
such as water, oil, air, gas, or sometimes liquid salts. The collected heat can be stored in an
isolated storage or it can be directly used. Herein a description of elements used in the previous
technologies will be discussed, but first it is important to define the concentration ratio” the
ability of a collector to concentrate or elevate the intensity of solar radiation”, the theoretical
concentration ratio which is the ratio of the aperture area to the absorber area, and the actual
concentration ratio which is the ratio of the solar flux absorbed by the absorber to the solar flux
received at the aperture.
2.1.1 Fresnel
This technology is based on Fresnel mirrors to concentrate the sun rays on a line, it is also based
on the Principle of Fresnel lens; named after the French inventor Augustin Fresnel in1819; which
is described schematically in figure1.1, he aimed to use this technology for house lighting by
reducing the material and the price of the conventional lens, now the same principle is used in
these types of concentrators.
Page 16
Assessment of Dry Cooled Parabolic Trough (CSP) plants
16
Figure1.1: Fresnel lens based on the conventional lens2
The following figure shows the principle of the Fresnel concentrator, which is simply the
opposite of a lens, by replacing the segments of Fresnel lens by mirrors.
Figure1.2: Fresnel mirror based on the Fresnel lens3
2 http://en.wikipedia.org/wiki/File:Fresnel_lens.svg
3 DLR enerMENA capacity building course eM-CB01:U4
Page 17
Assessment of Dry Cooled Parabolic Trough (CSP) plants
17
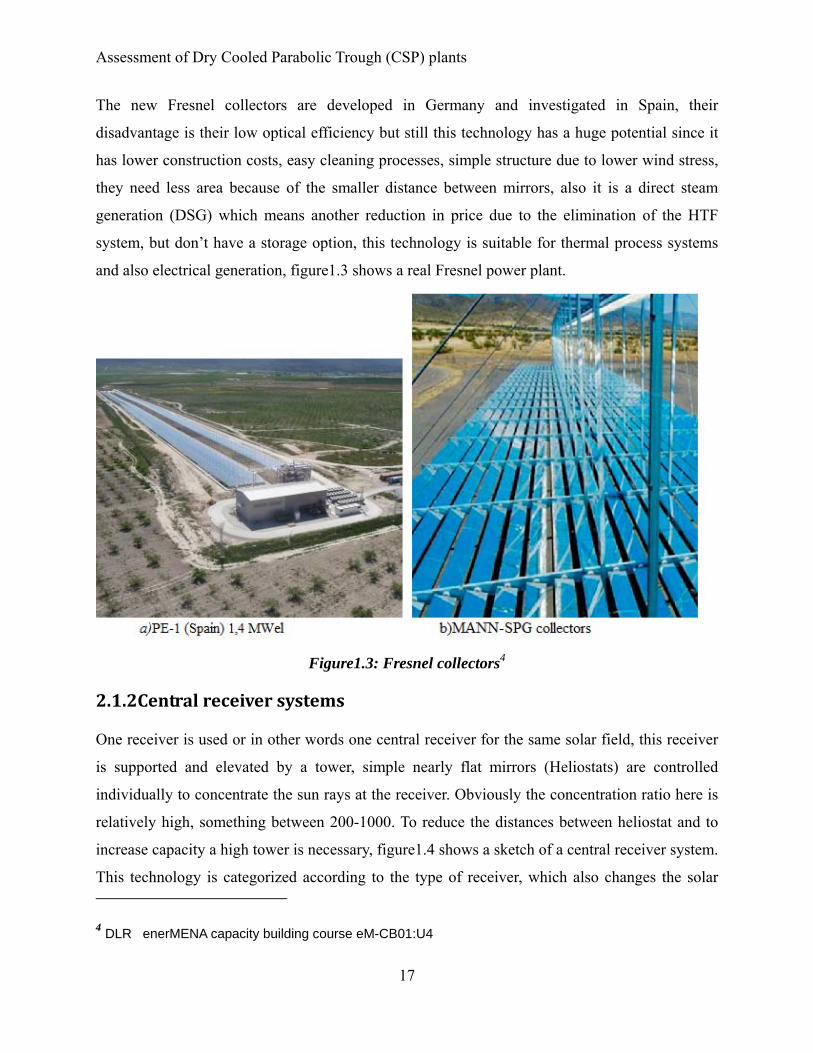
The new Fresnel collectors are developed in Germany and investigated in Spain, their
disadvantage is their low optical efficiency but still this technology has a huge potential since it
has lower construction costs, easy cleaning processes, simple structure due to lower wind stress,
they need less area because of the smaller distance between mirrors, also it is a direct steam
generation (DSG) which means another reduction in price due to the elimination of the HTF
system, but don’t have a storage option, this technology is suitable for thermal process systems
and also electrical generation, figure1.3 shows a real Fresnel power plant.
Figure1.3: Fresnel collectors4
2.1.2Central receiver systems
One receiver is used or in other words one central receiver for the same solar field, this receiver
is supported and elevated by a tower, simple nearly flat mirrors (Heliostats) are controlled
individually to concentrate the sun rays at the receiver. Obviously the concentration ratio here is
relatively high, something between 200-1000. To reduce the distances between heliostat and to
increase capacity a high tower is necessary, figure1.4 shows a sketch of a central receiver system.
This technology is categorized according to the type of receiver, which also changes the solar
4 DLR enerMENA capacity building course eM-CB01:U4
Page 18
Assessment of Dry Cooled Parabolic Trough (CSP) plants
18
field design.
Figure1.4: Sketch of Tower Systems
External receiver:
This type of receiver has high an acceptance angle thus it can receive solar rays from all
directions, also it is simply constructed but it’s subjected to high thermal losses. Figure1.5 shows
the receiver and its solar field. The development of this type is in the coating of the receiver
which increases absorptivity and reduces emissivity.
Figure1.5: Central receiver filed and its receiver.5
5 DLR
Page 19
Assessment of Dry Cooled Parabolic Trough (CSP) plants
19
Mainly this receiver is tubular which means a set of tubes are a direct heat exchanger from the
solar heat into a fluid, the fluid circulates inside these tubes, it should withstand high
temperatures, for that reason molten salts are used here which are also stored well.
Cavity receiver:
In the cavity receiver, the concentrated radiation will be admitted through an aperture to be
absorbed by the internal cavity walls, it is subjected to lower losses but has a smaller acceptance
angle. Here the absorption techniques are deferent and still under development, types of such
receivers are Tubular Receiver with pressurized air, Volumetric Receiver which is similar to the
previous one but without tubes, and Direct Absorption Receiver (DAR) where a moving working
fluid passes through a radiation flux and absorbs radiation directly. Figure1.6 shows a cavity
receiver schematic and a real power plant.
Figure1.6: Cavity receiver Pant and schematic of cavity receiver. (PS10, 20 Spain)6
2.1.3 Dish‐Stirling
The technology here uses two dimensional mirrors to concentrate normal irradiance on one point,
the surface mirror has a parabolic shaped mirror able to rotate along two axis; to make its
manufacturing easy they divided the surface into several segments. At the focal point a high
density of solar flux exists due to high concentration ratio (over that 1000), and thus high
temperatures and high performance. What’s deferent here is that a Stirling generator located in
6 http://en.wikipedia.org/wiki/File:PS20andPS10.jpg
Page 20
Assessment of Dry Cooled Parabolic Trough (CSP) plants
20
the focal point is used to convert heat into electricity directly. Figure1.7 shows a Stirling
generator’s components for a system at PSA, used by DLR in the dish research and development.
Figure1.7: Sterling Generator Package.7
Each dish system is a complete power production device due to the high temperatures and the
help of Stirling, this leads to a distributed generation, that means to generate electricity
separately and then collecting it, this is not found in Tower and parabolic trough which are
centralized power systems.
The main design problem is related to the structure which has to withstand high loading stress of
gravity, bending moments, tensional loads and structural forces due to thermal expansion, and
also high wind forces due to large aperture area. Figure1.8 shows a group of dishes with different
designs at PSA.
7 DLR
Page 21
Assessment of Dry Cooled Parabolic Trough (CSP) plants
21
Figure1.8: Sterling Dishes at PSA.8
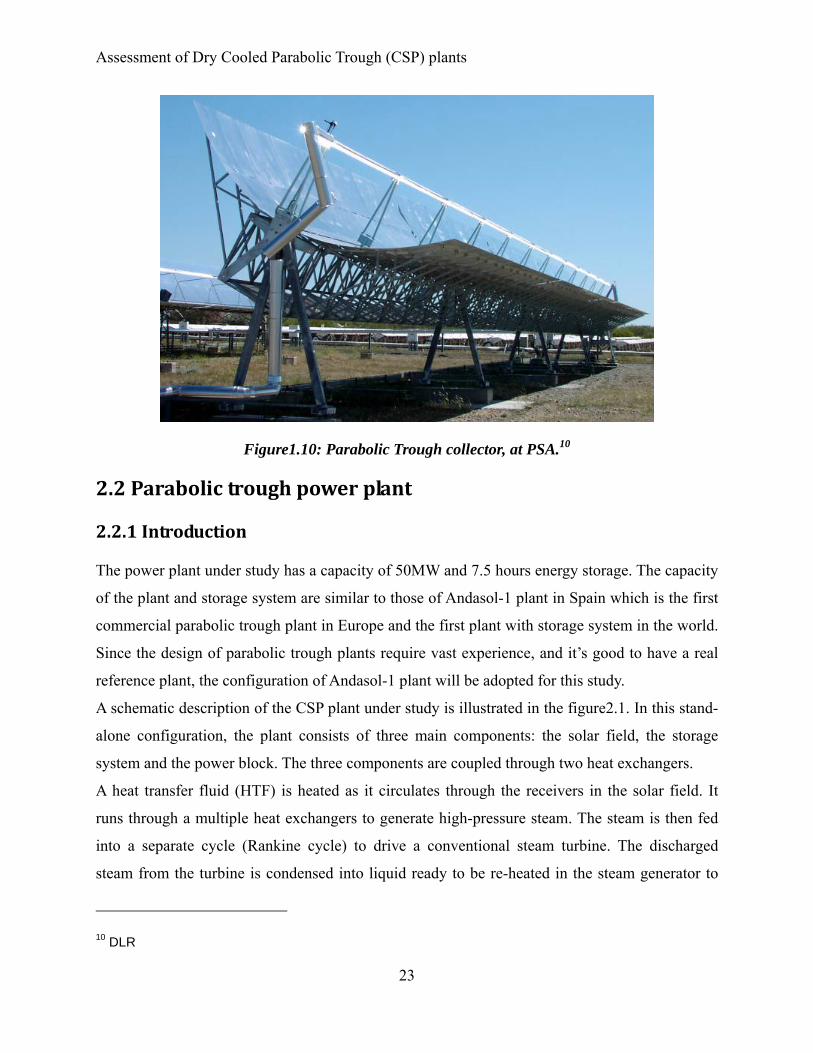
2.1.4 Parabolic Trough
A Parabolic Trough Collector is simply a parabolic shaped mirror that reflects the direct normal
irradiation from its normal axis to its axis, as shown in figure1.9, the cross section of the mirror
is a parabola curve (Trough) for that reason it is named, the typical curvature radius is between 1
to 4 and the focal length is half of the curvature radius, and the typical concentration ratio is
around 80 but they could reach higher values by lager accurate troughs. This shape is extended
along an axis that passes through the focus which results in a focal line, where a heat collecting
element; also called absorber tube; is placed. Mirrors and tubes are mounted on a steel structure
to fix and support the assembly, see figure1.10, this assembly tracks the sun as it moves across
the sky around the trough axis, and the other axis is fixed normally aligned North –South.
8 DLR enerMENA capacity building course eM-CB01:U6
Page 22
Assessment of Dry Cooled Parabolic Trough (CSP) plants
22
Figure1.9: Rays collecting mechanism9
The fluid inside the Absorber tube –usually synthetic Oil - heats up, thus the collected energy is
evacuated by circulating this fluid to a heat exchanger, that transmits heat to water cycle inside a
conventional steam cycle, this process is called indirect steam generation or two cycles, the other
option is to be used directly if the HTF is water this technology is called direct steam generation
DSG or one cycle. the attractiveness of this technology are clear, the potential of storage in the
indirect steam generation where the oil or molten salts are used to store huge amounts of thermal
energy, and it can be used on demand or whenever the sun is not shining.
This technology is justified and used in USA since 1981, recently new power plants are installed
-hybrid systems or only solar-, in Spain, Egypt, Morocco, Algeria and UAE. The solar field cost
is still relatively expensive.
9 DLR enerMENA capacity building course eM-CB01:U4
Page 23
Assessment of Dry Cooled Parabolic Trough (CSP) plants
23
Figure1.10: Parabolic Trough collector, at PSA.10
2.2 Parabolic trough power plant
2.2.1 Introduction
The power plant under study has a capacity of 50MW and 7.5 hours energy storage. The capacity
of the plant and storage system are similar to those of Andasol-1 plant in Spain which is the first
commercial parabolic trough plant in Europe and the first plant with storage system in the world.
Since the design of parabolic trough plants require vast experience, and it’s good to have a real
reference plant, the configuration of Andasol-1 plant will be adopted for this study.
A schematic description of the CSP plant under study is illustrated in the figure2.1. In this stand-
alone configuration, the plant consists of three main components: the solar field, the storage
system and the power block. The three components are coupled through two heat exchangers.
A heat transfer fluid (HTF) is heated as it circulates through the receivers in the solar field. It
runs through a multiple heat exchangers to generate high-pressure steam. The steam is then fed
into a separate cycle (Rankine cycle) to drive a conventional steam turbine. The discharged
steam from the turbine is condensed into liquid ready to be re-heated in the steam generator to
10 DLR
Page 24
Assessment of Dry Cooled Parabolic Trough (CSP) plants
24
complete the cycle.
The thermal energy storage (indirect two-tank system) is charged when the output thermal power
of the solar field exceeds the power block requirements. Where the surplus heat is transferred to
the molten salt through a heat exchanger, the heated molten salt is stored in the hot salt tank.
Discharging salt from the hot tank to reheat the HTF occurs in the same heat exchanger except
the flow is reversed when the solar field does not provide the sufficient power for steam
generation.
Figure2.1: Schematic diagram of parabolic trough CSP plant with indirect two-tank storage.11
2.2.2 Solar field
The major element in the solar field is the collector; the field consists of parabolic trough
collectors which are currently the most proven solar thermal electric technology. This is
primarily due to nine large commercial-scale solar power plants since 1984 with a total capacity
of 354MW.
SKAL-ET150 collector with a continuous tracking system will be used for solar radiation
collection. Some selective properties of the collector are presented in table2.1 below. The size of 11 Solar Millennium (2008, p.13)
Page 25
Assessment of Dry Cooled Parabolic Trough (CSP) plants
25
the field aperture area will be similar to that in Andasol-1 which is 510,120m² with a solar
multiplier of 1.712. Given the fact that the DNI in Ma’an is greater than in Andasol-1, the annual
energy output is expected to be higher as will be demonstrated in chapter5, and more solar
energy will be dumped, thus the design should be optimized to have a better base when
compared with dry cooling.
The most widely used HTF is hydrocarbon oil, which has a wider liquid temperature range than
water, but a lower thermal capacity and higher viscosity. It is a eutectic mixture of two very
stable compounds, biphenyl (C12H10) and diphenyloxide (C12H10O).
Table2.1: Selected properties of SKAL-ET150 collector.13
Parameter Value Unite
Focal Length 1.71 m m
Average distance to focus 2.11 m m
HCE Absorber Radius 3.5 cm cm
HCE Length 4 m m
Aperture width 5.75 m m
Aperture area 817.5 m2
Length 150 m m
Number of modules 12 ---
Mirror reflectivity 93.5 %
Absorber absorptivity 96 %
Envelop transmissivity 96.3 %
Overall optical efficiency 78 %
2.2.3 Storage system
As mentioned herein before, the storage system consists of hot and cold water tanks. The storage
media is Nitrate molten salt (60% NaNO3 + 40% KNO3). The heat capacity, thermal conductivity 12 Solar Millennium (2008, p.8)
13 Herrmann, Nava (p.3)
Page 26
Assessment of Dry Cooled Parabolic Trough (CSP) plants
26
and viscosity of the salt are given as functions of temperature shown in the equations below14. In
addition, the salt has a high melting point (239 oC).
cp(T)=1443 +0.172 T [J/kg/K]
k(T) =0.443 +0.00019 +T [W/m/K]
μ(T) =0.001+22.714 -0.12 T +0.0002281T 2-0.0000001474 T 3 ) [Pa s]
The storage designed for Andasol provides the rated power output of the plant for 7.5 hours, the
main technical data of this storage is written down; a picture of this storage is shown in figure2.2
• Cold tank temperature: 292 oC
• Hot tank temperature: 386 oC
• Flow rate: 948 kg/s.
• 14 m height, 38 m diameter.
• 1085 MWh capacity = 7.5 equivalent hours = 28.500 tonnes.
Figure2.2: Two tanks molten salts storage of Andasol.15
14 Kopp (2004, p.16)
15 Solar Millennium (2008, p.18)
Page 27
Assessment of Dry Cooled Parabolic Trough (CSP) plants
27
2.2.4 Power block
The thermal energy will be transferred by the HTF to the power generation side through the heat
exchanger. The generation side consists of conventional Rankine steam cycle. Because of
thermal stability of HTF it is only kept up to working temperatures of 400 oC, the maximum
steam temperature in the power cycle will be nearly 370 oC16.
The steam turbine type is condensing turbine single reheat and six steam extractions. Siemens
turbine SST-700 is selected for this study, capacity and operation parameters of the turbine are as
follows:
‐ Nominal Capacity 50.0 MW.
‐ Conversion efficiency 38%.
‐ Turbine Inlet Conditions 100 bar 370°C, reheat 16.5 bar 370°C.
‐ Nominal Steam Flow 59 kg/s.
‐ Design Back Pressure 0.08 bar.
Cooling tower will cool the water that is used to condense the steam flowing out of the turbine
using water from the municipality despite the proximity of the plant to the sea, or using dry
cooling system. Because this part of the plant is very important to our study, the theory of
Rankine Cycle and the cooling options are discussed next.
Steam Rankine Power Cycle
Conventional coal plants and nuclear plants are Steam power plants; also here CSP parabolic
trough and sometimes tower technologies are based on such types of steam power plants. These
power cycles simply converts heat into work (figure2.3), it inputs high-quality thermal energy
from boiler or here by solar field, produce electric power, and reject low-quality heat at the
condenser and cooling system, The cooling phase is using heat sink which is the ambient .the
maximum conversion efficiency defined by the ideal thermal cycle efficiency (the Carnot
efficiency) is proportional to 1 minus the ratio of heat sink absolute temperature to the heat
source absolute temperature
16 Kopp (2004, p.16)
Page 28
Assessment of Dry Cooled Parabolic Trough (CSP) plants
28
Source
k
TT
EfficiencyCyc sin1le −=
The previous equation shows that the efficiency increases as the difference between the two
temperatures increases, also for the same source temperature but lower sink temperature we get
high efficiency or sometimes called better performance of the plant. Around this equation a lot
of research and development of CSP technologies is proceeding, for example changing the HTF
to reach high temperatures.
Figure2.3: Simple representation of a steam Rankine thermal power cycle.17
Cooling systems
Conventional Steam power plants, those operating on Rankin cycle requires a medium to reject
heat out of the condenser, the two obvious mediums are water and air, another option is a hybrid
system which benefits from wet cooling in hours of high ambient temperatures.
• Wet cooling
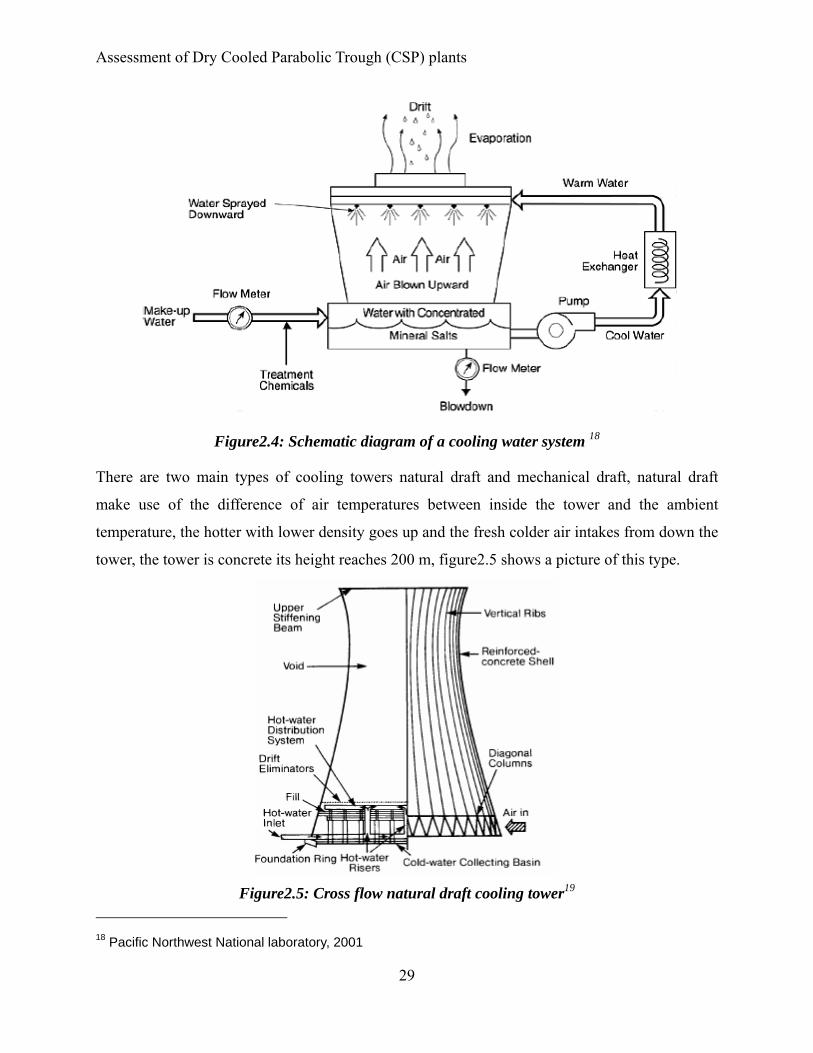
This type of cooling is connected with the name of cooling tower, which is a device used to
reduce the temperature of a water stream by extracting heat from water and rejecting it to the
ambient. Figure2.4 shows that a cooling tower based on the evaporation of water whereby some
of the water is evaporated and carried by a moving air stream and discharged to the atmosphere. 17 Water Use in Parabolic Trough Power Plants: Summary Results from WorleyParsons' Analyses.P(3)
Page 29
Assessment of Dry Cooled Parabolic Trough (CSP) plants
29
Figure2.4: Schematic diagram of a cooling water system 18
There are two main types of cooling towers natural draft and mechanical draft, natural draft
make use of the difference of air temperatures between inside the tower and the ambient
temperature, the hotter with lower density goes up and the fresh colder air intakes from down the
tower, the tower is concrete its height reaches 200 m, figure2.5 shows a picture of this type.
Figure2.5: Cross flow natural draft cooling tower19
18 Pacific Northwest National laboratory, 2001
Page 30
Assessment of Dry Cooled Parabolic Trough (CSP) plants
30
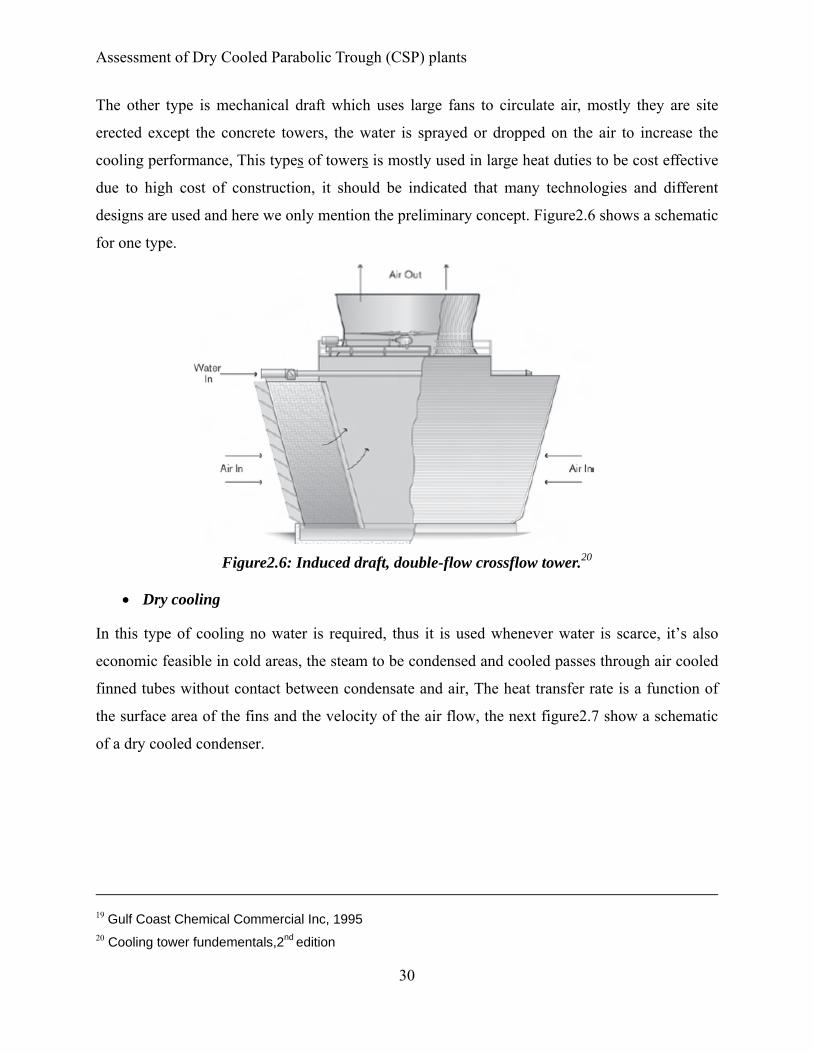
The other type is mechanical draft which uses large fans to circulate air, mostly they are site
erected except the concrete towers, the water is sprayed or dropped on the air to increase the
cooling performance, This types of towers is mostly used in large heat duties to be cost effective
due to high cost of construction, it should be indicated that many technologies and different
designs are used and here we only mention the preliminary concept. Figure2.6 shows a schematic
for one type.
Figure2.6: Induced draft, double-flow crossflow tower.20
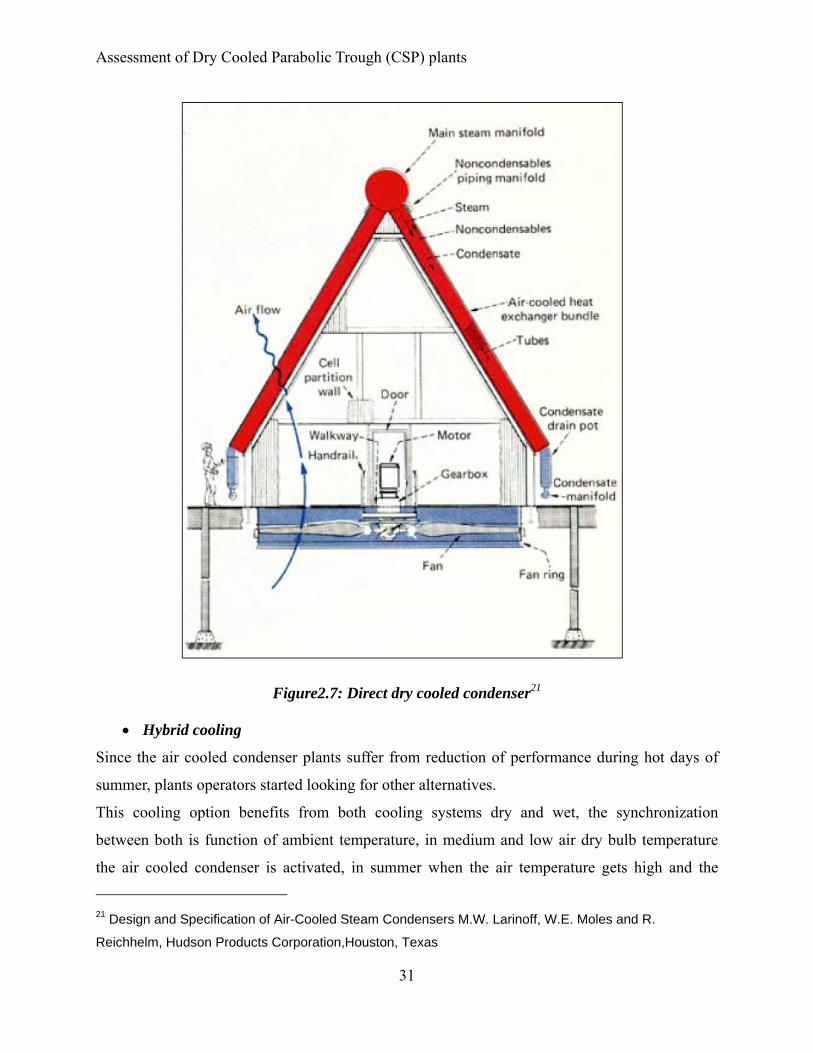
• Dry cooling
In this type of cooling no water is required, thus it is used whenever water is scarce, it’s also
economic feasible in cold areas, the steam to be condensed and cooled passes through air cooled
finned tubes without contact between condensate and air, The heat transfer rate is a function of
the surface area of the fins and the velocity of the air flow, the next figure2.7 show a schematic
of a dry cooled condenser.
19 Gulf Coast Chemical Commercial Inc, 1995 20 Cooling tower fundementals,2nd edition
Page 31
Assessment of Dry Cooled Parabolic Trough (CSP) plants
31
Figure2.7: Direct dry cooled condenser21
• Hybrid cooling
Since the air cooled condenser plants suffer from reduction of performance during hot days of
summer, plants operators started looking for other alternatives.
This cooling option benefits from both cooling systems dry and wet, the synchronization
between both is function of ambient temperature, in medium and low air dry bulb temperature
the air cooled condenser is activated, in summer when the air temperature gets high and the 21 Design and Specification of Air-Cooled Steam Condensers M.W. Larinoff, W.E. Moles and R.
Reichhelm, Hudson Products Corporation,Houston, Texas
Page 32
Assessment of Dry Cooled Parabolic Trough (CSP) plants
32
performance of the plant reduces, the wet cooling tower carries part of the load. It is clear that
this system has the cost of ACC and WCC, so it’s not economically feasible for most sites,
figure2.8 shows one type of hybrid cooling systems.
Figure2.8: Hybrid cooling systems use an air-cooled condenser and a wet-cooled condenser in
parallel. 22
22 Water Use in Parabolic Trough Power Plants: Summary Results from WorleyParsons' Analyses.P(7)
Page 33
Assessment of Dry Cooled Parabolic Trough (CSP) plants
33
Chapter 3
Site Assessment of the case study area 3.1 Site Location
3.1.1 Best locations for CSP
Obviously the best locations for CSP plants are those with high solar insulation, thus locations
lying in the solar belt are the most attractive, figure3.1 shows the world map with sites ranked
according to their suitability to such type of plants.
Figure3.1: Best locations for CSP. 23
Sites with good solar recourses are not enough to be chosen as plant locations, since parabolic
trough plants requires large areas and special foundations, also they are like steam power plants
that require special needs, in the next paragraph most of the important site characteristics are
clarified. 23 Solar Millennium
Page 34
Assessment of Dry Cooled Parabolic Trough (CSP) plants
34
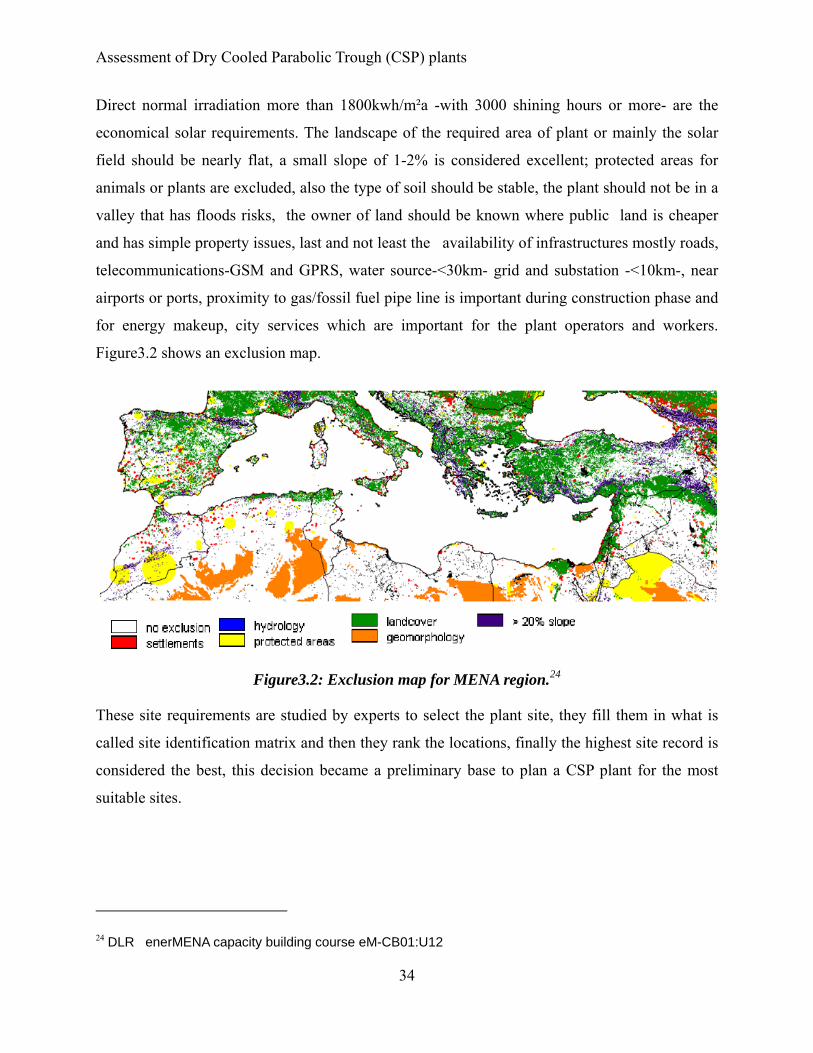
Direct normal irradiation more than 1800kwh/m²a -with 3000 shining hours or more- are the
economical solar requirements. The landscape of the required area of plant or mainly the solar
field should be nearly flat, a small slope of 1-2% is considered excellent; protected areas for
animals or plants are excluded, also the type of soil should be stable, the plant should not be in a
valley that has floods risks, the owner of land should be known where public land is cheaper
and has simple property issues, last and not least the availability of infrastructures mostly roads,
telecommunications-GSM and GPRS, water source-<30km- grid and substation -<10km-, near
airports or ports, proximity to gas/fossil fuel pipe line is important during construction phase and
for energy makeup, city services which are important for the plant operators and workers.
Figure3.2 shows an exclusion map.
Figure3.2: Exclusion map for MENA region.24
These site requirements are studied by experts to select the plant site, they fill them in what is
called site identification matrix and then they rank the locations, finally the highest site record is
considered the best, this decision became a preliminary base to plan a CSP plant for the most
suitable sites.
24 DLR enerMENA capacity building course eM-CB01:U12
Page 35
Assessment of Dry Cooled Parabolic Trough (CSP) plants
35
3.1.2 Ma’an Plant location
The site chosen for this study is a Ma’an development area near Ma’an city, which is 200 km
south of Amman the capital of Jordan, and only 9 km from the city of Ma’an, also it is 100 km
from Aqaba port. The coordinates of the site are (N 30.17° E 35.78°) see figure3.3
&figure3.4.It’s not the best location for CSP in MENA region, but a location where such kind of
a project is attractive, due to the impacts on the development of this area the Jordanian
government is willing to invest in such projects, also the solar radiation is higher than the solar
economic potential making it an attractive location.
Figure3.3: Plant location.25
25 Source: Google earth
Page 36
Assessment of Dry Cooled Parabolic Trough (CSP) plants
36
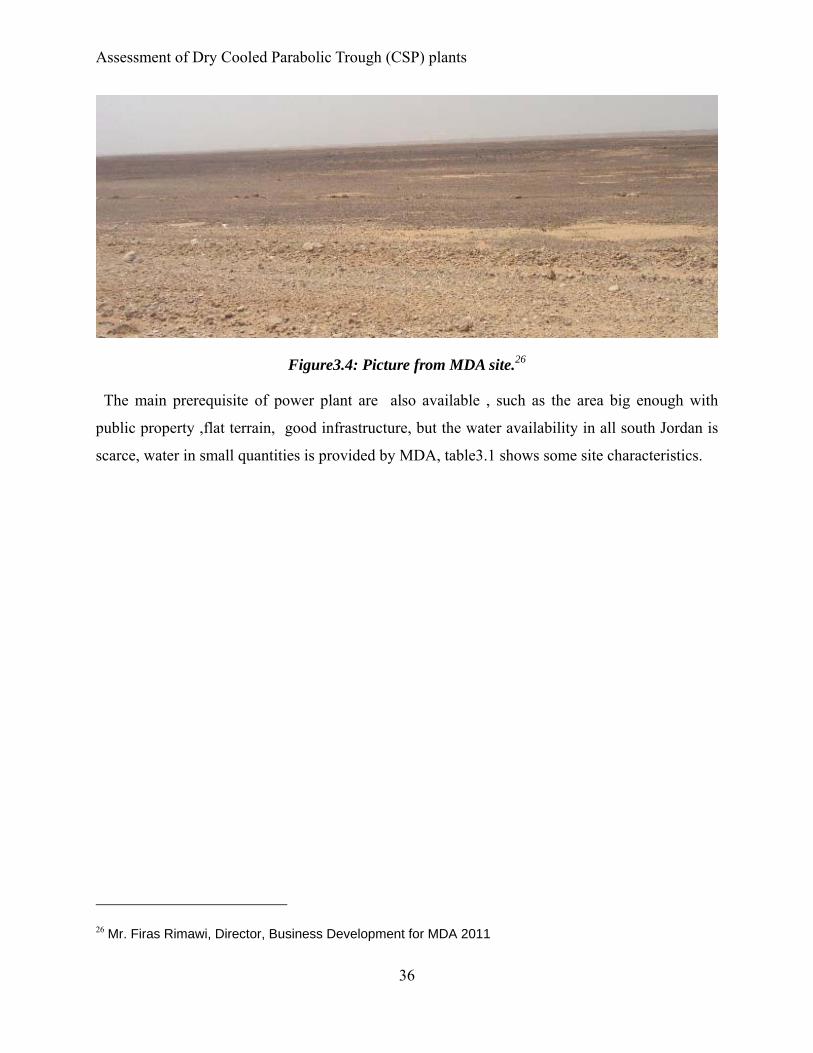
Figure3.4: Picture from MDA site.26
The main prerequisite of power plant are also available , such as the area big enough with
public property ,flat terrain, good infrastructure, but the water availability in all south Jordan is
scarce, water in small quantities is provided by MDA, table3.1 shows some site characteristics.
26 Mr. Firas Rimawi, Director, Business Development for MDA 2011
Page 37
Assessment of Dry Cooled Parabolic Trough (CSP) plants
37
Table3.1: Ma’an site characteristics
Criteria Unit Site name MDA
Region/Municipality Jordan/Ma'an
Latitude N 30.17°
Longitude E 35.78°
Elevation/altitude 1015 m
Time zone Hours GMT +3
Annual sum DNI 2772kWh/m²a
Topography Flat
Terrain Slope and Direction Deg -
Approximate Land Size 7.5 km²
Soil compacted sand and gravel
Land protection No
Land Ownership MDA
Flooding risk No
Fire risk No
Armed/Social conflicts No
HV substation 33 kV
Availability of Water yes-few
Source of Water MDA-underground
Distance to source less than 1 km
Road/railway yes (highway)
Aprox. Distance to Road/Railway 0.2km
Gas / Fossil Fuel Pipeline NO
Telecom Yes
Page 38
Assessment of Dry Cooled Parabolic Trough (CSP) plants
38
3.2 Solar resources assessment
3.2.1 Source and quality o f metrological data
Planning for this type of project requires high quality solar resources, based on long term data –
more than 10 years- and resolution less than 15 minutes which is unavailable in many promising
locations specially in MENA region, for that reason satellite data is used in prefeasibility studies
to identify the locations potential, a ground data station installed in the promising site to be used
as a base of final design, also its important to mention that depending only on one year is not
enough while the long term satellite data give an indication if the solar irradiation is good
always.
Parabolic Trough CSP plant is the first of all steam power plants that depends on other weather
parameters such as, dry bulb temperature, air pressure, and relative humidity. These important
yearly values plus the DNI and time series should be measured and purified for a complete year,
typical meteorological years (TMY) provide reasonable sized annual data sets, hourly values and
for more than 20 years, there are Different methods to create these file types, metrological data
sources provide different format, table3.1 below shows sources of metrological data with their
period and precision.
Page 39
Assessment of Dry Cooled Parabolic Trough (CSP) plants
39
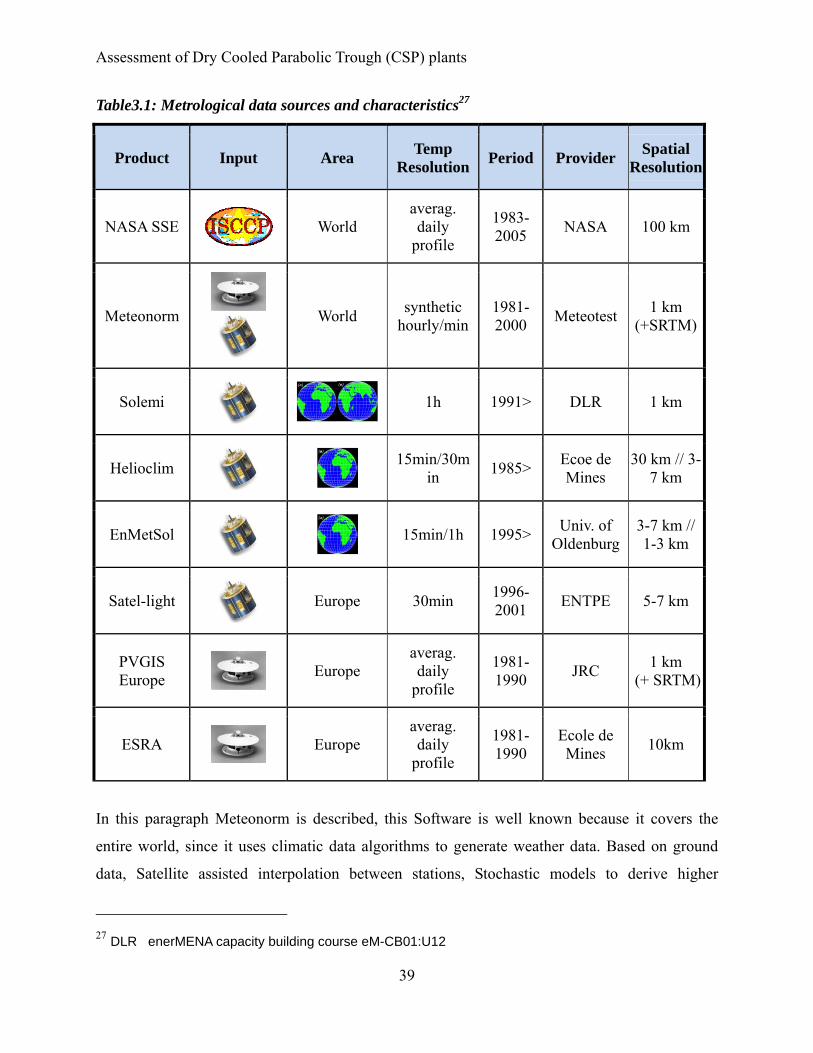
Table3.1: Metrological data sources and characteristics27
Product Input Area Temp Resolution Period Provider Spatial
Resolution
NASA SSE
World averag. daily
profile
1983-2005 NASA 100 km
Meteonorm
World synthetic hourly/min
1981-2000 Meteotest 1 km
(+SRTM)
Solemi
1h 1991> DLR 1 km
Helioclim
15min/30min 1985> Ecoe de
Mines 30 km // 3-
7 km
EnMetSol
15min/1h 1995> Univ. of Oldenburg
3-7 km // 1-3 km
Satel-light
Europe 30min 1996-2001 ENTPE 5-7 km
PVGIS Europe
Europe averag. daily
profile
1981-1990 JRC 1 km
(+ SRTM)
ESRA
Europe averag. daily
profile
1981-1990
Ecole de Mines 10km
In this paragraph Meteonorm is described, this Software is well known because it covers the
entire world, since it uses climatic data algorithms to generate weather data. Based on ground
data, Satellite assisted interpolation between stations, Stochastic models to derive higher
27 DLR enerMENA capacity building course eM-CB01:U12
Page 40
Assessment of Dry Cooled Parabolic Trough (CSP) plants
40
resolution data and Global to tilted models. In this study the data taken by the software is used to
generate TMY2 format weather data for Ma’an site this data as mentioned before is not accurate
enough to be used as an only source for large projects, but it is enough for prefeasibility studies,
“The radiation data was subjected to extensive tests. The error in interpolating the monthly
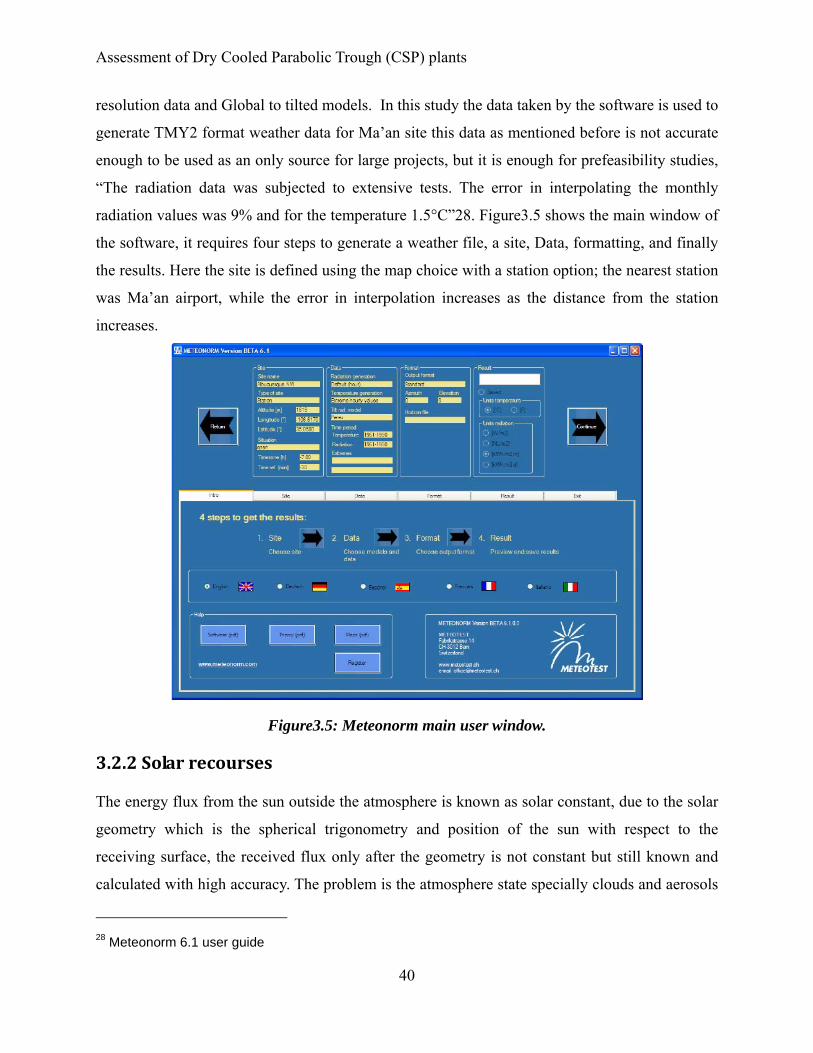
radiation values was 9% and for the temperature 1.5°C”28. Figure3.5 shows the main window of
the software, it requires four steps to generate a weather file, a site, Data, formatting, and finally
the results. Here the site is defined using the map choice with a station option; the nearest station
was Ma’an airport, while the error in interpolation increases as the distance from the station
increases.
Figure3.5: Meteonorm main user window.
3.2.2 Solar recourses
The energy flux from the sun outside the atmosphere is known as solar constant, due to the solar
geometry which is the spherical trigonometry and position of the sun with respect to the
receiving surface, the received flux only after the geometry is not constant but still known and
calculated with high accuracy. The problem is the atmosphere state specially clouds and aerosols
28 Meteonorm 6.1 user guide
Page 41
Assessment of Dry Cooled Parabolic Trough (CSP) plants
41
that dominate the changes of irradiance reaching a target on earth. Figure3.6 shows the measured
irradiation at Ma’an during a cleared sky day, from the enerMENA ground station, the data is
measured and purified by DLR and CSP services. This source of data is used in this study, but
the station is still new(less than one year), Meteonorm Software was necessary to generate a
Meteodata file which is a Typical Meteorological Year version 2 (TMY2), that was only used
during optimization phase, but this data is not accurate enough thus it was not used in the final
assessment while the ground data completed one year in februray2012.
Figure3.6: One day clear sky irradiance in Ma’an.29
The red line -what is important for CSP- is the direct normal irradiation (DNI) which is the
irradiance received by a plane normal to the solar incident rays, it’s measured by a device called
Pyrheliometer mounted on an accurate double axis tracker. The value of DNI is changed severely
by the presence of clouds that is inaccurate to be calculated based on satellite data only.
tables3.2 show the average monthly data from enerMENA station, and tables3.3 show the
29 enerMENA High Precision Meteo Station in Ma’an, Jordan . DLR /CSP Services Company
Page 42
Assessment of Dry Cooled Parabolic Trough (CSP) plants
42
average monthly data from Meteonorm, the monthly data are taken from Greenius, and tables
was created by separate excel sheet.
Table3.2: Monthly Average Ground data30
Month Daylight(1) DNI (2) Temperature (3) Wind speed (4)
[hours] [kWh/m²] [deg C] [m/s]
January 12 5.211937 8.532256 3.465053
February 13 5.69143 10.80223 4.984672
March 13 7.85187 12.62003 4.11156
April 14 7.149566 16.62529 4.507222
May 15 7.836742 21.29423 4.311559
June 15 10.40243 24.55055 4.033055
July 15 9.249483 28.34423 3.69113
August 14 9.139579 26.76895 3.512634
September 13 8.130232 24.26709 3.497223
October 13 7.083063 19.40955 3.065458
November 12 7.027534 10.57999 3.366806
December 12 5.211937 8.490456 3.479301
annual avg - 7.498817 17.6904 3.835473
30enerMENA High Precision Meteo Station in Ma’an, Jordan . DLR /CSP Services Company
Page 43
Assessment of Dry Cooled Parabolic Trough (CSP) plants
43
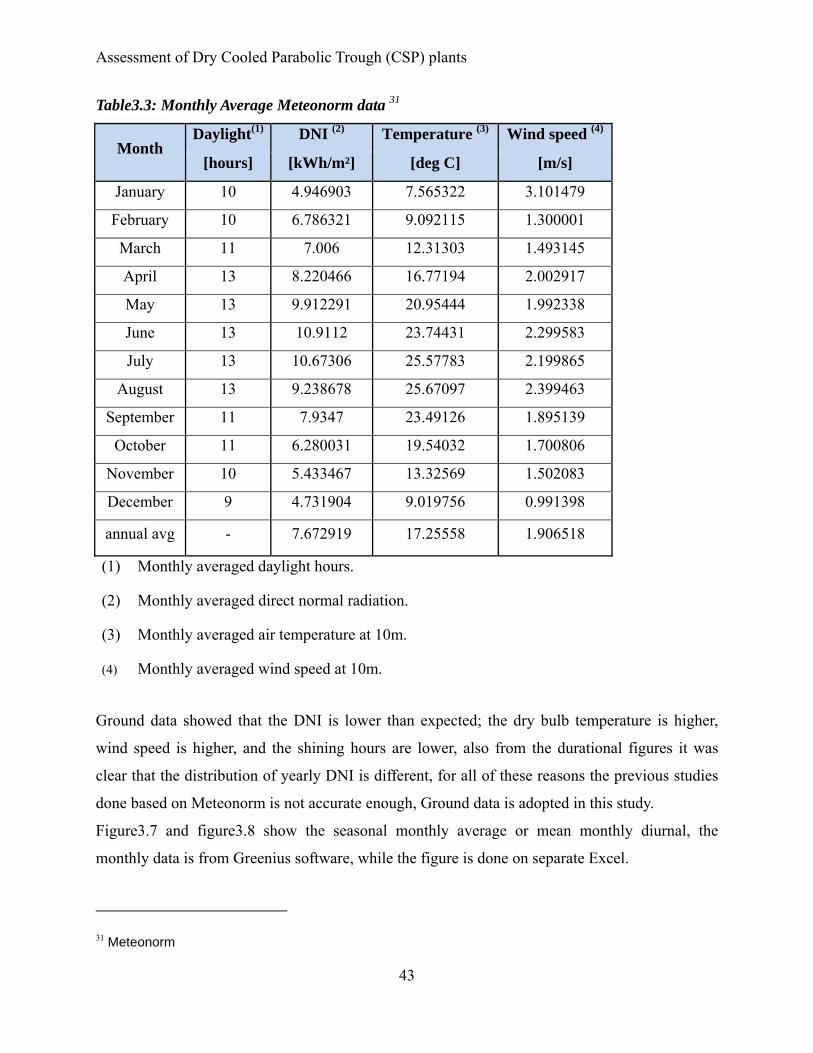
Table3.3: Monthly Average Meteonorm data 31
Month Daylight(1) DNI (2) Temperature (3) Wind speed (4)
[hours] [kWh/m²] [deg C] [m/s]
January 10 4.946903 7.565322 3.101479
February 10 6.786321 9.092115 1.300001
March 11 7.006 12.31303 1.493145
April 13 8.220466 16.77194 2.002917
May 13 9.912291 20.95444 1.992338
June 13 10.9112 23.74431 2.299583
July 13 10.67306 25.57783 2.199865
August 13 9.238678 25.67097 2.399463
September 11 7.9347 23.49126 1.895139
October 11 6.280031 19.54032 1.700806
November 10 5.433467 13.32569 1.502083
December 9 4.731904 9.019756 0.991398
annual avg - 7.672919 17.25558 1.906518
(1) Monthly averaged daylight hours.
(2) Monthly averaged direct normal radiation.
(3) Monthly averaged air temperature at 10m.
(4) Monthly averaged wind speed at 10m.
Ground data showed that the DNI is lower than expected; the dry bulb temperature is higher,
wind speed is higher, and the shining hours are lower, also from the durational figures it was
clear that the distribution of yearly DNI is different, for all of these reasons the previous studies
done based on Meteonorm is not accurate enough, Ground data is adopted in this study.
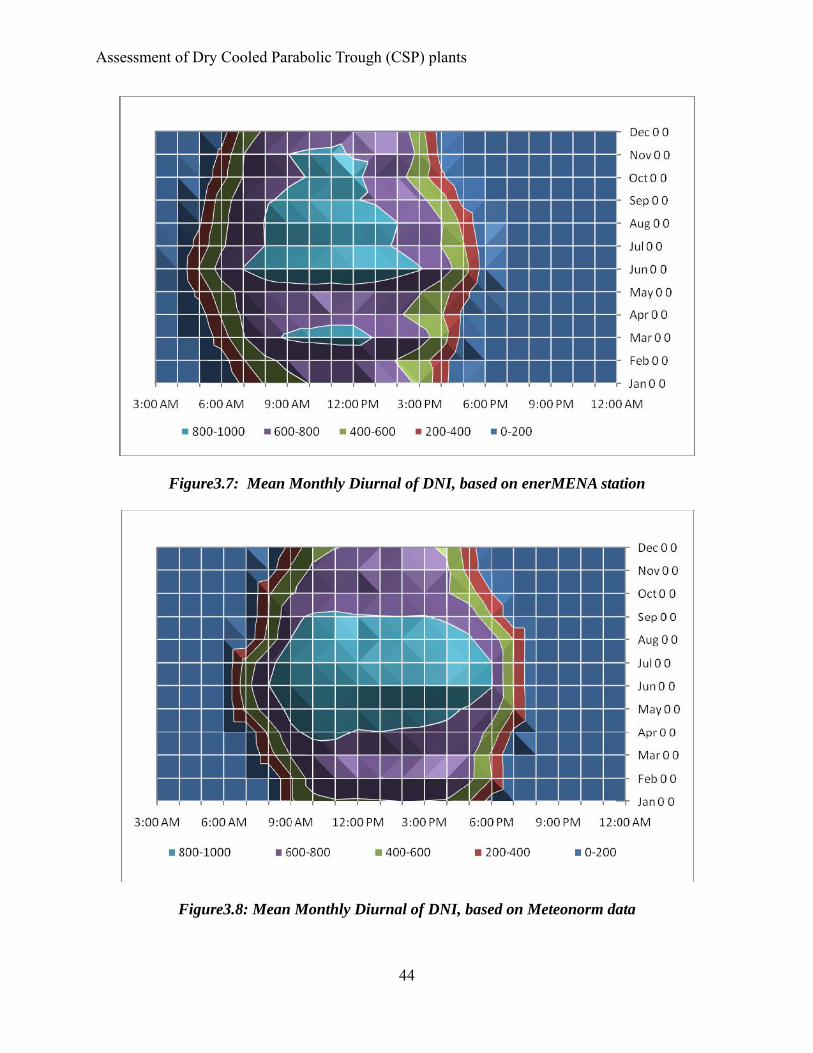
Figure3.7 and figure3.8 show the seasonal monthly average or mean monthly diurnal, the
monthly data is from Greenius software, while the figure is done on separate Excel.
31 Meteonorm
Page 44
Assessment of Dry Cooled Parabolic Trough (CSP) plants
44
Figure3.7: Mean Monthly Diurnal of DNI, based on enerMENA station
Figure3.8: Mean Monthly Diurnal of DNI, based on Meteonorm data
Page 45
Assessment of Dry Cooled Parabolic Trough (CSP) plants
45
These types of figures are widely used because they give a clear representation about yearly
DNI, the distribution of irradiance during one day from sun rise to sunset. It is obvious that the
highest DNI is always around noon reaching its extreme in June. the ground data showed that the
two months April and may have low DNI as expected, from the diffused irradiation data it
showed that, the reason is the existence of clouds and not measurement error, for that reason
ground data for more than one year gives a more accurate view about clouds, but still this data is
the best for this location and later the output of simulation is near to realty.
3.3 Study of dry cooling as an option
What is more important to this study is the need for a Dry cooling CSP parabolic trough plant,
because water recourses are scarce in Jordan especially the south part which is rich of solar
irradiation, it should be indicated that a previous study was already done for this location under a
project named EMPOWER, but their metrological data source was Meteonorm, since it is not
accurate enough the output of CSP power plant was not realistic and thus the economic results.
Herein a high accurate metrological data is supported by DLR. specially DNI, dry-bulb
temperature and relative humidity, this will change the simulation results and the design
optimization also the plants economic results. On the other hand it will give us the ability to
compare between the dry and wet cooling option for our site.
Dry Cooling for CSP means a larger plant where the solar field has the largest effect on the
economics of the plant, using the storage enables the plant to work at night where the ambient
temperature is low; more over this location has high altitude and desert weather properties in
cold nights. Later the energy yield will be simulated, for both a dry and wet plant with the same
conceptual design as Andasol-I, after that modification and optimization is done to have a new
base design for wet plant and compare it with a dry cooling option. What’s important to show is
how the higher energy yield; resulted from larger solar field and low ambient temperature
periods; will reduce the LCOE.
Dry bulb temperature is an important parameter in dry cooling plants designs, that affects the
performance of the plant, for CSP plant it will reduce the annual energy yield and the design of
solar field beside the power block, where high temperature means low performance, freezing
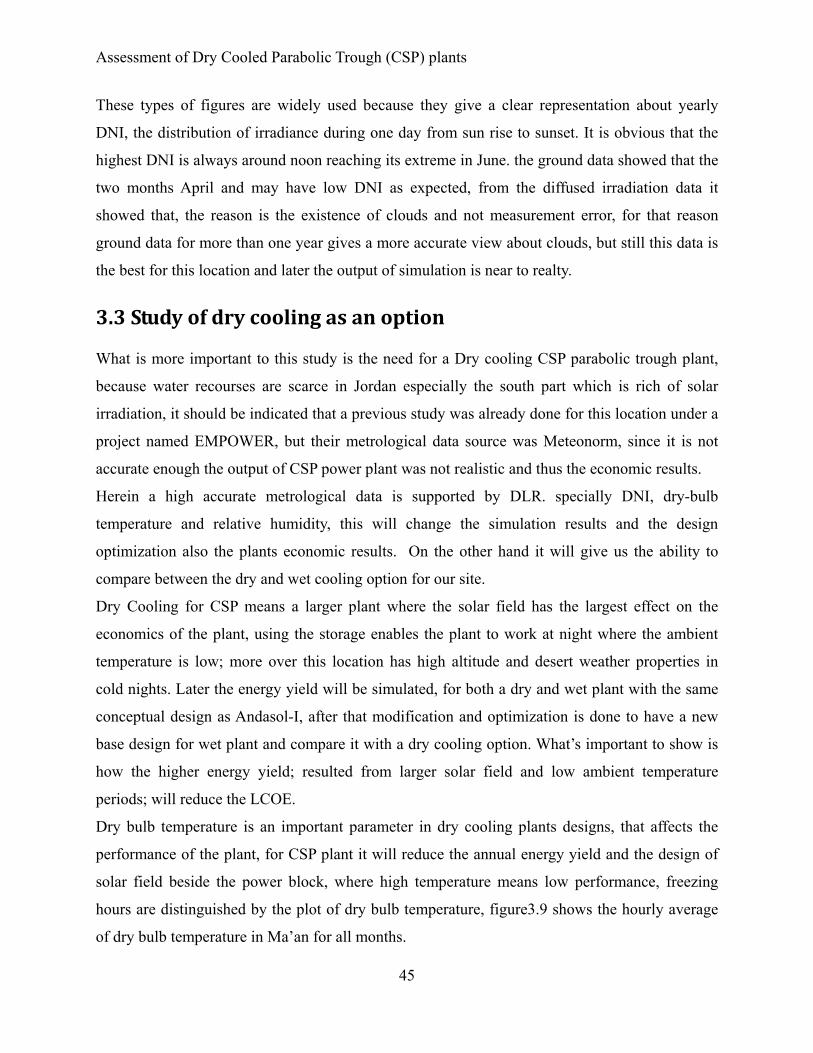
hours are distinguished by the plot of dry bulb temperature, figure3.9 shows the hourly average
of dry bulb temperature in Ma’an for all months.
Page 46
Assessment of Dry Cooled Parabolic Trough (CSP) plants
46
Figure3.9: Monthly plot of hourly averaged dry bulb temperature in Ma’an.
First of all the overlook on the previous figure, showed that Ma’an is not an extremely hot area,
and it has very low probability of freezing hours thus the operation of plant is accepted, also the
higher air temperature occurred at noon, which is not always true in other locations that are
shifted from noon, this property is good because the reduction in performance is compensated by
higher thermal input instead of dumping it.
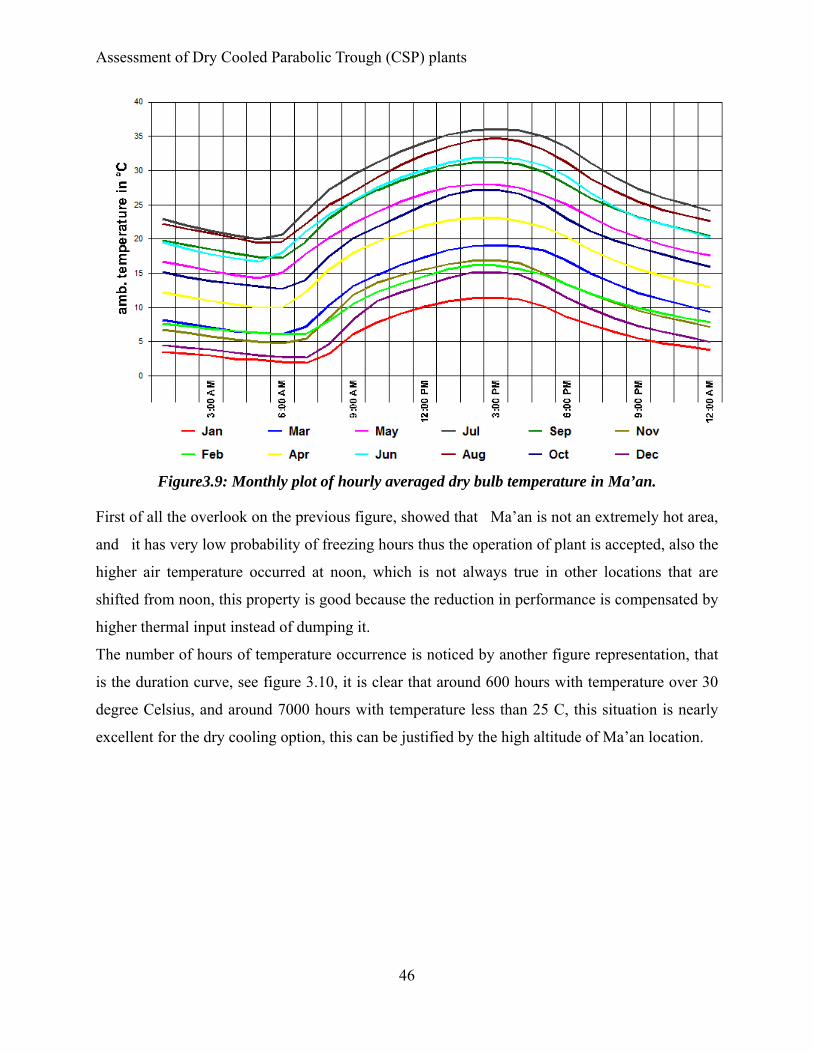
The number of hours of temperature occurrence is noticed by another figure representation, that
is the duration curve, see figure 3.10, it is clear that around 600 hours with temperature over 30
degree Celsius, and around 7000 hours with temperature less than 25 C, this situation is nearly
excellent for the dry cooling option, this can be justified by the high altitude of Ma’an location.
Page 47
Assessment of Dry Cooled Parabolic Trough (CSP) plants
47
Figure3.10: Duration curve of dry bulb temperature.
As a result of this section, dry cooling option in Ma’an is accepted, and the performance of plant
will not be affected harmfully but further investigation is done in next chapters.
Page 48
Assessment of Dry Cooled Parabolic Trough (CSP) plants
48
Chapter 4
Planning of the Ma’an power plant
4.1 Pre‐Design of Ma’an power plant
In this section the Andasol design characteristics are specified, to be used later as a base
reference for our plant. As mentioned earlier the first comparison between wet and dry cooling
will be done for the reference designs, then some optimization is going to be necessary to fit the
local conditions, Table4.1 shows the main specifications of Andasol design where the underlined
items are the ones that will be changed.
Table4.1:Ma'an pre-design parameters similar to Andasol
Location Project name Ma'an-MDA
Location 200 km south Amman
Terrain approx.195 hectar (1300m x1500m)
High voltage line 33kV
Solar field Aperture area 510,120m²
Solar multiplier 1.7
Collector Assembly (SKAL-ET 150)
Storage Cold tank temperature 292 C
Hot tank temperature: 386 C
Flow rate 948 kg/s.
Hours 7.5
Size 14 m height, 38 m diameter.
Capacity 1085 MWh =28.500 tonnes
Power Block Turbine SST-700
Nominal Capacity 50.0 MW
Page 49
Assessment of Dry Cooled Parabolic Trough (CSP) plants
49
Conversion efficiency 38%
Turbine Inlet Conditions 100 bar 370°C , reheat 16.5 bar
370°C
Nominal Steam Flow 59 kg/s
Cooling system wet
Design Back Pressure 0.08 bar
Figure4.1 depicts the general layout of the CSP plant where the collectors are N-S. Collector
loop configuration has been set according to the current engineering layout for oil-cooled
parabolic trough solar fields with each loop consisting of four collectors.
Figure4.1: layout of Andasol plant 32
32 Herrmann and Nava, 2008; Prieto et al., 2008; Herna´ndez et al., 2008
Page 50
Assessment of Dry Cooled Parabolic Trough (CSP) plants
50
4.2 Power cycle and cooling system
Changing the cooling system will change the operation of the whole power cycle, Greenius
software defines the power cycle as a look-up table, which is generated by external power station
simulation softwares, such as Ebsilon Professional, IPSEpro, or GateCycle. For this study it’s
very good to have access to one of these softwares but that is not possible, so the capacity of
plant is 50MW similar to Andasol solves the problem, because these look-up tables are available
in Greenius expert version, not only for the wet cooling but also for the dry cooling. the process
matrix for a 50 MW dry cooled power block is shown below, it is taken from the Greenius library
which is the same used for the simulation in this study, another matrix for the wet cooled case is
used.
Figure4.2: Process Matrix for 50 MW Dry Cooled Power Block33
33 Greenius library
Page 51
Assessment of Dry Cooled Parabolic Trough (CSP) plants
51
The rows marked in yellow are the range of ambient temperature and design conditions; the
ambient temperature range covers all the ambient temperature of our location which is very
good. The design conditions are tabulated for both wet and dry, see table4.2.
Table4.2: Power block design conditions for wet and dry
Design item
Design value
Wet Dry
Solar thermal heat 129222.5 147440
Inlet temperature 391 393
Ambient temperature 30 25
Ambient pressure 0.9 0.99
Relative air humidity 20 60
Condenser pressure 0.08 0.144
Load type freeload freeload
4.3 Simulation Inputs
Greenius software is one of the leading tools used for simulating renewable energy systems
specially concentrated solar power systems; it is developed by DLR and still under development.
In this study a parabolic trough with storage will be simulated optimized and adapted, for both
dry and wet cooling. One should be able to deal with these large input variables and different
outputs, herein this section the procedure is described based on its manual and self learning
through program interface, see the figure4.3.
Figure4.3: Process for Greenius simulation
Page 52
Assessment of Dry Cooled Parabolic Trough (CSP) plants
52
The next tables clarify the inputs of simulation, in table4.3 project site inputs, where the
underlined items mean they were changed through different simulation cases, most of them
describing the technology used and the local conditions, items without reference are
recommended by software. The financial simulation is very simple without any incentives, that
were identical for both cases, and further financial study could be done separately after the
economical results of this study. The load curve is undefined because it’s a free load design,
where all the produced electrical energy is fed to grid; also the Boiler is not included.
Table4.3: Simulation inputs for project site
Project Site Nation: Jordan location
Rem
uneration T
ariffs
type flat Geographical location
Name Ma'an- MDA year 2011 latitude 30.17 N
Electricity Jordan 0.084 €/kwh Spain 0.27 €/kwh longitude 35.78 E
Heat/cooling 0 Altitude 1069 fuel usage 0 Time zone +3
Taxes
Income tax rate 0 Properties of Ground
Ground structure Clay
Property tax rate 0 Roughness length 0.03
Tax holidays 0 Albedo factor 0.2 loss forwarded 0 Average slope 0
Discount R
ate
investment cost 6% specific land cost Jordan0.5€/m²Spain 2€/m²
running costs 6% load curve
Prices of D
elivery
Fuel price 0.05€/kwhth Water price 0.5€/m3
undefined-free load purchased from the grid
Jordan 0.084€/ kwh34 Spain 0.15 €/kwh
year 2011 Metrological input
Escalati
on Rates
Electricity 0% Typical Metrological year ( Meteonorm ) Ma’an Airport
O&M 0% Replacement 0%
34 NEPCO, annual report 2005.(P 40)
Page 53
Assessment of Dry Cooled Parabolic Trough (CSP) plants
53
Fuel Jordan 0% Spain 12%
Specific Reference
Values
levelized electricity costs 0.050€/kwh
One year ground data
DLR
CO2 emissions -electricity 0.63235
levelized Heat costs 0
CO2 emissions -Heat 0.3
The next table shows the solar field design specification, the values are based on Andasol design
supported by Greenius team; also the underlined items are the changeable inputs for different
simulation cases.
35 UNEP, 2000 - "The GHG Indicator"
Page 54
Assessment of Dry Cooled Parabolic Trough (CSP) plants
54
Table4.4: Simulation inputs for solar field
Technology Part 1
collector Assembly collector Field
General inform
ation and dimensions
Length 148.5 m General and
dimensions
Name Andasol
Aperture width 5.75 m land use 1900000m²
Aperture area 817.5 m² Reference
irradiation 800w/m²
Focal Length 1.71 m
Orientation
Distance between
rows 17.3m
HCE Diameter 0.0655m Distance between
collectors 1m
Nominal optical
efficiency 77.00%
Tracking axis tilt
angle 0
Therm
al Parameters
Tracking axis
Azimuth 0
Field parameters
Number of rows 156
No. of
collectors/loop 4
Field size 510120
Total header length 6823m
mean header
diameter 0.381
Header specific
mass 60.29kg/m
length fraction cold
header 0.5
pipe length in loops 6807m
Incidence A
ngle M
odifier
Coefficient a1 0.000525
Coefficient a2 2.86E-05 pipe diameter in
loops 0.0525m
Coefficient a3 0
Page 55
Assessment of Dry Cooled Parabolic Trough (CSP) plants
55
Table4.5 shows the technical data for storage and power block, which is loaded from Greenius
library, these are valid only for the wet cooled case in Andasol and Ma’an case before
optimization, where the dry cooling case requires different power block as mentioned before, the
results of the final optimization of dry cooling is discussed briefly in chapter5
Table4.5: Simulation inputs for Storage and Power Block
Technology Part2
Thermal storage Power Block
Name Andasol 50 MW
Type Two Tank Molten Salts
Technical D
ata
Page 56
Assessment of Dry Cooled Parabolic Trough (CSP) plants
56
Table4.6: Economic Simulation inputs for Spain (Costs, Financing, Timing)
Economics
Costs Financing major equipment costs minimum internal rate of return 12%
Non-C
onventional Costs
Reference year 2011 Financing sources
specific costs 320 €/m² Grant
Funding
none conventional parts 0%
specific O&M costs 4 €/m² conventional parts 0%
specific replacement costs 0.2%/a Dept
funding 70%
Guarantee period 0 Equity Funding 30%
specific insurance cost 0%/a Dept financing
Conventional costs-
Power B
lock
Reference year 2009 A loan w
ith portfolio Share 60%
land use 10000m² Interest rate 5.40% specific costs 950 €/kw Dept term 10 years
specific O&M costs 3 €/m² Upfront fee 0% specific replacement
costs 0.2%/a Commitment fee 0.4% of the amount drown
Guarantee period 0 grace period 0 specific insurance cost 0%/a bridge loan No
Storage
Reference year 2009 B loan w
ith portfolio
Share 40% land use 7500 Interest rate 6.00%
specific costs 35 €/kwth Dept term 12 years specific O&M costs 1 €/m² Upfront fee 0% specific replacement
costs 0.2%/a Commitment fee 0.5% of the amount drown
Guarantee period 0 grace period 0 specific insurance cost 0%/a bridge loan No
Other C
osts infrastructure costs 0 Timing-(Project Schedule)
Project development 5% Reference year of discounting 2012 insurance during
construction 1% Construction period 2
supervision and Startup 3% First year of operation 2014 contingencies 5% Operation period 25
Depreciation type linear Depreciation period 15
Cost distribution during
construction 25% per half year
Page 57
Assessment of Dry Cooled Parabolic Trough (CSP) plants
57
Chapter 5
Simulation, optimization and comparison
5. 1 Simulation of base design (Andasol) First of all the Andasol input in Spain is simulated with dry and wet cooling, then a simulation
with the same design and economic inputs in Ma’an is done, this would be a good base for
comparison. During steps Energy yield, parasitic loads, Gross power, Net power, investment
cost, water consumption and LCOE, are the main outputs that are analyzed
5.1.1 Andasol in Spain
Table5.1 shows monthly power production and overall efficiency, table5.2 shows the simulation
results of the Andasol design in Spain based on the same economic inputs of Spain, thus an
economic reference for the next steps was created.
Table5.1 Monthly Power production and overall efficiency for Andasol design in Spain
Wet Dry
Month Net
power [MWh]
Gross power [MWh]
overall efficiency
[ %]
Net power [MWh]
Gross power [MWh]
overall efficiency
[%] Jan 4335.76 4928.26 6.71422 3965.92 4487.75 6.1392
Feb 6280.6 7075.74 10.1821 5685.71 6419.61 9.2165
Mar 11778.1 13374.3 13.6355 10749.7 12291.2 12.443
Apr 13411.2 15193.1 15.6361 12245.3 13997.8 14.265
May 16222.3 18337 15.7938 14978.4 17091.5 14.581
Jun 18263.3 20655 15.6429 16601.9 18981.6 14.218
Jul 19746.4 22297.5 15.4337 18057 20670.1 14.108
Aug 17403 19661.2 16.1173 15730.5 17978.9 14.568
Sep 13105 14826.8 14.7125 11749.1 13424.9 13.189
Oct 8624.36 9756.06 12.0788 7662.73 8710.31 10.73
Nov 5453.07 6127.06 8.09658 4908.25 5514.55 7.2863
Dec 3347.23 3787.97 5.86989 3050.49 3432.41 5.3413
Page 58
Assessment of Dry Cooled Parabolic Trough (CSP) plants
58
Table5.2 Simulation results of Andasol design in Spain
General information
Number of loops 156
Effective Collector Area 510120m²
Direct normal irradiance (DNI) 2052kWh/(m²·a)
Cooling type Comparison element Wet Dry Unite
Energy yield 134715.8 126184.27 MWh/a
Capacity factor 31.709968 28.8091941 %
Thermal output of solar field 442908.3 458833.01 MWh/a
Economic results Internal Rate of Return (IRR) on Equity 9.69 7.28 %
Net Present Value 109.11 59.32 €
Payback Period 12.35 13.96 yrs.
Discounted Payback Period 15.88 20.77 yrs.
Total Incremental Costs 262 474 023 280 190 787 €
Minimum ADSCR 1.01 0.91
Required Tariff (LCOE) 0.301 0.341 €/kWh
Incremental LEC 0.152 0.179 €/kWhe
Calculation of LEC Levelized Electricity Costs (LEC) 0.2024 0.2293 €/kWhe
Total Investment Costs (IC) 274 259 498 282 859 352 €
Annuity of IC 0.0782 0.0782
NPV of Running Costs (OC) 74 320 528 75 473 190 €
Annuity of OC 0.0782 0.0782
Page 59
Assessment of Dry Cooled Parabolic Trough (CSP) plants
59
The net power which is the final electrical power that is ready to be fed to the grid, is shown in
figuer5.1, where the wet case has high power production due to the higher efficiency of the
turbine, the dry cooling and wet cooling have nearly the same output during the period between
October and march, due to the lower ambient temperature that improves the turbine performance.
Figure5.1: Monthly Net Power for Andasol design in Spain
A graph of the overall efficiency is shown in figure5.2, which indicates the conversion factor
from solar energy to final electrical energy, the wet cooled case always has higher efficiency than
the dry case; this difference reduces at a lower ambient temperature. In summer the overall
efficiency for wet and dry is reduced because of the dumped solar energy, it is expected that the
dry cooling will have more reduction because of its lower performance but this effect is reduced
by using mores solar energy instead of dumping it.
Page 60
Assessment of Dry Cooled Parabolic Trough (CSP) plants
60
Figure5.2: Plant Overall Efficiency for Andasol design in Spain
5.1.2Andasol in Ma’an
Herein four simulation steps are done. dry and wet cooling systems are attached to Andasol
design and simulated in Jordan, once with Spain economic inputs from Greenius and the other
with Jordan Economic, this section is important to compare between the Dry and wet cooling in
those two countries. The same design for both plants means that only cooling system is changed.
Table5.3 Monthly Power production and overall efficiency for Andasol design in Ma’an
Wet Dry
Month Net
power [MWh]
Gross power [MWh]
Overall efficiency
[%]
Net power [MWh]
Gross power [MWh]
Overall efficiency
[%] Jan 8160.2 9090.2 8.47 7318.9 8181.0 7.59 Feb 8491.5 9600.8 10.70 7622.8 8677.5 9.60 Mar 17694.6 19995.3 14.34 16280.9 18626.4 13.20 Apr 16207.3 18358.8 15.04 14989.0 17208.9 13.91 May 19102.7 21653.5 15.46 18069.2 20830.2 14.62 Jun 23188.1 26334.6 14.62 22779.4 26412.2 14.37 Jul 23440.2 26638.2 16.05 22226.6 25772.0 15.22 Aug 22866.8 25999.3 16.12 21674.0 25105.1 15.28 Sep 18882.3 21515.3 15.39 17138.4 19830.1 13.96 Oct 14895.3 16753.4 13.36 13027.8 14803.9 11.68 Nov 10985.5 12288.3 10.44 9826.3 11056.5 9.33 Dec 8117.6 9046.1 8.40 7278.8 8156.67 7.54
Page 61
Assessment of Dry Cooled Parabolic Trough (CSP) plants
61
Table5.4 Simulation results of Andasol destine in Ma’an with Spain economics
General information Number of loops 156
Effective Collector Area 510120m² Direct normal irradiance (DNI) 2802.2kWh/(m²·a)
Cooling type Comparison element Wet Dry Unite
Energy yield 191999.2 178232.3 MWhe/a
Capacity factor 43.84 40.69 %
Thermal output of solar field 625580.2 626682.2 MWh/a
Economic and financial results Internal Rate of Return (IRR) on Equity 18.38 15.27 %
Net Present Value 295.79 238.68 €
Payback Period 6.31 8.33 yrs.
Discounted Payback Period 8.15 10.75 yrs.
Total Incremental Costs 225 860 347 247 656 288 €
Minimum ADSCR 1.39 1.25
Required Tariff (LCOE) 0.211 0.236 €/kWh
Incremental LEC 0.092 0.109 €/kWhe
Calculation of LEC Levelized Electricity Costs (LEC) 0.142 0.1587 €/kWhe
Total Investment Costs (IC) 274 259 498 285 719 994 €
Annuity of IC 0.0782 0.0782
NPV of Running Costs (OC) 74 320 528 75 856 614 €
Annuity of OC 0.0782 0.0782
Figuer5.3 shows the net Power, where the wet case has high power production due to the higher
efficiency of the turbine, in the period between December and February, the dry cooling and wet
cooling have nearly the same output that is due to the lower ambient temperature that improves
the turbine performance, and mainly due to the usage of dumped energy in dry cooling instead of
being lost in wet cooling. In Ma’an the DNI is higher than Andasol thus the net power of both
dry and wet cooling is higher too, the summer ambient temperatures are higher in Ma’an, that
increases the difference of power production between wet and dry cooling,
Page 62
Assessment of Dry Cooled Parabolic Trough (CSP) plants
62
Figure5.3:Monthly Net Power for Andasol design in Ma’an
The overall efficiency is shown in figure5.4, the wet cooled case always has higher efficiency
than the dry case, this difference reduces at a lower ambient temperature. In summer (Jun) the
overall efficiency for wet and dry is reduced because of the dumped solar energy, it is expected
that the dry cooling will have more reduction because of the lower performance but the effect is
reduced by using more solar energy instead of dumping it. This figure shows that the difference
in the overall efficiency between wet and dry cooling in Ma’an is more than the difference in
Andasol, Mainly due to higher ambient temperature.
Figure5.4:Plant overall Efficiency for Andasol design in Ma’an
Page 63
Assessment of Dry Cooled Parabolic Trough (CSP) plants
63
Because Ma’an has higher DNI the Andasol design is not suitable, in other words it is not the
optimized, where the solar field is oversized and storage full load hours for dry cooling should
be increased as the turbine requires higher thermal input, for these reasons the comparison can’t
be generalized before an optimization of the plant in Ma’an, that is done in the next section.
5.2 Optimization of Ma’an plant
During last sections simulation the design was fixed as Andasol, constant thermal input
comparison criteria, in this section another comparison criteria is constant capacity, thus
optimization is required to compensate the lower efficiency of dry cooling by higher thermal
input keeping the capacity at design conditions fixed, for both dry and wet cooled plants .
The design of a plant is site specific due to the dependency on local metrological characteristics,
specially the DNI, ambient temperature, atmospheric pressure and relative humidity that change
the operation and performance of power plants.
Using another plant design (Andasol) for our location is not accurate, the miss-optimized design
results in differences that can be characterized as, over sized solar field and lower sized, but in
our case it is over sized due to the higher DNI and relatively similar other destine requirements.
During periods of high DNI the solar field produces higher amount of needed thermal energy
while no space in the storage system is available, thus more wasted energy-Dumped energy-,
from an economical point of view larger a solar field adds investment and operating costs
without effecting the reduction of LCOE, on the other hand the dry cooled plant will benefit
from that extra solar energy, because the turbine requires more thermal input, as a result the
comparison would senseless, for those reasons a new design optimization is required with a new
base for a wet plant, then to be used for a dry cooled plant with the same design , finally a last
optimization for the dry cooled plant is done for good economical results.
The procedure for optimization is discussed in this paragraph, the first step started with Andasol
design in Ma’an that was used in the previous simulations, and then several reduction steps of
the solar field area are made, followed by simulation each time while keeping the same storage
system size. The Gross output power, the Energy yield, thermal energy into system, the storage
level, the Storage input/output and the Dumped solar Heat, are analyzed, all are typical
operations yearly with hourly data, besides the LCOE and the investment cost, daily figures are
also noticed consequently and some of them are included in the next figures.
Page 64
Assessment of Dry Cooled Parabolic Trough (CSP) plants
64
5.2.1 Wet Optimization
As we discussed before an optimized wet cooled plant is important to be a reference valid for the
local conditions, table5.5, shows the several simulation trials to reach the best LCOE, where the
storage still has the same design characteristics as Andasol, also the power block, but the size of
solar field is changed, it should be indicated that these economic values are depending on the
cost inputs, but the sequence and thus the consequence are the same
Table5.5: optimization steps of wet cooled case
Wet optimization
# run #
loops
Effective mirror area
[m²]
Thermal output of solar filed
[MWhth]
Energy yield [MWhel]
Investment cost [€]
LCOE [€/kWhe]
1 156 510120 644378.5 198497.9 272 336 160 0.1305 2 152 497040 627918.6 196043.3 269 940 951 0.1298 3 148 483960 611435.2 193448.8 262 755 322 0.1292 4 144 470880 594963.5 190553 257 964 903 0.1287 5 140 457800 578498.8 187345.5 253 174 483 0.1285 6 138 451260 570268.8 185598.4 250 779 274 0.1285 7 136 444720 562028.1 183879.4 248 384 064 0.1284 8 134 438180 553796.4 182043.9 245 988 855 0.1285 9 132 431640 545583.8 180200.7 243 593 645 0.1285 10 130 425100 537345.0 178186.3 241 198 435 0.1287
The main optimization resulted in that 444720m² mirror areas is the optimum size for the solar
field, for 50Mw capacity,7.5 TES hours, a wet cooled condenser, a capacity factor of 41.98%,
plant in Ma’an Jordan. The next two figures (5.5&5.6) show the net power before and after
optimization, it’s clear that little changed on the annular figure, represented by the white area
meaning that the operating hours reduced little, but still economically better, because larger solar
field cover those days and dump the solar energy in other periods, which increases the
investment cost without a big share in the reduction of LCOE.
Page 65
Assessment of Dry Cooled Parabolic Trough (CSP) plants
65
Figure5.5:Gross electrical power of wet case,before optimization
Figure5.6:Gross electrical power of wet case,after optimization
Page 66
Assessment of Dry Cooled Parabolic Trough (CSP) plants
66
The dumped energy is the energy that is thrown away because it is larger than the allowable
thermal input for the steam turbine, and can’t be stored because the storage is full, it can’t be
zero if the solar field is optimized, because the design reference of DNI is 800w/m² that covers
the majority of hours and not only the peak summer hours, where in many hours it is more than
this value, part of the extra energy is stored and part is thrown by shutting some rows. The next
two figures (5.7&5.8) show that the dumped energy is reduced, especially for the summer
months.
Figure5.7:Dumped solar energy of wet case,before optimization
Page 67
Assessment of Dry Cooled Parabolic Trough (CSP) plants
67
Figure5.8:Dumped solar energy of wet case,after optimization
The next two figures (5.9&5.10) show the thermal energy entering the storage and going out, the
charging and discharging rates, they give an indication wither the storage is fit with the solar
field or not, relatively the two figures before and after optimization are not changed, that means
the extra energy was mostly dumped energy, in periods where the storage is not full higher
energy yield was before optimization, but again this energy was insignificant compared with the
cost of extra rows. generally from march to April the storage capacity was used completely
except for a few hours, which is a good selection of storage capacity and the charging
/discharging rates are suitable for the solar field and turbine design points, the fact that the
storage for Andasol is perfectly optimized, thus the reduction in the solar field effective area is
due to higher DNI in Ma’an than Andasol.
Page 68
Assessment of Dry Cooled Parabolic Trough (CSP) plants
68
Figure5.9:Charging and discharging of TES of wet case,before optimization
Figure5.10:Charging and discharging of TES of wet case,after optimization
Page 69
Assessment of Dry Cooled Parabolic Trough (CSP) plants
69
5.2.2 Dry Optimization
Herein the power block is changed to be dry cooled, since the thermal input for the turbine
147440Mwth is higher than the wet case which is 129233Mwth, the TES full load hours are
lower than 6.3 hours, so the storage capacity and the charging/discharging rates are changed to
meet the design point, table5.6 shows these simulation steps. The same procedure as wet
optimization is done; the higher investment costs and LCOE are due to the higher costs of the
cooling system, a larger turbine, a larger storage and lower efficiency of the power cycle.
The main optimization resulted in 510120m² mirror area as an optimum size for the solar field,
for 50Mw capacity, 7.5 TES hours, a dry cooled condenser, a capacity factor of 41.59%, and a
plant in Ma’an Jordan.
Table5.6: Optimization steps of dry cooled case
Dry optimization
# run
# loops
Effective mirror
area [m²]
Thermal output of solar filed
[MWhth]
Energy yield
[MWhel]
Investment cost [€]
LCOE [€/kWhe]
1 136 444720 562803.6 163431.0 265 209 798 0.1525 2 140 457800 579262.3 167801.6 270 000 217 0.1512 3 144 470880 595709.3 171846.3 274 790 637 0.1502 4 148 483960 612171.0 175639.8 279 581 056 0.1496 5 152 497040 628603.9 179071.8 284 371 475 0.1492 6 154 503580 636834.5 180652 286 766 685 0.1491 7 156 510120 645061.7 182173.5 289 161 894 0.1491 8 158 516660 653296.5 183657.2 291 557 104 0.1492 9 160 523200 661515.3 185109.8 293 952 313 0.1492 10 164 536280 677988.6 187874.3 298 742 733 0.1494
Since the same procedure as wet case optimization, then only figures after optimization are
included, the next figure5.11 shows the gross power after optimization. What is different here is
that the gross power is reduced in hot summer days, while only a small increase in cold days,
which is clear from the figures output curve, more than 50MWe in cold days and lowers than
50MWe in hot ones.
Page 70
Assessment of Dry Cooled Parabolic Trough (CSP) plants
70
Figure5.11:Gross electrical power of dry case,after optimization
Figure5.12 shows the dumped solar energy which is lower than the wet case, because the plant
has larger storage and higher thermal input to turbine.
Figure5.12:Dumped solar energy of dry case,after optimization
Page 71
Assessment of Dry Cooled Parabolic Trough (CSP) plants
71
Figure5.13shows the charging/discharging rates, the difference here is larger rates is needed to
meet the turbine to its design point, the optimization here is better than for wet because more
effective thermal energy is provided by larger storage and turbine.
Figure5.13:Charging and discharging of TES of dry case,after optimization
The Simulation software called SAM has a powerful parameterization and optimization tool.
Nearly similar inputs of this Greenius model are entered there, the values are not exactly as
Greenius but this step is essential to be sure that the optimization of the dry cooled plant is
correct, table5.7 shows how LCOE changes by the full load hours of TES and by the solar
multiple.
Page 72
Assessment of Dry Cooled Parabolic Trough (CSP) plants
72
Table5.7: LCOE at different TES hours and solar multiple, for dry cooled plant in Ma’an LCOE
Nominal Solar Multiple
[c€/kWhe] 1 1.25 1.5 1.75 2 2.25 2.5 2.75 3 3.25
full load hours of TE
S
0 19.71 19.3 20.1 21.3 22.54 23.99 25.42 26.89 28.41 30.11.5 20.91 19.2 19.5 20.2 21.19 22.32 23.53 24.81 26.08 27.63 22.58 19.9 19.4 19.8 20.57 21.42 22.39 23.45 24.49 25.7
4.5 24.24 21.2 19.6 19.6 20.1 20.78 21.55 22.4 23.29 24.36 25.91 22.6 20.3 19.7 19.89 20.38 21.01 21.73 22.46 23.3
7.5 27.56 23.9 21.3 20 19.91 20.16 20.62 21.2 21.81 22.59 29.22 25.2 22.4 20.6 20.05 20.04 20.36 20.83 21.36 22
10.5 30.86 26.5 23.5 21.5 20.47 20.17 20.25 20.59 21.03 21.612 32.52 27.9 24.6 22.5 21.27 20.44 20.24 20.41 20.73 21.2
Another representation of the last table is simply plotted in figure 5.14, the upper left and lower
right corners of the figure, are colored by red closely spaced lines which means that the values
are very high and the increase in storage hours or solar multiple consequently, have low effect on
energy yield because the solar field is not suitably chosen, thus more costs without effective
energy yield. In the middle of the figure wide spaced blue lines are changing around both axes,
the blue color means low values of LCOE, and the distance means small change in solar multiple
or storage hours have strong effect on energy yield.
Page 73
Assessment of Dry Cooled Parabolic Trough (CSP) plants
73
Figure5.14: Contour representation of LCOE as function of solar multiple and storage hours
Figure5.15 shows the relation between LCOE and the solar multiple for each storage capacity, it
is clear that the best LCOE of energy for 7.5 storage hours is at a solar multiple of two, lower
values can be achieved without storage and smaller solar multiples, but that is not our case
because the plant works only on solar energy and we need a higher capacity factor, the 9 hours
are also suitable for solar multiple and with similar LCOE, this matter of the capacity factor
needed. As a conclusion, the solar multiple two with storage of 7.5 hours will be adopted also for
a dry plant and it is technically and economically an excellent choice.
Page 74
Assessment of Dry Cooled Parabolic Trough (CSP) plants
74
Figure5.15: plot of LCOE as function of solar multiple for each TES capacity
5.3 Technical Comparison between wet and dry cooling in Ma’an
Comparison between a wet cooling and dry cooling plant is based on two criterias, constant
thermal input and constant capacity. In the constant thermal input the turbine input thermal
energy is fixed, thus the dry cooled will have lower capacity, in the second criteria (used in this
study) the capacity is fixed by adjusting the turbines design point conditions by feeding them
more thermal energy, this adjustment is supported by Greenius and included in the two power
blocks models.
Here two situations are used, the first is using similar design specifications to compare the output
and performance of both plants and the other is by using the optimized plants.
As mentioned before the base wet cooled plant is the optimized plant for Ma’an site conditions,
in the dry similar to the wet only the cooling system is changed keeping the solar field and
storage fixed, while in the optimized design the dry cooled plant is optimized to meet the
economic condition of lowest LCOE. It should be indicated that economic results also somehow
represent the best technical performance.
Page 75
Assessment of Dry Cooled Parabolic Trough (CSP) plants
75
5.3.1 Same design
Table5.8: Power output and overall plant efficiency for same design case.
Optimized Wet Plant Dry same design as wet
Month T amb
[°C]
Net power
Gross power
Overall efficiency
Net power
Gross power
Overall efficiency
[MWhe] [MWhe] [%] [MWhe] [MWhe] [%] Jan 6.28 7308.4 8131.1 8.70 6585.8 7334.7 7.84 Feb 10.64 7705.8 8689.9 11.14 6867.8 7789.0 9.92 Mar 12.60 16622.4 18768.7 15.46 14738.3 16825.7 13.70 Apr 16.63 15392.9 17435.7 16.39 13640.9 15636.5 14.52 May 21.28 18664.4 21182.5 17.32 16730.2 19287.2 15.53 Jun 24.55 23551.8 26829.2 17.03 21331.2 24775.9 15.43 Jul 28.33 23325.6 26552.6 18.31 20489.4 23766.7 16.09 Aug 26.78 22596.9 25735.9 18.27 19824.7 22946.7 16.03 Sep 24.27 17910.7 20374.6 16.74 15403.6 17783.0 14.40 Oct 19.59 13501.7 15139.1 13.88 11704.8 13247.0 12.04 Nov 10.59 9944.5 11086.3 10.84 8867.6 9934.8 9.66 Dec 8.35 7354.3 8179.0 8.73 6575.8 7339.4 7.81
Table5.8 shows the simulation results of the power output and the overall efficiency for the
whole plant. The net power for the wet case and thus for the efficiency was always higher than
for the dry case, due to the lower conversion efficiency the of dry cooled plant; the efficiency
was reduced about 1% for dry cooled, except in June and July about 2%, because the ambient
temperature is higher than design point condition, in cold months January and December the
reduction in efficiency was less than 1%. It is also clear that the difference between the net
power and the gross power increases in summer, because of the high power block parasitics
loads.
in figure5.16 the net power was plotted, it represents the previous table, the net power for the wet
case is always higher than for the dry, but the two plots come closer from [October to march],
where the ambient temperature is low and the dry cooled plant can generate electricity with
efficiency near or higher than the wet cooled, thus the monthly sum of energy becomes similar.
Page 76
Assessment of Dry Cooled Parabolic Trough (CSP) plants
76
Figure5.16: Monthly Net power for same design
Figure5.17 show the parasitics loads for both the dry and wet cooling, where for the wet cooling
case the parasitics is higher, that not means the dry cooling has lower hourly parasitics, because
the monthly value is reduced due to the lower operating hours because it requires higher thermal
input, thus the full load hours are lower than for the wet cooling, this is the main reason
justifying the figure.
Figure5.17: Monthly parasitics loads for same design
In the next figure5.18, the overall wet cooled plant efficiency is higher than the dry cooling
efficiency because It operates more hours and the dumped solar energy is reduced by larger
storage. But the difference in both efficiencies is reduced in colder months due to higher
Page 77
Assessment of Dry Cooled Parabolic Trough (CSP) plants
77
conversion efficiency of dry cooled plants, but still it is lower than the wet because the
irradiation is not enough to operate the dry cooled plant in many hours.
Figure5.18: Monthly overall efficiency for same design
5.3.2 Optimized design
Here in this case the turbines design point is different than the wet case, where more thermal
input is fed and the conversion efficiency is lower than for the wet cooled condenser, this was
discussed in section 3.3. The solar field area and the storage capacity are adjusted and optimized
in section5.2; table 5.9 shows the power output and the overall efficiency for both the optimized
dry and wet cooling cases.
Page 78
Assessment of Dry Cooled Parabolic Trough (CSP) plants
78
Table5.9: Power output and overall plant efficiency for Optimized design case
Optimized Wet Plant Optimized Dry Plant
Month T amb
Net power
Gross power
Overall efficiency
Net power
Gross power
Overall efficiency
[°C] [MWh] [MWh] [%] [MWh] [MWh] [%] Jan 6.28 7308.4 8131.1 8.70 7580.9 8474.34 7.86 Feb 10.64 7705.8 8689.9 11.14 7862.29 8958.74 9.90 Mar 12.60 16622.4 18768.7 15.46 16696.7 19133.3 13.53 Apr 16.63 15392.9 17435.7 16.39 15365.7 17667.9 14.26 May 21.28 18664.4 21182.5 17.32 18423 21277.7 14.90 Jun 24.55 23551.8 26829.2 17.03 22951.5 26658.8 14.48 Jul 28.33 23325.6 26552.6 18.31 22546 26192 15.44
Aug 26.78 22596.9 25735.9 18.27 22065 25610.1 15.56 Sep 24.27 17910.7 20374.6 16.74 17607.9 20415 14.34 Oct 19.59 13501.7 15139.1 13.88 13414.3 15261.1 12.03 Nov 10.59 9944.5 11086.3 10.84 10133.1 11406.2 9.62 Dec 8.35 7354.3 8179.0 8.73 7527.08 8434.73 7.79
Figure5.19 shows the monthly net power, it is clear that both outputs are identical except for the
small extra power in the dry case at low ambient temperature, but the dry plant has 20 loops
more than the wet plant, also from this figure we can prove that the optimization led us to see
that the required outputs are identical, which is good for the comparison. If the plant is in a
location hotter than Ma’an, the solar field would then be larger to reach for results similar to this.
Page 79
Assessment of Dry Cooled Parabolic Trough (CSP) plants
79
Figure5.19: Monthly Net power for Optimized design case
Figure5.20 shows the overall efficiency where the dry cooled plant is subjected to [2-2.88]%
efficiency reduction in summer, but only [0.85-1.2]% reduction in winter. Compared to the
previous case the difference between the wet and dry condition is increased because of higher
dumped energy in summer resulted from larger solar field.
Figure5.20: Monthly overall efficiency for Optimized design case
Page 80
Assessment of Dry Cooled Parabolic Trough (CSP) plants
80
The next table includes the monthly power block parasitics loads that are also plotted in
figure5.21, the reason for including this table is to show why the overall efficiency reduced and
where the extra thermal input goes, another factor is the lower conversion efficiency due to
higher turbine’s back pressure.
Table5.10: Power block parasitics for Optimized design case
The previous table is plotted in figure5.21, it is clear that the parasitics load is higher for dry
cooling, where in summer the difference increased due to the high ambient temperature,
assuming that both cases operate for the same number of hours because of enough solar energy
in summer that also able them to operate 7.5 hours at night, on the contrary for the period
between October to march where there is nearly no deference between the two figures due to
two reasons, the first is the low ambient temperature where the fans run at lower speed, the
second reason is the lower number of operation hours of the dry cooled plant because it requires
high thermal input.
Wet Dry
Month [MWhe] [MWhe] Jan 408.412 446.995 Feb 499.151 564.466 Mar 1055.32 1227.22 Apr 993.996 1136 May 1205.58 1372.41 Jun 1536.83 1735.88 Jul 1526.7 1728.72
Aug 1484.67 1685.57 Sep 1162.46 1352.44 Oct 862.376 996.269 Nov 640.943 726.179 Dec 474.243 528.993
Page 81
Assessment of Dry Cooled Parabolic Trough (CSP) plants
81
Figure5.21: Dry cooled power block parasitics for Optimized design case
In table5.11 the summary of the previous cases are tabulated, where the dry cooling case similar
to the wet design is just used for comparison, because it is not optimized it does not give the
maximum possible energy yield. Both the optimized wet and dry cases for Ma’an are the logical
technical and economical cases for comparison, because they have nearly similar output
requirements, the Dry cooling has 16.121% (2.07c€/kWhe) higher in LCOE and 16.417% in the
investment cost. The optimization of the wet plant in Ma’an was essential because the higher
DNI in Ma’an made the Andasol wet design operate at lower performance due to the high
dumped solar energy; this was justified by the optimized dry case in Ma’an nearly similar to the
wet case in Spain but with higher energy yield and thus lower LCOE.
Page 82
Assessment of Dry Cooled Parabolic Trough (CSP) plants
82
Table5.11: Summary of all technical simulation results
Number of loops
Effective mirror
area
Thermal output of solar filed
Energy yield
Full load hours
Capacity factor
Investment cost
LCOE
------ [m²] [Mwht] [MWhe] [Hours] [%] [€] [€/KWhe] Optimized Wet/Ma’an
136 444720 562028.1 183879.4 4162 41.98 248 384 064 0.1284 Dry similar to Wet design/Ma’an
136 444720 563128.2 162310.3 3719 37.06 259 844 561 0.1514 Optimized Dry/Ma’an
156 510120 645061.7 182173.5 4190 41.59 289161894 0.1491 Andasol Wet/Spain
156 510120 442908.3 134715.8 3468 31.71 274 259 498 0.1967 Andasol Dry/Spain
156 510120 458833.01 126184.27 3175 28.81 282 859 352 0.2183 Andasol Wet/Ma’an
156 510120 625580.2 191999.2 4345 43.84 274 259 498 0.142 Andasol Dry/Ma’an
156 510120 626682.2 178232.3 4093 40.69 285 719 994 0.1587
After the optimization of the plant in Ma’an the technical specifications of both options are
tabulated in table 5.12, where larger size of the dry plant is adopted to give the same capacity at
the design point conditions.
Page 83
Assessment of Dry Cooled Parabolic Trough (CSP) plants
83
Table5.12: Technical comparison between expected plants in Ma’an
Comparison between two plants in Ma’an Item Unit Wet Dry
General characteristics Direct normal irradiation [kWh/(m²·a)] 2802.2 2802.2
Annual Thermal output of solar filed [MWhth] 562028.1 645061.7 Annual Energy yield [MWhel] 183879.4 182173.5
Full load hours [h/a] 4162 4190 Capacity factor [%] 41.98 41.59
Plant area [m²] 1710000 2010000 Water consumption [m3/a] 717981 41820
Solar field Aperture area [m²] 444720 510120
Solar multiplier --- 1.74 2 Number of loops --- 136 156
Storage Cold tank temperature [C] 292 C 292 C Hot tank temperature [C] 386 C 386 C
Full load hours hours 7.5 7.5 Capacity [MWht] 970 1100
Power Block Turbine --- SST-700 SST-700
Nominal Capacity [MW] 50.0 50.0 Conversion efficiency [%] 38 34 Design Back Pressure [bar] 0.08 0.144
Thermal Input [MWt] 129.2225 147.440
Page 84
Assessment of Dry Cooled Parabolic Trough (CSP) plants
84
Figure5.22: main operational charctersitics of the expexted dry plant in ma’an,(23-Jun)
The red line is the thermal power of the solar field, its coincident with the DNI, the green line is
the charging and discharging of TES during the day, while the blue line is the net electrical
output power, it increases during night due to lower ambient temperature and the very low solar
field parasitics mainly the pumping parasitics.
5.4 Economic Comparison between wet and dry cooling in Ma’an
In table5.13 all the costs and financial inputs are repeated but with small adjustment, two project
periods are simulated with two minimum required internal rate of returns, also one soft loan is
used.
Page 85
Assessment of Dry Cooled Parabolic Trough (CSP) plants
85
Table5.13: Economic Simulation inputs for Jordan (Costs, Financing, and Timing)
Economic inputs Costs Financing
Non-C
onventional Costs
Reference year 2011 minimum required internal rate of return6% 9%
specific costs 320 €/m² Financing sources
specific O&M costs 4 €/m² Grant Funding
None conventional 0% 30% 60%
specific replacement costs 0.2%/a Conventional 0%
Guarantee period 0 Dept funding 70% specific insurance cost 0%/a Equity Funding 30%
Conventional costs-Pow
er B
lock
Reference year 2011 Dept financing
land use Wet 10000m² Dry 30000m² loan w
ith portfolio
Share 100%
specific costs Wet 800 €/kw Dry 1000€/kw
Interest rate 5.3%,5.4%,5.5%,6%
specific O&M costs 3 €/m² Dept term 10,15,17,18,20 years specific replacement costs 0.2%/a Upfront fee 0%
Guarantee period 0 Commitment fee 0.4% of amount drownspecific insurance cost 0%/a grace period 0
Storage
Reference year 2010 bridge loan No land use 7500 Timing-(Project Schedule)
specific costs 35 €/kwth Reference year of discounting 2012 specific O&M costs 1 €/m² Construction period 2 years
specific replacement costs 0.2%/a Upfront fee 0% Guarantee period 0 First year of operation 2014
specific insurance cost 0%/a Operation period 30 years 40 years
Other C
osts
infrastructure costs 0 bridge loan No Project development 5% Depreciation type linear
insurance during construction
1% Depreciation period 15 years
supervision and Startup 3% Cost distribution during construction
25% per half year contingencies 5%
The simulation results show that the project is not economically feasible according to Jordan
electricity prices without feed in tariff, even without taxes on renewables. Table5.14 shows the
Page 86
Assessment of Dry Cooled Parabolic Trough (CSP) plants
86
financial inputs that are simulated, two cases are tabulated in table 5.15 and table 5.16
consequently.
Table5.14: Simulated financial inputs
project period
Electricity Tariff
min required
IRR 30 0.084 6% 30 0.084 9% 40 0.084 6% 40 0.084 9%
Table 5.15: Economic comparison between expected plants in Ma’an (sample one)
Cooling type Comparison element
Wet Dry Unite
Project period 30 30 years Electricity tariff 0.084 0.084 €/kWhe
Minimum required IRR 6 6 % Simulation results
Internal Rate of Return (IRR) on Equity -0.31 -2.12 % Net Present Value -109.41 -157.94 million € Payback Period 0 0 yrs.
Discounted Payback Period 0 0 yrs. Total Incremental Costs 198 520 169 248 590 623 €
Minimum ADSCR 0.35 0.28 Required Tariff (LCOE) 0.13 0.151 €/kWh
Incremental LEC 0.078 0.099 €/kWhe Calculation of LEC
Levelized Electricity Costs (LEC) 0.1284 0.1491 €/kWhe Total Investment Costs (IC) 248 384 064 289 161 894 €
Annuity of IC 0.0726 0.0726 NPV of Running Costs (OC) 76 689 532 84 808 070 €
Annuity of OC 0.0726 0.0726 Environmental Aspects:
Annual CO2 Reduction 116211.8 115133.6 tCO2 CO2 Avoidance Costs 124.1 156.86 €/tCO2
Page 87
Assessment of Dry Cooled Parabolic Trough (CSP) plants
87
Table5.16: Economic comparison between expected plants in Ma’an (sample two)
5.5 Suggestions to make the project economically feasible
The pervious simulations showed that the project was not feasible under the economic conditions
in Jordan, thus some essential suggestions are simulated that will make the project feasible.
Those are the minimum required tariff, the minimum required grant, and the tariff with grant.
During simulation of the three mentioned cases, the loan portfolio changed to increase the
ADSCR, the factor should be more than one, unless the project has a shortage of liquid assets;
also the loan portfolio was changed in each case according to the required minimum ADSCR.
Cooling type Comparison element
Wet Dry Unite
Project period 40 40 years Electricity tariff 0.084 0.084 €/kWhe
Minimum required IRR 9 9 % Simulation results
Internal Rate of Return (IRR) on Equity 1.6 0.13 % Net Present Value -97.47 -146.89 million € Payback Period 31.14 39.16 yrs.
Discounted Payback Period 0 0 yrs. Total Incremental Costs 193 877 985 244 813 556 €
Minimum ADSCR 0.35 0.28 Required Tariff (LCOE) 0.148 0.172 €/kWh
Incremental LEC 0.07 0.089 €/kWhe Calculation of LEC
Levelized Electricity Costs (LEC) 0.1201 0.1393 €/kWhe Total Investment Costs (IC) 248 384 064 289 161 894 €
Annuity of IC 0.0665 0.0665 NPV of Running Costs (OC) 83 829 104 92 703 455 €
Annuity of OC 0.0665 0.0665 Environmental Aspects:
Annual CO2 Reduction 116211.8 115133.6 tCO2 CO2 Avoidance Costs 110.88 141.32 €/tCO2
Page 88
Assessment of Dry Cooled Parabolic Trough (CSP) plants
88
5.5.1 Minimum required tariff
Table (17&18) show the minimum required tariff, that the project need to be feasible, the wet
plant require 0.152€/kWhe while the dry plant require 0.17€/kWhe. The loan is soft loan with
term 15 years, and interest rate 5.5%, the tariff is more than the required tariff based on required
IRR because of the ratio ADSCR that should be more than one, as mentioned before.
Table5.17: Economic comparison between expected plants in Ma’an with minimum required
tariff (sample one)
Cooling type Comparison element
Wet Dry Unite
Project period 30 30 years Electricity tariff 0.152 0.170 €/kWhe
Minimum required IRR 6 6 % Dept term 15 15 years
interest rate 5.5 5.5 % Simulation results
Internal Rate of Return (IRR) on Equity 9.69 8.8 % Net Present Value 57.91 51.26 million € Payback Period 14.1 15.33 yrs.
Discounted Payback Period 18.59 20.36 yrs. Total Incremental Costs 198 520 169 248 590 623 €
Minimum ADSCR 1.05 1 Required Tariff (LCOE) 0.128 0.148 €/kWh
Incremental LEC 0.078 0.099 €/kWhe Calculation of LEC
Levelized Electricity Costs (LEC) 0.1284 0.1491 €/kWhe Total Investment Costs (IC) 248 384 064 289 161 894 €
Annuity of IC 0.0726 0.0726 NPV of Running Costs (OC) 76 689 532 84 808 070 €
Annuity of OC 0.0726 0.0726 Environmental Aspects:
Annual CO2 Reduction 116211.76 115133.62 tCO2 CO2 Avoidance Costs 124.1 156.86 €/tCO2
Page 89
Assessment of Dry Cooled Parabolic Trough (CSP) plants
89
Table5.18: Economic comparison between expected plants in Ma’an with minimum required
tariff (sample two)
Cooling type Comparison element
Wet Dry Unite
Project period 40 40 years Electricity tariff 0.152 0.17 €/kWhe
Minimum required IRR 9 9 % Dept term 15 15 years
interest rate 5.5 5.5 % Simulation results
Internal Rate of Return (IRR) on Equity 10.34 9.54 % Net Present Value 84.96 81.25 million € Payback Period 14.1 15.33 yrs.
Discounted Payback Period 18.59 20.36 yrs. Total Incremental Costs 193 877 985 244 813 556 €
Minimum ADSCR 1.05 1 Required Tariff (LCOE) 0.142 0.165 €/kWh
Incremental LEC 0.07 0.089 €/kWhe Calculation of LEC
Levelized Electricity Costs (LEC) 0.1201 0.1393 €/kWhe Total Investment Costs (IC) 248 384 064 289 161 894 €
Annuity of IC 0.0665 0.0665 NPV of Running Costs (OC) 83 829 104 92 703 455 €
Annuity of OC 0.0665 0.0665 Environmental Aspects:
Annual CO2 Reduction 116211.8 115133.62 tCO2 CO2 Avoidance Costs 110.88 141.32 €/tCO2
Page 90
Assessment of Dry Cooled Parabolic Trough (CSP) plants
90
5.5.2 Minimum required grant
Table (19&20) show the minimum required grant, that the project need to be feasible, the wet
plant require 123810048€ The loan is soft loan with term 18 years, and interest rate 5.5%, while
the dry plant require 163238400€ with loan term 20 years, and interest rate 5.3%,. The tariff in
both cases is 0.084€/kWhe which is the electricity price in Jordan.
Table5.19: Economic comparison between expected plants in Ma’an with grant (sample one)
Cooling type Comparison element
Wet Dry Unite
Project period 30 30 years Electricity tariff 0.084 0.084 €/kWhe
Minimum required IRR 6 6 % Grant 123810048 163238400 million €
Dept term 18 20 years interest rate 5.5 5.3 %
Simulation results Internal Rate of Return (IRR) on Equity 7.63 6.36 %
Net Present Value 11.84 2.46 million € Payback Period 16.56 18.41 yrs.
Discounted Payback Period 23.77 28.39 yrs. Total Incremental Costs 198 520 169 248 590 623 €
Minimum ADSCR 1.02 1 Required Tariff (LCOE) 0.079 0.083 €/kWh
Incremental LEC 0.078 0.099 €/kWhe Calculation of LEC
Levelized Electricity Costs (LEC) 0.1284 0.1491 €/kWhe Total Investment Costs (IC) 248 384 064 289 161 894 €
Annuity of IC 0.0726 0.0726 NPV of Running Costs (OC) 76 689 532 84 808 070 €
Annuity of OC 0.0726 0.0726 Environmental Aspects:
Annual CO2 Reduction 116211.76 115133.62 tCO2 CO2 Avoidance Costs 124.1 156.86 €/tCO2
Page 91
Assessment of Dry Cooled Parabolic Trough (CSP) plants
91
Table5.20: Economic comparison between expected plants in Ma’an with grant (sample two)
Cooling type Comparison element
Wet Dry Unite
Project period 40 40 years Electricity tariff 0.084 0.084 €/kWhe
Minimum required IRR 6 6 % Grant 123810048 163238400 million €
Dept term 18 20 years interest rate 5.5 5.3 %
Simulation results Internal Rate of Return (IRR) on Equity 8.55 7.5 %
Net Present Value 23.78 13.52 million € Payback Period 16.56 18.41 yrs.
Discounted Payback Period 23.77 28.39 yrs. Total Incremental Costs 193 877 985 244 813 556 €
Minimum ADSCR 1.02 1 Required Tariff (LCOE) 0.075 0.079 €/kWh
Incremental LEC 0.07 0.089 €/kWhe Calculation of LEC
Levelized Electricity Costs (LEC) 0.1201 0.1393 €/kWhe Total Investment Costs (IC) 248 384 064 289 161 894 €
Annuity of IC 0.0665 0.0665 NPV of Running Costs (OC) 83 829 104 92 703 455 €
Annuity of OC 0.0665 0.0665 Environmental Aspects:
Annual CO2 Reduction 116211.8 115133.62 tCO2 CO2 Avoidance Costs 110.88 141.32 €/tCO2
Page 92
Assessment of Dry Cooled Parabolic Trough (CSP) plants
92
5.5.3 Tariff and grant
Table (21&22) show the minimum set of tariff and grant that are required to make the project
feasible, the wet plant require 0.13€/kWhe, while the dry plant require 0.146€/kWhe, both are
with grant of 50 million€ and loan is soft loan with term 15 years, and interest rate 5.5%.
Table5.21: Economic comparison between expected plants in Ma’an with tariff and grant
(sample one)
Cooling type Comparison element
Wet Dry Unite
Project period 30 30 years Electricity tariff 0.130 0.146 €/kWhe
Minimum required IRR 6 6 % Grant 50 50 million €
Dept term 15 15 years interest rate 5.5 5.5 %
Simulation results Internal Rate of Return (IRR) on Equity 10.17 8.73 %
Net Present Value 52.17 41.33 million € Payback Period 13.3 15.39 yrs.
Discounted Payback Period 17.77 20.51 yrs. Total Incremental Costs 198 520 169 248 590 623 €
Minimum ADSCR 1.08 1 Required Tariff (LCOE) 0.108 0.129 €/kWh
Incremental LEC 0.078 0.099 €/kWhe Calculation of LEC
Levelized Electricity Costs (LEC) 0.1284 0.1491 €/kWhe Total Investment Costs (IC) 248 384 064 289 161 894 €
Annuity of IC 0.0726 0.0726 NPV of Running Costs (OC) 76 689 532 84 808 070 €
Annuity of OC 0.0726 0.0726 Environmental Aspects:
Annual CO2 Reduction 116211.76 115133.62 tCO2 CO2 Avoidance Costs 124.1 156.86 €/tCO2
Page 93
Assessment of Dry Cooled Parabolic Trough (CSP) plants
93
Table5.22: Economic comparison between expected plants in Ma’an with tariff and grant
(sample two)
Cooling type Comparison element
Wet Dry Unite
Project period 40 40 years Electricity tariff 0.130 0.146 €/kWhe
Minimum required IRR 6 6 % Grant 50 50 million €
Dept term 15 15 years interest rate 5.5 5.5 %
Simulation results Internal Rate of Return (IRR) on Equity 10.77 9.47 %
Net Present Value 74.33 66.03 million € Payback Period 13.3 15.39 yrs.
Discounted Payback Period 17.77 20.51 yrs. Total Incremental Costs 193 877 985 244 813 556 €
Minimum ADSCR 1.08 1 Required Tariff (LCOE) 0.102 0.12 €/kWh
Incremental LEC 0.07 0.089 €/kWhe Calculation of LEC
Levelized Electricity Costs (LEC) 0.1201 0.1393 €/kWhe Total Investment Costs (IC) 248 384 064 289 161 894 €
Annuity of IC 0.0665 0.0665 NPV of Running Costs (OC) 83 829 104 92 703 455 €
Annuity of OC 0.0665 0.0665 Environmental Aspects:
Annual CO2 Reduction 116211.8 115133.62 tCO2 CO2 Avoidance Costs 110.88 141.32 €/tCO2
Page 94
Assessment of Dry Cooled Parabolic Trough (CSP) plants
94
Table (23&24) show the minimum set of tariff and grant that are required to make the project
feasible, the wet plant require 0.10€/kWhe, while the dry plant require 0.13€/kWhe, both are
with grant of 100 million€ and loan is soft loan with term 15 years, and interest rate 5.5%.
Table5.23: Economic comparison between expected plants in Ma’an with tariff and grant
(sample three)
Cooling type Comparison element
Wet Dry Unite
Project period 30 30 years Electricity tariff 0.10 0.13 €/kWhe
Minimum required IRR 6 6 % Grant 100 100 million €
Dept term 15 15 years interest rate 5.5 5.5 %
Simulation results Internal Rate of Return (IRR) on Equity 8.92 10.22 %
Net Present Value 27.42 50.32 million € Payback Period 15.22 13.22 yrs.
Discounted Payback Period 20.09 17.69 yrs. Total Incremental Costs 198 520 169 248 590 623 €
Minimum ADSCR 1.01 1.08 Required Tariff (LCOE) 0.089 0.109 €/kWh
Incremental LEC 0.078 0.099 €/kWhe Calculation of LEC
Levelized Electricity Costs (LEC) 0.1284 0.1491 €/kWhe Total Investment Costs (IC) 248 384 064 289 161 894 €
Annuity of IC 0.0726 0.0726 NPV of Running Costs (OC) 76 689 532 84 808 070 €
Annuity of OC 0.0726 0.0726 Environmental Aspects:
Annual CO2 Reduction 116211.76 115133.62 tCO2 CO2 Avoidance Costs 124.1 156.86 €/tCO2
Page 95
Assessment of Dry Cooled Parabolic Trough (CSP) plants
95
Table5.24: Economic comparison between expected plants in Ma’an with tariff and grant
(sample four)
Cooling type Comparison element
Wet Dry Unite
Project period 40 40 years Electricity tariff 0.10 0.13 €/kWhe
Minimum required IRR 6 6 % Grant 100 100 million €
Dept term 15 15 years interest rate 5.5 5.5 %
Simulation results Internal Rate of Return (IRR) on Equity 9.64 10.82 %
Net Present Value 42.92 71.5 million € Payback Period 15.22 13.22 yrs.
Discounted Payback Period 20.09 17.69 yrs. Total Incremental Costs 193 877 985 244 813 556 €
Minimum ADSCR 1.01 1.08 Required Tariff (LCOE) 0.084 0.102 €/kWh
Incremental LEC 0.07 0.089 €/kWhe Calculation of LEC
Levelized Electricity Costs (LEC) 0.1201 0.1393 €/kWhe Total Investment Costs (IC) 248 384 064 289 161 894 €
Annuity of IC 0.0665 0.0665 NPV of Running Costs (OC) 83 829 104 92 703 455 €
Annuity of OC 0.0665 0.0665 Environmental Aspects:
Annual CO2 Reduction 116211.8 115133.62 tCO2 CO2 Avoidance Costs 110.88 141.32 €/tCO2
Page 96
Assessment of Dry Cooled Parabolic Trough (CSP) plants
96
Table (25) shows the minimum set of tariff and grant that are required to make the project
feasible, the wet plant require 0.122€/kWhe, while the dry plant require 0.151€/kWhe, both are
with grant of 100 million€ and loan is soft loan with term 10 years, and interest rate 6%, this
table representing the normal soft loan that is already given to renewable projects, the net present
values for both cases are high because the high tariff compared to the minimum required tariff,
while the ratio ADSCR is equal to one because the loan term is only ten years that lead into high
loan payments the first ten years, by other financial solutions the tariff could be reduced such as
two loans, or another budget to cover the deficit in the first ten years.
Table5.25: Economic comparison between expected plants in Ma’an with tariff and grant
(sample five)
Cooling type Comparison element
Wet Dry Unite
Project period 30 30 years Electricity tariff 0.122 0.151 €/kWhe
Minimum required IRR 6 6 % Grant 100 100 million €
Dept term 10 10 years interest rate 6 6 %
Simulation results Internal Rate of Return (IRR) on Equity 13.02 13.24 %
Net Present Value 77 122.04 million € Payback Period 10.89 10.97 yrs.
Discounted Payback Period 13.16 13.3 yrs. Total Incremental Costs 198 520 169 244 813 556 €
Minimum ADSCR 1.01 1 Required Tariff (LCOE) 0.09 0.104 €/kWh
Incremental LEC 0.078 0.089 €/kWhe Calculation of LEC
Levelized Electricity Costs (LEC) 0.1284 0.1393 €/kWhe Total Investment Costs (IC) 248 384 064 289 161 894 €
Annuity of IC 0.0726 0.0665 NPV of Running Costs (OC) 76 689 532 92 703 455 €
Annuity of OC 0.0726 0.0665 Environmental Aspects:
Annual CO2 Reduction 116211.76 115133.62 tCO2 CO2 Avoidance Costs 124.1 141.32 €/tCO2
Page 97
Assessment of Dry Cooled Parabolic Trough (CSP) plants
97
Chapter 6
Economic Analysis 6.1 Introduction:
The economic feasibility analysis examines the economic effects of the CSP power plant
in Ma’an MDA. Generally the objective of an economic feasibility is to give an assessment from
a macro perspective, whereas the financial feasibility analysis assesses the operators’ point of
view. Thus, the financing costs are not considered within the economic but only in the financial
analysis. The analysis also considers externalities which can be defined as positive or negative
effects that describe the uncovered costs (e.g. pollution in conventional power plants).
Furthermore, since the economic analysis considers the macro-level it does not take into account
cash transfers within the economy. Within an economic feasibility analyses real prices are used
so changes over time aren’t taken into account. The economic feasibility analysis can be further
subdivided into two major parts, the analysis of the direct and the indirect effects respectively.
Direct economic impacts relate only to the construction of new power plants, whereas indirect
effects are economic impacts by demand in the supply value chain. However, most factors have
direct and indirect effects, thus they won’t be separated in this analysis.
6.2 Electricity Prices
Under current estimations the plant will produce electricity at a price of 12.74–15.94 €c/kWh
(without transmission and distribution) which is higher than the end-user price. Thus, in the short
term electricity prices will rise for industry and consumers and thereby negatively affect
competitiveness and reduce the purchasing power. According to different recommended specific
solar filed costs, the most convenient values are 14.19–16.0€c/kWh
6.3 Environmental impacts
The construction and operation of a CSP project leads to several environmental and social
impacts that have to be identified, assessed, monitored and mitigated. Therefore, this project
follows environmental guidelines of the respective national institutions. Within this section the
Page 98
Assessment of Dry Cooled Parabolic Trough (CSP) plants
98
major aspects as well as their mitigation are listed; these are site-specific rather than regional.
6.3.1 Plant construction:
• Land use: In the previous chapter, it was shown that the pant required less than 497
acres; this is quite huge for a 50MW conventional plant due to the low energy density of
solar thermal power. Yet, when comparing the required land with other alternatives like
conventional power plants, the land demand for excavation, transport and processing has
to be considered. This plant justifies the need of this land, by other environmental
attractiveness such as the free fuel that doesn’t need excavation and transportation and
zero emission sources. Another important point for site selection, the land used for the
plant itself, and the precluding other use of the adjacent lands are very critical.
Alternative locations were compared previously under the project of EMPOWER and the
site was carefully selected to avoid impact with recreational areas. Furthermore, it is
recommended from this study that the local government makes consultation with nearby
communities, in the other hand this plant is required for this site due to its positive impact
on the development of the area, for that reason the government and MDA interested in
such project.
• Construction impacts: some harmful impacts during construction might occur, these are
evaluated and the plant must put regulations on the consultant to be sure that a safe
construction process is followed that’s also parallel with safe waste disposal. Some
relevant effects from associated infrastructure are also evaluated early in the process for
example opening temporary roads; parking land preparation equipments, labors housings,
here the MDA is prepared well and can supply the required services.
• Fire risks: due to high temperatures at some sections of plant parts including risk of out-
gassing from panel components, mitigation and safety measures against fire are needed,
such as overheating (coolants) and relevant warning / monitoring systems.
• Flora and Fauna: the land is desert that does not mean neglecting those impacts, impacts
of these components on environment are critical; a Re-establishment of local flora and
fauna plan is included to the construction phase if it is urgent and possible.
6.3.2 Plant operation:
• Chemical discharge: There is a risk of ordinary or accidental release of chemicals, e.g.
Page 99
Assessment of Dry Cooled Parabolic Trough (CSP) plants
99
anti-freeze or rust inhibitors in coolant liquids. Also heat transfer fluids are likely to
contain harmful chemicals. Therefore it is essential to include in the plant some safety
measures against such possible releases through leak-proof, regularly maintenance and
cleaning as well as periodical replacements of components.
• Safety issues for workers: due to high levels of radiation workers should use special
sunglasses, hats, skin protection and other protective devices if required.
• Water requirements: this element is the most important and attractive, since this plant is
dry cooled it requires fewer amount of water where the annual consumption is only
41820m3 , while the wet cooled plant requires 717981m3 , that means 94.18% of water
saving, other studies showed that around 93% of water consumption is reduced by dry
cooling. The water consumption is not calculated by Greenius because it is not possible,
thus it is calculated by SAM software under the assumptions of 0.6 l/m² aperture and 63
annual washes, which are recommended by SAM software, table6.1 shows the expected
water consumption monthly.
Table6.1: Expected water consumption for Dry/Wet 50 MW with 7.5 TES in Ma’an-Jordan
Water consumption (m3) 50 MW 7.5 TES
Page 100
Assessment of Dry Cooled Parabolic Trough (CSP) plants
100
Month Wet cooled
[m3] Dry cooled
[m3] Saving
[%] Jan 21870.5 774.8 96.46 Feb 31664.3 1128 96.44 Mar 50395.4 1744 96.54 Apr 68028.8 2240 96.71 May 82907.3 2509 96.97 Jun 92620.0 2668 97.12 Jul 90028.1 2631 97.08 Aug 89484.1 2611 97.08 Sep 74386.7 2298 96.91 Aug 49207.1 1661 96.62 Nov 29990.2 1055 96.48 Dec 20588.6 721.3 96.46
Sum+Other water usage
717981 41820 94.18
NREL study36
3.5m3/Mwh 54900
0.3m3/Mwh633500
91.33
Reflections from the solar field: visual impacts are important when using tower technology, but
since our plant is a parabolic trough, the points of focus of the concentrators will be relatively
close to the reflector itself. However, further consideration should be given to the impacts on any
residences, facilities and transport within line of sight of the reflector field.
Regarding this plant the water and land are not critical, land is available and dry cooling doesn’t
require much water, so due to water scarce in this region such plant is needed. Since it is clean
with no greenhouse gas emissions, and provides a fixed cost of energy produced, this plant is an
attractive feature for Jordan a country that imports 95% of its energy. Also this plant is required
because it’s a good tool for the government to meet the national renewable energy plan, the
major thing that should be taken into consideration in this environmental study is to secure
public acceptance of the plant. Therefore we need careful management processes and some
media advertisement to highlight the environmental features, and other social attractiveness such
as job creation, development of local technologies research and educational benefits.
6.3.3 CO2 emission reduction
36 Water Use in Parabolic Trough Power Plants: Summary Results from WorleyParsons' Analyses.P(17)
Page 101
Assessment of Dry Cooled Parabolic Trough (CSP) plants
101
Since this plant will feed the grid with electricity, the amount of CO2 reduction is calculated
based on electricity to carbon conversion factor. Each kWhe of grid electricity participates in
0.632kgCO237 emissions. So the project avoids 115995.69 tonCO2, which is equal to
115.8€/tCO2 based on the country’s electricity prices. Regarding the carbon trading for CSP the
cost is 30$/tCO238 .thus the avoided emission can be sold for 2.4359095million €, as an
additional profit for the plant.
6.4 SWOT Analysis
This section summarizes the effects of the power plant construction in a SWOT analysis.
Strengths: Governmental support, production of clean and sustainable energy at relatively fixed
costs, job creation, reduction of CO2 emissions and CDM potential, provides excellent
conditions for research as well as for technology transfer; the energy storage system supports
the grid, low water consumption and the plant participate in the development of Ma’an.
Table6.2: SWOT analysis table
Strengths: Clean energy at fixed costs,
Weaknesses: low local know-how and operating experience
37 UNEP, 2000 - "The GHG Indicator”
38 Desert Power: The Economics of Solar Thermal Electricity for Europe, North Africa, and the Middle
East(p25)
Page 102
Assessment of Dry Cooled Parabolic Trough (CSP) plants
102
Independent of fossil fuels, Job creation, Research and technology development of Ma’an low water consumption
High electricity prices today Most products have to be imported 2% lower efficiency than wet cooled plant
Opportunities: Development of new industry Reduction of energy costs in the future
Threats: Opposition by local population can’t attract investors without feed in tariff law
Weakness: there is no local know-how and operating experience, all the equipments for
the operation are imported, very high land and water consumption, high LCOE today.
Opportunity: fixed energy price even with rising fossil fuel costs, creation of local
experts and manufactures that will reduce the levelized cost of this technology in the long
run.
Threats: some environmental risks, such as a sand storm which will affect the operation and
cost, a threat that the project may not attract workers due to high solar radiations and difficult
working conditions, social rejection and demonstrations against the power plant.
Comparison between opportunity and threats: It can be seen that the risks can be controlled
which means overcoming the major weakness. Thus, their strengths and opportunities provide a
great chance to contribute to a long term stable and clean energy supply and to foster sustainable
development in Jordan. Furthermore, there is great potential to develop new industries and foster
R&D which both support long term job creation, and technology transfer.
6.5 sensitivity analysis
Since the input costs used in this study affect the Investment cost of the LCOE, and these costs
should be recommended by experts, a search is done on them, table 6.4 shows the cost
assumptions recommended by SAM software the other important simulation software. Also in
table6.5different costs are simulated by Greenius for the optimized wet and dry design in Ma’an.
Page 103
Assessment of Dry Cooled Parabolic Trough (CSP) plants
103
Table6.4: Cost assumptions recommended by SAM software, adjusted to Greenius inputs39 Component Value Unite Value Unite Solar Field 295 $/m²
270 €/m² HTF System 90 $/m²
Storage 80 $/kwht 56 €/kwht Power Block (Wet-Cooled) 940 $/kW 658 €/kw Power Block (Dry-Cooled) 1160 $/kW 812 €/kw
Table6.5: Different simulation results for different specific solar filed cost, including the recommended costs
Investment cost and LCOE for different specific solar field cost Specific solar
filed cost Project Period
Wet Dry LCOE Investment cost LCOE Investment cost
[€/m²] years [€/kWhe] [€] [€/kWhe] [€] Greenius320 25 0.136 248 384 064 0.1580 289 161 894
320 this study 30 0.1284 248 384 064 0.1491 289 161 894 315 30 0.1273 245 839 154 0.1478 286 242 733 310 30 0.1261 243 294 244 0.1465 283 323 571 305 30 0.1249 240 749 334 0.1451 280 404 409 300 30 0.1238 238 204 423 0.1438 277 485 247 295 30 0.1226 235 659 513 0.1425 274 566 086 290 30 0.1214 233 114 603 0.1441 271 646 924 285 30 0.1202 230 569 693 0.1398 268 727 762 280 30 0.1191 228 024 783 0.1415 265 808 601 275 30 0.1179 225 479 872 0.1402 262 889 439
270 SAM 30 0.1167 222 934 962 0.1388 259 970 277 265 30 0.1156 220 390 052 0.1375 257 051 116 260 30 0.1144 217 845 142 0.1362 254 131 954 255 30 0.11.32 215 300 232 0.1348 251 212 792 250 30 0.1121 212 755 321 0.1335 248 293 630 245 30 0.1109 210 210 411 0.1322 245 374 469 240 30 0.1097 207 665 501 0.1308 242 455 307
237 DLR study40 30 0.1090 206 138 555 0.127 240 703 810 235 30 0.1085 205 120 591 0.1295 239 536 145
39 Parabolic Trough Reference Plant for Cost Modeling with the Solar Advisor Model (SAM) (p3) 40 EFCOOL- Wassereffiziente Kühlung solarthermischer Kraftwerke (p33)
Page 104
Assessment of Dry Cooled Parabolic Trough (CSP) plants
104
The simple sensitivity analysis is made by a separate excel sheet based on several simulation
results, because Greenius has no option for sensitivity, starting with 100% of base value which is
the original result of this study, then the investment cost is increased and reduced keeping all
other inputs fixed, the same method done for O&M costs of solar field. The energy yield was
difficult to change, so the characteristics of storage and solar field were changed, keeping the
investment cost and the variable costs at the same values of the original case, the result was
changing in energy yield as required without any other changes, separate excel tools can be used
rather than this, see table6.6.
Table6.6: Sensitivity analysis
Sensitivity
Investment cost Annual solar field
O&M costs Annual Energy Yield Percent
of base IC LCOE O&M LCOE EY LCOE [€] [€/kWhe] [€] [€/kWhe] [MWhe ] [€/kWhe] [%]
346994272.8 0.1768 2448576 0.1514 218608.200 0.1290 120 332536178.1 0.1719 2346552 0.1508 209499.525 0.1361 115 318078083.4 0.1653 2244528 0.1503 200390.850 0.1411 110 303619988.7 0.1583 2142504 0.1497 191282.175 0.1433 105 289161894.0 0.1491 2040480 0.1491 182173.500 0.1491 100 274703799.3 0.1455 1938456 0.1486 173064.825 0.1528 95 260245704.6 0.1389 1836432 0.148 163956.150 0.1565 90 245787609.9 0.1323 1734408 0.1475 154847.475 0.1735 85 231329515.2 0.1257 1632384 0.1469 145738.800 0.1867 80
The sensitivity results shown in the previous table are plotted in figure6, the blue line describes
the investment cost, it is obvious that LCOE reduced as the investment cost decreased.10% and
20% increase in IC resulted in 1.62c€ and2.77c€ increase in LCOE consequently, 10% and 20%
decrease in IC resulted in 1.02c€ and2.34c€ decrease in LCOE consequently, the reduction of IC
cost is the more convenient. the red line describes the solar field operating and maintenance
costs, also the LCOE reduced as the O&M costs decreased.10% and 20% increase in O&M costs
resulted in 0.12c€ and 0.23c€ increase in LCOE consequently, 10% and 20% decrease in IC
resulted in 0.11c€ and0.22c€ decrease in LCOE consequently. The Energy yield is inversely
proportional to the LCOE, 10% and 20% increase in EY resulted in 0.8€ and2.01c€ decrease in
LCOE consequently, 10% and 20% decrease in EY resulted in 0.74c€ and 3.76c€ increase in
Page 105
Assessment of Dry Cooled Parabolic Trough (CSP) plants
105
LCOE consequently
Figure6.1: LCOE senstivity analysis
Jordan today is highly dependent on imported fossil fuels, (for example the frequent cuts of the
imported Egyptian gas, costs the government 3 million Euro daily). This situation is expected to
worsen due to economic growth and rising prices for fossil fuels on international markets. Thus,
renewable energy provides a good solution despite higher prices today. Solar energy plays a
strong role in the ambitious plans of the Jordanian government which is to reach a 10%
renewables share by 2020, so CSP is one of the promising renewable technologies for Jordan.
The economic analysis identified large positive effects which can be achieved by the application
of solar thermal power in Jordan. Yet, most of them (development of new industry, reduction of
fossil fuel imports, job creation, development in south of Jordan etc.) only come into effect when
CSP technology is applied on a wider basis. Thus, the results of a single plant with 50MW are
rather low – yet, large potential when a shift to more CSP is undertaken as expected.
The SWOT analysis summarized the results of all previous chapters. It was concluded, that
despite higher electricity prices today the strengths and opportunities outweigh the threads and
weaknesses.
Page 106
Assessment of Dry Cooled Parabolic Trough (CSP) plants
106
Conclusions
It will be a 50MW solar thermal power plant operating on a dry cooled (air cooled) Rankine
cycle with thermal storage for 7.5 hours. The proposed turbine is the SST-700 from Siemens, for
the solar field the SKAL-ET150 from Solar Millenium is selected. Based on the ground data
from enerMENA station in the site and a North-South installation, the expected yield reached
around 182173.5MWhe. This yearly amount is greater than the yearly output of Andasol-1 (a wt
cooled plant in Spain) which generates around 134715.8 MWhe and has the same power and
storage capacity as proposed plant; this can be attributed to the higher direct normal radiation in
Ma’an.
Constant-capacity design was assumed, thus the dry plant has a larger turbine and solar field to
accommodate the lower cycle efficiency, The expected wet cooled plant in Ma’an has 444720
m2 effective solar field area, with 183879.4MWhe annual energy yield, 4162 operating hours,
14.9% annual mean overall efficiency, a capacity factor of 41.98 and water consumption of
717981 m3/a.
While the dry plant has 523200 m2 effective solar field area, with 182173.5MWhe energy
yield, 4190 operating hours, 12.9% annual mean overall efficiency, a capacity factor of 41.59%,
and water consumption of 41820 m3/a,
In addition, the annual mean overall efficiency is 12.9% which is low compared to the current
fossil fuel technology like the combined cycle that can have an efficiency of 60%. It should be
pointed out that the solar irradiation that falls in the areas between the collectors is accounted for
in this efficiency.
The solar field area increased by 17.64%, the efficiency reduced by 2%, the water consumption
reduced by 91.3%, the energy yield reduced by0.93%, the investment cost increased by 16.42%,
the LCOE increased by 16.12%.
A dry cooled plant in Ma’an will have the same solar field size as the Andasol wet cooled plant,
but with a larger turbine; both have the same TES full load hours (7.5 hours), but instead of a
970MWht thermal capacity in Andasol a 1100MWht in Ma’an, because of higher thermal input
of dry cooled turbine at same capacity. And the expected Energy yield is 35.23% higher than
Andasol.
The technical simulation showed good results, because Ma’an has high DNI and Normal ambient
Page 107
Assessment of Dry Cooled Parabolic Trough (CSP) plants
107
temperatures, from technical point of view the dry cooling option in Ma’an still very good, but
CSP technologies are expensive. The economic simulation showed that the project is unfeasible
if the energy to the grid is sold at the same price of Jordanian electricity 0.084€/kWhe, without
feed in tariff. Different suggested financial scenarios have been simulated to make the project
feasible. The minimum required tariff 0.17€/kWhe, or a grant of 163.3 million €, or
(0.146€/kWhe with 50 million €), or (0.13€/kWhe with 100 million €)
Page 108
Assessment of Dry Cooled Parabolic Trough (CSP) plants
108
Recommendations
• Water recourses are not restriction factors against CSP in Ma’an, dry cooling requires less
amounts, and the performance is not affected too much, because of high attitude and very
low hours with extreme ambient temperatures
• This result is site specific, for other locations with high ambient temperatures,
improvements in the cooling system and re-optimization are essential.
• Active approach to support the build-up of local industry and local added value (inclusion
in tenders).
• Active approach to get support from local communities.
• Usage of soft loans and grants from international and regional donors,
• Thinking of selling electricity to neighbor countries that have high electricity prices,
Ma’an wins from the development of its area, and experts are prepared for further
Jordanian projects