146
Evaluation of EmployAbility (Supported Employment) Service Submitted to Department of Social Protection Prepared by Indecon International Economic Consultants www.indecon.ie February 2016
Evaluation of EmployAbility (Supported Employment) Service
Submitted to
Department of Social Protection
Prepared by
Indecon International Economic Consultants
www.indecon.ie
February 2016


Contents Page
Indecon International Economic Consultants
Evaluation of EmployAbility (Supported Employment) Service
i
Executive Summary i
1 Introduction, Background and Methodology 1
1.1 Introduction 1 1.2 Background and Terms of Reference 1 1.3 Methodological Approach to Evaluation 2 1.4 Overview of Previous Research re Supported Employment Model 6 1.5 Outcomes from Previous Review of Supported Employment Service 11 1.6 Report Structure 12 1.7 Acknowledgements and Disclaimer 12
2 Overview of EmployAbility 14
2.1 Introduction 14 2.2 Overview of EmployAbility and Project Aims and Objectives 14 2.3 Geographical Distribution of EmployAbility Services 15 2.4 Target Groups and Eligibility 18 2.5 Activities undertaken by EmployAbility 18
3 Assessment of Effectiveness and Efficiency of Service 21
3.1 Introduction 21 3.2 Service Inputs 21 3.3 Assessment of Service Effectiveness 22 3.4 Client Experience and Benefits 35 3.5 Employer Experience of Programme 37 3.6 Assessment of Service Efficiency and Cost-Effectiveness 39 3.7 Assessment of Appropriateness of Key Performance Indicators 43 3.8 Assessment of Appropriateness of Service Access Criteria 47 3.9 Summary of Findings 53
4 Assessment of Scale and Scope of Service Provision 55
4.1 Introduction 55 4.2 Background and Contextual Data 55 4.3 Current and Future Demand for Supported Employment 67 4.4 Adequacy of Geographical Coverage to EmployAbility 78 4.5 Summary of Findings 86
5 Assessment of Governance Structures 88
5.1 Introduction 88 5.2 Assessment of Effectiveness of Current Structures 88 5.3 Views of Employer Organisations on Aspects of Service Operation 97 5.4 Summary of Findings 98
6 Overall Conclusions and Recommendations for Future Delivery of Service 100
6.1 Conclusions from Evaluation 100 6.2 Policy Recommendations 108 6.3 Overall Conclusion 109
Contents Page
ii Indecon International Economic Consultants
Evaluation of EmployAbility (Supported Employment) Service
Annex 1 Copy of Questionnaire re Survey of EmployAbility Clients 110
Annex 2 Survey of Employer Organisations – Copy of Questionnaire 112
Annex 3 Overview of Stakeholder Consultations 115
Annex 4 Additional Background and Contextual Data 119

Tables, Figures & Boxes Page
Indecon International Economic Consultants
Evaluation of EmployAbility (Supported Employment) Service
iii
Table 1.1: Number of Responses to Survey Research Streams 5
Table 2.1: Regional Breakdown of EmployAbility 16
Table 3.1: Budget and Expenditure of EmployAbility Service – 2010-2014 21
Table 3.2: Costs of EmployAbility Programme 2012 - 2014 22
Table 3.3: Number of Referrals to EmployAbility 22
Table 3.4: Number of Active Clients in EmployAbility 23
Table 3.5: Number of Active Clients in EmployAbility – Company Breakdown* 24
Table 3.6: Client Exits from EmployAbility 25
Table 3.7: Client Exits from EmployAbility – Company Breakdown 26
Table 3.8: EmployAbility – % of Clients Exiting Programme while in Employment (excluding Clients who Dropped Out/Did Not Complete * 27
Table 3.9: Key Performance Indicators - % of Active Clients in Employment with Support from Service - Company Breakdown 29
Table 3.10: Key Performance Indicators – Number of Clients in Employment while Active on the EmployAbility Programme 30
Table 3.11: Key Performance Indicators - % of Clients Exiting Programme while in Employment – Company Breakdown 31
Table 3.12: Sustainability of Employment Outcomes – Number of Persons in Employment 6 Months after Exit 32
Table 3.13: Breakdown of Exits from EmployAbility by Destination/Reason 33
Table 3.14: Closures from Illness Benefit for Claimants of more than 6 months 34
Table 3.15: Views of EmployAbility Service Clients as to Whether they would have provided opportunities in the Absence of the Programme 35
Table 3.16: EmployAbility Participant Views on Experience and Impact of Service 36
Table 3.17: Employer Organisation Views on Success of EmployAbility in Meeting its Objectives 39
Table 3.18: Costs of EmployAbility Programme per Client Supported – 2010-2014 40
Table 3.19: Measures of Cost Effectiveness of EmployAbility Service - Service Expenditure / Exits to Employment 40
Table 3.20: Measures of Cost Effectiveness of EmployAbility Service - Cost per Job Sustained 41
Table 3.21: Key Performance Indicators – Job Coach Ratio 41
Table 3.22: Key Performance Indicators – Job Coach Ratio (Clients per Job Coach) – Company Breakdown – 2014 42
Table 3.23: Summary of Key Performance Indicators Currently Maintained by EmployAbility 43
Table 3.24: EmployAbility Key Performance Indicators – Summary Assessment of Indicator Quality 45
Table 3.25: Breakdown of EmployAbility Referrals by DSP Social Welfare Payment Type - 2014 Referrals 49
Table 4.1: Numbers in Receipt of Social Welfare Payment 69
Table 4.2: Recipients of Disability Allowance by Age in 2014 69
Table 4.3: Recipients of Illness Benefit by Age in 2014 70
Table 4.4: Recipients of Invalidity Pension by Age in 2014 71
Table 4.5: Number receiving Disability Allowance as at July 2015 72
Table 4.6: Number receiving Illness Benefit as at August 2015 72

Tables, figures & boxes Page
iv Indecon International Economic Consultants
Evaluation of EmployAbility (Supported Employment) Service
Table 4.7: Potential Demand for EmployAbility: Persons with a Disability aged 18 to 65 outside the Labour Force 74
Table 4.8: Annual Change in Numbers with a Disability and Numbers of EmployAbility Referrals and Clients 74
Table 4.9: Demand for EmployAbility – Definition based on Number of Persons with a Disability aged 18 to 65 who are Unemployed 75
Table 4.10: Annual Change in Numbers with a Disability that are unemployed and Numbers of EmployAbility Referrals and Clients 75
Table 4.11: Demand for EmployAbility – Definition based on Number of Persons aged 25 to 65 in receipt of a Disability-related Social Welfare Payment 76
Table 4.12: Demand for EmployAbility: Waiting Times 77
Table 4.13: Number of Referrals to EmployAbility – Regional Breakdown 83
Table 4.14: Recipients of Social Welfare Payments by County in 2014 84
Table 4.15: Demand for EmployAbility by Region – Definition based on Number of Persons aged 25 to 65 in receipt of a Disability-related Social Welfare Payment 85
Table 5.1: Analysis of Average Unit Costs of Service Provision by EmployAbility Company – Average Expenditure per Client – 2012-2014 90
Table 5.2: EmployAbility Companies – Company Structures – Size of Boards of Directors 92
Table 5.3: Levels of Satisfaction/Dissatisfaction among Employer Organisations with Aspects of Administration of EmployAbility Service 97
Table 6.1: EmployAbility – Summary of Service Activity Levels and Progression Outcomes – 2010-2014 101
Table 6.2: Summary of Policy Recommendations from Evaluation 109
Figure 1.1: Methodological Approach and Work Programme for Review 3
Figure 2.1: Catchment Areas of EmployAbility companies 17
Figure 2.2: Stages of EmployAbility Service 19
Figure 3.1: Satisfaction Levels with the EmployAbility Service 36
Figure 3.2: Views of Employer Organisations on Benefits of Involvement with EmployAbility 37
Figure 3.3: Views on Benefits of EmployAbility to Clients 38
Figure 4.1: Population with a Disability by Age Group – 2011 Census 55
Figure 4.2: Population with a Disability by Age Group (Census 2011) 56
Figure 4.3: Labour Force Participation of Persons with Disabilities – Census 2011 57
Figure 4.4: Labour Force Participation of Persons with Disabilities – Census 2011 58
Figure 4.5: Persons with Disabilities at Work – Census 2011 59
Figure 4.6: Unemployed Persons with Disabilities looking for their First Job – Census 2011 60
Figure 4.7: Unemployed Persons with Disabilities that Lost or Left their Previous Job – Census 2011 61
Figure 4.8: Unemployed Persons with Disabilities by Disability Type – Census 2011 62
Figure 4.9: Highest Education Attained by Persons with Disabilities – Census 2011 63
Figure 4.10: Education Profile of Persons with Disabilities – Primary to Secondary – Census 2011 64
Figure 4.11: Education Profile of Persons with Disabilities – Post Secondary – Census 2011 65
Figure 4.12: Education Profile of Persons with Disabilities – Third Level – Census 2011 66

Tables, Figures & Boxes Page
Indecon International Economic Consultants
Evaluation of EmployAbility (Supported Employment) Service
v
Figure 4.13: Trends in Numbers in Receipt of Disability Allowance and Illness Benefit 71
Figure 4.14: Total Persons with a Disability by Region – Census 2011 78
Figure 4.15: Number of People with a Disability by County 79
Figure 4.16: Population with a Disability as a Percentage of Total Population by County 80
Figure 4.17: Numbers of Referrals to EmployAbility 2014 81
Figure 4.18: Numbers of Active Clients on EmployAbility 2014 82
Figure 5.1: Schematic Overview of EmployAbility Governance Structures 89
Figure 5.2: Analysis of Average Unit Costs of Service Provision by EmployAbility Company – Relationship between Average Unit Costs and Number of Active Clients 91

Executive Summary
Indecon International Economic Consultants
Evaluation of EmployAbility (Supported Employment) Service
i
Executive Summary
Introduction, Background and Methodology
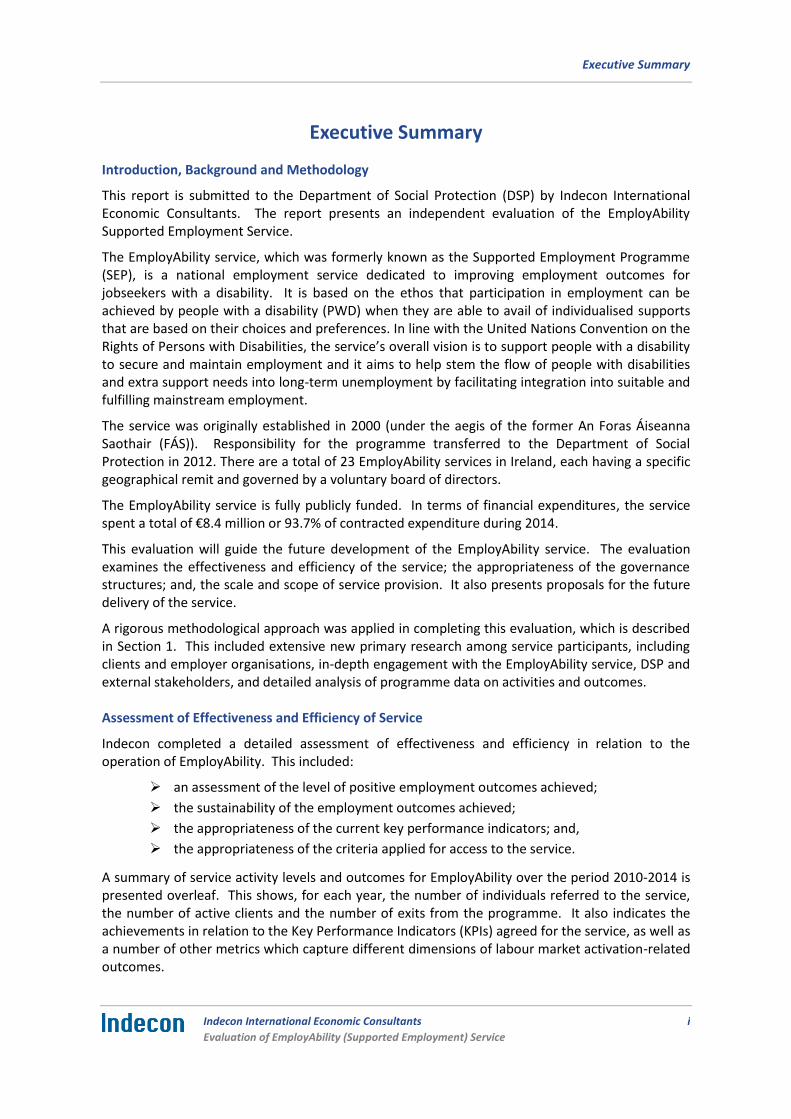
This report is submitted to the Department of Social Protection (DSP) by Indecon International Economic Consultants. The report presents an independent evaluation of the EmployAbility Supported Employment Service.
The EmployAbility service, which was formerly known as the Supported Employment Programme (SEP), is a national employment service dedicated to improving employment outcomes for jobseekers with a disability. It is based on the ethos that participation in employment can be achieved by people with a disability (PWD) when they are able to avail of individualised supports that are based on their choices and preferences. In line with the United Nations Convention on the Rights of Persons with Disabilities, the service’s overall vision is to support people with a disability to secure and maintain employment and it aims to help stem the flow of people with disabilities and extra support needs into long-term unemployment by facilitating integration into suitable and fulfilling mainstream employment.
The service was originally established in 2000 (under the aegis of the former An Foras Áiseanna Saothair (FÁS)). Responsibility for the programme transferred to the Department of Social Protection in 2012. There are a total of 23 EmployAbility services in Ireland, each having a specific geographical remit and governed by a voluntary board of directors.
The EmployAbility service is fully publicly funded. In terms of financial expenditures, the service spent a total of €8.4 million or 93.7% of contracted expenditure during 2014.
This evaluation will guide the future development of the EmployAbility service. The evaluation examines the effectiveness and efficiency of the service; the appropriateness of the governance structures; and, the scale and scope of service provision. It also presents proposals for the future delivery of the service.
A rigorous methodological approach was applied in completing this evaluation, which is described in Section 1. This included extensive new primary research among service participants, including clients and employer organisations, in-depth engagement with the EmployAbility service, DSP and external stakeholders, and detailed analysis of programme data on activities and outcomes. Assessment of Effectiveness and Efficiency of Service
Indecon completed a detailed assessment of effectiveness and efficiency in relation to the operation of EmployAbility. This included:
an assessment of the level of positive employment outcomes achieved;
the sustainability of the employment outcomes achieved;
the appropriateness of the current key performance indicators; and,
the appropriateness of the criteria applied for access to the service.
A summary of service activity levels and outcomes for EmployAbility over the period 2010-2014 is presented overleaf. This shows, for each year, the number of individuals referred to the service, the number of active clients and the number of exits from the programme. It also indicates the achievements in relation to the Key Performance Indicators (KPIs) agreed for the service, as well as a number of other metrics which capture different dimensions of labour market activation-related outcomes.

Executive Summary
ii Indecon International Economic Consultants
Evaluation of EmployAbility (Supported Employment) Service
EmployAbility – Summary of Service Activity Levels and Progression Outcomes – 2010-2014
Targets 2010 2011 2012 2013 2014
Number of Referrals 2,075 2,257 2,134 2,709 3,151
Number of Active Clients 2,704 2,903 2,762 2,862 2,936
Total Programme Exits 1,768 2,048 2,254 2,449 2,651
Key Performance Indicators (KPIs)
% of Clients in Employment with Support from the Service
50% 35.1% 35.6% 36.6% 29.1% 41.9%
% of Clients Exiting the Programme While in Employment
50% 18.6% 18.5% 29.2% 28.0% 33.6%
Job Coach Ratio (Job Coaches : Clients) 1:25 1:26 1:27 1:26 1:26 1:26
Other Progression Metrics
Clients in Employment with Support from the Service
950 1,032 1,011 1,324 1,229
Total Exits to Employment 326 379 631 686 891
% of Clients Exiting the Programme While in Employment - excluding clients that dropped out/non-completions
37.7% 46.9%
In Employment 6 Months without Support from Service - % of Total Exits to Employment
N/A N/A N/A 75.8% 83.3%
In Employment 6 Months without Support from Service - % of Total Exits
N/A N/A N/A 21.2% 28.0%
Source: Indecon analysis of EmployAbility data Notes: (1) KPIs are included in the contractual agreements between DSP and each Supported Employment (SUP) Sponsor Organisation / EmployAbility Company and derive from the Supported Employment Service Operating Standards (2011). (2) % of Clients in Employment with Support from the Service - employment with support from the service includes formal work experience or employment in the open labour market leading to working a minimum of 8 hours per week. (3) % of Clients Exiting the Programme While in Employment - employment after exiting the service must be in the open labour market and defined as working a minimum of 8 hours per week.
Level of Positive Employment Outcomes Achieved
A number of specific observations and conclusions emerge from the analysis of recent data on activity levels and outcomes from the service, as follows:
There has been a recent upward trend in the number of individuals referred to the EmployAbility service, with the number of referrals reaching 3,151 in 2014, representing an increase of 51% on the level in 2010. It is likely that this increase in demand reflects a range of factors, including the impact of the economic recession.
The service provided supports to 2,936 active clients during 2014. A total of 2,651 clients exited the service during 2014.
Executive Summary
Indecon International Economic Consultants
Evaluation of EmployAbility (Supported Employment) Service
iii
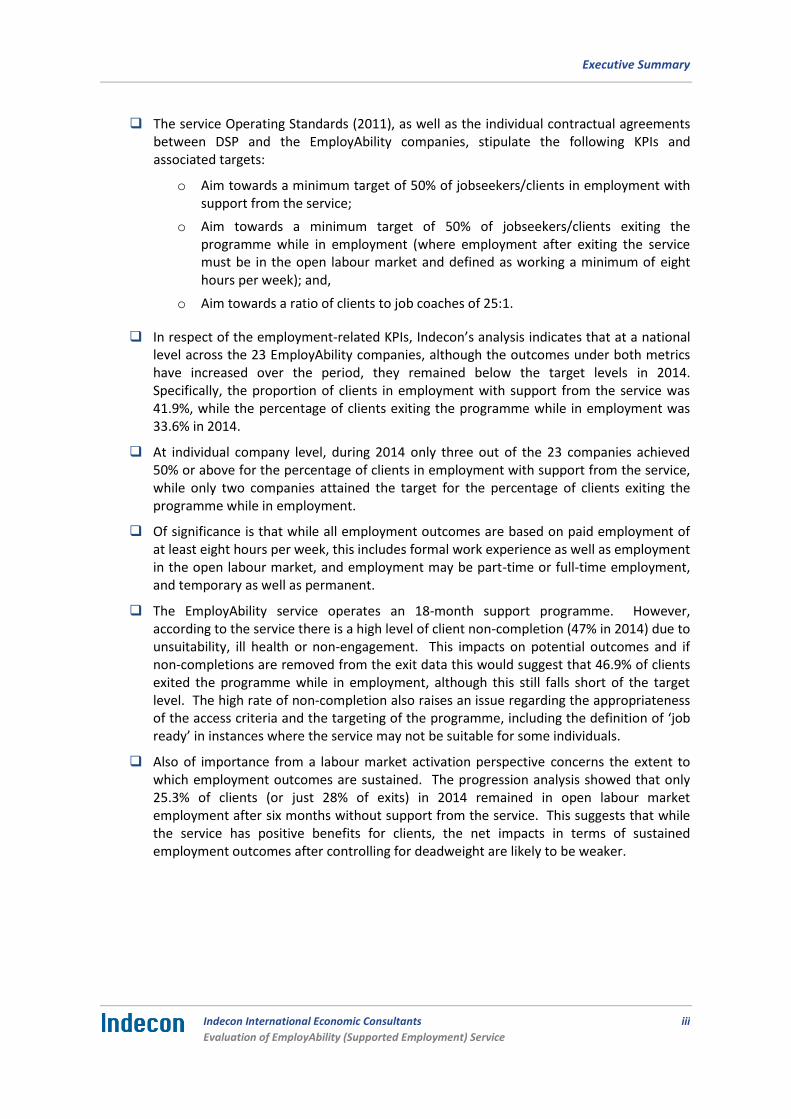
The service Operating Standards (2011), as well as the individual contractual agreements between DSP and the EmployAbility companies, stipulate the following KPIs and associated targets:
o Aim towards a minimum target of 50% of jobseekers/clients in employment with support from the service;
o Aim towards a minimum target of 50% of jobseekers/clients exiting the programme while in employment (where employment after exiting the service must be in the open labour market and defined as working a minimum of eight hours per week); and,
o Aim towards a ratio of clients to job coaches of 25:1.
In respect of the employment-related KPIs, Indecon’s analysis indicates that at a national level across the 23 EmployAbility companies, although the outcomes under both metrics have increased over the period, they remained below the target levels in 2014. Specifically, the proportion of clients in employment with support from the service was 41.9%, while the percentage of clients exiting the programme while in employment was 33.6% in 2014.
At individual company level, during 2014 only three out of the 23 companies achieved 50% or above for the percentage of clients in employment with support from the service, while only two companies attained the target for the percentage of clients exiting the programme while in employment.
Of significance is that while all employment outcomes are based on paid employment of at least eight hours per week, this includes formal work experience as well as employment in the open labour market, and employment may be part-time or full-time employment, and temporary as well as permanent.
The EmployAbility service operates an 18-month support programme. However, according to the service there is a high level of client non-completion (47% in 2014) due to unsuitability, ill health or non-engagement. This impacts on potential outcomes and if non-completions are removed from the exit data this would suggest that 46.9% of clients exited the programme while in employment, although this still falls short of the target level. The high rate of non-completion also raises an issue regarding the appropriateness of the access criteria and the targeting of the programme, including the definition of ‘job ready’ in instances where the service may not be suitable for some individuals.
Also of importance from a labour market activation perspective concerns the extent to which employment outcomes are sustained. The progression analysis showed that only 25.3% of clients (or just 28% of exits) in 2014 remained in open labour market employment after six months without support from the service. This suggests that while the service has positive benefits for clients, the net impacts in terms of sustained employment outcomes after controlling for deadweight are likely to be weaker.
Executive Summary
iv Indecon International Economic Consultants
Evaluation of EmployAbility (Supported Employment) Service
Appropriateness of Key Performance Indicators
A review was also undertaken of the current performance metrics, including the KPIs used to monitor service outcomes and effectiveness. In relation to the appropriateness of these KPIs, the following conclusions are relevant:
In terms of conforming to ‘SMART’ criteria (see Section 3.7.2 for list of SMART criteria) for effective monitoring indicators, the existing KPIs would appear to be well-defined and measurable. However, Indecon would have some concerns in relation to the definition and interpretation of the employment-related metrics.
Consistent with the eligibility requirements for access to the service, we understand that only employment that is in the open labour market and involves working a minimum of eight hours per week is included in the exit employment KPI, whereas the active client employment metric is defined to include employment with support from the service. This includes formal work experience or employment in the open labour market. However, it is not clear whether employment achieved reaches a minimum of eight hours per week. In addition, employment may be part-time or full-time employment, and temporary as well as permanent.
We would also have a concern in relation to the interpretation of the metric pertaining to the percentage of clients exiting the programme while in employment, whereby it was found that a number of companies had been misinterpreting the definition of the indicator and there appears to have been confusion between the target for the indicator (50%) and the computation of the metric. It is important that full clarity is achieved across the companies in relation this key metric, as otherwise there is a danger of incorrectly overstating the outcomes recorded under this measure.
The basis for the targets set for the KPIs is not clear and appears arbitrary. In addition, the timeframes over which the targets should be achieved are not clear. It is important that any targets represent ‘stretch’ targets, while at the same time being achievable within pre-defined and realistic timeframes.
A notable gap concerns the coverage of the KPIs. Overall, Indecon believes that the range of KPIs, being confined to just three metrics pertaining to employment outcomes (two metrics) and the job coach ratio, is extremely limited and inadequate to assess service effectiveness and efficiency. One particular weakness concerns the absence of appropriate metrics which capture the extent to which employment outcomes are sustained beyond a 12-month (as opposed to six-month) period, in line with standard measures of labour market activation. Other aspects which merit development and formalisation of additional KPIs include the destination of clients exiting the service who do not take up employment, and the reasons for non-completion of the programme.
The service would appear to generate a number of positive outcomes, which are reported by clients, in terms of independence, well-being, self-confidence, skills and ability to work. Some of these aspects could be captured in KPIs that measure these qualitative outcomes on an ongoing basis.
Executive Summary
Indecon International Economic Consultants
Evaluation of EmployAbility (Supported Employment) Service
v
Appropriateness of Criteria for Access to Service
The review also considered the criteria for access to the EmployAbility service and their appropriateness. This is important as eligibility for participation, by impacting on the numbers and types of clients supported, will influence the potential to achieve positive improvements and progression outcomes for these clients.
All potential EmployAbility clients must be referred through a Department of Social Protection INTREO office, or a Local Employment Service, and they have final authority in determining an individual’s suitability for referral.
One issue highlighted in Indecon’s assessment of the appropriateness of the access criteria concerns the precise scope of individuals in receipt of DSP payments who are potentially eligible for support. While the eligibility criteria state that the service is open to people aged 18 to 65 year with disabilities, including those recovering from injury or illness, which are ‘job ready’ and need the support of a Job Coach to get a job in the open labour market, it was notable some 26% of referrals during 2014 were for individuals in receipt of Jobseeker’s Allowance. Such individuals require a medical report/certification to access the service. In comparison, potential clients in receipt of a DSP disability or illness payment do not. The degree of clarity in relation to the precise scope and interpretation of eligibility based on DSP payments is an important issue if this leads to inappropriate referral of individuals who may not be suitable for the service. In addition, there is a risk that inappropriate referral of individuals to the service could increase the potential for ‘deadweight’, whereby there is a higher probability that observed employment outcomes are achieved in the absence of EmployAbility supports.
The requirement that prospective clients be ‘job ready’ – defined as a person who has the necessary training, education, motivation and ability to pursue work/career in the open labour market and, if needed, have access to transport to get to and from work – is an important element of the overall access criteria. The evident high rates of non-completion/drop-out among clients and the failure to challenges apparent in achieving the KPI targets for employment outcomes together suggest that a high proportion of referrals may relate to individuals who are not job ready, and therefore that the EmployAbility service is not appropriate to address their needs. These findings would suggest that the definition of job readiness requires reconsideration, to facilitate a more objective assessment of suitability for the service and to minimise the risk of inappropriate referral. A review of this criterion should be informed by the research on supported employment, including those groups for which the supported employment model has been demonstrated to be most effective in meeting their needs. Importantly, a re-formulated definition of job readiness should be sufficiently robust and more effectively targeted. This should, on the one hand, cater for increased demand for supports, but also ensure that only individuals with a disability who are in receipt of a relevant DSP payment, and who are motivated to take up and sustain open labour market employment, can access the supports provided by the service to enable them to progress, where their probability of success would otherwise have been lower. The definition must ensure that there is not inappropriate referral of individuals who are not suitable or motivated, individuals who are skilled and experienced but have short-term disabilities and would otherwise have a high probability of achieving successful labour market outcomes, or individuals who require a more intensive, high-support programme. This is important in minimising potential deadweight associated with the service.
Executive Summary
vi Indecon International Economic Consultants
Evaluation of EmployAbility (Supported Employment) Service
The recently published Comprehensive Employment Strategy for People with Disabilities commits the Department to expand the INTREO service on a phased basis, to cater for people with a disability who present at an INTREO Centre. To this end, INTREO will become a gateway to employment activation for people with disabilities, commencing on a phased basis from February 2015, with people with disabilities being case managed along with live register cohort. The Department is progressively rolling out its full activation support service to people with disabilities who wish to avail of the service on a voluntary basis. Indecon believes that the assignment of appropriately trained INTREO case officers to potential clients, who will undertake prior assessment of individuals’ needs and sign-post individuals to appropriate (EmployAbility or other) supports will be an important development in this regard.
Efficiency and Cost-Effectiveness
A range of factors will impact on service efficiency and cost-effectiveness, and a detailed assessment of cost drivers was outside the scope of this evaluation. This report examined a number of metrics, which relate expenditures to different outcomes from the service. A more detailed consideration should include benchmarking of metrics against comparable programmes. The following observations were made based on the selected metrics examined:
Average monthly expenditure per client supported is estimated to have varied in the range of €222 per month to €258 per month over the period 2010-2014. Based on a typical 18-monthy programme duration, this would suggest an average programme cost per client supported of between €3,996 and €4,644 over this period.
Average spend per client exit to employment has fallen from €19,032 in 2012 to €11,433 in 2014. This decline reflects the recent increase in exits to employment, whereas annual average expenditure has remained broadly stable over the period under consideration.
Average service expenditure relative to employment sustained was €13,582 over the period 2013-2014.
Overall, however, the analysis suggests that programme expenditure remains high relative to the quantum and sustainability of employment outcomes achieved.
One measure of efficiency of service delivery relates to the number of clients assisted relative to the number of job coaches employed. The individual contractual agreements with EmployAbility companies stipulate that a ratio of clients to job coaches of 25:1 should be attained. Over the period 2010-2014, the service has achieved an average ratio of one job coach per 26 clients. Analysis of data for 2014 indicates the presence of significant variation at individual company level, with the ratio varying in the range of 22.3:1 to 35.2:1. Overall, the job coach ratio figures suggest that the service overall is working to capacity levels and reflects the recent growth in demand. The challenge, however, concerns the effectiveness of the service in translating this demand into positive employment progression outcomes.
Executive Summary
Indecon International Economic Consultants
Evaluation of EmployAbility (Supported Employment) Service
vii
Client experience and satisfaction levels
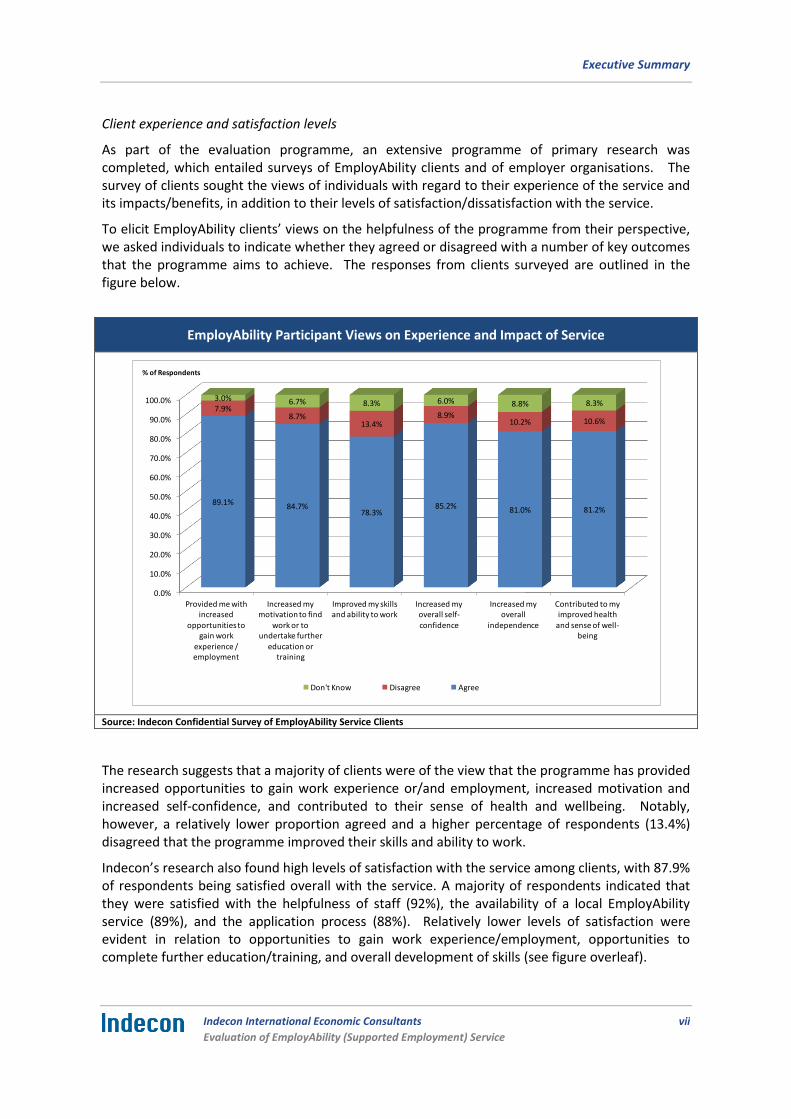
As part of the evaluation programme, an extensive programme of primary research was completed, which entailed surveys of EmployAbility clients and of employer organisations. The survey of clients sought the views of individuals with regard to their experience of the service and its impacts/benefits, in addition to their levels of satisfaction/dissatisfaction with the service.
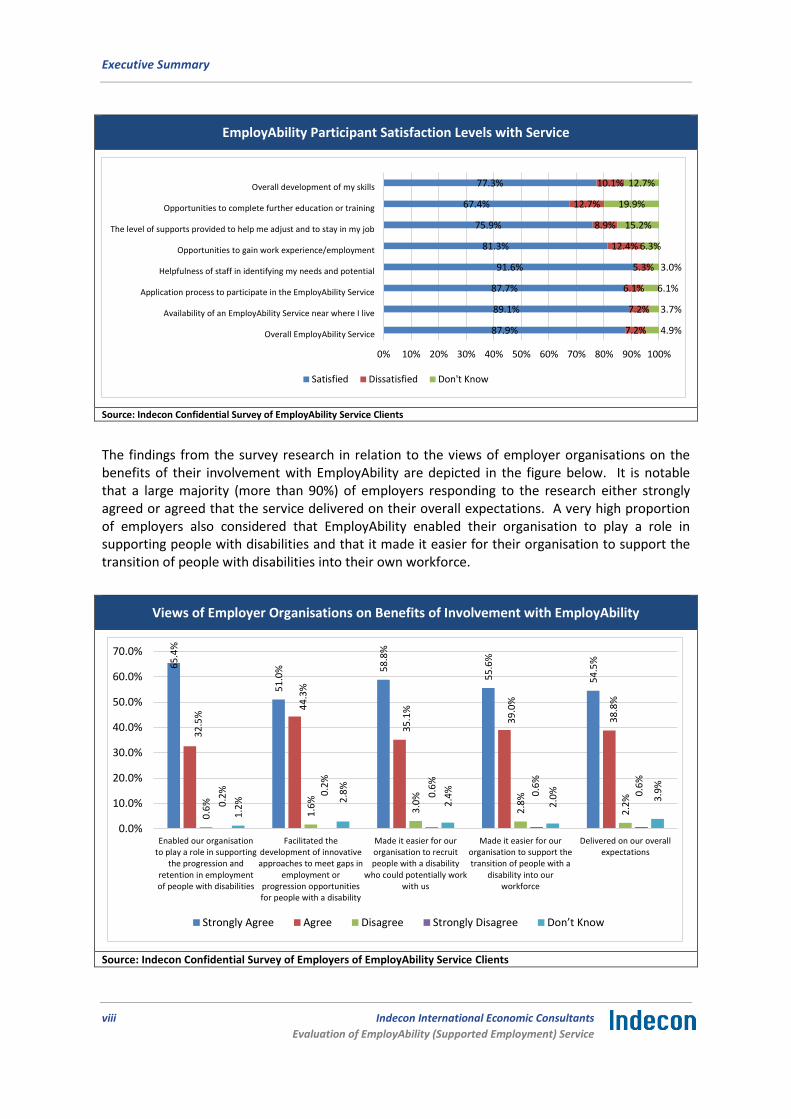
To elicit EmployAbility clients’ views on the helpfulness of the programme from their perspective, we asked individuals to indicate whether they agreed or disagreed with a number of key outcomes that the programme aims to achieve. The responses from clients surveyed are outlined in the figure below.
EmployAbility Participant Views on Experience and Impact of Service
Source: Indecon Confidential Survey of EmployAbility Service Clients
The research suggests that a majority of clients were of the view that the programme has provided increased opportunities to gain work experience or/and employment, increased motivation and increased self-confidence, and contributed to their sense of health and wellbeing. Notably, however, a relatively lower proportion agreed and a higher percentage of respondents (13.4%) disagreed that the programme improved their skills and ability to work.
Indecon’s research also found high levels of satisfaction with the service among clients, with 87.9% of respondents being satisfied overall with the service. A majority of respondents indicated that they were satisfied with the helpfulness of staff (92%), the availability of a local EmployAbility service (89%), and the application process (88%). Relatively lower levels of satisfaction were evident in relation to opportunities to gain work experience/employment, opportunities to complete further education/training, and overall development of skills (see figure overleaf).
0.0%
10.0%
20.0%
30.0%
40.0%
50.0%
60.0%
70.0%
80.0%
90.0%
100.0%
Provided me with increased
opportunities to gain work
experience / employment
Increased my motivation to find
work or to undertake further
education or training
Improved my skills and ability to work
Increased my overall self-
confidence
Increased my overall
independence
Contributed to my improved health
and sense of well-being
89.1% 84.7%78.3%
85.2% 81.0% 81.2%
7.9%8.7%
13.4%8.9%
10.2% 10.6%
3.0% 6.7% 8.3% 6.0% 8.8% 8.3%
Don't Know Disagree Agree
% of Respondents
Executive Summary
viii Indecon International Economic Consultants
Evaluation of EmployAbility (Supported Employment) Service
EmployAbility Participant Satisfaction Levels with Service
Source: Indecon Confidential Survey of EmployAbility Service Clients
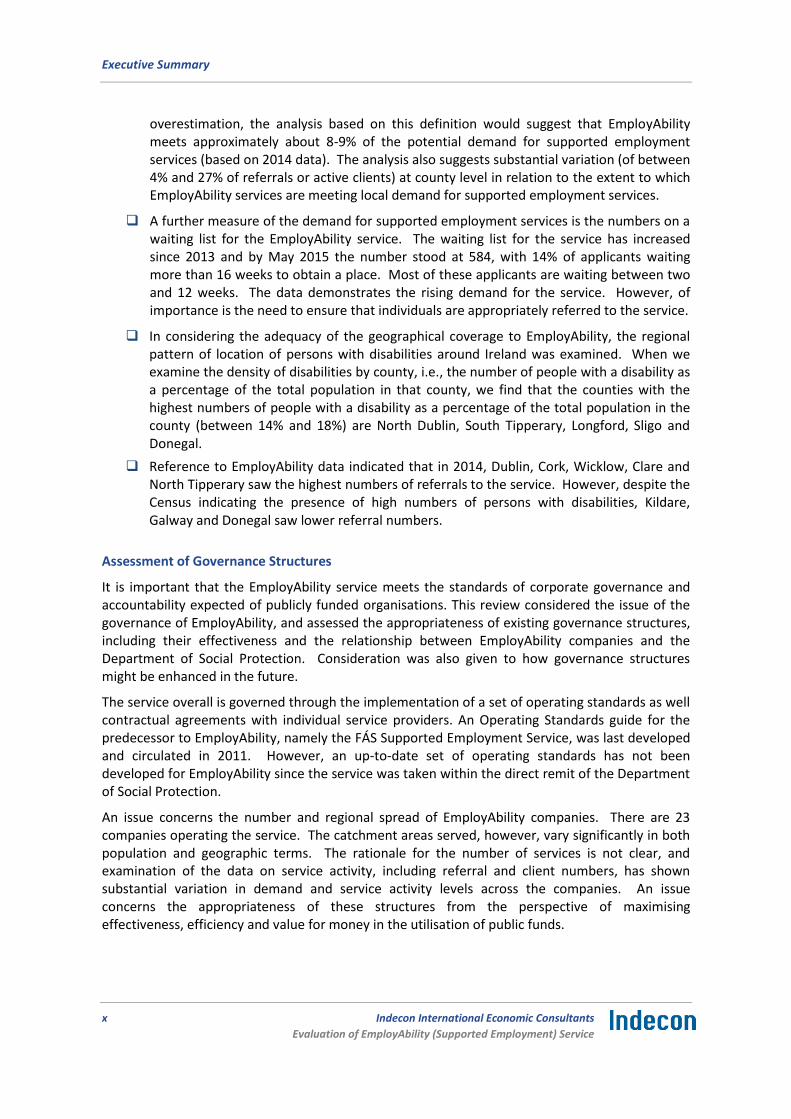
The findings from the survey research in relation to the views of employer organisations on the benefits of their involvement with EmployAbility are depicted in the figure below. It is notable that a large majority (more than 90%) of employers responding to the research either strongly agreed or agreed that the service delivered on their overall expectations. A very high proportion of employers also considered that EmployAbility enabled their organisation to play a role in supporting people with disabilities and that it made it easier for their organisation to support the transition of people with disabilities into their own workforce.
Views of Employer Organisations on Benefits of Involvement with EmployAbility
Source: Indecon Confidential Survey of Employers of EmployAbility Service Clients
87.9%
89.1%
87.7%
91.6%
81.3%
75.9%
67.4%
77.3%
7.2%
7.2%
6.1%
5.3%
12.4%
8.9%
12.7%
10.1%
4.9%
3.7%
6.1%
3.0%
6.3%
15.2%
19.9%
12.7%
0% 10% 20% 30% 40% 50% 60% 70% 80% 90% 100%
Overall EmployAbility Service
Availability of an EmployAbility Service near where I live
Application process to participate in the EmployAbility Service
Helpfulness of staff in identifying my needs and potential
Opportunities to gain work experience/employment
The level of supports provided to help me adjust and to stay in my job
Opportunities to complete further education or training
Overall development of my skills
Satisfied Dissatisfied Don't Know
65
.4%
51
.0%
58
.8%
55
.6%
54
.5%
32
.5%
44
.3%
35
.1%
39
.0%
38
.8%
0.6
%
1.6
%
3.0
%
2.8
%
2.2
%
0.2
%
0.2
%
0.6
%
0.6
%
0.6
%
1.2
%
2.8
%
2.4
%
2.0
%
3.9
%
0.0%
10.0%
20.0%
30.0%
40.0%
50.0%
60.0%
70.0%
Enabled our organisationto play a role in supporting
the progression andretention in employmentof people with disabilities
Facilitated thedevelopment of innovativeapproaches to meet gaps in
employment orprogression opportunitiesfor people with a disability
Made it easier for ourorganisation to recruitpeople with a disability
who could potentially workwith us
Made it easier for ourorganisation to support thetransition of people with a
disability into ourworkforce
Delivered on our overallexpectations
Strongly Agree Agree Disagree Strongly Disagree Don’t Know

Executive Summary
Indecon International Economic Consultants
Evaluation of EmployAbility (Supported Employment) Service
ix
Assessment of Scale and Scope of Service Provision
The evaluation also assessed the scale and the scope of service provision, including the demand for supported employment services and the adequacy of the geographical coverage of EmployAbility. The potential demand for EmployAbility services is influenced by a range of factors, including the number of persons with disabilities, the accessibility of the service and the voluntary nature of participation in the service. The development of a rigorous statistical model to predict the demand for EmployAbility services was not within the scope of this assessment. However, Indecon has completed an examination based on alternative definitions of the potential client base. These definitions are informed by reference to key drivers of potential demand as they relate to the criteria for access to the service, including the population of persons with disabilities within the relevant age cohorts, the extent of unemployment among persons with disabilities, and the patterns of receipt of relevant social welfare supports. This assessment drew from data on disability within the Census of Population, in addition to data provided by the Department of Social Protection concerning trends the numbers of recipients of disability-related social welfare payments, and information from EmployAbility companies. The main findings from this assessment were as follows:
Based on the 2011 Census of Population, there were approximately 542,277 persons aged 15 and over with a disability in Ireland.
The Census also indicates that there were 162,681 people with disabilities in the labour force in 2011, implying a labour force participation rate among persons with a disability of 30%. Of this, a total of 112,502 people (69%) were employed, while 50,179 individuals (31%) were unemployed. Providing the opportunity for the latter cohort in particular to take up independent open labour market employment, where they wish to do so, represents a key objective of supported employment programmes such as EmployAbility.
While the above findings based on Census 2011 data suggest that there is significant scope for EmployAbility to continue to expand its service in improving the employment opportunities and outcomes for people with disabilities, it should be recognised that the service is voluntary, in that participation by persons with disabilities is not compulsory, and this, along with population numbers and eligibility, will influence the potential demand for the service.
Due to the range of factors involved, it is difficult to identify with precision the overall demand for supported employment services. Indecon has examined a number of measures of potential demand. If one considers a definiton based on the total number of people with a disability aged 18 to 65 (the age cohort that are eligible for EmployAbility) that are outside the labour force, this definition suggests that EmployAbility service referrals and client numbers represented less than 2% of this cohort in 2014.
Based on a second definition, if one relates EmployAbility referral and client numbers to the numbers of people with a disability aged 18 to 65 who are unemployed, this suggests that EmployAbility is meeting about 6-7% of the demand for supported employment (based on 2014 figures). This may provide the closest representation of demand for the service.
We also examined a third definition, based on the numbers of persons in the relevant age group who are in receipt of a disability-related social welfare payments (Disability Allowance, Illness Benefit and Invalidity Pension). While a precise assessment is not possible due to the need to make a number of adjustments to minimise potential
Executive Summary
x Indecon International Economic Consultants
Evaluation of EmployAbility (Supported Employment) Service
overestimation, the analysis based on this definition would suggest that EmployAbility meets approximately about 8-9% of the potential demand for supported employment services (based on 2014 data). The analysis also suggests substantial variation (of between 4% and 27% of referrals or active clients) at county level in relation to the extent to which EmployAbility services are meeting local demand for supported employment services.
A further measure of the demand for supported employment services is the numbers on a waiting list for the EmployAbility service. The waiting list for the service has increased since 2013 and by May 2015 the number stood at 584, with 14% of applicants waiting more than 16 weeks to obtain a place. Most of these applicants are waiting between two and 12 weeks. The data demonstrates the rising demand for the service. However, of importance is the need to ensure that individuals are appropriately referred to the service.
In considering the adequacy of the geographical coverage to EmployAbility, the regional pattern of location of persons with disabilities around Ireland was examined. When we examine the density of disabilities by county, i.e., the number of people with a disability as a percentage of the total population in that county, we find that the counties with the highest numbers of people with a disability as a percentage of the total population in the county (between 14% and 18%) are North Dublin, South Tipperary, Longford, Sligo and Donegal.
Reference to EmployAbility data indicated that in 2014, Dublin, Cork, Wicklow, Clare and North Tipperary saw the highest numbers of referrals to the service. However, despite the Census indicating the presence of high numbers of persons with disabilities, Kildare, Galway and Donegal saw lower referral numbers.
Assessment of Governance Structures
It is important that the EmployAbility service meets the standards of corporate governance and accountability expected of publicly funded organisations. This review considered the issue of the governance of EmployAbility, and assessed the appropriateness of existing governance structures, including their effectiveness and the relationship between EmployAbility companies and the Department of Social Protection. Consideration was also given to how governance structures might be enhanced in the future.
The service overall is governed through the implementation of a set of operating standards as well contractual agreements with individual service providers. An Operating Standards guide for the predecessor to EmployAbility, namely the FÁS Supported Employment Service, was last developed and circulated in 2011. However, an up-to-date set of operating standards has not been developed for EmployAbility since the service was taken within the direct remit of the Department of Social Protection.
An issue concerns the number and regional spread of EmployAbility companies. There are 23 companies operating the service. The catchment areas served, however, vary significantly in both population and geographic terms. The rationale for the number of services is not clear, and examination of the data on service activity, including referral and client numbers, has shown substantial variation in demand and service activity levels across the companies. An issue concerns the appropriateness of these structures from the perspective of maximising effectiveness, efficiency and value for money in the utilisation of public funds.
Executive Summary
Indecon International Economic Consultants
Evaluation of EmployAbility (Supported Employment) Service
xi
EmployAbility programme expenditure is high relative to the quantum and sustainability of employment outcomes achieved. In this regard, we believe there is a need to examine the configuration, including the number and geographic spread, and the scope for streamlining existing services to maximise the potential to leverage economies of scale in service provision and to deliver improved value for money. It is also noteworthy that there is a strong negative correlation between the number of clients and the average expenditure per client across the EmployAbility companies. This would suggest that there may be potential to achieve greater economies of scale and efficiencies through merging of certain EmployAbility companies which are geographically adjacent into combined entities with larger catchment areas.
Indecon’s analysis of the structure of EmployAbility company boards of directors indicates the presence of a substantial variation in the size of boards, with the number of directors/members varying from three to 11. The reasons behind the wide variation in the size of EmployAbility boards of directors are not clear. Overall board size should be kept to a defined maximum.
We understand from discussions with a selection of frontline DSP officials who interact with EmployAbility companies, that the Department operates strict governance and control procedures in relation to financial accountability in particular, including in relation to ongoing processes for sanctioning of expenditure and release of funds, and in monitoring and auditing financial management within the companies. However, it is understood that there is no formalised central reporting system in operation at national level between EmployAbility as a whole and the Department, with SUP14 statistical returns being submitted in paper form only to local DSP offices.
A particular issue in relation to overall national management and coordination concerns the absence of formalised mechanisms at national level across EmployAbility companies to ensure consistent implementation of appropriate governance approaches. This is an area where we believe the Department of Social Protection should make such a provision to ensure that governance requirements are met across the service.
Procurement model
An important issue for the future development of state-funded supported employment services concerns the model applied in procuring and funding such services. The EmployAbility service and its predecessor have been to-date directly funded by the State, with the relationship between the State and individual services governed by an annual contractual agreement. This relationship is effectively renewed on an ongoing/annual basis. However, given the wider developments in relation to the operation of employment and labour market activation programmes, as well as the increased pressure to demonstrate value for money in the application of public funds, it would be appropriate that the opportunities for alternative procurement models be considered.
Executive Summary
xii Indecon International Economic Consultants
Evaluation of EmployAbility (Supported Employment) Service
Overall Conclusions and Recommendations for Future Delivery of Service
Key Conclusions
Our key conclusions from the evaluation of the EmployAbility service are as follows:
1. There is evidence of increasing demand for the service.
2. The service has been well received by both clients and employer organisations.
3. However, the service supports only a small cohort of clients (fewer than 3,000 at any one time) relative to the potential demand for supported employment services, while the geographical configuration of the service may not adequately reflect the location of demand.
4. There is a concern that inappropriate referral to the service could be contributing to increased non-completion rates and undermining potential progression outcomes.
5. Programme expenditure remains high relative to the quantum and sustainability of employment outcomes achieved.
6. Some improvement is evident over the last 3-5 years in relation to the extent of positive employment outcomes achieved by the service. However, only a small number of EmployAbility companies have achieved the targets for the employment KPIs set out in the service agreements.
7. The coverage of existing Key Performance Indicators is very limited and requires enhancement to enable effective monitoring of the effectiveness and efficiency of service delivery.
8. There is a need to further enhance and strengthen the governance and oversight of the service, both at national and individual company level, to ensure accountability and value for money in the utilisation of public resources. Opportunities for alternative models of procurement of supported employment services should also be considered in this context.
Recommendations
Based on the detailed assessment undertaken, Indecon has identified a number of recommendations for policy in this area. These are summarised in the table overleaf and are informed by the level of demand for supported employment services and our consideration of the type of service that is required to effectively and efficiently meet that demand.
Overall Conclusion
The EmployAbility service has achieved a high level of support and has been well received by both clients and employer organisations, suggesting that the supported employment service model remains valid as a framework to deliver improved employment outcomes for jobseekers with a disability. However, the service faces a number of challenges if it is to respond effectively to increased demand and to maximise progression outcomes in a cost-effective manner. This will require a more streamlined service nationally, functioning under an enhanced governance and oversight framework, with more effective targeting of prospective clients.
Executive Summary
Indecon International Economic Consultants
Evaluation of EmployAbility (Supported Employment) Service
xiii
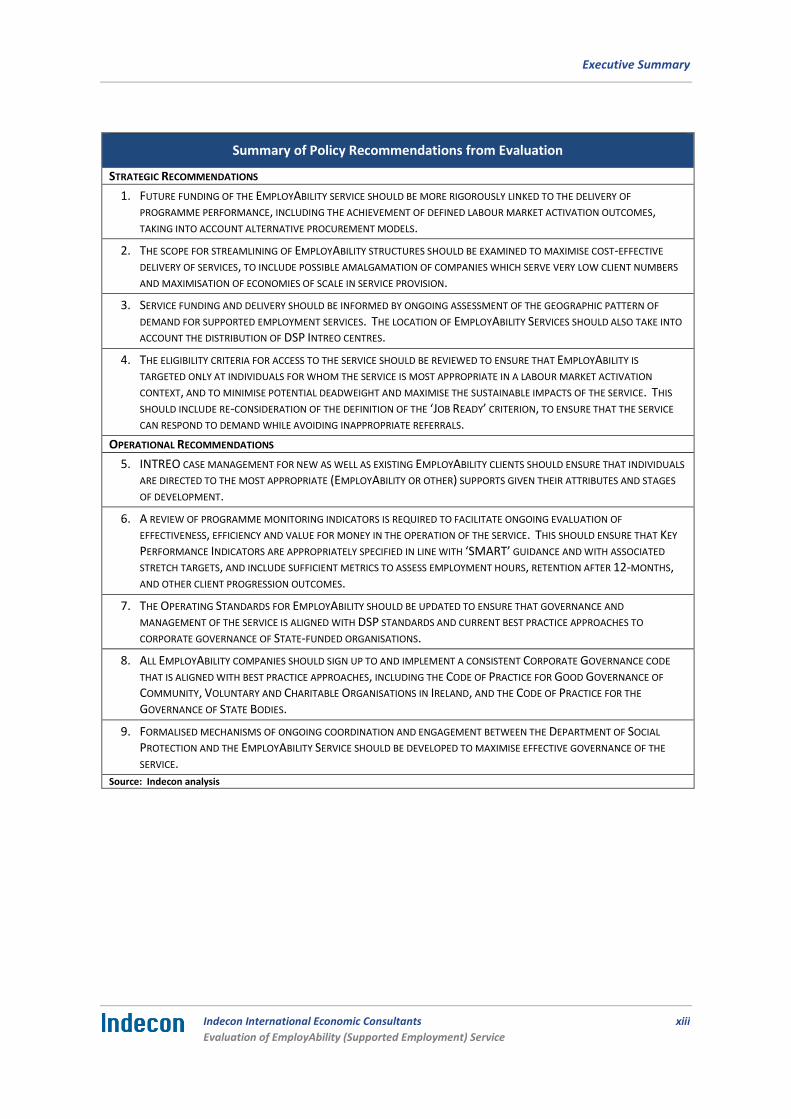
Summary of Policy Recommendations from Evaluation
STRATEGIC RECOMMENDATIONS
1. FUTURE FUNDING OF THE EMPLOYABILITY SERVICE SHOULD BE MORE RIGOROUSLY LINKED TO THE DELIVERY OF
PROGRAMME PERFORMANCE, INCLUDING THE ACHIEVEMENT OF DEFINED LABOUR MARKET ACTIVATION OUTCOMES, TAKING INTO ACCOUNT ALTERNATIVE PROCUREMENT MODELS.
2. THE SCOPE FOR STREAMLINING OF EMPLOYABILITY STRUCTURES SHOULD BE EXAMINED TO MAXIMISE COST-EFFECTIVE
DELIVERY OF SERVICES, TO INCLUDE POSSIBLE AMALGAMATION OF COMPANIES WHICH SERVE VERY LOW CLIENT NUMBERS
AND MAXIMISATION OF ECONOMIES OF SCALE IN SERVICE PROVISION.
3. SERVICE FUNDING AND DELIVERY SHOULD BE INFORMED BY ONGOING ASSESSMENT OF THE GEOGRAPHIC PATTERN OF
DEMAND FOR SUPPORTED EMPLOYMENT SERVICES. THE LOCATION OF EMPLOYABILITY SERVICES SHOULD ALSO TAKE INTO
ACCOUNT THE DISTRIBUTION OF DSP INTREO CENTRES.
4. THE ELIGIBILITY CRITERIA FOR ACCESS TO THE SERVICE SHOULD BE REVIEWED TO ENSURE THAT EMPLOYABILITY IS
TARGETED ONLY AT INDIVIDUALS FOR WHOM THE SERVICE IS MOST APPROPRIATE IN A LABOUR MARKET ACTIVATION
CONTEXT, AND TO MINIMISE POTENTIAL DEADWEIGHT AND MAXIMISE THE SUSTAINABLE IMPACTS OF THE SERVICE. THIS
SHOULD INCLUDE RE-CONSIDERATION OF THE DEFINITION OF THE ‘JOB READY’ CRITERION, TO ENSURE THAT THE SERVICE
CAN RESPOND TO DEMAND WHILE AVOIDING INAPPROPRIATE REFERRALS.
OPERATIONAL RECOMMENDATIONS
5. INTREO CASE MANAGEMENT FOR NEW AS WELL AS EXISTING EMPLOYABILITY CLIENTS SHOULD ENSURE THAT INDIVIDUALS
ARE DIRECTED TO THE MOST APPROPRIATE (EMPLOYABILITY OR OTHER) SUPPORTS GIVEN THEIR ATTRIBUTES AND STAGES
OF DEVELOPMENT.
6. A REVIEW OF PROGRAMME MONITORING INDICATORS IS REQUIRED TO FACILITATE ONGOING EVALUATION OF
EFFECTIVENESS, EFFICIENCY AND VALUE FOR MONEY IN THE OPERATION OF THE SERVICE. THIS SHOULD ENSURE THAT KEY
PERFORMANCE INDICATORS ARE APPROPRIATELY SPECIFIED IN LINE WITH ‘SMART’ GUIDANCE AND WITH ASSOCIATED
STRETCH TARGETS, AND INCLUDE SUFFICIENT METRICS TO ASSESS EMPLOYMENT HOURS, RETENTION AFTER 12-MONTHS, AND OTHER CLIENT PROGRESSION OUTCOMES.
7. THE OPERATING STANDARDS FOR EMPLOYABILITY SHOULD BE UPDATED TO ENSURE THAT GOVERNANCE AND
MANAGEMENT OF THE SERVICE IS ALIGNED WITH DSP STANDARDS AND CURRENT BEST PRACTICE APPROACHES TO
CORPORATE GOVERNANCE OF STATE-FUNDED ORGANISATIONS.
8. ALL EMPLOYABILITY COMPANIES SHOULD SIGN UP TO AND IMPLEMENT A CONSISTENT CORPORATE GOVERNANCE CODE
THAT IS ALIGNED WITH BEST PRACTICE APPROACHES, INCLUDING THE CODE OF PRACTICE FOR GOOD GOVERNANCE OF
COMMUNITY, VOLUNTARY AND CHARITABLE ORGANISATIONS IN IRELAND, AND THE CODE OF PRACTICE FOR THE
GOVERNANCE OF STATE BODIES.
9. FORMALISED MECHANISMS OF ONGOING COORDINATION AND ENGAGEMENT BETWEEN THE DEPARTMENT OF SOCIAL
PROTECTION AND THE EMPLOYABILITY SERVICE SHOULD BE DEVELOPED TO MAXIMISE EFFECTIVE GOVERNANCE OF THE
SERVICE.
Source: Indecon analysis

1 │ Introduction, Background and Methodology
Indecon International Economic Consultants
Evaluation of EmployAbility (Supported Employment) Service
1
1 Introduction, Background and Methodology
1.1 Introduction
This report is submitted to the Department of Social Protection (DSP) by Indecon International Economic Consultants. The report presents an independent evaluation of the EmployAbility Supported Employment Service.
1.2 Background and Terms of Reference
1.2.1 Background and Context for Review
The EmployAbility service, which was formerly known as the Supported Employment Programme (SEP), is a national employment service dedicated to improving employment outcomes for jobseekers with a disability. It is based on the ethos that participation in employment can be achieved by people with a disability (PWD) when they are able to avail of individualised supports that are based on their choices and preferences. In line with the United Nations Convention on the Rights of Persons with Disabilities, the service’s overall vision is to support people with a disability to secure and maintain employment and it aims to help stem the flow of people with disabilities and extra support needs into long-term unemployment by facilitating integration into suitable and fulfilling mainstream employment.
The service was originally established in 2000 (under the aegis of the former An Foras Áiseanna Saothair (FÁS)). Responsibility for the programme transferred to the Department of Social Protection in 2012. There are a total of 23 EmployAbility services in Ireland, each having a specific geographical remit and governed by a voluntary board of directors.
The EmployAbility service is fully publicly funded and the service spent a total of €8.4 million during 2014.
This review of EmployAbility will guide the future development and structures of the service, which offers a job-coaching service to people with disabilities seeking to secure employment. We understand that the review of the performance of the EmployAbility Service and the appropriateness of its governance structures is being undertaken in the context of the recent transfer of responsibility for the service from FÁS to the Department of Social Protection in 2012, and the development of a more focused and integrated activation service within the Department.
1.2.2 Scope and Terms of Reference
This evaluation entailed addressing the following terms of reference:
To assess the effectiveness and efficiency of the service, including:
an assessment of the level of positive employment outcomes achieved;
the sustainability of the employment outcomes achieved;
the appropriateness of the current key performance indicators; and,
the appropriateness of the criteria applied for access to the service.

1 │ Introduction, Background and Methodology
2 Indecon International Economic Consultants
Evaluation of EmployAbility (Supported Employment) Service
To assess the appropriateness of the governance structures, including:
an assessment of the effectiveness of the current governance structures;
an assessment of the effectiveness of the relationship between the individual compa-
nies and the Department of Social Protection; and,
consideration of how governance structures might be enhanced.
To assess the scale and scope of service provision including:
an assessment of the demand for supported employment services generally and con-
sideration of the extent to which the EmployAbility service addresses that demand;
and,
an assessment of the adequacy of the geographical coverage of the service.
To present proposals for the future delivery of the service, having regard to:
the level of demand for supported employment services; and,
the type of service required to effectively meet that demand.
1.3 Methodological Approach to Evaluation
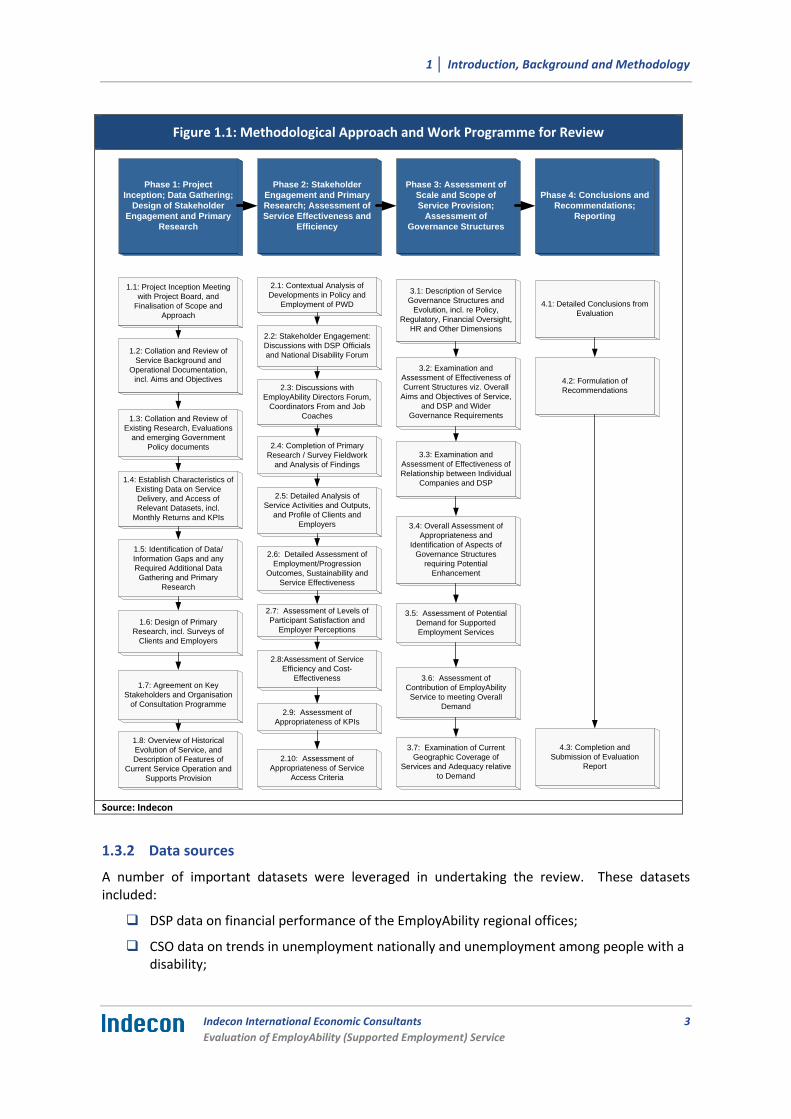
A rigorous methodological approach was applied in completing this evaluation. This included extensive new primary research among service participants, including clients and employer organisations, in-depth engagement with the EmployAbility service, DSP and external stakeholders, and detailed analysis of programme data on activities and outcomes. A schematic summary of the methodological approach and tasks undertaken is presented in Figure 1.1 and is elaborated upon below and overleaf.
1.3.1 Collation of Research Materials
The evaluation was informed by a wide range of informational and research materials. This was important in ensuring a clear understanding of the historical context since the establishment of the SEP in 2000, as well as the more recent policy and other developments, and new governance structures and operational dimensions. The main research materials consulted included:
EmployAbility documentation;
Research Report on the Operations and Effectiveness of the Supported Employment Programme (2008);
Educational and Employment Experiences of People with a Disability in Ireland: An Analysis of the National Disability Survey (2015) – ESRI Report;
Code of Practice for the Governance of State Bodies (2009) – Department of Finance;
Disability in the Irish Labour Market – Evidence from the QNHS Equality Module 2010 – (2012) - ESRI Report;
Supported Employment Service – Operating Standards 2011 – FÁS; and,
Submissions from disability and non-disability sector organisations.
1 │ Introduction, Background and Methodology
Indecon International Economic Consultants
Evaluation of EmployAbility (Supported Employment) Service
3
Figure 1.1: Methodological Approach and Work Programme for Review
Source: Indecon
1.3.2 Data sources
A number of important datasets were leveraged in undertaking the review. These datasets included:
DSP data on financial performance of the EmployAbility regional offices;
CSO data on trends in unemployment nationally and unemployment among people with a disability;
Phase 1: Project
Inception; Data Gathering;
Design of Stakeholder
Engagement and Primary
Research
Phase 2: Stakeholder
Engagement and Primary
Research; Assessment of
Service Effectiveness and
Efficiency
Phase 3: Assessment of
Scale and Scope of
Service Provision;
Assessment of
Governance Structures
Phase 4: Conclusions and
Recommendations;
Reporting
1.1: Project Inception Meeting
with Project Board, and
Finalisation of Scope and
Approach
2.2: Stakeholder Engagement:
Discussions with DSP Officials
and National Disability Forum
3.1: Description of Service
Governance Structures and
Evolution, incl. re Policy,
Regulatory, Financial Oversight,
HR and Other Dimensions
4.1: Detailed Conclusions from
Evaluation
1.2: Collation and Review of
Service Background and
Operational Documentation,
incl. Aims and Objectives
1.3: Collation and Review of
Existing Research, Evaluations
and emerging Government
Policy documents
1.4: Establish Characteristics of
Existing Data on Service
Delivery, and Access of
Relevant Datasets, incl.
Monthly Returns and KPIs
1.5: Identification of Data/
Information Gaps and any
Required Additional Data
Gathering and Primary
Research
1.7: Agreement on Key
Stakeholders and Organisation
of Consultation Programme
2.5: Detailed Analysis of
Service Activities and Outputs,
and Profile of Clients and
Employers
2.4: Completion of Primary
Research / Survey Fieldwork
and Analysis of Findings
1.6: Design of Primary
Research, incl. Surveys of
Clients and Employers
2.6: Detailed Assessment of
Employment/Progression
Outcomes, Sustainability and
Service Effectiveness
2.7: Assessment of Levels of
Participant Satisfaction and
Employer Perceptions
2.9: Assessment of
Appropriateness of KPIs
2.10: Assessment of
Appropriateness of Service
Access Criteria
3.2: Examination and
Assessment of Effectiveness of
Current Structures viz. Overall
Aims and Objectives of Service,
and DSP and Wider
Governance Requirements
3.3: Examination and
Assessment of Effectiveness of
Relationship between Individual
Companies and DSP
3.4: Overall Assessment of
Appropriateness and
Identification of Aspects of
Governance Structures
requiring Potential
Enhancement
3.5: Assessment of Potential
Demand for Supported
Employment Services
3.6: Assessment of
Contribution of EmployAbility
Service to meeting Overall
Demand
3.7: Examination of Current
Geographic Coverage of
Services and Adequacy relative
to Demand
4.2: Formulation of
Recommendations
2.8:Assessment of Service
Efficiency and Cost-
Effectiveness
4.3: Completion and
Submission of Evaluation
Report
1.8: Overview of Historical
Evolution of Service, and
Description of Features of
Current Service Operation and
Supports Provision
2.1: Contextual Analysis of
Developments in Policy and
Employment of PWD
2.3: Discussions with
EmployAbility Directors Forum,
Coordinators From and Job
Coaches
1 │ Introduction, Background and Methodology
4 Indecon International Economic Consultants
Evaluation of EmployAbility (Supported Employment) Service
Census of Population data on numbers of people with a disability;
Data on activities of EmployAbility;
Outputs from EmployAbility in terms of employment outcomes and exits from the service;
Data on detailed monthly returns from the individual service providers relating to Key Performance Indicators (KPIs) in respect of including employment posts secured, internships, work experience placements, referrals to further education or training, number of employment officers and ratio to jobseekers; and,
Additional data on progression and other aspects requested by Indecon.
1.3.3 Stakeholder Engagement
In addition to the completion of new primary research, the evaluation was informed by an extensive programme of engagement with relevant stakeholder groups. The programme of engagement included:
Bilateral meetings held with officials within the Department of Social Protection;
Meeting held with EmployAbility National Coordinators’ Forum – Athlone, 5th March 2015;
Meetings held with EmployAbility National Directors’ Forum – 13th March and 24th July 2015;
Meeting with DSP National Disability Consultative Forum, 23rd June 2015;
Meeting held with EmployAbility Job Coaches – 28th July 2015;
Ongoing bilateral engagement with EmployAbility services; and,
Provision of submissions to the evaluation by individual disability and other organisations, and individuals.
A synopsis of the findings from the engagement with stakeholders during the consultation process is presented in Annex 3. This relates to the views expressed by stakeholders only, and does not represent the views of Indecon as part of this evaluation.
1.3.4 Primary Research
A particular feature of Indecon’s evaluation methodology was the application of detailed primary/survey research. The evaluation entailed two survey research streams, as follows:
Survey of EmployAbility Clients; and,
Survey of Employers of EmployAbility Clients.
Focussed questionnaires were carefully designed by Indecon for each survey, in line with National Adult Literacy Agency (NALA) guidelines to ensure ease of completion, and were reviewed by the Department of Social Protection. The questionnaires were designed to complement existing DSP data but also to rigorously examine a range of dimensions. Copies of the questionnaires supporting each survey are provided in Annex 1 to this report.
In relation to the survey of clients/participants, a total of 1,300 clients were surveyed, broken down as follows:

1 │ Introduction, Background and Methodology
Indecon International Economic Consultants
Evaluation of EmployAbility (Supported Employment) Service
5
Clients/participants were to be chosen in broad proportion to the numbers assisted over the last three years across a random selection of eleven EmployAbility companies;
Clients must have spent a minimum of 12 months with the service over this period; and,
75% of the chosen participants within each company must have exited the service within the last three years, while 25% were currently active.
A similar number (1,300) Employer Organisations were surveyed, divided as follows:
Organisations were sourced from across the remaining twelve EmployAbility companies not included for the client survey above; and,
Employers were chosen in broad proportion to the numbers engaged/involved across each of the selected companies over the last three years.1
The fieldwork for each survey was conducted between 12th and 26th June 2015, with the assistance of EmployAbility coordinators.
Response rates
An exceptionally high level of response was achieved on Indecon’s survey research among EmployAbility clients and employer organisations. Details are summarised in the table below. Based on our experience with this type of survey, Indecon would normally expect a response rate of around 10%, but for assignments where there is an ongoing relationship 15-20% would in some cases apply. Indecon designed the survey questionnaires and options for completion for respondents to secure high response rates. Individual correspondence was also tailored to achieve this level of response. The high response rates achieved provided a strong input to the assessment. As with all such surveys interpretation of the research findings should take into account the normal risks associated with sample bias.
Table 1.1: Number of Responses to Survey Research Streams
Survey of EmployAbility Clients
No. of Responses 500
Number of Invitations Issued 1,300
Response Rate Achieved - % 38.5%
Survey of Employers of EmployAbility Clients
No. of Responses 696
Number of Invitations Issued 1,300
Response Rate Achieved - % 53.5%
Source: Indecon analysis
1 In addition, in a small number of EmployAbility locations where Disability Activation (DACT) projects also operated, employers who engaged with both programmes were removed from the sample to avoid these organisations being surveyed twice.

1 │ Introduction, Background and Methodology
6 Indecon International Economic Consultants
Evaluation of EmployAbility (Supported Employment) Service
1.4 Overview of Previous Research re Supported Employment Model
This section presents an overview of previous research in Ireland and internationally concerning the issue of supported employment. This overview assists in informing the assessment of how the EmployAbility supported employment service operates within the Irish context.
Supported employment assists people with significant disabilities (physical, intellectual, hearing, sensory, mental health and hidden) in accessing employment opportunities. The type of employment is of the individual’s choice and is in an integrated setting with appropriate ongoing support to allow them to become economically and socially active in their own communities.2 The UN Convention on the Rights of Persons with Disabilities states that persons with disabilities have a right to work.3 The Government’s recently launched Comprehensive Employment Strategy for People with Disabilities, inter alia, indicates that as with all individuals of working age, work is of high importance for individuals with disabilities and evidence shows that work can contribute towards recovery for some people with disabilities.4 The National Economic and Social Forum (2007) notes in relation to mental health that “Meaningful occupation, whether paid or unpaid, is central to recovery and…full social inclusion and participation in society is the key goal, whether in or outside the labour market. Nevertheless, work remains a key route to social inclusion for many.”5 The OECD also notes that enabling people to retain or gain employment has a stronger impact on quality of life than almost any other medical or social intervention.6
Important issues relevant to developing a supported employment programme for individuals with disabilities include the typically low levels of educational attainment among persons with disabilities, the relatively high levels of self-employment and part-time work among existing workers with a disability, and the heterogeneity of the group.7
In the Irish context, supported employment is defined as a scheme that supports people with disabilities or other disadvantaged groups in obtaining and maintaining paid employment in the open labour market.8 Supports to the individual include assistance before taking up employment, in the application process and during employment, as well as supports provided to the employer. In this context, the Irish model can be seen to broadly follow a ‘place, train and maintain model’.9
Similar to the UK, supported employment in Ireland takes the “Individual Placement and Support” (IPS) approach where individuals are placed in a job and this is followed by on-the-job training, as opposed to lengthy pre-employment training.
2 European Union of Supported Employment – see: http://www.euse.org/index.php/about-euse. 3 United Nations – see: http://www.un.org/disabilities/default.asp?id=287. 4 Comprehensive Employment Strategy for People with Disabilities -
http://justice.ie/en/JELR/Comprehensive%20Employment%20Strategy%20for%20People%20with%20Disabilities%20-%20FINAL.pdf/Files/Comprehensive%20Employment%20Strategy%20for%20People%20with%20Disabilities%20-%20FINAL.pdf.
5 National Economic and Social Forum, Mental Health & Social Inclusion, 2007, pp. 170-171. 6 OECD (2011), Sick on the job? Myths and realities about Mental Health and Work. 7 A Strategy of Engagement: Towards a Comprehensive Engagement Strategy – National Disability Authority. 8 This definition has been adopted by the European Commission:
http://ec.europa.eu/justice/discrimination/files/cowi.final_study_report_may_2011_final_en.pdf. 9 Beyer and Robinson (2009), A Review of the Research Literature on Supported Employment: A Report for the cross-Government learn-
ing disability employment strategy team. London: Cabinet Office.

1 │ Introduction, Background and Methodology
Indecon International Economic Consultants
Evaluation of EmployAbility (Supported Employment) Service
7
An important element of supported employment is the role of the job coach, who provides on-the-job training and individualised supports. The duties of the job coach include:
Assistance in identifying skills, interests and aspirations of job seekers;
Help to match skills, interests and talents with employment opportunities;
Examining tasks involved in the job and planning the supports that the applicant will
require; and,
Assistance in developing the technical and social skills required to do the job.
According to the Irish Association for Supported Employment, central to successful supported employment are three key requirements that should be in place for people with disabilities obtaining employment:10
Paid work – individuals should receive commensurate pay for work carried out and, where
applicable and feasible, an individual should receive at least the minimum wage;
Open labour market – people with disabilities should be regular employees with the same
wages, terms and conditions as other employees who are employed in similar
organisations; and,
Ongoing support – this refers to job support while in paid employment and is of an
individualised nature.
There has been a wide range of research conducted on the costs and benefits of the supported employment model, and on the most effective methods of provision. Some of this research is referenced in the Government’s Comprehensive Employment Strategy for People with Disabilities, and, inter alia, notes the following:11
Work is a realistic outcome for many people with disabilities;
However, preparation for work should start at school and transition plans should start at an early age;
The setting of goals and action plans (such as personalised progression plans) have been proven to be successful at supporting people with disabilities into further education, training or employment;
Work experience placements can play an important role in obtaining employment;
Often a ‘place and train’ model works more effectively than a ‘train and place’ method;
The social aspects of the workplace can be as important as the jobs themselves;
Engaging with and informing employers of the benefits of employing people with disabilities is important in finding suitable employment opportunities for candidates;
10 Irish Association for Supported Employment – see: http://www.iase.ie/_wp_/wp-content/uploads/2015/05/EUSE-DIVERSITY-SE-
Toolkit-2014.pdf 11Comprehensive Employment Strategy for People with Disabilities, Op. Cit.

1 │ Introduction, Background and Methodology
8 Indecon International Economic Consultants
Evaluation of EmployAbility (Supported Employment) Service
There is a need for an initial profiling of the individual’s work capacity, which should be followed by referral to the most appropriate service for that individual. This process is in place in Australia and Norway;12 and,
There can be a benefit in having both mainstream services and specialist knowledge for particular groups. For example, the OECD notes that in Denmark, experts in disability employment are placed in employment offices, while there is also a central office focussed on the needs of people with disabilities.13
The World Health Organisation (WHO)14 also makes a number of suggestions on the delivery of supported employment programmes:
Importance of anti-discrimination laws;
Incentives for both groups – individuals with disabilities to work and for employers to hire them;
Promotion of positive attitudes towards employment of people with disabilities and instilling the belief that people with disabilities can work given the right supports; and,
Importance of employer disability management programmes to facilitate return to work of those who acquire a disability.
Academic research has also considered the effectiveness of different methods of engaging with people with disabilities and in assisting individuals to find and maintain employment. Selected examples of studies are summarised below in Box 1.1.
Box 1. 1 Overview of research on assisting people with disabilities into employment
Jahoda et al. (2008) examines the impact of supported employment on the socio-emotional well-being of people with intellectual disabilities. The research shows that there are positive impacts on quality of life, well-being and autonomy, although there is an issue in relation to perceived social acceptance.
Jahoda et al. (2009) undertook a longitudinal study involving interviews with people with intellectual disabilities at the time of commencing employment and again 9-12 months later. The analysis shows that participants perceived continuing benefits from entering mainstream employment, including that their lives are more purposeful and have increased social status. However, over the follow-up period, the participants reported few social opportunities that extended beyond the workplace, and an anxiety about their competence to meet employers’ demands remained a concern for some.
12 European Commission – see:
http://ec.europa.eu/health/mental_health/eu_compass/reports_studies/disability_synthesis_2010_en.pdf, p.16. 13 OECD – see: http://www.oecd-ilibrary.org/social-issues-migration-health/mental-health-and-work_9789264124523-en. 14 World Health Organisation – see: http://www.who.int/disabilities/world_report/2011/report.pdf.
1 │ Introduction, Background and Methodology
Indecon International Economic Consultants
Evaluation of EmployAbility (Supported Employment) Service
9
Verdugo et al. (2006) examined the relative merits of supported employment versus sheltered employment in Spain. The research found no significant variations between the two groups in relation to quality of life, but the results indicated that in relation to supported employment, high levels of ‘typicalness’ (which the authors define as the degree to which the characteristics of a job are the same as those of co-workers without a disability in the same company) are associated with a higher quality of life and that the handling of certain characteristics of support and the job are related to the enhancement of quality of life of the workers. The research broadly finds that workers in supported employment show the same quality of life as those in sheltered employment centres.
Cimera (2009) examined the cost-efficiency of supported employment schemes in the US from 2002 to 2007. The research found that supported employees produce an average monthly net benefit to taxpayers of $252 ($3,017 per year) and generate a benefit-cost ratio of 1.46:1. The study also showed that individuals with multiple disabilities were associated with positive cost-effectiveness outcomes.
Shearn et al. (2000) examined the costs and outcomes of supporting individuals with intellectual disabilities in part-time employment versus supporting them in a special needs unit day centre. The researchers studied two groups of equal size – one in supported employment and one in a day centre – looking at individual engagement in activity, receipt of assistance, and social contact and interaction. While supporting people in employment was found to be more costly (in terms of support staff costs and administrative costs), employment was reported to be more beneficial to individuals with intellectual disabilities, as it showed higher task-related engagement and greater social interaction with people other than support staff. Thus, while supporting individuals in a day centre was more cost-effective, supporting individuals in employment was associated with more positive outcomes for individuals.
A number of studies have looked at the merits of the “Individual Placement and Support” (IPS) approach which is applied in the case of EmployAbility. Burns et al. (2008) conducted a randomized controlled trial of IPS versus train and place vocational rehabilitation in six European centres with varied labour market and social care conditions. It was found that IPS was more effective than vocational services in terms of finding and maintaining work, lower drop-out rates and lower re-admission rates.
A further study over the period 2007-2008 by South West London Community Mental Health Teams, involving 1,155 individuals with mental health issues who were working in employment under the IPS approach, reported that 56% obtained and maintained open employment, while 25% were supported to maintain education and training.
Hoffman et al. (2012) compared and contrasted the outcomes under traditional vocational rehabilitation with IPS employment, assessing the time to first job, job tenure, weeks worked, wages, coping with stress and quality of life. It was found that IPS participants were significantly more likely to find competitive work and work more weeks. Marshall et al. (2014) reported similar findings in that under IPS, longer hours are worked, more weeks worked per year, and fewer days taken for the individual to find their first job.
1 │ Introduction, Background and Methodology
10 Indecon International Economic Consultants
Evaluation of EmployAbility (Supported Employment) Service
1.4.1 Overview of aspects of supported employment programmes in other countries
Supported employment programmes were first implemented in the US in the 1970s and 1980s, with an initial focus on people with intellectual disabilities. The programmes were successful in that they changed the perception of people with disabilities and their capacity to undertake paid work. It showed that with the right type of supports, people with disabilities could make a meaningful contribution if they wished to do so.15
Supported employment schemes are in operation in a number of countries in Europe. Many operate under the umbrella of the European Union of Supported Employment (EUSE), which offers guidance and a platform for knowledge-sharing across national schemes. Members include Ireland (Irish Association of Supported Employment), UK (British Association of Supported Employment), Northern Ireland (Northern Ireland Union of Supported Employment), Spain, Sweden, Norway, Austria, Denmark, Finland, Germany and Greece.
Supported employment organisations also operate in a number of other jurisdictions. For example, the Canadian Association for Supported Employees is a national association of community-based service providers and stakeholders, which are active supporting employment for persons with disabilities. The association operates a model similar to the IASE in Ireland, in that supports are provided in finding employment, undertaking the application, and when individuals are in employment. Disability Employment Australia is an umbrella group representing, supporting and resourcing the disability sector in Australia.
The British Association for Supported Employment represents a large number of individual agencies involved in securing employment for people with disabilities. Similar to the Irish Association of Supported Employment, it aims to raise awareness of supported employment, represent the sector, and encourage best practice.16 Supported employment techniques have been increasingly used to support disadvantaged groups. Employment terms and conditions for people with disabilities are targeted at a level which is comparable to non-disabled persons, in that payment is at a contracted market rate, while there are equal employee benefits, safe working conditions and opportunities for career advancement. Member organisations of the association offer the following supports:17
Training – from basic skills to vocational and professional qualifications;
Finding the right job and matching skills and tastes;
Assistance in the interview process (including attendance at interview where appropriate);
On-the-job supports to guide and support individuals through the early stages; and,
Helping individuals to keep their job if they become disabled.
15 http://www.iase.ie/more-about-supported-employment/ 16 British Association for Supported Employment – see: http://base-uk.org/
17 Ibid. See: http://base-uk.org/information-jobseekers

1 │ Introduction, Background and Methodology
Indecon International Economic Consultants
Evaluation of EmployAbility (Supported Employment) Service
11
The model for supported employment involves the following steps:
Customer Engagement – members maintain close links with referring agencies and seek to encourage individuals to explore employment as a means of improving quality of life;
Vocational Profiling – identification of aspirations, learning needs, skills, experience and job interested of job seeker;
Employer Engagement – liaising with employers and encouraging them of the benefits of employing persons with disabilities, as well as recognising the value of “working inter-views” which allow individuals to demonstrate their skills in the workplace and allow the employer to gather the evidence that a formal interview seeks to capture;
Job Matching – matching individuals with suitable employment and identifying all aspects of the job and workplace including health and safety, and determining the level of assis-tance and support that would be required on-the-job;
In Work Supports – individual development plans are used to plan and monitor the em-ployee’s learning and on-the-job supports and training are provided where necessary; and,
Career Development – supported employment considers also the career development of individuals by promoting training opportunities and seeking opportunities for increased responsibility.
1.5 Outcomes from Previous Review of Supported Employment Service
It is instructive to consider the outcomes from the previous review of the Supported Employment Service, including the status of implementation of the recommended actions from that review. A national review of the former Supported Employment Service, which was overseen by FÁS, was undertaken in 2008.18 The review issued a number of recommendations for reforming the service’s operation in the future. These were as follows:
1. Develop key indicators of programme effectiveness.
2. Develop operational clarity in respect of the target group for Supported Employment.
3. Develop appropriate assessment procedures.
4. Identify and document operational procedures in respect of key areas of implementation.
5. Develop a national identity for the Supported Employment Programme and devise and implement a marketing strategy for the programme.
Following extensive consultation with key stakeholders an action plan was adopted in line with the recommendations of the review, to enhance the effectiveness of the programme. The action was initiated in 2009 and the following actions were implemented with a view to addressing the recommendations from the 2008 review:
The introduction of specific Key Performance Indicators to review and monitor programme effectiveness. (The current position in relation to performance indicators is examined in Section 3.7 of this report.)
18 FÁS, Research Report on the Operations and Effectiveness of the Supported Employment Programme, May 2008.
1 │ Introduction, Background and Methodology
12 Indecon International Economic Consultants
Evaluation of EmployAbility (Supported Employment) Service
The development of appropriate methods of assessment of client entry to programme and the implementation of these procedures. (This aspect is considered further in Section 2.)
The development of vocational profiling, needs assessment and Individual Employment Plans for participants. (This aspect is considered further in Section 2.)
The development of operational clarity through the revision of the Operating Standards guidelines. (New guidance on Operating Standards for the service was issued in 2011, but this aspect is considered further in Section 5.)
Job Coaches and Co-ordinators undertook competency development training (FETAC Level 6) in key areas including Mental Health Awareness, and Client Profiling and Support.
The 2008 review also included a recommendation to secure greater employer participation in the programme, by repositioning the programme in the labour market. This was to be achieved through the launch of the new national identity ‘EmployAbility Service’ brand. A formal launch for this brand/identity was made by the Minister for Social Protection in February 2012.19
1.6 Report Structure
The remainder of the report is structured as follows:
Section 2 presents an overview of the EmployAbility service;
Section 3 contains the assessment of the effectiveness and efficiency of the service;
Section 4 examines the scale and scope of service provision in the context of the demand for supported employment services;
Section 5 assesses the appropriateness of the governance structures for the service; and,
Section 6 integrates the detailed assessment undertaken in the preceding sections to develop overall conclusions and present policy recommendations for the future direction of the programme.
1.7 Acknowledgements and Disclaimer
Indecon would like to acknowledge the assistance and inputs to this evaluation provided by a number of individuals and organisations. Particular thanks are due to Teresa Leonard, John McKeon, Oliver Egan, Liam Walsh and Ciaran Diamond of the Department of Social Protection.
We are also very grateful to a wide range of representative organisations that provided submissions and valuable inputs to this review, including the National Disability Authority, the Health Services Executive, the Disability Federation of Ireland, Inclusion Ireland, Mental Health Reform, the National Advocacy Service, the Irish Association of Supported Employment, the Citizens Information Board, Rehab, the Mid-West Mental Health Occupational Therapy Service, and the European Union of Supported Employment.
19 Department of Social Protection – see: https://www.welfare.ie/en/pressoffice/Pages/pr130212.aspx.
1 │ Introduction, Background and Methodology
Indecon International Economic Consultants
Evaluation of EmployAbility (Supported Employment) Service
13
We would also like to acknowledge high level of co-operation and inputs of the EmployAbility service, including companies around the country which assisted in relation to data provision and primary research. Particular thanks are due to Declan Tanham and to Sheila Comiskey for their valuable assistance throughout the evaluation process.
The usual disclaimer applies and responsibility for the analysis and findings in this independent report remains the sole responsibility of Indecon.
2 │ Overview of EmployAbility
14 Indecon International Economic Consultants
Evaluation of EmployAbility (Supported Employment) Service
2 Overview of EmployAbility
2.1 Introduction
This section gives an overview of the EmployAbility service in terms of its aims and objectives and the types of activities that the service undertakes in achieving these aims and objectives.
2.2 Overview of EmployAbility and Project Aims and Objectives
2.2.1 Overall Aims and Objectives of EmployAbility
The EmployAbility service, which was formerly known as the Supported Employment Programme, is a national employment service dedicated to improving employment outcomes for job seekers with a disability. Its overall vision is ‘Supporting people with a disability to secure and maintain employment’ and it aims to help stem the flow of people with disabilities and extra support needs into long-term unemployment by facilitating integration into suitable and fulfilling mainstream employment. Its mission entails:
Forming alliances and working partnerships with other organisations and service providers throughout Ireland to meet organisational objectives;
Playing an active and leading role in informing and influencing employers with regard to the benefits of employing people with disabilities; and,
Setting and promoting world class standards in employment and placement services within a framework of total equality and continuous improvement.
It was established in 2000 and is funded by the Department of Social Protection (DSP) with the objective of providing critical supports for jobseekers with a disability and other disadvantaged groups to join the open labour market. EmployAbility also provides supports for employers to employ a person with a disability and to assist with employee integration into the workforce. There are a total of 23 EmployAbility services nationally. Referrals to the EmployAbility programme are made through the DSP and the service is delivered by trained staff over a period of 18 months, with the objective for clients to be working independently in the open labour market or alternatively to have identified a clear employment progression plan upon completion of the programme.
The EmployAbility model involves five stages, including:
Stage 1: Initial Contact/Employment
Stage 2: Employment Needs Assessment, Vocational Profiling and Career Planning
Stage 3: Job Search and Marketing
Stage 4: Progression to Work Experience and Open Employment
Stage 5: Progression to Independent Employment without Job Coach Support
As set out in the Operating Standards (2011), employment with support from the service includes formal work experience and employment in the open labour market leading to working a minimum of eight hours per week.
2 │ Overview of EmployAbility
Indecon International Economic Consultants
Evaluation of EmployAbility (Supported Employment) Service
15
Approximately 2,700 individuals enrol in the service per year and supports are provided to employers and clients through job coaches. The range of supports include individual needs assessments, vocational profiling and career planning, the development of an individual employment plan, job sourcing and job matching, on-the-job support and coaching, advice and support to employers, and follow-up support and mentoring to both employers and employees.20
Clients in the EmployAbility programme can progress to various forms of employment, including internships, community employment appointments, and further vocational skills training.21 The definition of employment is that which is obtained in the open labour market, involving at least eight hours per week, and is paid employment. Job coaches provide career advice to clients, including professional guidance in career planning, identification of skills, and job search assistance and advice.
Employment supports are also provided, including access to job vacancies, assistance in the job application process, matching skills with employers’ needs, work experience placements, and assistance in integrating into the workplace. Follow-up supports are also provided, as required to maintain employment.
Through the service, employers obtain free recruitment and employment services, a database of skilled jobseekers, on-going support from job coaches, and advice on employment grants and supports.
There are a number of grants provided by the DSP that aim to help employees with a disability to gain and retain employment, including the Workplace Equipment/Adaptation Grant (WEAG), Job Interview – Interpreter Grant (JIIG), Personal Reader Grant (PRG), Employee Retention Grant Scheme (ERGS), Wage Subsidy Scheme, Disability Awareness Training for Employers and the Back to Work Enterprise Allowance. For example, the Wage Subsidy Scheme provides a financial subsidy to employers for identified shortfalls in productivity levels.
2.3 Geographical Distribution of EmployAbility Services
There are a total of 23 EmployAbility companies, including:
3 in Dublin
3 in the Mid-West
2 in the Midlands
2 in the North East
2 in the North Midlands
1 in the North West
5 in the South East
3 in the South West
2 in the West
20 http://www.work4u.ie/Brochure%20and%20PDF/Employability_Services_brochure_WEB.pdf 21 Our understanding, based on clarifications provided to Indecon by EmployAbility, is that when a participant is active on the
programme and supported while in an internship position, they are included in the service employment KPIs (KPI 1) reported to DSP. However, when a client exits the service while in an internship position, they are not treated as an employment outcome under KPI 2.

2 │ Overview of EmployAbility
16 Indecon International Economic Consultants
Evaluation of EmployAbility (Supported Employment) Service
Table 2.1 below describes the names and catchment areas of each service.
Table 2.1: Regional Breakdown of EmployAbility
Region EmployAbility Company
Name EmployAbility Trading
Name Company Catchment Area
Dublin
Employability Ltd. (Dublin West)
EmployAbility Dublin West Dublin 8, 10, 12, 20, 22, 24. SW County-Lucan, Rathcoole, New-castle etc.
Work4u Ltd (Dublin North) EmployAbility Dublin North Dublin North
Dublin South Supported Em-ployment Ltd.
EmployAbility Dublin South Dublin South
Mid-West
Work Access Ltd. EmployAbility Limerick Limerick City and County
Clare Supported Employment Service Ltd
EmployAbility Clare County Clare
North Tipperary Supported Employment Ltd.
EmployAbility North Tip-perary
County Kildare
Midlands
Kildare Coalition of Supported Employment Ltd.
EmployAbility Kildare Kildare County
Midland Employment Support Agency Ltd.
EmployAbility Laois/Offaly/Westmeath/Longford
Laois Offaly Longford West-meath
North East
Co. Louth Supported Employ-ment Partnership Ltd.
EmployAbility Louth County Louth
Monaghan Supported Employ-ment Ltd.
EmployAbility Mona-ghan/Cavan
County Cavan/Monaghan
North Midlands
Co. Roscommon Supported Employment Service Ltd.
EmployAbility Roscommon County Roscommon
Jobmatters Ltd. (Meath) EmployAbility Meath County Meath
North West Employment Response North West Ltd.
EmployAbility Done-gal/Sligo/Leitrim
Sligo Leitrim and Donegal
South East
Waterford Employment Sup-port Agency Ltd
EmployAbility Waterford Waterford City and County
South Tipperary Supported Employment Project Ltd.
EmployAbility South Tipp Tipperary South
Kilkenny/Carlow Area Support-ed Employment Service
EmployAbility Kilkenny Kilkenny and Carlow
Wexford Consortium For Sup-ported Employment Ltd
EmployAbility Wexford Wexford County
Wicklow Supported Employ-ment Network Ltd
EmployAbility Wicklow Wicklow County
South West
First Employment Services Ltd EmployAbility Cork Cork City, North East and South Cork, West Cork as far as Macroom
Workstart West Cork Ltd EmployAbility West Cork South West Cork
Kerry Supported Employment Ltd.
EmployAbility Kerry Kerry
West Galway Supported Employment Consortium
EmployAbility Galway Galway County
Work Web West Ltd. EmployAbility Mayo Mayo
Source: Indecon analysis
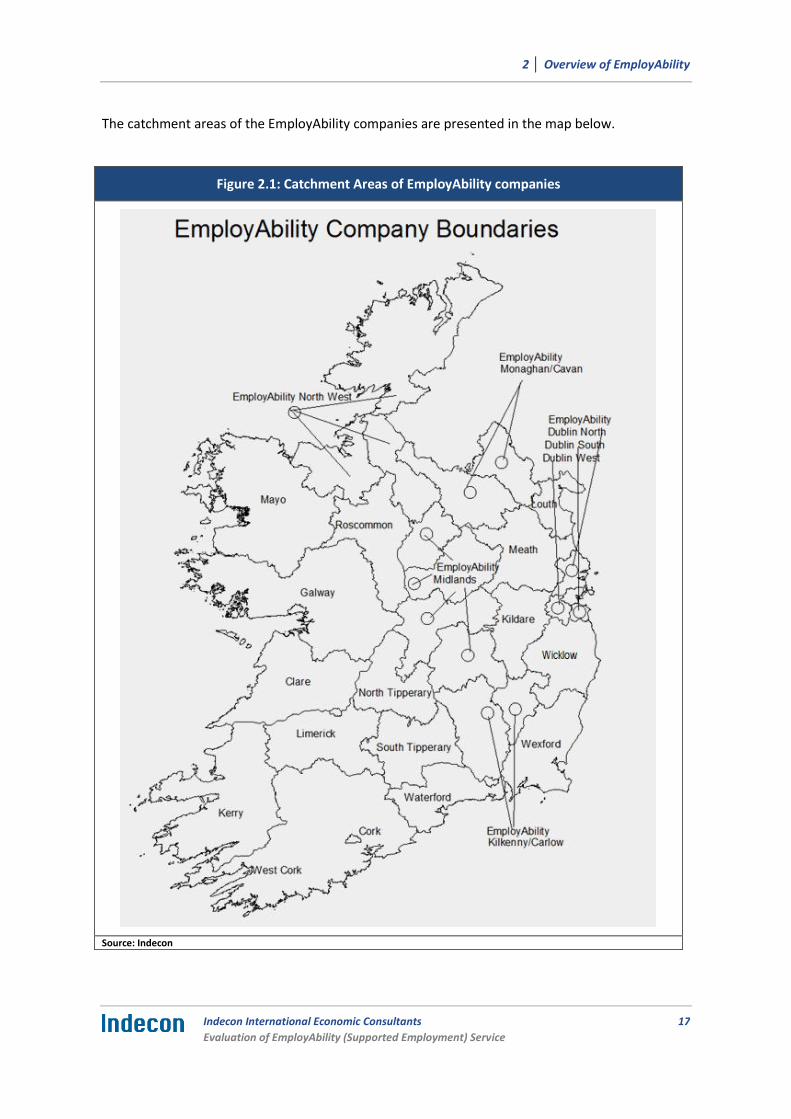
2 │ Overview of EmployAbility
Indecon International Economic Consultants
Evaluation of EmployAbility (Supported Employment) Service
17
The catchment areas of the EmployAbility companies are presented in the map below.
Figure 2.1: Catchment Areas of EmployAbility companies
Source: Indecon

2 │ Overview of EmployAbility
18 Indecon International Economic Consultants
Evaluation of EmployAbility (Supported Employment) Service
2.4 Target Groups and Eligibility
The employment support is available to jobseekers that are at least 18 years of age, who have a disability and require a level of support to succeed in long-term and sustainable employment. The range of disabilities is broad and can include intellectual, mental health, physical, sensory, hidden and/or medical. The client should reside in the geographic catchment area of their local EmployAbility service.
The client must be ‘job ready’, where this is defined as: having the necessary training, motivation, education and ability to progress to work and pursue work/career in the open labour market; willing and able (with support) to work at least eight hours per week in open employment; and having the required training and education for their chosen career. The job ready definition was designed when the Supported Employment Service was overseen by FÁS. In the context of the supported employment model, of importance is that the definition does not include individuals who require more intensive levels of support and who would not have the possibility of achieving open market employment.
Clients in receipt of a disability-related social welfare payment, for example, Disability Allowance, Illness Benefit, Invalidity Pension etc. do not require further medical evidence to access the service. Where the client is on Jobseeker’s Allowance or not in receipt of a social welfare payment, they must have a letter from their GP stating their eligibility for the programme.
2.5 Activities undertaken by EmployAbility
The EmployAbility service entails 10 key stages as illustrated in the schematic overleaf. This involves the first interaction of the client with EmployAbility through to their eventual exit from the service.
To be referred to the service, clients can seek a referral through their local INTREO office or Local Employment Service.22 Once the referral is received, clients are informed of how long they will be on the waiting list.
Upon being deemed eligible for the service by the DSP, clients are assigned a job coach. Job coaches work on a one to one basis with clients, providing each client with an individual package of support, taking into account each client’s attributes and aspirations whilst planning how to address the barriers they may face in gaining and maintaining employment. Job coaches also liaise and engage with employers to identify potential opportunities for clients, as well as the needs of employers. The service operates on the basis of a ratio of 25 clients to one job coach. This is followed by a needs assessment, of which the time to complete can vary by client. The client then receives support through development of skills, depending on their prior attributes and disabilities/needs. Client skillsets and career goals are assessed, leading to the development of a profile with regard to future avenues including employment.
A plan is then made with the employer of the client and this specifies that level of ongoing engagement and support that the client will require. Stage 9 involves the client exiting EmployAbility and where they exit to employment, the employer engagement plan is activated, to provide ongoing support for both employee and employer where necessary. We understand that where a client exits to another destination (e.g., to further education or training), no recorded
22 http://www.employabilitycork.ie/drupal/job-seekers/frequently-asked-questions

2 │ Overview of EmployAbility
Indecon International Economic Consultants
Evaluation of EmployAbility (Supported Employment) Service
19
support service is provided. Occasionally a client may contact their job coach for advice and emotional support, but this is not treated as part of the active caseload.
Figure 2.2: Stages of EmployAbility Service
Source: Indecon
The 10 stages of the EmployAbility fall across four key themes, as outlined below:23
Profiling and Career Planning
Getting to know the client; Identifying barriers, obstacles and any support needs; Helping you to identify skills and abilities; Preparing CV's and references; Matching skills of clients to suitable jobs; and,
23 http://www.employabilitygalway.ie/new-page/
Stages of EmployAbility Service
1. Individual calls to/commences interaction with EmployAbility.
2. Department of Social Protection ascertains eligibility and refers individual to service.
3. A Job Coach is assigned to the new Client.
4. A Needs Assessment is undertaken. The time required to complete this can vary depending on the client.
5. The Client is supported through Skills Development, as required depending on their prior attributes and disabilities.
6. Client skillsets and career/life development goals are assessed, and a profile is built with regard to possible avenues for future development, including
employment.
7. Relationship building with Employers to identify potential opportunities for Clients.
8. A plan is made with the Employer for the Client, which inter alia will specify the level of intensity of ongoing engagement and support required.
9. The Client exits. If to Employment, the employer engagement plan is activated, to provide ongoing support where required depending on client
needs.
10. If Client exits to other destinations (e.g. to further education/training) ongoing contact is maintained post-18 months.
2 │ Overview of EmployAbility
20 Indecon International Economic Consultants
Evaluation of EmployAbility (Supported Employment) Service
Developing an Action Plan for Job Sourcing.
Job Search Providing support to help the client look for work; Working with the client to find a job; Helping the client to prepare for an interview; Going to interviews with the client (if required); and, Helping to agree with terms and conditions of employment.
Employed Support
Training the client on-the-job; Developing work skills; Mentoring; Accessing grants; Supporting the employer; and, Helping with client’s contract and wages.
Working Independently
Needing less support over time; Working without support; and, Exit from EmployAbility.
As part of the programme, clients typically undertake a work experience placement, often with a duration of up to seven weeks. Clients are placed with employers at no cost to the employer and receive a payment of €20 per week from their EmployAbility service. It enables both the employer and the client to identify if the placement could lead to a successful longer-term employment opportunity.

3 │ Assessment of Effectiveness and Efficiency of Service
Indecon International Economic Consultants
Evaluation of EmployAbility (Supported Employment) Service
21
3 Assessment of Effectiveness and Efficiency of Service
3.1 Introduction
This section presents an overview of the analysis in relation to effectiveness and efficiency of the EmployAbility service, through examination of financial inputs/expenditures, service activities (referrals and clients), and the evidence in relation to outcomes for clients in terms of progression to employment and other achievements.
3.2 Service Inputs
3.2.1 Financial Inputs – Expenditures
The table below indicates the overall level of expenditure on the EmployAbility service over the five-year period from 2010 to 2014. Between 2010 and 2014, overall spend on the service has been broadly stable on an annual basis, in the range of €8.1 million to €8.8 million. Since 2012 the service’s actual spend has been in the range of 91.2% to 98.6% of budgeted spend. Of note has been the stability of budgets and spend in a wider context of severe cutbacks in many areas of public services during this period.
Table 3.1: Budget and Expenditure of EmployAbility Service – 2010-2014
2010 2011 2012 2013 2014
€ € € € €
Budgeted Expenditure 8,780,000 8,840,000 8,840,000 8,840,000 9,240,000
Contracted Expenditure N/a N/a 8,800,000 8,770,000 8,990,000
Actual Expenditure 8,840,000 8,483,000 8,104,027 8,713,069 8,427,779
Actual as a Percent of Budgeted Expenditure
100.6% 95.9% 91.7% 98.6% 91.2%
Source: Indecon analysis of EmployAbility data
In looking at the breakdown of the annual expenditures, the main costs include staff costs, programme running costs and buildings costs (see table overleaf). There are also costs associated with publicity and promotional work for the programme.

3 │ Assessment of Effectiveness and Efficiency of Service
22 Indecon International Economic Consultants
Evaluation of EmployAbility (Supported Employment) Service
Table 3.2: Costs of EmployAbility Programme 2012 - 2014
2012 - € 2013 - € 2014 - €
Scheme & Course Brochures 1,700 3,947 840
Publicity / Events 5,116 4,752 -
Promotional Communications 12,040 7,881 153,682
Printing & Scanning Costs 13,032 5,301 2,920
Programme Staff Costs 7,170,236 7,460,171 6,854,152
Programme Running Costs 591,316 966,033 1,258,667
Programme Building Costs 299,743 264,984 157,518
WPS Trainee Costs 10,844 - -
Total 8,104,027 8,713,069 8,427,779
Source: Indecon analysis of EmployAbility data
A key issue for this evaluation concerns the measurable outcomes from the expenditures that have been incurred by EmployAbility. The first aspect requiring assessment in this context concerns the level of activity, in terms of referrals and client numbers assisted by the service. These aspects are examined below.
3.3 Assessment of Service Effectiveness
3.3.1 Referrals to EmployAbility
All potential EmployAbility clients must be referred through a Department of Social Protection INTREO office or a Local Employment Service, and they have final authority in determining an individual’s suitability for referral. The table below presents the number of referrals to EmployAbility over the five-year period since 2010. This provides an indication of demand for the service. The figures indicate an upward trend, with the number of referrals increasing by one-third between 2010 and 2014, with a total of 12,326 individuals referred over the five-year period. The analysis points to a recent increase in demand for the service.
Table 3.3: Number of Referrals to EmployAbility
Year Total No. of Referrals
2010 2,075
2011 2,257
2012 2,134
2013 2,709
2014 3,151
Total 2010 - 2014 12,326
% Change – 2010-2014 51.8%
Source: Indecon analysis of EmployAbility data
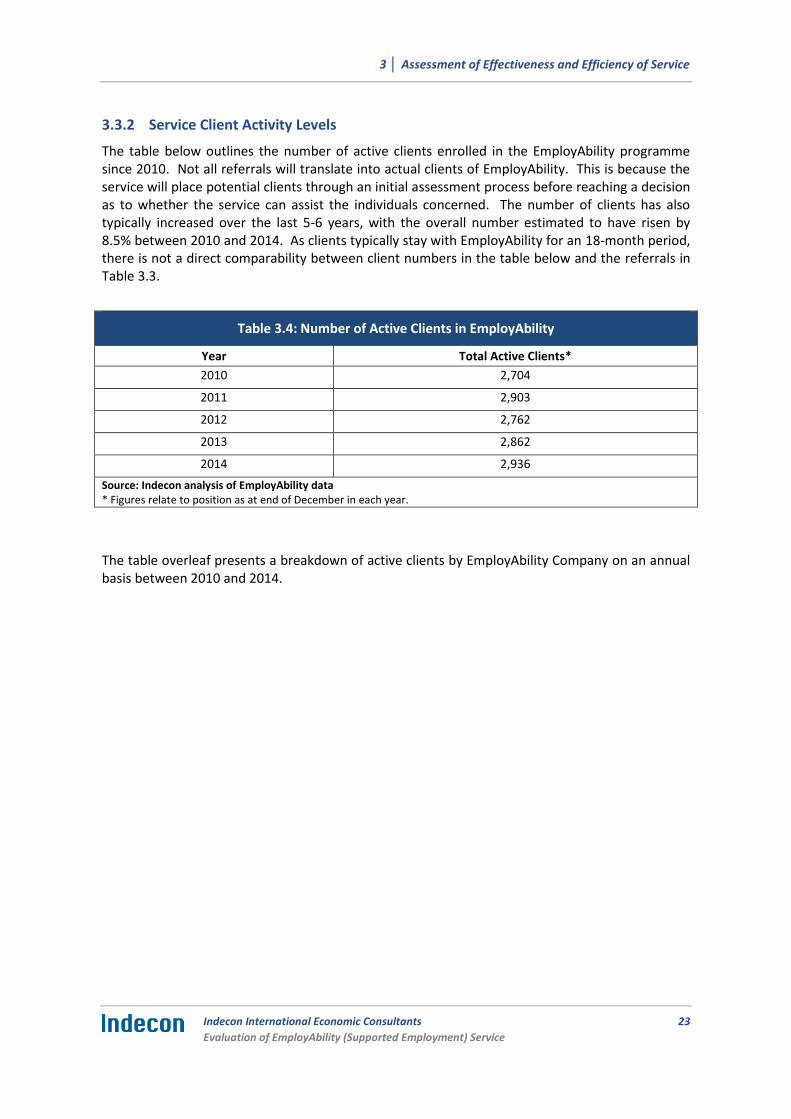
3 │ Assessment of Effectiveness and Efficiency of Service
Indecon International Economic Consultants
Evaluation of EmployAbility (Supported Employment) Service
23
3.3.2 Service Client Activity Levels
The table below outlines the number of active clients enrolled in the EmployAbility programme since 2010. Not all referrals will translate into actual clients of EmployAbility. This is because the service will place potential clients through an initial assessment process before reaching a decision as to whether the service can assist the individuals concerned. The number of clients has also typically increased over the last 5-6 years, with the overall number estimated to have risen by 8.5% between 2010 and 2014. As clients typically stay with EmployAbility for an 18-month period, there is not a direct comparability between client numbers in the table below and the referrals in Table 3.3.
Table 3.4: Number of Active Clients in EmployAbility
Year Total Active Clients*
2010 2,704
2011 2,903
2012 2,762
2013 2,862
2014 2,936
Source: Indecon analysis of EmployAbility data * Figures relate to position as at end of December in each year.
The table overleaf presents a breakdown of active clients by EmployAbility Company on an annual basis between 2010 and 2014.

3 │ Assessment of Effectiveness and Efficiency of Service
24 Indecon International Economic Consultants
Evaluation of EmployAbility (Supported Employment) Service
Table 3.5: Number of Active Clients in EmployAbility – Company Breakdown*
Company 2010 2011 2012 2013 2014 Percentage
Change 2010 - 2014
EmployAbility Dublin West 130 152 150 143 156 20%
EmployAbility Dublin North 98 116 119 113 104 6%
EmployAbility Dublin South 106 124 119 99 92 -13%
EmployAbility Limerick 74 94 79 100 89 20%
EmployAbility Clare 114 125 107 105 115 1%
EmployAbility North Tipperary
85 71 83 98 76 -11%
EmployAbility Kildare 136 140 167 146 176 29%
EmployAbility Laois/Offaly/Westmeath/ Longford
151 148 139 140 150 -1%
EmployAbility Louth 150 234 160 160 128 -15%
EmployAbility Monaghan/Cavan
163 164 162 216 227 39%
EmployAbility Roscommon 112 116 100 107 114 2%
EmployAbility Meath 89 68 88 88 107 20%
EmployAbility Donegal/Sligo/Leitrim
103 119 105 145 144 40%
EmployAbility Waterford 95 125 127 76 103 8%
EmployAbility South Tipperary
75 78 76 100 76 1%
EmployAbility Kilkenny/Carlow
120 108 123 152 150 25%
EmployAbility Wexford 78 76 77 75 77 -1%
EmployAbility Wicklow 117 127 99 111 126 8%
EmployAbility Cork 234 218 203 214 172 -26%
EmployAbility West Cork 104 136 115 98 148 42%
EmployAbility Kerry 145 146 139 166 141 -3%
EmployAbility Galway 100 102 116 112 136 36%
EmployAbility Mayo 125 116 109 98 129 3%
Source: Indecon analysis of EmployAbility data * Figures relate to position as at end of December in each year.
The analysis indicates that a number of EmployAbility services have seen significant growth in client numbers since 2010, particularly in Dublin West, Limerick, Kildare, Monaghan, the North West, Kilkenny, West Cork and Galway. However, some companies have seen declines, including in particular Dublin South, North Tipperary, Louth and Cork. The geographic pattern of client numbers is important in assessing the scale and scope of service provision.
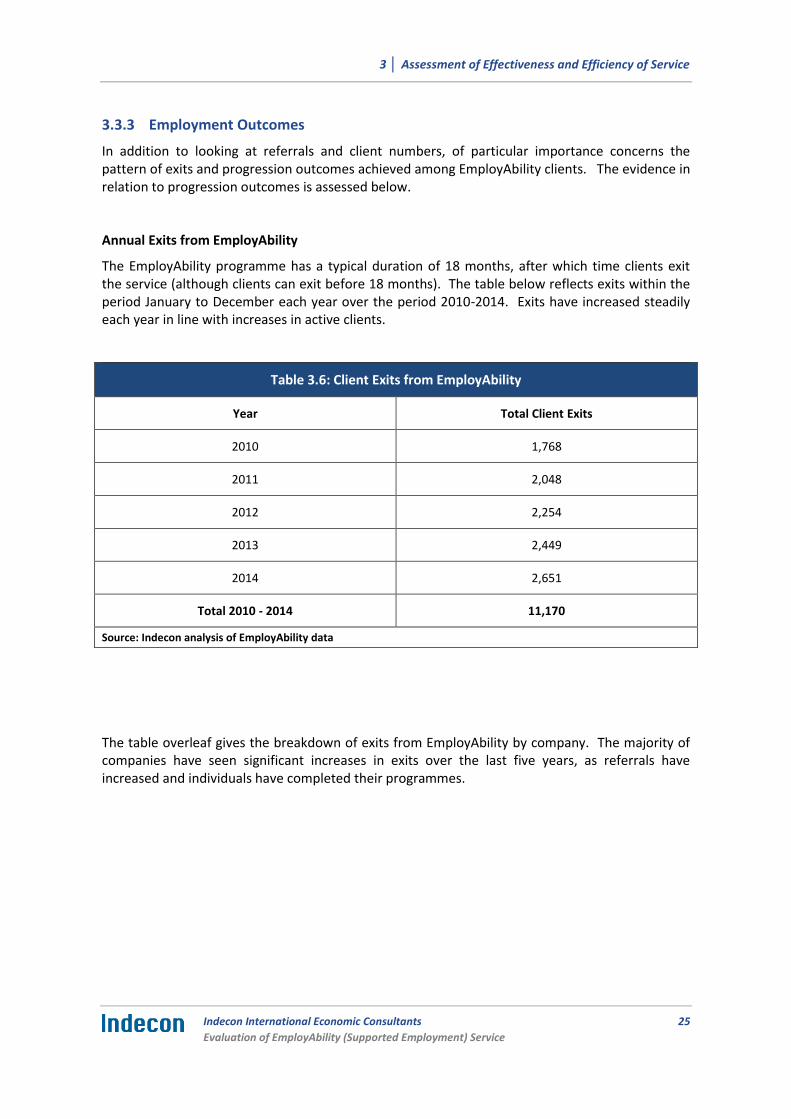
3 │ Assessment of Effectiveness and Efficiency of Service
Indecon International Economic Consultants
Evaluation of EmployAbility (Supported Employment) Service
25
3.3.3 Employment Outcomes
In addition to looking at referrals and client numbers, of particular importance concerns the pattern of exits and progression outcomes achieved among EmployAbility clients. The evidence in relation to progression outcomes is assessed below.
Annual Exits from EmployAbility
The EmployAbility programme has a typical duration of 18 months, after which time clients exit the service (although clients can exit before 18 months). The table below reflects exits within the period January to December each year over the period 2010-2014. Exits have increased steadily each year in line with increases in active clients.
Table 3.6: Client Exits from EmployAbility
Year Total Client Exits
2010 1,768
2011 2,048
2012 2,254
2013 2,449
2014 2,651
Total 2010 - 2014 11,170
Source: Indecon analysis of EmployAbility data
The table overleaf gives the breakdown of exits from EmployAbility by company. The majority of companies have seen significant increases in exits over the last five years, as referrals have increased and individuals have completed their programmes.

3 │ Assessment of Effectiveness and Efficiency of Service
26 Indecon International Economic Consultants
Evaluation of EmployAbility (Supported Employment) Service
Table 3.7: Client Exits from EmployAbility – Company Breakdown
Company 2010 2011 2012 2013 2014
EmployAbility Dublin West 81 100 135 109 156
EmployAbility Dublin North 78 115 142 188 149
EmployAbility Dublin South 112 88 128 159 137
EmployAbility Limerick 76 60 94 79 84
EmployAbility Clare 103 105 133 114 87
EmployAbility North Tipperary 16 27 22 143 58
EmployAbility Kildare 22 41 38 71 111
EmployAbility Laois/Offaly/Westmeath/Longford 68 112 118 129 122
EmployAbility Louth 95 115 143 129 159
EmployAbility Monaghan/Cavan 62 86 108 85 194
EmployAbility Roscommon 33 64 59 46 82
EmployAbility Meath 20 53 47 70 74
EmployAbility Donegal/Sligo/Leitrim 88 73 101 75 124
EmployAbility Waterford 71 79 51 80 81
EmployAbility South Tipperary 27 43 47 37 69
EmployAbility Kilkenny/Carlow 105 112 104 91 109
EmployAbility Wexford 62 94 65 91 81
EmployAbility Wicklow 126 122 169 98 152
EmployAbility Cork 143 206 216 223 167
EmployAbility West Cork 70 60 37 89 101
EmployAbility Kerry 147 147 186 130 157
EmployAbility Galway 109 98 99 147 126
EmployAbility Mayo 54 48 12 66 71
Source: Indecon analysis of EmployAbility data
Extent of non-completion of EmployAbility programme
An important issue concerns the extent to which clients are completing the full duration of the EmployAbility programme. As indicated in Section 2, the service is delivered over a period of 18 months, with the objective for clients to be working independently in the open labour market or alternatively to have identified a clear employment progression plan upon completion of the programme. According to the service there is a high level of client non-completion (47% in 2014), due to unsuitability, ill health or non-engagement. This impacts on potential outcomes and if non-completions are removed from the exit data this would suggest that 46.9% of clients exited the programme while in employment, although this still falls short of the target level (see table overleaf).

3 │ Assessment of Effectiveness and Efficiency of Service
Indecon International Economic Consultants
Evaluation of EmployAbility (Supported Employment) Service
27
Table 3.8: EmployAbility – % of Clients Exiting Programme while in Employment (excluding Clients who Dropped Out/Did Not Complete *
Company 2013 2014
EmployAbility Dublin West 38.5% 58.9%
EmployAbility Dublin North 31.0% 24.7%
EmployAbility Dublin South 33.3% 45.2%
EmployAbility Limerick 25.6% 41.3%
EmployAbility Clare 16.7% 26.4%
EmployAbility North Tipperary 23.8% 53.4%
EmployAbility Kildare 46.2% 59.5%
EmployAbility Laois/Offaly/Westmeath/Longford 56.1% 46.5%
EmployAbility Louth 46.7% 63.2%
EmployAbility Monaghan/Cavan 76.6% 60.7%
EmployAbility Roscommon 84.4% 62.1%
EmployAbility Meath 61.8% 44.4%
EmployAbility Donegal/Sligo/Leitrim 33.3% 36.6%
EmployAbility Waterford 32.7% 45.8%
EmployAbility South Tipperary 46.9% 42.9%
EmployAbility Kilkenny/Carlow 35.2% 35.8%
EmployAbility Wexford 21.0% 22.6%
EmployAbility Wicklow 38.7% 58.2%
EmployAbility Cork 39.1% 46.6%
EmployAbility West Cork 42.7% 34.7%
EmployAbility Kerry 35.4% 44.7%
EmployAbility Galway 24.5% 53.8%
EmployAbility Mayo 33.3% 34.1%
Total 37.7% 46.9%
Source: Indecon analysis of EmployAbility data * Clients who dropped out/did not complete include individuals who fell into ill health, found the service unsuitable or did not engage
Further detail in relation to the profile of those who did not complete the programme was not available to Indecon for this evaluation and this is an area that would benefit from enhanced data collection in the future.
The high rate of non-completion impacts on potential outcomes, but also raises an issue regarding the appropriateness of the access criteria and the targeting of the programme, including the definition of ‘job ready’ in instances where the service may not be suitable for some individuals. This issue is considered further in Section 3.8 in relation to the appropriateness of the criteria for access to the service.
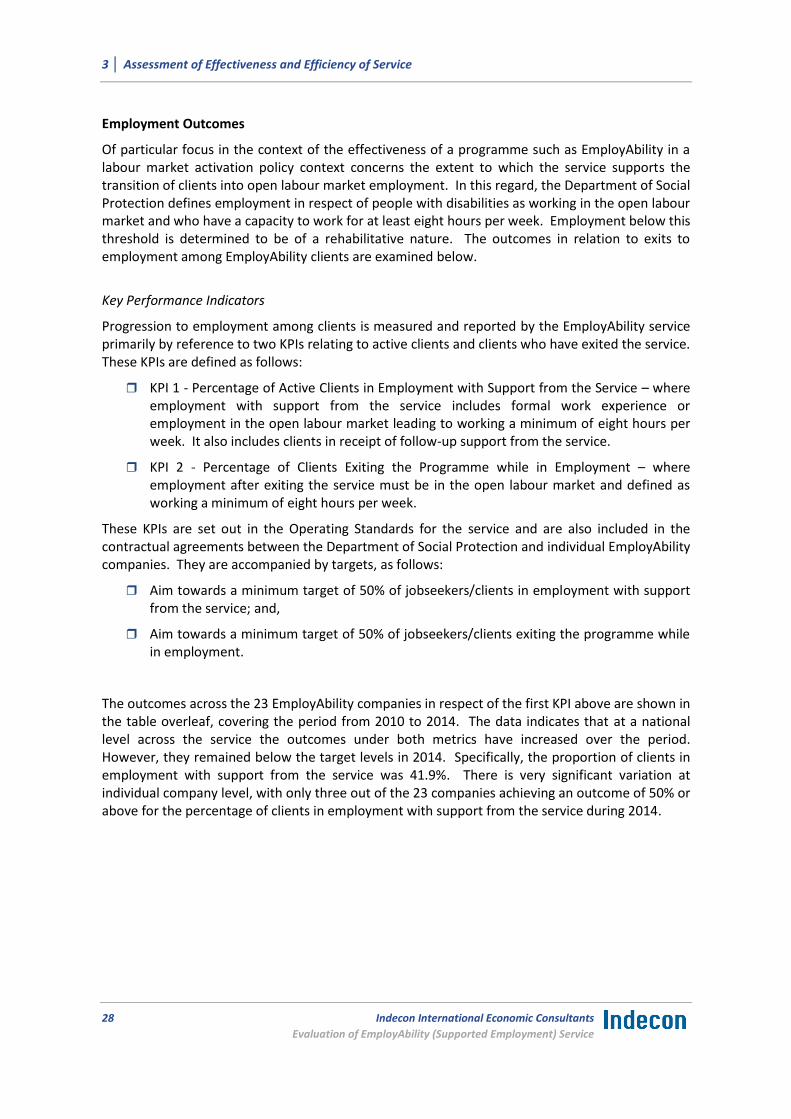
3 │ Assessment of Effectiveness and Efficiency of Service
28 Indecon International Economic Consultants
Evaluation of EmployAbility (Supported Employment) Service
Employment Outcomes
Of particular focus in the context of the effectiveness of a programme such as EmployAbility in a labour market activation policy context concerns the extent to which the service supports the transition of clients into open labour market employment. In this regard, the Department of Social Protection defines employment in respect of people with disabilities as working in the open labour market and who have a capacity to work for at least eight hours per week. Employment below this threshold is determined to be of a rehabilitative nature. The outcomes in relation to exits to employment among EmployAbility clients are examined below.
Key Performance Indicators
Progression to employment among clients is measured and reported by the EmployAbility service primarily by reference to two KPIs relating to active clients and clients who have exited the service. These KPIs are defined as follows:
KPI 1 - Percentage of Active Clients in Employment with Support from the Service – where employment with support from the service includes formal work experience or employment in the open labour market leading to working a minimum of eight hours per week. It also includes clients in receipt of follow-up support from the service.
KPI 2 - Percentage of Clients Exiting the Programme while in Employment – where employment after exiting the service must be in the open labour market and defined as working a minimum of eight hours per week.
These KPIs are set out in the Operating Standards for the service and are also included in the contractual agreements between the Department of Social Protection and individual EmployAbility companies. They are accompanied by targets, as follows:
Aim towards a minimum target of 50% of jobseekers/clients in employment with support from the service; and,
Aim towards a minimum target of 50% of jobseekers/clients exiting the programme while in employment.
The outcomes across the 23 EmployAbility companies in respect of the first KPI above are shown in the table overleaf, covering the period from 2010 to 2014. The data indicates that at a national level across the service the outcomes under both metrics have increased over the period. However, they remained below the target levels in 2014. Specifically, the proportion of clients in employment with support from the service was 41.9%. There is very significant variation at individual company level, with only three out of the 23 companies achieving an outcome of 50% or above for the percentage of clients in employment with support from the service during 2014.
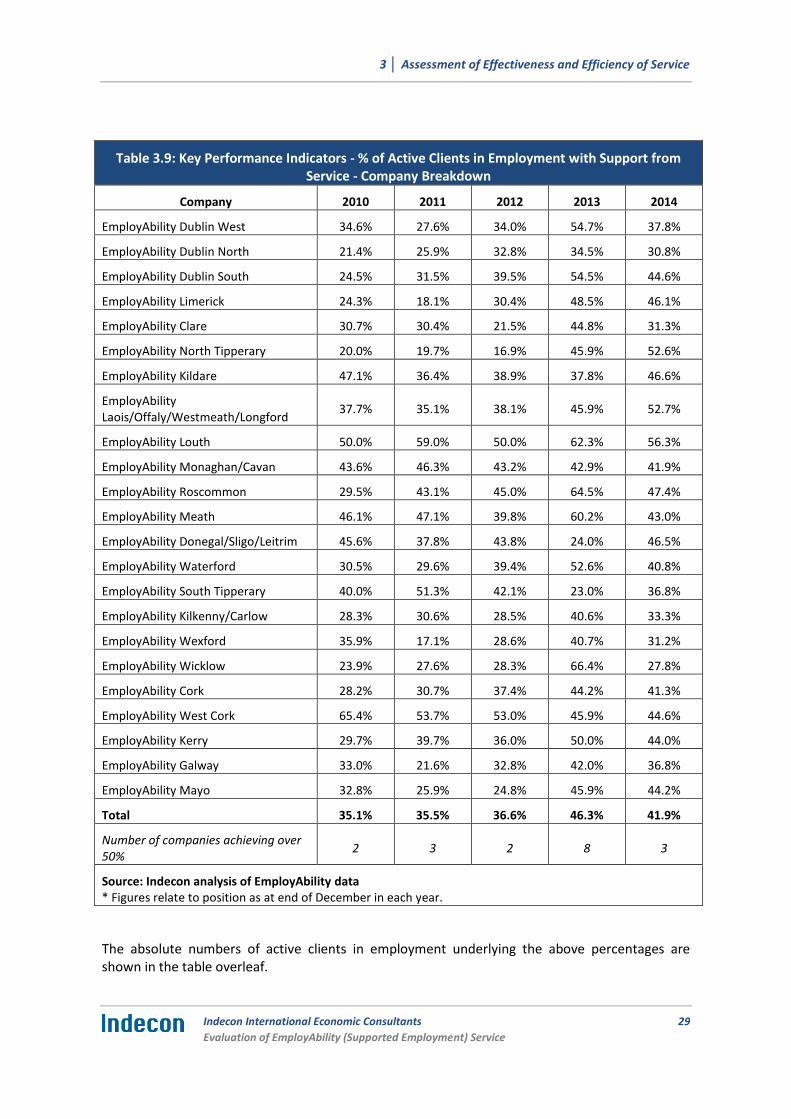
3 │ Assessment of Effectiveness and Efficiency of Service
Indecon International Economic Consultants
Evaluation of EmployAbility (Supported Employment) Service
29
Table 3.9: Key Performance Indicators - % of Active Clients in Employment with Support from Service - Company Breakdown
Company 2010 2011 2012 2013 2014
EmployAbility Dublin West 34.6% 27.6% 34.0% 54.7% 37.8%
EmployAbility Dublin North 21.4% 25.9% 32.8% 34.5% 30.8%
EmployAbility Dublin South 24.5% 31.5% 39.5% 54.5% 44.6%
EmployAbility Limerick 24.3% 18.1% 30.4% 48.5% 46.1%
EmployAbility Clare 30.7% 30.4% 21.5% 44.8% 31.3%
EmployAbility North Tipperary 20.0% 19.7% 16.9% 45.9% 52.6%
EmployAbility Kildare 47.1% 36.4% 38.9% 37.8% 46.6%
EmployAbility Laois/Offaly/Westmeath/Longford
37.7% 35.1% 38.1% 45.9% 52.7%
EmployAbility Louth 50.0% 59.0% 50.0% 62.3% 56.3%
EmployAbility Monaghan/Cavan 43.6% 46.3% 43.2% 42.9% 41.9%
EmployAbility Roscommon 29.5% 43.1% 45.0% 64.5% 47.4%
EmployAbility Meath 46.1% 47.1% 39.8% 60.2% 43.0%
EmployAbility Donegal/Sligo/Leitrim 45.6% 37.8% 43.8% 24.0% 46.5%
EmployAbility Waterford 30.5% 29.6% 39.4% 52.6% 40.8%
EmployAbility South Tipperary 40.0% 51.3% 42.1% 23.0% 36.8%
EmployAbility Kilkenny/Carlow 28.3% 30.6% 28.5% 40.6% 33.3%
EmployAbility Wexford 35.9% 17.1% 28.6% 40.7% 31.2%
EmployAbility Wicklow 23.9% 27.6% 28.3% 66.4% 27.8%
EmployAbility Cork 28.2% 30.7% 37.4% 44.2% 41.3%
EmployAbility West Cork 65.4% 53.7% 53.0% 45.9% 44.6%
EmployAbility Kerry 29.7% 39.7% 36.0% 50.0% 44.0%
EmployAbility Galway 33.0% 21.6% 32.8% 42.0% 36.8%
EmployAbility Mayo 32.8% 25.9% 24.8% 45.9% 44.2%
Total 35.1% 35.5% 36.6% 46.3% 41.9%
Number of companies achieving over 50%
2 3 2 8 3
Source: Indecon analysis of EmployAbility data * Figures relate to position as at end of December in each year.
The absolute numbers of active clients in employment underlying the above percentages are shown in the table overleaf.
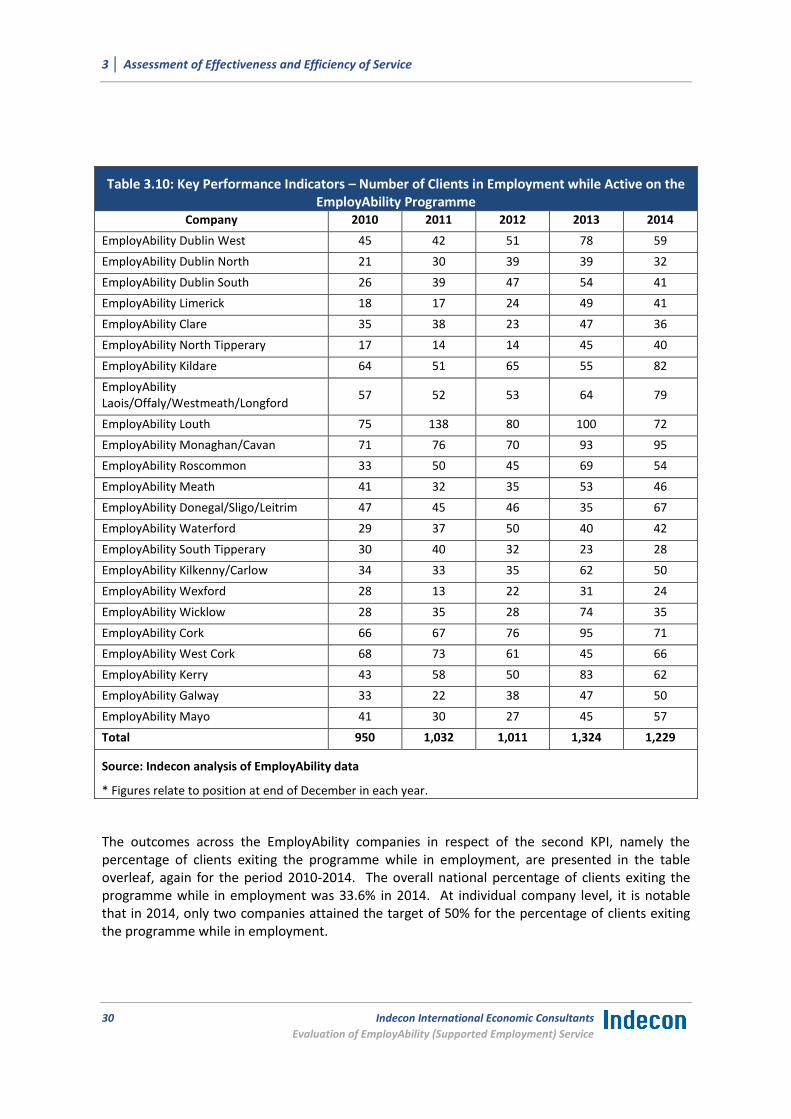
3 │ Assessment of Effectiveness and Efficiency of Service
30 Indecon International Economic Consultants
Evaluation of EmployAbility (Supported Employment) Service
Table 3.10: Key Performance Indicators – Number of Clients in Employment while Active on the EmployAbility Programme
Company 2010 2011 2012 2013 2014
EmployAbility Dublin West 45 42 51 78 59
EmployAbility Dublin North 21 30 39 39 32
EmployAbility Dublin South 26 39 47 54 41
EmployAbility Limerick 18 17 24 49 41
EmployAbility Clare 35 38 23 47 36
EmployAbility North Tipperary 17 14 14 45 40
EmployAbility Kildare 64 51 65 55 82
EmployAbility Laois/Offaly/Westmeath/Longford
57 52 53 64 79
EmployAbility Louth 75 138 80 100 72
EmployAbility Monaghan/Cavan 71 76 70 93 95
EmployAbility Roscommon 33 50 45 69 54
EmployAbility Meath 41 32 35 53 46
EmployAbility Donegal/Sligo/Leitrim 47 45 46 35 67
EmployAbility Waterford 29 37 50 40 42
EmployAbility South Tipperary 30 40 32 23 28
EmployAbility Kilkenny/Carlow 34 33 35 62 50
EmployAbility Wexford 28 13 22 31 24
EmployAbility Wicklow 28 35 28 74 35
EmployAbility Cork 66 67 76 95 71
EmployAbility West Cork 68 73 61 45 66
EmployAbility Kerry 43 58 50 83 62
EmployAbility Galway 33 22 38 47 50
EmployAbility Mayo 41 30 27 45 57
Total 950 1,032 1,011 1,324 1,229
Source: Indecon analysis of EmployAbility data
* Figures relate to position at end of December in each year.
The outcomes across the EmployAbility companies in respect of the second KPI, namely the percentage of clients exiting the programme while in employment, are presented in the table overleaf, again for the period 2010-2014. The overall national percentage of clients exiting the programme while in employment was 33.6% in 2014. At individual company level, it is notable that in 2014, only two companies attained the target of 50% for the percentage of clients exiting the programme while in employment.

3 │ Assessment of Effectiveness and Efficiency of Service
Indecon International Economic Consultants
Evaluation of EmployAbility (Supported Employment) Service
31
Table 3.11: Key Performance Indicators - % of Clients Exiting Programme while in Employment – Company Breakdown
Company 2010 2011 2012 2013 2014
EmployAbility Dublin West 9.9% 29.0% 28.1% 32.1% 46.8%
EmployAbility Dublin North 7.7% 9.6% 16.9% 20.7% 14.8%
EmployAbility Dublin South 10.7% 6.8% 24.2% 21.4% 30.7%
EmployAbility Limerick 3.9% 11.7% N/a 13.9% 22.6%
EmployAbility Clare 8.7% 12.4% 23.3% 12.3% 26.4%
EmployAbility North Tipperary N/a 40.7% 68.2% 23.8% 53.4%
EmployAbility Kildare 68.2% 14.6% 73.7% 33.8% 45.0%
EmployAbility Laois/Offaly/Westmeath/Longford
19.1% 22.3% 26.3% 35.7% 27.0%
EmployAbility Louth 21.1% 18.3% 36.4% 33.3% 54.1%
EmployAbility Monaghan/Cavan 27.4% 8.1% 25.0% 69.4% 46.9%
EmployAbility Roscommon 18.2% 12.5% 54.2% 58.7% 43.9%
EmployAbility Meath 20.0% 45.3% 42.6% 48.6% 32.4%
EmployAbility Donegal/Sligo/Leitrim
45.5% 35.6% 23.8% 26.7% 24.2%
EmployAbility Waterford 16.9% 16.5% 31.4% 22.5% 33.3%
EmployAbility South Tipperary 40.7% 32.6% 34.0% 40.5% 34.8%
EmployAbility Kilkenny/Carlow 21.9% 10.7% 26.9% 20.9% 22.0%
EmployAbility Wexford 11.3% 14.9% 15.4% 14.3% 14.8%
EmployAbility Wicklow 29.4% 16.4% 24.9% 29.6% 34.9%
EmployAbility Cork 20.3% 25.2% 21.3% 24.2% 28.7%
EmployAbility West Cork 18.6% 30.0% 91.9% 42.7% 34.7%
EmployAbility Kerry 19.0% 15.6% 25.3% 22.3% 37.6%
EmployAbility Galway 3.7% 15.3% 29.3% 24.5% 27.8%
EmployAbility Mayo 16.7% 8.3% 83.3% 22.7% 19.7%
Total 18.6% 18.5% 29.2% 28.0% 33.6%
Source: Indecon analysis of EmployAbility data
* Figures relate to position as at end of December in each year.
Significantly, while all employment outcomes are based on paid employment of at least eight hours per week in the open labour market, employment may be part-time or full-time employment, and temporary as well as permanent.

3 │ Assessment of Effectiveness and Efficiency of Service
32 Indecon International Economic Consultants
Evaluation of EmployAbility (Supported Employment) Service
Sustainability of Employment Outcomes
It is important also to consider the sustainability of employment outcomes achieved by the service. In this regard, data is gathered by EmployAbility companies on individuals who exited the service in employment and remained at work after six months without support from the service. The table below indicates the national position in 2014 and in 2014 by reference to the number of former clients who were in employment six months following exit without support from the service as a percentage of the total number of exits to employment and as a percentage of the overall number of exits from the programme in each period. During 2014, across the EmployAbility companies, a total of 742 former programme clients were in employment without support from the service after six months following exit. This represented 83.3% of total exits to employment but only 28% of total exits (or 25% of total active clients). There has been an increase since 2010 in both ratios, suggesting improved employment retention outcomes, although a target was not set for this metric. The data suggests that while a high proportion of employment outcomes achieved were sustained without support for at least six months, only a low proportion of overall clients found sustained employment without support. This suggests that while the service has positive benefits for clients, the net impacts in terms of sustained employment outcomes after controlling for deadweight are likely to be weaker.
Table 3.12: Sustainability of Employment Outcomes – Number of Persons in Employment 6 Months after Exit
Year Total Exits Total Exits to Employment
Number in Employment 6 Months after Exit without support from EmployAbility
Service
In employment 6 months after
exit without support from Service as % Total Exits to Employment
In employment 6 months after
exit without support from Service as % Total Exits
2013 2,449 686 520 75.8% 21.2%
2014 2,651 891 742 83.3% 28.0%
Source: Indecon analysis of EmployAbility data
Of note is that data was not available in relation to the extent to which jobs were sustained for 12 months or more, which would be a standard measure of employment sustainability applied in a labour market activation context.

3 │ Assessment of Effectiveness and Efficiency of Service
Indecon International Economic Consultants
Evaluation of EmployAbility (Supported Employment) Service
33
Other Exit Destinations
It is also instructive to consider the nature of exits other than to employment. The table below outlines these outcomes, including exits to further training and education, an internship, and a work placement under the CE/TÚS24 programme, in both 2013 and 2014. The remaining exits were accounted for through instances where clients fell into ill health, were relocated, refused a job offer, did not engage with the service, or were deceased.
Table 3.13: Breakdown of Exits from EmployAbility by Destination/Reason
2013 - No. 2013 - % of
Exits 2014 - No. 2014 - % of
Exits
Total Exits 2,449 100% 2,651 100%
Total Exits into Employment 686 28.0% 891 33.6%
CE/TUS 78 3.2% 92 3.5%
Internship 31 1.3% 51 1.9%
Further Training Education 346 14.1% 347 13.1%
Return to Welfare 314 12.8% 291 11.0%
Job Offer Refused by Participant 36 1.5% 61 2.3%
Ill Health 215 8.8% 258 9.7%
Not Engaging 226 9.2% 277 10.4%
Relocation 49 2.0% 74 2.8%
Service Unsuitable 190 7.8% 216 8.1%
Deceased 9 0.4% 20 0.8%
Reason/Destination of Exit not recorded/available 269 11.0% 73 2.8%
Source: Indecon analysis of EmployAbility data
3.3.4 Counterfactuals and Control Groups
As part of any labour market activation measure evaluation, it is important to consider whether any benefits would have occurred without the intervention; in other words, what would have been the counterfactual. Ideally, this could be measured by a control group of matched individuals who have similar characteristics to those who participated on the programme but who did not obtain any benefits from the programme. This is an important issue, as the benefits of the programme could be overstated.25
24 CE refers to Community Employment. TÚS is a community work placement programme. 25 For example, in a previous Indecon analysis of the JobBridge Internship Programme, we estimated that 64.8% of labour market out-
comes, when measured against an estimated counterfactual control group, would have occurred in any case and so much of the employment outcomes were wiped out. Indeed it is possible that participation on a programme, by removing the opportunity to take up employment during the programme, could have negative employment outcomes.
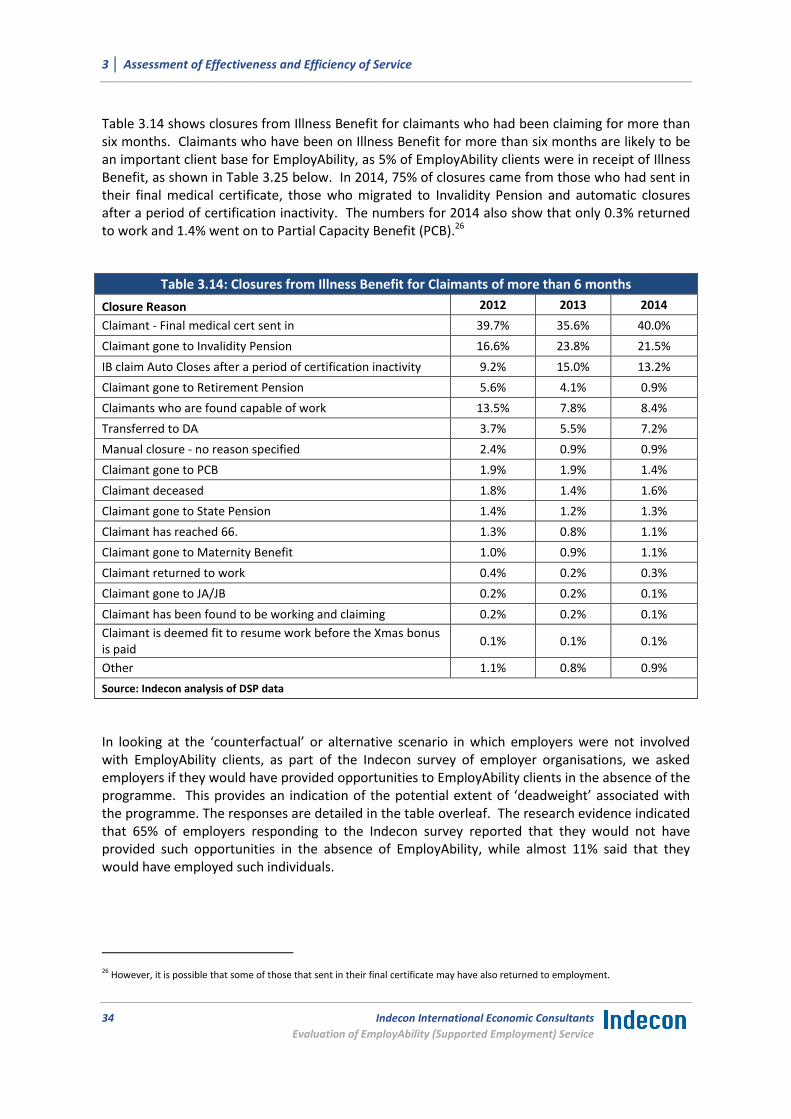
3 │ Assessment of Effectiveness and Efficiency of Service
34 Indecon International Economic Consultants
Evaluation of EmployAbility (Supported Employment) Service
Table 3.14 shows closures from Illness Benefit for claimants who had been claiming for more than six months. Claimants who have been on Illness Benefit for more than six months are likely to be an important client base for EmployAbility, as 5% of EmployAbility clients were in receipt of Illness Benefit, as shown in Table 3.25 below. In 2014, 75% of closures came from those who had sent in their final medical certificate, those who migrated to Invalidity Pension and automatic closures after a period of certification inactivity. The numbers for 2014 also show that only 0.3% returned to work and 1.4% went on to Partial Capacity Benefit (PCB).26
Table 3.14: Closures from Illness Benefit for Claimants of more than 6 months
Closure Reason 2012 2013 2014
Claimant - Final medical cert sent in 39.7% 35.6% 40.0%
Claimant gone to Invalidity Pension 16.6% 23.8% 21.5%
IB claim Auto Closes after a period of certification inactivity 9.2% 15.0% 13.2%
Claimant gone to Retirement Pension 5.6% 4.1% 0.9%
Claimants who are found capable of work 13.5% 7.8% 8.4%
Transferred to DA 3.7% 5.5% 7.2%
Manual closure - no reason specified 2.4% 0.9% 0.9%
Claimant gone to PCB 1.9% 1.9% 1.4%
Claimant deceased 1.8% 1.4% 1.6%
Claimant gone to State Pension 1.4% 1.2% 1.3%
Claimant has reached 66. 1.3% 0.8% 1.1%
Claimant gone to Maternity Benefit 1.0% 0.9% 1.1%
Claimant returned to work 0.4% 0.2% 0.3%
Claimant gone to JA/JB 0.2% 0.2% 0.1%
Claimant has been found to be working and claiming 0.2% 0.2% 0.1%
Claimant is deemed fit to resume work before the Xmas bonus is paid
0.1% 0.1% 0.1%
Other 1.1% 0.8% 0.9%
Source: Indecon analysis of DSP data
In looking at the ‘counterfactual’ or alternative scenario in which employers were not involved with EmployAbility clients, as part of the Indecon survey of employer organisations, we asked employers if they would have provided opportunities to EmployAbility clients in the absence of the programme. This provides an indication of the potential extent of ‘deadweight’ associated with the programme. The responses are detailed in the table overleaf. The research evidence indicated that 65% of employers responding to the Indecon survey reported that they would not have provided such opportunities in the absence of EmployAbility, while almost 11% said that they would have employed such individuals.
26 However, it is possible that some of those that sent in their final certificate may have also returned to employment.
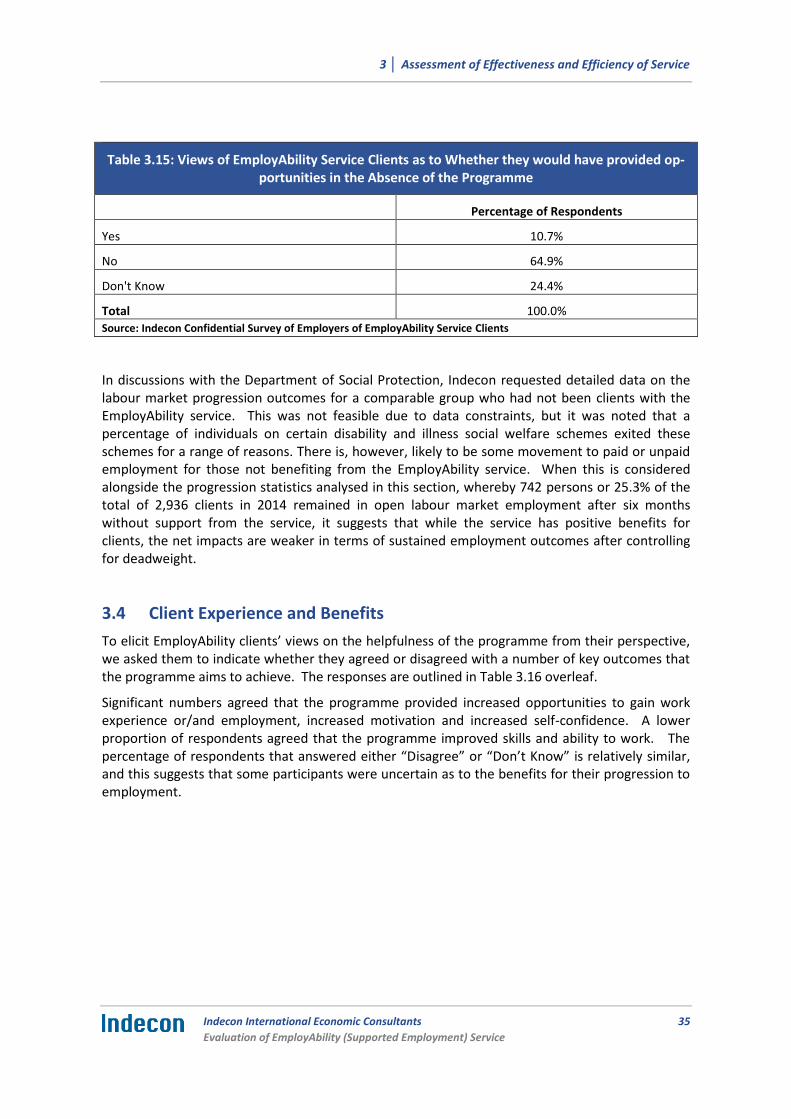
3 │ Assessment of Effectiveness and Efficiency of Service
Indecon International Economic Consultants
Evaluation of EmployAbility (Supported Employment) Service
35
Table 3.15: Views of EmployAbility Service Clients as to Whether they would have provided op-portunities in the Absence of the Programme
Percentage of Respondents
Yes 10.7%
No 64.9%
Don't Know 24.4%
Total 100.0%
Source: Indecon Confidential Survey of Employers of EmployAbility Service Clients
In discussions with the Department of Social Protection, Indecon requested detailed data on the labour market progression outcomes for a comparable group who had not been clients with the EmployAbility service. This was not feasible due to data constraints, but it was noted that a percentage of individuals on certain disability and illness social welfare schemes exited these schemes for a range of reasons. There is, however, likely to be some movement to paid or unpaid employment for those not benefiting from the EmployAbility service. When this is considered alongside the progression statistics analysed in this section, whereby 742 persons or 25.3% of the total of 2,936 clients in 2014 remained in open labour market employment after six months without support from the service, it suggests that while the service has positive benefits for clients, the net impacts are weaker in terms of sustained employment outcomes after controlling for deadweight.
3.4 Client Experience and Benefits
To elicit EmployAbility clients’ views on the helpfulness of the programme from their perspective, we asked them to indicate whether they agreed or disagreed with a number of key outcomes that the programme aims to achieve. The responses are outlined in Table 3.16 overleaf.
Significant numbers agreed that the programme provided increased opportunities to gain work experience or/and employment, increased motivation and increased self-confidence. A lower proportion of respondents agreed that the programme improved skills and ability to work. The percentage of respondents that answered either “Disagree” or “Don’t Know” is relatively similar, and this suggests that some participants were uncertain as to the benefits for their progression to employment.
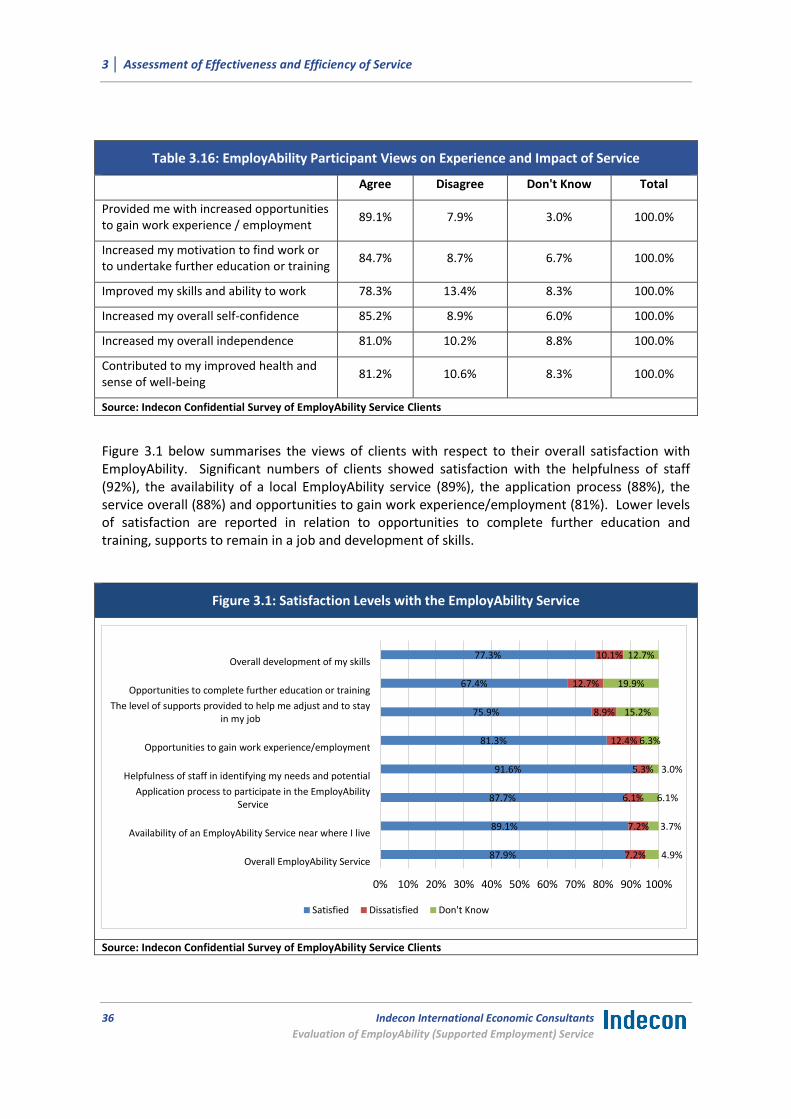
3 │ Assessment of Effectiveness and Efficiency of Service
36 Indecon International Economic Consultants
Evaluation of EmployAbility (Supported Employment) Service
Table 3.16: EmployAbility Participant Views on Experience and Impact of Service
Agree Disagree Don't Know Total
Provided me with increased opportunities to gain work experience / employment
89.1% 7.9% 3.0% 100.0%
Increased my motivation to find work or to undertake further education or training
84.7% 8.7% 6.7% 100.0%
Improved my skills and ability to work 78.3% 13.4% 8.3% 100.0%
Increased my overall self-confidence 85.2% 8.9% 6.0% 100.0%
Increased my overall independence 81.0% 10.2% 8.8% 100.0%
Contributed to my improved health and sense of well-being
81.2% 10.6% 8.3% 100.0%
Source: Indecon Confidential Survey of EmployAbility Service Clients
Figure 3.1 below summarises the views of clients with respect to their overall satisfaction with EmployAbility. Significant numbers of clients showed satisfaction with the helpfulness of staff (92%), the availability of a local EmployAbility service (89%), the application process (88%), the service overall (88%) and opportunities to gain work experience/employment (81%). Lower levels of satisfaction are reported in relation to opportunities to complete further education and training, supports to remain in a job and development of skills.
Figure 3.1: Satisfaction Levels with the EmployAbility Service
Source: Indecon Confidential Survey of EmployAbility Service Clients
87.9%
89.1%
87.7%
91.6%
81.3%
75.9%
67.4%
77.3%
7.2%
7.2%
6.1%
5.3%
12.4%
8.9%
12.7%
10.1%
4.9%
3.7%
6.1%
3.0%
6.3%
15.2%
19.9%
12.7%
0% 10% 20% 30% 40% 50% 60% 70% 80% 90% 100%
Overall EmployAbility Service
Availability of an EmployAbility Service near where I live
Application process to participate in the EmployAbilityService
Helpfulness of staff in identifying my needs and potential
Opportunities to gain work experience/employment
The level of supports provided to help me adjust and to stayin my job
Opportunities to complete further education or training
Overall development of my skills
Satisfied Dissatisfied Don't Know
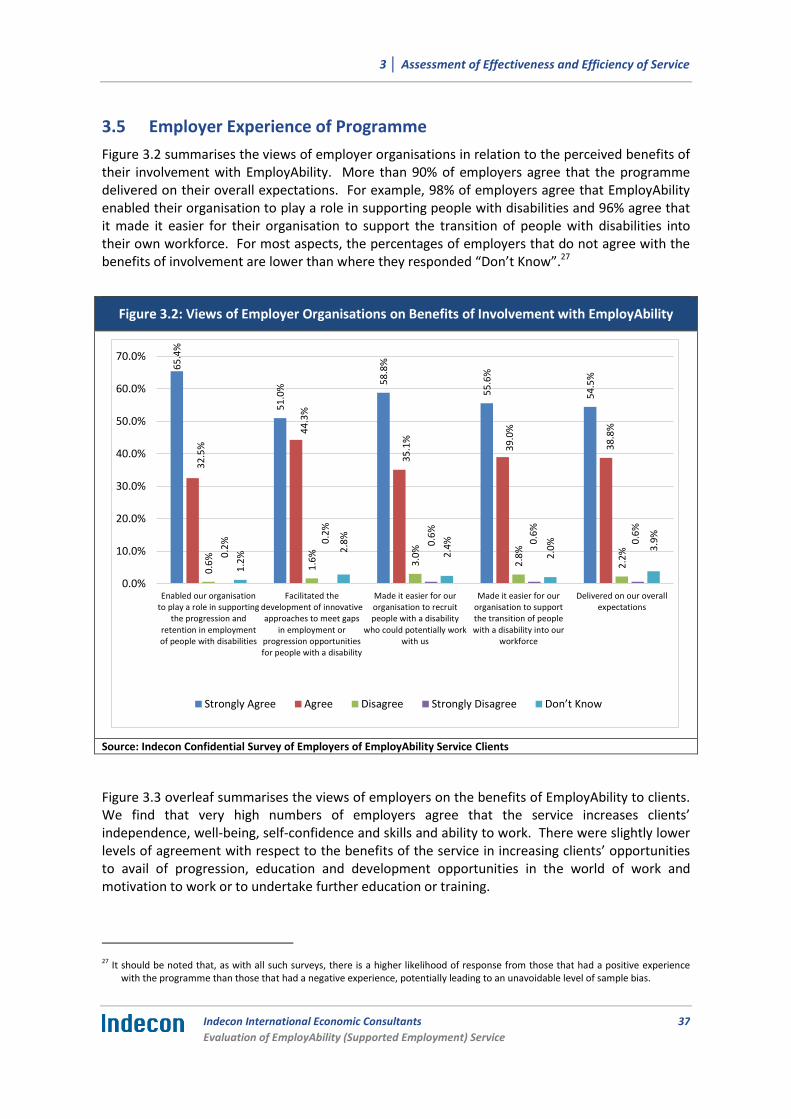
3 │ Assessment of Effectiveness and Efficiency of Service
Indecon International Economic Consultants
Evaluation of EmployAbility (Supported Employment) Service
37
3.5 Employer Experience of Programme
Figure 3.2 summarises the views of employer organisations in relation to the perceived benefits of their involvement with EmployAbility. More than 90% of employers agree that the programme delivered on their overall expectations. For example, 98% of employers agree that EmployAbility enabled their organisation to play a role in supporting people with disabilities and 96% agree that it made it easier for their organisation to support the transition of people with disabilities into their own workforce. For most aspects, the percentages of employers that do not agree with the benefits of involvement are lower than where they responded “Don’t Know”.27
Figure 3.2: Views of Employer Organisations on Benefits of Involvement with EmployAbility
Source: Indecon Confidential Survey of Employers of EmployAbility Service Clients
Figure 3.3 overleaf summarises the views of employers on the benefits of EmployAbility to clients. We find that very high numbers of employers agree that the service increases clients’ independence, well-being, self-confidence and skills and ability to work. There were slightly lower levels of agreement with respect to the benefits of the service in increasing clients’ opportunities to avail of progression, education and development opportunities in the world of work and motivation to work or to undertake further education or training.
27 It should be noted that, as with all such surveys, there is a higher likelihood of response from those that had a positive experience
with the programme than those that had a negative experience, potentially leading to an unavoidable level of sample bias.
65
.4%
51
.0%
58
.8%
55
.6%
54
.5%
32
.5%
44
.3%
35
.1%
39
.0%
38
.8%
0.6
%
1.6
%
3.0
%
2.8
%
2.2
%
0.2
%
0.2
%
0.6
%
0.6
%
0.6
%
1.2
% 2.8
%
2.4
%
2.0
%
3.9
%
0.0%
10.0%
20.0%
30.0%
40.0%
50.0%
60.0%
70.0%
Enabled our organisationto play a role in supporting
the progression andretention in employmentof people with disabilities
Facilitated thedevelopment of innovativeapproaches to meet gaps
in employment orprogression opportunitiesfor people with a disability
Made it easier for ourorganisation to recruitpeople with a disability
who could potentially workwith us
Made it easier for ourorganisation to supportthe transition of peoplewith a disability into our
workforce
Delivered on our overallexpectations
Strongly Agree Agree Disagree Strongly Disagree Don’t Know

3 │ Assessment of Effectiveness and Efficiency of Service
38 Indecon International Economic Consultants
Evaluation of EmployAbility (Supported Employment) Service
Figure 3.3: Views on Benefits of EmployAbility to Clients
Source: Indecon Confidential Survey of Employers of EmployAbility Service Clients
Employers were also asked to give their views on the success of EmployAbility in meeting its objectives, the responses to which are summarised in the table overleaf. The service was seen to be successful in facilitating the integration of people with disabilities into the labour market and in providing supports to facilitate this integration. Some employers viewed the programme as neither successful nor unsuccessful (or responded “Don’t Know”) in meeting the labour requirements of employers and in supporting progression that leads to independence and career progression.
60.6%
53.4%
55.9%
53.4%
48.3%
44.8%
35.8%
41.9%
38.4%
38.3%
38.7%
41.0%
0.2%
1.4%
0.8%
0.8%
2.2%
2.4%
3.4%
3.2%
4.7%
7.5%
10.5%
11.7%
Increased participants’ overall self-confidence
Improved participants’ skills and ability to work
Increased participants’ overall independence
Contributed to improving participants’ health and sense of well-being
Increased participants’ motivation to work or to undertake further education or training
Increased participants’ opportunities to avail of progression, education and development opportunities within the world of work
0.0% 10.0% 20.0% 30.0% 40.0% 50.0% 60.0% 70.0%
Don’t Know Strongly Disagree Disagree Agree Strongly Agree
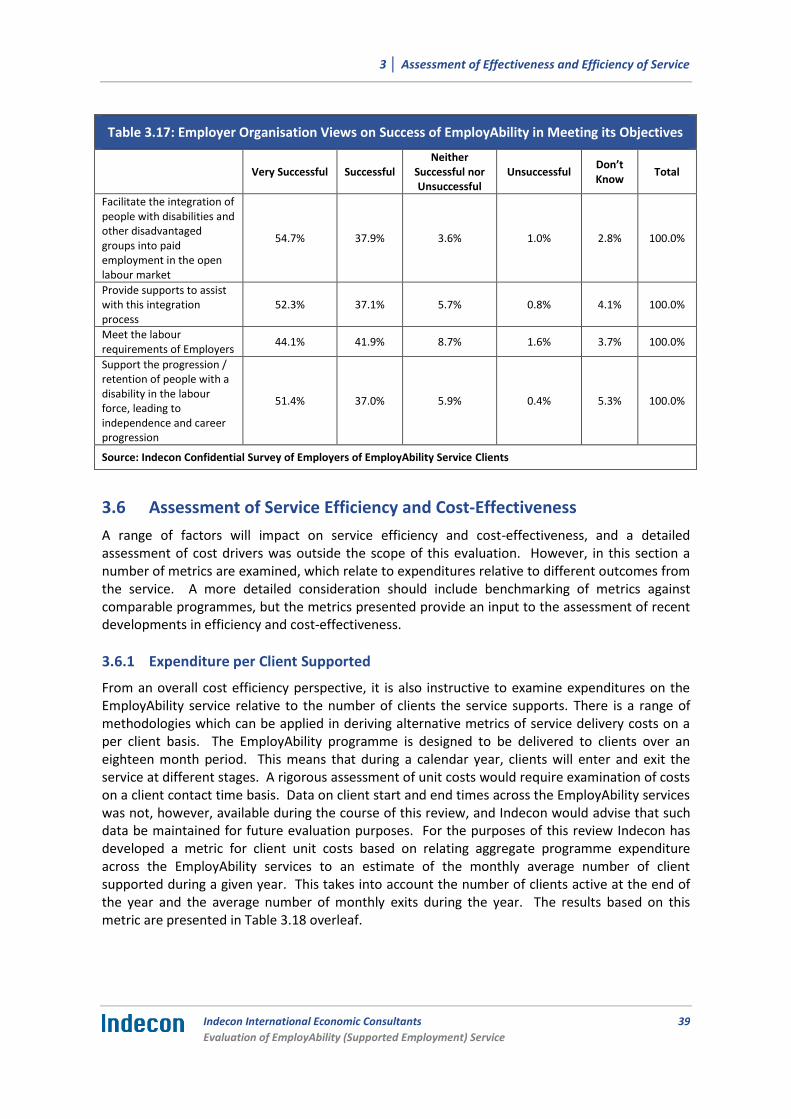
3 │ Assessment of Effectiveness and Efficiency of Service
Indecon International Economic Consultants
Evaluation of EmployAbility (Supported Employment) Service
39
Table 3.17: Employer Organisation Views on Success of EmployAbility in Meeting its Objectives
Very Successful Successful
Neither Successful nor Unsuccessful
Unsuccessful Don’t Know
Total
Facilitate the integration of people with disabilities and other disadvantaged groups into paid employment in the open labour market
54.7% 37.9% 3.6% 1.0% 2.8% 100.0%
Provide supports to assist with this integration process
52.3% 37.1% 5.7% 0.8% 4.1% 100.0%
Meet the labour requirements of Employers
44.1% 41.9% 8.7% 1.6% 3.7% 100.0%
Support the progression / retention of people with a disability in the labour force, leading to independence and career progression
51.4% 37.0% 5.9% 0.4% 5.3% 100.0%
Source: Indecon Confidential Survey of Employers of EmployAbility Service Clients
3.6 Assessment of Service Efficiency and Cost-Effectiveness
A range of factors will impact on service efficiency and cost-effectiveness, and a detailed assessment of cost drivers was outside the scope of this evaluation. However, in this section a number of metrics are examined, which relate to expenditures relative to different outcomes from the service. A more detailed consideration should include benchmarking of metrics against comparable programmes, but the metrics presented provide an input to the assessment of recent developments in efficiency and cost-effectiveness.
3.6.1 Expenditure per Client Supported
From an overall cost efficiency perspective, it is also instructive to examine expenditures on the EmployAbility service relative to the number of clients the service supports. There is a range of methodologies which can be applied in deriving alternative metrics of service delivery costs on a per client basis. The EmployAbility programme is designed to be delivered to clients over an eighteen month period. This means that during a calendar year, clients will enter and exit the service at different stages. A rigorous assessment of unit costs would require examination of costs on a client contact time basis. Data on client start and end times across the EmployAbility services was not, however, available during the course of this review, and Indecon would advise that such data be maintained for future evaluation purposes. For the purposes of this review Indecon has developed a metric for client unit costs based on relating aggregate programme expenditure across the EmployAbility services to an estimate of the monthly average number of client supported during a given year. This takes into account the number of clients active at the end of the year and the average number of monthly exits during the year. The results based on this metric are presented in Table 3.18 overleaf.
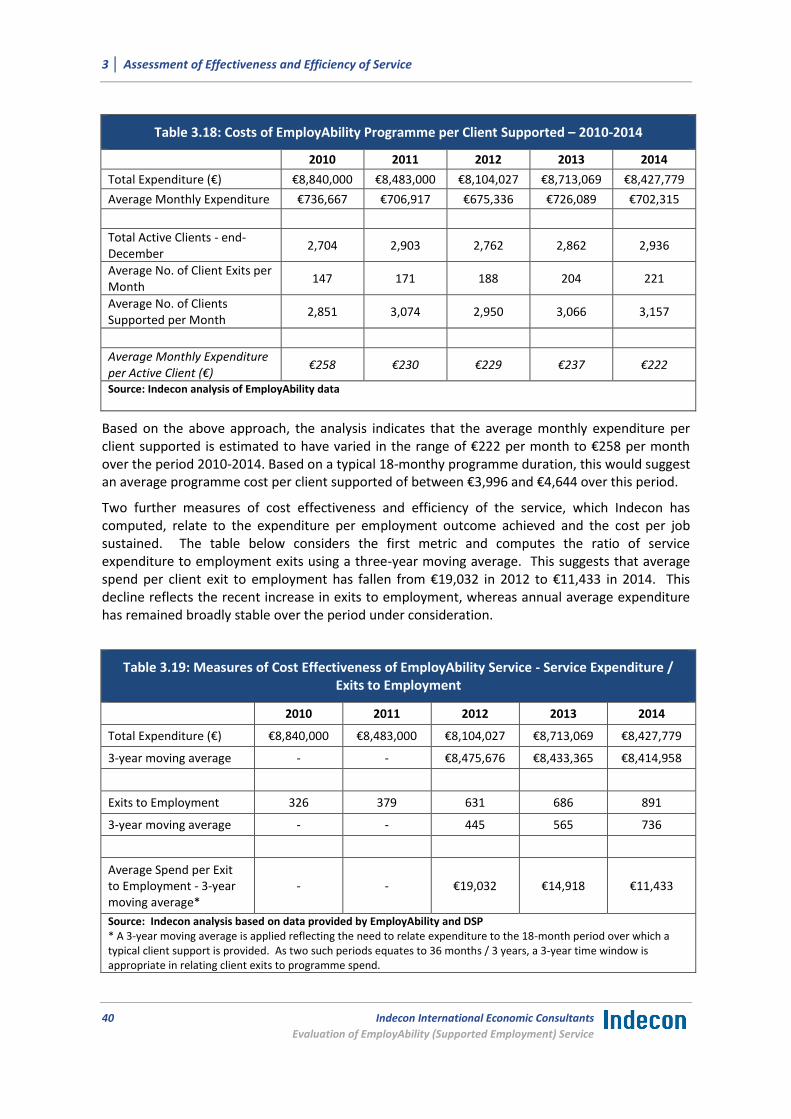
3 │ Assessment of Effectiveness and Efficiency of Service
40 Indecon International Economic Consultants
Evaluation of EmployAbility (Supported Employment) Service
Table 3.18: Costs of EmployAbility Programme per Client Supported – 2010-2014
2010 2011 2012 2013 2014
Total Expenditure (€) €8,840,000 €8,483,000 €8,104,027 €8,713,069 €8,427,779
Average Monthly Expenditure €736,667 €706,917 €675,336 €726,089 €702,315
Total Active Clients - end-December
2,704 2,903 2,762 2,862 2,936
Average No. of Client Exits per Month
147 171 188 204 221
Average No. of Clients Supported per Month
2,851 3,074 2,950 3,066 3,157
Average Monthly Expenditure per Active Client (€)
€258 €230 €229 €237 €222
Source: Indecon analysis of EmployAbility data
Based on the above approach, the analysis indicates that the average monthly expenditure per client supported is estimated to have varied in the range of €222 per month to €258 per month over the period 2010-2014. Based on a typical 18-monthy programme duration, this would suggest an average programme cost per client supported of between €3,996 and €4,644 over this period.
Two further measures of cost effectiveness and efficiency of the service, which Indecon has computed, relate to the expenditure per employment outcome achieved and the cost per job sustained. The table below considers the first metric and computes the ratio of service expenditure to employment exits using a three-year moving average. This suggests that average spend per client exit to employment has fallen from €19,032 in 2012 to €11,433 in 2014. This decline reflects the recent increase in exits to employment, whereas annual average expenditure has remained broadly stable over the period under consideration.
Table 3.19: Measures of Cost Effectiveness of EmployAbility Service - Service Expenditure / Exits to Employment
2010 2011 2012 2013 2014
Total Expenditure (€) €8,840,000 €8,483,000 €8,104,027 €8,713,069 €8,427,779
3-year moving average - - €8,475,676 €8,433,365 €8,414,958
Exits to Employment 326 379 631 686 891
3-year moving average - - 445 565 736
Average Spend per Exit to Employment - 3-year moving average*
- - €19,032 €14,918 €11,433
Source: Indecon analysis based on data provided by EmployAbility and DSP * A 3-year moving average is applied reflecting the need to relate expenditure to the 18-month period over which a typical client support is provided. As two such periods equates to 36 months / 3 years, a 3-year time window is appropriate in relating client exits to programme spend.

3 │ Assessment of Effectiveness and Efficiency of Service
Indecon International Economic Consultants
Evaluation of EmployAbility (Supported Employment) Service
41
The table below considers the level of service expenditure relative to jobs sustained, based on the data available for clients in employment six months following exit. In this case, data was not available to enable examination of the six-month positions over the full period from 2010-2014, so an average of the outcomes for 2013 and 2014 was computed. This suggests an average level of expenditure relative to employment sustained of €13,582 over 2013-2014. Further analysis would, however, be required to enable assessment of a trend in this metric, and to compare outcomes to other, comparable programmes. Overall, however, the analysis suggests that programme expenditure is high relative to the quantum and sustainability of employment outcomes achieved.
Table 3.20: Measures of Cost Effectiveness of EmployAbility Service - Cost per Job Sustained
2013 2014 2013-2014 Average
Total Expenditure (€) €8,713,069 €8,427,779 €8,570,424
Number in Employment 6 Months after Exit without support from EmployAbility Service 520 742 631
Cost per Job Sustained €13,582
Source: Indecon analysis based on data provided by EmployAbility and DSP
3.6.2 Job Coach Ratio
The EmployAbility service is required to operate on the basis of a ratio of 25 clients to one job coach. Table 3.21 presents the ratio of full-time equivalent (FTE) job coaches to active clients, i.e. the number of clients to a job coach at a national level across the service companies. Over the period 2010-2014, the service has achieved an average ratio of one job coach per 26 clients. The service Operating Standards (2011) and the contractual agreements between the Department of Social Protection and individual EmployAbility companies require each company to achieve a client to job coach ratio of at least 25:1.
Table 3.21: Key Performance Indicators – Job Coach Ratio
Year Total Active Clients Number of Job Coaches (FTE) Job Coach to Client ratio
2010 2,704 106 1:26
2011 2,903 107 1:27
2012 2,762 106 1:26
2013 2,862 109 1:26
2014 2,936 112 1:26
Source: Indecon analysis of EmployAbility data Note: Data for 2015 relates to January to May

3 │ Assessment of Effectiveness and Efficiency of Service
42 Indecon International Economic Consultants
Evaluation of EmployAbility (Supported Employment) Service
The outcomes in relation to the job coach ratio across the 23 EmployAbility companies are shown in the table below. There has been significant variation at individual company level, with the ratio recorded in 2014 varying in the range of 22.3:1 to 35.2:1. Fifteen companies exceeded the ratio required, while eight fell slightly below the target level. Overall, the job coach ratio figures suggest that the service overall is working to capacity levels and reflects the recent growth in demand. The challenge, however, concerns the effectiveness of the service in translating this demand into positive employment progression outcomes.
Table 3.22: Key Performance Indicators – Job Coach Ratio (Clients per Job Coach) – Company Breakdown – 2014
Company 2014
X : 1
EmployAbility Dublin West 24.0
EmployAbility Dublin North 25.0
EmployAbility Dublin South 25.6
EmployAbility Limerick 22.3
EmployAbility Clare 25.6
EmployAbility North Tipperary 25.3
EmployAbility Kildare 35.2
EmployAbility Laois/Offaly/Westmeath/Longford 25.0
EmployAbility Louth 32.0
EmployAbility Monaghan/Cavan 34.4
EmployAbility Roscommon 25.3
EmployAbility Meath 26.8
EmployAbility Donegal/Sligo/Leitrim 25.7
EmployAbility Waterford 25.8
EmployAbility South Tipperary 25.3
EmployAbility Kilkenny/Carlow 25.0
EmployAbility Wexford 25.7
EmployAbility Wicklow 24.6
EmployAbility Cork 23.2
EmployAbility West Cork 24.7
EmployAbility Kerry 25.6
EmployAbility Galway 27.2
EmployAbility Mayo 25.8
Total 26.2
Source: Indecon analysis of EmployAbility data * Figures relate to position as at end of December in each year.
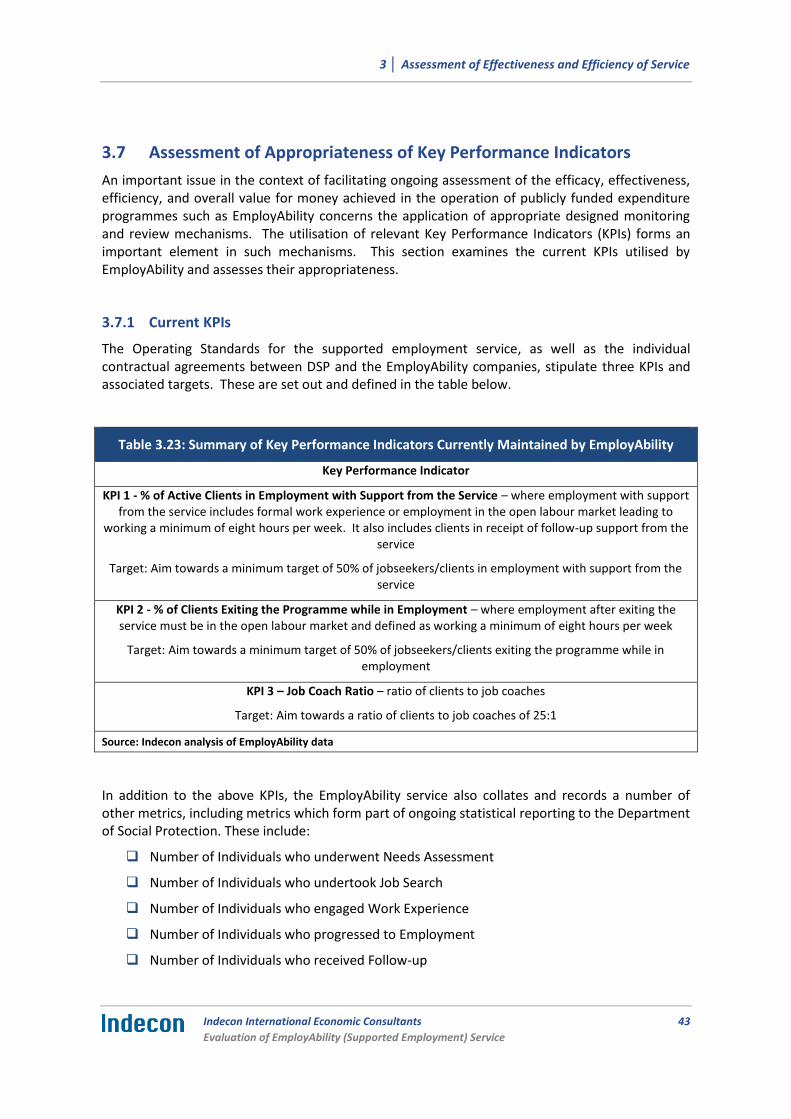
3 │ Assessment of Effectiveness and Efficiency of Service
Indecon International Economic Consultants
Evaluation of EmployAbility (Supported Employment) Service
43
3.7 Assessment of Appropriateness of Key Performance Indicators
An important issue in the context of facilitating ongoing assessment of the efficacy, effectiveness, efficiency, and overall value for money achieved in the operation of publicly funded expenditure programmes such as EmployAbility concerns the application of appropriate designed monitoring and review mechanisms. The utilisation of relevant Key Performance Indicators (KPIs) forms an important element in such mechanisms. This section examines the current KPIs utilised by EmployAbility and assesses their appropriateness.
3.7.1 Current KPIs
The Operating Standards for the supported employment service, as well as the individual contractual agreements between DSP and the EmployAbility companies, stipulate three KPIs and associated targets. These are set out and defined in the table below.
Table 3.23: Summary of Key Performance Indicators Currently Maintained by EmployAbility
Key Performance Indicator
KPI 1 - % of Active Clients in Employment with Support from the Service – where employment with support from the service includes formal work experience or employment in the open labour market leading to
working a minimum of eight hours per week. It also includes clients in receipt of follow-up support from the service
Target: Aim towards a minimum target of 50% of jobseekers/clients in employment with support from the service
KPI 2 - % of Clients Exiting the Programme while in Employment – where employment after exiting the service must be in the open labour market and defined as working a minimum of eight hours per week
Target: Aim towards a minimum target of 50% of jobseekers/clients exiting the programme while in employment
KPI 3 – Job Coach Ratio – ratio of clients to job coaches
Target: Aim towards a ratio of clients to job coaches of 25:1
Source: Indecon analysis of EmployAbility data
In addition to the above KPIs, the EmployAbility service also collates and records a number of other metrics, including metrics which form part of ongoing statistical reporting to the Department of Social Protection. These include:
Number of Individuals who underwent Needs Assessment
Number of Individuals who undertook Job Search
Number of Individuals who engaged Work Experience
Number of Individuals who progressed to Employment
Number of Individuals who received Follow-up
3 │ Assessment of Effectiveness and Efficiency of Service
44 Indecon International Economic Consultants
Evaluation of EmployAbility (Supported Employment) Service
Number of Individuals who obtained Approved Extension
Active Total Clients
Monthly Exits
Cumulative Exits Year to Date
Monthly Jobs Retained After Exit
Cumulative Jobs Retained After Exit
Job Coach FTEs
Ratio of Job Coach to Clients
However, only the three metrics shown in Table 3.23 above have been formalised as KPIs in the Operating Standards for the service and in the contractual agreements with the companies.
3.7.2 Assessment of quality of existing KPIs
Effective programme evaluation is dependent on the application of an appropriate monitoring and evaluation system based on data and information which facilitates detailed analysis and assess-ment of programme performance. In assessing the quality of the existing KPIs, a standard interna-tional framework is to assess the extent to which metrics conform to ‘SMART’ criteria on indicator quality. KPIs are considered ‘SMART’ when they are:
Specific – the metric should be specific to the purpose of measuring the objectives/goals it is designed to measure, and should be clearly defined;
Measurable – the metric should be measureable on a quantitative basis;
Achievable – the activities or outcomes being measured, and associated targets, must be realistic and achievable;
Relevant to the programme – the metric must be aligned with the objective and goals of the programme; and,
Time bound – the metric should have a clearly defined timeframe for achievement.
An assessment of the extent to which the existing KPIs provided by the EmployAbility companies meet ‘SMART’ criteria for well-designed indicators is presented in the table overleaf.

3 │ Assessment of Effectiveness and Efficiency of Service
Indecon International Economic Consultants
Evaluation of EmployAbility (Supported Employment) Service
45
Table 3.24: EmployAbility Key Performance Indicators – Summary Assessment of Indicator Quality
Indicator Data Source Target Specified and Realistic?
Indicator Quality Assessment using ‘SMART’ Features
Specific Measurable Achievable Relevant Timely Bound
% of Active Clients in Employment with Support from the Service
EmployAbility company records
Basis for 50% target not clear and arbitrary
?
Timeframe for
achievement of target not
clear
% of Clients Exiting the Programme while in Employment
EmployAbility company records
As above ? As above
Job Coach Ratio EmployAbility company records
As above As above
Source: Indecon
KPI definition and interpretation
Overall, the existing KPIs would appear to be well-defined and measurable. However, Indecon would have some concerns in relation to the definition and interpretation of the employment-related KPIs.
One aspect concerns the definition of employment outcomes measured. Consistent with the eligibility requirements for access to the service, we understand that only employment which is in the open labour market and involves working a minimum of eight hours per week is included in the exit employment KPI, whereas the active client employment metric is defined to include employment with support from the service. This includes formal work experience or employment in the open labour market. However, it is not clear whether employment achieved reaches a minimum of eight hours per week. In addition, employment may be part-time or full-time employment, and temporary as well as permanent.
We would also have a concern in relation to the interpretation of the metric pertaining to the percentage of clients exiting the programme while in employment, as applied by individual companies. In particular, in collating the data on this indicator, it was found that a number of companies had been misinterpreting the definition of the indicator, whereby the following definition was applied:
% of Clients exiting the programme while in employment = Cumulative jobs retained at exit / (50% of total active clients “in employment”)
3 │ Assessment of Effectiveness and Efficiency of Service
46 Indecon International Economic Consultants
Evaluation of EmployAbility (Supported Employment) Service
We understand that the above interpretation may have arisen from earlier guidance issued by FÁS prior to when the service was transferred into the direct oversight of the Department of Social Protection. However, there is no reference in the Operating Standards or in the contractual agreements with companies that the above definition should apply, and there appears to have been confusion between the target for the indicator (50%) and the computation of the metric. The correct definition is as follows:
% of Clients exiting the programme while in employment = No. of clients in employment on exit from programme / No. of clients exiting the programme
It is important that full clarity is achieved across the companies in relation this key metric, as otherwise there is a danger of incorrectly overstating the outcomes recorded under this measure. The outcomes reported in Table 3.11 above are based on application of the correct definition above. This issue also highlights a need to update the Operating Standards for the service to ensure sufficient clarity in relation to the application of KPIs.
Indicator targets
We would also have concerns with regard to the setting of targets for each of the existing KPIs. These concerns relate to three aspects, namely: (a) the basis and realism of the targets, (b) the achievability of the metrics and associated targets, and (c) the timeframe for achieving the targets.
The targets as set – which require the companies to aim towards a minimum of 50% of jobseekers/clients in employment with support from the service, a minimum of 50% of jobseekers/clients exiting the programme while in employment, and a ratio of clients to job coaches of 25:1 – are not clear as to their basis and rationale. The levels chosen appear arbitrary and we understand that these targets were set some years ago when the service was overseen by FÁS and when the labour market context in particular was different. There is also an absence of a pre-defined timeframe for achievement of the targets, and the use of ‘aim towards’ in the definitions means that any timeframe remains vague.
It is important that the targets have clear basis and reference point, as otherwise their realism and credibility will be undermined. Targets for all KPIs should be ‘stretch’ targets, but should also be realistic and achievable within pre-defined timeframes. These targets and timeframes should be reviewed periodically to ensure they remain appropriate in the context of programme objectives and goals, and the evolving external (including labour market) context in which the service operates.
3.7.3 Coverage of indicators
In addition to the above highlighted issues with regard to the existing KPIs, a notable gap concerns the coverage of indicators. Overall, Indecon believes that the coverage of the KPIs, being confined to just three metrics pertaining to employment outcomes (two metrics) and the job coach ratio, is extremely limited and inadequate to assess service effectiveness and efficiency.
3 │ Assessment of Effectiveness and Efficiency of Service
Indecon International Economic Consultants
Evaluation of EmployAbility (Supported Employment) Service
47
There are specific weaknesses evident in relation to formalised monitoring indicators and KPIs which capture the characteristics of clients once they exit the service, including their progression status over time and their destination. As part of this assessment, Indecon requested the EmployAbility companies to furnish data on a range of dimensions, a number of which are not ordinarily monitored. These included exits to CE/TÚS jobs, internships, education, as well as outcomes in which the clients refused a job offer, fell into ill health, did not engage with the programme, relocated or found the service to be unsuitable for their needs.
Another gap which requires attention in relation to indicator coverage concerns the availability and ongoing reporting of metrics to capture the longer-term status of clients who have exited the service. Standard metrics to assess the performance of labour market activation programmes would include indicators designed to measure the extent to which participants remain in employment for 12 months or more (as opposed to the more limited six-month timeframe addressed in the existing data collated by the EmployAbility companies).
Finally, the service generates a number of positive outcomes for clients in terms of independence, well-being, self-confidence, skills and ability to work. Some of these aspects could be captured in KPIs that try to measure these outcomes. The survey research revealed that high numbers of clients found the service to be very beneficial in leading to these positive outcomes and perhaps a survey/interview technique could be applied to generate KPIs for these aspects on an ongoing basis.
3.8 Assessment of Appropriateness of Service Access Criteria
3.8.1 Existing service access/eligibility criteria
In addition to examining the outcomes for clients of EmployAbility, it is important to assess the appropriateness of the criteria for access to the service, as this will impact the numbers and types of clients supported, and the overall performance of the service in assisting its clients.
According to the Operating Standards for the Supported Employment Service, the eligibility criteria state that the service is open to people with disabilities, including those recovering from injury or illness, which are job ready and need the support of a Job Coach to get a job in the open labour market.28 The following criteria/requirements apply:
Persons must be aged between 18 and 65 years;
It is a programme requirement that participants will be working towards a minimum of 8 hours a week;
Participants may avail of the services for a maximum duration of 18 months.
Participants must be ‘job ready’ – where ‘job ready’ is defined as having the necessary, training, motivation, education and ability to progress to work and pursue work/career in the open labour market at the end of the 18-month EmployAbility programme;
Participants must have the potential to work independently, without support; and,
Participants must reside within the catchment area of the EmployAbility company.
28 Supported Employment Service Operating Standards (2011), Section 4.2.

3 │ Assessment of Effectiveness and Efficiency of Service
48 Indecon International Economic Consultants
Evaluation of EmployAbility (Supported Employment) Service
EmployAbility clients who are in receipt of Jobseeker’s Allowance can work up to and including three days per week while still claiming some benefit. It should be noted that clients on Disability Allowance can voluntarily take up rehabilitative work and earn up to €120 per week without their payment being affected; earnings of between €121 and €350 per week are assessed at 50% for means test purposes. For clients on Invalidity Pension, they are only allowed work if they go onto Partial Capacity Benefit, while clients on Illness Benefit can also go on to Partial Capacity Benefit but must be in receipt of this payment for six months before they qualify.
Disabilities can range from physical to mental health,29 including for example attention deficit disorder (ADD), attention deficit hyperactivity disorder (ADHD), blindness/sight impairment, acquired brain injury, deafness/hearing impairment, learning, medical, physical, psychiatric and speech and language disabilities.
At the end of the 18-month duration of the programme, clients must exit the service to allow new clients to engage, who may be on a waiting list.
3.8.2 Appropriateness of access criteria
In assessing the appropriateness of the criteria for access to the service, a number of aspects and issues are highlighted below in relation to each criterion, with particular scrutiny being given to the categories of DSP payments which qualify applicants for referral to the service, and the requirement to be ‘job ready’ and the suitability of potential clients.
Clarity on categories of DSP payments eligible for referral to service
One particular issue meriting consideration concerns the precise scope of individuals in receipt of DSP payments who are potentially eligible for EmployAbility services. As noted above, the service is open to people aged between 18 and 65 with disabilities, including those recovering from injury or illness, which are job ready and need the support of a Job Coach to get a job in the open labour market.30 Examination of the recent (2014) pattern of DSP referrals to the EmployAbility service indicates that the majority of referrals relate to individuals who are in receipt of Disability Allowance or other disability-related supports, including invalidity benefit or pension (see table overleaf). However, it is notable that 26% of referrals during 2014 were for individuals in receipt of Jobseeker’s Allowance. In such cases, we understand that the Department can clear an individual as being eligible for the service if they can provide a medical certificate to the effect that they have a disability. Indecon’s discussions with DSP case officers noted some concern among officials that this may be open to abuse and that the expertise or resources to adequately verify and independently assess the eligibility of individuals presenting with medical certification through this channel is lacking. In addition, while Indecon did not have access to detailed data on referral decisions, which would require further investigation, we understand that there is a low incidence of decline or non-referral in general among applicants for the service.
29 The Disability Act 2005 defines disability as: “A substantial restriction in the capacity of the person to carry on a profession, business or occupation in the Irish State or to participate in social or cultural life in the Irish State by reason of an enduring physical, sensory, mental health or intellectual impairment.” See: http://www.irishstatutebook.ie/2005/en/act/pub/0014/.
30 Supported Employment Service Operating Standards (2011), Section 4.2.

3 │ Assessment of Effectiveness and Efficiency of Service
Indecon International Economic Consultants
Evaluation of EmployAbility (Supported Employment) Service
49
The degree of clarity in relation to the precise scope and interpretation of eligibility based on DSP payments is an important issue if this leads to inappropriate referral of individuals who may not be suitable for the service. In addition, there is a risk that inappropriate referral of individuals to the service could increase the potential for ‘deadweight’, whereby there is a higher probability that observed employment outcomes are achieved in the absence of EmployAbility supports. This could be the case, for example, where an unemployed individual has a short-term disability (e.g., a workplace accident or a mental health illness), but otherwise is qualified and experienced, and has a higher probability of obtaining employment. In this respect, it is important that EmployAbility is not regarded as a last resort or default route for individuals who do not have long-term disabilities or who would otherwise have a high probability of achieving positive and sustained labour market progression outcomes in the absence of service supports.
Table 3.25: Breakdown of EmployAbility Referrals by DSP Social Welfare Payment Type - 2014 Referrals
Payment Type % of Referrals
Disability Allowance 51.0%
Jobseeker’s Allowance 26.0%
None 5.5%
Illness Benefit 5.1%
Invalidity Pension 4.4%
Job Seekers Benefit 2.8%
Other 2.7%
Disability Benefit 0.6%
Occupational Injury Benefit 0.1%
Deserted Wives Benefit 0.2%
Widows Pension 0.1%
Blind Pension 0.3%
Social Welfare Assistance 0.1%
Incapacity Supplement 0.0%
FAS Allowance 0.1%
Solas Allowance 0.2%
Non Irish Support 0.1%
State Pension 0.2%
Carers Allowance 0.1%
Total Referrals 2014 100%
Source: EmployAbility Companies Note: “None” means no DSP payment; “Non Irish Support” relates to a payment received from another country.
3 │ Assessment of Effectiveness and Efficiency of Service
50 Indecon International Economic Consultants
Evaluation of EmployAbility (Supported Employment) Service
Eight-hour week minimum requirement for employment
The Operating Standards for the supported employment service state that:
“Open Labour Market Employment must be in the open labour market and defined as working a minimum of eight hours a week. Work performed must be compensated with the same benefits and wages, as other workers in similar jobs. This includes sick leave, annual leave, bonuses, training opportunities and other benefits.”
31
While the threshold is set at a low level, the service access requirement that prospective clients are willing and able to work for a minimum of eight hours per week reflects a standard definition for ‘open labour market employment’, whereas employment below this threshold is determined to be of a rehabilitative nature. However, as the requirement can only be verified once a client progresses through the programme and takes up employment, of importance is the need to ensure that this requirement is actually met in practice. This requires ongoing verification of client progression, including client weekly working hours. In this regard, Indecon’s review of a sample of job coach activity returns from the EmployAbility companies to DSP, contained within the Department’s internal audit report completed during 2013, indicated that this reporting includes data on median working hours per week among active clients in employment. However, it was not clear whether such data is reported among individuals in employment who had exited the service.
Requirement to be able to progress to independent employment after 18 months
The 18-month programme period for the EmployAbility service is a longstanding feature of the service which formed part of the format when the supported employment service was originally managed by FÁS. We understand that the timeframe reflects the need to strike an appropriate balance between what is judged to be a minimum time period needed for job coaches to work with and progress clients on the one hand, and the need to achieve client exit to facilitate the provision of supports to new clients (who may be on a waiting list) on the other. It is possible to obtain an extension for a client beyond the 18-month period, but this requires DSP approval.32 Indecon did not have access to detailed data across all EmployAbility companies pertaining to the number of proportion of clients who have been over 18 months on the service. Reference to the Department of Social Protection’s 2013 internal audit report indicated that for two sample companies reviewed the proportion of clients who were over 18 months on the service at the end of 2012 was between 6.9% and 18%. While this relates to only two companies, it does suggest a significant variation, with some companies seeing a relatively high proportion of extensions beyond the 18-month prescribed maximum timeframe for the programme. It would be important that this aspect is continuously monitored to ensure that the prescribed timeframe is adhered to, or, if not, the reasons behind non-achievement of this requirement.
31 Supported Employment Service Operating Standards (2011). 32 Service extensions are granted if employment commenced near the end of the 18-month period or under reasonable circumstances
such as if a significant part of the 18 months was lost due to a client’s ill health.
3 │ Assessment of Effectiveness and Efficiency of Service
Indecon International Economic Consultants
Evaluation of EmployAbility (Supported Employment) Service
51
Age range of applicants
The age range of 18 to 65 essentially targets all persons with disabilities who are seeking employment. The age criterion is broadly consistent with standard definitions of the working age population and Indecon would not point out any substantive issues with this requirement.
Requirement to be ‘Job Ready’
The Operating Standards for the service define ‘job readiness’ as follows:
“A person who has the necessary training, education, motivation and ability to pursue work/career in the open labour market and, if needed, have access to transport to get to and from work. (In the context of Supported Employment, this job ready definition requires that a person with a disability must have the personal motivation to go to work.)”
33
This criterion is an important element of the overall access criteria, in that it is designed to ensure that individuals are suitable for the service in terms of their education and training, and particularly their desire and motivation to complete the programme and progress to open labour market employment.
In practice, however, the definition of ‘job ready’ is challenging to implement in an objective manner, and a prospective client’s attainment of this requirement must be assessed at referral stage. This requires careful judgment by DSP case officers working in conjunction with the service, and assessing attributes such as motivation and ability can be subjective and challenging to confirm prior to an individual commencing the programme and working with a job coach.
Many clients also exit to education, which would suggest that these clients were not job ready upon beginning the programme. Given the wide age criterion and the breadth of disabilities which may present to the service, it could be expected that significant numbers are unlikely to be job ready.
Submissions to this evaluation by various stakeholders (see Annex 3) have also suggested that the definition could be subjective and open to interpretation, as, for example, it may be interpreted differently when viewed from the perspective of the participant, the job coach, the DSP and an employer.
The evident high rates of non-completion/drop-out among clients (as shown in Table 3.8 above) and the failure to challenges apparent in achieving the KPI targets for employment outcomes together suggest that a high proportion of referrals may relate to individuals who are not job ready, and therefore that the EmployAbility service is not appropriate to address their needs.
These observations would suggest that the definition of job readiness requires reconsideration, to facilitate a more objective assessment of suitability for the service and to minimise the risk of inappropriate referral. A review of this criterion for access to the service should be informed by the research on supported employment, including those groups for which the supported employment model has been demonstrated to be most effective in meeting their needs. Importantly, a re-formulated definition of job readiness should be sufficiently robust and more effectively targeted. This should, on the one hand, cater for increased demand for supports, but also ensure that only individuals with a disability and who are motivated to take up and sustain open labour market employment, can access the supports provided by the service to enable them
33 Supported Employment Service Operating Standards, Op. Cit.
3 │ Assessment of Effectiveness and Efficiency of Service
52 Indecon International Economic Consultants
Evaluation of EmployAbility (Supported Employment) Service
to progress, where their probability of success would otherwise have been lower. The definition must ensure that there is not inappropriate referral of individuals who are not suitable or motivated, individuals who are skilled and experienced but have short-term disabilities and would otherwise have a high probability of achieving successful labour market outcomes, or individuals who require a more intensive, high-support programme. This is important in minimising potential deadweight associated with the service.
Role of INTREO service
An important recent development, which has potentially significant implications for future development of the EmployAbility service, is the expansion of the INTREO service, on a phased, basis to people with disabilities in line with the commitments contained in the Comprehensive Employment Strategy for People with Disabilities.34 As a result, a person with a disability who wishes to avail of the service can call into an INTREO centre, on a voluntary basis, and be offered the full range of activation supports. Furthermore, Indecon understands that relevant officers in INTREO centres will be receiving training to enable them to interact effectively with people with disabilities. In time, appropriately trained INTREO case officers would undertake prior assessment of client suitability and build a programme to map a client’s transition to open market employment through participation in EmployAbility, or alternatively to other supports if EmployAbility is not appropriate. This is important in the context of application of service access criteria, including the application of a re-formulated definition of ‘job readiness’, as discussed above.
The role of the INTREO service in the context of where the EmployAbility service is situated within the suite of employment supports available to people with disabilities is considered further in Section 6.
Requirements for clients to have potential to work independently
The requirement for clients to have the potential to work independently, without support, once they complete the EmployAbility programme could also be judged to suffer from a potential weakness of being subjective and challenging to assess in practice. Given the breadth of individuals and disability types encountered by the service, this requirement, while an important element of the eligibility criteria, is unlikely to be satisfied by all clients who enrol on the programme. It is likely that a level of assistance will be required post the 18-month programme period in respect of clients that need more intensive supports. Examination of the progression data supplied by EmployAbility showed that during 2014, across the EmployAbility companies, a total of 744 former programme clients were in employment without support from the service after six months following exit – equivalent to 83.3% of exits to employment and 28% of total exits from the programme. This suggests that while a high proportion of employment outcomes achieved were sustained without support for at least six months, only a low proportion of overall clients found sustained employment without support, which again highlights a potential issue with regard the referral process and the suitability of individuals for the service.
34 At the time of writing, this service was being provided in ten INTREO Centres: Finglas, Tallaght, Dun Laoghaire, Longford, Limerick,
Sligo, Waterford, Wexford, Cork and Bantry.
3 │ Assessment of Effectiveness and Efficiency of Service
Indecon International Economic Consultants
Evaluation of EmployAbility (Supported Employment) Service
53
Residence within the catchment area of the EmployAbility company
The requirement that clients reside within the catchment area of the EmployAbility company to which they are referred is understandable from the perspective of minimising potential duplication of service provision on a geographic basis. It also helps minimise accessibility issues, by reducing travel times for clients attending services. However, this criterion may be problematic in parts of the country where potential employment opportunities are more limited and clients may wish to travel further to avail of EmployAbility services in another location where their skills are more likely to be in demand. To facilitate the efficient functioning of labour markets and widen the employment opportunities available to clients, it may be appropriate to introduce greater flexibility in the application of this requirement.
3.9 Summary of Findings
This section presented a detailed assessment of effectiveness and efficiency in relation to the operation of EmployAbility. This included an assessment of: (a) the level of positive employment outcomes achieved; (b) the sustainability of the employment outcomes achieved; (c) the appropriateness of the current key performance indicators; and, (d) the appropriateness of the criteria applied for access to the service. The key findings are summarised below:
There has been a recent upward trend in the number of individuals referred to the EmployAbility service, with the number of referrals reaching a total of 3,151 in 2014, representing an increase of 51.8% on the level in 2010. The service provided supports to a total of 2,936 active clients, while a total of 2,651 clients exited the service during 2014. At a national level across the 23 EmployAbility companies, although the outcomes under both metrics have increased over the period, they remained below the target levels in 2014.
There is a high level of client non-completion (47% in 2014) due to unsuitability, ill health or non-engagement. This impacts on potential outcomes and if non-completions are removed from the exit data this would suggest that 46.9% of clients exited the programme while in employment, although this still falls short of the target level.
During 2014, across the EmployAbility companies, a total of 744 former programme clients were in employment after six months following exit. This represented 83.3% of total exits to employment and 28% of total exits.
The progression statistics analysed in this section, whereby 742 persons or only 25.3% of the 2,936 active clients in 2014 remained in open labour market employment after 6 months without support from the service, suggest that while the service has positive benefits for clients, the net impacts in terms of sustained employment outcomes after controlling for deadweight are likely to be weaker.
The service has been well received by both clients and employer organisations. A majority of clients surveyed by Indecon were of the view that the programme has provided increased opportunities to gain work experience or/and employment, increased motivation and increased self-confidence, and contributed to their sense of health and wellbeing.
A majority of employers responding to Indecon’s research either strongly agreed or agreed that the service delivered on their overall expectations.

3 │ Assessment of Effectiveness and Efficiency of Service
54 Indecon International Economic Consultants
Evaluation of EmployAbility (Supported Employment) Service
A review was also undertaken of the current performance metrics, including the KPIs used to monitor service outcomes and effectiveness.
o In terms of conforming to ‘SMART’ criteria for effective monitoring indicators, the existing KPIs would appear to be well-defined and measurable. However, Indecon would have some concerns in relation to the definition and interpretation of the employment-related metrics.
o We would also have a concern in relation to the interpretation of the metric pertaining to the percentage of clients exiting the programme while in employment.
o The basis for the targets set for the KPIs is not clear and appears arbitrary. In addition, the timeframes over which the targets should be achieved are not clear.
o A notable gap concerns the coverage of the KPIs. The range of KPIs, being confined to just three metrics pertaining to employment outcomes (two metrics) and the job coach ratio, is extremely limited and inadequate to assess service effectiveness and efficiency.
An issue highlighted in Indecon’s assessment of the appropriateness of the access criteria concerns the precise scope of individuals in receipt of DSP payments who are potentially eligible for support. It is also understood that there is a low incidence or probability of refusal or non-referral among applicants for the service in general.
The requirement that prospective clients be ‘job ready’ is an important element of the overall access criteria. The evident high rates of non-completion/drop-out among clients and the failure to challenges apparent in achieving the KPI targets for employment outcomes together suggest that a high proportion of referrals may relate to individuals who are not job ready, and therefore that the EmployAbility service is not appropriate to address their needs.
The evaluation examined a number of metrics, which relate expenditures to different outcomes from the service to assess cost-effectiveness. The following observations were made based on the selected metrics examined:
o Average monthly expenditure per client supported is estimated to have varied in the range of €222 per month to €258 per month over the period 2010-2014. Based on a typical 18-monthy programme duration, this would suggest an average programme cost per client supported of between €3,996 and €4,644 over this period.
o Average spend per client exit to employment has fallen from €19,032 in 2012 to €11,433 in 2014. This decline reflects the recent increase in exits to employment, whereas annual average expenditure has remained broadly stable over the period under consideration.
o Average service expenditure relative to employment sustained was €13,582 over the period 2013-2014.
o Overall, however, the analysis suggests that programme expenditure remains high relative to the quantum and sustainability of employment outcomes achieved.
o One measure of efficiency of service delivery relates to the number of clients assisted relative to the number of job coaches employed. Over the period 2010-2014, the service has achieved an average ratio of one job coach per 26 clients.
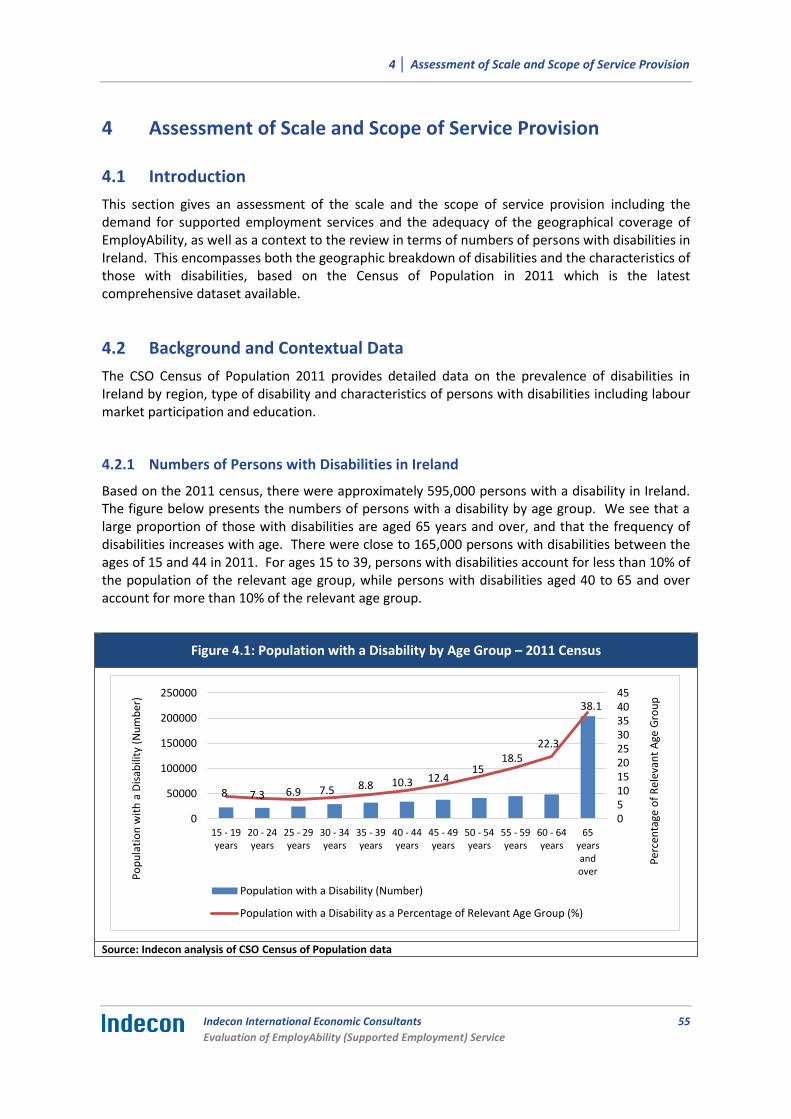
4 │ Assessment of Scale and Scope of Service Provision
Indecon International Economic Consultants
Evaluation of EmployAbility (Supported Employment) Service
55
4 Assessment of Scale and Scope of Service Provision
4.1 Introduction
This section gives an assessment of the scale and the scope of service provision including the demand for supported employment services and the adequacy of the geographical coverage of EmployAbility, as well as a context to the review in terms of numbers of persons with disabilities in Ireland. This encompasses both the geographic breakdown of disabilities and the characteristics of those with disabilities, based on the Census of Population in 2011 which is the latest comprehensive dataset available.
4.2 Background and Contextual Data
The CSO Census of Population 2011 provides detailed data on the prevalence of disabilities in Ireland by region, type of disability and characteristics of persons with disabilities including labour market participation and education.
4.2.1 Numbers of Persons with Disabilities in Ireland
Based on the 2011 census, there were approximately 595,000 persons with a disability in Ireland. The figure below presents the numbers of persons with a disability by age group. We see that a large proportion of those with disabilities are aged 65 years and over, and that the frequency of disabilities increases with age. There were close to 165,000 persons with disabilities between the ages of 15 and 44 in 2011. For ages 15 to 39, persons with disabilities account for less than 10% of the population of the relevant age group, while persons with disabilities aged 40 to 65 and over account for more than 10% of the relevant age group.
Figure 4.1: Population with a Disability by Age Group – 2011 Census
Source: Indecon analysis of CSO Census of Population data
8 7.3 6.9 7.5 8.8 10.3 12.4 15
18.5 22.3
38.1
051015202530354045
0
50000
100000
150000
200000
250000
15 - 19years
20 - 24years
25 - 29years
30 - 34years
35 - 39years
40 - 44years
45 - 49years
50 - 54years
55 - 59years
60 - 64years
65yearsandover
Per
cen
tage
of
Rel
evan
t A
ge G
rou
p
Po
pu
lati
on
wit
h a
Dis
abili
ty (
Nu
mb
er)
Population with a Disability (Number)
Population with a Disability as a Percentage of Relevant Age Group (%)

4 │ Assessment of Scale and Scope of Service Provision
56 Indecon International Economic Consultants
Evaluation of EmployAbility (Supported Employment) Service
The figure below provides the numbers of persons with disabilities by more detailed age group. The total number of persons of all ages with a disability was 595,335 in 2011. We see that the prevalence of disabilities rises and is highest between ages 40 and 70.35
Figure 4.2: Population with a Disability by Age Group (Census 2011)
Source: Indecon analysis of CSO Census 2011 Census of Population data
It is important to look also at the regional distribution of disabilities and this will be related to the size of the regional population. For example, it is expected that given its high population, Dublin and surrounding locales will have high numbers of persons with disabilities. Based on the Census 2011, we find that Dublin has the highest numbers of persons with a disability by virtue of its high population, with the next regions with high numbers being the South-West, the South-East, the Border region and the Mid-East. The Midlands has the lowest prevalence of persons with a disability. The regions with the highest density of disabilities (i.e., relative to population) are the South East (13.7%) and the Mid-West (13.6%). This is shown in more detail in Section 4.4.
35 A comparison with the numbers with disabilities in the 2006 Census was not possible as the CSO note in their Census commentary that changes to the wording of the disability questions on the Census forms have had an impact on the increases in the numbers of people with disabilities between 2006 and 2011. The CSO state that given the way the questions were changed it is not possible to identify to what extent these increases mask the actual underlying changes in disability, although a broadly similar age pattern can be observed for both censuses. See page 8 on the following link: http://www.cso.ie/en/media/csoie/census/documents/census2011profile8/Profile,8,commentary.pdf.
0
10000
20000
30000
40000
50000
60000
Po
pu
lati
on
wit
h a
Dis
abili
ty (
Nu
mb
er)
Population with a Disability (Number)
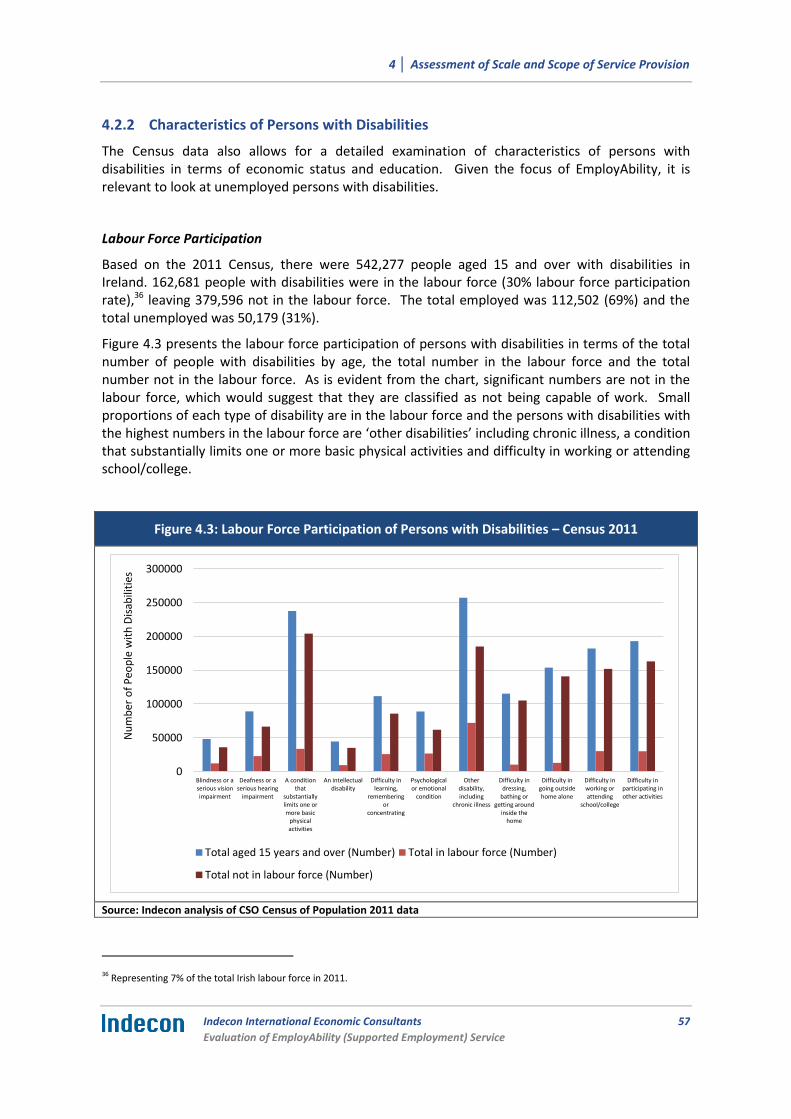
4 │ Assessment of Scale and Scope of Service Provision
Indecon International Economic Consultants
Evaluation of EmployAbility (Supported Employment) Service
57
4.2.2 Characteristics of Persons with Disabilities
The Census data also allows for a detailed examination of characteristics of persons with disabilities in terms of economic status and education. Given the focus of EmployAbility, it is relevant to look at unemployed persons with disabilities.
Labour Force Participation
Based on the 2011 Census, there were 542,277 people aged 15 and over with disabilities in Ireland. 162,681 people with disabilities were in the labour force (30% labour force participation rate),36 leaving 379,596 not in the labour force. The total employed was 112,502 (69%) and the total unemployed was 50,179 (31%).
Figure 4.3 presents the labour force participation of persons with disabilities in terms of the total number of people with disabilities by age, the total number in the labour force and the total number not in the labour force. As is evident from the chart, significant numbers are not in the labour force, which would suggest that they are classified as not being capable of work. Small proportions of each type of disability are in the labour force and the persons with disabilities with the highest numbers in the labour force are ‘other disabilities’ including chronic illness, a condition that substantially limits one or more basic physical activities and difficulty in working or attending school/college.
Figure 4.3: Labour Force Participation of Persons with Disabilities – Census 2011
Source: Indecon analysis of CSO Census of Population 2011 data
36 Representing 7% of the total Irish labour force in 2011.
0
50000
100000
150000
200000
250000
300000
Blindness or aserious visionimpairment
Deafness or aserious hearing
impairment
A conditionthat
substantiallylimits one ormore basic
physicalactivities
An intellectualdisability
Difficulty inlearning,
rememberingor
concentrating
Psychologicalor emotional
condition
Otherdisability,including
chronic illness
Difficulty indressing,
bathing orgetting around
inside thehome
Difficulty ingoing outsidehome alone
Difficulty inworking orattending
school/college
Difficulty inparticipating inother activities
Nu
mb
er o
f P
eop
le w
ith
Dis
abili
ties
Total aged 15 years and over (Number) Total in labour force (Number)
Total not in labour force (Number)

4 │ Assessment of Scale and Scope of Service Provision
58 Indecon International Economic Consultants
Evaluation of EmployAbility (Supported Employment) Service
The figure below plots the numbers of persons with disabilities and the labour force participation rate of those persons (right-hand axis). The highest participation rates are among persons with psychological conditions (30.2%), other disabilities (28.1%), deafness (25.4%) and persons with difficulty in learning (23.2%).
Figure 4.4: Labour Force Participation of Persons with Disabilities – Census 2011
Source: Indecon analysis of CSO Census of Population 2011 data
In looking at those persons with disabilities that are employed, the figure overleaf presents the numbers employed in terms of being an employee, an employer/self-employed, or working in assisting a relative (i.e., in the home). Of those at work, the highest numbers are employees or employers/self-employed.
25.3 25.4
14.1
21.3
23.2
30.2 28.1
8.8
8.4
16.6 15.6
0
5
10
15
20
25
30
35
0
50000
100000
150000
200000
250000
300000
Blindness or aserious visionimpairment
Deafness or aserioushearing
impairment
A conditionthat
substantiallylimits one ormore basic
physicalactivities
An intellectualdisability
Difficulty inlearning,
rememberingor
concentrating
Psychologicalor emotional
condition
Otherdisability,including
chronic illness
Difficulty indressing,
bathing orgetting
around insidethe home
Difficulty ingoing outsidehome alone
Difficulty inworking orattending
school/college
Difficulty inparticipating
in otheractivities
Lab
ou
r fo
rce
par
tici
pat
ion
rat
e %
Nu
mb
er o
f P
eop
le w
ith
Dis
abili
ties
Total aged 15 years and over (Number) Labour force participation rate (%)(right axis)
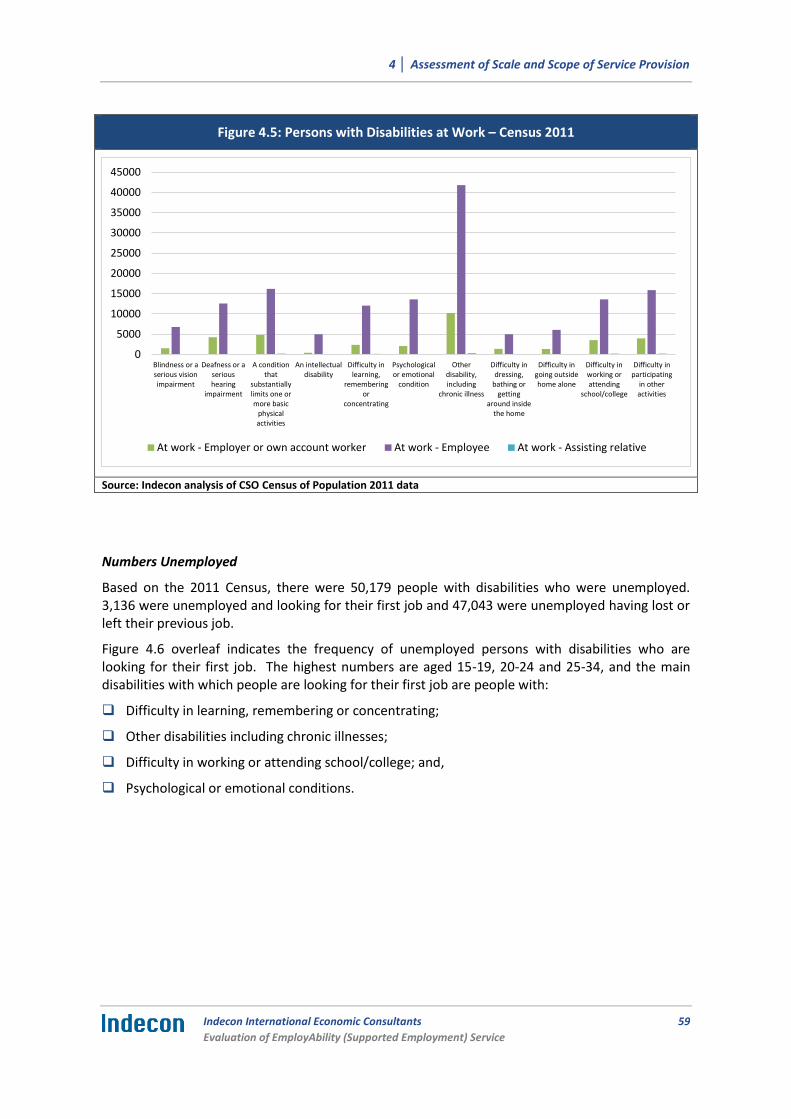
4 │ Assessment of Scale and Scope of Service Provision
Indecon International Economic Consultants
Evaluation of EmployAbility (Supported Employment) Service
59
Figure 4.5: Persons with Disabilities at Work – Census 2011
Source: Indecon analysis of CSO Census of Population 2011 data
Numbers Unemployed
Based on the 2011 Census, there were 50,179 people with disabilities who were unemployed. 3,136 were unemployed and looking for their first job and 47,043 were unemployed having lost or left their previous job.
Figure 4.6 overleaf indicates the frequency of unemployed persons with disabilities who are looking for their first job. The highest numbers are aged 15-19, 20-24 and 25-34, and the main disabilities with which people are looking for their first job are people with:
Difficulty in learning, remembering or concentrating;
Other disabilities including chronic illnesses;
Difficulty in working or attending school/college; and,
Psychological or emotional conditions.
0
5000
10000
15000
20000
25000
30000
35000
40000
45000
Blindness or aserious visionimpairment
Deafness or aserioushearing
impairment
A conditionthat
substantiallylimits one ormore basic
physicalactivities
An intellectualdisability
Difficulty inlearning,
rememberingor
concentrating
Psychologicalor emotional
condition
Otherdisability,including
chronic illness
Difficulty indressing,
bathing orgetting
around insidethe home
Difficulty ingoing outsidehome alone
Difficulty inworking orattending
school/college
Difficulty inparticipating
in otheractivities
At work - Employer or own account worker At work - Employee At work - Assisting relative

4 │ Assessment of Scale and Scope of Service Provision
60 Indecon International Economic Consultants
Evaluation of EmployAbility (Supported Employment) Service
Figure 4.6: Unemployed Persons with Disabilities looking for their First Job – Census 2011
Source: Indecon analysis of CSO Census of Population 2011 data
Figure 4.7 overleaf describes the number of unemployed persons with disabilities that lost or left their previous job. The most common age groups are 35-44, 45-54, and 55-64, respectively. The main disabilities with which people lost or left their job are:
Other disabilities including chronic illness;
A condition that substantially limits one or more basic physical activities;
Difficulty in working or attending school; and,
Psychological or emotional condition.
0
50
100
150
200
250
300
350
400
450
Blindness or aserious visionimpairment
Deafness or aserioushearing
impairment
A conditionthat
substantiallylimits one ormore basic
physicalactivities
An intellectualdisability
Difficulty inlearning,
rememberingor
concentrating
Psychologicalor emotional
condition
Otherdisability,including
chronic illness
Difficulty indressing,
bathing orgetting
around insidethe home
Difficulty ingoing outsidehome alone
Difficulty inworking orattending
school/college
Difficulty inparticipating
in otheractivities
15 - 19 years 20 - 24 years 25 - 34 years 35 - 44 years 45 - 54 years 55 - 64 years

4 │ Assessment of Scale and Scope of Service Provision
Indecon International Economic Consultants
Evaluation of EmployAbility (Supported Employment) Service
61
Figure 4.7: Unemployed Persons with Disabilities that Lost or Left their Previous Job – Census 2011
Source: Indecon analysis of CSO Census of Population 2011 data
Additional analysis is also presented in Annex 4, including the number of people with disabilities who are categorised as students or pupils. The most common age groups are 15-19 and 20-24, which can be expected given that high numbers of the total population typically attend school and college within these age brackets. Of those persons with disabilities who are students or pupils, the most common disabilities are: difficulty in learning, remembering or concentrating; other disa-bilities including chronic illness; difficulty in working or attending school/college; and intellectual disabilities.
0
1000
2000
3000
4000
5000
6000
Blindness or aserious visionimpairment
Deafness or aserioushearing
impairment
A conditionthat
substantiallylimits one ormore basic
physicalactivities
An intellectualdisability
Difficulty inlearning,
rememberingor
concentrating
Psychologicalor emotional
condition
Otherdisability,including
chronic illness
Difficulty indressing,
bathing orgetting
around insidethe home
Difficulty ingoing outsidehome alone
Difficulty inworking orattending
school/college
Difficulty inparticipating
in otheractivities
15 - 19 years 20 - 24 years 25 - 34 years 35 - 44 years
45 - 54 years 55 - 64 years 65 years and over

4 │ Assessment of Scale and Scope of Service Provision
62 Indecon International Economic Consultants
Evaluation of EmployAbility (Supported Employment) Service
Figure 4.8 below gives the overall numbers of persons unemployed that are either looking for their first regular job or have lost or given up their previous job. Significant numbers of people with disabilities have become unemployed based on having lost or given up their previous job.
Figure 4.8: Unemployed Persons with Disabilities by Disability Type – Census 2011
Source: Indecon analysis of CSO Census of Population 2011 data
Educational Attainment
A further interesting aspect to consider is the education profile of people with disabilities. Figure 4.9 overleaf presents the highest educational attainment levels of people with a disability. We find that while low numbers have no formal education, significant numbers have achieved only primary education, with some having achieved lower and upper secondary education. Low numbers have achieved any post-school level education such as technical/vocational education, certificates/diploma or bachelor degrees. This would suggest that there is a need to raise the educational attainment levels of people with disabilities in Ireland.
0
2000
4000
6000
8000
10000
12000
14000
16000
18000
20000
Blindness or aserious visionimpairment
Deafness or aserioushearing
impairment
A conditionthat
substantiallylimits one ormore basic
physicalactivities
An intellectualdisability
Difficulty inlearning,
rememberingor
concentrating
Psychologicalor emotional
condition
Otherdisability,including
chronic illness
Difficulty indressing,
bathing orgetting
around insidethe home
Difficulty ingoing outsidehome alone
Difficulty inworking orattending
school/college
Difficulty inparticipating
in otheractivities
Unemployed looking for first regular job (Number)
Unemployed having lost or given up previous job (Number)

4 │ Assessment of Scale and Scope of Service Provision
Indecon International Economic Consultants
Evaluation of EmployAbility (Supported Employment) Service
63
Figure 4.9: Highest Education Attained by Persons with Disabilities – Census 2011
Source: Indecon analysis of CSO Census of Population 2011 data
The following charts look at the educational attainment levels of persons with disabilities by the type of disabilities. Figure 4.10 overleaf outlines the primary and secondary level education profile of persons with disabilities by disability type. We find that the numbers with primary and secondary education are fairly evenly spread across disability type, but that persons with intellectual and learning disabilities have the highest frequency of no formal education.
0
20000
40000
60000
80000
100000
120000
140000
160000
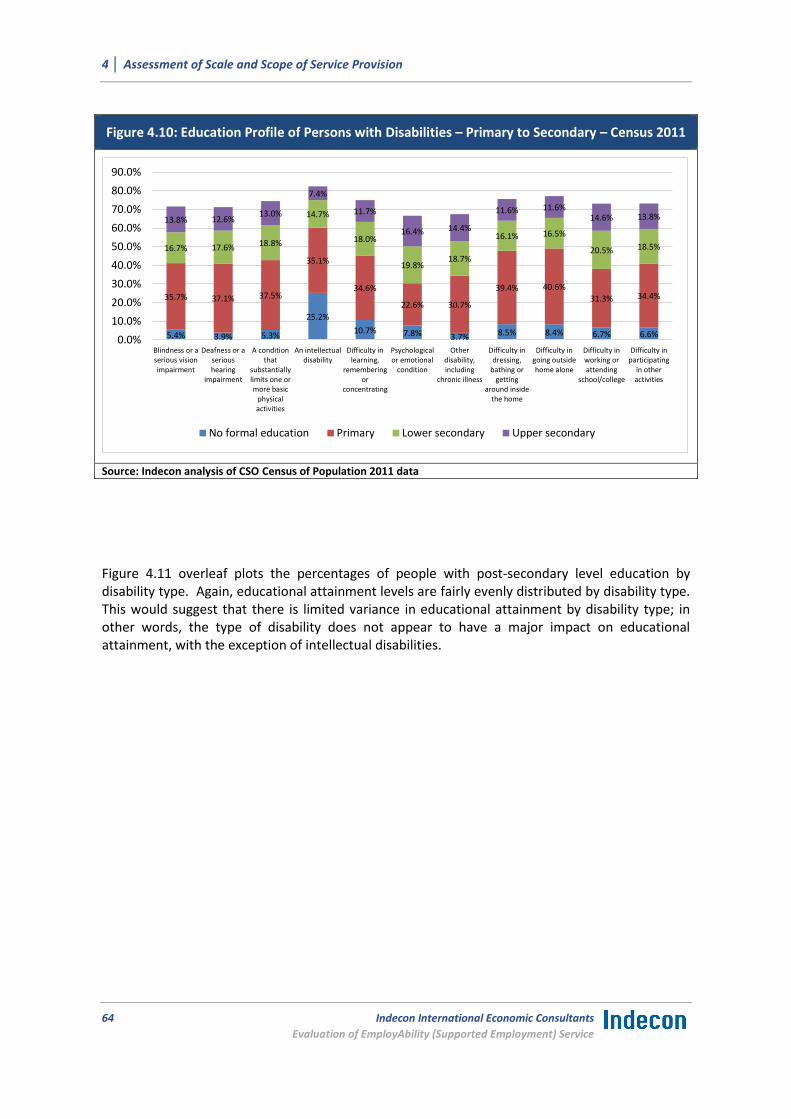
4 │ Assessment of Scale and Scope of Service Provision
64 Indecon International Economic Consultants
Evaluation of EmployAbility (Supported Employment) Service
Figure 4.10: Education Profile of Persons with Disabilities – Primary to Secondary – Census 2011
Source: Indecon analysis of CSO Census of Population 2011 data
Figure 4.11 overleaf plots the percentages of people with post-secondary level education by disability type. Again, educational attainment levels are fairly evenly distributed by disability type. This would suggest that there is limited variance in educational attainment by disability type; in other words, the type of disability does not appear to have a major impact on educational attainment, with the exception of intellectual disabilities.
5.4% 3.9% 5.3%
25.2%
10.7% 7.8% 3.7% 8.5% 8.4% 6.7% 6.6%
35.7% 37.1% 37.5%
35.1%
34.6%
22.6% 30.7%
39.4% 40.6%
31.3% 34.4%
16.7% 17.6% 18.8%
14.7%
18.0%
19.8% 18.7%
16.1% 16.5%
20.5% 18.5%
13.8% 12.6% 13.0%
7.4%
11.7%
16.4% 14.4%
11.6% 11.6% 14.6% 13.8%
0.0%
10.0%
20.0%
30.0%
40.0%
50.0%
60.0%
70.0%
80.0%
90.0%
Blindness or aserious visionimpairment
Deafness or aserioushearing
impairment
A conditionthat
substantiallylimits one ormore basic
physicalactivities
An intellectualdisability
Difficulty inlearning,
rememberingor
concentrating
Psychologicalor emotional
condition
Otherdisability,including
chronic illness
Difficulty indressing,
bathing orgetting
around insidethe home
Difficulty ingoing outsidehome alone
Difficulty inworking orattending
school/college
Difficulty inparticipating
in otheractivities
No formal education Primary Lower secondary Upper secondary
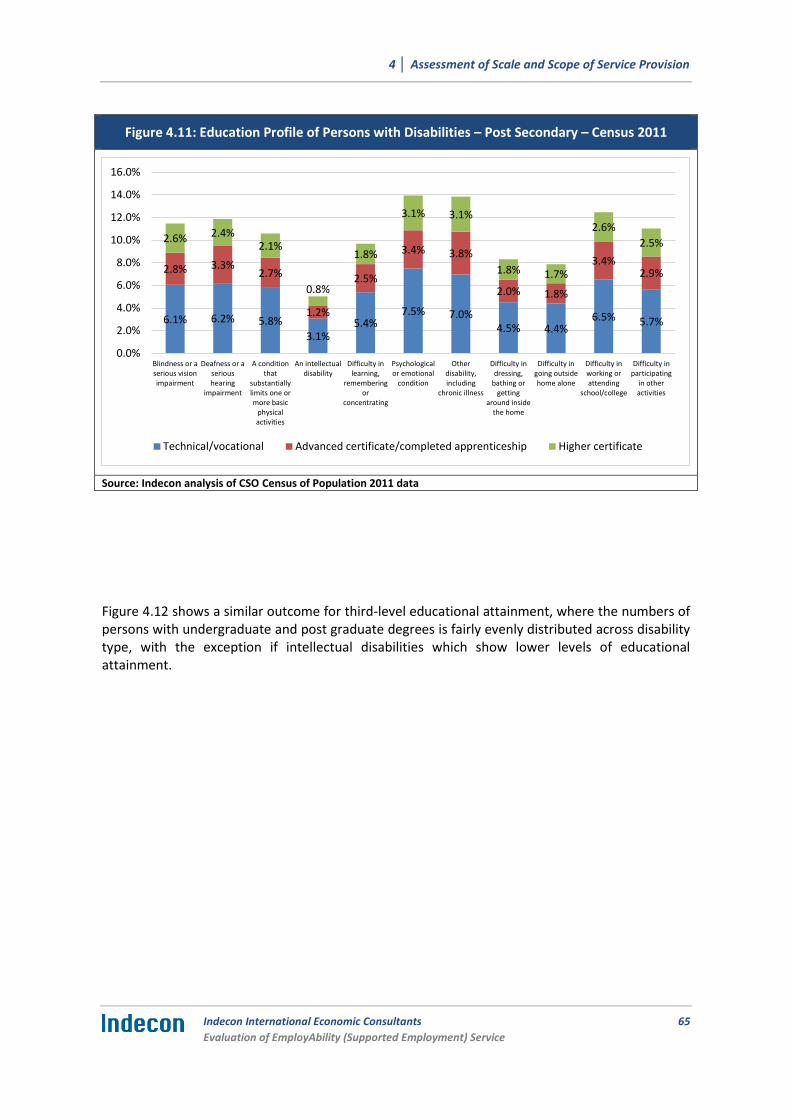
4 │ Assessment of Scale and Scope of Service Provision
Indecon International Economic Consultants
Evaluation of EmployAbility (Supported Employment) Service
65
Figure 4.11: Education Profile of Persons with Disabilities – Post Secondary – Census 2011
Source: Indecon analysis of CSO Census of Population 2011 data
Figure 4.12 shows a similar outcome for third-level educational attainment, where the numbers of persons with undergraduate and post graduate degrees is fairly evenly distributed across disability type, with the exception if intellectual disabilities which show lower levels of educational attainment.
6.1% 6.2% 5.8%
3.1% 5.4%
7.5% 7.0% 4.5% 4.4%
6.5% 5.7%
2.8% 3.3% 2.7%
1.2%
2.5%
3.4% 3.8%
2.0% 1.8%
3.4% 2.9%
2.6% 2.4% 2.1%
0.8%
1.8%
3.1% 3.1%
1.8% 1.7%
2.6%
2.5%
0.0%
2.0%
4.0%
6.0%
8.0%
10.0%
12.0%
14.0%
16.0%
Blindness or aserious visionimpairment
Deafness or aserioushearing
impairment
A conditionthat
substantiallylimits one ormore basic
physicalactivities
An intellectualdisability
Difficulty inlearning,
rememberingor
concentrating
Psychologicalor emotional
condition
Otherdisability,including
chronic illness
Difficulty indressing,
bathing orgetting
around insidethe home
Difficulty ingoing outsidehome alone
Difficulty inworking orattending
school/college
Difficulty inparticipating
in otheractivities
Technical/vocational Advanced certificate/completed apprenticeship Higher certificate

4 │ Assessment of Scale and Scope of Service Provision
66 Indecon International Economic Consultants
Evaluation of EmployAbility (Supported Employment) Service
Figure 4.12: Education Profile of Persons with Disabilities – Third Level – Census 2011
Source: Indecon analysis of CSO Census of Population 2011 data
4.2.3 Conclusions from analysis of contextual data
Based on the 2011 census, there were approximately 595,000 persons with a disability in Ireland. We find that a large proportion of those with disabilities are aged 65 years and over, and that the frequency of disabilities increases with age. There were close to 165,000 persons with disabilities between the ages of 15 and 44 in 2011. For ages 15 to 39, persons with disabilities account for less than 10% of the population of the relevant age group, while persons with disabilities aged 40 to 65 and over account for more than 10% of the relevant age group.
In looking at the regional distribution of disabilities, we find that Dublin has the highest numbers of persons with a disability by virtue of its high population, with the next regions with high numbers being the South-West, the South-East, the Border region and the Mid-East. The Midlands has the lowest prevalence of persons with a disability. The regions with the highest density of disabilities (i.e., relative to population) are the South East (13.7%) and the Mid-West (13.6%).
The Census also showed that there were 542,277 people aged 15 and over with disabilities in Ireland. 162,681 people with disabilities were in the labour force (30% labour force participation rate),37 leaving 379,596 not in the labour force. The total employed was 112,502 (69%) and the total unemployed was 50,179 (31%).
37 Representing 7% of the total Irish labour force, based on the most recent Census of Population (2011).
3.6% 4.0% 3.2%
1.1%
2.8%
4.7% 4.6%
2.7% 2.6% 3.6% 3.8%
3.3% 3.0%
2.1%
0.9%
2.0%
4.3% 4.2%
1.8% 1.7%
2.6% 2.8%
2.6% 2.7%
1.7%
0.6%
1.4%
3.5% 3.7%
1.3% 1.2%
2.1% 2.2%
0.4% 0.4%
0.3%
0.1%
0.2%
0.4% 0.5%
0.3% 0.2%
0.3% 0.3%
0.0%
2.0%
4.0%
6.0%
8.0%
10.0%
12.0%
14.0%
Blindness or aserious visionimpairment
Deafness or aserioushearing
impairment
A conditionthat
substantiallylimits one ormore basic
physicalactivities
An intellectualdisability
Difficulty inlearning,
rememberingor
concentrating
Psychologicalor emotional
condition
Otherdisability,including
chronic illness
Difficulty indressing,
bathing orgetting
around insidethe home
Difficulty ingoing outsidehome alone
Difficulty inworking orattending
school/college
Difficulty inparticipating
in otheractivities
Doctorate (Ph.D) Postgraduate diploma or degree
Honours bachelor degree/professional qualification or both Ordinary bachelor degree/professional qualification or both

4 │ Assessment of Scale and Scope of Service Provision
Indecon International Economic Consultants
Evaluation of EmployAbility (Supported Employment) Service
67
When looking at the education profile of people with disabilities, the data shows that while low numbers have no formal education, significant numbers have achieved only primary education, with some having achieved lower and upper secondary education. Low numbers have achieved any post-school level education such as technical/vocational education, certificates/diploma or bachelor degrees. This would suggest that there is a need to raise the educational attainment levels of people with disabilities in Ireland. We find also that the numbers with primary and secondary education are fairly evenly spread across disability type, but that persons with intellectual and learning disabilities have the highest frequency of no formal education.
While the above findings based on Census 2011 data suggest that there is significant scope for EmployAbility to continue and expand its service in improving the employment opportunities and outcomes for people with disabilities, it should be recognised that the service is voluntary in that participation by persons with disabilities is not compulsory and this, along with population numbers and eligibility, will influence the potential demand for the service. Client numbers are also influenced by the accessibility of the service, as participation may be more difficult for some individuals in more isolated rural areas.
4.3 Current and Future Demand for Supported Employment
In looking at the demand for supported employment and hence the potential client base for EmployAbility, we utilise data from the Census 2011 (which is extended in line with recent population growth) and data on the numbers of recipients of disability-related social welfare payments.
4.3.1 Numbers of People with Disabilities from the Census 2011
Based on the 2011 Census, there were 542,277 people aged 15 and over with disabilities in Ireland, 334,234 of which were between the ages of 18 and 65 years.
162,681 people with disabilities were in the labour force (30% labour force participation rate), leaving 379,596 not in the labour force. The total employed was 112,502 (69%) and the total unemployed was 50,179 (31%). It is this latter number of people that are unemployed that is likely to be the closest estimate of demand for supported employment.
The highest participation rates were among persons with psychological conditions (30.2%), other disabilities (28.1%), deafness (25.4%) and persons with difficulty in learning (23.2%).
There are significant numbers of people with disabilities who are unemployed and/or have achieved a low level of educational attainment.
Unemployed
Of the 50,179 people with disabilities who were unemployed, 3,136 were unemployed and looking for their first job and 47,043 were unemployed having lost or left their previous job. Significant numbers within each of these cohorts are likely to be potential clients for EmployAbility.
The group that was unemployed and looking for their first job saw the highest numbers concentrated across the ages of 15-19, 20-24 and 25-34 and with disabilities such as:
Difficulty in learning, remembering or concentrating;
4 │ Assessment of Scale and Scope of Service Provision
68 Indecon International Economic Consultants
Evaluation of EmployAbility (Supported Employment) Service
Other disabilities including chronic illnesses;
Difficulty in working or attending school/college; and,
Psychological or emotional conditions.
The group that was unemployed and who left or lost their previous job saw the highest numbers concentrated across the ages of 35-44, 45-54, and 55-64 respectively and with disabilities such as:
Other disabilities including chronic illness;
A condition that substantially limits one or more basic physical activities;
Difficulty in working or attending school; and,
Psychological or emotional condition.
Educational Attainment
We find that while low numbers have no formal education, significant numbers have achieved only primary education, with some having achieved lower and upper secondary education. Low numbers have achieved any post-school level education such as technical/vocational education, certificates/diploma or bachelor degrees. This would suggest that there is a need to raise the educational attainment levels of people with disabilities in Ireland.
We also find that the numbers with primary and secondary education are fairly evenly spread across disability type, but that persons with intellectual and learning disabilities have the highest frequency of no formal education.
In looking at third-level educational attainment, the number of persons with undergraduate and post graduate degrees is fairly evenly distributed across disability type, with the exception of intellectual disabilities, which show lower levels of educational attainment.
4.3.2 Numbers in Receipt of Social Welfare Payment
The table overleaf presents an overview of the numbers in receipt of the various types of social welfare payments for people with disabilities. In 2014, 112,097 people were in receipt of Disability Allowance, while 57,024 were in receipt of Illness Benefit and 54,223 were in receipt of Invalidity Pension.

4 │ Assessment of Scale and Scope of Service Provision
Indecon International Economic Consultants
Evaluation of EmployAbility (Supported Employment) Service
69
Table 4.1: Numbers in Receipt of Social Welfare Payment
Year Disability Allowance
Blind Pension
Illness Benefit
Injury Benefit
Interim Illness Benefit
Invalidity Pension Disablement Benefit
2004 72,976 2,027 58,726 915 316 55,864 12,162
2005 79,253 1,985 61,845 908 355 58,352 12,475
2006 83,697 1,476 65,774 924 338 51,954 12,646
2007 89,048 1,474 70,404 900 440 53,956 12,874
2008 95,754 1,472 73,609 846 525 53,725 13,192
2009 99,576 1,467 77,665 726 318 52,922 13,520
2010 101,111 1,485 81,253 835 374 50,766 13,721
2011 102,866 1,496 73,397 776 327 49,792 13,993
2012 101,784 1,456 64,429 671 363 50,053 14,202
2013 106,279 1,385 58,990 822 380 53,196 14,226
2014 112,097 N/A 57,024 906 327 54,223 12,293
Source: Statistical Information on Social Welfare Services 2014 38
Of the total number of 112,097 on Disability Allowance, 107,022 were between the ages of 20 and 65, as illustrated in the table below.
Table 4.2: Recipients of Disability Allowance by Age in 2014
Age Total
Under 20 years 5,058
20 to 24 years 7,834
25 to 29 years 8,207
30 to 34 years 9,750
35 to 39 years 10,531
40 to 44 years 11,864
45 to 49 years 12,966
50 to 54 years 13,739
55 to 59 years 14,283
60 to 64 years 14,967
65 years 2,881
66 to 69 years 17
Total 112,097
Source: Statistical Information on Social Welfare Services 2014
38 https://www.welfare.ie/en/downloads/Social-Stats-AR-2014-SectionE.pdf
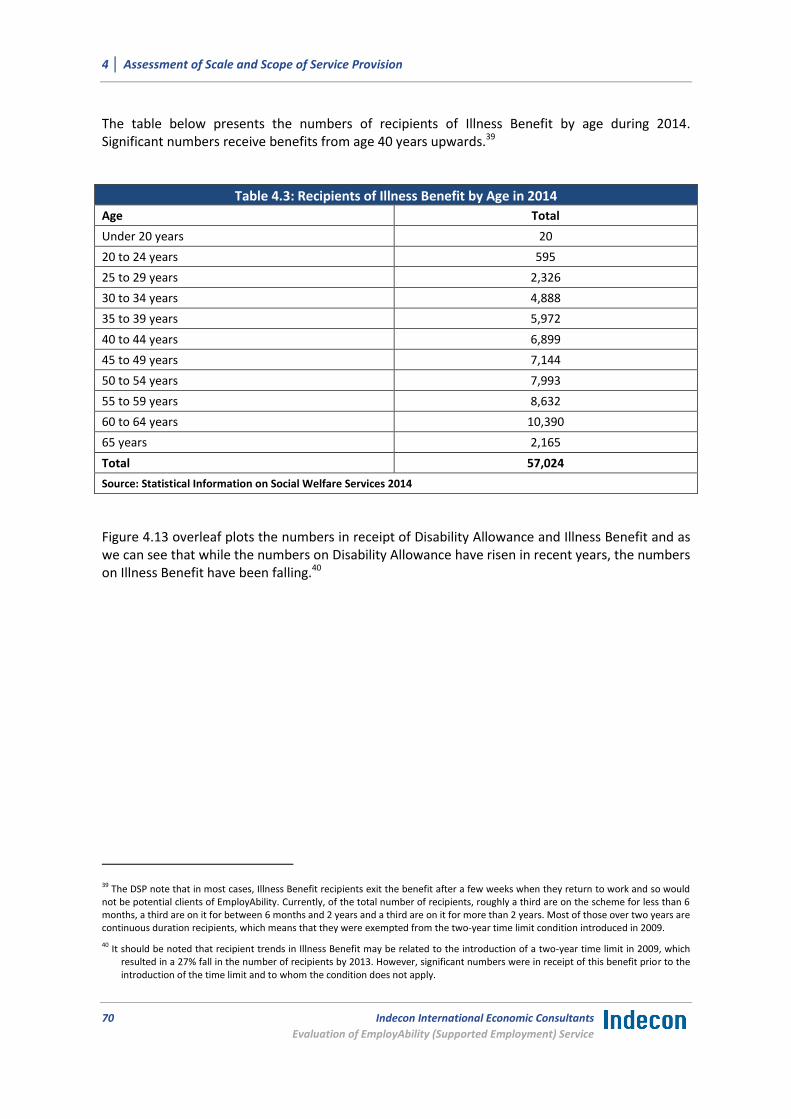
4 │ Assessment of Scale and Scope of Service Provision
70 Indecon International Economic Consultants
Evaluation of EmployAbility (Supported Employment) Service
The table below presents the numbers of recipients of Illness Benefit by age during 2014. Significant numbers receive benefits from age 40 years upwards.39
Table 4.3: Recipients of Illness Benefit by Age in 2014
Age Total
Under 20 years 20
20 to 24 years 595
25 to 29 years 2,326
30 to 34 years 4,888
35 to 39 years 5,972
40 to 44 years 6,899
45 to 49 years 7,144
50 to 54 years 7,993
55 to 59 years 8,632
60 to 64 years 10,390
65 years 2,165
Total 57,024
Source: Statistical Information on Social Welfare Services 2014
Figure 4.13 overleaf plots the numbers in receipt of Disability Allowance and Illness Benefit and as we can see that while the numbers on Disability Allowance have risen in recent years, the numbers on Illness Benefit have been falling.40
39 The DSP note that in most cases, Illness Benefit recipients exit the benefit after a few weeks when they return to work and so would not be potential clients of EmployAbility. Currently, of the total number of recipients, roughly a third are on the scheme for less than 6 months, a third are on it for between 6 months and 2 years and a third are on it for more than 2 years. Most of those over two years are continuous duration recipients, which means that they were exempted from the two-year time limit condition introduced in 2009. 40 It should be noted that recipient trends in Illness Benefit may be related to the introduction of a two-year time limit in 2009, which
resulted in a 27% fall in the number of recipients by 2013. However, significant numbers were in receipt of this benefit prior to the introduction of the time limit and to whom the condition does not apply.

4 │ Assessment of Scale and Scope of Service Provision
Indecon International Economic Consultants
Evaluation of EmployAbility (Supported Employment) Service
71
Figure 4.13: Trends in Numbers in Receipt of Disability Allowance and Illness Benefit
Source: Statistical Information on Social Welfare Services 2014
Table 4.4 below outlines the numbers that received an Invalidity Pension payment during 2014. Again, higher numbers were in receipt of a payment from age 45 onwards. 41
Table 4.4: Recipients of Invalidity Pension by Age in 2014
Age Total
Under 25 years 2
25 to 29 years 77
30 to 34 years 580
35 to 39 years 1,588
40 to 44 years 2,969
45 to 49 years 4,641
50 to 54 years 8,249
55 to 59 years 12,673
60 to 65 years 23,444
Total 54,223
Source: Statistical Information on Social Welfare Services 2014
41 The potential client base for EmployAbility from this payment is likely to be small. Invalidity Pension is paid to people who are perma-nently incapable of work because of illness. To qualify a claimant must satisfy the following medical condition: a claimant must be re-garded as permanently incapable of work, which is defined as: Incapacity for work of such a nature that the likelihood is that the claim-ant will be incapable of work for life or an incapacity which has existed for 12 months prior to the date of claim, and where the Deciding Officer or an Appeals Officer is satisfied that the claimant is likely to be unable to work for 1 year from the date of claim.
-15.0%
-10.0%
-5.0%
0.0%
5.0%
10.0%
0
20000
40000
60000
80000
100000
120000
2004 2005 2006 2007 2008 2009 2010 2011 2012 2013 2014
Numbers on Disability Allowance
Numbers on Illness Benefit
Annual Change in Numbers on Disability Allowance
Annual Change in Numbers on Illness Benefit

4 │ Assessment of Scale and Scope of Service Provision
72 Indecon International Economic Consultants
Evaluation of EmployAbility (Supported Employment) Service
Table 4.5 below presents the numbers on Disability Allowance based on duration to date. We find that significant numbers have been in receipt of this payment for more than ten years (40%).
Table 4.5: Number receiving Disability Allowance as at July 2015
Duration Number Percentage of Total
<6 Months 2,564 2.2%
6-12Months 4,641 4.0%
1 to 2 Years 9,898 8.5%
2 to 3 Years 7,814 6.7%
3 to 4 Years 8,570 7.4%
4 to 5 Years 7,071 6.1%
5 to 6 Years 5,140 4.4%
6 to 7 Years 5,362 4.6%
7 to 8 Years 6,564 5.7%
8 to 9 Years 6,480 5.6%
9 to 10 Years 5,770 5.0%
Over 10 Years 46,157 39.8%
Total 116,031 100.0% Source: Indecon analysis of DSP data
Similarly, Table 4.6 below outlines the numbers in receipt of Illness Benefit by duration to date and the highest numbers have been in receipt of the payment for more than ten years. This is likely to be due to the introduction in 2009 of a time limit on how long one could claim this benefit and this did not affect people who were on this benefit prior to the introduction of a cap.
Table 4.6: Number receiving Illness Benefit as at August 2015
Duration Number Percentage of Total
Under 6 Months 19,534 34.4%
6 Months to 1 Year 8,546 15.1%
1 to 2 Years 8,023 14.1%
2 to 3 Years 213 0.4%
3 to 4 Years 165 0.3%
4 to 5 Years 161 0.3%
5 to 6 Years 155 0.3%
6 to 7 Years 2,259 4.0%
7 to 8 Years 3,641 6.4%
8 to 9 Years 2,657 4.7%
9 to 10 Years 2,014 3.6%
Over 10 Years 9,355 16.5%
Total 56,723 100.0%
Source: Indecon analysis of DSP data
4 │ Assessment of Scale and Scope of Service Provision
Indecon International Economic Consultants
Evaluation of EmployAbility (Supported Employment) Service
73
4.3.3 Contribution of EmployAbility to meeting Demand for Supported Employment
The potential demand for EmployAbility services is influenced by a range of factors, including the number of persons with disabilities, the accessibility of the service and the voluntary nature of participation in the service. The development of a rigorous statistical model to predict the demand for EmployAbility services was not within the scope of this assessment. However, Indecon has completed an examination based on alternative definitions of the potential client base. These definitions are informed by reference to key drivers of potential demand as they relate to the criteria for access to the service, including the population of persons with disabilities within the relevant age cohorts, the extent of unemployment among persons with disabilities, and the patterns of receipt of relevant social welfare supports. This assessment drew from data on disability within the Census of Population, in addition to data provided by the Department of Social Protection concerning trends the numbers of recipients of disability-related social welfare payments, and information from EmployAbility companies.
Approximately 2,700 participate in EmployAbility per year. The most recent Census of Population (2011) showed that 162,681 people with disabilities were in the labour force that year, with 112,502 employed (70%) and 50,179 unemployed (30%). The highest numbers in the labour force that were unemployed were among people with physical disabilities, difficulty in learning and remembering, psychological or emotional conditions, difficulty attending school or work and difficulty in participating in other activities. While it is uncertain how job ready these people may be, the fact these people are in the labour force and unemployed suggests that they are looking for work and that EmployAbility may be of assistance to them. The analysis of the Census data also showed that there were 47,043 people who were unemployed, having lost or left their previous job, and 3,136 people who were unemployed and looking for their first regular job.
Therefore, based on the data from 2011, the demand for such a service is likely to be of the order of 50,000 and the numbers of active clients on the service would suggest that it is only serving about 6% of the demand for such a service. However, ascertaining an exact estimate of the likely client base for EmployAbility is somewhat difficult.
In assessing the likely demand for EmployAbility, we apply three definitions of the potential client base:
Persons aged 18 to 65 with a disability outside the labour force (i.e. neither unemployed nor employed);
Persons aged 18 to 65 with a disability that are unemployed; and,
Persons aged 25 to 65 who are in receipt of a disability-related social welfare payment.
These definitions aim to give an indicative estimate of the potential client base for EmployAbility services, by considering persons who are outside the labour force, persons unemployed and looking for a job, and eligible persons who are in receipt of a disability-related social weflare payment. However, some caution should be applied in interpreting the numbers of persons implied by these alternative definitions, given the challenges involved in precisely defining the eligible client base for EmployAbility.

4 │ Assessment of Scale and Scope of Service Provision
74 Indecon International Economic Consultants
Evaluation of EmployAbility (Supported Employment) Service
Persons aged 18 to 65 with a disability outside the labour force
When we look at the total number of people with a disability aged 18 to 65 (the age cohort that is eligible for EmployAbility) excluding those that are employed and unemployed (i.e., outside the labour force), we find that the referrals and client numbers each account for less than 2% of these people, as illustrated below.
Table 4.7: Potential Demand for EmployAbility: Persons with a Disability aged 18 to 65 outside the Labour Force
Year
Persons with a Disability aged
18 to 65 outside Labour Force
EmployAbility Referrals
EmployAbility Active Clients
EmployAbility Referrals %
EmployAbility Active Clients %
2011 172,012 2,257 2,903 1.3% 1.7%
2012 172,641 2,134 2,762 1.2% 1.6%
2013 174,341 2,709 2,862 1.6% 1.6%
2014 176,001 3,151 2,936 1.8% 1.7%
Source: Indecon analysis Note: Number of Persons with a Disability is based on population estimates
Table 4.8 indicates the annual change in the number of referrals and active clients, as well as the annual change in the numbers with a disability aged 18 to 65. The latter has remained relatively constant since 2012.
Table 4.8: Annual Change in Numbers with a Disability and Numbers of EmployAbility Referrals and Clients
Year Persons with a Disability aged 18
to 65 outside Labour Force EmployAbility
Referrals EmployAbility Ac-
tive Clients
2012 0.4% -5% 4%
2013 1.0% 27% 3%
2014 1.0% 16% 4%
Source: Indecon analysis
Persons aged 18 to 65 with a disability that are unemployed
Table 4.9 compares the referral and client numbers to the numbers of people with a disability aged 18 to 65 that are unemployed. This suggests that EmployAbility is meeting about 6-7% of the demand for supported employment. This may provide the closest representation of demand for the service.

4 │ Assessment of Scale and Scope of Service Provision
Indecon International Economic Consultants
Evaluation of EmployAbility (Supported Employment) Service
75
Table 4.9: Demand for EmployAbility – Definition based on Number of Persons with a Disability aged 18 to 65 who are Unemployed
Year
Persons with a Disability aged
18 to 65 unemployed
EmployAbility Referrals
EmployAbility Active Clients
EmployAbility Referrals %
EmployAbility Active Clients %
2011 47,419 2,257 2,903 4.8% 6.1%
2012 47,318 2,134 2,762 4.5% 5.8%
2013 47,251 2,709 2,862 5.7% 6.1%
2014 47,364 3,151 2,936 6.7% 6.2%
Source: Indecon analysis Note: Number of Persons with a Disability is based on population estimates
As shown in the table below, the numbers unemployed have remained relatively constant since 2011, while the referral numbers have fluctuated quite a bit.
Table 4.10: Annual Change in Numbers with a Disability that are unemployed and Numbers of EmployAbility Referrals and Clients
Persons with a Disability aged 18 to
65 who are Unemployed EmployAbility Referrals
EmployAbility Active Clients
2012 -0.2% -5% 4%
2013 -0.1% 27% 3%
2014 0.2% 16% 4%
Source: Indecon analysis
Persons aged 25 to 65 who are in receipt of a disability-related social welfare payment
Finally, we look at the numbers in the relevant age group that are in receipt of a social welfare payment. These social welfare payments include:
Disability Allowance;
Illness Benefit; and,
Invalidity Pension.
It is important to note that under each payment only a proportion would meet the eligibility criteria for participation in EmployAbility. In the case of illness benefit, about one-third of recipients will receive payment for a short time while they are sick, and will subsequently return to their job upon recovering from illness. A further third of recipients of illness benefit are in receipt for more than two years, while the remaining third would be in receipt for six months to two years.42
42 This information is based on consultation with the DSP.
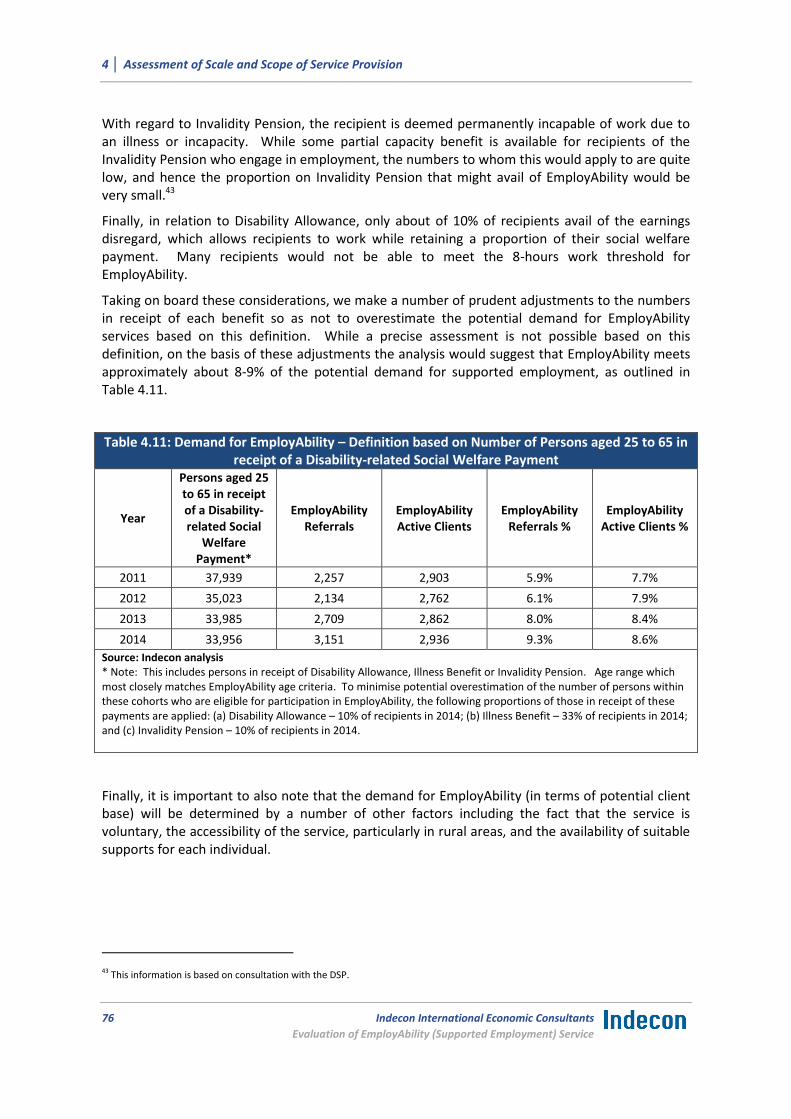
4 │ Assessment of Scale and Scope of Service Provision
76 Indecon International Economic Consultants
Evaluation of EmployAbility (Supported Employment) Service
With regard to Invalidity Pension, the recipient is deemed permanently incapable of work due to an illness or incapacity. While some partial capacity benefit is available for recipients of the Invalidity Pension who engage in employment, the numbers to whom this would apply to are quite low, and hence the proportion on Invalidity Pension that might avail of EmployAbility would be very small.43
Finally, in relation to Disability Allowance, only about of 10% of recipients avail of the earnings disregard, which allows recipients to work while retaining a proportion of their social welfare payment. Many recipients would not be able to meet the 8-hours work threshold for EmployAbility.
Taking on board these considerations, we make a number of prudent adjustments to the numbers in receipt of each benefit so as not to overestimate the potential demand for EmployAbility services based on this definition. While a precise assessment is not possible based on this definition, on the basis of these adjustments the analysis would suggest that EmployAbility meets approximately about 8-9% of the potential demand for supported employment, as outlined in Table 4.11.
Table 4.11: Demand for EmployAbility – Definition based on Number of Persons aged 25 to 65 in receipt of a Disability-related Social Welfare Payment
Year
Persons aged 25 to 65 in receipt of a Disability-related Social
Welfare Payment*
EmployAbility Referrals
EmployAbility Active Clients
EmployAbility Referrals %
EmployAbility Active Clients %
2011 37,939 2,257 2,903 5.9% 7.7%
2012 35,023 2,134 2,762 6.1% 7.9%
2013 33,985 2,709 2,862 8.0% 8.4%
2014 33,956 3,151 2,936 9.3% 8.6%
Source: Indecon analysis * Note: This includes persons in receipt of Disability Allowance, Illness Benefit or Invalidity Pension. Age range which most closely matches EmployAbility age criteria. To minimise potential overestimation of the number of persons within these cohorts who are eligible for participation in EmployAbility, the following proportions of those in receipt of these payments are applied: (a) Disability Allowance – 10% of recipients in 2014; (b) Illness Benefit – 33% of recipients in 2014; and (c) Invalidity Pension – 10% of recipients in 2014.
Finally, it is important to also note that the demand for EmployAbility (in terms of potential client base) will be determined by a number of other factors including the fact that the service is voluntary, the accessibility of the service, particularly in rural areas, and the availability of suitable supports for each individual.
43 This information is based on consultation with the DSP.
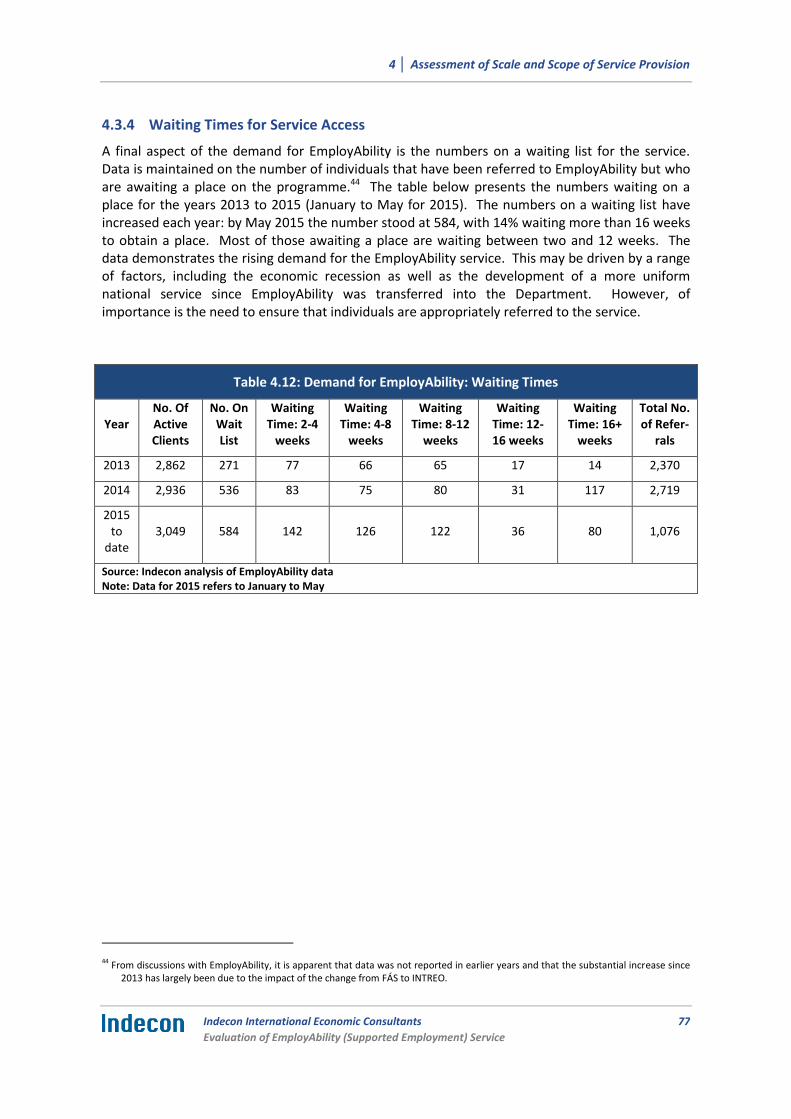
4 │ Assessment of Scale and Scope of Service Provision
Indecon International Economic Consultants
Evaluation of EmployAbility (Supported Employment) Service
77
4.3.4 Waiting Times for Service Access
A final aspect of the demand for EmployAbility is the numbers on a waiting list for the service. Data is maintained on the number of individuals that have been referred to EmployAbility but who are awaiting a place on the programme.44 The table below presents the numbers waiting on a place for the years 2013 to 2015 (January to May for 2015). The numbers on a waiting list have increased each year: by May 2015 the number stood at 584, with 14% waiting more than 16 weeks to obtain a place. Most of those awaiting a place are waiting between two and 12 weeks. The data demonstrates the rising demand for the EmployAbility service. This may be driven by a range of factors, including the economic recession as well as the development of a more uniform national service since EmployAbility was transferred into the Department. However, of importance is the need to ensure that individuals are appropriately referred to the service.
Table 4.12: Demand for EmployAbility: Waiting Times
Year No. Of Active Clients
No. On Wait List
Waiting Time: 2-4
weeks
Waiting Time: 4-8
weeks
Waiting Time: 8-12
weeks
Waiting Time: 12-16 weeks
Waiting Time: 16+
weeks
Total No. of Refer-
rals
2013 2,862 271 77 66 65 17 14 2,370
2014 2,936 536 83 75 80 31 117 2,719
2015 to
date 3,049 584 142 126 122 36 80 1,076
Source: Indecon analysis of EmployAbility data Note: Data for 2015 refers to January to May
44 From discussions with EmployAbility, it is apparent that data was not reported in earlier years and that the substantial increase since
2013 has largely been due to the impact of the change from FÁS to INTREO.
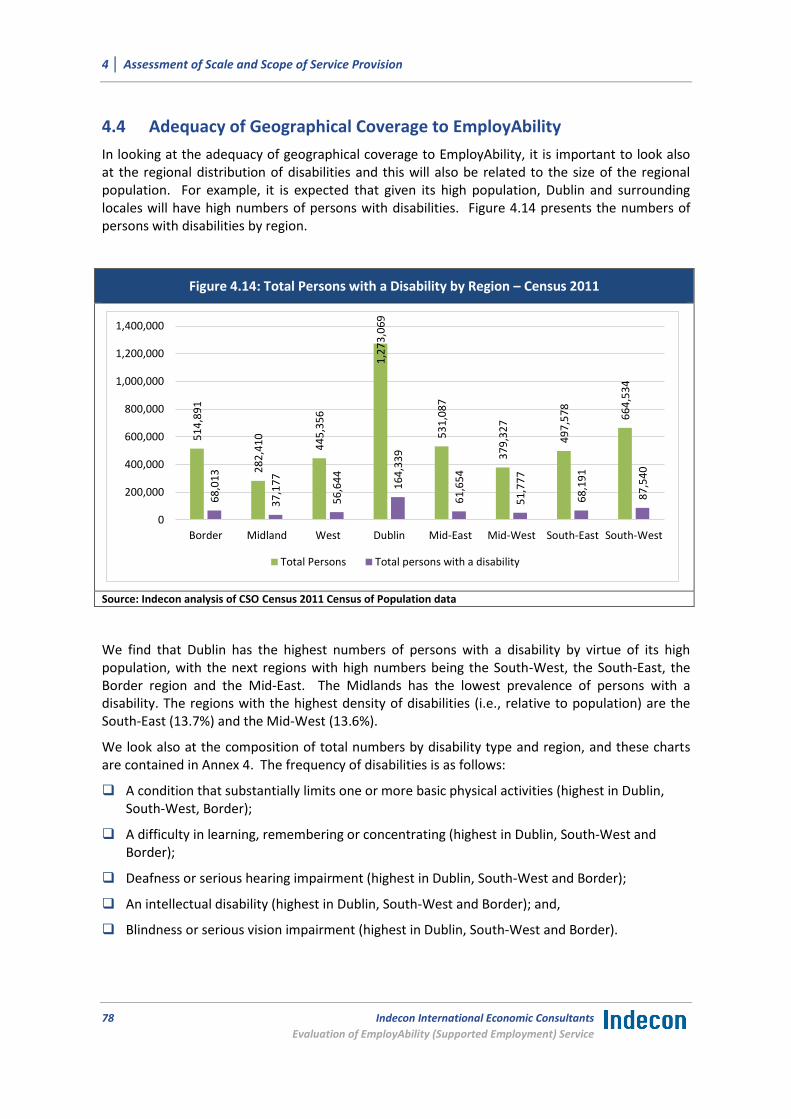
4 │ Assessment of Scale and Scope of Service Provision
78 Indecon International Economic Consultants
Evaluation of EmployAbility (Supported Employment) Service
4.4 Adequacy of Geographical Coverage to EmployAbility
In looking at the adequacy of geographical coverage to EmployAbility, it is important to look also at the regional distribution of disabilities and this will also be related to the size of the regional population. For example, it is expected that given its high population, Dublin and surrounding locales will have high numbers of persons with disabilities. Figure 4.14 presents the numbers of persons with disabilities by region.
Figure 4.14: Total Persons with a Disability by Region – Census 2011
Source: Indecon analysis of CSO Census 2011 Census of Population data
We find that Dublin has the highest numbers of persons with a disability by virtue of its high population, with the next regions with high numbers being the South-West, the South-East, the Border region and the Mid-East. The Midlands has the lowest prevalence of persons with a disability. The regions with the highest density of disabilities (i.e., relative to population) are the South-East (13.7%) and the Mid-West (13.6%).
We look also at the composition of total numbers by disability type and region, and these charts are contained in Annex 4. The frequency of disabilities is as follows:
A condition that substantially limits one or more basic physical activities (highest in Dublin, South-West, Border);
A difficulty in learning, remembering or concentrating (highest in Dublin, South-West and Border);
Deafness or serious hearing impairment (highest in Dublin, South-West and Border);
An intellectual disability (highest in Dublin, South-West and Border); and,
Blindness or serious vision impairment (highest in Dublin, South-West and Border).
51
4,8
91
28
2,4
10
44
5,3
56
1,2
73
,06
9
53
1,0
87
37
9,3
27
49
7,5
78
66
4,5
34
68
,01
3
37
,17
7
56
,64
4
16
4,3
39
61
,65
4
51
,77
7
68
,19
1
87
,54
0
0
200,000
400,000
600,000
800,000
1,000,000
1,200,000
1,400,000
Border Midland West Dublin Mid-East Mid-West South-East South-West
Total Persons Total persons with a disability

4 │ Assessment of Scale and Scope of Service Provision
Indecon International Economic Consultants
Evaluation of EmployAbility (Supported Employment) Service
79
The map below shows the counties in Ireland ranked by the numbers of people with disabilities. We see that Dublin, Kildare, Cork, Galway and Donegal have high numbers of people with disabilities (i.e., between 22,000 and 78,000).
Figure 4.15: Number of People with a Disability by County
Source: Indecon analysis of CSO data Note: Data based on Census of Population 2011. In the legend to this map, the distribution is divided into quartiles. However, as is clear from the map, 25% of the distribution lies in the range between 21,000 and 78,000.

4 │ Assessment of Scale and Scope of Service Provision
80 Indecon International Economic Consultants
Evaluation of EmployAbility (Supported Employment) Service
It is also instructive to consider the density of persons with disabilities by county, i.e., the number of people with a disability as a percentage of the total population in each county. Figure 4.16 plots the density of people with a disability by county. We see that the counties with the highest numbers of people with a disability as a percentage of the total population in the county (between 14% and 18%) are North Dublin, South Tipperary, Longford, Sligo and Donegal.
Figure 4.16: Population with a Disability as a Percentage of Total Population by County
Source: Indecon analysis of CSO data Note: Data based on Census of Population 2011. In the legend to this map, the distribution is divided into quartiles.
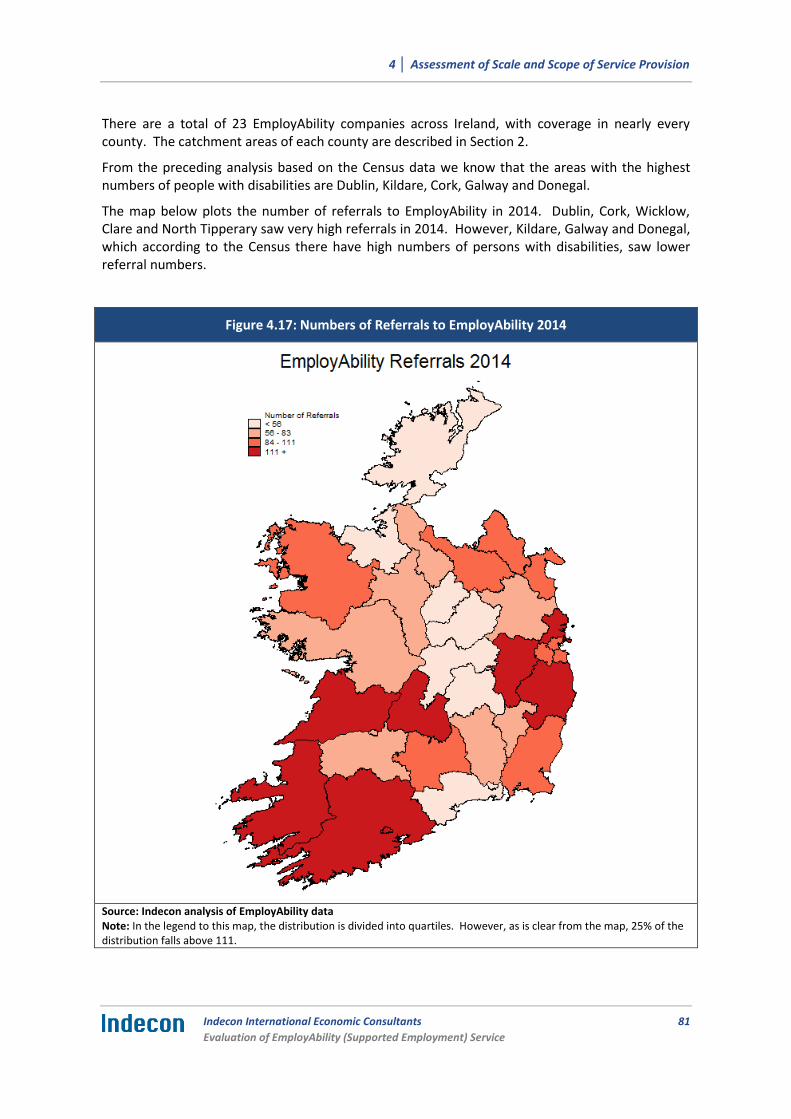
4 │ Assessment of Scale and Scope of Service Provision
Indecon International Economic Consultants
Evaluation of EmployAbility (Supported Employment) Service
81
There are a total of 23 EmployAbility companies across Ireland, with coverage in nearly every county. The catchment areas of each county are described in Section 2.
From the preceding analysis based on the Census data we know that the areas with the highest numbers of people with disabilities are Dublin, Kildare, Cork, Galway and Donegal.
The map below plots the number of referrals to EmployAbility in 2014. Dublin, Cork, Wicklow, Clare and North Tipperary saw very high referrals in 2014. However, Kildare, Galway and Donegal, which according to the Census there have high numbers of persons with disabilities, saw lower referral numbers.
Figure 4.17: Numbers of Referrals to EmployAbility 2014
Source: Indecon analysis of EmployAbility data Note: In the legend to this map, the distribution is divided into quartiles. However, as is clear from the map, 25% of the distribution falls above 111.
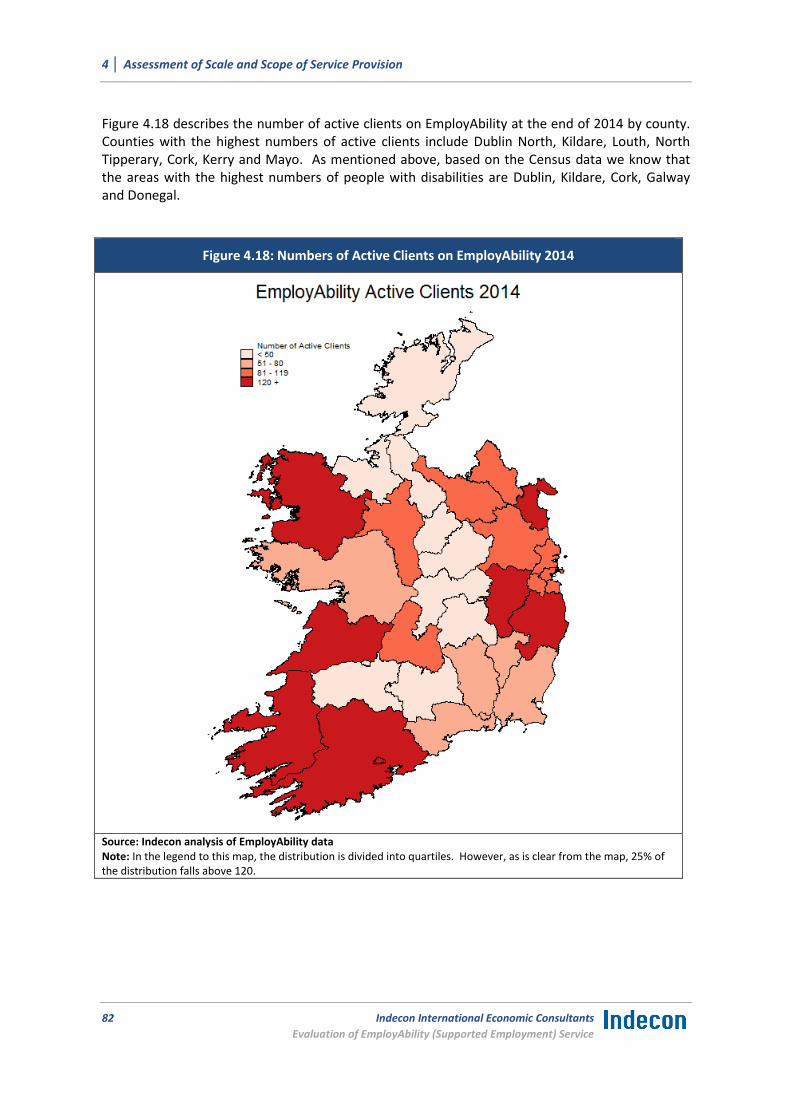
4 │ Assessment of Scale and Scope of Service Provision
82 Indecon International Economic Consultants
Evaluation of EmployAbility (Supported Employment) Service
Figure 4.18 describes the number of active clients on EmployAbility at the end of 2014 by county. Counties with the highest numbers of active clients include Dublin North, Kildare, Louth, North Tipperary, Cork, Kerry and Mayo. As mentioned above, based on the Census data we know that the areas with the highest numbers of people with disabilities are Dublin, Kildare, Cork, Galway and Donegal.
Figure 4.18: Numbers of Active Clients on EmployAbility 2014
Source: Indecon analysis of EmployAbility data Note: In the legend to this map, the distribution is divided into quartiles. However, as is clear from the map, 25% of the distribution falls above 120.
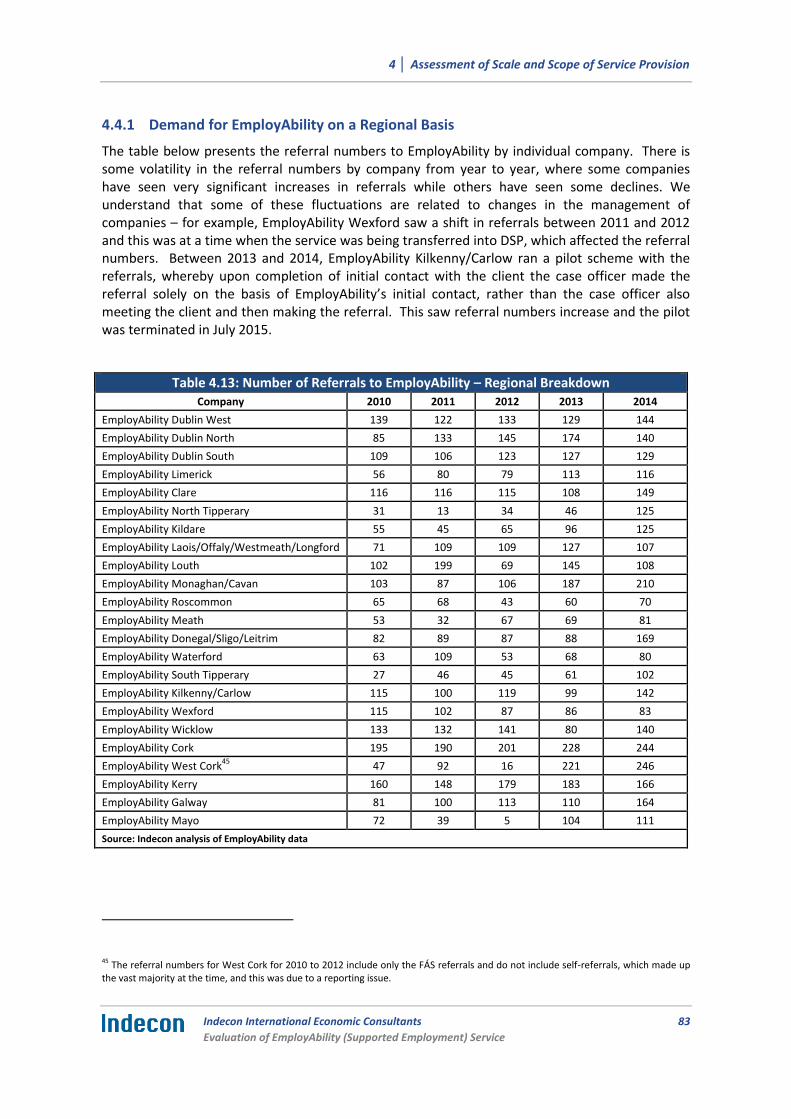
4 │ Assessment of Scale and Scope of Service Provision
Indecon International Economic Consultants
Evaluation of EmployAbility (Supported Employment) Service
83
4.4.1 Demand for EmployAbility on a Regional Basis
The table below presents the referral numbers to EmployAbility by individual company. There is some volatility in the referral numbers by company from year to year, where some companies have seen very significant increases in referrals while others have seen some declines. We understand that some of these fluctuations are related to changes in the management of companies – for example, EmployAbility Wexford saw a shift in referrals between 2011 and 2012 and this was at a time when the service was being transferred into DSP, which affected the referral numbers. Between 2013 and 2014, EmployAbility Kilkenny/Carlow ran a pilot scheme with the referrals, whereby upon completion of initial contact with the client the case officer made the referral solely on the basis of EmployAbility’s initial contact, rather than the case officer also meeting the client and then making the referral. This saw referral numbers increase and the pilot was terminated in July 2015.
Table 4.13: Number of Referrals to EmployAbility – Regional Breakdown Company 2010 2011 2012 2013 2014
EmployAbility Dublin West 139 122 133 129 144
EmployAbility Dublin North 85 133 145 174 140
EmployAbility Dublin South 109 106 123 127 129
EmployAbility Limerick 56 80 79 113 116
EmployAbility Clare 116 116 115 108 149
EmployAbility North Tipperary 31 13 34 46 125
EmployAbility Kildare 55 45 65 96 125
EmployAbility Laois/Offaly/Westmeath/Longford 71 109 109 127 107
EmployAbility Louth 102 199 69 145 108
EmployAbility Monaghan/Cavan 103 87 106 187 210
EmployAbility Roscommon 65 68 43 60 70
EmployAbility Meath 53 32 67 69 81
EmployAbility Donegal/Sligo/Leitrim 82 89 87 88 169
EmployAbility Waterford 63 109 53 68 80
EmployAbility South Tipperary 27 46 45 61 102
EmployAbility Kilkenny/Carlow 115 100 119 99 142
EmployAbility Wexford 115 102 87 86 83
EmployAbility Wicklow 133 132 141 80 140
EmployAbility Cork 195 190 201 228 244
EmployAbility West Cork45 47 92 16 221 246
EmployAbility Kerry 160 148 179 183 166
EmployAbility Galway 81 100 113 110 164
EmployAbility Mayo 72 39 5 104 111
Source: Indecon analysis of EmployAbility data
45 The referral numbers for West Cork for 2010 to 2012 include only the FÁS referrals and do not include self-referrals, which made up the vast majority at the time, and this was due to a reporting issue.

4 │ Assessment of Scale and Scope of Service Provision
84 Indecon International Economic Consultants
Evaluation of EmployAbility (Supported Employment) Service
Table 4.14 outlines the numbers in receipt of a disability-related social welfare payment during 2014 (latest available year for which we have data). Large numbers of recipients are clustered around Dublin, Cork, Galway, Tipperary, Mayo, Wexford and Limerick.
Table 4.14: Recipients of Social Welfare Payments by County in 2014 Disability Allowance Illness Benefit Invalidity Pension
Carlow 1,747 1,138 946
Cavan 1,593 953 692
Clare 2,708 1,123 1,143
Cork 13,752 7,386 7,216
Donegal 4,796 1,856 1,542
Dublin 27,813 14,416 13,789
Galway 6,403 2,387 1,970
Kerry 4,241 1,622 1,524
Kildare 3,701 2,641 2,211
Kilkenny 2146 951 951
Laois 1871 858 858
Leitrim 791 473 458
Limerick 5,825 2,834 3,174
Longford 1,273 529 574
Louth 3,013 2,260 1,805
Mayo 3,674 1,518 1,392
Meath 2,906 2,534 1,624
Monaghan 1304 780 538
Offaly 1,899 1,028 1,100
Roscommon 1584 754 784
Sligo 1858 890 824
Tipperary 5,040 1,863 2,134
Waterford 3,020 1,509 1,552
Westmeath 2,214 1,065 1,219
Wexford 3,946 1,726 1,988
Wicklow 2,970 1,597 1,399
Others 9 333 816
Total 112,097 57,024 54,223
Source: Statistical Information on Social Welfare Services 2014
It is also instructive to relate the numbers on social welfare payments above to the numbers being referred to EmployAbility to obtain a picture of the county level demand for the service. The table overleaf indicates the percentages of the potential client base that EmployAbility is meeting on a county basis. This is undertaken using a similar approach to that presented in the analysis in Table 4.11 above. While precise assessment is not possible due to the need to make a number of adjustments to minimise potential overestimation, the analysis suggests substantial variation (of between 4% and 27% of referrals or active clients) at county level in relation to the extent to which EmployAbility services are meeting local demand for supported employment services.
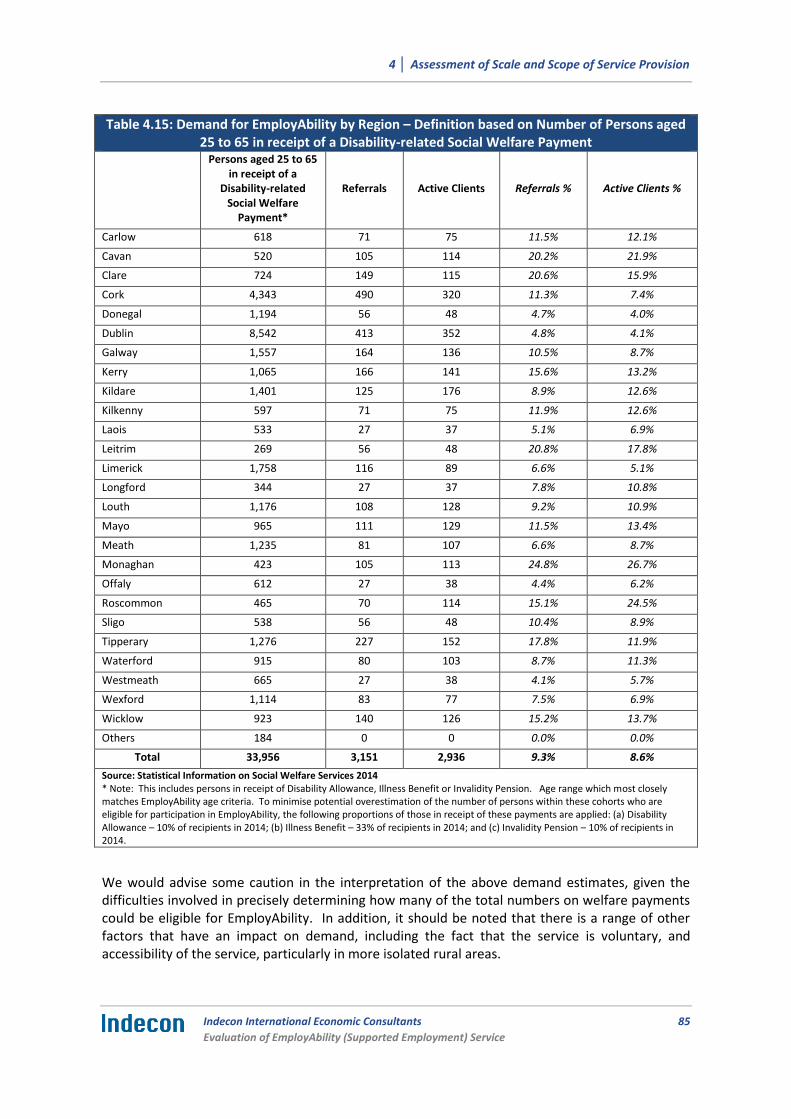
4 │ Assessment of Scale and Scope of Service Provision
Indecon International Economic Consultants
Evaluation of EmployAbility (Supported Employment) Service
85
Table 4.15: Demand for EmployAbility by Region – Definition based on Number of Persons aged 25 to 65 in receipt of a Disability-related Social Welfare Payment
Persons aged 25 to 65 in receipt of a
Disability-related Social Welfare
Payment*
Referrals Active Clients Referrals % Active Clients %
Carlow 618 71 75 11.5% 12.1%
Cavan 520 105 114 20.2% 21.9%
Clare 724 149 115 20.6% 15.9%
Cork 4,343 490 320 11.3% 7.4%
Donegal 1,194 56 48 4.7% 4.0%
Dublin 8,542 413 352 4.8% 4.1%
Galway 1,557 164 136 10.5% 8.7%
Kerry 1,065 166 141 15.6% 13.2%
Kildare 1,401 125 176 8.9% 12.6%
Kilkenny 597 71 75 11.9% 12.6%
Laois 533 27 37 5.1% 6.9%
Leitrim 269 56 48 20.8% 17.8%
Limerick 1,758 116 89 6.6% 5.1%
Longford 344 27 37 7.8% 10.8%
Louth 1,176 108 128 9.2% 10.9%
Mayo 965 111 129 11.5% 13.4%
Meath 1,235 81 107 6.6% 8.7%
Monaghan 423 105 113 24.8% 26.7%
Offaly 612 27 38 4.4% 6.2%
Roscommon 465 70 114 15.1% 24.5%
Sligo 538 56 48 10.4% 8.9%
Tipperary 1,276 227 152 17.8% 11.9%
Waterford 915 80 103 8.7% 11.3%
Westmeath 665 27 38 4.1% 5.7%
Wexford 1,114 83 77 7.5% 6.9%
Wicklow 923 140 126 15.2% 13.7%
Others 184 0 0 0.0% 0.0%
Total 33,956 3,151 2,936 9.3% 8.6%
Source: Statistical Information on Social Welfare Services 2014 * Note: This includes persons in receipt of Disability Allowance, Illness Benefit or Invalidity Pension. Age range which most closely matches EmployAbility age criteria. To minimise potential overestimation of the number of persons within these cohorts who are eligible for participation in EmployAbility, the following proportions of those in receipt of these payments are applied: (a) Disability Allowance – 10% of recipients in 2014; (b) Illness Benefit – 33% of recipients in 2014; and (c) Invalidity Pension – 10% of recipients in 2014.
We would advise some caution in the interpretation of the above demand estimates, given the difficulties involved in precisely determining how many of the total numbers on welfare payments could be eligible for EmployAbility. In addition, it should be noted that there is a range of other factors that have an impact on demand, including the fact that the service is voluntary, and accessibility of the service, particularly in more isolated rural areas.

4 │ Assessment of Scale and Scope of Service Provision
86 Indecon International Economic Consultants
Evaluation of EmployAbility (Supported Employment) Service
4.5 Summary of Findings
This section assessed the scale and the scope of service provision, including the demand for supported employment services and the adequacy of the geographical coverage of EmployAbility. The main findings were as follows:
Based on the 2011 Census of Population, there were approximately 595,000 persons with a disability in Ireland. As a proportion of the overall population of the State, the number of people with a disability represented 13% of people in 2011.
The Census also indicates that there were 162,681 people with disabilities in the labour force in 2011, implying a labour force participation rate among persons with a disability of 30%. Of this, a total of 112,502 people (69%) were employed, while 50,179 individuals (31%) were unemployed. Providing the opportunity for the latter cohort in particular to take up independent open labour market employment, where they wish to so, represents a key objective of supported employment programmes such as EmployAbility.
In looking at the highest educational attainment levels of people with a disability, we find that while low numbers have no formal education, significant numbers have achieved only primary education, with some having achieved lower and upper secondary education. Low numbers have achieved any post-school level education such as technical/vocational education, certificates/diploma or bachelor degrees. This would suggest that there is a need to provide further oportunities to increase the educational attainment levels of people with disabilities in Ireland.
While the above findings based on Census 2011 data suggest that there is significant scope for EmployAbility to continue and expand its service in improving the employment opportunities and outcomes for people with disabilities, it should be recognised that the service is voluntary, in that participation by persons with disabilities is not compulsory and this, along with population numbers and eligibility, will influence the potential demand for the service.
In 2013, 106,279 people were in receipt of a DSP Disability Allowance, while 58,990 were in receipt of Illness Benefit and 53,196 received an Invalidity Pension. Of the total number of 106,279 on Disability Allowance, 101,305 were between the ages of 20 and 65.
Due to the range of factors involved, it is difficult to identify with precision the overall demand for supported employment services. Indecon has examined a number of measures of potential demand. If one considers a definiton based on the total number of people with a disability aged 18 to 65 (the age cohort that are eligible for EmployAbility) that are outside the labour force, this definition suggests that EmployAbility service referrals and client numbers represented less than 2% of this cohort in 2014.
Based on a second definition, if one relates EmployAbility referral and client numbers to the numbers of people with a disability aged 18 to 65 who are unemployed, this suggests that EmployAbility is meeting about 6-7% of the demand for supported employment (based on 2014 figures). This may provide the closest representation of demand for the service.
We also examined a third definition, based on the numbers of persons in the relevant age group who are in receipt of a disability-related social welfare payments (Disability Allowance, Illness Benefit and Invalidity Pension). While a precise assessment is not possible due to the need to make a number of adjustments to minimise potential
4 │ Assessment of Scale and Scope of Service Provision
Indecon International Economic Consultants
Evaluation of EmployAbility (Supported Employment) Service
87
overestimation, the analysis based on this definition would suggest that EmployAbility meets approximately about 8-9% of the potential demand for supported employment services (based on 2014 data). The analysis also suggests substantial variation (of between 4% and 27% of referrals or active clients) at county level in relation to the extent to which EmployAbility services are meeting local demand for supported employment services.
A further measure of the demand for supported employment services is the number on a waiting list for the EmployAbility service. The waiting list for the service has increased since 2013 and by May 2015 the number stood at 584, with 14% waiting more than 16 weeks to obtain a place. Most of those are waiting between two and 12 weeks. The data demonstrates the rising demand for the service.
In considering the adequacy of the geographical coverage to EmployAbility, the regional distribution of persons with disabilities around Ireland was examined. When we examine the density of disabilities by county, i.e., the number of people with a disability as a percentage of the total population in that county, we find that the counties with the highest numbers of people with a disability as a percentage of the total population in the county (between 14% and 18%) are North Dublin, South Tipperary, Longford, Sligo and Donegal.
Reference to EmployAbility data indicated that in 2014, Dublin, Cork, Wicklow, Clare and North Tipperary saw the highest numbers of referrals to the service. However, despite the Census indicating the presence of high numbers of persons with disabilities, Kildare, Galway and Donegal saw lower referral numbers.
5 │ Assessment of Governance Structures
88 Indecon International Economic Consultants
Evaluation of EmployAbility (Supported Employment) Service
5 Assessment of Governance Structures
5.1 Introduction
It is important that the EmployAbility service meets the standards of corporate governance and accountability expected of publicly funded organisations. This section considers the issue of the governance of EmployAbility, and assesses the appropriateness of existing governance structures, including their effectiveness and the relationship between EmployAbility companies and the Department of Social Protection. Consideration is also given to how governance structures might be enhanced in the future. The assessment is informed through Indecon’s engagement with EmployAbility companies including the EmployAbility Directors’ Forum, the Department of Social Protection and the inputs/views of employer organisations who have worked with EmployAbility and organisations working in the wider disability sector.
5.2 Assessment of Effectiveness of Current Structures
5.2.1 Overview description of existing governance structures
In assessing the appropriateness and effectiveness of governance structures, it is instructive to firstly provide an overview of the existing structures. The main features of the existing framework for governance of the EmployAbility service are identified in the schematic overleaf, including the relationship between EmployAbility companies and the Department of Social Protection, and the legal and management structures pertaining within each of the companies. Each aspect is elaborated upon overleaf.
EmployAbility Operating Standards
The service overall is governed through the implementation of a set of Operating Standards as well as contractual agreements with individual service providers. An Operating Standards guide for the predecessor to EmployAbility, namely the FAS Supported Employment Service, was last developed and circulated in 2011. The guide sets down the overarching framework for the operation and governance of the service and covers the following aspects:
Mission Statement FÁS Supported Employment Service;
Aims and Objectives of the Supported Employment Service;
Programme Structure;
Eligibility Criteria;
Definitions;
Roles and Responsibilities;
The Role of the SUP Sponsor Organisation;
The role of FÁS; and,
The Role of the Employer.
An up-to-date set of operating standards has not, however, been developed for the EmployAbility service, since the service was taken within the direct remit of the Department of Social Protection.

5 │ Assessment of Governance Structures
Indecon International Economic Consultants
Evaluation of EmployAbility (Supported Employment) Service
89
Figure 5.1: Schematic Overview of EmployAbility Governance Structures
Source: Department of Social Protection; EmployAbility Companies; Supported Employment Services Operating Standards.
5.2.2 EmployAbility structures
Number of companies
A particular issue in relation to the overall structures concerns the number and regional spread of EmployAbility companies. There are 23 companies operating the service, as shown in Table 2.1. The catchment areas served, however, vary significantly in both population and geographic terms. The rationale for the number of services is not clear, and examination of the data on service activity, including referral and client numbers, has shown substantial variation in demand and service activity levels across the companies. At issue concerns the appropriateness of these delivery structures from the perspective of maximising effectiveness, efficiency and value for money in the utilisation of public funds.
As indicated in Section 3.6, EmployAbility programme expenditure is high relative to the quantum and sustainability of employment outcomes achieved. In this regard, we believe there is a need to examine the configuration, including the number and geographic spread, and the scope for streamlining existing services to maximise the potential to leverage economies of scale in service
Supported Employment Service (SUP) Sponsor Organisations:
EmployAbility Companies
23 Companies:
(a) Independent Legal Entities
(b) Each Not-for-Profit Company Limited by Guarantee, and without Share
Capital
Department of Social Protection
Including:
Regional Managers, Disability and Illness Policy Unit, Internal Audit Unit
Board of Management of Each EmployAbility Company
(a) Minimum of 2 Directors
(b) Also Board Members
(c) All Directors and Board Members are Voluntary
(d) Varying Board Sizes and Skills/Background of Directors/Members
Annual Funding
Contract with
Individual
EmployAbility
Companies
EmployAbility Staff (Paid):
(a) Coordinators
(b) Job Coaches
(c) Support Staff
EmployAbility
Operating
Standards

5 │ Assessment of Governance Structures
90 Indecon International Economic Consultants
Evaluation of EmployAbility (Supported Employment) Service
provision and to deliver improved value for money. A detailed assessment of service delivery costs across all EmployAbility companies was not feasible as part of this evaluation. Of importance in this context concerns the unit costs of service delivery across the EmployAbility companies. The table below presents an analysis of comparative unit costs of service provision across companies, computed through relating overall annual expenditures to the number of active clients within each company over a three-year period from 2012 to 2014. It is noteworthy that there is a strong negative correlation between the number of clients on the one hand and the average expenditure per client on the other (correlation of -0.62, based on the average expenditure per client over the period relative to the number of clients in 2014). For example, it was found that the average expenditure per client in the service with the lowest number of clients was 63% higher than in the company with the highest number of clients.
Table 5.1: Analysis of Average Unit Costs of Service Provision by EmployAbility Company – Average Expenditure per Client – 2012-2014
Company
Average Expenditure per Active Client - € No. of Active Clients 2014
2012 2013 2014 Average
2012-2014 - € per Client
EmployAbility Monaghan/Cavan 1,862 2,205 2,088 2,052 227
EmployAbility Kildare 2,441 3,200 2,694 2,778 176
EmployAbility Cork 2,497 2,465 2,811 2,591 172
EmployAbility Dublin West 3,003 3,302 2,578 2,961 156
EmployAbility Midlands 2,878 3,454 2,686 3,006 150
EmployAbility Kilkenny 3,575 3,070 2,580 3,075 150
EmployAbility West Cork 2,754 4,670 2,320 3,248 148
EmployAbility North West 3,172 2,460 2,955 2,862 144
EmployAbility Kerry 3,076 2,576 2,998 2,883 141
EmployAbility Galway 2,823 3,113 2,170 2,702 136
EmployAbility Mayo 3,101 3,846 2,760 3,236 129
EmployAbility Louth 2,196 2,001 2,310 2,169 128
EmployAbility Wicklow 4,002 3,178 2,869 3,350 126
EmployAbility Clare 3,439 3,741 3,485 3,555 115
EmployAbility Roscommon 3,346 3,165 3,333 3,281 114
EmployAbility Meath 3,094 3,539 2,682 3,105 107
EmployAbility Dublin North 2,624 3,623 3,199 3,149 104
EmployAbility Waterford 2,840 4,369 3,067 3,426 103
EmployAbility Dublin South 2,807 3,847 3,527 3,393 92
EmployAbility Limerick 4,987 2,140 4,278 3,802 89
EmployAbility Wexford 3,482 3,715 3,027 3,408 77
EmployAbility North Tipperary 2,339 2,431 2,917 2,562 76
EmployAbility South Tipperary 3,763 2,758 3,516 3,346 76
Source: Indecon analysis of data supplied by DSP
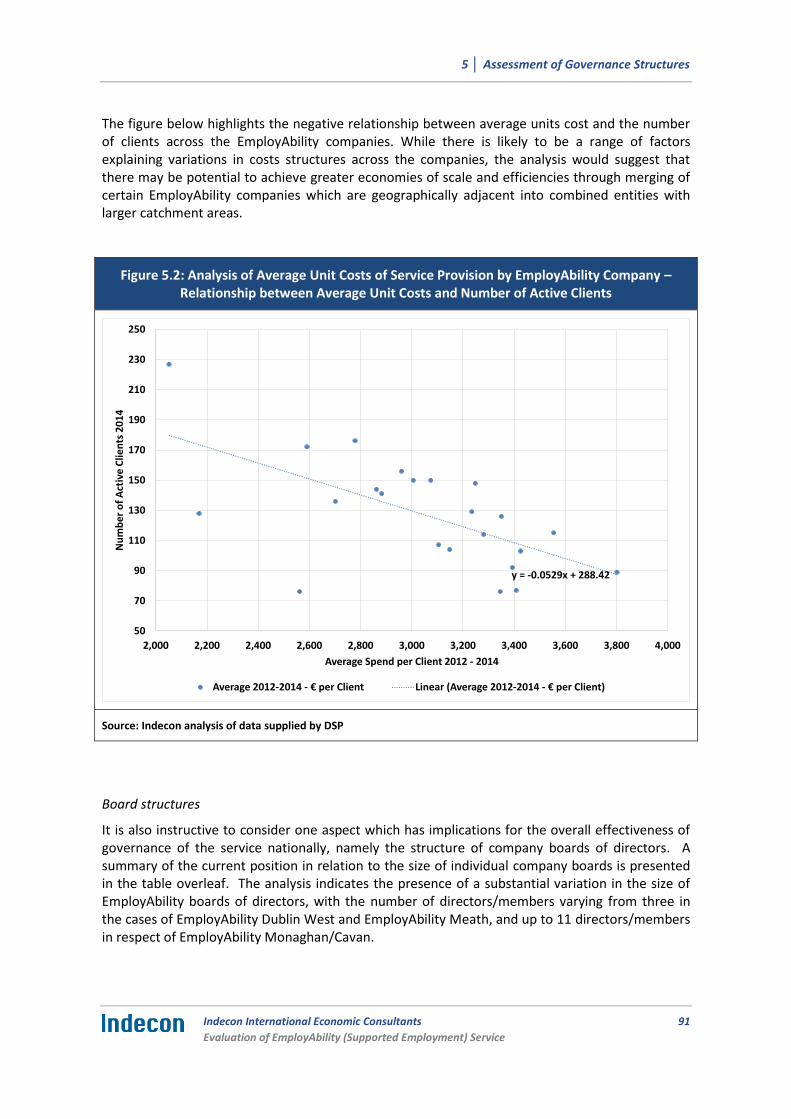
5 │ Assessment of Governance Structures
Indecon International Economic Consultants
Evaluation of EmployAbility (Supported Employment) Service
91
The figure below highlights the negative relationship between average units cost and the number of clients across the EmployAbility companies. While there is likely to be a range of factors explaining variations in costs structures across the companies, the analysis would suggest that there may be potential to achieve greater economies of scale and efficiencies through merging of certain EmployAbility companies which are geographically adjacent into combined entities with larger catchment areas.
Figure 5.2: Analysis of Average Unit Costs of Service Provision by EmployAbility Company – Relationship between Average Unit Costs and Number of Active Clients
Source: Indecon analysis of data supplied by DSP
Board structures
It is also instructive to consider one aspect which has implications for the overall effectiveness of governance of the service nationally, namely the structure of company boards of directors. A summary of the current position in relation to the size of individual company boards is presented in the table overleaf. The analysis indicates the presence of a substantial variation in the size of EmployAbility boards of directors, with the number of directors/members varying from three in the cases of EmployAbility Dublin West and EmployAbility Meath, and up to 11 directors/members in respect of EmployAbility Monaghan/Cavan.
y = -0.0529x + 288.42
50
70
90
110
130
150
170
190
210
230
250
2,000 2,200 2,400 2,600 2,800 3,000 3,200 3,400 3,600 3,800 4,000
Nu
mb
er
of
Act
ive
Clie
nts
20
14
Average Spend per Client 2012 - 2014
Average 2012-2014 - € per Client Linear (Average 2012-2014 - € per Client)

5 │ Assessment of Governance Structures
92 Indecon International Economic Consultants
Evaluation of EmployAbility (Supported Employment) Service
Table 5.2: EmployAbility Companies – Company Structures – Size of Boards of Directors
Company Board of Directors – No. of Persons – 2014/15
EmployAbility Dublin West 3
EmployAbility Dublin North 6
EmployAbility Dublin South 4
EmployAbility Limerick 4
EmployAbility Clare 9
EmployAbility North Tipperary 6
EmployAbility Kildare 7
EmployAbility Laois/Offaly/Westmeath/Longford 6
EmployAbility Louth 4
EmployAbility Monaghan/Cavan 11
EmployAbility Roscommon 5
EmployAbility Meath 3
EmployAbility Donegal/Sligo/Leitrim 7
EmployAbility Waterford 7
EmployAbility South Tipperary 5
EmployAbility Kilkenny/Carlow 6
EmployAbility Wexford 6
EmployAbility Wicklow 7
EmployAbility Cork 6
EmployAbility West Cork 4
EmployAbility Kerry 6
EmployAbility Galway 6
EmployAbility Mayo 7
Source: Indecon analysis, based on review of EmployAbility company-level performance reviews (2014) and business plans (2015) supplied by Department of Social Protection
The reasons behind the wide variation in the size of EmployAbility boards of directors are not clear. The most recent corporate legislation stipulates that companies limited by guarantee must have a minimum of two directors. Additional members may be appropriate where specialist expertise in required. However, overall board size should be kept to a defined maximum.
5 │ Assessment of Governance Structures
Indecon International Economic Consultants
Evaluation of EmployAbility (Supported Employment) Service
93
5.2.3 Relationship between EmployAbility Companies and Department of Social Protection
The supported employment services are provided by 23 EmployAbility companies across the State, which are otherwise known as Supported Employment Service (SUP) Sponsor Organisations. Each company is an independent legal entity, limited by State guarantee, and is a not-for-profit organisation without a share capital. Each company/SUP Sponsor Organisation is fully State-funded.
Contractual agreements
The relationship between individual companies and the Department of Social Protection is governed by an annual contractual agreement. This is a legal document, which sets out the terms and conditions which apply to the operation of the Support Employment Service in the case of each company. Perusal of a sample of the most recent contracts between the Department and individual companies indicated the inclusion of clauses pertaining, inter alia, to the following aspects:
Funding Term – annual term;
Funding conditions, which, inter alia, include specification of the funding level for the year and the operation of the service in lines with the provisions set out, including specification of service activities and outcomes, with attendant targets; and that funding is subject to review and satisfactory performance;
The obligations on the SUP Sponsor Organisation, including, inter alia, the service operating provisions; the provision to DSP of regular reporting on performance; the evaluation and review of progress; and the need to comply with all requirements of company law;
Staffing levels in the service;
Payments of funding contracted, including expenditure claim procedures;
Maintenance of accounts and records; and,
Audit and inspection processes.
Individual contractual agreements with the EmployAbility companies follow the same template, in terms of the above common features, but differ in relation to the agreed activities and outcomes, and funding and staffing levels. We understand that these aspects are negotiated between the companies and the Department on an annual basis. The contractual agreements also include a six-month review clause, whereby the Department can undertake a six-monthly review of the provision of EmployAbility services and the companies’ obligations under the agreement.
5 │ Assessment of Governance Structures
94 Indecon International Economic Consultants
Evaluation of EmployAbility (Supported Employment) Service
Annual Business Plans and Performance Reviews
One of the requirements set out in the Operating Standards is that each EmployAbility company/sponsor organisation must prepare and submit an annual performance review of the previous year’s activities and achievements, and a business plan for the forthcoming year. This comprises the following elements:
Review of current year’s activity, including reference to Key Performance Indicators, and details of successful and unsuccessful outcomes;
Mission statement of organisation;
Project organisation details;
Structure/legal status;
Composition of Board of Directors;
Operations, including staffing assignment;
Sourcing of service clients;
Service provision, in relation to how the service sources and supports employer organisations in the service’s geographical area, and facilitates clients to become independent in the open labour market on completion of the programme;
Expected outcomes for the coming year, including KPIs, and how these will be achieved during the year;
Recruitment of clients, including linkage with DSP Employment Services/LES and other service providers;
Promotion of the service in the catchment area;
Further information; and,
Financial details, including funding request for coming year and breakdown of costs.
Indecon’s inspection of the performance reviews for 2014 and business plans for 2015, submitted to DSP by each EmployAbility company, indicated broad adherence to the requirements set out on the templates, although the depth of information and analysis provided in respect of each of the above dimensions varied significantly across individual companies.
Ongoing (intra-year) interaction between EmployAbility companies and DSP
In relation to ongoing (intra-year) interaction between individual EmployAbility companies and the Department, we understand that this includes the following:
The provision of monthly accounts and expenditure claims to DSP, which include income and expenditure records, bank statements and reconciliations, and salary costs. These are reviewed and sanctioned/cleared by local DSP officials and sent to the Department’s Finance Section for verification and payment.

5 │ Assessment of Governance Structures
Indecon International Economic Consultants
Evaluation of EmployAbility (Supported Employment) Service
95
A Statistical Summary (SUP14) report is submitted to the Department by each company on a monthly basis. This report details the KPIs described in Section 3.7.1 including monthly and year-to-date/cumulative numbers of active clients on the programme, and the stage on the programme for each participant. It also details the number of exits from the programme and the outcomes from these exits, including jobs/employment obtained and sustained for at least six months. Each monthly report is signed off by the EmployAbility Coordinator and the Chairman of each company’s board.
In line with company law, annual audited accounts are prepared by each company. After board approval, these accounts are presented to the Department and submitted to the Companies Registration Office within six months of the financial year-end.
The Department undertakes an annual on-site operational and financial monitoring review/audit. Further audits may be undertaken, if deemed appropriate, by the Department’s Internal Audit Unit.
Periodic visits to or contact with employer organisations may take place, to verify participants are employed as reported.
It was not within the scope or feasibility of this evaluation to independently verify and assess the extent to which each of the above elements have taken place at the level of each EmployAbility company. However, Indecon understands from interviews with a selection of frontline DSP officials that the Department operates strict governance and control procedures in relation to financial accountability in particular, including in relation to ongoing processes for sanctioning of expenditure and release of funds, and in monitoring and auditing financial management within the companies.
Some variance in experience was reported among Departmental officials interviewed by Indecon in relation to the visibility of the outcomes achieved by EmployAbility companies as a result of sanctioned expenditures. This may in part relate to varying levels of visibility of company-level activities and outcomes among frontline officials, who are focussed on ensuring financial control. We understand in this respect that SUP14 statistical returns are submitted in paper form only to local DSP offices, and that no formalised central reporting system is in operation at national level between EmployAbility as a whole, and the Department. Therefore, there is a need for enhanced detail on quality of outcomes and other data to facilitate assessment of value for money and the effectiveness of the service.
5 │ Assessment of Governance Structures
96 Indecon International Economic Consultants
Evaluation of EmployAbility (Supported Employment) Service
Management and coordination at national level
In relation to overall national management and coordination of the EmployAbility service, a particular issue, which warrants consideration from the perspective of effective governance, concerns the absence of formalised mechanisms at national level across EmployAbility companies to ensure consistent implementation of appropriate governance approaches. It is important that each EmployAbility company adheres to a consistent corporate governance code and this is an area where we believe the Department of Social Protection should make such a provision to ensure governance requirements are met across the service.
The National EmployAbility Service Directors Forum Limited (NESDF) was incorporated in January 2011 (as a not-for-profit company limited by guarantee and without share capital). The main objective of the organisation is to promote best practice in governance and delivery across the EmployAbility services. It was also intended that the Directors Forum would provide a support service to, and represent the interests of, the EmployAbility organisations engaged in the provision and development of employment services for persons with a disability and other disadvantaged groups.
One of the areas where the Directors Forum believes it can promote enhanced programme efficiency and effectiveness is in relation to governance. This includes the dissemination of best practice frameworks for corporate governance, including the Code of Practice for Good Governance of Community, Voluntary and Charitable Organisations in Ireland. Indecon understands that while a small number of EmployAbility companies have signed up to, or intend to sign up to this code, it is not applied consistently across all companies.
Client referral
Importantly, the Department of Social Protection must also clear the referral of all clients to the EmployAbility service. This process is undertaken by Departmental case officers in conjunction with individual EmployAbility companies, and ascertains the eligibility and suitability of individuals for support. Specific aspects and issues with regard to the access criteria for referral of prospective clients were highlighted in Section 3.8 of this review. This also considers the future role of the DSP INTREO service in referring clients to the service.
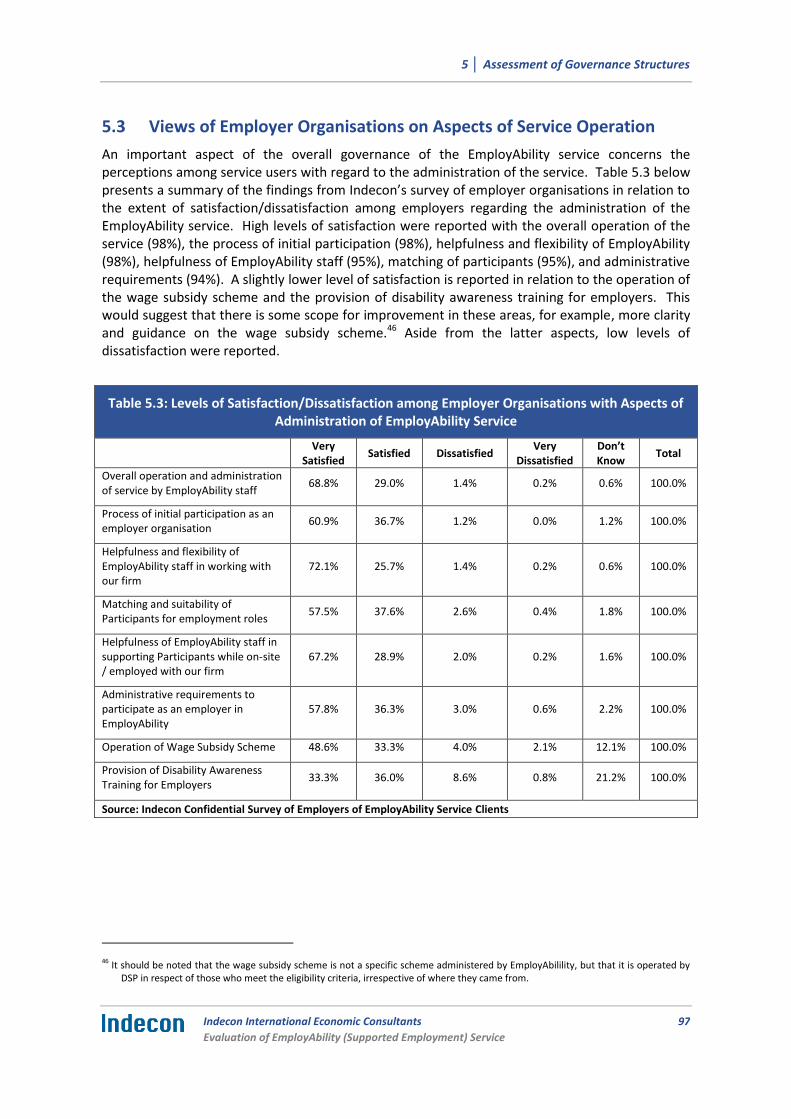
5 │ Assessment of Governance Structures
Indecon International Economic Consultants
Evaluation of EmployAbility (Supported Employment) Service
97
5.3 Views of Employer Organisations on Aspects of Service Operation
An important aspect of the overall governance of the EmployAbility service concerns the perceptions among service users with regard to the administration of the service. Table 5.3 below presents a summary of the findings from Indecon’s survey of employer organisations in relation to the extent of satisfaction/dissatisfaction among employers regarding the administration of the EmployAbility service. High levels of satisfaction were reported with the overall operation of the service (98%), the process of initial participation (98%), helpfulness and flexibility of EmployAbility (98%), helpfulness of EmployAbility staff (95%), matching of participants (95%), and administrative requirements (94%). A slightly lower level of satisfaction is reported in relation to the operation of the wage subsidy scheme and the provision of disability awareness training for employers. This would suggest that there is some scope for improvement in these areas, for example, more clarity and guidance on the wage subsidy scheme.46 Aside from the latter aspects, low levels of dissatisfaction were reported.
Table 5.3: Levels of Satisfaction/Dissatisfaction among Employer Organisations with Aspects of Administration of EmployAbility Service
Very
Satisfied Satisfied Dissatisfied
Very Dissatisfied
Don’t Know
Total
Overall operation and administration of service by EmployAbility staff
68.8% 29.0% 1.4% 0.2% 0.6% 100.0%
Process of initial participation as an employer organisation
60.9% 36.7% 1.2% 0.0% 1.2% 100.0%
Helpfulness and flexibility of EmployAbility staff in working with our firm
72.1% 25.7% 1.4% 0.2% 0.6% 100.0%
Matching and suitability of Participants for employment roles
57.5% 37.6% 2.6% 0.4% 1.8% 100.0%
Helpfulness of EmployAbility staff in supporting Participants while on-site / employed with our firm
67.2% 28.9% 2.0% 0.2% 1.6% 100.0%
Administrative requirements to participate as an employer in EmployAbility
57.8% 36.3% 3.0% 0.6% 2.2% 100.0%
Operation of Wage Subsidy Scheme 48.6% 33.3% 4.0% 2.1% 12.1% 100.0%
Provision of Disability Awareness Training for Employers
33.3% 36.0% 8.6% 0.8% 21.2% 100.0%
Source: Indecon Confidential Survey of Employers of EmployAbility Service Clients
46 It should be noted that the wage subsidy scheme is not a specific scheme administered by EmployAbilility, but that it is operated by
DSP in respect of those who meet the eligibility criteria, irrespective of where they came from.
5 │ Assessment of Governance Structures
98 Indecon International Economic Consultants
Evaluation of EmployAbility (Supported Employment) Service
5.4 Summary of Findings
This section considered the issue of the governance of EmployAbility, and assessed the appropriateness of existing governance structures, including their effectiveness and the relationship between EmployAbility companies and the Department of Social Protection. Consideration was also given to how governance structures might be enhanced in the future. The key findings in relation to the examination of governance structures are summarised below.
The service overall is governed through the implementation of a set of operating standards as well contractual agreements with individual service providers. An Operating Standards guide for the predecessor to EmployAbility, namely the FÁS Supported Employment Service, was last developed and circulated in 2011. However, an up-to-date set of operating standards has not been developed for EmployAbility since the service was taken within the direct remit of the Department of Social Protection.
An issue concerns the number and regional spread of EmployAbility companies. There are 23 companies operating the service. The catchment areas served, however, vary significantly in both population and geographic terms. The rationale for the number of services is not clear, and examination of the data on service activity, including referral and client numbers, has shown substantial variation in demand and service activity levels across the companies.
EmployAbility programme expenditure is high relative to the quantum and sustainability of employment outcomes achieved. In this regard, we believe there is a need to examine the configuration, including the number and geographic spread, and the scope for streamlining existing services to maximise the potential to leverage economies of scale in service provision and to deliver improved value for money. In this context, we believe there would be significant potential to consider the option of amalgamating services across regions which currently see relatively low levels of activity. In this respect, it is noteworthy that there is a strong negative correlation between the number of clients and the average expenditure per client across the EmployAbility companies. This would suggest that there may be potential to achieve greater economies of scale and efficiencies through merging of certain EmployAbility companies which are geographically adjacent into combined entities with larger catchment areas.
Indecon’s analysis of the structure of EmployAbility company boards of directors indicates the presence of a substantial variation in the size of boards. The reasons behind the wide variation in the size of EmployAbility boards of directors are not clear. The most recent corporate legislation stipulates that companies limited by guarantee must have a minimum of two directors. Additional members may be appropriate where specialist expertise in required. However, overall board size should be kept to a defined maximum.
One of the requirements set out in the Operating Standards is that each EmployAbility company/sponsor organisation must prepare and submit an annual performance review of the previous year’s activities and achievements, and a business plan for the forthcoming year. Indecon’s inspection of the performance reviews for 2014 and business plans for 2015, submitted to DSP by each EmployAbility company, indicated broad adherence to the requirements set out on the templates, although the depth of information and analysis provided in respect of each of the above dimensions varied significantly across individual companies.
5 │ Assessment of Governance Structures
Indecon International Economic Consultants
Evaluation of EmployAbility (Supported Employment) Service
99
We understand from discussions with a selection of frontline DSP officials who interact with EmployAbility companies that the Department operates strict governance and control procedures in relation to financial accountability in particular, including in relation to ongoing processes for sanctioning of expenditure and release of funds, and in monitoring and auditing financial management within the companies.
Some variance in experience was reported among Departmental officials interviewed by Indecon in relation to the visibility of the outcomes achieved by EmployAbility companies as a result of sanctioned expenditures. There is a need for enhanced detail on quality of outcomes and other data to facilitate assessment of value for money achieved and the effectiveness of the service.
Currently, there is an absence of formalised mechanisms at national level across EmployAbility companies to ensure consistent implementation of appropriate governance approaches and this is an area where we believe the Department of Social Protection should make such a provision to ensure that governance requirements are met across the service.
6 │ Overall Conclusions and Recommendations for Future Delivery of Service
100 Indecon International Economic Consultants
Evaluation of EmployAbility (Supported Employment) Service
6 Overall Conclusions and Recommendations for Future Delivery of Service
This section of the report ties together the preceding analysis to give an overall set of conclusions and recommendations on the current and future delivery of the EmployAbility service.
6.1 Conclusions from Evaluation
This report has completed an independent evaluation of the EmployAbility service (Supported Employment Service). In particular, the evaluation has examined the effectiveness and efficiency of the service; the appropriateness of the governance structures; and the scale and scope of service provision. It also presents proposals for the future delivery of the service.
Effectiveness and Efficiency
A summary of service activity levels and outcomes for EmployAbility over the period 2010-2014 is presented overleaf.
There has been a recent upward trend in the number of individuals referred to the EmployAbility service, with the number of referrals reaching a total of 3,151 in 2014, representing an increase of 39.1% on the level in 2010. It is likely that this increase in demand reflects a range of factors, including the impact of the economic recession. The service provided supports to a total of 2,936 active clients, while a total of 2,651 clients exited the service during 2014.
At a national level across the 23 EmployAbility companies, although the outcomes under both metrics have increased over the period, they remained below the target levels in 2014. The proportion of clients in employment with support from the service was 41.9%, while the percentage of clients exiting the programme while in employment was 33.6% in 2014. At individual company level, during 2014 only three out of the 23 companies achieved 50% or above for the percentage of clients in employment with support from the service, while only two companies attained the target for the percentage of clients exiting the programme while in employment.
There is a high level of client non-completion (47% in 2014) due to unsuitability, ill health or non-engagement. This impacts on potential outcomes and if non-completions are removed from the exit data this would suggest that 46.9% of clients exited the programme while in employment, although this still falls short of the target level. The high rate of non-completion also raises an issue regarding the appropriateness of the access criteria and the targeting of the programme, including the definition of ‘job ready’ in instances where the service may not be suitable for some individuals.
The progression analysis also showed that only 25.3% of clients (or 28% of exits) in 2014 remained in open labour market employment after six months without support from the service. This suggests that while the service has positive benefits for clients, the net impacts in terms of sustained employment outcomes are likely to be weaker after controlling for deadweight.

6 │ Overall Conclusions and Recommendations for Future Delivery of Service
Indecon International Economic Consultants
Evaluation of EmployAbility (Supported Employment) Service
101
Table 6.1: EmployAbility – Summary of Service Activity Levels and Progression Outcomes – 2010-2014
Target 2010 2011 2012 2013 2014
Number of Referrals 2,075 2,257 2,134 2,709 3,151
Number of Active Clients 2,704 2,903 2,762 2,862 2,936
Total Programme Exits 1,768 2,048 2,254 2,449 2,651
Key Performance Indicators (KPIs)
% of Clients in Employment with Support from the Service
50% 35.1% 35.6% 36.6% 29.1% 41.9%
% of Clients Exiting the Programme While in Employment
50% 18.6% 18.5% 29.2% 28.0% 33.6%
Job Coach Ratio (Job Coaches : Clients)
1:25 1:26 1:27 1:26 1:26 1:26
Other Progression Metrics
Clients in Employment with Support from the Service
950 1,032 1,011 1,324 1,229
Total Exits to Employment 326 379 631 686 891
% of Clients Exiting the Programme While in Employment - excluding clients that dropped out/non-completions
37.7% 46.9%
In Employment 6 Months without Support from Service - % of Total Exits to Employment
N/A N/A N/A 75.8% 83.3%
In Employment 6 Months without Support from Service - % of Total Exits
N/A N/A N/A 21.2% 28.0%
Source: Indecon analysis of EmployAbility data Notes: (1) KPIs are included in the contractual agreements between DSP and each Supported Employment (SUP) Sponsor Organisation / EmployAbility Company and derive from the Supported Employment Service Operating Standards (2011). (2) % of Clients in Employment with Support from the Service - employment with support from the service includes formal work experience or employment in the open labour market leading to working a minimum of 8 hours per week. (3) % of Clients Exiting the Programme While in Employment - employment after exiting the service must be in the open labour market and defined as working a minimum of 8 hours per week.
The service has been well received by both clients and employer organisations. A majority of clients surveyed by Indecon were of the view that the programme has provided increased opportunities to gain work experience or/and employment, increased motivation and increased self-confidence, and contributed to their sense of health and wellbeing. Notably, however, a relatively lower proportion agreed and a higher percentage of respondents (13.4%) disagreed that the programme improved their skills and ability to work.
In addition, a majority of clients indicated that they were satisfied with the helpfulness of staff (92%), the availability of a local EmployAbility service (89%), and the application process (88%). Relatively lower levels of satisfaction were evident in relation to opportunities to gain work experience/employment, opportunities to complete further education/training, and overall development of skills.

6 │ Overall Conclusions and Recommendations for Future Delivery of Service
102 Indecon International Economic Consultants
Evaluation of EmployAbility (Supported Employment) Service
A large majority (more than 90%) of employers responding to Indecon’s research either strongly agreed or agreed that the service delivered on their overall expectations. A very high proportion of employers also considered that EmployAbility enabled their organisation to play a role in supporting people with disabilities and that it made it easier for their organisation to support the transition of people with disabilities into their own workforce.
Appropriateness of Key Performance Indicators
A review was also undertaken of the current performance metrics, including the KPIs used to monitor service outcomes and effectiveness.
In terms of conforming to ‘SMART’ criteria for effective monitoring indicators, the existing KPIs would appear to be well-defined and measurable. However, Indecon would have some concerns in relation to the definition and interpretation of the employment-related metrics.
Consistent with the eligibility requirements for access to the service, we understand that only employment which is in the open labour market and involves working a minimum of eight hours per week is included in the exit employment KPI, whereas the active client employment metric is defined to include employment with support from the service. This includes formal work experience or employment in the open labour market. However, it is not clear whether employment achieved reaches a minimum of eight hours per week. In addition, employment may be part-time or full-time employment, and temporary as well as permanent.
We would also have a concern in relation to the interpretation of the metric pertaining to the percentage of clients exiting the programme while in employment, whereby it was found that a number of companies had been misinterpreting the definition of the indicator and there appears to have been confusion between the target for the indicator (50%) and the computation of the metric. It is important that full clarity is achieved across the companies in relation this key metric, as otherwise there is a danger of incorrectly overstating the outcomes recorded under this measure.
The basis for the targets set for the KPIs is not clear and appears arbitrary. In addition, the timeframes over which the targets should be achieved are not clear. It is important that any targets represent ‘stretch’ targets, while at the same time being achievable within pre-defined and realistic timeframes.
A notable gap concerns the coverage of the KPIs. Overall, Indecon believes that the range of KPIs, being confined to just three metrics pertaining to employment outcomes (two metrics) and the job coach ratio, is extremely limited and inadequate to assess service effectiveness and efficiency. One particular weakness concerns the absence of appropriate metrics which capture the extent to which employment outcomes are sustained beyond a 12-month (as opposed to six-month) period, in line with standard measures of labour market activation. Other aspects which merit development and formalisation of additional KPIs include the destination of clients exiting the service who do not take up employment, and the reasons for non-completion of the programme.
The service would appear to generate a number of positive outcomes, which are reported by clients, in terms of independence, well-being, self-confidence, skills and ability to work. Some of these aspects could be captured in KPIs that measure these qualitative outcomes on an ongoing basis.

6 │ Overall Conclusions and Recommendations for Future Delivery of Service
Indecon International Economic Consultants
Evaluation of EmployAbility (Supported Employment) Service
103
Appropriateness of Criteria for Access to Service
The review also considered the criteria for access to the EmployAbility service and their appropriateness. This is important as eligibility for participation, by impacting on the numbers and types of clients supported, will influence the potential to achieve positive improvements and progression outcomes for these clients.
All potential EmployAbility clients must be referred through a Department of Social Protection INTREO office or a Local Employment Service, and they have final authority in determining an individual’s suitability for referral.
One issue highlighted in Indecon’s assessment of the appropriateness of the access criteria concerns the precise scope of individuals in receipt of DSP payments who are potentially eligible for support. While the eligibility criteria state that the service is open to people with disabilities, including those recovering from injury or illness, which are job ready and need the support of a Job Coach to get a job in the open labour market, it was notable some 26% of referrals during 2014 were for individuals in receipt of Jobseeker’s Allowance. Such individuals require a medical report/certification to access the service. In comparison, potential clients in receipt of a DSP disability or illness payment do not. Some concerns have been expressed among case officers that referral through medical certification may be open to abuse and that the expertise or resources to independently assess the eligibility of individuals presenting with medical certification is lacking. It is also understood that there is a low incidence or probability of refusal or non-referral among applicants for the service in general. The degree of clarity in relation to the precise scope and interpretation of eligibility based on DSP payments is an important issue if this leads to inappropriate referral of individuals who may not be suitable for the service. In addition, there is a risk that inappropriate referral of individuals to the service could increase the potential for ‘deadweight’, whereby there is a higher probability that observed employment outcomes are achieved in the absence of EmployAbility supports.
While the threshold is set at a low level, the requirement that prospective clients are willing and able to work for a minimum of eight hours per week reflects a standard definition for ‘open labour market employment’, whereas employment below this threshold is classed as high-support employment. However, as this can only be verified once a client progresses through the programme and takes up employment, of importance is the need to ensure that this requirement is actually met in practice. This requires ongoing verification of client progression, including weekly working hours post exit from the service.
The requirement that prospective clients be ‘job ready’ – defined as a person who has the necessary training, education, motivation and ability to pursue work/career in the open labour market and, if needed, have access to transport to get to and from work – is an important element of the overall access criteria. In practice, however, the definition of ‘job ready’ is challenging to implement in an objective manner. The evident high rates of non-completion/drop-out among clients and the failure to challenges apparent in achieving the KPI targets for employment outcomes together suggest that a high proportion of referrals may relate to individuals who are not job ready, and therefore that the EmployAbility service is not appropriate to address their needs. These findings would suggest that the definition of job readiness requires reconsideration, to facilitate a more objective assessment of suitability for the service and to minimise the risk of inappropriate referral. This is also important in ensuring that potential deadweight is minimised.

6 │ Overall Conclusions and Recommendations for Future Delivery of Service
104 Indecon International Economic Consultants
Evaluation of EmployAbility (Supported Employment) Service
Efficiency and Cost-Effectiveness
A range of factors will impact on service efficiency and cost-effectiveness, and a detailed assessment of cost drivers was outside the scope of this evaluation. The evaluation, however, examined a number of metrics, which relate expenditures to different outcomes from the service. A more detailed consideration should include benchmarking of metrics against comparable programmes. The following observations were made based on the selected metrics examined:
Average monthly expenditure per client supported is estimated to have varied in the range of €222 per month to €258 per month over the period 2010-2014. Based on a typical 18-monthy programme duration, this would suggest an average programme cost per client supported of between €3,996 and €4,644 over this period.
Average spend per client exit to employment has fallen from €19,032 in 2012 to €11,433 in 2014. This decline reflects the recent increase in exits to employment, whereas annual average expenditure has remained broadly stable over the period under consideration.
Average service expenditure relative to employment sustained was €13,582 over the period 2013-2014.
Overall, however, the analysis suggests that programme expenditure remains high relative to the quantum and sustainability of employment outcomes achieved.
One measure of efficiency of service delivery relates to the number of clients assisted relative to the number of job coaches employed. The individual contractual agreements with EmployAbility companies stipulate that a ratio of clients to job coaches of 25:1 should be attained. Over the period 2010-2014, the service has achieved an average ratio of one job coach per 26 clients. Analysis of data for 2014 indicates the presence of significant variation at individual company level, with the ratio varying in the range of 22.3:1 to 35.2:1. Overall, the job coach ratio figures suggest that the service overall is working to capacity levels and reflects the recent growth in demand. The challenge, however, concerns the effectiveness of the service in translating this demand into positive employment progression outcomes.
Assessment of Scale and Scope of Service Provision
In relation to the scale and the scope of service provision, this evaluation considered the demand for supported employment services and the adequacy of the geographical coverage of EmployAbility. While the findings in this regard suggest that there is significant scope for EmployAbility to continue and expand its service in improving the employment opportunities and outcomes for people with disabilities, it should be recognised that the service is voluntary in that participation by persons with disabilities is not compulsory and this, along with population numbers and eligibility, will influence the potential demand for the service.
Due to the range of factors involved, it is difficult to identify with precision the overall demand for supported employment services. Indecon has examined a number of measures of potential demand. If one considers a definiton based on the total number of people with a disability aged 18 to 65 (the age cohort that are eligible for EmployAbility) that are outside the labour force, this definition suggests that EmployAbility service referrals and client numbers represented less than 2% of this cohort in 2014.
6 │ Overall Conclusions and Recommendations for Future Delivery of Service
Indecon International Economic Consultants
Evaluation of EmployAbility (Supported Employment) Service
105
Based on a second definition, if one relates EmployAbility referral and client numbers to the numbers of people with a disability aged 18 to 65 who are unemployed, this suggests that EmployAbility is meeting about 6-7% of the demand for supported employment (based on 2014 figures). This may provide the closest representation of demand for the service.
We also examined a third definition, based on the numbers of persons in the relevant age group who are in receipt of a disability-related social welfare payments (Disability Allowance, Illness Benefit and Invalidity Pension). While a precise assessment is not possible due to the need to make a number of adjustments to minimise potential overestimation, the analysis based on this definition would suggest that EmployAbility meets approximately about 8-9% of the potential demand for supported employment services (based on 2014 data).
The analysis based on this definition also suggests substantial variation (of between 4% and 27% of referrals or active clients) at county level in relation to the extent to which EmployAbility services are meeting local demand for supported employment services.
A further measure of the demand for supported employment services is the numbers on a waiting list for the EmployAbility service. The waiting list for the service has increased since 2013 and by May 2015 the number stood at 584, with 14% waiting more than 16 weeks to obtain a place. Most of those individuals are waiting between two and 12 weeks. The data demonstrates the rising demand for the EmployAbility service. However, of importance is the need to ensure that individuals are appropriately referred to the service.
In considering the adequacy of the geographical coverage to EmployAbility, the regional distribution of persons with disabilities around Ireland was examined. When we examine the density of disabilities by county, i.e., the number of people with a disability as a percentage of the total population in that county, we find that the counties with the highest numbers of people with a disability as a percentage of the total population in the county (between 14% and 18%) are North Dublin, South Tipperary, Longford, Sligo and Donegal.
Reference to EmployAbility data indicated that in 2014, Dublin, Cork, Wicklow, Clare and North Tipperary saw the highest numbers of referrals to the service. However, despite the Census indicating the presence of high numbers of persons with disabilities, Kildare, Galway and Donegal saw lower referral numbers.
Assessment of Governance Structures
The evaluation also considered the issue of the governance of EmployAbility, and assessed the appropriateness of existing governance structures, including their effectiveness and the relationship between EmployAbility companies and the Department of Social Protection. Consideration was also given to how governance structures might be enhanced in the future.
The service overall is governed through the implementation of a set of operating standards as well as contractual agreements with individual service providers. An Operating Standards guide for the predecessor to EmployAbility, namely the FÁS Supported Employment Service, was last developed and circulated in 2011. However, an up-to-date set of operating standards has not been developed for EmployAbility since the service was taken within the direct remit of the Department of Social Protection.
An issue concerns the number and regional spread of EmployAbility companies. There are 23 companies operating the service. The catchment areas served, however, vary significantly in both population and geographic terms. The rationale for the number of services is not clear, and
6 │ Overall Conclusions and Recommendations for Future Delivery of Service
106 Indecon International Economic Consultants
Evaluation of EmployAbility (Supported Employment) Service
examination of the data on service activity, including referral and client numbers, has shown substantial variation in demand and service activity levels across the companies. At issue concerns the appropriateness of these delivery structures from the perspective of maximising effectiveness, efficiency and value for money in the utilisation of public funds.
EmployAbility programme expenditure is high relative to the quantum and sustainability of employment outcomes achieved. In this regard, we believe there is a need to examine the configuration, including the number and geographic spread, and the scope for streamlining existing services to maximise the potential to leverage economies of scale in service provision and to deliver improved value for money. It is also noteworthy that there is a strong negative correlation between the number of clients and the average expenditure per client across the EmployAbility companies. This would suggest that there may be potential to achieve greater economies of scale and efficiencies through merging of certain EmployAbility companies which are geographically adjacent into combined entities with larger catchment areas.
Indecon’s analysis of the structure of EmployAbility company boards of directors indicates the presence of a substantial variation in the size of boards, with the number of directors/members varying from three in the cases of EmployAbility Dublin West and EmployAbility Meath, and up to 11 directors/members in respect of EmployAbility Monaghan/Cavan. The reasons behind the wide variation in the size of EmployAbility boards of directors are not clear. The most recent corporate legislation stipulates that companies limited by guarantee must have a minimum of two directors. Additional members may be appropriate where specialist expertise in required. However, overall board size should be kept to a defined maximum.
One of the requirements set out in the Operating Standards is that each EmployAbility company/sponsor organisation must prepare and submit an annual performance review of the previous year’s activities and achievements, and a business plan for the forthcoming year. Indecon’s inspection of the performance reviews for 2014 and business plans for 2015, submitted to DSP by each EmployAbility company, indicated broad adherence to the requirements set out on the templates, although the depth of information and analysis provided in respect of each of the above dimensions varied significantly across individual companies.
We understand from discussions a selection of frontline DSP officials who interact with EmployAbility companies that the Department operates strict governance and control procedures in relation to financial accountability in particular, including in relation to ongoing processes for sanctioning of expenditure and release of funds, and in monitoring and auditing financial management within the companies. However, it is understood that there is no formalised central reporting system in operation at national level between EmployAbility as a whole, and the Department with SUP14 statistical returns being submitted in paper form only to local DSP offices.
Therefore, there is a need for enhanced detail on quality of outcomes and other data to facilitate assessment of value for money and the effectiveness of the service.
Currently, there is an absence of formalised mechanisms at national level across EmployAbility companies to ensure consistent implementation of appropriate governance approaches. This is an area where we believe the Department of Social Protection should make such a provision to ensure governance requirements are met across the service.
6 │ Overall Conclusions and Recommendations for Future Delivery of Service
Indecon International Economic Consultants
Evaluation of EmployAbility (Supported Employment) Service
107
Procurement models
An important issue for the future development of state-funded supported employment services concerns the model applied in procuring and funding such services. The EmployAbility service and its predecessor have to-date been directly funded by the State, with the relationship between the State and individual services governed by an annual contractual agreement. This relationship is effectively renewed on an ongoing/annual basis. However, given the wider developments in relation to the operation of employment and labour market activation programmes, as well as the increased pressure to demonstrate value for money in the application of public funds, it would be appropriate that the opportunities for alternative procurement models be considered.
Role of INTREO Service
In recent years the social protection system in Ireland has been undergoing significant reforms, moving away from passive income supports to an ‘active inclusion’ approach that seeks to maximise the potential of working age adults, with the appropriate supports and services. The INTREO service, which is the Department of Social Protection’s new integrated income support, employment and support service, is central to this process.
The INTREO service brings together the services previously delivered by the Department at its Local Offices, the Community Welfare Service formerly administered on behalf of the Department by the Health Service Executive and the Employment Support Services formerly managed by FÁS.
The recently published Comprehensive Employment Strategy for People with Disabilities commits the Department to expand the INTREO service on a phased basis to cater for people with a disability who present at an INTREO Centre. To this end, INTREO will become a gateway to employment activation for people with disabilities, commencing on a phased basis from February 2015, with people with disabilities being case managed along with the live register cohort.
The Department is progressively rolling out its full activation support service to people with disabilities who wish to avail of the service on a voluntary basis. Indecon believes that the assignment of appropriately trained INTREO case officers to potential clients, who will undertake prior assessment of individuals’ needs and sign-post individuals to appropriate (EmployAbility or other) supports will be an important development in this regard.
6 │ Overall Conclusions and Recommendations for Future Delivery of Service
108 Indecon International Economic Consultants
Evaluation of EmployAbility (Supported Employment) Service
6.1.1 Overall Key Conclusions
Our key conclusions from the evaluation of the EmployAbility service are as follows:
1. There is evidence of increasing demand for the service.
2. The service has been well received by both clients and employer organisations.
3. However, the service supports only a small cohort of clients (fewer than 3,000 at any one time) relative to the potential demand for supported employment services, while the geographical configuration of the service may not adequately reflect the location of demand.
4. There is a concern that inappropriate referral to the service could be contributing to increased non-completion rates and undermining potential progression outcomes.
5. Programme expenditure remains high relative to the quantum and sustainability of employment outcomes achieved.
6. Some improvement is evident over the last 3-5 years in relation to the extent of positive employment outcomes achieved by the service. However, only a small number of EmployAbility companies have achieved the targets for the employment KPIs set out in the service agreements.
7. The coverage of existing Key Performance Indicators is very limited and requires enhancement to enable effective monitoring of the effectiveness and efficiency of service delivery.
8. There is a need to further enhance and strengthen the governance and oversight of the service, both at national and individual company level, to ensure accountability and value for money in the utilisation of public resources. Opportunities for alternative models of procurement of supported employment services should also be considered in this context.
6.2 Policy Recommendations
Based on the detailed assessment undertaken, Indecon has identified a number of recommendations for policy in this area. These are summarised in the table overleaf and are informed by the level of demand for supported employment services and our consideration of the type of service that is required to effectively and efficiently meet that demand.
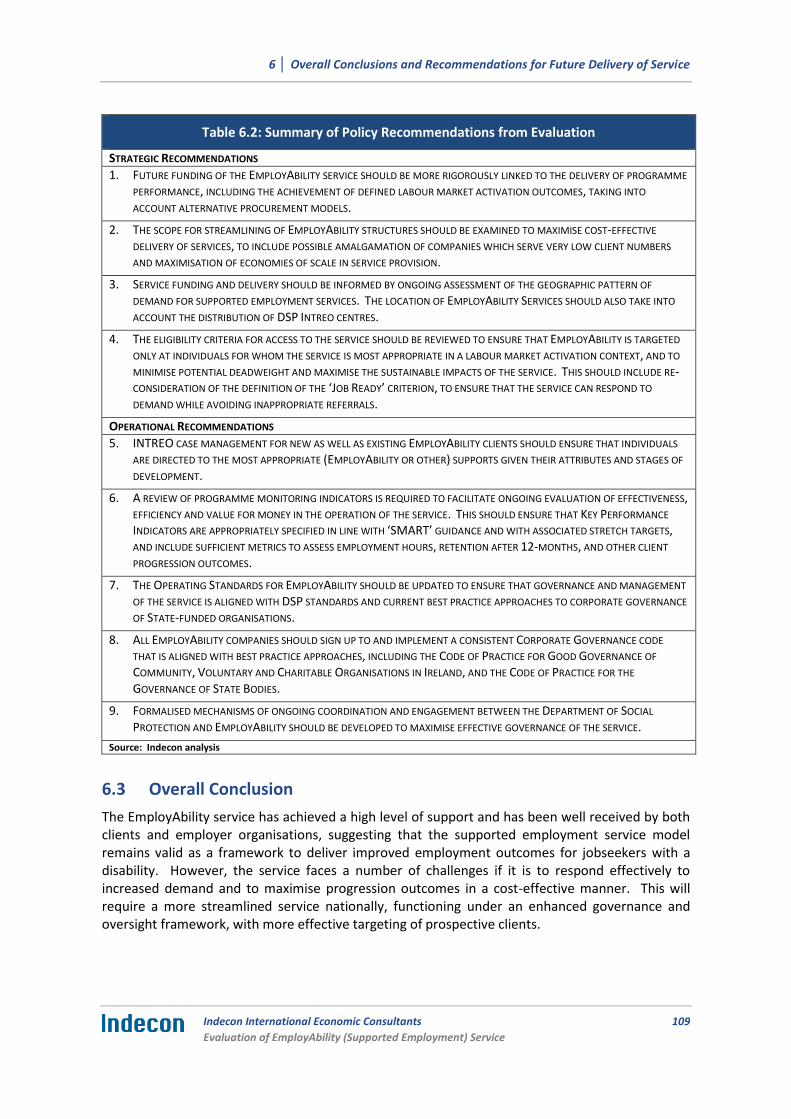
6 │ Overall Conclusions and Recommendations for Future Delivery of Service
Indecon International Economic Consultants
Evaluation of EmployAbility (Supported Employment) Service
109
Table 6.2: Summary of Policy Recommendations from Evaluation
STRATEGIC RECOMMENDATIONS 1. FUTURE FUNDING OF THE EMPLOYABILITY SERVICE SHOULD BE MORE RIGOROUSLY LINKED TO THE DELIVERY OF PROGRAMME
PERFORMANCE, INCLUDING THE ACHIEVEMENT OF DEFINED LABOUR MARKET ACTIVATION OUTCOMES, TAKING INTO
ACCOUNT ALTERNATIVE PROCUREMENT MODELS.
2. THE SCOPE FOR STREAMLINING OF EMPLOYABILITY STRUCTURES SHOULD BE EXAMINED TO MAXIMISE COST-EFFECTIVE
DELIVERY OF SERVICES, TO INCLUDE POSSIBLE AMALGAMATION OF COMPANIES WHICH SERVE VERY LOW CLIENT NUMBERS
AND MAXIMISATION OF ECONOMIES OF SCALE IN SERVICE PROVISION.
3. SERVICE FUNDING AND DELIVERY SHOULD BE INFORMED BY ONGOING ASSESSMENT OF THE GEOGRAPHIC PATTERN OF
DEMAND FOR SUPPORTED EMPLOYMENT SERVICES. THE LOCATION OF EMPLOYABILITY SERVICES SHOULD ALSO TAKE INTO
ACCOUNT THE DISTRIBUTION OF DSP INTREO CENTRES.
4. THE ELIGIBILITY CRITERIA FOR ACCESS TO THE SERVICE SHOULD BE REVIEWED TO ENSURE THAT EMPLOYABILITY IS TARGETED
ONLY AT INDIVIDUALS FOR WHOM THE SERVICE IS MOST APPROPRIATE IN A LABOUR MARKET ACTIVATION CONTEXT, AND TO
MINIMISE POTENTIAL DEADWEIGHT AND MAXIMISE THE SUSTAINABLE IMPACTS OF THE SERVICE. THIS SHOULD INCLUDE RE-CONSIDERATION OF THE DEFINITION OF THE ‘JOB READY’ CRITERION, TO ENSURE THAT THE SERVICE CAN RESPOND TO
DEMAND WHILE AVOIDING INAPPROPRIATE REFERRALS.
OPERATIONAL RECOMMENDATIONS 5. INTREO CASE MANAGEMENT FOR NEW AS WELL AS EXISTING EMPLOYABILITY CLIENTS SHOULD ENSURE THAT INDIVIDUALS
ARE DIRECTED TO THE MOST APPROPRIATE (EMPLOYABILITY OR OTHER) SUPPORTS GIVEN THEIR ATTRIBUTES AND STAGES OF
DEVELOPMENT.
6. A REVIEW OF PROGRAMME MONITORING INDICATORS IS REQUIRED TO FACILITATE ONGOING EVALUATION OF EFFECTIVENESS, EFFICIENCY AND VALUE FOR MONEY IN THE OPERATION OF THE SERVICE. THIS SHOULD ENSURE THAT KEY PERFORMANCE
INDICATORS ARE APPROPRIATELY SPECIFIED IN LINE WITH ‘SMART’ GUIDANCE AND WITH ASSOCIATED STRETCH TARGETS, AND INCLUDE SUFFICIENT METRICS TO ASSESS EMPLOYMENT HOURS, RETENTION AFTER 12-MONTHS, AND OTHER CLIENT
PROGRESSION OUTCOMES.
7. THE OPERATING STANDARDS FOR EMPLOYABILITY SHOULD BE UPDATED TO ENSURE THAT GOVERNANCE AND MANAGEMENT
OF THE SERVICE IS ALIGNED WITH DSP STANDARDS AND CURRENT BEST PRACTICE APPROACHES TO CORPORATE GOVERNANCE
OF STATE-FUNDED ORGANISATIONS.
8. ALL EMPLOYABILITY COMPANIES SHOULD SIGN UP TO AND IMPLEMENT A CONSISTENT CORPORATE GOVERNANCE CODE
THAT IS ALIGNED WITH BEST PRACTICE APPROACHES, INCLUDING THE CODE OF PRACTICE FOR GOOD GOVERNANCE OF
COMMUNITY, VOLUNTARY AND CHARITABLE ORGANISATIONS IN IRELAND, AND THE CODE OF PRACTICE FOR THE
GOVERNANCE OF STATE BODIES.
9. FORMALISED MECHANISMS OF ONGOING COORDINATION AND ENGAGEMENT BETWEEN THE DEPARTMENT OF SOCIAL
PROTECTION AND EMPLOYABILITY SHOULD BE DEVELOPED TO MAXIMISE EFFECTIVE GOVERNANCE OF THE SERVICE.
Source: Indecon analysis
6.3 Overall Conclusion
The EmployAbility service has achieved a high level of support and has been well received by both clients and employer organisations, suggesting that the supported employment service model remains valid as a framework to deliver improved employment outcomes for jobseekers with a disability. However, the service faces a number of challenges if it is to respond effectively to increased demand and to maximise progression outcomes in a cost-effective manner. This will require a more streamlined service nationally, functioning under an enhanced governance and oversight framework, with more effective targeting of prospective clients.
6 │ Overall Conclusions and Recommendations for Future Delivery of Service
110 Indecon International Economic Consultants
Evaluation of EmployAbility (Supported Employment) Service
Annex 1 Copy of Questionnaire re Survey of EmployAbility Clients

Annex 1 │ Copy of Questionnaire re Survey of EmployAbility Clients
Indecon International Economic Consultants
Evaluation of EmployAbility (Supported Employment) Service
111
CONFIDENTIAL SURVEY OF EMPLOYABILITY SERVICE PARTICIPANTS
We would be very grateful if you could address each question below and provide your response by Friday, 26th June. Your response will be provided directly to Indecon only, will be treated as strictly confidential and will not be seen by the Department of Social Protection or any other organisation. We believe obtaining your views are very important to our evaluation and we are therefore very thankful for your help with this.
Experience and Impact of EmployAbility Service
To help us understand what ways you believe the EmployAbility Service has been helpful to you, please indicate whether you agree or disagree with each of the following statements. Please tick one box for each statement.
Participation in EmployAbility Agree Disagree Don’t Know
Provided me with increased opportunities to gain work experience / employment
Increased my motivation to find work or to undertake further education or training
Improved my skills and ability to work
Increased my overall self-confidence
Increased my overall independence
Contributed to my improved health and sense of well-being
Satisfaction with EmployAbility Service
To help us understand your satisfaction with the EmployAbility service, please indicate whether you were satisfied or dissatisfied with the service and with the different elements of this, as outlined below:
Level of Satisfaction/Dissatisfaction with: Satisfied Dissatisfied Don’t Know
Overall EmployAbility Service
Availability of an EmployAbility Service near where I live
Application process to participate in the EmployAbility Service
Helpfulness of staff in identifying my needs and potential
Opportunities to gain work experience/employment
The level of supports provided to help me adjust and to stay in my job
Opportunities to complete further education or training
Overall development of my skills
Other Comments
Please indicate any other comments you may have about the usefulness of EmployAbility and your experience, and on how the service could be improved:
____________________________________________________________________________________________
____________________________________________________________________________________________ Confidential Background Material
Please indicate the highest education level you have achieved (e.g. Primary/National School, Junior/Intermediate or Group Certificate, Leaving Certificate, Third-Level Education): __________________________________________
Please indicate the type of disability you have: ______________________________________________________
Thank you very much for your help with this.
Annex 2 │ Survey of Employer Organisations – Copy of Questionnaire
112 Indecon International Economic Consultants
Evaluation of EmployAbility (Supported Employment) Service
Annex 2 Survey of Employer Organisations – Copy of Questionnaire
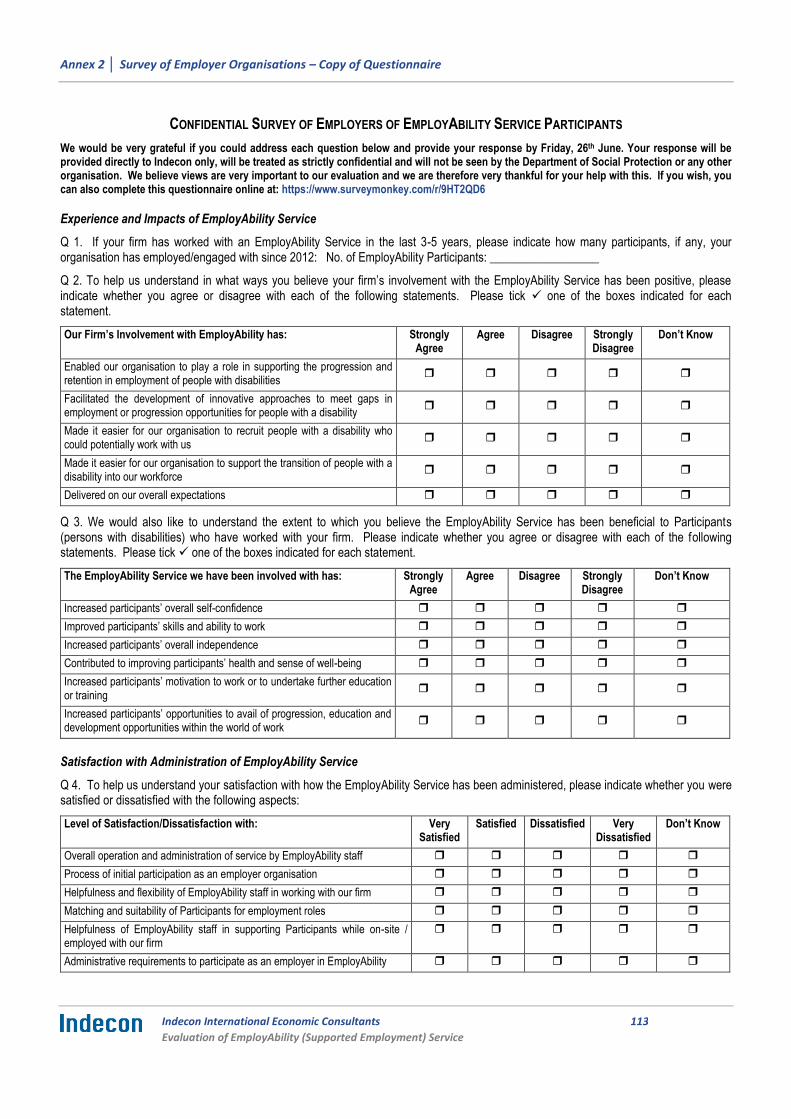
Annex 2 │ Survey of Employer Organisations – Copy of Questionnaire
Indecon International Economic Consultants
Evaluation of EmployAbility (Supported Employment) Service
113
CONFIDENTIAL SURVEY OF EMPLOYERS OF EMPLOYABILITY SERVICE PARTICIPANTS
We would be very grateful if you could address each question below and provide your response by Friday, 26th June. Your response will be provided directly to Indecon only, will be treated as strictly confidential and will not be seen by the Department of Social Protection or any other organisation. We believe views are very important to our evaluation and we are therefore very thankful for your help with this. If you wish, you can also complete this questionnaire online at: https://www.surveymonkey.com/r/9HT2QD6
Experience and Impacts of EmployAbility Service
Q 1. If your firm has worked with an EmployAbility Service in the last 3-5 years, please indicate how many participants, if any, your organisation has employed/engaged with since 2012: No. of EmployAbility Participants: __________________
Q 2. To help us understand in what ways you believe your firm’s involvement with the EmployAbility Service has been positive, please indicate whether you agree or disagree with each of the following statements. Please tick one of the boxes indicated for each statement.
Our Firm’s Involvement with EmployAbility has: Strongly Agree
Agree Disagree Strongly Disagree
Don’t Know
Enabled our organisation to play a role in supporting the progression and retention in employment of people with disabilities
Facilitated the development of innovative approaches to meet gaps in employment or progression opportunities for people with a disability
Made it easier for our organisation to recruit people with a disability who could potentially work with us
Made it easier for our organisation to support the transition of people with a disability into our workforce
Delivered on our overall expectations
Q 3. We would also like to understand the extent to which you believe the EmployAbility Service has been beneficial to Participants (persons with disabilities) who have worked with your firm. Please indicate whether you agree or disagree with each of the following statements. Please tick one of the boxes indicated for each statement.
The EmployAbility Service we have been involved with has: Strongly Agree
Agree Disagree Strongly Disagree
Don’t Know
Increased participants’ overall self-confidence
Improved participants’ skills and ability to work
Increased participants’ overall independence
Contributed to improving participants’ health and sense of well-being
Increased participants’ motivation to work or to undertake further education or training
Increased participants’ opportunities to avail of progression, education and development opportunities within the world of work
Satisfaction with Administration of EmployAbility Service
Q 4. To help us understand your satisfaction with how the EmployAbility Service has been administered, please indicate whether you were satisfied or dissatisfied with the following aspects:
Level of Satisfaction/Dissatisfaction with: Very Satisfied
Satisfied Dissatisfied Very Dissatisfied
Don’t Know
Overall operation and administration of service by EmployAbility staff
Process of initial participation as an employer organisation
Helpfulness and flexibility of EmployAbility staff in working with our firm
Matching and suitability of Participants for employment roles
Helpfulness of EmployAbility staff in supporting Participants while on-site / employed with our firm
Administrative requirements to participate as an employer in EmployAbility

Annex 2 │ Survey of Employer Organisations – Copy of Questionnaire
114 Indecon International Economic Consultants
Evaluation of EmployAbility (Supported Employment) Service
Operation of Wage Subsidy Scheme
Provision of Disability Awareness Training for Employers
Overall Assessment of Success of EmployAbility in Meeting its Aims/Objectives
Q 5. Please outline your opinion on the impact of the EmployAbility Service in meeting its key aims/objectives, as outlined below:
Success in meeting the following Objectives of EmployAbility Service:
Very Successful
Successful Neither Successful nor Unsuccessful
Unsuccessful Don’t Know
Facilitate the integration of people with disabilities and other disadvantaged groups into paid employment in the open labour market
Provide supports to assist with this integration process
Meet the labour requirements of Employers
Support the progression / retention of people with a disability in the labour force, leading to independence and career progression
Counterfactual
Q 6. If your organisation has employed/taken on EmployAbility Service participants since 2012, please indicate whether you would have provided the specific opportunities to these persons without the service:
Yes No Don’t Know
Other Comments
Q 7. Please indicate below any other comments you might like to make about your experience with the EmployAbility Services, including your views on the benefits of involvement for participants and employers, and on how the service could be improved:
Thank you very much for your help with this review.
Annex 3 │ Overview of Stakeholder Consultations
Indecon International Economic Consultants
Evaluation of EmployAbility (Supported Employment) Service
115
Annex 3 Overview of Stakeholder Consultations
The evaluation was informed by an extensive programme of engagement with relevant stakeholder groups. The programme of engagement included:
Bilateral meetings held with officials within the Department of Social Protection;
Meeting held with EmployAbility National Coordinators’ Forum;
Meetings held with EmployAbility National Directors’ Forum;
Meeting with DSP National Disability Consultative Forum;
Meeting held with EmployAbility Job Coaches;
Ongoing bilateral engagement with EmployAbility services; and,
Provision of submissions to the evaluation by individual disability and other organisations, and individuals.
Written submissions were received from the following groups:
Health Service Executive;
Irish Association of Supported Employment (IASE);
Department of Social Protection;
Rehab Group;
Citizens Information Board;
Disability Federation of Ireland;
Mid-West Mental Health Occupational Therapy Service;
Mental Health Reform (MHR);
Tony Hennett (EmployAbility); and,
European Union of Supported Employment (Margaret Haddock, President).
A summary of the inputs and proposals from all engagement with stakeholders is presented overleaf under a number of key themes.
Annex 3 │ Overview of Stakeholder Consultations
116 Indecon International Economic Consultants
Evaluation of EmployAbility (Supported Employment) Service
Public Awareness of EmployAbility
Many organisations, both during the various workshops chaired by Indecon and through formal submissions to Indecon, noted an issue with regard to the absence of more widespread recognition and awareness of the EmployAbility service, both among the general public and among employer organisations. It was suggested that this could be improved through more intensive and effective promotion of the service, which would enhance its profile as well as promote understanding of the service.
It was also suggested that the service could also be promoted more widely among the private sector and employer organisations, with a view to acquiring additional and more varied roles for service clients. This would include through developing relationships between INTREO and private sector employers. Employers also need to be more aware of the wide array of grants available in hiring people with disabilities, e.g., the Workplace Equipment/Adaptation Grant, the Personal Reader Grant, the Job Interview Interpreter Grant and the Employee Retention Grant. This was also highlighted in the context of reducing demand-side barriers to the uptake of employment among people with disabilities.
Various stakeholders also suggested that co-operation could also take place at county level among disability and community service providers with employment programmes, in order to develop strategic local activation processes and progression for people with disabilities. It was considered that a collaborative approach at county level among services could have the potential to enhance and increase employer awareness and engagement in a structured manner.
Duration of Client Interaction on EmployAbility Service
Some stakeholders were of the view that the 18-month duration of the service should be reviewed. It was felt that in some cases the duration may need to be extended to accommodate clients that require longer support times, while in other cases it could be reduced where clients are more ‘job ready’. Overall, it was suggested that a more flexible approach to the programme duration – for example, at which 24 months could be a maximum and six to 12 months could be a minimum – could have merit.
Job Coach Ratio
A number of views were expressed by stakeholders in relation to the targeted Job Coach ratio (which is one of the three KPIs monitored and reported to the Department of Social Protection). In particular, it was considered that the targeted job coach ratio of one job coach per 25 clients may be too high and that more resourcing in the area of job coaches may be required, particularly if some clients have higher support needs. One submission to Indecon noted that the European average caseload of job coaches to clients is between 1:6 and 1:10.47 It was suggested that a lower ratio may improve the exit to employment rates. Stakeholders also generally reported that the demand for the services exceeds the available resources.
47 IASE – EmployAbility Review response to Indecon 13/07/2015
Annex 3 │ Overview of Stakeholder Consultations
Indecon International Economic Consultants
Evaluation of EmployAbility (Supported Employment) Service
117
Quality Assurance
A number of stakeholders expressed the view that quality assurance, standards and professional development should be adhered to more widely across the EmployAbility service, to ensure consistency in delivery of the service’s five-stage model and that best practice approaches are pursued. In this context, the availability of professional qualifications in the provision of supported employment was highlighted, such as the Certificate in Supported Employment through the Open Training College, the Northern Ireland Union of Supported Employment and the Irish Association of Supported Employment. It was suggested that these qualifications could provide an opportunity for service staff to attain a level of knowledge and achieve a professional qualification in the area of supported employment.
Scale and Scope of Service Provision
Eligibility Criteria
The eligibility criteria for access to the EmployAbility service were cited by a wide range of stakeholders as an important issue requiring consideration.
One aspect of the access criteria for the service which was considered in stakeholder submissions concerns the age criterion for potential clients. The age range of 18 to 65 essentially targets all persons with disabilities who are seeking employment. It was suggested that as many persons aged between 18 and 24 attend university, it could be argued that it would be more appropriate to target persons over 24, as by that age some level of post-secondary education is likely to have been achieved. Similarly, it was suggested that it is less likely that persons aged from 60 to 65 who have a disability are less likely to be employed. For these reasons, it was considered that it may be more appropriate to target a cohort of individuals that are within the prime working age of between 24 and 60. It was suggested that by adjusting the eligibility criteria accordingly and channelling resources more effectively, EmployAbility could potentially achieve higher exit rates to employment.
Some stakeholders expressed the view that the requirement that clients be ‘job ready’ could affect potential progression outcomes. Given the breadth of disabilities catered for by EmployAbility, it could be expected that significant numbers are unlikely to be job ready. Stakeholders also noted that the concept could be subjective and open to interpretation, as it may be interpreted differently when viewed from the perspective of the participant, the job coach, the Department of Social Protection, or an employer organisation. It was suggested that if the job readiness requirement was adhered to more stringently, then the type of clients enrolled in the service may potentially have a higher probability of exiting to employment. However, this may restrict the numbers eligible for the service, thereby excluding a significant number of persons with disabilities that could avail of the service. It was noted that some consideration as to the scope of the service would be required in this context, particularly in light of the fact that only about one-third of clients exit to employment.
Several submissions to Indecon also noted that the requirement for clients to be able to work a minimum of eight hours per week was restrictive and not suited to potential clients that wished to work fewer hours, in work of a ‘sheltered nature.’ It was noted, however, that the eight-hour requirement was in accordance with the definition of open labour market employment, whereas employment below this threshold fell into a different category, which was outside the objectives of EmployAbility.
Annex 3 │ Overview of Stakeholder Consultations
118 Indecon International Economic Consultants
Evaluation of EmployAbility (Supported Employment) Service
Collaboration across Government Departments
It was suggested in some submissions that greater collaboration across the various Government Departments engaged with EmployAbility could improve the efficiency of the service. Information sharing and the maintenance of a database of potential clients by geographic breakdown and by detailed background (disability, previous employment, skills, etc.) could improve efficiency of referrals.
It was also noted that potential clients who are in education and training must complete their training programme before going on a social welfare payment and then being eligible to apply for EmployAbility. In other words, potential clients cannot apply for EmployAbility while still undertaking education or training, often leaving students in a period of inactivity at the end of their training with no progression while they wait for enrolment on the service. Related to this is the length of waiting times among clients to avail of the service, which in some cases is as high as 16 weeks.
Transport Facility
Stakeholders also reported to Indecon that clients in rural areas can face a significant difficulty in travelling to both their local EmployAbility office and to their place of work. It was suggested that this can act as a barrier to the uptake of employment and, in this context, a facility for transporting clients in rural areas could be explored. This could take the form of a scheduled private bus service or the provision of travel cards on rural taxi/hackney services.
Range of Supports
Some stakeholders stated that some other programmes that are funded by the HSE, and which help people with disabilities to access employment, adopt broader criteria and provide access to a more sustained period of support than EmployAbility. It was suggested that the transition plan for EmployAbility should ensure that individuals have access to a wider range of supports that may be required from specialist services such as occupational therapy, psychological support, independent living support, psychiatric services, etc.
Education
A number of stakeholders noted that there is often there is a need for upskilling of clients before they are ready for work and that this should be considered when evaluating the EmployAbility service in terms of employment outcomes. The view was expressed by some stakeholders that EmployAbility is an employment support service and not a recruitment service, and hence the focus on targets and KPIs is not always appropriate.
Appropriateness of the Governance Structures
In relation to the current governance structures in place, several stakeholders suggested that it may be worthwhile establishing a form of overarching umbrella group for the 23 EmployAbility companies, with a view to promoting consistent quality and standardised delivery of the service across the State. It was suggested that this organisation could provide co-ordination and assistance to the individual companies.

Annex 4 │ Additional Background and Contextual Data
Indecon International Economic Consultants
Evaluation of EmployAbility (Supported Employment) Service
119
Annex 4 Additional Background and Contextual Data
This section presents some additional background and contextual data from the 2011 Census of Population which has not been included in the main body of the report. The figure below presents the numbers of persons with disabilities by region.
We find that Dublin has the highest numbers of persons with a disability by virtue of its high population, with the next regions with high numbers being the South-West, the South-East, the Border region and the Mid-East. The Midlands has the lowest prevalence of persons with a disability. The regions with the highest density of disabilities (i.e. relative to population) are the South East (13.7%) and the Mid-West (13.6%).
It is interesting to look into the composition of the total numbers by disability type and region. The following two charts show the numbers of persons with disabilities by type and region.
The frequency of disabilities is as follows:
A condition that substantially limits one or more basic physical activities (highest in Dublin, South-West, Border);
A difficulty in learning, remembering or concentrating (highest in Dublin, South-West and Border);
Deafness or serious hearing impairment (highest in Dublin, South-West and Border);
An intellectual disability (highest in Dublin, South-West and Border); and,
Blindness or serious vision impairment (highest in Dublin, South-West and Border).
Population with Disability by Type and Region – Census 2011
Source: Indecon analysis of CSO Census of Population 2011 data
0
10000
20000
30000
40000
50000
60000
70000
Blindness or a serious visionimpairment
Deafness or a serious hearingimpairment
A condition that substantially limitsone or more basic physicalactivities
An intellectual disability
Difficulty in learning, rememberingor concentrating
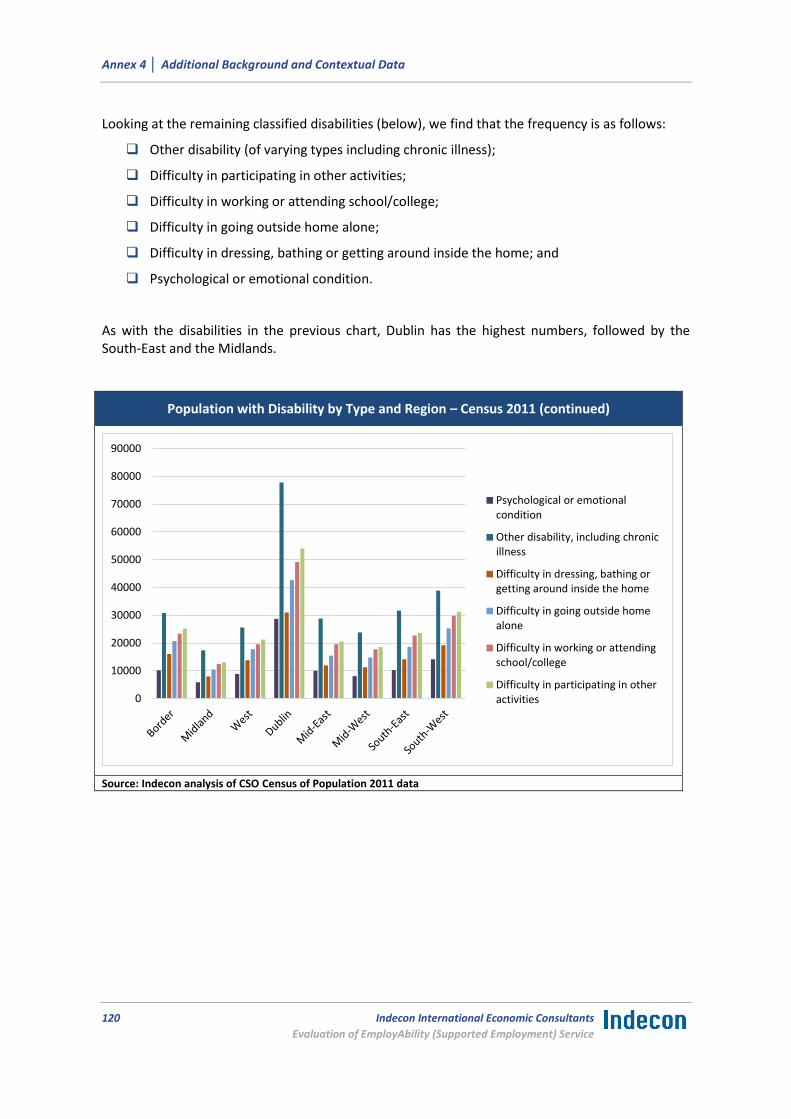
Annex 4 │ Additional Background and Contextual Data
120 Indecon International Economic Consultants
Evaluation of EmployAbility (Supported Employment) Service
Looking at the remaining classified disabilities (below), we find that the frequency is as follows:
Other disability (of varying types including chronic illness);
Difficulty in participating in other activities;
Difficulty in working or attending school/college;
Difficulty in going outside home alone;
Difficulty in dressing, bathing or getting around inside the home; and
Psychological or emotional condition.
As with the disabilities in the previous chart, Dublin has the highest numbers, followed by the South-East and the Midlands.
Population with Disability by Type and Region – Census 2011 (continued)
Source: Indecon analysis of CSO Census of Population 2011 data
0
10000
20000
30000
40000
50000
60000
70000
80000
90000
Psychological or emotionalcondition
Other disability, including chronicillness
Difficulty in dressing, bathing orgetting around inside the home
Difficulty in going outside homealone
Difficulty in working or attendingschool/college
Difficulty in participating in otheractivities

Annex 4 │ Additional Background and Contextual Data
Indecon International Economic Consultants
Evaluation of EmployAbility (Supported Employment) Service
121
Among the characteristics of persons with disabilities is their labour market participation. The figure below shows the numbers of people with a disability and the corresponding numbers at work as a percentage of the total number of people with a disability (right-hand axis). For example, we see that 42.9% of people with a disability aged 25-29 are in work. The numbers at work fall with age, with just 3.4% of people aged 65 and over at work.
Population with a Disability at Work by Age Group – 2011 Census
Source: Indecon analysis of CSO Census of Population data
3.8%
24.9%
42.9% 44.7% 41.7%
38.9% 36.0%
32.8%
27.2%
18.9%
3.4% 0.0%
5.0%
10.0%
15.0%
20.0%
25.0%
30.0%
35.0%
40.0%
45.0%
50.0%
0
50000
100000
150000
200000
250000
15 - 19years
20 - 24years
25 - 29years
30 - 34years
35 - 39years
40 - 44years
45 - 49years
50 - 54years
55 - 59years
60 - 64years
65yearsandover
Per
cen
tage
of
Rel
evan
t A
ge G
rou
p
Po
pu
lati
on
wit
h a
Dis
abili
ty (
Nu
mb
er)
Population with a Disability (Number)
Population with a Disability at Work as a Percentage of Total Population with a Disability (%)

Annex 4 │ Additional Background and Contextual Data
122 Indecon International Economic Consultants
Evaluation of EmployAbility (Supported Employment) Service
The figure below shows the numbers by age group that are at work (based on the 2011 Census) and the percentage at work as a percentage of the total population at work in that age group (right hand axis). For example, based on the 2011 Census, persons with disabilities aged 25-29 accounted for 4.3% of all persons aged 25-29 in work. In general, the percentage of persons with disabilities as a percentage of the total population at work is quite low, averaging around 6% for ages 20 to 54, before rising to 15.5% for persons aged 65 and over.
Population with a Disability at Work and Total Population at Work by Age Group – 2011 Census
Source: Indecon analysis of CSO Census of Population data
6 4.7 4.3 4.6 5.2 5.8 6.5
7.5 8.9
10.5
15.5
0
2
4
6
8
10
12
14
16
18
0
2000
4000
6000
8000
10000
12000
14000
16000
15 - 19years
20 - 24years
25 - 29years
30 - 34years
35 - 39years
40 - 44years
45 - 49years
50 - 54years
55 - 59years
60 - 64years
65 yearsandover
Per
cen
tage
of
Rel
evan
t A
ge G
rou
p
Po
pu
lati
on
wit
h a
Dis
abili
ty (
Nu
mb
er)
Population with a Disability at Work (Number)
Population with a Disability at Work as a Percentage of Relevant Age Group (%)
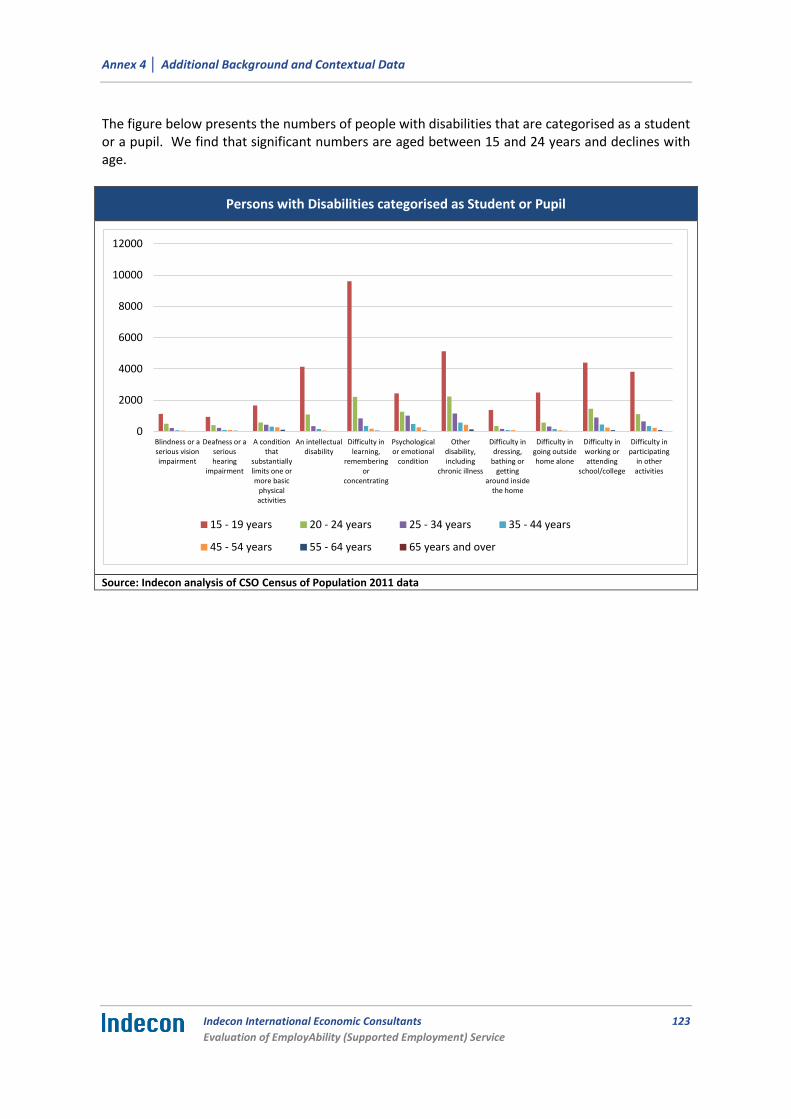
Annex 4 │ Additional Background and Contextual Data
Indecon International Economic Consultants
Evaluation of EmployAbility (Supported Employment) Service
123
The figure below presents the numbers of people with disabilities that are categorised as a student or a pupil. We find that significant numbers are aged between 15 and 24 years and declines with age.
Persons with Disabilities categorised as Student or Pupil
Source: Indecon analysis of CSO Census of Population 2011 data
0
2000
4000
6000
8000
10000
12000
Blindness or aserious visionimpairment
Deafness or aserioushearing
impairment
A conditionthat
substantiallylimits one ormore basic
physicalactivities
An intellectualdisability
Difficulty inlearning,
rememberingor
concentrating
Psychologicalor emotional
condition
Otherdisability,including
chronic illness
Difficulty indressing,
bathing orgetting
around insidethe home
Difficulty ingoing outsidehome alone
Difficulty inworking orattending
school/college
Difficulty inparticipating
in otheractivities
15 - 19 years 20 - 24 years 25 - 34 years 35 - 44 years
45 - 54 years 55 - 64 years 65 years and over

Annex 4 │ Additional Background and Contextual Data
124 Indecon International Economic Consultants
Evaluation of EmployAbility (Supported Employment) Service
The chart below describes the number of people with disabilities by socio-economic group (in terms of type of occupation) and the age at which education ceased. For example, for those per-sons whose education ceased at age 15, small numbers work as employers and managers or lower professionals, while larger numbers work in other occupations that are neither skilled nor semi- skilled. As the age at which education ceased rises, the numbers employed in professional occupa-tions rises.
People with Disabilities by Socio Economic Group and Age at which Education Ceased
Source: Indecon analysis of CSO Census of Population 2011 data
0%
10%
20%
30%
40%
50%
60%
70%
80%
90%
100%
Z. All others gainfully occupied andunknown
J. Agricultural workers
I. Farmers
H. Own account workers
G. Unskilled
F. Semi-skilled
E. Manual skilled
D. Non-manual
C. Lower professional
B. Higher professional
A. Employers and managers


