Evaluation of Factors Governing the Use of Floating Solar System: A Study on Iran's
Important Water Infrastructures
Mohammad Fereshtehpoura,*, Reza Javidi Sabbaghianb, Ali Farrokhic, Ehsan
Bahrami Joveind, Elham Ebrahimi Sarindizaje
a,* Postdoctoral researcher, Department of Water Science and Engineering, Ferdowsi University of
Mashhad, Mashhad, Iran, [email protected]
b Assistant Professor, Department of Civil Engineering, Hakim Sabzevari University, Sabzevar, Iran.
c Research Assistant, Department of Civil Engineering, Islamic Azad University of Mashhad,
Mashhad, Iran.
d Assistant Professor, Civil Engineering Department, University of Torbat Heydarieh, Torbat
Heydarieh, Iran.
e Ph.D. candidate, School of Civil Engineering, University of Tehran, Tehran, Iran.
ABSTRACT
The issue of water and energy crisis have been turned into global matters which need to be tackled
jointly. Accordingly, floating solar power plants, in which photovoltaic modules are used on the
surface of water infrastructures, has recently been attracting much interest. This system provides
some additional advantages over the ground-based system such as conserving the land and the
water and increasing the efficiency of the module. This study first reviews the relevant literature
comprehensively and then evaluates the potential of using floating solar photovoltaic (FSPV) on
some of Iran’s water infrastructures which have experienced a large amount of evaporation every
year due to high solar radiation. To this end, the five important dam reservoirs are selected as the
representatives of the five important watersheds in Iran, and the advantages of the FSPV plant is
analyzed in terms of energy generation, evaporation reduction, economic and environmental
aspects considering different coverage percentages of reservoir’s surfaces. Considering Iran's vast
potential for solar radiation, and, on the other hand, huge energy demand and critical water
situation, results indicated that Iran can effectively harness solar energy through FSPV systems
which help conserve the water in addition to support sustainable energy production.
Keywords: Floating PV system, Sustainable Energy Production, Solar Power Plant, Water
Infrastructures, Evaporation, Water Conservation.
1. INTRODUCTION
Preprints (www.preprints.org) | NOT PEER-REVIEWED | Posted: 5 July 2020 doi:10.20944/preprints202007.0085.v1
© 2020 by the author(s). Distributed under a Creative Commons CC BY license.
In recent years, water and energy resources have been tightly linked together. Water
resources are utilized in the procedure of electrical energy generation. On the other hand, energy
resources are utilized for water supply, transfer, distribution, and also for treating wastewater
(Bauer, 2014(. This interdependency between water and energy is the so-called water-energy
nexus. In the national and international scales, several water and energy systems have been
developed, managed, and regulated to efficiently resolve the water-energy nexus (Reinhard et al.,
2017).
Water resources systems are used to supply several demands including potable, agricultural,
industrial, and environmental requirements, and satisfy the sustainable development goals.
Reservoir dams in many regions of the world have a significant role in supplying water and
generating energy (Javidi Sabbaghian et al., 2016). In Iran, Over the last four decades, the capacity
of the constructed dams has been increased into more than 50 billion cubic meters (BCM), which
is almost 42 percent of the freshwater resources of the country (Mesgaran and Azadi, 2018).
Moreover, many hydroelectric power plants have been established inside the country with an
annual generation capacity of 53000 Gigawatt hours (GWh), which is about one-fifth of the
electrical energy generation of the country (IWRMC, 2019). Accordingly, the reservoir dams can
effectively control and manage the water deficit crisis across the country and are necessary for
generating electricity as well (Fereshtehpour, 2016).
However, there are challenges related to the reservoir dams especially in the arid or semi-
arid regions of the world. In Iran, the most important challenges are the low mean annual
precipitation (almost 250 mm/year), climate change, and the long-term increase of the air
temperature (about 1.5 degrees of centigrade), which cause a huge amount of evaporation ) about
3 BCM/year) (IWRMC, 2019). The air temperature, heat flux, mass transfer in the water surface,
Preprints (www.preprints.org) | NOT PEER-REVIEWED | Posted: 5 July 2020 doi:10.20944/preprints202007.0085.v1
and wind speed are the most influential factors on the water surface evaporation from reservoir
dams. Several techniques have been introduced for reducing the evaporative losses from reservoir
dams (Craig, 2005). Although these methods are effective to reduce the evaporation from the
reservoir dams, there are still some limitations such as high operation and maintenance costs,
undesirable environmental impacts, and especially loss of solar energy received by the water body
for energy generation.
Solar energy is of great importance in the water-energy nexus and is one of the most
abundant, clean, affordable, and sustainable energy resources in the world, especially in arid or
semi-arid regions. This energy is generated by the global solar radiation on the earth's surface
including the continents and the water surfaces. The global solar radiation is defined by the global
horizontal irradiance (GHI) and the diffuse horizontal irradiance (DHI) (Gamarra and Ronk, 2019).
The global solar radiation would be 1800 times the global primary energy consumption, whereas
hydropower plants would supply the global primary consumption for just one year. Therefore, it
can be used potentially as a reliable and comprehensive resource for energy generation in the near
future (Dizier, 2018).
The potential of receiving solar radiation on the earth's surface depends on the type of
surface cover and the climatic conditions. Iran has a desirable potential for utilizing the solar
energy generated by solar radiation. The country has a mean annual 300 sunny days (almost 2800
sunny hours per year) in the two-thirds of its area and the solar radiation average is about 4.5–5.5
kWh per square meter per day (Daneshyar, 1978; Fadai, 2007).
Over recent years, one of the most noticeable strategies for decreasing the undesirable
impacts of evaporation from the water surface of the reservoir dams and generating sustainable
Preprints (www.preprints.org) | NOT PEER-REVIEWED | Posted: 5 July 2020 doi:10.20944/preprints202007.0085.v1
energy is utilizing photovoltaic panels mounted on a floating platform for natural or artificial
surface water resources. These systems are creating new opportunities to get the most out of solar
energy, particularly in regions that have a high potential of harnessing solar radiation. The
installation of PV panels on surface water resources in the world has grown considerably, from an
installed capacity of 10 megawatts (MW) at the end of 2014 to 1.1 gigawatts (GW) by September
2018 (Abid et al., 2019). Taking into account the success of utilizing floating PV panels in the
South Asian region, Abid et al. (2019) suggested that other Central Asian countries such as
Pakistan, Afghanistan, and Iran, where a large number of water bodies are available, can
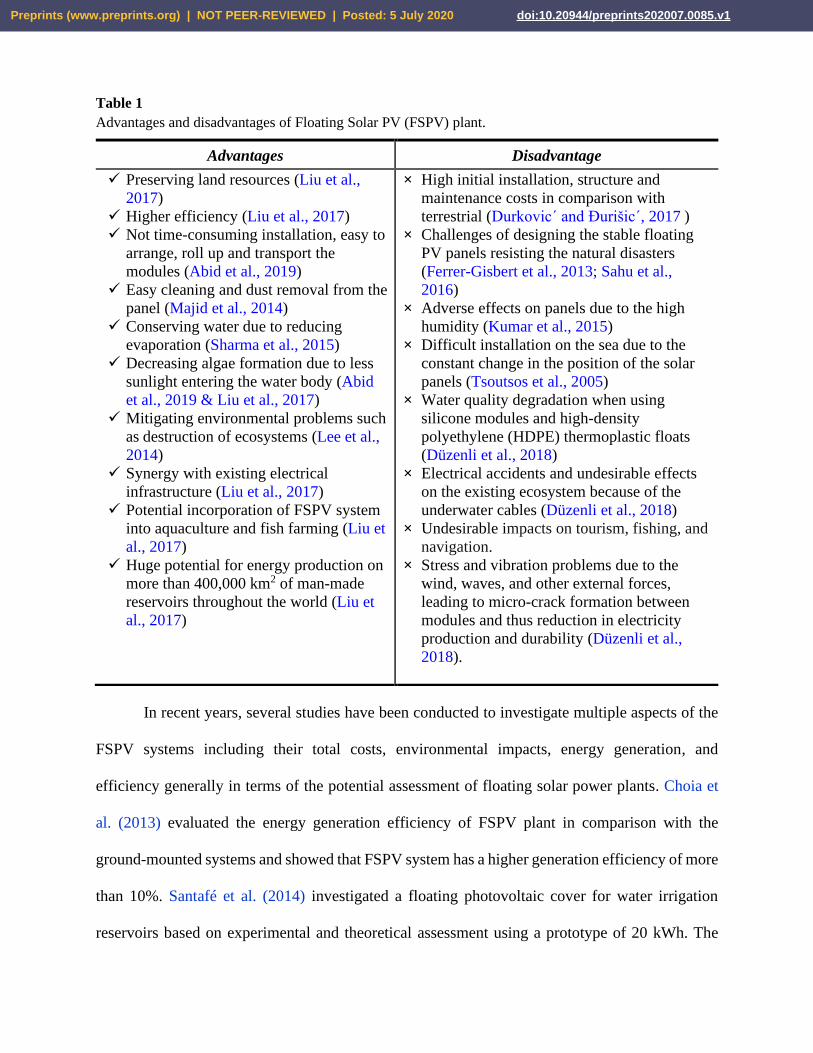
effectively utilize these systems. Many researchers have shown the advantages and disadvantages
of floating solar systems in comparison with the land-based ones (Table 1).
Despite the benefits of the FSPV, there is an important concern about the installation cost
of these systems. However, there is evidence that in the next ten years, the global average
installation cost of the utility-scale solar photovoltaics (PV) could fall by around 60% (Barbuscia,
2018). In general, total system costs for utility-scale PV systems are expected to decrease from
around 1.8 USD/W in 2015 to 0.8 USD/W in 2025, a reduction of 57% in 10 years. The majority
of the decrease in the costs is expected to come from a lower balance of system (BoS) costs.
Preprints (www.preprints.org) | NOT PEER-REVIEWED | Posted: 5 July 2020 doi:10.20944/preprints202007.0085.v1
Table 1
Advantages and disadvantages of Floating Solar PV (FSPV) plant.
In recent years, several studies have been conducted to investigate multiple aspects of the
FSPV systems including their total costs, environmental impacts, energy generation, and
efficiency generally in terms of the potential assessment of floating solar power plants. Choia et
al. (2013) evaluated the energy generation efficiency of FSPV plant in comparison with the
ground-mounted systems and showed that FSPV system has a higher generation efficiency of more
than 10%. Santafé et al. (2014) investigated a floating photovoltaic cover for water irrigation
reservoirs based on experimental and theoretical assessment using a prototype of 20 kWh. The
Advantages Disadvantage
✓ Preserving land resources (Liu et al.,
2017)
✓ Higher efficiency (Liu et al., 2017)
✓ Not time-consuming installation, easy to
arrange, roll up and transport the
modules (Abid et al., 2019)
✓ Easy cleaning and dust removal from the
panel (Majid et al., 2014)
✓ Conserving water due to reducing
evaporation (Sharma et al., 2015)
✓ Decreasing algae formation due to less
sunlight entering the water body (Abid
et al., 2019 & Liu et al., 2017)
✓ Mitigating environmental problems such
as destruction of ecosystems (Lee et al.,
2014)
✓ Synergy with existing electrical
infrastructure (Liu et al., 2017)
✓ Potential incorporation of FSPV system
into aquaculture and fish farming (Liu et
al., 2017)
✓ Huge potential for energy production on
more than 400,000 km2 of man-made
reservoirs throughout the world (Liu et
al., 2017)
× High initial installation, structure and
maintenance costs in comparison with
terrestrial (Durkovic´ and Đurišic´, 2017 ) × Challenges of designing the stable floating
PV panels resisting the natural disasters
(Ferrer-Gisbert et al., 2013; Sahu et al.,
2016)
× Adverse effects on panels due to the high
humidity (Kumar et al., 2015)
× Difficult installation on the sea due to the
constant change in the position of the solar
panels (Tsoutsos et al., 2005)
× Water quality degradation when using
silicone modules and high-density
polyethylene (HDPE) thermoplastic floats
(Düzenli et al., 2018)
× Electrical accidents and undesirable effects
on the existing ecosystem because of the
underwater cables (Düzenli et al., 2018)
× Undesirable impacts on tourism, fishing, and
navigation.
× Stress and vibration problems due to the
wind, waves, and other external forces,
leading to micro-crack formation between
modules and thus reduction in electricity
production and durability (Düzenli et al.,
2018).
Preprints (www.preprints.org) | NOT PEER-REVIEWED | Posted: 5 July 2020 doi:10.20944/preprints202007.0085.v1
case study was the zones near to the Spanish eastern Mediterranean coastline. They concluded that
FSPV system can improve the water and energy balances in areas having limited water resources
especially in arid and semi-arid zones. Teixeira et al. (2015) studied the feasibility of a floating
PV system operating at a hydropower station for water supply in southern Brazil. Their study
demonstrated that there is an initial cost of USD 1715.83/kW and energy cost of USD 0.059/kWh.
Hartzell (2016) evaluated FSPV potential on water management infrastructure. They modeled a
small pilot installation on Lake Pleasant Reservoir, Arizona. The results showed that hydropower
reservoirs could be ideal locations for floating photovoltaic installations within a sustainable
development paradigm.
Song and Choi (2016) analyzed the potential for FSPV system use on Mine Pit Lakes in
Korea in terms of solar site assessment, design of a photovoltaic system, and simulation of PV
system based on economic and GHG emission criteria. Liu et al. (2017) examined the power
generation efficiency of FSPV plant in terms of the variations in temperature and cooling effects
using a finite element model. The results demonstrated that there is a potential of 160 GW, utilizing
floating PV systems covering 2500 km2 water surface in China. This results in 2×1027 m3/year
water saving from evaporation and 1.25×10¹² m3/year indirect water-saving if water saved from
evaporation is being used by hydropower plant.
Durkovic ́and Đurišic´ (2017) conducted studies on a large Floating Photovoltaic Power
Plant (FPPP) with an innovative azimuth angle control method in Montenegro. Proper economic
savings and a significant reduction in CO2 emissions at this recommended power plant were the
results of this study. Kim et al. (2019) investigated the potential of FSPV use on 3401 reservoirs
in Korea. The results of this study showed an annual power production of 2932 GWh. Besides, the
annual reduction in greenhouse gas (GHG) was estimated at about 1294450 tons.
Preprints (www.preprints.org) | NOT PEER-REVIEWED | Posted: 5 July 2020 doi:10.20944/preprints202007.0085.v1
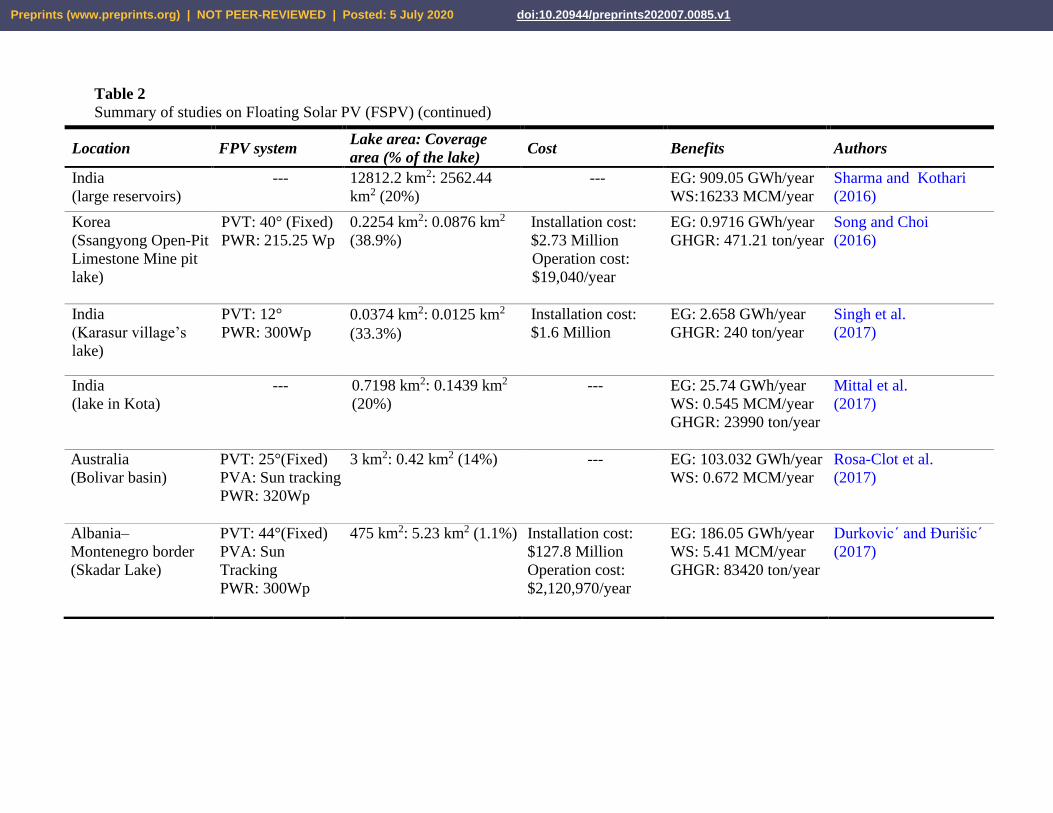
A comprehensive review of the literature was conducted to derive important aspects of the
floating solar PV (FSPV) projects implemented since 2013. The type of the FSPV system,
coverage area percentage, their benefits, and costs are summarized in Table 2.
Previous studies have shown that floating solar PV (FSPV) plants should be considered as
a promising alternative for energy production and to prevent surface evaporation in water bodies
due to their significant benefits. To date, there is not a scientific paper focusing on the potential
assessment of FSPV application in Iran and thus this study can pave the way for future studies.
The present study proposes a practical framework to evaluate the multiple aspects of using
FSPV systems based on their specific characteristics. The methodology is applied to Iran’s water
infrastructures. Five important reservoirs are selected as the representatives of the water
infrastructures within the five main basins of Iran and the potential for installing FSPV plant with
different coverage scenarios are investigated in terms of power that could be generated, amount of
water that can be saved from evaporation and the reduction in CO2 emissions. Moreover, an
economic analysis is carried out to estimate the total investment, the operation and maintenance
(O&M), and the energy production costs for each FSPV coverage scenario of the case studies. This
analysis is based on the variation of the economic parameters including the interest rate, the
availability factor for FSPV system, and the exploitation period of the system. Furthermore, the
expected years for returning the investment costs are estimated for each scenario of the case studies.
The paper has been organized as follows: Section 2 introduces the selected study areas for
the implementation of floating solar PV in Iran, proposes the process of the model and illustrates
the methodology for evaluating the governing factors such as water-saving, energy generation,
economic benefits and environmental advantages. In section 3, the proposed approach is applied
Preprints (www.preprints.org) | NOT PEER-REVIEWED | Posted: 5 July 2020 doi:10.20944/preprints202007.0085.v1
to the study areas and the results are presented and discussed. Finally, in section 4 the conclusions
and recommendations for future practical applications are presented.
Preprints (www.preprints.org) | NOT PEER-REVIEWED | Posted: 5 July 2020 doi:10.20944/preprints202007.0085.v1
Table 2
Summary of studies on Floating Solar PV (FSPV) system
Location FSPV system Lake area: Coverage
area (% of the lake) Cost Benefits Authors
USA
(Silver Lake)
PWR1: 305 Wp
0.4047 km²: 0.4047
km² (100%)
Value of water
saving per year:
$208,000
EG4: 53 GWh/year
WS5: 0.32 MCM/year
McKay
(2013)
Spain
(irrigation water
reservoir)
PVT2: 10° (Fixed)
PVA3: 0° (Fixed)
PWR: 240Wp
0.00449 km2: 0.00449
km2 (100%)
Installation cost:
$2.37/Wp
$242.1/m2
EG: 0.425 GWh/year
WS: 0.005 MCM/year
GRGH6: 72.71 ton/year
Santafé et al.
)2014 (
Brazil
(three reservoirs –
Castanhão, Orós and
Banabuiú)
--- Castanhão
40 km²: 2 km² (5%)
Orós
30.6 km²: 1.53 km²
(5%)
Banabuiú
17 km²: 0.85 km² (5%)
--- EG: 699.351 GWh/year
Sacramento et al.
(2015)
Canada
(McFaulds Lake)
Thin film FSPV 9.5 km2: 0.6857 km2
(7.2%)
Installation cost:
$6.62 Million
Operation cost:
$40,000/year
EG: 20.22 GWh/year
GHGR: 12048.9 ton/year
Trapani and Millar
)2016 (
Arizona state
(Lake Pleasant
Reservoir)
PVT: 12° (Fixed)
PVA: Sun tracking
PWR: either 43,637
modules with power
275Wp or 48,000
with 250Wp
17.118 km2: 0.12 km2
(0.7%)
Installation cost:
$33.6 Million
EG: 27.65 GWh/year
WS: 0.247222 MCM/year
Hartzell
(2016)
1The maximum electric power (PWR) 3Photovoltaic Azimuth angle (PVA), 5Water Saving (WS) 2Photovoltaic tilt angle (PVT) 4Energy Generation (EG); 6Greenhouse Gas Reduction (GHGR)
Preprints (www.preprints.org) | NOT PEER-REVIEWED | Posted: 5 July 2020 doi:10.20944/preprints202007.0085.v1
Table 2
Summary of studies on Floating Solar PV (FSPV) (continued)
Location FPV system Lake area: Coverage
area (% of the lake) Cost Benefits Authors
India
(large reservoirs)
--- 12812.2 km2: 2562.44
km2 (20%)
--- EG: 909.05 GWh/year
WS:16233 MCM/year
Sharma and Kothari
(2016)
Korea
(Ssangyong Open-Pit
Limestone Mine pit
lake)
PVT: 40° (Fixed) PWR: 215.25 Wp
0.2254 km2: 0.0876 km2
(38.9%)
Installation cost:
$2.73 Million
Operation cost:
$19,040/year
EG: 0.9716 GWh/year
GHGR: 471.21 ton/year
Song and Choi
(2016)
India
(Karasur village’s
lake)
PVT: 12°
PWR: 300Wp
0.0374 km2: 0.0125 km2
(33.3%)
Installation cost:
$1.6 Million
EG: 2.658 GWh/year
GHGR: 240 ton/year
Singh et al.
(2017)
India
(lake in Kota)
--- 0.7198 km2: 0.1439 km2
(20%)
--- EG: 25.74 GWh/year
WS: 0.545 MCM/year
GHGR: 23990 ton/year
Mittal et al.
(2017)
Australia
(Bolivar basin)
PVT: 25°(Fixed)
PVA: Sun tracking
PWR: 320Wp
3 km2: 0.42 km2 (14%) --- EG: 103.032 GWh/year
WS: 0.672 MCM/year
Rosa-Clot et al.
(2017)
Albania–
Montenegro border
(Skadar Lake)
PVT: 44°(Fixed)
PVA: Sun
Tracking
PWR: 300Wp
475 km2: 5.23 km2 (1.1%) Installation cost:
$127.8 Million
Operation cost:
$2,120,970/year
EG: 186.05 GWh/year
WS: 5.41 MCM/year
GHGR: 83420 ton/year
Durkovic´ and Đurišic´
(2017)
Preprints (www.preprints.org) | NOT PEER-REVIEWED | Posted: 5 July 2020 doi:10.20944/preprints202007.0085.v1
Table 2
Summary of studies on Floating Solar PV (FSPV) (continued)
Location FPV system Lake area: Coverage
area (% of the lake) Cost Benefits Authors
China
(water surface in the
eastern regions)
--- 124700 km2: 2500 km2
(2%)
--- EG: 160 GW/year
WS: 2×10²¹ MCM/year
Liu et al.
(2017)
Brazil
(São Francisco River
basin)
PVT: 3° (Fixed)
PWR: 250 Wp
6369.71 km2: 101.86 km2
(1.6%)
Installation cost:
(tilt angle = 0°)
$5726.81 Million
(tilt angle = 5°)
$6547.38 Million
EG: 10.5536 GWh/year Silvério et al.
(2018)
Portugal
(Alqueva dam)
PVT: 20° (Fixed)
PVA: 0° (Fixed)
PWR: 260 Wp
92200 km2: 0.00335 km2 Installation cost:
$3.51 Million
Operation cost:
$19,412.82/year
EG: 0.4557 GWh/year Barbuscia
(2018)
Taiwan
(site of Sugu, south of
Taiwan)
PVT: 12° (Fixed)
PVA: 82&-98°
(two fixed angle)
PWR: 295 Wp
0.03235 km2: 0.0091 km2
(28.27%)
Installation cost:
$1.6267 Million
Operation cost
$28,320/year
EG: 1.5433 GWh/year Dizier
(2018)
Bosnia and
Herzegovina
(Jablanica Lake)
PVT: 35° (Fixed)
PWR: 210 Wp
13 km2: 0.38025 km2
(less than 3%)
Installation cost:
$68.37 Million
Operation cost:
$4.39 Million/year
EG: 36.55 GWh/year Pašalić et al.
(2018)
USA
(man-made
waterbodies in the
contiguous United
States)
PVT: 11° (Fixed)
21410 km2: 5780.7 km2
(27%)
--- EG: 786000 GWh/year
WS: 36403 MCM/year
Spencer et al.
(2018)
Preprints (www.preprints.org) | NOT PEER-REVIEWED | Posted: 5 July 2020 doi:10.20944/preprints202007.0085.v1
Table 2 Summary of studies on Floating Solar PV (FSPV) (continued)
Location FPV system Lake area: Coverage
area (% of the lake) Cost Benefits Authors
Korea
(1134 reservoirs
which satisfy the
condition of FPP in
Korea)
PV: 20°
(Fixed)
PVA: South-
facing slope
(Fixed)
PWR: 210Wp
430.6 km2: 43.06 km2
(10%)
Installation cost:
$3,007.29 Million
Operation cost:
$21.83 Million/year
EG: 2931.94 GWh/year
GHGR: 1294450
ton/year
Kim et al.
(2019)
Vietnam
(three reservoirs –
Hoa Binh, Tri An
and Dau Tieng)
PVT: 11° (Fixed)
PVA: 0° (Fixed)
603.5 km²: 91.28 km²
(15%)
Installation cost:
$10300 Million
Operation cost:
$240 Million/year
EG: 13700 GWh/year
WS: 136 MCM/year
GHGR: 11000000
ton/year
Bui
(2019)
India
(Neel-Nirjan Dam
located in
Bakreswar)
PWR: 320Wp ---: 0.12 km² Installation cost:
$9.365 Million
Operation cost:
$221,075.4/year
EG: 14.97 GWh/year
WS: 0.21 MCM/year
GHGR: 13632.06
ton/year
Goswami et al.
(2019)
Brazil
(Gavião reservoir,
located in the
Northeast of Brazil)
PVT: 10° (Fixed)
PWR: 245Wp
6.17 km²: 5 km² (81%)
Installation cost:
$755 Million
Operation cost:
$4.674 Million/year
EG: 835.82 GWh/year
WS: 2.595 MCM/year
Rodrigues et al.
(2020)
Turkey
(Mumcular Dam
located in Aegean
Region of Turkey)
PVT: 33° (Fixed)
PVA: 0° (Fixed)
PWR: 350Wp
0.00301 km2 Installation cost:
$0.295 Million
Operation cost:
$18,203/year
EG: 0.182 GWh/year
Temiz and Javani
(2020)
Preprints (www.preprints.org) | NOT PEER-REVIEWED | Posted: 5 July 2020 doi:10.20944/preprints202007.0085.v1
2. Materials and Methods
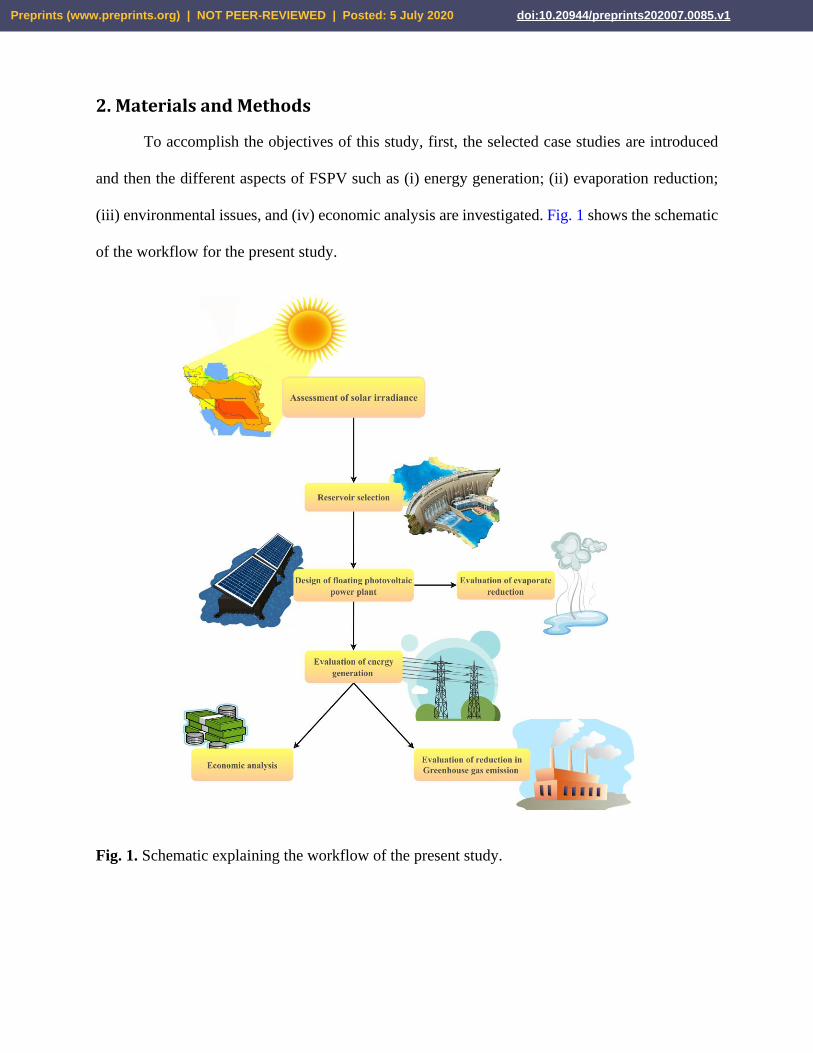
To accomplish the objectives of this study, first, the selected case studies are introduced
and then the different aspects of FSPV such as (i) energy generation; (ii) evaporation reduction;
(iii) environmental issues, and (iv) economic analysis are investigated. Fig. 1 shows the schematic
of the workflow for the present study.
Fig. 1. Schematic explaining the workflow of the present study.
Preprints (www.preprints.org) | NOT PEER-REVIEWED | Posted: 5 July 2020 doi:10.20944/preprints202007.0085.v1
2.1 Study Area
Based on the divisions made by the Ministry of Energy in Iran, the catchment area of the
country includes six main basins equal to the total area of the country, each of which is itself
divided into small basins. These six main basins are: 1- Khazar basin, 2- Persian Gulf and Oman
Sea basin, 3- Urmia Lake basin, 4- Central plateau (Markazi) basin, 5- Hamoon basin, 6- Sarakhs
basin.
Currently, there are 383, 365, 104, 314, 71 and 40 dams in the Khazar, Persian Gulf, Urmia,
Markazi, Hamoon and Sarakhs basins, respectively, under operation, implementation and study.
A total of 647 reservoirs having a volume of more than 48 BCM are in operation, with the Persian
Gulf catchment area accounting for the largest share in the reservoir volume. In addition, 683 dams
are in two stages of implementation or study. If they reach the stage of operation, 75 BCM will be
added to the current capacity. These capacities indicate the high potential for developing FSPV
systems in Iran. In this study, to evaluate a portion of this capacity, the five important dams in five
main basins with the largest area of the reservoir are selected, namely Aras, Karkheh, Shahid
Kazemi, Doroudzan, Doosti dams (Fig. 2). It should be noted that while the annual evaporation
volume in Hamoon basin is significant, no dam has been selected from this basin since there is not
enough data for conducting the research. However, the results of this study could effectively pave
the way for the application of FSPV in Hamoon basin in future.
To have better insights into the application of the FSPV power plant, several scenarios of
the coverage percentage of dam’s lake such as 2, 10, 20, 50 and 80% are adopted. Although, the
implementation of the scenarios 50% and 80% is economically and administratively unjustifiable,
these scenarios can better highlight the theoretical potential for harvesting the solar energy from
the surface of water bodies.
Preprints (www.preprints.org) | NOT PEER-REVIEWED | Posted: 5 July 2020 doi:10.20944/preprints202007.0085.v1
Fig. 2 represents the location of the selected dams within the six solar radiation zones,
which has been specified by Iran's Renewable Energy Organization (http://www.satba.gov.ir/).
The amount of solar radiation varies in different parts of the world and has the highest amount in
the solar belt of the earth. Iran is also located in areas with high radiation and studies show that the
use of solar equipment in Iran is appropriate and can provide part of the country's energy needs.
Having 300 sunny days in more than two-thirds of the country and average radiation of 4.5~5.5
kWh/m2day, Iran has been introduced as one of the countries with high potential in the field of
solar energy. As can be seen in Fig. 2, Iran has been divided into six areas based on the potential
of solar radiation. The central and southern regions of the country receive a higher amount of solar
radiation, whereas the cities in the northern part near the Caspian Sea absorb the lowest amount of
radiation. Three of the selected dams namely Aras, Doosti, and Shahid Kazami are located at
regions with minimum solar irradiation of 3.8 kWh/m2day. Karkheh and Doroudzan dams receive
solar radiation at a higher intensity of at least 4.5 and 5.2 kWh/m2day, respectively. The specific
characteristics of the selected dams are briefly explained as follows.
Preprints (www.preprints.org) | NOT PEER-REVIEWED | Posted: 5 July 2020 doi:10.20944/preprints202007.0085.v1
1
2
3
4
5
. 6
7
8
9
10
11
12
Fig. 2. Map of potential solar radiation in main basins of Iran and the location of the selected dams. 13
Min Solar Irradiation
𝑘𝑊ℎ
𝑚2𝑑𝑎𝑦
Preprints (www.preprints.org) | NOT PEER-REVIEWED | Posted: 5 July 2020 doi:10.20944/preprints202007.0085.v1
Aras Dam (Khazar Basin). Aras Dam is an embankment dam located 40 kilometers from the
town of Jolfa on the Aras River on the border of Iran and Azerbaijan. Construction and operation
of this dam have been done jointly by Iran and the Republic of Azerbaijan
(http://www.azarwater.ir/). The purpose of this reservoir dam is to supply agricultural water and
generate electricity. The total volume and area of the reservoir are 1254 MCM and 15200 ha in
normal water elevation (NWL), respectively. It generates about 172000 GWh of electricity per
year (86000 GWh per share). The dam consists of four turbines (two in each side) with a total
power of 44 MW (11 MW each). Aras Dam Lake has a great variety of freshwater fish and is a
good tourist and fishing destination. About 167 MCM of water is evaporated annually which is the
highest amount of evaporation in the Khazar Basin (http://daminfo.wmr.ir).
Karkheh Dam (Persian Gulf and Oman sea Basin). Karkheh Dam is located 21 km north-west
of the city of Andimeshk. The objectives of the dam are (1) storage and management of irrigation
water of 320,000 hectares of land in the downstream plains located in the northwest and west of
the province of Khuzestan, (2) generation of hydroelectric power of 934 GWh per year, and (3)
prevention of devastating flooding (Haghiabi et al., 2009). The maximum area and volume of the
lake in NWL are 16600 ha and 5600 MCM, respectively. In this dam, 334.14 MCM of water is
evaporated annually.
Shahid Kazemi Dam (Urmia Lake Basin). Shahid Kazemi (hereinafter referred to as Kazemi)
dam located in Boukan city of west Azarbaijan province was built on Zarrineh River (Emami et
al. 2019). The purposes of the construction of Shahid Kazemi dam were to irrigate 85000 ha of
Miandoab plain lands, control of destructive floods, adjust the water level of the Zarrineh River,
supply the drinking water of upstream and downstream cities and protect aquatic ecosystems. The
Preprints (www.preprints.org) | NOT PEER-REVIEWED | Posted: 5 July 2020 doi:10.20944/preprints202007.0085.v1
maximum area and volume of the lake in NWL are 4150 ha and 808 MCM, respectively. In this
dam, 41.1 MCM of water is evaporated annually.
Doroudzan Dam (Markazi Basin). Doroudzan Dam is one of the largest dams in southern Iran.
The reservoir of this multipurpose earth-fill dam is located near the northwest of Shiraz on the Kor
River and in the Bakhtegan Lake catchment area. The total storage capacity of the reservoir is 993
MCM. This reservoir is the main source of water supply for 112,000 hectares of agricultural land,
domestic-industrial needs, and power plant of Shiraz, the capital of the province of Fars (Goodarzi
et al., 2014). The maximum area of the lake in NWL is 5500 ha. The annual evaporation volume
is 94.38 MCM.
Doosti Dam (Sarakhs Basin). Doosti Dam was jointly built by Turkmenistan and Iran on the
Harirood River at the boundary of both countries, 180 km north-east of the city of Mashhad. It is
a rockfill dam having a storage capacity of 1,250 MCM (Mozafari et al., 2012). This dam provides
irrigation and municipal water to both Iran and Turkmenistan. (Majidi et al.,2015; Ghandehari et
al., 2020). The maximum area of the lake in NWL is 4932 ha. Since this dam is situated in a semi-
arid region of Iran, water evaporation is of great importance. About 83 MCM of water is
evaporated annually which is the highest amount of evaporation in the Sarakhs basin.
2-2 Energy Generation
Hourly energy generation (𝑊) by the FSPV can be estimated as follows (Durkovic and
Đurišic´, 2017):
𝑊 = 𝐼 × 𝐴 × 𝜂 (1)
where 𝐼 is mean hourly insolation and 𝐴 is the covered area by the floating panels of efficiency 𝜂,
which is determined as
Preprints (www.preprints.org) | NOT PEER-REVIEWED | Posted: 5 July 2020 doi:10.20944/preprints202007.0085.v1
𝜂 = 𝜂𝑚𝑜𝑑𝑢𝑙𝑒 × 𝜂𝑡𝑒𝑚𝑝 × 𝜂𝑖𝑛𝑣𝑒𝑟𝑡𝑜𝑟 (2)
where 𝜂𝑚𝑜𝑑𝑢𝑙𝑒 is the degree of efficiency of a module, 𝜂𝑡𝑒𝑚𝑝 is the PV conversion efficiency, and
𝜂𝑖𝑛𝑣𝑒𝑟𝑡𝑜𝑟 is the efficiency of the invertor. In this paper based on the selected PV panel 1
(polycrystalline 157×157 mm cell with peak power watts of 260 Wp and module dimensions of
1640×992×35 mm), 𝜂𝑚𝑜𝑑𝑢𝑙𝑒 and 𝜂𝑖𝑛𝑣𝑒𝑟𝑡𝑜𝑟 were adopted as 0.1601 and 0.96, respectively. 𝜂𝑡𝑒𝑚𝑝
is calculated by Eq. (3).
𝜂𝑡𝑒𝑚𝑝 = 𝜂𝑠𝑡𝑐[1 − 0.0047 × ( 𝑇𝑝𝑎𝑛𝑒𝑙 − 25◦)] (3)
where 𝜂𝑠𝑡𝑐 is an efficiency defined for a panel when utilizing it in a standard condition (stc), 0.0047
is the temperature coefficient of power of PV panel (-0.47 %/°C) and 𝑇𝑝𝑎𝑛𝑒𝑙 is the temperature of
a PV panel that is estimated according to the following formula:
𝑇𝑝𝑎𝑛𝑒𝑙 = 𝑇𝑎𝑚𝑏 + (𝑁𝑂𝐶𝑇 − 20
0.8) × 𝐼
(4)
where 𝑁𝑂𝐶𝑇 is the operation cell temperature that is 44° based on selected PV panel in this study
and 𝑇𝑎𝑚𝑏 is the ambient air temperature that was assumed equal to the temperature of dam’s lake
area.
2-3 Evaporation estimation
Preventing evaporation by the PV plant is not only for the area covered by them but also
for the entire lake’s surface. The reduction of water evaporation occurs due to the two main reasons.
The first reason is the reduction in water and air interaction from the covered area which directly
affects the evaporation reduction. The second reason is the change in the heat balance of the lake
1 The trade name of the module is SSF-P60 produced by Solar Sanat Firouzeh Co. (www.ssf-solar.com)
Preprints (www.preprints.org) | NOT PEER-REVIEWED | Posted: 5 July 2020 doi:10.20944/preprints202007.0085.v1
after the power plant being built which causes the lake to be colder and thus reduces the total
evaporation throughout the entire lake’s surface (Durkovic ́and Đurišic´, 2017).
Estimating evaporation appropriately is essential. However, a large number of parameters
influence the process for estimating water evaporation such as air saturation deficit above the
surface, wind speed, the amount of solar radiation reaching the water surface, air pressure, and the
chemical characteristics of water. The evaporation rate in water surfaces has been studied in the
literature utilizing different models. Generally, water budget, mass transfer, pan evaporation,
Penman-Monteith model, and energy balance method are used to measure evaporation.
Furthermore, many empirical relations and equations have been developed incorporating
temperature, solar day hours, and solar radiation.
Penman’s method is one of the most frequently used methods among many mathematical
methods that has been modified in different ways (Penman, 1948; Jensen, 2010). Valiantzas (2006)
defined this equation in a simplified way using routine weather data as follows:
𝐸0 ≈ 0.051(1 − 𝛼) × 𝑅𝑆 × √𝑇 + 9.5 − 2.4 (𝑅𝑆
𝑅𝐴)
2
+ 0.052 × (𝑇 + 20)(1
−𝑅𝐻
100) × (𝑎𝑢 − 0.38 + 0.54𝑢)
(5)
where E0 is the average daily water surface evaporation (mm/day) at the sea level (𝑧 = 0), and 𝑅𝑠
is the average sunny hours per day, calculated as follows:
𝑅𝑆 = 𝑅𝐴 × (0.5 + 0.25𝑛
𝑁) (6)
where n and N are the observed average number of sunny days and the maximum possible number
of sunny days for the selected month, respectively. Having geographic width φ, for a selected
month (𝑖), N can be calculated as follows:
Preprints (www.preprints.org) | NOT PEER-REVIEWED | Posted: 5 July 2020 doi:10.20944/preprints202007.0085.v1
𝑁 ≈ 4 × 𝜙 × 𝑠𝑖𝑛(0.53𝑖 − 1.65) + 12 (7)
The solar irradiance on the surface of the atmosphere (𝑅𝐴) is approximated as follows:
𝑅𝐴 = 3𝑁𝑠𝑖𝑛(0.131𝑁 − 0.95𝜙) |𝜙| >23.5𝜋
180
𝑅𝐴 = 118𝑁0.2 𝑠𝑖𝑛(0.131𝑁 − 0.2𝜙) |𝜙| <23.5𝜋
180
(8)
where α denotes the reflection coefficient called albedo. It is related to the water surface that ranges
from 0 to 1 and supposed to be 0.08 in this study. T is the average of extreme temperatures
(𝑇𝑚𝑖𝑛, 𝑇𝑚𝑎𝑥) for the analyzed month (◦C):
𝑇 =𝑇𝑚𝑎𝑥 + 𝑇𝑚𝑖𝑛
2
(9)
Daily mean percentage of relative air humidity is represented by 𝑅𝐻 and u is the average
value of wind speed (m/s) at an altitude of 2 m above the water surface.
Equation (6) is adjusted empirically for higher altitudes z (m) (Valiantzas, 2006):
𝐸 = 𝐸0 + 0.00012 × 𝑧 (10)
The daily volume of water evaporated can be determined by multiplying the amount of
evaporation (𝐸) by area of the lake (𝐴):
𝑉(𝑚3/𝑑𝑎𝑦) = 𝐸(𝑚/𝑑𝑎𝑦) × 𝐴𝐿𝑎𝑘𝑒(𝑚2) (11)
To find out how much water can be saved by implementing FSPV system, the amount of
evaporation (𝐸) is multiplied by the FSPV coverage area 𝐴𝐶𝐴 as follows:
∆𝑉(𝑚3/𝑑𝑎𝑦) = 𝑘 × 𝐸(𝑚/𝑑𝑎𝑦) × 𝐴𝐶𝐴(𝑚2) (12)
Preprints (www.preprints.org) | NOT PEER-REVIEWED | Posted: 5 July 2020 doi:10.20944/preprints202007.0085.v1
where 𝑘 is a reduction factor determined by the type and platform's reflective functionality, its
coverage level with panels, and the panel’s performance. This coefficient decreases the
evaporation volume due to the fact that a portion of solar irradiance passes through panels and
reaches the water surface.
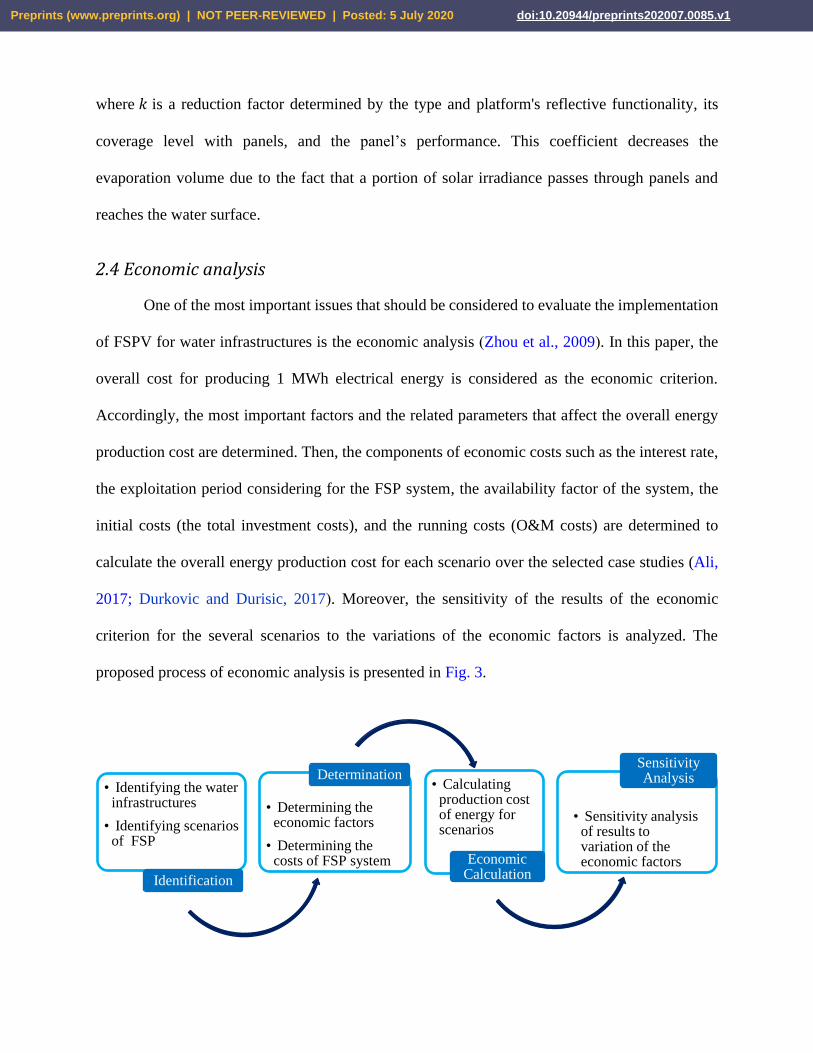
2.4 Economic analysis
One of the most important issues that should be considered to evaluate the implementation
of FSPV for water infrastructures is the economic analysis )Zhou et al., 2009(. In this paper, the
overall cost for producing 1 MWh electrical energy is considered as the economic criterion.
Accordingly, the most important factors and the related parameters that affect the overall energy
production cost are determined. Then, the components of economic costs such as the interest rate,
the exploitation period considering for the FSP system, the availability factor of the system, the
initial costs (the total investment costs), and the running costs (O&M costs) are determined to
calculate the overall energy production cost for each scenario over the selected case studies (Ali,
2017; Durkovic and Durisic, 2017(. Moreover, the sensitivity of the results of the economic
criterion for the several scenarios to the variations of the economic factors is analyzed. The
proposed process of economic analysis is presented in Fig. 3.
• Identifying the water infrastructures
• Identifying scenarios of FSP
Identification
• Determining the economic factors
• Determining the costs of FSP system
Determination• Calculating
production cost of energy for scenarios
Economic Calculation
• Sensitivity analysis of results to variation of the economic factors
Sensitivity Analysis
Preprints (www.preprints.org) | NOT PEER-REVIEWED | Posted: 5 July 2020 doi:10.20944/preprints202007.0085.v1
Fig. 3. The proposed workflow for economic analysis process of FSPV plant.
The overall energy production cost (EPC) for FSPV is calculated as follows (Masters, 2004;
Durkovic and Durisic, 2017)
𝐸𝑃𝐶 (𝑈𝑆𝐷
𝑀𝑊ℎ) =
(𝐼𝑅 × (1 + 𝐼𝑅)𝑡
(1 + 𝐼𝑅)𝑡 − 1) × 𝐼𝐶𝑡𝑜𝑡(𝑈𝑆𝐷)
𝐴𝐹 × 𝐸𝑡𝑜𝑡(𝑀𝑊ℎ)+ 𝑂𝑀𝐶(
𝑈𝑆𝐷
𝑀𝑊ℎ)
(13)
where 𝐸𝑃𝐶 is the total price for producing 1 MWh electrical energy, which is called the overall
energy production cost (𝑈𝑆𝐷/𝑀𝑊ℎ). In Eq. (13), 𝐼𝑅 is the interest rate that is considered as an
internal rate of return (IRR), 𝑡 is the exploitation period of the FSPV plant that is named also the
amortization period (𝑦𝑒𝑎𝑟), and 𝐴𝐹 is the availability factor that is related to the availability of
grid during the exploitation period. 𝐼𝐶𝑡𝑜𝑡 and 𝑂𝑀𝐶 denote the total investment costs as the total
initial costs ( 𝑈𝑆𝐷 ) and the O&M costs as the running costs during the operation period
(𝑈𝑆𝐷/𝑀𝑊ℎ), respectively. 𝐸𝑡𝑜𝑡 is the annual production of electrical energy from the FSPV plant
(𝑀𝑊ℎ).
To calculate the overall energy production cost for each scenario based on Eq. (13), first,
the effective economic factors in this equation should be determined. The interest rate, which refers
to the internal rate of return (IRR) (Desideri and Asdrubali, 2019), is considered as an integer
number in the interval of [0,24] in term of percentage. The sensitivity analysis is accomplished
over the entire range of interest rate percentage (Durkovic and Durisic, 2017). The exploitation
period of the FSPV system, which is started from the end of the construction phase and terminated
at the end of the operation phase, is considered between 20-25 years (Sahel Ettehad Co., 2020;
Durkovic and Durisic, 2017). Accordingly, the sensitivity analysis is carried out for the six cases
of exploitation period including 20, 21, 22, 23, 24, and 25 years. Moreover, the availability factor
Preprints (www.preprints.org) | NOT PEER-REVIEWED | Posted: 5 July 2020 doi:10.20944/preprints202007.0085.v1
of the FSPV system, which is related to the availability of the grid and maintaining the existing
desirable conditions of efficiency of the FSP panel during the exploitation period, is analyzed with
the six values including 0.70, 0.75, 0.80, 0.85, 0.90 and 0.95 (Masters, 2004; Durkovic and Durisic,
2017).
The total investment costs (𝐼𝐶𝑡𝑜𝑡) is calculated as follows:
𝐼𝐶𝑡𝑜𝑡(𝑈𝑆𝐷) = 𝐶𝑖𝑛𝑣𝑒𝑟𝑡𝑜𝑟 + 𝐶𝑝𝑎𝑛𝑒𝑙 + 𝐶𝑠𝑡𝑟𝑢𝑐𝑡𝑢𝑟𝑒 + 𝐶𝑖𝑛𝑠𝑡𝑎𝑙𝑙𝑎𝑡𝑖𝑜𝑛 (14)
where 𝐶𝑖𝑛𝑣𝑒𝑟𝑡𝑜𝑟 is the invertor cost (𝑈𝑆𝐷), 𝐶𝑝𝑎𝑛𝑒𝑙 is the panel cost (𝑈𝑆𝐷), 𝐶𝑠𝑡𝑟𝑢𝑐𝑡𝑢𝑟𝑒 is the floating
structure cost (𝑈𝑆𝐷) and 𝐶𝑖𝑛𝑠𝑡𝑎𝑙𝑙𝑎𝑡𝑖𝑜𝑛 is the installation cost (𝑈𝑆𝐷). Each of these costs should be
determined for each of the FSPV scenarios. The four items of the total investment costs in Eq. (14)
could be estimated according to the economic data obtained from the consultant companies that
have knowledge and experience in the design, construction, and exploitation processes of installing
FSPV (Sahel Ettehad Co., 2020). It is noteworthy that the scale and type of FSPV plant affect the
overall costs (Ferrer-Gisbert et al., 2013). Our investigations revealed that the investment costs in
the FSPV systems have been estimated 30% higher than the corresponding costs for PV power
plants on the ground.
The following considerations have been taken into account in order to estimate the total
investment cost: (1) the information about the utilized cell material (crystalline silicon), module
cover (glass), array type (fixed open rack), azimuth (180°) and the optimal tilt (25° for some of
case studies and 30° for the others) are determined; (2) the annual produced energy (𝐸𝑡𝑜𝑡) is
estimated for each coverage percentage scenarios; (3) for each coverage scenario of each case
study, the relevant nominal capacity of the FSPV is calculated by dividing 𝐸𝑡𝑜𝑡 by the annual
average sunny hours; (4) according to the energy generation results and the economic information,
Preprints (www.preprints.org) | NOT PEER-REVIEWED | Posted: 5 July 2020 doi:10.20944/preprints202007.0085.v1
the total investment costs for unit power of FSPV power plant (1 MWp) is estimated 650000
(𝑈𝑆𝐷/𝑀𝑊ℎ) (Sahel Ettehad Co., 2020); (5) with respect to the nominal capacity of the FSPV
system as well as the overall investment costs for unit power, the total investment costs (𝐼𝐶𝑡𝑜𝑡) is
calculated.
In order to estimate the O&M costs for the FSPV, recent studies have been considered. The
international renewable energy agency (IREA) suggested 6.5 𝑈𝑆𝐷/𝑘𝑊𝑦𝑒𝑎𝑟 as the fixed annual
O&M costs in evaluating the cost-efficiency for PV systems (IREA, 2012). Hammad et al. (2015)
considered 12 𝑈𝑆𝐷/𝑘𝑊𝑝/𝑦𝑒𝑎𝑟 as the annual O&M costs for a 20 𝑀𝑊𝑝 PV power plant.
Bolinger and Seel (2015) expressed that the mean O&M costs of the ground PV power plants have
been gradually decreased from about 19 𝑈𝑆𝐷/𝑀𝑊ℎ in 2011 to about 8 𝑈𝑆𝐷/𝑀𝑊ℎ in 2014. In
2016, according to the USA energy information administration, the O&M costs for one-axis solar
tracker power plant related to a 20 𝑀𝑊𝑝 power are slightly higher compared with the O&M costs
of a fixed inclination and azimuth angle with the same power (USA energy information
administration, 2016). Whaley (2016) investigated the annual O&M costs of large and small PV
power plant systems and recommended 0.5% and 1% of initial costs for the large and small systems,
respectively. Durkovic and Durisic (2017) recommended 10 𝑈𝑆𝐷/𝑀𝑊ℎ as O&M costs for FSPV
systems, which is considerably higher than the O&M costs for large-scaled ground PV power
plants. In this paper, regarding the previous studies and the recommendations of the Iranian
consultant companies, the O&M cost is estimated at about 5~10 𝑈𝑆𝐷/𝑀𝑊ℎ depending on the
scale of scenarios. Consequently, the annual benefit and the required years for returning the
investment costs could be estimated (Sahel Ettehad Co., 2020). Furthermore, the sensitivity
analysis process on the economic results is accomplished based on the variations of the economic
factors.
Preprints (www.preprints.org) | NOT PEER-REVIEWED | Posted: 5 July 2020 doi:10.20944/preprints202007.0085.v1
2.5 Environmental impact analysis
As the operation of the FSPV is associated with some environmental consequences, besides
its advantages, mitigating negative effects is one of the governing factors in building procedures
(Durkovic and Durišic, 2017). Life cycle assessment (LCA) is a common tool for the evaluation
of the human activities’ potential outcomes (Hou et al., 2015; Raouz, 2017). Environmental
impacts of constructing FSPV include the primary energy return on investment, global warming
potential, and eutrophication potential.
The total life cycle energy input of the FSPV station is calculated using Eq. 15 in which i
i denotes the life cycle stages from manufacturing to dismantling.
𝐸𝑡𝑜𝑡 = ∑ 𝐸𝑖
𝑖=1
, 𝑖 = 1, … , 𝑛 (15)
The energy payback time (EPBT), represents the required time to produce the same amount
of energy that was consumed for FSPV construction (Raouz 2017). For the estimation of EPBT,
𝐸tot is the total energy input during the construction of the FSPV station and 𝐸yr is the annual energy
production:
𝐸𝑃𝐵𝑇 =𝐸𝑡𝑜𝑡
𝐸𝑦𝑟
(16)
Another index for addressing environmental issues in FSPV analysis is the environmental
impact indicator. This indicator includes eutrophication potential and global warming potential
(GWP) regarding the GHG reduction. A significant advantage of FSPV is related to the algae
bloom containment. This problem can be alleviated by covering the basin partially and reducing
the light below the surface (Cazzaniga et al., 2018).
Preprints (www.preprints.org) | NOT PEER-REVIEWED | Posted: 5 July 2020 doi:10.20944/preprints202007.0085.v1
The impact of FSPV system on the reduction of greenhouse gas emissions is estimated
using Eq. 17. It is obtained based on the generated greenhouse gases within a fossil-fuel energy
system producing the same amount of electricity generation (Durkovic and Durišic, 2017)
𝐺𝑡 = 𝐸𝑠 × 𝐺 × (1 + 𝛽) (17)
where 𝐺𝑡 represents the annual reduction of GHG (tCO2/year), 𝐸𝑠 is annual energy production
(MWh/year), 𝐺 is a standard value of GHG emissions for the country of the study area
(tCO2/MWh), and 𝛽 is a dimensionless parameter denoting the average loss rate related to the
power transmission and distribution systems.
3. Results and Discussion
3.1. Energy Production
3.1.1. Mean hourly insolation (I)
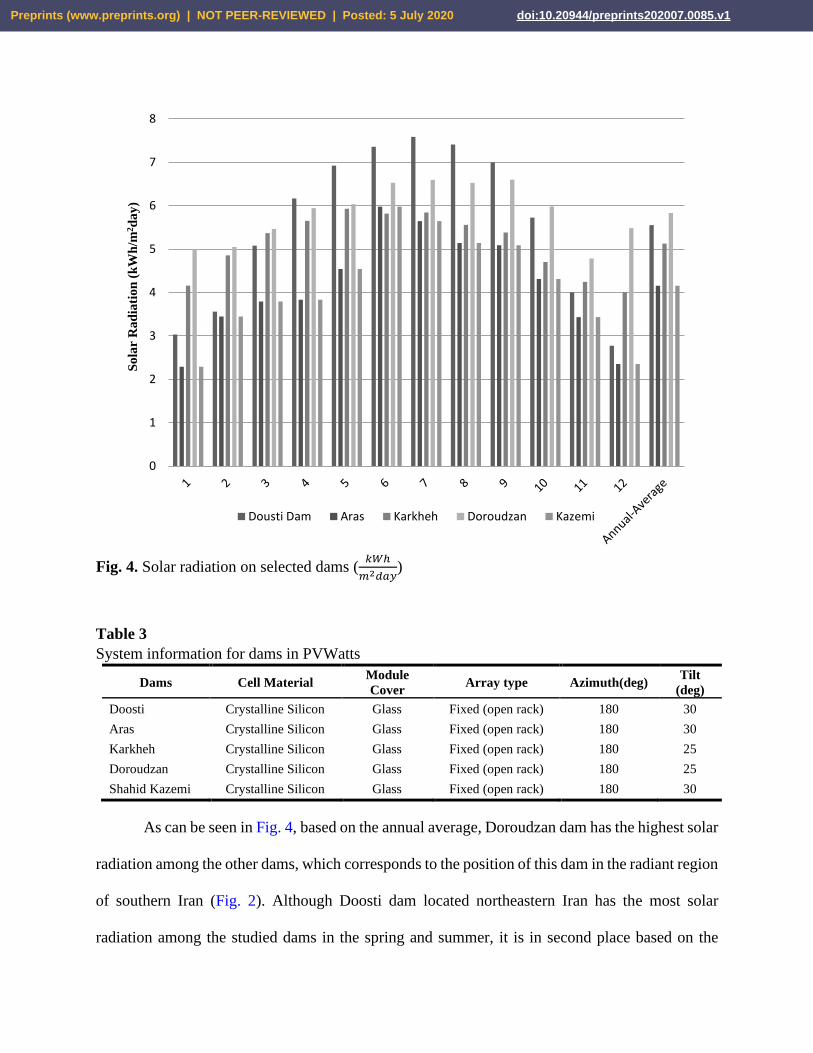
NREL information network and the PVWatts calculator (https://pvwatts.nrel.gov/) were
used to calculate the amount of I (kWh/m2day) for each of the studied dams in a monthly scale.
The results can be seen in Fig. 4. For calculating I, the specifications considered in the PVWatts
tool were based on the SSF-P60 solar cell provided by Solar Sanat Firouzeh company
(http://www.ssf-solar.com/) )See Table 3). It should be noted that the optimal tilt angle for each
dam is calculated separately.
Preprints (www.preprints.org) | NOT PEER-REVIEWED | Posted: 5 July 2020 doi:10.20944/preprints202007.0085.v1
Fig. 4. Solar radiation on selected dams (𝑘𝑊ℎ
𝑚2𝑑𝑎𝑦)
Table 3
System information for dams in PVWatts
Dams Cell Material Module
Cover Array type Azimuth(deg)
Tilt
(deg)
Doosti Crystalline Silicon Glass Fixed (open rack) 180 30
Aras Crystalline Silicon Glass Fixed (open rack) 180 30
Karkheh Crystalline Silicon Glass Fixed (open rack) 180 25
Doroudzan Crystalline Silicon Glass Fixed (open rack) 180 25
Shahid Kazemi Crystalline Silicon Glass Fixed (open rack) 180 30
As can be seen in Fig. 4, based on the annual average, Doroudzan dam has the highest solar
radiation among the other dams, which corresponds to the position of this dam in the radiant region
of southern Iran (Fig. 2). Although Doosti dam located northeastern Iran has the most solar
radiation among the studied dams in the spring and summer, it is in second place based on the
0
1
2
3
4
5
6
7
8S
ola
r R
ad
iati
on
(k
Wh
/m2d
ay
)
Dousti Dam Aras Karkheh Doroudzan Kazemi
Preprints (www.preprints.org) | NOT PEER-REVIEWED | Posted: 5 July 2020 doi:10.20944/preprints202007.0085.v1
average annual solar radiation. Karkheh dam is in the third place after Doosti Dam with average
annual radiation of 5.13 kWh/m2day. Shahid Kazemi and Aras dams, which are located in
northwestern parts of Iran, have the lowest amount of solar radiation among the selected dams.
3.1.2. Yearly energy production
As mentioned earlier, the total annual energy production values in the studied dams with
different coverage percentages were calculated which can be seen in Fig. 5.
.kWh) 610of PV panels in different dams ( production energynnual A .5 .Fig
0
5000
10000
15000
20000
25000
30000
35000
40000
45000
Doosti Aras Karkheh Doroudzan Kazemi
An
nu
al
ener
gy
pro
du
ctio
n (
10
6k
Wh
)
2% 10% 20% 50% 80%
Preprints (www.preprints.org) | NOT PEER-REVIEWED | Posted: 5 July 2020 doi:10.20944/preprints202007.0085.v1
Table 4
Comparison of electricity generated by solar panel system compared to conventional fossil fuel
methods.
Type of energy Dam FSPV coverage percentages
2% 10% 20% 50% 80%
Energy generated
(106 kWh)
Doosti 235.71 591.47 972.41 282.79 161.49
Aras 1178.53 2959.22 4862.03 1413.94 807.44
Karkheh 2357.06 5918.43 9724.07 2827.89 1614.88
Doroudzan 5892.64 14796.08 24310.17 7069.71 4037.20
Kazemi 9428.23 23673.73 38896.27 11311.54 6459.51
Equivalent thermal
value (kCal)
Doosti 5.08E+11 2.54E+12 5.08E+12 1.27E+13 2.03E+13
Aras 1.28E+12 6.38E+12 1.28E+13 3.19E+13 5.11E+13
Karkheh 2.10E+12 1.05E+13 2.10E+13 5.24E+13 8.39E+13
Doroudzan 6.10E+11 3.05E+12 6.10E+12 1.52E+13 2.44E+13
Kazemi 3.48E+11 1.74E+12 3.48E+12 8.71E+12 1.39E+13
Equivalent fossil fuel
(Gas) (MCM)
Doosti 58.93 294.63 589.26 1473.16 2357.06
Aras 147.87 739.80 1479.61 3699.02 5918.43
Karkheh 243.10 1215.51 2431.02 6077.54 9724.07
Doroudzan 70.70 353.49 706.97 1767.43 2827.89
Kazemi 40.37 201.86 403.72 1009.30 1614.88
Equivalent fossil fuel
(Oil) (106 No.
Barrels)
Doosti 0.35 1.74 3.47 8.69 13.90
Aras 0.87 4.36 8.73 21.81 34.90
Karkheh 1.43 7.17 14.34 35.84 57.34
Doroudzan 0.42 2.08 4.17 10.42 16.68
Kazemi 0.24 1.19 2.38 5.95 9.52
As can be seen in Fig. 5, the electricity generated by the selected dams is in line with the
lake area behind the dams. Accordingly, Karkheh dam has the highest amount of electricity with
an annual production of 972.4 GWh and 38900 GWh for 2% and 80% coverages, respectively. It
is noteworthy that the generated electricity resulted from 2% coverage is approximately similar to
the energy that is currently generated by the hydropower plant at Karkheh dam. Shahid Kazemi
dam has the lowest amount among the selected dams which is 161.5 GWh and 6500 GWh for 2
and 80% coverage, respectively. In order to evaluate the electricity generated by the FSPV in
comparison with the common ways of energy generations, the equivalent fuels required to generate
that amount of energy has been calculated. To generate every kWh of electricity in Iran, 2157 kcal
Preprints (www.preprints.org) | NOT PEER-REVIEWED | Posted: 5 July 2020 doi:10.20944/preprints202007.0085.v1
of energy is burned. Accordingly, burning every cubic meter of gas in Iran's thermal power plants
produces 4 kWh and each barrel of crude oil produces about 680 kWh of electricity. As can be
seen in Table 4, in Karkheh and Shahid Kazemi dams, which have the highest and lowest electricity
generation, only 2% coverage of the lake's surface can generate power equivalent to burning 243
and 40 MCM Gas and 1,400,000 and 238,000 barrels of crude oil in Iran's thermal power plants.
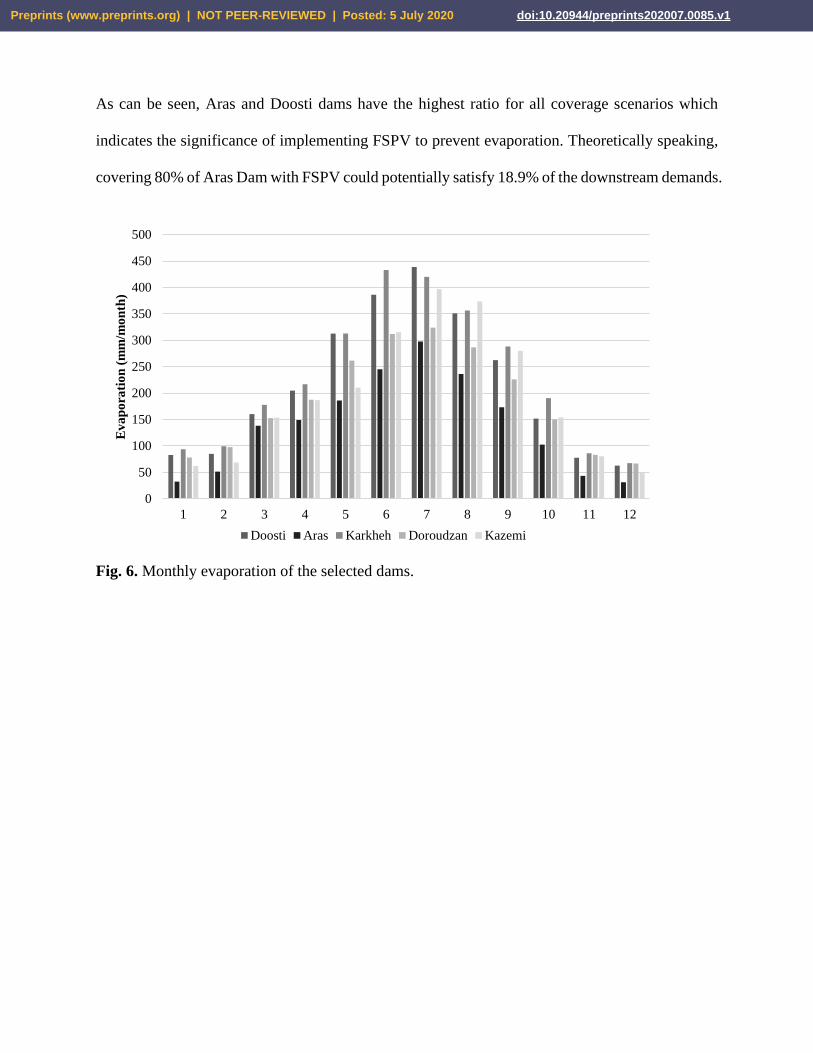
3-2 Evaporation reduction
Covering part of the dam reservoirs has shown to be an effective way of reducing water
evaporation. Furthermore, by changing the heat balance due to the reflection of the part of the solar
energy from the PV panels, the evaporation rate will be reduced from the entire reservoir’s
surface )Durkovic ́and Đurišic´, 2017 ( . For the five selected dams, the monthly evaporation is
calculated using the simplified Penman’s model and shown in Fig. 6. As can be seen, the maximum
evaporation occurs in July for Doosti and Karkheh Dams. In July, the water level in Doosti and
Karkheh dams decreases more than 400 mm which is an average of 14 mm/day. For all dams, the
monthly evaporation in November, December, January, and February is less than 100 mm with
December having the smallest rate. The maximum and minimum total water evaporation in the
selected year is 2742 mm and 1686 mm which are related to the Karkheh and Aras dams,
respectively.
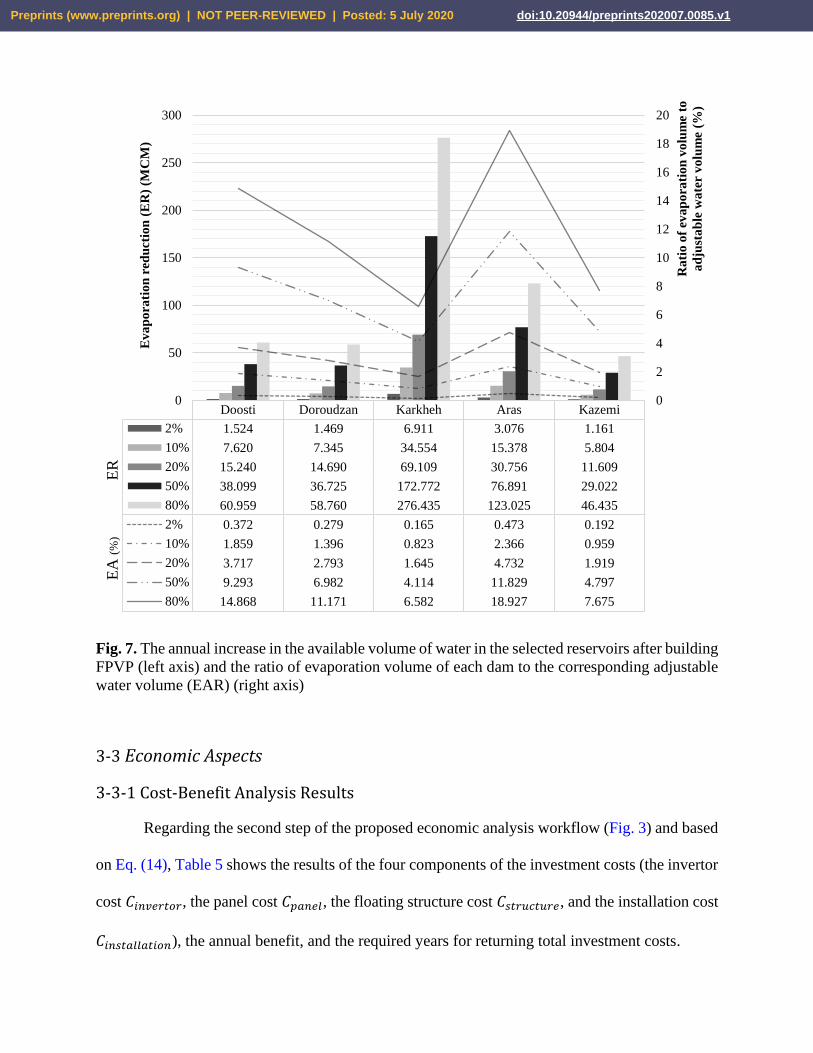
Fig. 7 shows the yearly increase in the available volume of water behind the selected dams
after building FSPV under five coverage scenarios. Due to some energy reflection from the
platform, 𝑘 in Eq. (12) is assumed to be 0.6. As expected, building FSPV on the Karkheh reservoir
can provide a vast amount of water annually by preventing evaporation. However, to make the
results more meaningful, the evaporation reduction is divided by the adjustable volume of water
(AVW) for each dam. AVW refers to the capacity of the dam to fulfill the downstream demands.
Preprints (www.preprints.org) | NOT PEER-REVIEWED | Posted: 5 July 2020 doi:10.20944/preprints202007.0085.v1
As can be seen, Aras and Doosti dams have the highest ratio for all coverage scenarios which
indicates the significance of implementing FSPV to prevent evaporation. Theoretically speaking,
covering 80% of Aras Dam with FSPV could potentially satisfy 18.9% of the downstream demands.
Fig. 6. Monthly evaporation of the selected dams.
0
50
100
150
200
250
300
350
400
450
500
1 2 3 4 5 6 7 8 9 10 11 12
Ev
ap
ora
tio
n (
mm
/mo
nth
)
Doosti Aras Karkheh Doroudzan Kazemi
Preprints (www.preprints.org) | NOT PEER-REVIEWED | Posted: 5 July 2020 doi:10.20944/preprints202007.0085.v1
Fig. 7. The annual increase in the available volume of water in the selected reservoirs after building
FPVP (left axis) and the ratio of evaporation volume of each dam to the corresponding adjustable
water volume (EAR) (right axis)
3-3 Economic Aspects
3-3-1 Cost-Benefit Analysis Results
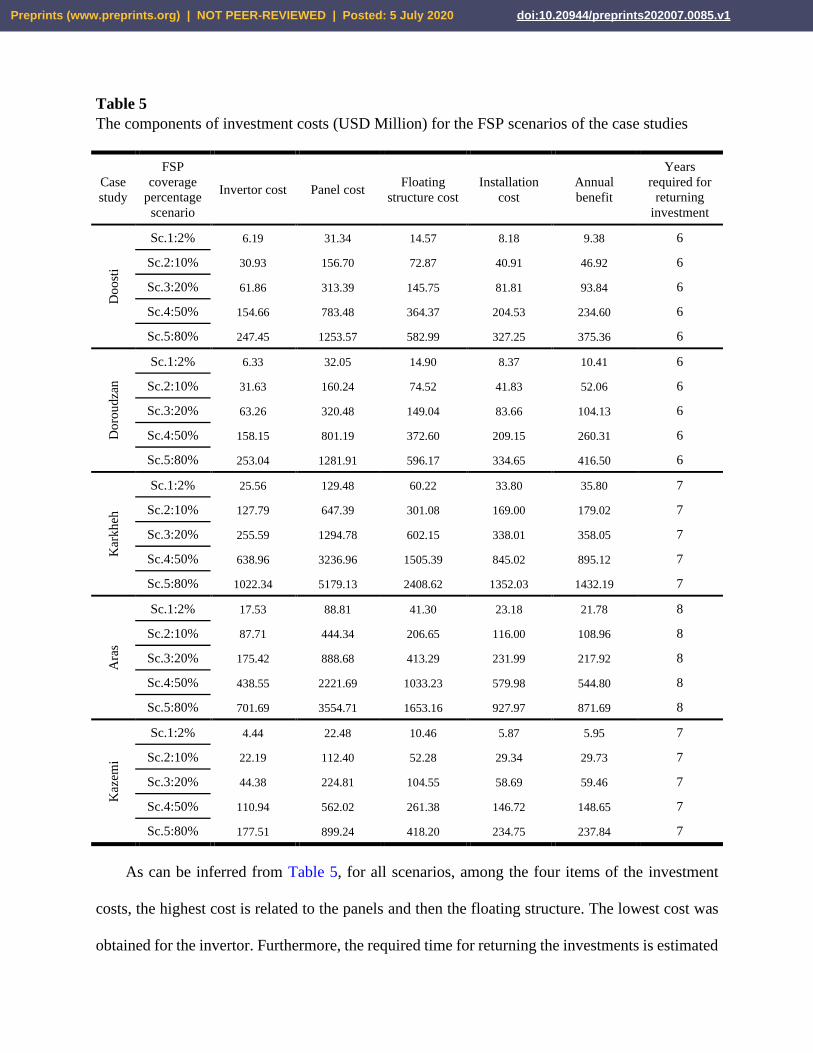
Regarding the second step of the proposed economic analysis workflow (Fig. 3) and based
on Eq. (14), Table 5 shows the results of the four components of the investment costs (the invertor
cost 𝐶𝑖𝑛𝑣𝑒𝑟𝑡𝑜𝑟, the panel cost 𝐶𝑝𝑎𝑛𝑒𝑙, the floating structure cost 𝐶𝑠𝑡𝑟𝑢𝑐𝑡𝑢𝑟𝑒, and the installation cost
𝐶𝑖𝑛𝑠𝑡𝑎𝑙𝑙𝑎𝑡𝑖𝑜𝑛), the annual benefit, and the required years for returning total investment costs.
Doosti Doroudzan Karkheh Aras Kazemi
2% 1.524 1.469 6.911 3.076 1.161
10% 7.620 7.345 34.554 15.378 5.804
20% 15.240 14.690 69.109 30.756 11.609
50% 38.099 36.725 172.772 76.891 29.022
80% 60.959 58.760 276.435 123.025 46.435
2% 0.372 0.279 0.165 0.473 0.192
10% 1.859 1.396 0.823 2.366 0.959
20% 3.717 2.793 1.645 4.732 1.919
50% 9.293 6.982 4.114 11.829 4.797
80% 14.868 11.171 6.582 18.927 7.675
0
2
4
6
8
10
12
14
16
18
20
0
50
100
150
200
250
300
Ra
tio
of
eva
po
rati
on
vo
lum
e to
ad
just
ab
le w
ate
r v
olu
me
(%)
Ev
ap
ora
tio
n r
ed
uct
ion
(E
R)
(MC
M)
ER
(M
CM
) E
A (
%)
Preprints (www.preprints.org) | NOT PEER-REVIEWED | Posted: 5 July 2020 doi:10.20944/preprints202007.0085.v1
Table 5
The components of investment costs (USD Million) for the FSP scenarios of the case studies
Case
study
FSP
coverage
percentage
scenario
Invertor cost Panel cost Floating
structure cost
Installation
cost
Annual
benefit
Years
required for
returning
investment
Do
ost
i
Sc.1:2% 6.19 31.34 14.57 8.18 9.38 6
Sc.2:10% 30.93 156.70 72.87 40.91 46.92 6
Sc.3:20% 61.86 313.39 145.75 81.81 93.84 6
Sc.4:50% 154.66 783.48 364.37 204.53 234.60 6
Sc.5:80% 247.45 1253.57 582.99 327.25 375.36 6
Do
rou
dza
n
Sc.1:2% 6.33 32.05 14.90 8.37 10.41 6
Sc.2:10% 31.63 160.24 74.52 41.83 52.06 6
Sc.3:20% 63.26 320.48 149.04 83.66 104.13 6
Sc.4:50% 158.15 801.19 372.60 209.15 260.31 6
Sc.5:80% 253.04 1281.91 596.17 334.65 416.50 6
Kar
kh
eh
Sc.1:2% 25.56 129.48 60.22 33.80 35.80 7
Sc.2:10% 127.79 647.39 301.08 169.00 179.02 7
Sc.3:20% 255.59 1294.78 602.15 338.01 358.05 7
Sc.4:50% 638.96 3236.96 1505.39 845.02 895.12 7
Sc.5:80% 1022.34 5179.13 2408.62 1352.03 1432.19 7
Ara
s
Sc.1:2% 17.53 88.81 41.30 23.18 21.78 8
Sc.2:10% 87.71 444.34 206.65 116.00 108.96 8
Sc.3:20% 175.42 888.68 413.29 231.99 217.92 8
Sc.4:50% 438.55 2221.69 1033.23 579.98 544.80 8
Sc.5:80% 701.69 3554.71 1653.16 927.97 871.69 8
Kaz
emi
Sc.1:2% 4.44 22.48 10.46 5.87 5.95 7
Sc.2:10% 22.19 112.40 52.28 29.34 29.73 7
Sc.3:20% 44.38 224.81 104.55 58.69 59.46 7
Sc.4:50% 110.94 562.02 261.38 146.72 148.65 7
Sc.5:80% 177.51 899.24 418.20 234.75 237.84 7
As can be inferred from Table 5, for all scenarios, among the four items of the investment
costs, the highest cost is related to the panels and then the floating structure. The lowest cost was
obtained for the invertor. Furthermore, the required time for returning the investments is estimated
Preprints (www.preprints.org) | NOT PEER-REVIEWED | Posted: 5 July 2020 doi:10.20944/preprints202007.0085.v1
to be between 6~8 years depending on the annual benefit and the amount of the investments. It is
expected that the costs of items in the investment part will increase by increasing the area covered
by the FSPV system.
The total investment costs (𝐼𝐶𝑡𝑜𝑡) was calculated using Eq. (14) and the results are illustrated
in Fig. 8. Moreover, the corresponding O&M costs (𝑂𝑀𝐶) are represented in Fig. 9.
Fig. 8. The total investment costs ($ Million) for the FSPV scenarios of the case studies.
2%
10%
20%
50%80%
0
2000
4000
6000
8000
10000
Sce
nari
o o
f co
ver
age
per
cen
tage
Tota
l in
ves
tmen
t co
sts
($ M
illi
on
)
Doosti Doroudzan Karkheh Aras Kazemi
2% 60.28 61.64 249.05 170.83 43.24
10% 301.41 308.22 1245.27 854.69 216.21
20% 602.82 616.44 2490.53 1709.38 432.42
50% 1507.04 1541.10 6226.33 4273.45 1081.06
80% 2411.27 2465.76 9962.12 6837.52 1729.70
Preprints (www.preprints.org) | NOT PEER-REVIEWED | Posted: 5 July 2020 doi:10.20944/preprints202007.0085.v1
Figure 9. The O&M costs ($ Million) for the FSP scenarios of the case studies
As can be expected from Figs. 8 and 9, the total investment and O&M costs is increased by
the rise of the area covered by the FSPV systems. The highest investment and O&M costs are
related to Karkheh water infrastructure as it has the largest reservoir area among the case studies
in the NWL and thus needs more material for FSPV coverage including the panel, the floating
structure and installation items. Furthermore, because of the higher energy produced in this dam,
the higher invertor cost is required.
3-3-2 Sensitivity Analysis on Economic Results
Regarding the steps 3 and 4 of the economic analysis process (Fig. 3), the overall energy
production cost for each FSPV scenario of the water infrastructures is calculated based on Eq. (13).
2%
10%
20%
50%
80%
0
20
40
60
80
100
DoostiDoroudzan
KarkhehAras
Kazemi
Sce
na
rio
of
cov
era
ge
per
cen
tag
e
O&
M c
ost
($
Mil
lio
n)
Doosti Doroudzan Karkheh Aras Kazemi
2% 2.36 2.83 9.72 5.91 1.61
10% 11.79 14.14 48.62 29.59 8.07
20% 23.57 28.28 97.24 59.18 16.15
50% 58.93 70.70 243.10 147.96 40.37
80% 94.28 113.12 388.96 236.74 64.60
Preprints (www.preprints.org) | NOT PEER-REVIEWED | Posted: 5 July 2020 doi:10.20944/preprints202007.0085.v1
The results are analyzed with respect to the variations of the effective economic factors such as
the interest rate, the availability factor, and the exploitation period for the FSPV scenarios. Fig. 10
shows the overall energy production costs ( 𝐸𝑃𝐶 ) for the 20% coverage percentage in the
conditions of 𝑡 =25, 𝐴𝐹 =0.95 based on the variations of the interest rate (𝐼𝑅):
Fig. 10. The variations of energy production costs based on the interest rate values
It is revealed that the increase in the interest rates caused a significant rise in the energy
production cost for the FSPV system. Indeed, if the higher internal rate of return is requested, the
higher cost is required for producing electrical energy by the FSPV system. According to the
results, the private or public investor could investigate the economic justification for such an
IR=0
IR=0.03IR=0.06
IR=0.09IR=0.12
IR=0.15IR=0.18
IR=0.21IR=0.24
010
20
30
40
50
60
70
80
90
100
Inte
rest
Ra
te
Pro
du
ctio
n c
ost
(U
SD
/MW
h)
Doosti Doroudzan Karkheh Aras Kazemi
IR=0 20.77 19.18 20.78 22.16 21.27
IR=0.03 25.46 23.18 25.48 27.46 26.19
IR=0.06 31.06 27.95 31.09 33.78 32.05
IR=0.09 37.41 33.36 37.45 40.95 38.70
IR=0.12 44.32 39.26 44.37 48.76 45.94
IR=0.15 51.65 45.50 51.71 57.03 53.60
IR=0.18 59.24 51.97 59.31 65.61 61.56
IR=0.21 67.02 58.60 67.10 74.39 69.70
IR=0.24 74.91 65.33 75.00 83.30 77.96
t=25 , AF=0.95 , Coverage Percentage=20%
Preprints (www.preprints.org) | NOT PEER-REVIEWED | Posted: 5 July 2020 doi:10.20944/preprints202007.0085.v1
investment. As can be seen, among the studied water infrastructures, the case study of Aras with
considerable reservoir area and the least annual sunny days has the highest energy production cost.
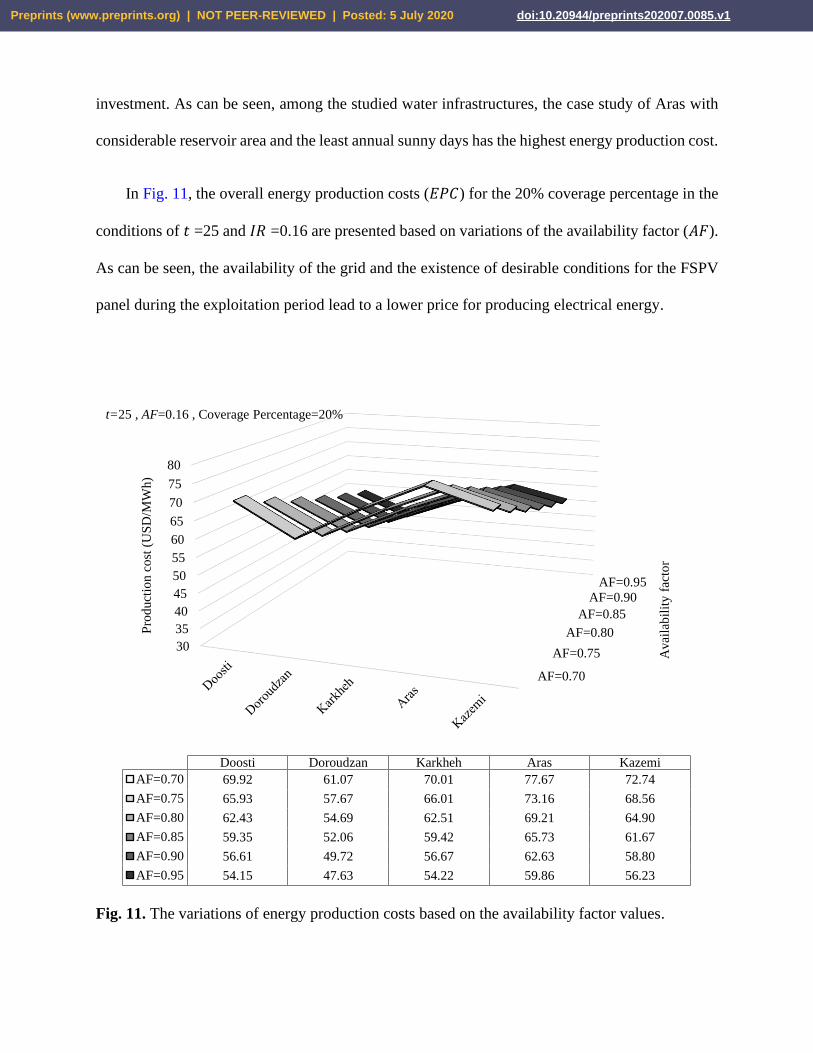
In Fig. 11, the overall energy production costs (𝐸𝑃𝐶) for the 20% coverage percentage in the
conditions of 𝑡 =25 and 𝐼𝑅 =0.16 are presented based on variations of the availability factor (𝐴𝐹).
As can be seen, the availability of the grid and the existence of desirable conditions for the FSPV
panel during the exploitation period lead to a lower price for producing electrical energy.
Fig. 11. The variations of energy production costs based on the availability factor values.
AF=0.70
AF=0.75
AF=0.80
AF=0.85
AF=0.90
AF=0.95
30
35
40
45
50
55
60
65
70
75
80
Avai
lab
ilit
y f
acto
r
Pro
duct
ion c
ost
(U
SD
/MW
h)
Doosti Doroudzan Karkheh Aras Kazemi
AF=0.70 69.92 61.07 70.01 77.67 72.74
AF=0.75 65.93 57.67 66.01 73.16 68.56
AF=0.80 62.43 54.69 62.51 69.21 64.90
AF=0.85 59.35 52.06 59.42 65.73 61.67
AF=0.90 56.61 49.72 56.67 62.63 58.80
AF=0.95 54.15 47.63 54.22 59.86 56.23
t=25 , AF=0.16 , Coverage Percentage=20%
Preprints (www.preprints.org) | NOT PEER-REVIEWED | Posted: 5 July 2020 doi:10.20944/preprints202007.0085.v1
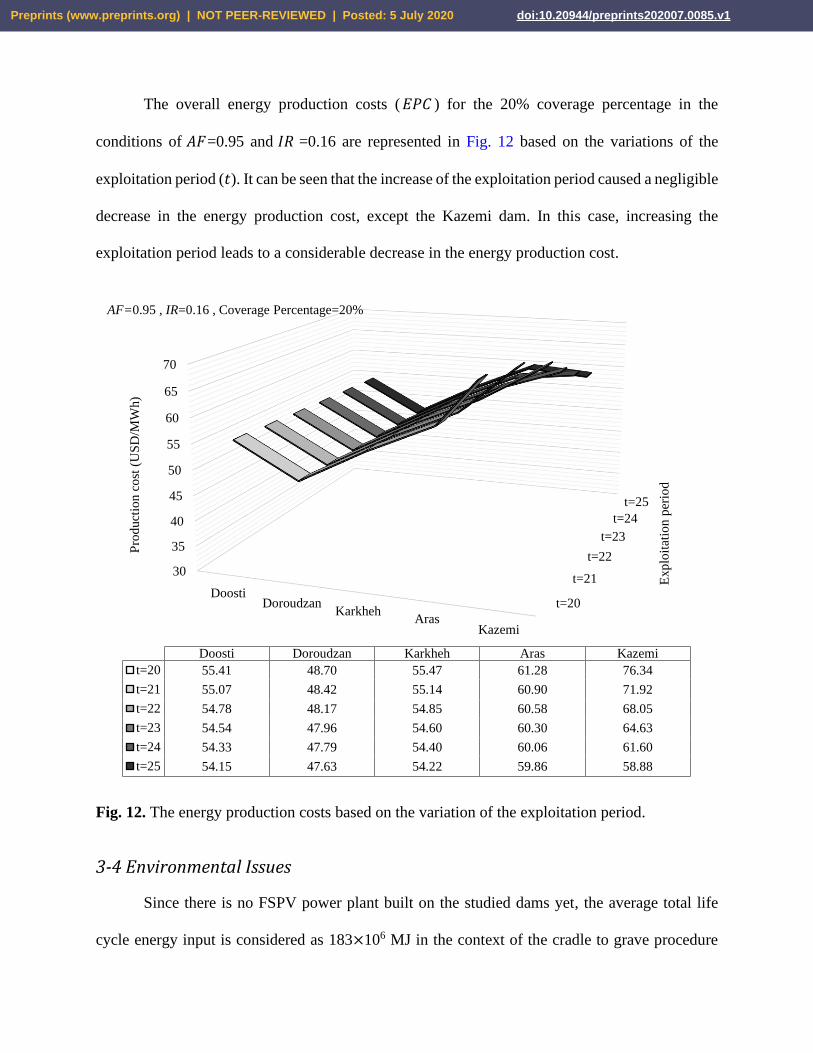
The overall energy production costs ( 𝐸𝑃𝐶 ) for the 20% coverage percentage in the
conditions of 𝐴𝐹=0.95 and 𝐼𝑅 =0.16 are represented in Fig. 12 based on the variations of the
exploitation period (𝑡). It can be seen that the increase of the exploitation period caused a negligible
decrease in the energy production cost, except the Kazemi dam. In this case, increasing the
exploitation period leads to a considerable decrease in the energy production cost.
Fig. 12. The energy production costs based on the variation of the exploitation period.
3-4 Environmental Issues
Since there is no FSPV power plant built on the studied dams yet, the average total life
cycle energy input is considered as 183×106 MJ in the context of the cradle to grave procedure
t=20
t=21
t=22
t=23
t=24
t=25
30
35
40
45
50
55
60
65
70
DoostiDoroudzan
KarkhehAras
Kazemi
Exp
loit
atio
n p
erio
d
Pro
duct
ion c
ost
(U
SD
/MW
h)
Doosti Doroudzan Karkheh Aras Kazemi
t=20 55.41 48.70 55.47 61.28 76.34
t=21 55.07 48.42 55.14 60.90 71.92
t=22 54.78 48.17 54.85 60.58 68.05
t=23 54.54 47.96 54.60 60.30 64.63
t=24 54.33 47.79 54.40 60.06 61.60
t=25 54.15 47.63 54.22 59.86 58.88
AF=0.95 , IR=0.16 , Coverage Percentage=20%
Preprints (www.preprints.org) | NOT PEER-REVIEWED | Posted: 5 July 2020 doi:10.20944/preprints202007.0085.v1
based on the previous studies in the Asia (Fu et al. 2015; Palanov 2014). Table 6 shows the energy
payback time for each of dams under different coverage scenarios.
Table 6
The energy payback time for the FSP scenarios of the case studies
EPBT (Year)
Doosti Aras Karkheh Doroudzan Kazemi
2% 0.776 0.309 0.188 0.647 1.133
10% 0.155 0.062 0.038 0.129 0.227
20% 0.078 0.031 0.019 0.065 0.113
50% 0.031 0.012 0.008 0.026 0.045
80% 0.019 0.008 0.005 0.016 0.028
According to the Table 6, the EPBT range of variation for Kazemi dam is 1 years (about
0.03~1.13) which is the widest range among the case studies. The highest EPBT is corresponded
to Kezemi dam, and it is followed by the Doosti, Doroudzan and Aras dams, respectively.
Installing FSP systems in the Karkheh dam area is highly recommended, where it takes less than
0.2 years to pay back the energy consumed during its lifecycle stages. According to the results,
wherever in Iran the FSPV system is installed, the EPBT would be less than its lifespan
(here less than 1.5 year). Thus, regarding to the energy payback point of view, the development of
these systems in Iran is practical and beneficial.
The effect of FSPV systems on GHG emission reduction is an important environmental
issue. In this context, values for 𝐺 (tCO2/MWh) and 𝛽 (dimensionless) were estimated as 0.65 and
0.13, respectively (World Bank, 2020). The annual reduction of CO2 emissions is shown in the
Table 7.
Preprints (www.preprints.org) | NOT PEER-REVIEWED | Posted: 5 July 2020 doi:10.20944/preprints202007.0085.v1
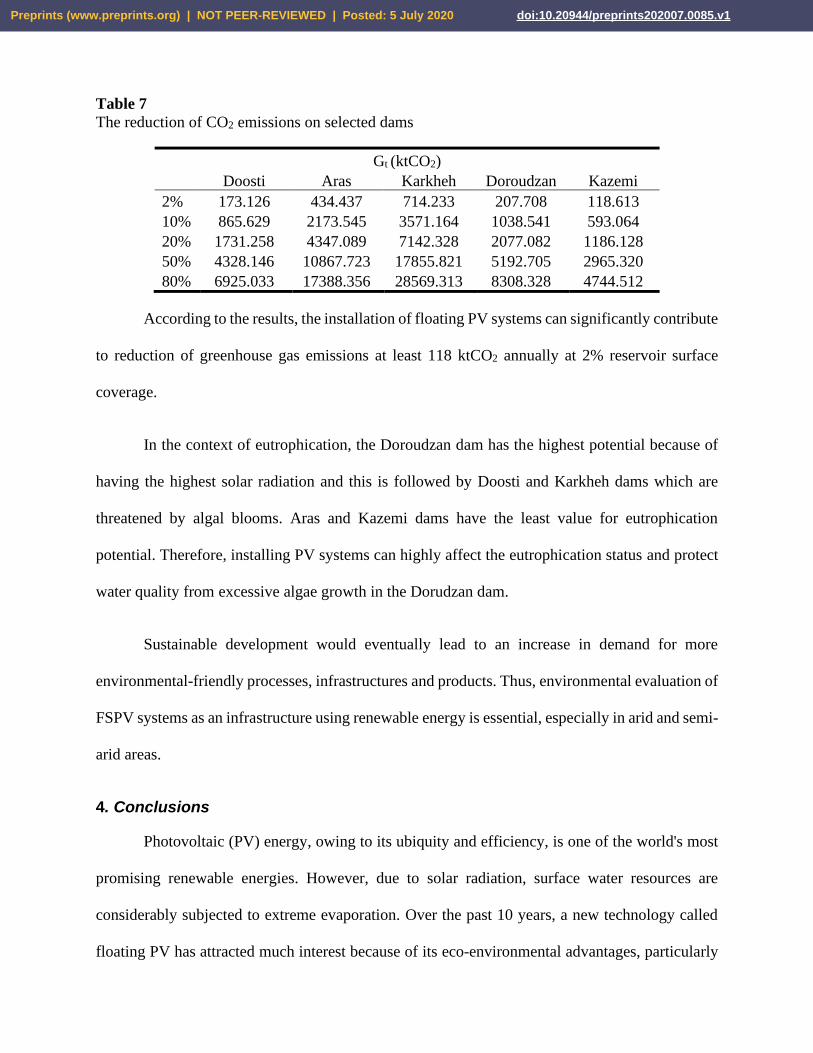
Table 7
The reduction of CO2 emissions on selected dams
Gt (ktCO2)
Doosti Aras Karkheh Doroudzan Kazemi
2% 173.126 434.437 714.233 207.708 118.613
10% 865.629 2173.545 3571.164 1038.541 593.064
20% 1731.258 4347.089 7142.328 2077.082 1186.128
50% 4328.146 10867.723 17855.821 5192.705 2965.320
80% 6925.033 17388.356 28569.313 8308.328 4744.512
According to the results, the installation of floating PV systems can significantly contribute
to reduction of greenhouse gas emissions at least 118 ktCO2 annually at 2% reservoir surface
coverage.
In the context of eutrophication, the Doroudzan dam has the highest potential because of
having the highest solar radiation and this is followed by Doosti and Karkheh dams which are
threatened by algal blooms. Aras and Kazemi dams have the least value for eutrophication
potential. Therefore, installing PV systems can highly affect the eutrophication status and protect
water quality from excessive algae growth in the Dorudzan dam.
Sustainable development would eventually lead to an increase in demand for more
environmental-friendly processes, infrastructures and products. Thus, environmental evaluation of
FSPV systems as an infrastructure using renewable energy is essential, especially in arid and semi-
arid areas.
4. Conclusions
Photovoltaic (PV) energy, owing to its ubiquity and efficiency, is one of the world's most
promising renewable energies. However, due to solar radiation, surface water resources are
considerably subjected to extreme evaporation. Over the past 10 years, a new technology called
floating PV has attracted much interest because of its eco-environmental advantages, particularly
Preprints (www.preprints.org) | NOT PEER-REVIEWED | Posted: 5 July 2020 doi:10.20944/preprints202007.0085.v1
when it comes to large-scale installing on dams’ lakes and reservoirs. This system protects the
huge amount of water resources from evaporation and generate sustainable electrical energy from
solar energy, simultaneously. Having developed an energy path focusing on the increased use of
renewable energy, Iran has a tremendous opportunity to install floating solar photovoltaic (FSPV)
plants with over 1300 water reservoirs under operation, implementation, and study that will protect
fertile property, mitigate greenhouse gas pollution, and minimize water evaporation levels. This
study first provides a comprehensive literature review on the application of FSPV and then
evaluates the technical, economic and environmental potential of installing FSPV plants in
important water infrastructures in Iran, namely Aras, Karkheh, Doosti, Doroudzan and Shahid
Kazemi dams.
According to the present study, installing FSPV plant over one square kilometer of the
lake’s surfaces of the selected dams could annually generate 194~257 GWh of electrical energy.
Given the fact that the per capita annual electricity consumption in Iran is 2727 kWh, the results
show that covering only one square kilometer of each dam with floating solar panels could meet
the electricity needs of, on average, about 90,000 people. One of the most beneficial ecological
consequences of the development of FSPV is the reduction in water evaporation. This system if
implemented on the selected dams covering for instance 10% of each lake, would save up to
collectively 70.7 MCM water per year which meets the annual domestic water demands of a city
with one million residents. In addition, regarding with the economic evaluation results, the energy
production cost is calculated based on the four items of invertor, panel, structure and installation
costs at 20~85 ($/MWh) depending on the coverage percentage of the reservoirs’ area, interest rate,
availability factor, and exploitation period. Furthermore, the economic outcomes indicate that the
investment costs for energy production return in 6 to 8 years. In terms of environmental advantages,
Preprints (www.preprints.org) | NOT PEER-REVIEWED | Posted: 5 July 2020 doi:10.20944/preprints202007.0085.v1
results indicated that the least EPBT value is for Karkheh dam as the most desirable case, where it
takes less than 0.2 years to pay back the energy consumed during its lifecycle stages. The proposed
FSPV would contribute to a reduction of CO2 emission more than 118 ktCO2 annually.
The study conducted here is a preliminary effort to highlight the significance of installing
FSPV on Iran’s reservoir surfaces based on the most important governing factors and other aspects
will need to be thoroughly explored in future works. Also, a comparative economic analysis
between the investment costs for water supply as much as the evaporated volume form the
reservoirs and the investment costs for installing the FSPV system could be a subject for future
studies. In addition, a detailed investigation should be undertaken into all possible electrical links,
including the possibility of integrating FSPV with hydroelectric power plants. In conclusion, FSPV
is opening up a new investment path, where many factors lead to the reduction of costs and the
enhancement of the environment.
Acknowledgment:
The authors would like to thank Dr. Vladan Durkovíc for his valuable help at the early stages of
developing the methodology. They are also grateful for the comments and supports provided by
Mr. Vahid Fatouraee, the head manager of Sahel Ettehad Manufacturing Co. and Mr. Sadjad
Rezaee, the implementation manager of Simorgh Electronic Asrar Co.
References:
Preprints (www.preprints.org) | NOT PEER-REVIEWED | Posted: 5 July 2020 doi:10.20944/preprints202007.0085.v1
Abid M, Abid Z, Sagin J, Murtaza R, Sarbassov D, Shabbir M. Prospects of floating photovoltaic
technology and its implementation in Central and South Asian Countries. Int J Environ Sci Technol
2019;16:1755–62. https://doi.org/10.1007/s13762-018-2080-5.
Alizadeh osalou Z, Mohsenpourazari A, Nekuiefard A, Seidgar M, Mohebbi F, Abbaspour anbi A.
The study of Changes in the composition of inorganic compounds of phosphate and nitrate in the
lake behind Shahid Kazemi Dam (West Azarbaijan province). J Wetl Ecobiol 2018;10:89–96. (In
Persian). http://jweb.iauahvaz.ac.ir/article-1-724-fa.html
Barbuscia M. Economic viability assessment of floating photovoltaic energy. Work Pap 2018;1:1–
11.
Bauer D, Philbrick M, Vallario B, Battey H, Clement Z, Fields F. The water-energy nexus:
Challenges and opportunities. US Dep Energy 2014.
https://sites.nationalacademies.org/cs/groups/pgasite/documents/webpage/pga_153127.pdf
Bolinger M, Seel J. Utility-Scale Solar 2014: An Empirical Analysis of Project Cost, Performance,
and Pricing Trends in the United States (No. LBNL-1000917). Berkeley, CA: Lawrence Berkeley
National Laboratory 2015.
Bui PA. Assessing the Technical, Economic, and Environmental Feasibility of Floating Solar
Power Generation on Water Reservoirs in Vietnam 2019:146.
https://digitalcommons.humboldt.edu/etd/345
Cazzaniga R, Cicu M, Rosa-Clot M, Rosa-Clot P, Tina GM, Ventura C. Floating photovoltaic
plants: Performance analysis and design solutions. Renew Sustain Energy Rev 2018;81:1730–41.
https://doi.org/10.1016/j.rser.2017.05.269.
Choi, YK, Lee NH, and Kim, KJ. 2013. Empirical Research on the Efficiency of Floating PV
Systems Compared with Overland PV Systems. In Proceedings, The 3rd International Conference
on Circuits, Control, Communication, Electricity, Electronics, Energy, System, Signal and
Simulation, 2013;25:284-289
Craig IP. Loss of storage water due to evaporation – a literature review. 2005.
http://eprints.usq.edu.au/id/eprint/2660
Preprints (www.preprints.org) | NOT PEER-REVIEWED | Posted: 5 July 2020 doi:10.20944/preprints202007.0085.v1
Daneshyar M. Solar radiation statistics for Iran. Sol Energy 1978;21:345–9.
https://doi.org/10.1016/0038-092X(78)90013-0.
Dizier A. Techno-economic analysis of floating PV solar power plants using active cooling
technique A case study for Taiwan 2018:68. https://kth.diva-
portal.org/smash/get/diva2:1290021/FULLTEXT01.pdf
Do Sacramento EM, Carvalho PCM, De Araújo JC, Riffel DB, Da Cruz Corrêa RM, Neto JSP.
Scenarios for use of floating photovoltaic plants in Brazilian reservoirs. IET Renew Power Gener
2015;9:1019–24. https://doi.org/10.1049/iet-rpg.2015.0120.
Durkovíc V, Durišíc Ž. Analysis of the potential for use of floating PV power plant on the skadar
lake for electricity supply of aluminium plant in montenegro. Energies 2017;10:1505.
https://doi.org/10.3390/en10101505.
Duzenli M, Kocar G, Eryasar A. a Review of Floating Solar Power Plants. FROM Sci Ed
2018:281–8.
Emami S, Choopan Y, Parsa J. Dam Seepage Prediction Using RBF and GFF Models of Artificial
Neural Network; Case Study: Boukan Shahid Kazemi’s Dam. J Rehabil Civ Eng 2019;7:15–32.
https://doi.org/10.22075/JRCE.2018.13986.1254
Fadai D. Utilization of renewable energy sources for power generation in Iran. Renew Sustain
Energy Rev 2007;11:173–81. https://doi.org/10.1016/j.rser.2005.01.011.
Fereshtehpour, M. Application of Floating Solar Panels on Dam’s reservoir, Sharif Event on Water
and Energy Nexus, 1- 3 March, 2016, Sharif University of Technology, Tehran, Iran. (In Persian).
https://www.civilica.com/Paper-ENERWAT01-ENERWAT01_007.html.
Ferrer-Gisbert C, Ferrán-Gozálvez JJ, Redón-Santafé M, Ferrer-Gisbert P, Sánchez-Romero FJ,
Torregrosa-Soler JB. A new photovoltaic floating cover system for water reservoirs. Renew
Energy 2013;60:63–70. https://doi.org/10.1016/j.renene.2013.04.007.
Fu Y, Liu X, Yuan Z. Life-cycle assessment of multi-crystalline photovoltaic (PV) systems in
China. J Clean Prod 2015;86:180–90. https://doi.org/10.1016/j.jclepro.2014.07.057.
Preprints (www.preprints.org) | NOT PEER-REVIEWED | Posted: 5 July 2020 doi:10.20944/preprints202007.0085.v1
Gamarra C, Ronk JJ. Floating Solar: An Emerging Opportunity at the Energy-Water Nexus. Float
Sol An Emerg Oppor Energy-Water Nexus 2019;10:32–45.
https://journals.tdl.org/twj/index.php/twj/article/download/7050/pdf
Ghandehari, A, Davary K, Omranian Khorasani H, Vatanparast M, and Pourmohamad Y.
Assessment of Urban Water Supply Options by Using Fuzzy Possibilistic Theory. Environ Process
(2020): 1-24. https://doi.org/10.1007/s40710-020-00441-8.
Goodarzi E, Shui LT, Ziaei M. Risk and uncertainty analysis for dam overtopping - Case study:
The Doroudzan Dam, Iran. J Hydro-Environment Res 2014;8:50–61.
https://doi.org/10.1016/j.jher.2013.02.001.
Goswami A, Sadhu P, Goswami U, Sadhu PK. Floating solar power plant for sustainable
development: A techno-economic analysis. Environ Prog Sustain Energy 2019;38:e13268.
https://doi.org/10.1002/ep.13268.
Haghiabi AH, Mastorakis NE. Water resources management in Karkheh basin-Iran. Proc 3rd Int
Conf Energy Dev - Environ - Biomed EDEB’09 2009:114–21.
Hammad M, Ebaid MSY, Halaseh G, Erekat B. Large scale grid connected (20MW) photovoltaic
system for peak load shaving in Sahab Industrial District. Jordan J Mech Ind Eng 2015;9:45–59.
http://jjmie.hu.edu.jo/vol9-1/JJMIE-114-14-01%20Proof%20Reading.pdf
Hartzell TS. Evaluating potential for floating solar installations on Arizona water management
infrastructure 2016:1–60. http://hdl.handle.net/10150/608582
Hou G, Sun H, Jiang Z, Pan Z, Wang Y, Zhang X, et al. Life cycle assessment of grid-connected
photovoltaic power generation from crystalline silicon solar modules in China. Appl Energy
2016;164:882–90. https://doi.org/10.1016/j.apenergy.2015.11.023.
International Renewable Energy Agency (IRENA). RENEWABLE ENERGY TECHNOLOGIES:
COST ANALYSIS SERIES,Volume:1:PowerSector,Issue3/5,HydroPower. vol. 1. International
Renewable Energy Agency: Bonn, Germany,; 2012.
https://www.irena.org/publications/2012/Jun/Renewable-Energy-Cost-Analysis---Hydropower
Preprints (www.preprints.org) | NOT PEER-REVIEWED | Posted: 5 July 2020 doi:10.20944/preprints202007.0085.v1
IWRMC (Iran Water Resources Management Company). An overview of water resource
management in IR of Iran. Tehran: Report to Ministry of Energy. http://www.wrm.ir. Accessed 10
Dec 2019.
Javidi Sabbaghian R, Zarghami M, Nejadhashemi AP, Sharifi MB, Herman MR, Daneshvar F.
Application of risk-based multiple criteria decision analysis for selection of the best agricultural
scenario for effective watershed management. J Environ Manage 2016;168:260–72.
https://doi.org/10.1016/j.jenvman.2015.11.038.
Jensen M. Historical Evolution of ET Estimating Methods: A Century of Progress. CSU/ARS
Evapotranspiration Work., vol. 12, 2010, p. 1–17.
https://coagmet.colostate.edu/ET_Workshop/pdf/1_Jensen.pdf
Kim SM, Oh M, Park HD. Analysis and prioritization of the floating photovoltaic system potential
for reservoirs in Korea. Appl Sci 2019;9. https://doi.org/10.3390/app9030395.
Kumar V, Shrivastava RL, Untawale SP. Solar Energy: Review of Potential Green & Clean Energy
for Coastal and Offshore Applications. Aquat Procedia 2015;4:473–80.
https://doi.org/10.1016/j.aqpro.2015.02.062.
Lee YG, Joo HJ, Yoon SJ. Design and installation of floating type photovoltaic energy generation
system using FRP members. Sol Energy 2014;108:13–27.
https://doi.org/10.1016/j.solener.2014.06.033.
Liu L, Wang Q, Lin H, Li H, Sun Q, Wennersten R. Power Generation Efficiency and Prospects
of Floating Photovoltaic Systems. Energy Procedia 2017;105:1136–42.
https://doi.org/10.1016/j.egypro.2017.03.483.
Ludin, A, N. Life Cycle Assessment of Photovoltaic Systems in the APEC Region. Life Cycle
Assessment Analytical Report. APEC Energy Working Group, 2019.
Majid ZAA, Ruslan MH, Sopian K, Othman MY, Azmi MSM. Study on performance of 80 watt
floating photovoltaic panel. J Mech Eng Sci 2014;7:1150–6.
https://doi.org/10.15282/jmes.7.2014.14.0112.
Preprints (www.preprints.org) | NOT PEER-REVIEWED | Posted: 5 July 2020 doi:10.20944/preprints202007.0085.v1
Majidi M, Alizadeh A, FaridHosseini A, Vazifedoust M. Lake and Reservoir Evaporation: Energy
Balance Estimations, Evaluation of Combination and Radiation- Temperature Methods. Iran J Irrig
Drain n.d. 2015;8:602–15.(In Persian). https://doi.org/10.22067/jsw.v0i0.33253
Masters GM. Renewable and Efficient Electric Power Systems. John Wiley & Sons; 2004.
https://doi.org/10.1002/0471668826.
Mckay A. Floatovoltaics : Quantifying the Benefits of a Hydro -Solar Power Fusion. Pomona Sr
Theses 2013;Paper 74. https://scholarship.claremont.edu/pomona_theses/74
Mesgaran MB, Azadi P. A National Adaptation Plan for Water Scarcity in Iran. Working Paper 6,
Stanford Iran 2040 Project, Stanford University; 2018.
https://www.academia.edu/download/57499017/A_National_Adaptation_Plan_for_Water_Scarci
ty_in_Iran.pdf
Mittal D, Saxena BK, Rao KVS. Floating solar photovoltaic systems: An overview and their
feasibility at Kota in Rajasthan. Proc IEEE Int Conf Circuit, Power Comput Technol ICCPCT
2017. https://doi.org/10.1109/ICCPCT.2017.8074182.
Mozafari M, Raeisi E, Zare M. Water leakage paths in the Doosti Dam, Turkmenistan and Iran.
Environ Earth Sci 2012;65:103–17. https://doi.org/10.1007/s12665-011-1069-x.
Palanov Nikola. Life-cycle assessment of Photovaltaic systems -Analysis of environmental impact
from the production of PV system including solar panels produced by Gaia Solar. Life-Cycle
Assess Photovaltaic Syst -Analysis Environ Impact from Prod PV Syst Incl Sol Panels Prod by
Gaia Sol 2014:160. http://lup.lub.lu.se/student-papers/record/7471285/file/7471400.pdf
Pašalić S, Akšamović A, Avdaković S. Floating photovoltaic plants on artificial accumulations—
Example of Jablanica Lake. 2018 IEEE Int. Energy Conf., IEEE; 2018, p. 1–6.
https://doi.org/10.1109/ENERGYCON.2018.8398765
Penman HL. Natural evaporation from open water, bare soil and grass. Proc R Soc London Ser A
Math Phys Sci 1948;193:120–45. https://doi.org/10.1098/rspa.1948.0037
Raouz K. Environmental Impact Assessment of a Photovoltaic Power Station in Stockholm Khalid
Preprints (www.preprints.org) | NOT PEER-REVIEWED | Posted: 5 July 2020 doi:10.20944/preprints202007.0085.v1
Raouz 2017. http://kth.diva-portal.org/smash/record.jsf?pid=diva2%3A1115077
Redón Santafé M, Torregrosa Soler JB, Sánchez Romero FJ, Ferrer Gisbert PS, Ferrán Gozálvez
JJ, Ferrer Gisbert CM. Theoretical and experimental analysis of a floating photovoltaic cover for
water irrigation reservoirs. Energy 2014;67:246–55.
http://dx.doi.org/10.1016/j.energy.2014.01.083
Reinhard S, Verhagen J, Wolters W, Ruben R. Water-food-energy nexus; A quick scan.
Wageningen Economic Research; 2017. https://doi.org/2017-096.
Rodrigues IS, Ramalho GLB, Medeiros PHA. Potential of floating photovoltaic plant in a tropical
reservoir in Brazil. J Environ Plan Manag 2020:1–24.
https://doi.org/10.1080/09640568.2020.1719824.
Rosa-Clot M, Tina GM, Nizetic S. Floating photovoltaic plants and wastewater basins: An
Australian project. Energy Procedia 2017;134:664–74.
https://doi.org/10.1016/j.egypro.2017.09.585.
Sahu A, Yadav N, Sudhakar K. Floating photovoltaic power plant: A review. Renew Sustain
Energy Rev 2016;66:815–24. https://doi.org/10.1016/j.rser.2016.08.051.
Sharma AK, Kothari DP. Floating solar PV potential in large reservoirs in India. Int J 2016;2:97–
101. http://www.ijirst.org/articles/IJIRSTV2I11050.pdf
Sharma P, Muni B, Sen D. Design parameters of 10 KW floating solar power plant. Proc. Int. Adv.
Res. J. Sci. Eng. Technol. (IARJSET), Natl. Conf. Renew. Energy Environ. (NCREE-2015),
Ghaziabad, India, vol. 2, 2015.
https://pdfs.semanticscholar.org/13cc/78fd898a1f63b3b4eb5ec31e2b10b889bd05.pdf
Silvério NM, Barros RM, Tiago Filho GL, Redón-Santafé M, Santos IFS dos, Valério VE de M.
Use of floating PV plants for coordinated operation with hydropower plants: Case study of the
hydroelectric plants of the São Francisco River basin. Energy Convers Manag 2018;171:339–49.
https://doi.org/10.1016/j.enconman.2018.05.095.
Singh AK, Boruah D, Sehgal L, Ramaswamy AP. Feasibility study of a grid-tied 2MW floating
Preprints (www.preprints.org) | NOT PEER-REVIEWED | Posted: 5 July 2020 doi:10.20944/preprints202007.0085.v1
solar PV power station and e-transportation facility using ‘SketchUp Pro’ for the proposed smart
city of Pondicherry in India. J Smart Cities 2019;2:49–59.
https://doi.org/10.18063/jsc.2016.02.004.
Song J, Choi Y. Analysis of the potential for use of floating photovoltaic systems on mine pit lakes:
Case study at the Ssangyong open-pit limestone mine in Korea. Energies 2016;9:1–13.
https://doi.org/10.3390/en9020102.
Spencer RS, Macknick J, Aznar A, Warren A, Reese MO. Floating Photovoltaic Systems:
Assessing the Technical Potential of Photovoltaic Systems on Man-Made Water Bodies in the
Continental United States. Environ Sci Technol 2019;53:1680–9.
https://doi.org/10.1021/acs.est.8b04735.
Teixeira LE, Caux J, Beluco A, Bertoldo I, Louzada JAS, Eifler RC. Feasibility Study of a Hydro
PV Hybrid System Operating at a Dam for Water Supply in Southern Brazil. J Power Energy Eng
2015;03:70–83. https://doi.org/10.4236/jpee.2015.39006.
Temiz M, Javani N. Design and analysis of a combined floating photovoltaic system for electricity
and hydrogen production. Int J Hydrogen Energy 2020;45:3457–69.
https://doi.org/10.1016/j.ijhydene.2018.12.226.
Trapani K, Millar DL. Floating photovoltaic arrays to power the mining industry: A case study for
the McFaulds lake (Ring of Fire). Environ Prog Sustain Energy 2016;35:898–905.
https://doi.org/10.1002/ep.12275.
Tsoutsos T, Frantzeskaki N, Gekas V. Environmental impacts from the solar energy technologies.
Energy Policy 2005;33:289–96. https://doi.org/10.1016/S0301-4215(03)00241-6
Valiantzas JD. Simplified versions for the Penman evaporation equation using routine weather
data. J Hydrol 2006;331:690–702. https://doi.org/10.1016/j.jhydrol.2006.06.012.
Whaley C. Best practices in photovoltaic system operations and maintenance. National Renewable
Energy Lab.(NREL), Golden, CO (United States); 2016.
https://www.osti.gov/servlets/purl/1336898
Preprints (www.preprints.org) | NOT PEER-REVIEWED | Posted: 5 July 2020 doi:10.20944/preprints202007.0085.v1
World Bank, 2020. https://data.worldbank.org/indicator/eg.elc.loss.zs
Zhou X, Yang J, Wang F, Xiao B. Economic analysis of power generation from floating solar
chimney power plant. Renew Sustain Energy Rev 2009;13:736–49.
https://doi.org/10.1016/j.rser.2008.02.011.
Preprints (www.preprints.org) | NOT PEER-REVIEWED | Posted: 5 July 2020 doi:10.20944/preprints202007.0085.v1