SV\/P672 Evaluation of Financial Policy Credit Allocation in Bangladesh Arvind Virmani WORLD BANK STAFF WORKING PAPERS Number 672 Public Disclosure Authorized Public Disclosure Authorized Public Disclosure Authorized Public Disclosure Authorized Public Disclosure Authorized Public Disclosure Authorized Public Disclosure Authorized Public Disclosure Authorized
All rights reservedManufactured in the United States of AmericaFirst printing October 1984
This is a working document published informally by the World Bank. To presentthe results of research with the least possible delay, the typescript has not beenprepared in accordance with the procedures appropriate to formal printed texts, andthe World Bank accepts no responsibility for errors. The publication is supplied at atoken charge to defray part of the cost of manufacture and distribution.
The World Bank does not accept responsibility for the views expressed herein, whichare those of the author and should not be attributed to the World Bank or to itsaffiliated organizations. The findings, interpretations, and conclusions are the resultsof research supported by the Bank; they do not necessarily represent official policy ofthe Bank. The designations employed, the presentation of material, and any maps usedin this document are solely for the convenience of the reader and do not imply theexpression of any opinion whatsoever on the part of the World Bank or its affiliatesconcerning the legal status of any country, territory, city, area, or of its authorities, orconcerning the delimitation of its boundaries, or national affiliation.
The full range of World Bank publications, both free and for sale, is described in theCatalog of Publications; the continuing research program is outlined in Abstracts ofCurrent Studies. Both booklets are updated annually; the most recent edition of each isavailable without charge from the Publications Sales Unit, Department T, The WorldBank, 1818 H Street, N.W., Washington, D.C. 20433, U.S.A., or from the EuropeanOffice of the Bank, 66 avenue d'I6na, 75116 Paris, France.
Arvind Virmani is an economist in the Development Research Department of theWorld Bank.
Library of Congress Cataloging in Publication Data
Virmani, Arvind, 1949-Evaluation of financial policy.
(World Bank staff working papers ; no. 672)1. Credit control--Bangladesh. 2. Finance--Bangladesh.
I. Title. II. Series.HG3711.B3V57 1984 332.7'09549'2 84-20985ISBN 0-8213-0429-1
Abstract
The Bangladesh Goverrnment has used a variety of policies to
influence the allocation of credit to specific borrower groups like poor
farmers, uses such as housing, and sectors such as agriculture. These
policies have also been used tc reduce allocation for certain uses such
as inventory holding ("speculative purposes"). The policies used have
included interest controls credit guarantees, refinance and margine
requirements. This paper attempts a systematic analysis of all the
policies used by the Bangladesh government in the light of the explicit
or implicit objectives of the government. The effect of each of the
policies used, alone or in combination, is analysed with a view to
evaluating their usefulness and efficiency. The analysis then provides
the basis for suggested policy charges in Bangladesh, as well as lessons
for financial policy makers in other countries.
ABREGE
Le Gouvernement du Bangladesh, souhaitant orienter les pratiquesdu credit bancaire de maniere a favoriser certaines categories d'emprunteurstels que les agriculteurs defavorises et certains secteurs comme le logementet l'agriculture, ou, au contraire, a d6courager le detention de stocks ades fins speculatives, a mis en oeuvre tout un eventail de mesures. C'estainsi qu'il agit notamment sur les taux d'int6r&t, les garanties de creditet les criteres regissant les refinancements et les marges ben6ficiaires.Le present document s'efforce de proc6der a une analyse systematique detoutes les mesures appliquees par le Gouvernement, a la lumiere de sesobjectifs explicites ou implicities. II examine l'impact de chacune deces politiques, utilisee isolement ou en association avec d'autres, afinde juger de son utilit6 et de son efficacit6. Sur la base de cette etudecritique, il propose des modifications et tire un certain nombre deconclusions dont peuvent slinspirer les responsables de la politiquefinanciere d'autres pays.
Extracto
El Gobierno de Bangladesh ha utilizado diversas politicas parainfluir en la asignaci6n del credito a grupos especificos de prestatarios,como los agricultores pobres, iy a ciertos usos y sectores, como la vivienday la agricultura. Estas polit-icas se han utilizado ademas para reducir laasignaci6n del cr6dito a deterrninados usos, como el mantenimiento de exis-tencias ("fines especulativos"). Entre las politicas aplicadas cabe citarel control de los intereses, garantias de creditos, refinanciamiento y exi-gencias de margenes. En este trabajo se intenta hacer un analisis sistema-tico de todas las politicas ap]Licadas por el Gobierno de Bangladesh a la luzde los objetivos explicitos o implicitos del mismo. Se analiza el efecto decada una de las politicas util:izadas, por si sola o en combinaci6n conotras, con vistas a evaluar su utilidad y eficacia. El analisis proporcionaluego la base para sugerir cambios de politicas en Bangladesh, asi como paraextraer ensenianzas de posible utilidad para los responsables de elaborar laspoliticas financieras en otros paises.
CURRENCY EQUIVALENTS
The Bangladesh Taka (abreviated TK) is fixed in relation to abasket of reference currencies, with the Pound Sterling serving asintervention currency. On January 11, 1982, the exchange rate was setat TK 38.372 buying and TK 38.472 selling per Pound Sterling. Dependingon exchange rate movements between Sterling and the US Dollar, theTaka/Dollar cross-rate is subject to change. In recent months, thisrate has fluctuated between TK 19 and TK 20.9 per US$.
MEASURES
1 Crore = 10 million
1 Lakh = 100 thousand
FISCAL YEAR
The Bangladesh Fiscal Year (FY) runs from July 1 to June 30.
Chapter Table of Contents Page
I., Introduction 1
1.1 Objectives - Explicit 1
1.2 Objectives - Implicit 1
1.3 Types of Policies 2
1.4 Overall Allocation 3
II. Interest Rate Policy 8
2.1 First Major Revision 8
2.2 Second Major Revision 8
2.3 Effect of Credit Ceilings 10
2.4 Guarantees and Collateral 11
2.5 Distributional Effects 15
2.6 Speculative Credit 16
2.7 Interest Ceilings and Interest Subsidy 16
2.8 Penalty Interest Rates 17
2.9 Objectives and EfEfects of Second Revision 19
2.10 Intra-Bank Lending Rates 22
2.11 Real and Nominal Interest Rates 23
III. Credit Allocation Polic 24
3.1 Overview 24
3.2 The Target Approach 25
3.3 Ceilings and Prohibitions 30
3.4 Margin Requirements: Overview and Analysis 32
3.5 Margin Requirements: Differential Impact 37
3.6 Refinance and Counter Finance: Overview 47
Table of Contents (continued) Page
3.7 Refinance Usage, Intentive Effects and Usefulness 52
3.8 Guarantee Programs 62
3.9 Urban-Rural Branch Licensing 64
IV. Issues of Financial Policy 69
4.1 Efficiency or Inefficiency in Credit Markets 69
4.2 Welfare Objectives and Credit Markets 70
4.3 Differential Interest Rates: Availability vs. Cost 72
4.4 Financing of Specialized Banks: Refinance, Debentures 73or Deposits
4.5 Buffer Stocks: Alternative for Margin Requirements 79and Refinance
4.6 Term Finance 80
V. Agricultural Credit 81
5.1 Introduction 81
5.2 Expected Marginal Product of Loans 82
5.3 Targets and Disbursements; Differential Performance 85
5.4 The Special Agricultural Program and Commercial 88Bank Performance
5.5 Introduction of Urban Organized Banks into 91Agricultural Lending
5.6 Interest Ceilings and BKB Performance 92
5.7 Recovery Performance 94
5.8 Bad Debts vs. Liquidity Problems 101
Footnotes 103
References 103
List of Tables
Table Number Page
1. Sectoral Distr.Lbution of Advances by 4Scheduled Banks
2. GDP in Current Prices by Sectors 6
3. Credit Allocation Index 7
4. Interest Rates on Loans and Advances 9
5. Advances Classified by Size of Accounts 12
6. Advances Classified by Securities 13
7. Loans to Agricuiltural Hunting, Forestry, 14Fishing
8. Advances Classified by Rates of Interest 18
9. Advances to Small Loans and Small Industry, 27House Building and Transport
10. Rates of Growth of Prices and Imposition 33of Margin Requirements
11. Distribution of Advances by Margins for 38Specified Securities, and Average Loan Sizeby Margin for the same Securities
12. Distribution of Advances by Rates of Margin 40for Related Securities
13. Distribution of Advances by Rates of Margin 41
14. Distribution of Advances by Securities 44
15. Distribution of Advances by Economic Purpose 46
16. Use of Refinancie by Bangladesh Krishi Bank 48(BKB) and Bangladesh Samabya Bank (BSB)
17. Average (weighted) Deposit Rate 53
18. Refinance: Usage as a Percentage of 57Entitled Limits
19. Advances and Deposits of Scheduled Banks 59excluding BKB and BSB
List of Tables (continued) Page
20. Payment of Government Guarantees to the 63Banks Under Special Agricultural Credit Program
21. Rural Branch Expansion 65
22. Administrative Costs of Rural Branches 67
23. Sonali Bank Statistics 68
24. Credit-Deposit Ratio by District 78
25. Marginal Product of Loans in Agriculture 83
26. Agricultural Credit 86
27. Special Agricultural Credit Program 89
28. Bangladesh Krishi Bank Borrower Characteristics 93
List of Figures
1. Rationing Equilibrium 36
2. Recovery Profiles by Banks for the Special 96Agricultural Credit Program
3. Recovery Profiles: BKB, Sonali, Agrani and 97Janata Banks
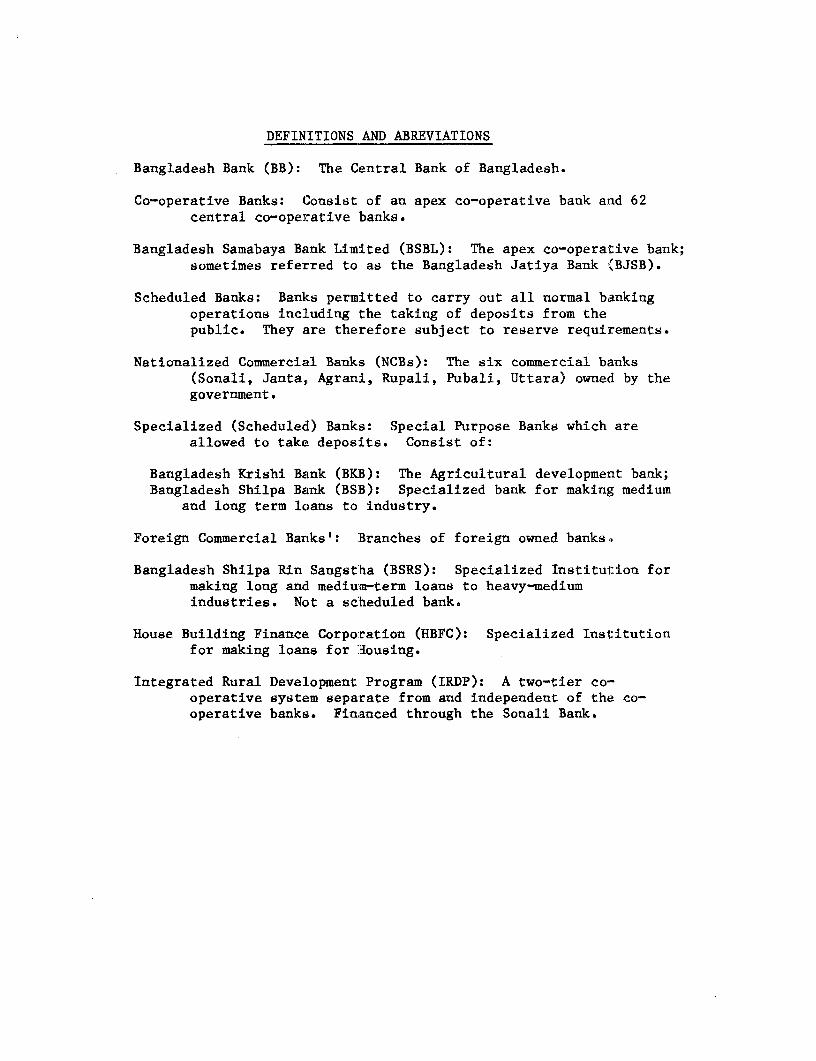
Bangladesh Bank (BB): The Central Bank of Bangladesh.
Co-operative Banks: Consist of an apex co-operative bank and 62central co-operative banks.
Bangladesh Samabaya Bank Limited (BSBL): The apex co-operative bank;sometimes referred to as the Bangladesh Jatiya Bank (BJSB).
Scheduled Banks: Banks permitted to carry out all normal bankingoperations including the taking of deposits from thepublic. They are therefore subject to reserve requirements.
Nationalized Commercial Banks (NCBs): The six commercial banks(Sonali, Janta, Agrani, Rupali, Pubali, Uttara) owned by thegovernment.
Specialized (Scheduled) Banks: Special Purpose Banks which areallowed to take deposits. Consist of:
Bangladesh Krishi Bank (BKB): The Agricultural development bank;Bangladesh Shilpa Bank (BSB): Specialized bank for making medium
and long term loans to industry.
Foreign Commercial Banks': 'Branches of foreign owned banks.
Bangladesh Shilpa Rin Sangst'ha (BSRS): Specialized Institution formaking long and medium-term loans to heavy-mediumindustries. Not a sc'heduled bank.
House Building Finance Corporation (HBFC): Specialized Institutionfor making loans for Housing.
Integrated Rural Development Program (IRDP): A two-tier co-operative system separate from and independent of the co-operative banks. Financed through the Sonali Bank.
PREFACE
This paper applies thet analytical framework developed earlier
by the author in The Nature of Credit Markets in Developing Countries:
A Framework for Policy Analysis, (World Bank Staff Working Paper
No.524). The paper was prepared originally as a report for the
Bangladesh Financial Sector Review Mission. Many of the issues before
this mission and its objectives were similar to those which motivated
the author's earlier work. The current paper was therefore conceived
from inception as a practical application of this policy framework.
A distinction between empirical testing and practical
application needs to be borne in mind in reading the paper. The former
was not attempted, given the data limitations and time constraints under
which the paper was written. It is presented more as a practical guide
to others wishing to apply the siame framework in the context of similar
limitations.
Arvind Virmani
I. INTRODUCTION
1.1 Objectives - Explicit
The Bangladesh government has outlined three operational objectives
of financial policy. These are-I/
(a) Macro-Economic Objective:
To control the expansion of bank credit so as to contain inflation
while stimulating production and investment. As with most governments no
explicit trade-off is considered and the relative emphasis on one or other
sub-objective has varied with economic and social conditions.
(b) Credit Allocation Objective:
To channel credit into priority and essential sectors and away from
speculative activities and hoarding. Agriculture, small industry and exports
were the earliest sectors to be defined as priority sectors. The emphasis on
agriculture as a priority/essential sector has remained throughout. The
emphasis given to other sectors has varied however. Small industry expanded
to include small businesses and trade, new sectors like residential housing
and Transport were added and then detleted from the list.
(c) Institutional Objective:
To consolidate and strengthen the banking system, to provide new
financial institutions and to promote money markets.
1.2 Objectives - Implicit
Underlying these explicit or apparent objectives of financial policy
are deeper or implicit objectives which guide their application. This is
particularly true of the credit allocation and institutional objectives. The
implicit objectives are:
- 2 -
(a) Efficiency Objective:
To correct imperfections in the credit market which lead to
economically or socially inefficient use of credit. This clearly influences
the choice of sectors and borrower categories for both positive and negative
credit allocation measures. It also influences the institutional objectives.
(b) Welfare Objective:
To provide welfare subsidies to target groups, to transfer income
between different groups of borrowers, and to change the division of gains in
transactions between traditional lenders and borrowers.
(c) Subsidy Objective:
To correct imperfections or impediments in other markets, or to
mitigate these effects, by providing subsidies through the credit system.
1.3 Types of Policies
The most important financial policies used to meet the overall
objectives can be divided broadly into three groups. This is done on the
basis of the sub-set of the objectives they are primarily directed towards.
They can and often do have effects on other objectives, but it is useful as a
first step to make the categorisation, as follows:
(a) Credit Ceilings and Prohibitions:
These were directed primarily at controlling the flow of total
credit, but often have an allocation component. They include ceilings on
total lending by individual banks, lending to private and public sectors,
lending to different loan size classes, and lending for certain economic
purposes. The allocation component is designed primarily to countervene the
likely allocational impact of overall credit control policies.
-3 -
(b) Allocational Instruments-
These included lending targets and guidelines, margin requirements,
refinance policies, government guarantees, and linking to new urban and rural
branches. Specialized banks when coupled with refinance policy have been
another instrument for this purpose. Further the effects of refinance policy
have been most strongly influenced by the credit ceiling instrument.
(c) Int:erest Rate Policy:
Interest rate policies, including the use of penalty rates, of
course have the broadest ramifications. Ceillgns on (loan) interest rates
have been directed primarily towards the welfare and subsidy objectives. A
secondary objective has beenm the stimulation of investment. Interest rate
policies of course influence the allocation of credit, and the viability of
financial institutions. The use of penalty rates of interest on loan
overdues, has been used as an indirect means of couiiteracti g some of these
secondary effects.
1.4 Overall Allocation
The present paper focuses on the post 1975 period, and on the issue
of credit allocation. Clearly however issues can seldom be so neatly
compartmentalized. To the extent that Macro-economi and institutional issues
interact with credit allocation Issues they will be dealt with.
Table 1 gives an overview of the allocation of credit by broad
economic sectors. Over the period from June 1975 to December 1975 the
proportion of total advances to the agricultural sector rose from 10.8% to
18.6%, while those to manufacturin;v declined from 52.4% to 40.0%. The
proportion of advances going to the transport eector also showed a declining
trend while those to the construction sector in reased. The proportion of
advances going to wholesale and retail trade fluctuated considerably over the
Table 1: Sectoral Distribution of Advances by Scheduled Banks
Transport and Communications 4.49 6.17 6.96 6.77 6.59 6.68
Trade & Catering 8.73 10.00 9.86 9.85 10.80 11.05
Soulrce: "Bangladesh: Recent Economic Dlevelopments and Selected Development Issues,"' March 3, 1982.(This is an internal document with restricted circulation.)
Table 3: Credit Allocation Index; Ratio of Advance Proportions to GD? Proportions
1974-75 1975-76 1976-77 1977-78 1978-79 1979-80
Sector
Agriculture .172 .201 .222 .255 .306 .344
Manufacturing 7.865 6.403 5.330 5.922 5.635 5.520
Construction .168 .135 .207 .290 .628 .265
Transportation .793 .793 .565 .570 .549 .475
Trade 2.702 2.750 2.803 2,329 2.424 2.337
Source: Tables 1 and 2.
II. INTEREST RATE POLICY
2.1 First Major Revision
Table 4 gives an overview of changes in interest rate ceilings on
loans and advances. Over the period there have been two major changes in loan
interest ceilings. The one in May 1977 reduced the nominal ceilings on almost
all loans by one percentage point; from 13% to 12% on general borrowing and
from 11.5 to 10.5 on exports. The exceptions to this were the rates on Jute,
Jute goods and Tea and rates charged by the specialised banks and co-
operatives, which remained essentially unchanged. The effect of this way to
reduce the gap between the interest charged by these institutions and by
others, with the exception of the Bangladesh Samabaya Bank (BSB).
Interestingly BSB which makes medium to long-term loans retained a higher
ceiling rate of 13%.
The professed objective of this reduction in ceilings was to provide
a stimulus to economic activity, particularly to commerce and trade. Credit
ceilings had been in effect since the IMF borrowing in 1974-74. These had
been raised periodically. In particular they had been raised some months
before the lowering of the interest rate ceilings. Credit ceilings were
therefore not on effective constraint in the succeeding period. In 1975-76
and 1976-77 the implicit GDP deflator declined by 23.9% and 3.2% respectively
indicating a strong though decelerating deflation. In 1977-78 this process
was reversed by an inflation rate of 14.9%.
2.2 Second Major Revision
The other major change in interest rate policy occured in October
1980 (also Table 4). The effect of this set of changes was to differentiate
loan interest ceilings by economic sectors. Thus intra-sectoral rates were
unified while intersectoral ceilings were made different for agriculture and
Table 4: Interest Rates on Loans and Advances (Scheduled Banks)
Since Since SinceJuly 1974 July 1976 May 1977 1978/79 October 1980 1981
General Borrowers 12.0-13.0% * 11.0-12.0% * 15.5% 16.0(i.e. all those notseparately specified)
to the public sector Jute industry were rescheduled. This was followed in
1977-78 by rescheduling and restructuring of the debt of the public sector
Jute and Tea industry. This was done under the condition that the debt would
now be backed by government guarantees. The change in the nature of
securities therefore primarily represents a reclassification of this debt from
fixed capital as collateral to government guarantees as collateral.
2.5 Distributional Effects
The distributional effects of credit ceilings, arising from the
unequal distribution of wealth and consequently of collateral among households
are best demonstrated for the agricultural sector. In this sector there is a
high co-relation between the distribution of land and the distribution of
wealth. land is of course the best form of implicit or explicit collateral in
agriculture. In addition, productivity and credit requirements would also be
linked to the value of land. Therefore among the land owners we would expect
small landowners to obtain smaller loans, while most of the landless creditors
would fall in the smallest category.
Table 7 gives the allocation of credit to the agricultural sector,
by loan size. Between June 1.977 and June 1978 there was a sharp reduction in
the proportion of loans of less than TK 1000 from 36.6% to 28.9%. Some of
these were shifted into the next loan size category of TIC 1000 to TK 3000,
which increased from 32.7% to 36.2%. However the table of cumulative
percentages shows clearly the decrease in the proportion of total loans going
to smaller loan categories. As our analysis indicated this would be the
direct effect of a decrease in interest ceiling. A word of caution is in
order, however: As the loan classes are in monetary terms, a proportional
increase in the size of all loans, for example due to inflation, would shift
the entire distribution to higher loan sizes. This would result in a
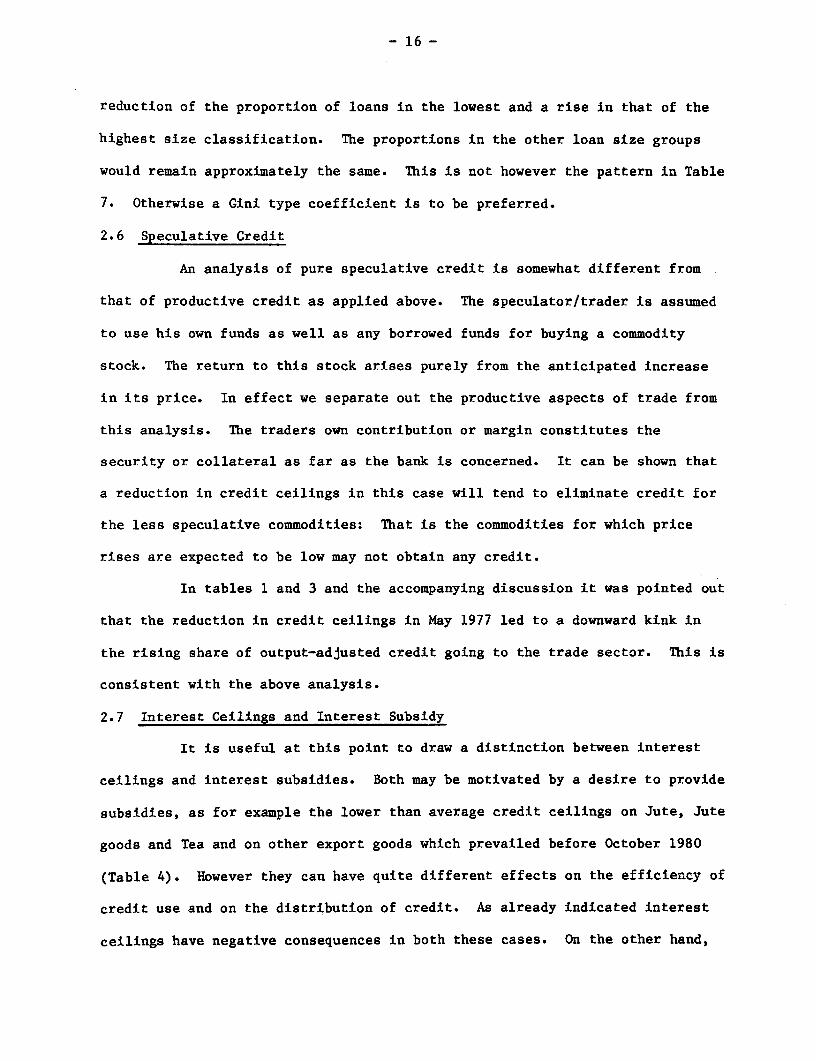
- 16 -
reduction of the proportion of loans in the lowest and a rise in that of the
highest size classification. The proportions in the other loan size groups
would remain approximately the same. This is not however the pattern in Table
7. Otherwise a Gini type coefficient is to be preferred.
2.6 Speculative Credit
An analysis of pure speculative credit is somewhat different from
that of productive credit as applied above. The speculator/trader is assumed
to use his own funds as well as any borrowed funds for buying a commodity
stock. The return to this stock arises purely from the anticipated increase
in its price. In effect we separate out the productive aspects of trade from
this analysis. The traders own contribution or margin constitutes the
security or collateral as far as the bank is concerned. It can be shown that
a reduction in credit ceilings in this case will tend to eliminate credit for
the less speculative commodities: That is the commodities for which price
rises are expected to be low may not obtain any credit.
In tables 1 and 3 and the accompanying discussion it was pointed out
that the reduction in credit ceilings in May 1977 led to a downward kink in
the rising share of output-adjusted credit going to the trade sector. This is
consistent with the above analysis.
2.7 Interest Ceilings and Interest Subsidy
It is useful at this point to draw a distinction between interest
ceilings and interest subsidies. Both may be motivated by a desire to provide
subsidies, as for example the lower than average credit ceilings on Jute, Jute
goods and Tea and on other export goods which prevailed before October 1980
(Table 4). However they can have quite different effects on the efficiency of
credit use and on the distribution of credit. As already indicated interest
ceilings have negative consequences in both these cases. On the other hand,
- 17 -
that when the banking system is inefficient in allocating credit to specific
sub-sectors or sets of borrowers, an interest subsidy to the bank can remove
this inefficiency [see Virmani (1982)]. In such a situation an interest
subsidy increases loans to the neglected sector and to borrowers with
inadequate collateral (wealth). However this policy has not been tried in
Bangladesh.
2.8 Penalty Interest Rates
In February 1979 the government introduced a system of penalty rates
of interest on overdue loans. Scheduled banks were allowed under the system,
to charge a penalty rate of interest, which could be incremented by 1% every
month, until total rate (normal plus penalty) became 20%. The objective of
this penalty was to decrease the disincentive for lending to sectors where
repayment of loans has been a problem. Loan overdues can create a liquidity
problem in addition to reducing the expected return to the bank. As borrowers
who are delaying payments are likely to be the more risky customers it is
logical to charge them a higher rate. The penalty rate does this without
imposing a cost on good borrowers and is therefore an efficient mechanism for
doing so.
The application of penalty rates, particularly in agriculture, has
been somewhat erratic, with differeni: banks having different rules. Thus
Sonali bank charges the full penalty while BKB limits itself to a maximum
penalty rate of 2.5% and Pubali to 11'. It is also reported that in other
economic sectors, banks often charge penalty rates only to the public sector
borrowers and seldom to the private sector. However this is quite consistent
with the rationale given above, if the public sector is more erratic and
deficient in its repayment performance than the corresponding private sector
borrowers.
Table 8: Advances Classif ied by Rates of Interest All Banks(Percent of total Loans)
30-6-76 30-6-77 30-6-78 30-6-79 30-6-80
Interest Rate
110,0%: 0.19 0.28 0.15 6.79 0.12 0.11
10.5% 26.41 23.31 16.34 18.93 25.25 19,86
11.0% 1.78 1.68 3.49 6.79 7.40 10.20
11.5- 7.28 5.85 5.87 5.49 8;38 7.26
12.O% 16.10 15.66 41.52 38,39 38.10 37.56
> 12.0 to < 13.0% 2.37 2.53 1,32 1.19 0.69 0,53 H
13.0% 33.38 40.57 17.46 9.04 5.01 3.89
> 13.0% 0 0 0 0.07 3.80 3.29
- 19 -
Table 8, giving the disl:ribution of advances by rate of interest,
shows that the proportion of loans carrying a rate of interest rate of more
than 13% jumped from .07% of total advances in June 1978 to 3.8% in June
1979. They remained at approximately that level in June 1980. A small
proportion of these of course constitute high interest loans under the Rural
Finance Experimental Project. The rest are due to the use of penalty rates
and give an approximate measure of the extent of usage of such rates.
As late repayment is a major problem in the agricultural sector,
penalty rates will be discussed further under agricultural credit. Such rates
can be a very useful instrument of policy, when the repayment period is
carefully defined to take account of natural agricultural fluctuations.
2.9 Objectives and Effects of the Second Revision
Detailed data of the kind used above is not available for June , so
the effects of the October 1980 revision of interest ceilings are not fully
visible. However some preliminary conclusions can be drawn. As previously
noted this revision involved a change-over to a sectorally oriented system of
interest ceilings. This involved the setting up of an implicit hierarchy of
sectors; agriculture and exports are on top with a ceiling rate of 12%,
followed by manufacturing with a ceiling of 14%, while all other sectors have
a ceiling rate of 15.5%. Small loans and loans in less developed areas, which
do not fit into the sectoral classiLfication, fall between the ceiling rates
for the agricultural and the manufacturing sectors, with a ceiling rate of
13%.
There are two possible justifications for this hierarchy. One is
based on the supposition that production and investment are sufficiently
sensitive to interest rates, and that the economic rate of return has the
hierarchical pattern postulated. T'hrough a plausible case can be made for the
- 20 -
second proposition, the first is highly dubious. However even if it has some
merit it must be questioned whether the provision of implicit subsidies to
creditors is the appropriate means of providing incentives. Thus it is
necessary to look more closely at other policies, like exchange rates and
tariffs, which directly affect exports and manufacturing.
The other possible justification is to provide welfare subsidies to
target groups. Thus the largest numbers of poor are thought to be in the
rural areas, and lower interest rates to agricultural creditors may be thought
of as providing a subsidy. However even if these justifications are accepted
credit ceilings can have unexpected and harmful effects. To understand this
it is very important to draw a distinction between interest ceilings and
interest subsidies, and between cheaper credit and sufficient credit.
Many policy makers and even economic analysts may see the
differential interest rate ceilings as a cross-subsidisation scheme from
general creditors to farmers, exporters, small loanees and industrial
borrowers. This is quite misleading. A true cross subsidisation scheme would
involve an interest tax (or a tax per loan) on all bank lending to general
borrowers and an appropriate interest subsidy (or subsidy per loan) on the
favoured borrowers. This would provide the correct incentives for channeling
credit into the desired sectors. The effect of the differential credit
ceilings will be to redirect credit away from agriculture and exports and to a
lesser extent from industry into general lending. This perverse effect would
be accompanied by redirection of credit within each sector to those with
sufficient collateral and away from those with little collateral. Thus the
poor would tend to get relatively less credit than they would in the absence
of effective credit ceilings. Though adverse intersectoral flows may be
partly stemmed by forced lending through specification of targets, this has
- 21 -
its own limitations. Among these are ineffectiveness against adverse
distributional effects and the fungability problem (discussed in a later
section).
Two observed effects of the differential credit ceiling support the
above analysis. Firstly these havre a differential impact among the
Nationalized Commercial Banks (NCBs). A rise in deposit interest rates also
raises the interest costs of all banks, and may have a differential impact
across banks depending on the distribution of each bank's deposits.
Profitability is more strongly affected, however, by the sectoral distribution
of a bank-s existing loan portfolio. Thus the Pubali Bank which was strongly
oriented towards small loans, exports and fisheries will now earn 12% or 13%
on most of its loans. This has put a profit squeeze and provided a
disincentive to expand further into these sectors. Thus, it is being forced
to expand into areas of related expertise in industry and trade in which
higher interest rates are allowed.
A similar reduction in profits is taking place for the specialized
banks such as the Bangladesh Krishi Bank (BKB). Though the rise in deposit
rates affects only a small fraction of its funds, the relative profitability
of agricultural lending vis a vis agriculture related commercial lending has
declined. Given that in 1979 approximately 70% of its loans went to
agriculture the lower interest rate of 12% on such loans puts a profit squeeze
on the BKB (discussed further in agricultural section). As a result the BKB
is planning to reduce the proportion of agricultural loans to 60% and to
expand faster into sectors like agro-industries, storage, transport and
banking to which higher credit ceilings are applicable.
- 22 -
2.10 Intra-Bank Lending Rates
The rates charged by banks on their internal transfer of funds
between branches and between branches and headquarters are of course not
directly relevant to final borrowers. They affect the incentive structure of
banks, however, and can affect credit flows to final borrowers. For
commercial banks, these rates vary from 11% to 14% at the present time, as
shown below
Bank Headquarters to Branch Branch to Headquarters
Sonali 11% 11%
Janata and Agrani 12% 12%
Pubali 14% 13%
Thus Pubali bank branches have clearly no incentive to borrow funds from
headquarters for lending to agricultural and export sectors (12%) and for
socioeconomic purposes (13%), and little incentives for lending to industry
(14%). If the average administrative costs for all lending operations (1 to
2%) are taken account of, even Sonali bank branches have little or no
incentive to borrow internally for lending to these sectors.
Banks should of course be free to set intra-bank lending rates
according to their particular circumstances. Given the current structure of
interest rates, however, we can calculate the approximate range in which these
rates should lie. The average interest cost of deposits is currently about 7%
of total business. The average administrative costs of lending are about 4%,
though the administrative costs of rural lending by commercial banks are
somewhat higher at about 5%. As the lowest loan rate is 12%, and taking the
4% cost as divided equally between the deposit and lending sides intra-bank
lending rates should be approximately 9 to 10%.
- 23 -
2.11 Real and Nominal Interest Rates
The anlysis presented in this chapter, as in the rest of the paper,
is in nominal interest rate terms. Given the established practice of using a
rate constructed by subtracting actual or expected inflation from the nominal
rate (the 'real' rate) this requires an explanation. The framework on which
the analysis of the paper is based, divides the basic financial market into
two submarkets: The deposit marlket and the loan market. The former is
supplied with funds by depositors and has banks as demanders of funds. In
conventional terms this is the savings side of the market. When savings are
treated in aggregate clearly a 'real' rate of interest must be used in the
analysis. If deposit markets are perfect, changes in the rate of inflation
have no effect on aggregate saving. If deposit rates are controlled by the
government, however, changes in ithe rate of inflation will influence both the
total amount of savings and the amount flowing into deposits. This in turn
will affect the opportunity shadow cost of funds to the banks (termed s in the
present paper).
our analysis focuses on the loan sub-market. The shadow
(opportunity) cost of funds (s) is of curse an input into this market. In the
loan market, competitive banks will make a loan to a borrower as long as their
expected profits are positive; the loan amount, the loan interest rate and
other variables are all expressed in nominal terms. The firm similarly
maximizes its expected profit evaluated in nominal terms. In deciding whether
to take a loan or not it merely compares these net profits with the nominal
opportunity cost of own funds. The terms of the loan contract, including the
loan interest rate, will differ for firms with different characteristics (e.g.
returns). The allocation of loans will therefore be determined by the
distribution of these characteristics across firms. If we compare two
- 24 -
situations; one in which all prices are double that in the other, there is no
reason to expect any difference in the distribution of these characteristics
across firms. Therefore the allocation of credit should not be affected if
other things remain unchanged.
If the deposit interest rate is controlled, however, the flow of
deposits into the banking system might fall. This in turn would raise the
shadow cost of funds to the banks. Our analysis shows that in this case loan
amounts must fall and loan interests rates rise for every existing borrower.
In addition collateral requirements may rise or fall for each borrower, and
this could affect the distribution of loans. Without more detailed
information, however, it is not possible to determine the direction of change
for any particular borrower. The first order approximation is therefore to
assume no effect of inflation on credit allocations; the analysis can be
carried out in nominal terms.
III. CREDIT ALLOCATION POLICY
3.1 Overview
Several different policy instruments have been used for different
sectors at different times. Among these are targets, prohibitions and
ceilings, margin requirements, refinance or counter finance, guarantees and
urban-rural branch approval. One way of organizing these instruments is in
terms of positive and negative instruments. The negative instruments are
designed to reduce or eliminate the flow of credit to certain individuals or
for certain purposes. Ceiling and prohibitions and margin requirements fall
into this category. The positive instruments are designed to channel the flow
of credit into specified areas. All the other instruments mentioned fall into
this category. Logically of course the categories are complementary in the
- 25 -
sense that if a negative instrunient is successful it must have a positive
aggregate effect on the unspecified areas, and similarly for a positive
instrument.
The banking system (i.e. the financial system excluding the Central
Bank and the government) can be conceptually seen as having an inflow of funds
on the deposit side and an outflow of funds on the loan side. In other words,
instruments can be classified in terms of how far they are from the final
borrower. Right on the outflow side are instruments like lending targets,
lending ceilings and prohibitions, exemptions from overall credit ceilings,
and margin requirements. In the middle are collateral guarantees and urban-
rural linked branch expansion. Farthest away, on the inflow side, are
instruments like refinance and liquidity guarantees.
3.2 The Target Approach
Loans to small businesses, small loans and exports were the earliest
to be designated as priority sectors (1973). In February 1975 banks were
notified that the small loan category be given priority in any credit
allocation following from an increase in deposits. In September 1975 a
lending target of TK 1 crore per bank was fixed for nationalised commercial
banks' lending to this category. During the same financial year (1975-76)
restrictions on housing loans were lifted.
In 1976-77, deposit-linked targets were imposed on each nationalised
commercial bank. The targets were 1 1/2% of deposits (as on June 1976) to be
loaned to the small loan category, 1 1/2% to the transport sector, and 1% of
deposits for residential housing. Informal guidelines were also issued for
increased lending in less developed areas at a controlled rate one percent
below the general interest rate ceilings (i.e. initially at 12%). In 1977-78,
the loan target for small loans was raised to 2% and maintained at that level
- 26 -
for the next three years. In contrast, targets for house building and
transport were maintained at the same level in 1977-78 and then eliminated the
following year. In 1977-78 loan interest ceilings of 11% on loans for rural
housing and 5% on loans for multistoried buildings were imposed. These
compared with the general ceiling of 12%.
Table 9 shows, for the three nationalised commercial banks the loans
made to the three targeted sectors as a percentage of their total loans and as
a percentage of target. The data for the three banks suggest that banks were
quite successful in meeting the small loan targets, but not those for housing
and transport. There is some variation among banks however: Sonali bank was
successful in small loans and unsuccessful in the other two; Agrani bank was
successful in transport and partially unsuccessful in small loans and housing;
and Janta bank was successful in both small loans and transport.
This variability in success (as measured against targets) suggests
that it is not useful to impose uniform targets on banks. Each bank has its
own special orientation and expertise. Given the different sources of
information and information links the banks would tend to specialise in
special segments. Uniform targets reduce the flexibility of the system. A
recognition of this probably lead to the elimination of targets on house
building and transport loans after a trail period of two years.
Table 9 also gives the allocation of credit to each priority sector
as a proportion of the total advances of each bank. In table 1, the share of
advances of all scheduled banks going to the transport sector showed a
declining trend over the 1978-80 period; it went from 4.3% in 1975 to 3.1%. in
1980. The allocation of credit by the three commercial banks in table 9, is
_ 27 -
Table 9: Advanees to Small toans rnd Smatl Tndtstry. HouRse Pu1ldfnr andTransport as a proportion of targeted amounts - Three Banks
kec. 1975 Dec. 1976 Dec. 1977 Dec. 1978 Dec. 1979 Dec. 19801. SONALI BANK (S)
Small loan. and small lndustryAs a percentage of total advanceti 2.19 2.o9 2.44 2.72 2.43 2.25As percentage of target: N.A. 701.00 126.56 109.51 97.82 98.80
House Building
Percentage of total advances .07 .17 .46 .74 .64 .54Percentage of target IIA. N.A. 36.46 59.55 N.A. N.A.
Trans porlt
As a percentage of total advanceo .82 .89 .71 .94 .49 .37As a percentage of target. NA. N.A. 36.89 50.26 N.A. NA.
2. AGRANI BANK (A)
Small loans
As a percentage of total advanceis .80 1.91 3.63 2.43 1.61 1.38As a percentage of target N.A. 291.00 201.18 95.67 62.47 53.15
Rouse Building
As percentage of total advances a .07 .91 1.29 1.26 2.13As percentage of target N.A. N.A. 75.34 101.48 N.A. N.A.
Transport
is percentage of total advance. * 1.14 1.18 1.27 1.00 1.10as percentage of target N.A. N.A. 65.54 67.02 N.A. .A.
3. JANATA BANK (J)
small Loans
As percentage of total advances .0 1.71 1.87 2.59 2.19 *As percentage of target N.A. 608.00 117.91 129.77 112.09 a
Rouse Building
As percentage of total advances a * * .89 1.56 *As percentage of target N.A. N.A. C 89.03 N.A. N.A.
Traaport
As percentage of total advances 2.72 2.11 1.89 1.92 1.91 aAs percentage of target N.A. N.A. 118.89 128.67 N.A. N.A.
4. ThREE BANKS (S. J, A)
Smll Loana (S, J, A)
As percentage of total advances .96 1.45 2.43 2.61 2.18 aAs percentage of target V.A. 364.00 138.58 114.02 95.71 a
House building (S & A only)
A percentage of total advances a .13 .63 .93 .83 .98As percentage of target N.A. N.A. 49.97 74.09 N.A. N.A.
Transport (S, J, A)
As percentage of total advances a 1.52 1.33 1.42 1.16 aAs percentage of target N.A. N.A. 75.84 83.04 N.A. N.A.
N.A. a Not applicablea - Data not availableSorce: Annual Reports of the respective banks
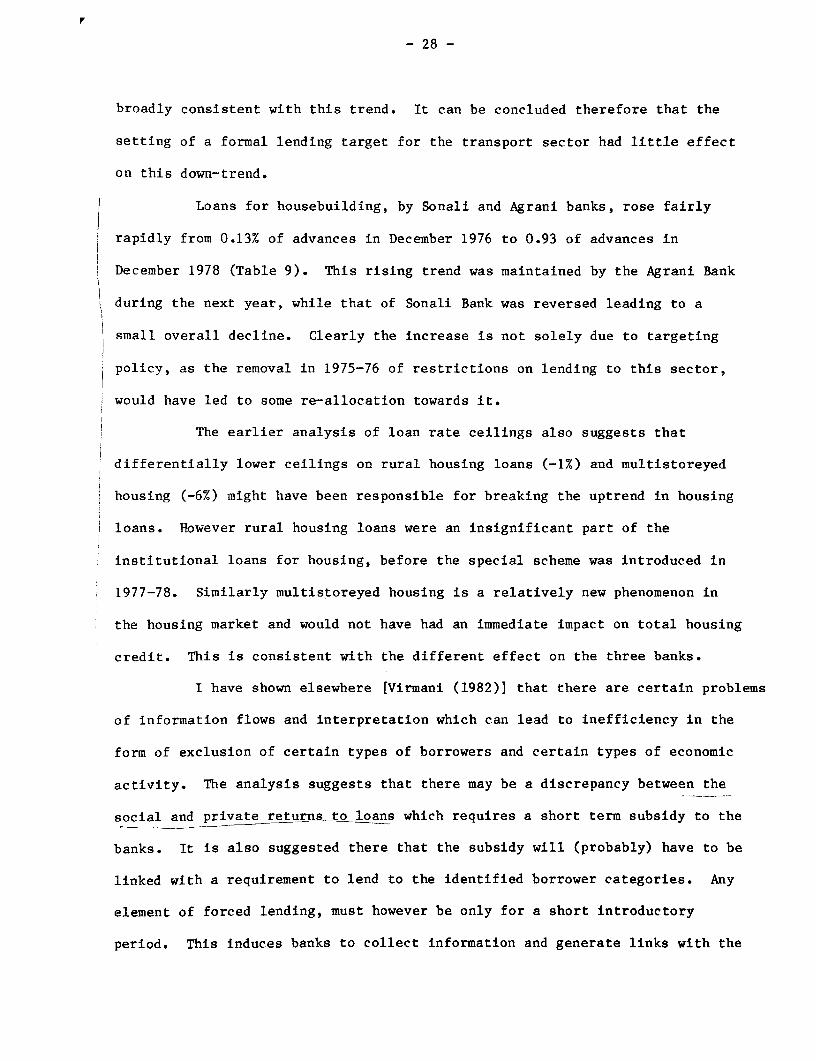
- 28 -
broadly consistent with this trend. It can be concluded therefore that the
setting of a formal lending target for the transport sector had little effect
on this down-trend.
Loans for housebuilding, by Sonali and Agrani banks, rose fairly
rapidly from 0.13% of advances in December 1976 to 0.93 of advances in
December 1978 (Table 9). This rising trend was maintained by the Agrani Bank
during the next year, while that of Sonali Bank was reversed leading to a
i small overall decline. Clearly the increase is not solely due to targeting
policy, as the removal in 1975-76 of restrictions on lending to this sector,
would have led to some re-allocation towards it.
The earlier analysis of loan rate ceilings also suggests that
differentially lower ceilings on rural housing loans (-1%) and multistoreyed
housing (-6%) might have been responsible for breaking the uptrend in housing
loans. However rural housing loans were an insignificant part of the
institutional loans for housing, before the special scheme was introduced in
1977-78. Similarly multistoreyed housing is a relatively new phenomenon in
the housing market and would not have had an immediate impact on total housing
credit. This is consistent with the different effect on the three banks.
I have shown elsewhere [Virmani (1982)] that there are certain problems
of information flows and interpretation which can lead to inefficiency in the
form of exclusion of certain types of borrowers and certain types of economic
activity. The analysis suggests that there may be a discrepancy between the
social and private returns to loans which requires a short term subsidy to the
banks. It is also suggested there that the subsidy will (probably) have to be
linked with a requirement to lend to the identified borrower categories. Any
element of forced lending, must however be only for a short introductory
period. This induces banks to collect information and generate links with the
- 29 -
neglected sector, a kind of forced learning by doing. A policy of
targeting/guidelines when accompanied by appropriate incentives can therefore
be justified for short periods for new and unfamiliar activities. Thus the
initial success in increasing the share of house building loans may have been
partly due to the guideline targeting approach.
This analysis is also supported by the differential performance of
banks in terms of loan share of the small loan category. Thus targeting had
little effect in the case of Sonali bank which already had a proportion of its
advances going to this sector, and already had information links. On the
other hand the Agrani and Janata banks had only .8% and 0% respectively of
their loan portfolio going to the small loan category on December 1975. This
had increased to 3.63% for Agrani by December 1977 and 2.59% for Janata by
December 1978. In both cases it declined after the peak. Three years in one
case and four years in the other was probably more than enough time for the
initial information links and learning to take place. Normal criteria would
eventually begin to apply. Thus the final stable level of lending to this
sector represents a relatively efficient level of lending compared both to the
low initial levels as well as to the peaks reached under pressure.
In 1979-80 banks were asked to raise their credit deposit ratios in
less developed areas, including the Chittagong Hill-Tracks to 75%. It is
highly unlikely that general development problems can be addressed solely or
even primarily by forced lending. Widespread experience, including that of
many banks in Bangladesh, indicates that a package of inputs and programme
(technology, marketing etc.) is necessary. Moreover with the interest changes
in October 1980, interest ceilings for these areas are at 13%, that is 2.5%
below the general rate. This provides a disincentive to bank lending.
Further as the target is linked to deposits from the same areas, if the target
- 30 -
is forcefully imposed, this would also provide a disincentive for raising
deposits from these areas.
A target of 1% of bank deposits for lending for non-traditional
exports was introduced in 1979-80 and continued thereafter. Policies directly
related to export profitability need to be examined very carefully as
suggested in the introduction. If there are also information problems in
export lending, guidelines and targets can be useful for a few years if
accompanied by adequate incentives. However from October 1980 the interest
ceiling for export lending at 12% was 3.5% below the general ceiling.
Informal targets were also set for agricultural lending. However as
target setting was not the major policy tool for agriculture, credit to this
sector will be considered in the section of the primary policy tool used.
3.3 Ceilings and Prohibitions
In the pre-1975 period of high inflation, there were many
restrictions on the use of various types of financial securities, capital
equipment and real estate as collateral. These were gradually lifted. In the
absence of interest rate ceilings such restrictions tend to raise interest
costs to borrowers (see Virmani 1982). Thus credit would be shifted from
those borrowers whose interest rates were previously against the ceiling to
those who were below. The latter would now be paying higher rates but getting
relatively more credit. Inefficiency is increased and credit tends to shift
from unfamiliar, more risky borrowers to familiar less risky borrowes as
perceived by the bank. Such restrictions would also tend to shift credit from
productive to speculative purposes as the latter are less likely to be based
on explicit collateral than on implicit collateral; for example, the margin of
stock value constituting the borrowers equity in a commodity stock. Implicit
collateral (e.g. the value of accounts receivable) can of course be used even
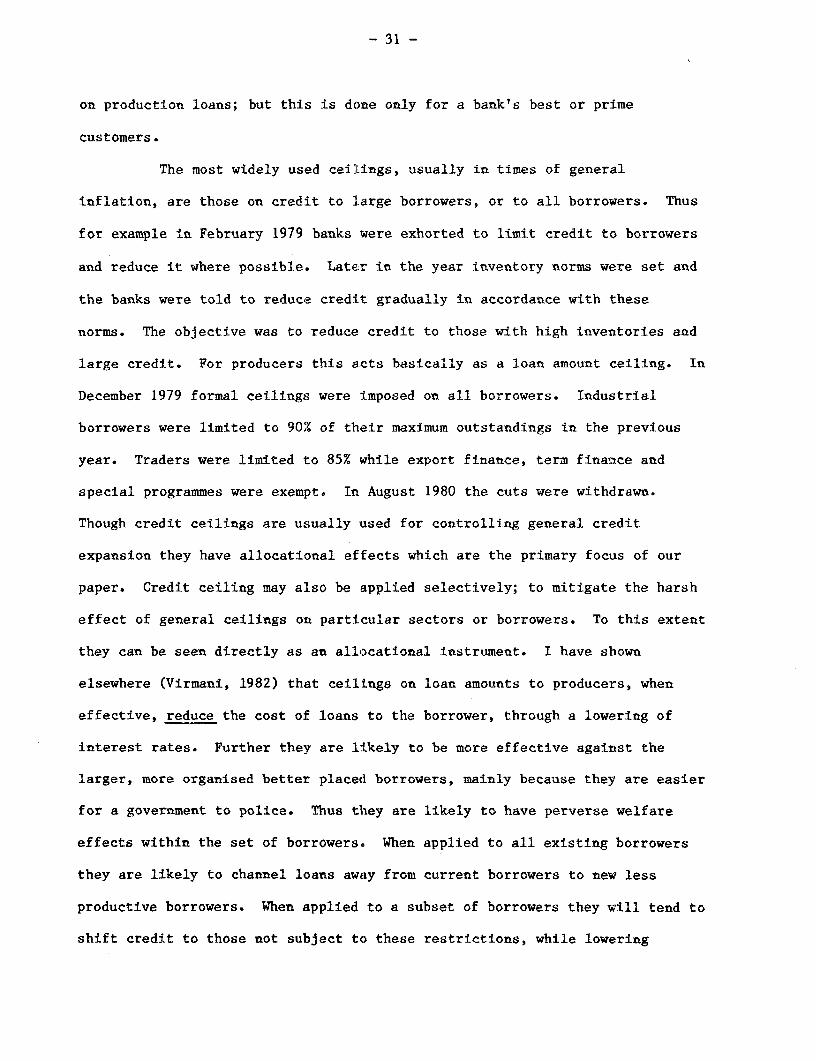
- 31 -
on production loans; but this is done only for a bank's best or prime
customers.
The most widely used ceilings, usually in times of general
inflation, are those on credit to large borrowers, or to all borrowers. Thus
for example in February 1979 banks were exhorted to limit credit to borrowers
and reduce it where possible. Later in the year inventory norms were set and
the banks were told to reduce credit gradually in accordance with these
norms. The objective was to reduce credit to those with high inventories and
large credit. For producers this acts basically as a loan amount ceiling. In
December 1979 formal ceilings were imposed on all borrowers. Industrial
borrowers were limited to 90% of their maximum outstandings in the previous
year. Traders were limited to 85% while export finance, term finance and
special programmes were exempt. In August 1980 the cuts were withdrawn.
Though credit ceilings are usually used for controlling general credit
expansion they have allocational effects which are the primary focus of our
paper. Credit ceiling may also be applied selectively; to mitigate the harsh
effect of general ceilings on particular sectors or borrowers. To this extent
they can be seen directly as an allocational instrument. I have shown
elsewhere (Virmani, 1982) that ceilings on loan amounts to producers, when
effective, reduce the cost of loans to the borrower, through a lowering of
interest rates. Further they are likely to be more effective against the
larger, more organised better placed borrowers, mainly because they are easier
for a government to police. Thus they are likely to have perverse welfare
effects within the set of borrowers. When applied to all existing borrowers
they are likely to channel loans away from current borrowers to new less
productive borrowers. When applied to a subset of borrowers they will tend to
shift credit to those not subject to these restrictions, while lowering
- 32 -
interest rates to the former. But a better way of rechanelling without
adverse distributional effects is to put an interest tax on lending to non-
favored borrowers. Overall efficiency in use of credit will deteriorate under
both policies, unless all favored creditors were previously getting less than
the efficient amount of credit. This is unlikely to be true.
Loan ceilings on credit which is going into stocking for speculative
purposes has somewhat different effects. In this case it can be shown that an
effective ceiling on loan amounts per borrower will increase the interest rate
on loans. However if these rates cannot be raised because of interest rate
ceilings then no loans will be made to the potential borrowers. Loan ceilings
can therefore be useful in this case if they are effective.
3.4 Margin Reguirements: Overview and Analysis
In Bangladesh, as in many other countries, government setting of
minimum margin requirements have been used primarily as an instrument for
controlling "speculation and hoarding", in specific commodities. Thus they
were in most active use when prices of particular commodities considered to
have large adverse social consequences started to rise very rapidly. Among
the specific commodities have been rice and paddy, sugar, oil and oil seeds,
jute and jute goods, onions and chillies, salt, cotton yarn and textiles, and
synthetic yarn and textiles.
As shown in Table 10, at the start of the period under consideration
the margin requirement on Jute and Jute goods was implicitly 100% as all
lending for this purpose was banned. This was motivated by the high rates of
growth of prices, which rose by 63% in 1974-75. As price growth eased to 4.4%
in 1975-76, credit was allowed to this sector. However a sharp rise of 40% in
the prices of these goods in 1977-78 following on the heels of a rise of 11%
the previous year does not seem to have led to an increase in margin
Table 10: Rate of Growth of Prices and Imposition of Margin Requirements (In percentages)
1974-75 1975-76 1976-77 1977-78 1978-79 1979-80
1. Jute and Jute GoodsMargin 100. 0(?)Rate of price growth 63.00 4.37 11.32 39.99 1.18
Mustard Oil Prices (Rate of Growth) -32.18 -15.00 35.20 -0.20
5. Cotton, Yarn & Textiles and 50 0 50Synthetic Yarn & TextilesRates of Growth in;Sari Prices -0.47 -1.45 10.65 26.49 2.81WPI for Manufactures 49.73 -43.07 -2.63 5.97 7.41
6. General Merchandise TradeMargins 0(?) 50 60
Rate of Growth ofCOL Index for Middle Income Groups 67.17 -8.40 2.40 12.60 8.30 18.50COL Index for Non-Food 52.10 11.40 4.40 9.50 9.30 14.60COL Index for Food -16.00 1.05 15.64 6.80 20.96
a/ There were informal guidelines in margins during this period.b/ Informal norms were prescribed to banks.
Sources: Resume of Financial Institutions, Finance Ministry, Various Issues.Bangladesh Bank, Annual Reports.Statistical Absgract of the Bangladesh (-ov,rnmnt.
- 34 -
requirements. Thus the use of this instrument seems to decline over time,
perhaps corresponding to a decline in concern over hoarding. Similarly the
margin requirement of 50% on advances against salt was accompanied in 1974-75
by rate of growth of 751% in salt prices. These margin requirements were
eliminated the next year as prices fell by 66.8%. Guidelines were issued in
1976-77 as prices again rose by 20.5% and inventory-credit norms were
established the following year. The sharp decline of 18% in salt price in
1978-79 led to some positive credit measures. Lending, for sugar alloted by
the food department, could be done at 50% margin in 1977-78. As sugar prices
were controlled throughout the period, the best available (though imperfect)
measure of tightness or rationing in the sugar market was gur prices
(jaggery). Thus gur prices, after falling by 21.1% in 1976-77 increased by
1.6% in 1977-78 suggesting a corresponding increase in demand pressure
relative to supply in the sugar market. This is confirmed by the still higher
price rise of 12% in gur prices in 1978-79.
Credit margins on borrowing by oil mills against local oil seeds and
oils were put at 50% in 1977-78. Similarly a 25% margin requirement was
specified on imported oils and oil seed during the same year. Prices of
mustard oil, which constitutes the most important local oil, provide the
answer. Price declines of 32% and 15% in 1975-76 and 1976-77 were followed by
a price rise of 35% causing alarm to the government. A decline of 0.2% in
mustard oil prices in 1978-79 led to a removal of margin requirements on
imported oils and seeds and a fall in margin requirement to 50% on finished
products of oil mills.
Margin requirements seem to have been directed primarily against
agricultural commodities, and within that primarily on goods of common
consumption. Thus, for example, lending to private rice and paddy traders has
- 35 -
been banned for most of this period, giving an effective margin requirement of
100%. The other major good in the consumption basket is clothing. As we
might expect both cotton yarn and textiles and synthetic yarn and textiles
have been subject to margin requirements (Table 10). The early period also
witnessed wider use of margin requirements on industrial inputs suggesting use
of margin requirement as a more general credit control and inflation fighting
device. As recently as 1978-79 margin requirements on general merchandise
trade were raised from 50% to 60%, following observation of accelerating
inflation in 1977-78 and 1978-79 (Table 10).
Before determining the effects of this policy instrument in
different contexts, it is useful Ito analyse the effect of margin requirements
in a simplified context. Consider a situation in which credit is being used
purely for speculative purposes, that is to buy and hold commodity stocks in
anticipation of a price rise. Consider a bank and a speculator who are
neutral in their attitude to risk and are therefore interested only in the
expected returns. To begin with we assume that the speculator has a fixed
amount of outside funds or equity available to him for purchase of
commodities. Given this equity, we can define a loan supply curve for each
borrower-lender pair which is limited at one end by the condition that banks'
have positive expected profits. The speculator's demand curve is perfectly
elastic; if at any interest rate it is profitable for him to borrow it will be
profitable to borrow an infinite amount. Thus a 'rationing equilibrium' can
emerge as shown below (r*, L*), if banks act competitively. In such a
situation, if government imposes a margin requirement m (m > e which ise + L* e wi is
effective, it is equivalent to a loan ceiling
- 36 -
Figure 1
LS
L~~~~~~~~~~LE ~ ~~~~ X
, .~~~~~~~~~~~~~~~~~~~~.
1~~ e
L = e (--1) (from m = e+ L , e is the value of the stock). As shown in the
ceilings exist, and the new interest required is higher than these ceilings no
loans will be made.
Even when the effect of government imposed margin requirements falls
on loans for productive purposes, it still acts as a loan ceiling. The effect
of loan ceilings has been shown above (section 12). When commodity stocks are
used as collateral by producers, the ratio of the loan value to the collateral
is of course referred to by banks as the 'margin'. This ratio, or bank set
,margin requirement' will, in general, be different for different producers,
even for the same collateral commodity. This is because the returns from and
riskiness of the productive activity in which the loan is used varies across
borrowers. All the terms of the loan contract will therefore differ: more
productive borrowers will obtain better terms than less productive ones. This
will tend to result in lower effective margins for the former than for the
latter.
Returning to the case of speculator borrowing, the speculator's
equity contribution may not be fixed as assumed. If, instead, the speculator
has a rising marginal cost of equity funds, similar results are obtained. The
- 37 -
only difference is that an effective margin requirement raises the marginal
return to speculator equity and therefore brings forth additional equity funds
into speculation. As a result interest rates do not rise as much as in the
fixed equity case, and the number of eliminated borrowers will be smaller.
Thus effective margin requirements can reduce the flow of funds for
speculative purposes and raise the cost to current borrowers.
3.5 Margin Requirements: Differential Impact
In Table 11 and 12 we present data on the distribution of credit by
margin requirements for some of the commodities reviewed above for which data
is available for the relevant time periods. These statistics relate to
Nationalised Commercial banks (NCBs). The results for sugar, and oil and oil
seeds are broadly consistent with the above analysis. Thus for sugar the
imposition of a 50% margin requirement in April 1978 resulted in a substantial
change: Between June 1977 and June 1978, the proportion of credit with no
margin requirements, went from 84% to 53%, while that with 50% margin
requirement went from 5% to 28%. This was accompanied by an increase in
proportion of credit subject to 25% margin. As this credit includes credit
going to public sector sugar mills, this represents a fairly effective
shift. This shift in the allocation of credit by margins was accompanied by a
fall in loan size per borrower from TK 6280 to TK 1040. Total loans against
sugar also declined from TK 408 thousand to TK 281 thousand. Both these are
consistent with our analysis.
By June 1979 however virt:ually no loans were at 50% margin, with
about 90% of the loans being at margins of 25% or less. The average loan size
had increased back to TK 5820, evert though total loans against sugar were
still at a reduced level of TK 245 thousand.
- 38 -
Table 11: Distribution of Advances by MarpinR for Specified Securities, and Average Loan Sizeby tlrgl, for saae Seeurities
1/ It is not entirely clear from the data whether disbursements are for agricultural credit alone or alsoinclude trade, storage marketing of agricultural goods.
Source: Bangladesh Bank, Annual Reports
- 49 -
sanctions for the first time and in 1980-81 this reversal become more
pronounced. This peculiar situation arises because of delay in disbursement
of loans committed in the previous year.
The proportion of refinancing actually provided can be measured
approximately by the loans disbursed by the Central Bank divided by the
entitlement, as measured by the agricultural banks advances for the year.
These rise to a peak of 117% in 1977-78 and then decline to 79% in 1980-81.
Because of the carry-over of previously committed loans and the partial carry
over of previously sanctioned loans, a better (but still approximate; because
of the abrupt start at 1974-75) measure is the cumulative disbursement divided
by the cumulative entitlement. This shows refinance proportion rising from
87% in 1975-76 to 101% in 1977-78, suggesting that most backlogs were cleared
by this time. Refinance remained aLt the fairly high level of 96% in 1979-80
but fell sharply to 90% in 1980-81. This suggests that even though actual
refinancing by the Bangladesh bank may have fallen below 100%, due to the
application of constraints ona general credit expansion, the goal remained at
100%. In contrast, in 1979-80 and 1980-81 loan sanctions are actually below
loan entitlements for the first time, suggesting an implicit movement away
from the goal of 100% refinancing of agricultural banks.
The commercial banks, and the BKB for its non-agricultural lending,
are entitled to refinance on a wide variety of items. The current rates of
refinance are as follows:
Food and Fertilizers (BADC), Petroleum and Petroleum Corp. 100
Exports Non-Traditional 100%
Traditional 50%
Small Loans 0% (100% until late )Sugar 50%
Jute 50%
SACP 50%
- 50 -
The refinance rate for the special agricultural programe (SACP),
like the agricultural lending of BRB and BSBL, carried a 2% subsidy on the
Bangladesh bank rate. All other sectors got refinace at the discount rate
which was 8% between June 1974 and October 1980 and 10.5% thereafter (Table
4).
The total amount of refinance taken under these catagories rose
steadily from 251.53 lakhs in 1979 to 703.88 lakhs in December , a growth of
180%. The annual compound growth rate from June 1979 to June was 67% a year,
representing a fairly substantial increase in refinance. Jute was the largest
user of refinance throughout the period, but grew by only 23.5% from 119 lakhs
in June 1979 to 146.98 lakhs in December . Refinance to the petroleum
corporation started in December 1979 and has been the second largest since
December 1980. Food and fertilizer have changed places for the next position.
Given the diverse items for which refinance is provided it is useful
to look at some of the explicit and implicit objectives. Both food and jute
are subject to annual fluctuations in production. Refinance is seen as a
means of providing credit for holding stocks in a deflationary situation. Our
earlier analysis of speculative credit suggests that commercial banks would
tend to provide little credit in this situation. But this question really
needs to be looked at in terms of the buffer stocking policy of the
government. Macroeconomic issues are also important. A properly worked out
buffer stocking policy would trade off sectoral effects and macro economic
effects, and work out a self supporting buffer-stock policy. Any desired
subsidies, should in general go direct to the producer and not to private
traders.
Sugar production has a strong seasonal pattern. Both lender banks
and potential borrowers know that prices will fluctuate in a seasonal pattern
- 51 -
over the year. The analysis of speculative credit does not indicate that
banks will not provide credit in this situation. However a seasonal buffer
stocking policy which is self-supporting could be worked out if necessary. If
it is thought necessary to provide subsidies to producers or consumers these
could be provided directly.
Provision of refinance to the petroleum corporation is used
essentially to fill the gap between the rise in oil prices and the rise of
final product prices. Thus it can be seen as a means of providing a
consumption subsidy to oil consumers. Even if such a subsidy is to be given
there does not appear to be significant reasons for using the banking system
for this purpose. The provision of refinance to BADC for fertilizer has a
completely different purpose. Subsidies are provided explicitly through the
budget: Delays in receipt of the subsidy or short term liquidity problems are
however met by providing 100% refinance to banks for their lending to BADC.
This appears to be a more satisfactory method for achieving a similar purpose.
In the case of non-traditional exports information problems can
effect the flow of credit, as I have shown elsewhere (Virmani 1982). A
determination must be made, however, whether this is the primary, or even a
major problem. This requires a prior examination of the foreign exchange
markets and the policies which impinge directly on exports and imports. In
addition one should also look at more general agricultural or industrial
policies which impinge on sectors which are potential exporters. Given
appropriate policies in these areas, credit policies can be used to remove any
inefficiencies in loan markets. These generally relate to new export products
with which bankers are unfamiliar. Credit policies when used for an initial
period can be useful in removing inefficiences.
- 52 -
3.7 Refinance Usage, Incentive Effects and Usefulness
The use of refinance policy as an instrument for redirecting credit
allocation can be examined in the context of the analysis in Virmani (1982). We
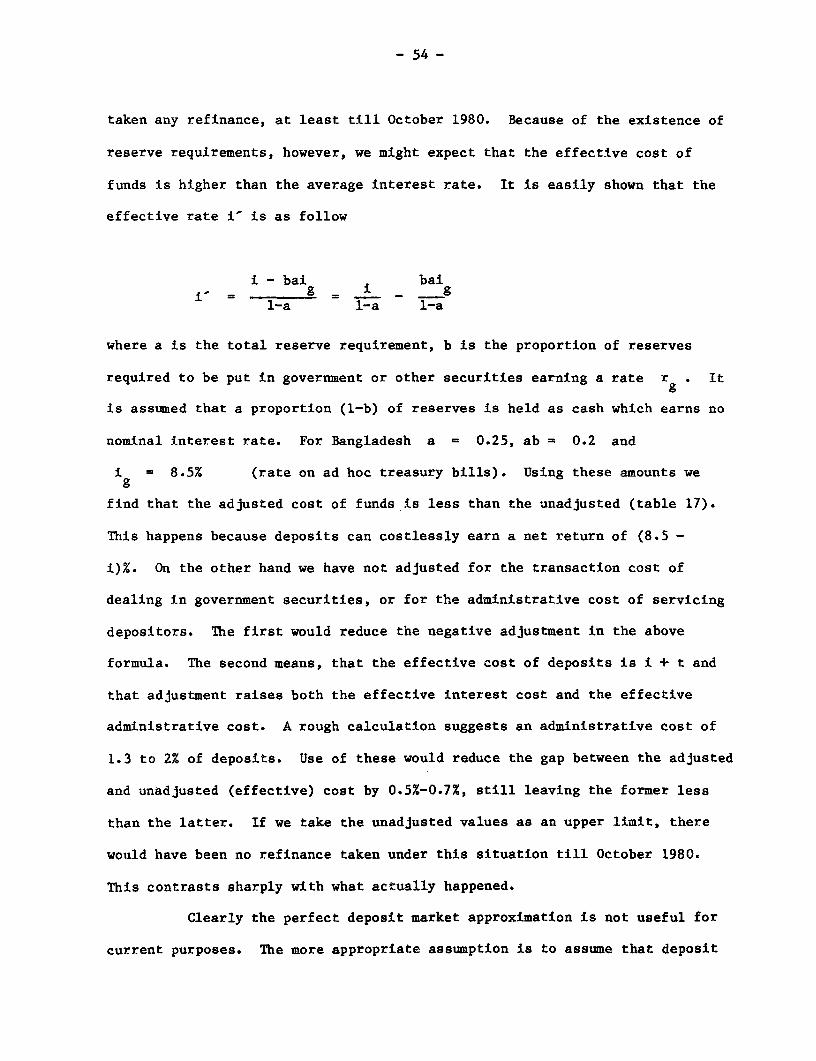
start by considering the simplest case of a perfect deposit market, in which a
bank acts as a price taker at a deposit interest rate of i (a more realistic
case is considered below). Let the refinance proportion be h and the
refinance rate p. If the refinance rate is greater than or equal to the
deposit rate, no refinance would be availed of and refinance provides no
incentive. If the refinance rate is less than the deposit rate, the cost of
funds for the refinanced sector becomes i = hp + (1 + h)i which is less than
i the deposit rate. I have shown that the direct effect of this is to
increase loan amounts and reduce interest rates to borrowers. Loans would
also be made for the first time to previously marginal potential borrowers.
Both these would shift credit allocation towards the refinanced sectors.
If interest ceilings exist, the effect of refinancing is to reverse,
partially, the harmful effects of such ceilings. The lowering of the 'free'
interest rate on loans means that on the margin borrowers are shifted from
having an effective credit ceiling to not having one. The effect of refinance
policy on collateral requirements is uncertain, as these may rise or fall. For
those borrowers who are still constrained by the loan interest ceilings, the
adverse distributional consequences of interest ceilings on the poor (little
wealth), may be countered or enhanced by refinance policy.
Table 17 gives the average weighted deposit costs over the period.
The refinance rate for the agricultural banks has been 6% since 1974. (The
refinance rate is of course 8.0/10.5 for the other sectors). This compares
with a interest rate of 3.5 to 4.3% till 1980 and 7.0% in respectively.
Under such a situation our analysis suggests that these banks would not have
Note: The national average for the size of business of a Sonali branch was16,669 (Thousand Taka) in 1979 and 19,164 (Thousand Taka) in 1980; theadministrative cost as a percentage of business was about 1.8% for thetwo years.
* Computed from a sample of 10 rural branches that have been inoperations since 1978 or earlier. -
** Size of Business is defined as the sum of total deposits andoutstanding advances.
Table 23: Sonali Bank Statistics(in 1000 Taka or p.9 as applicable)
these branches. If rural branches were transferred to BKB the primary
responsibility for providing funds; to BSBL and IRDP would be transferred to
BKB.
An alternative method for linking the flow of funds to agricultural
banks with rural deposit mobilization is to make it mandatory for nationalized
banks to transfer all excess reserves from their rural operations to BKB, BSBL
and IRDP. This transfer would be in the form of loans at rates which take
account of interest payments and administrative costs. In other words BKB,
BSBL and IRDP would have the right to borrow from the NCBs the difference
between the loanable funds generated by rural deposits and the loans made in
rural areas. This proposal is likely to be more acceptable to NCBs, but more
difficult to implement because of the problem of defining rural areas and
rural loans. Some mix of the two maethods may prove to be more feasible.
4.5 Buffer Stocks: Alternative for Margin Requirements and Refinance
When analysing margin requirements it was suggested that they may be
useful for agricultural commodities. As buffer stocks fulfill the same price
stabilizaton function it is useful to briefly consider the two together. As a
general principle buffer stock policy is more relevant for commodities whose
prices fluctuate regularly on a seasonal and/or annual basis. Margin
requirement changes are more appropriate for unexpected and temporary changes
in prices. Put somewhat differently buffer stocks are more appropriate when
production fluctuates from year to year or when havesting is concentrated at
one point in a year, resulting in a strong seasonal fluctuation in prices
(i.e., demand is uniform). Margin requirements are more appropriate when
unexpected economic events lead to strong speculative demand.
Buffer stocking and refinance are not as clearly separable. Buffer
stocking would itself give rise to a cyclical, seasonal or annual, pattern of
- 80 -
demand for credit. In the seasonal case the cycle is exactly the inverse of
the demand for credit for agricultural production of the corresponding
commodity. Therefore if both sets of borrowers were supplied from an
integrated financial system, cyclical demand fluctuation would be eliminated
and there would be no need for special refinance. On the other hand annual
cycles would still lead to annual fluctuation in credit demand from the
stocking agency. If the buffer stocking operation is self supporting (after
taking account of explicit budgetary subsidies) the banking system woud
generally be willing to supply the required credit.
4.6 Term Finance
In the agriculture area there is strong push for providing medium,
and long term finance for irrigation improvement. In industry the specialised
banks, Bangladesh Shilpa Bank (BSB) and Bangladesh Shilpa Rin Savings (BSRS),
are there specially for providing term finance. I have shown elsewhere that
term lending creates special problems for banks because of the difficulty of
distinguishing between productive and unproductive, and honest and dishonest
borrowers. Both problems have arisen in the case of term lending for
industry. Industrial lenders can borrow up to 70% of the cost of a new
project from BSB. Additional loans of up to 15% can be obtained from ICB and
IFC. By inflating the cost of imported machinery (overinvoicing) and of land,
and covering the difference from the public (shares) the promoters can end up
by not using any of their own funds. Thus they may have little commitment to
the success of the project, resulting in poor repayment performance.
As I have shown it is necessary in such situations to develop
procedures for distinguishing between productive and honest borrowers and the
rest, and restricting loans to the former. A World Bank research project on
Kenya is attempting to develop such procedures. Similar work has also been
- 81 -
done in a neighboring country. Use should be made of these and other
attempts, to do the same thing in Bangladesh. Other suggestions are made in
the financial review of Industrial Sector lending.
V. AGRICULTURAL CREDIT
5.1 Introduction
The explicit purpose of agricultural credit policy has been to
promote the growth of output and the welfare of farmers. The first goal
implies either that rural credit markets are inefficient or that credit is an
effective means of providing a production/investment subsidy to
agricultural. If rural credit markets are inefficient, then effective
intervention could promote output growth by improving efficiency. On the
other hand a determination of whether a production subsidy should be provided
through credit requires a prior exaLmination of the incidence of taxes and
subsidies on fertilizer, irrigation water, irrigation equipment and output.
Once a neutral policy environment is created, it cannot be ruled out a priori
that an explicit credit subsidy (not interest ceilings) may be one component
of an integrated subsidy package.
The second policy objective of increasing farmer welfare can relate
to the entire agricultural sector, or to sub-sets of farmers, usually the poor
and landless. An appropriate production subsidy package is one means of
increasing farmer welfare if accompanied by measures to market the output and
minimize any adverse impact on output prices. The other welfare question
relates to the distribution of gains between traditional lenders and farmer
borrowers. This has been addressed earlier.
Returning to the question of credit market efficiency, there are two
opposing views on the matter. One view is that if agricultural productivity
- 82 -
increases due to introduction of HYVs enough credit will be generated to meet
demand. In other words the existing level of technology and non-credit
related constraints-risk, availability of water, technical knowledge etc., are
significantly more important factors. The other view is that rural credit
markets are very fragmented, and excess funds do not flow smoothly from
surplus to deficit areas. This causes inefficiencies in credit markets.
5.2 Expected Marginal Product of Loans
In an earlier paper I have given a method for measuring the degree
of inefficiency, if any, in the market. I have also shown that if there is
any inefficiency in rural markets it is probably not due to the physical
problem of moving funds. Any inefficiencies arise due to informational
problems which constrain traditional lenders, and new potential lenders, from
providing credit in unfamiliar areas and to unfamiliar borrowers. I have
shown that if the credit market is functioning efficiently, the expected
marginal product of loans must be equal to the opportunity cost of loans. The
latter is the marginal cost of raising deposits plus the marginal cost of
transferring them to borrowers (marginal administrative costs). The average
cost of funds in 1979-80 was 4.3% of deposits (Table 17). The rural
administrative cost, for commercial banks have ranged around 10.6% of deposits
(from a sample of Sonali branches, 2 x 5.3). This yields an approximate
average cost of 15%. Though administrative costs for the agricultural banks
may be lower, a figure of 15% can be used for illustrative purposes.
To obtain the marginal product of loans, we use the fact that
fertilizer input and the output resulting from it are separated by the
produttion period for crops. Consider a simple case in which fertilizer input
is separated from agricultural output by T months. Use of fertilizer
therefore requires use of own funds or credit to purchase fertilizer. Any
Table 25: Marginal Product of Loans in Agriculture
Marginal Product Price Fertilizer 1 2 Time Period Annualizedof Fertilizer at (Adjusted) Price p 3 1 of Production Rate or ReturnAug. level of use (TK/md) A 3 (months) 5 x 12/T
Source: IFDC/BARC, Agricultural Production, Fertilizer Use and EquityConsiderations, Results and Analysis of Form Survey Data, 1979/80,Bangladesh 1981.
- 84 -
credit taken is then repaid T periods later. It is easy to show that the T
month rate of return on loans is (p. MPF/pF - 1) where p is the output price,
PF the fertilizer price and MPF the marginal product of fertilizer. If
fertilizer is not used efficiently because of rationing, the marginal product
of loans will be less than this amount.
Table 25 presents estimates for the marginal product of loans using
estimates of the marginal products of fertilizer at average levels of usage.
A reasonable assumption might be to assume that fertilizer usage is efficient
in HYV crops, but may not be so in traditional. The second thing, to keep in
mind is that high rates of return for short periods do not necessarily
translate into the high rates suggested by simple annualization. This is
because the opportunities available for the rest of the periods may be quite
restricted due to market inefficiencies. The estimated annualized rate of
return on loans for HYV crops varies from 6% for 1980 Broadcast Aus to 155%
for 1979 Transplant Aman, with 1979 Boro in the middle with 110%. Given a
cost of funds of 15% a rate of return of 6% would suggest an excessive use of
fertilizer which is very unlikely at average levels of fertilizer usage. Some
upward adjustment may also be required for the fact that 1979 and 1980 were
bad crop years and what we need is an average of the marginal product over
several years. As most HYV are grown in irrigated areas, fluctuations in
their output is much less (flooding, can still be a problem). A 9 percentage
point difference is hard to explain on this basis given the high returns from
other crops in the same period.
A possible explanation for the 1980 Aus and 1979 Boro is under use
of fertilizer due to shortages and rationing. In such a situation the
calculated rates provide an upper limit, and actual returns on loans would be
less. However there is no evidence to suggest that there was a shortage
- 85 -
during this period. Sample testing done by BADC indicates that free market
prices were not significantly diffierent from controlled prices.
The rates of return calculated from traditional varieties show
somewhat less variation ranging from 102% through 195% to 365%. Such high
rates are somewhat unbelievable, particularly in bad agricultural years. The
caution about annualizing rates is of course very relevant here, but even the
unadjusted returns range from 64% t:o 146%. The tentative hypothesis about
more efficient use of fertilizer in HYVs than in traditional crops, is
supported by the 1979-80 Borro returns but contradicted by the 1979 Aman
returns.
If one could ignore the 6% return, the rest of the data become
fairly consistent, indicating a minimum expected marginal product of loans of
100%. This suggests enormous inefficiency in the agricultural credit market.
We cannot just ignore the anomalous observation, however, and any judgment of
credit market inefficiency mtust be tempered by caution.
5.3 Targets and Disbursements: Differential Performance
Almost the entire gamut of policy instruments has been applied to
agricultural credits. This includes targets, refinance, guarantees, branch
licensing and special programs. In addition interest rate policies, margin
requirements and credit ceilings also impinge on agricultural credit. Among
the earliest to be used was the target guideline approach. Table 26 presents
the targets, disbursements and achievements of BKB, BSBL and the NCBs for the
1975-81 period.
In 1975-76 the target for total disbursements was TK 49.56 crore
while achievement was at TK 48.29 crore or 97% of the target. By 1980-81 the
targeted disbursements had more than tripled to TK 3438.31 crore while
disbursement had increased only to TK 279.6 crore showing a performance of
* Not availableBKB: Bangladesh Krishi BankBJSB/BSBL Bangladesh Jatigo Sumabaya Bank/Bangladesh Samabaya Bank Limited.Source: Annual Reports of the Bangladesh Bank
- 87 -
80%, the lowest level since 1976-77. Just as targets were designed to provide
an impetus to disbursement the actual disbursement performance influences the
setting of targets. Nevertheless the disbursement performance has varied
considerably over time and between the banks.
Both BKB and BSBL showed improved performance in terms of targeted
disbursement over the period 1976-77 to 1979-80, but then performance
plummeted quite sharply in 1980-81 (Table 26). In contrast the commercial
banks' performance shows a deteriorating trend over the period, going from 77%
in 1976-77 to 53% in 1980-81. BKB performed the best in terms of targets,
with a peak of 115% in 1979-80, and with 103% even in 1980-81. After the
early period BSBL's performance and has remained between these two in terms of
targets.
Total disbursements rose at a rate of 44% a year between 1976-77 to
1980-81, from TK 64.95% crore to TK 279.6 crore. However much of this growth
was due to expansion in lending by BKB which rose from TK 31.68 to TK 185.32
crore an overall compound rate of growth of 56% a year. The growth rate for
the commercial banks was 33% a year, and for BSBL only 23% a year. This
contrasts with the relative posiltion of the last two when compared on a
target-achievement basis. It also suggests that the government and the
Central Bank, perhaps, expected tWoo much from the commercial banks. The 33%
growth rate includes Sonali Bank lending to the IRDP co-operative system, in
which the former acts merely as a conduit. The commercial banks' performance
viz a viz direct lending to fina:L borrowers may not match this growth.
The BKB's performance sieems by and large to have matched
expectations. Thus for example the rise in targets from TK 65.88 crore in
1978-79 to TK 103.0 crore in 1979-80, was accompanied by a rise in
disbursement performance from 89% to 115% of target (A 102% growth of
- 88 -
disbursement). As a consequence BKB's share of total disbursements has risen
from 49% in 1976-77 to 66% in 1980-81. A major policy instrument affecting
this performance has been the refinance policy coupled with specialization.
Refinance policy was analyzed earlier. Being a specialized agricultural bank
BKB is excluded from non-agricultural lending, though trade, storage and
processing activities, particularly in rural areas, come within its purview.
In addition specialization has yielded information economies which resulted in
better performance. This is independently indicated by its recovery
performance which will be analysed below. An additional factor in past growth
performance is that the BKB has not been formally subject to credit ceilings
on agricultural lending (nor has the BSBL).
5.4 The Special Agricultural Program and Commercial Bank Performance
Table 27 gives the targets and disbursements under the Special
Agricultural Credit Program (SACP/TK 100 crore program). Disbursements
increased from TK 60.78 crore during 1977 (calender year) to TK 72.68 crore in
1980-81 (financial year), a total growth of only 20%. Achievements as a
proportion of targets were equally disappointing, declining progressively from
61% in the 1977 program to 36% in 1980-81 program (Table 27). For the first
two years the program was on a calendar year basis, so that the data is not
directly comparable to that in Table 26. If we take an average of the total
disbursement for 1976-77 and 1977-78 from this table, however, we obtain an
approximate figure of TK 77.92 crore for calender year 1977. Of this,
disbursement under SACP 1977 which started only in February was TK 60.78 crore
or 78% of the total. This gives some idea of the (initially) ambitious scope
of the program and the pressure put on commercial banks to increase
agricultural lending.
- 89 -
Table 27: Special Agricultural Program (SACP/100 crore)(In 1000 Taka)
SACP Program of: 1977 1978 1979 1979-80 1980-81
Total Under SACPTARGET 10000 10000 5715 10000 20000DISBURSEMENT 6078 5347 2370 4127 7268
The push didn't last long however, as by the next year, SACP
disbursements at TK 53.47 crore were only 49% of total (again taking 1977-78
and 1978-79 average for total disbursement). By 1980-81 SACP disbursements
were only 26% of total disbursements.
As one of the major purposes of the SACP was to bring NCBs into
agricultural lending, we would expect its greatest impact on their
agricultural lending. The data on the outstanding loans of Sonali Bank and
Agrani Bank (Table 27) is consistent with this. Though the figure for
outstandings includes overdues, the SACP outstandings for December 1977 will
include no overdues while those for the normal program do. Leaving aside IRDP
lending by Sonali, both banks had a major proportion of their disbursements
channeled through the SACP (Table 27). This clearly remains true for the
Agrani Banks until 1980-81; but less so for Sonali Bank, if allowance is made
for the possibility of higher overdues under SACP than under the normal
program. The major increase in the rate of growth of commercial banks
disbursements (Table 26), from 6% in 1976-77 to 67% in 1977-78 can be largely
attributed to the SACP program.
The rate of growth of loan disbursements by NCBs slackened somewhat
to 39% in 1978-79 and then plummeted to 9% in 1979-80. We have already shown
that disbursements by all banks under SACP as a proportion of total
disbursements also declined in absolute terms. Therefore part of the still
fairly high growth rate of 39% in NCB loan disbursements must be due to
increased lending under the normal program. This is suggested by the
gathering momentum of the rural branch expansion program. The ratio of new
rural to new urban branches of NCB grew from 1.3 in 1976-7 to 2.5 in 1977-8
and to a peak of 4.9 in 1978-9 (Table 21). The banks' loan disbursements
under SACP continued to slacken, however, and reached 68% of first year (1977)
- 91 -
levels in 1979-80. The growth oil rural branches also registered lower rates
in 1978-79 and 1979-80 (Table 21), suggesting a slackening of the rural
program. Loan disbursements by 21CBs therefore increased only by 9% in 1979-
80. A major causative factor was the much more rigorous application of credit
ceilings on commercial banks in 1.979-80. Though these ceilings had been in
operation for sometime, and NCBs' agricultural lending fall within their
ambit, aggregate inflationary pressures and IMF related contacts led to
increasingly forceful application.
5.5 Introduction of Urban Organised Banks into Agricultural Lending
Throughout this experience or experiment of getting the NCBs into
agricultural lending there has been a feeling that the distribution of credit
has not been satisfactory. In particular it has been felt that tenants and
small farmers are not getting enough credit. These effects are predicted by
my earlier analysis (competitive monopoly, Virimani (1982)), and I will briefly
outline the implications of the amalysis.
Given the importance of information and knowledge in the operation
of credit markets, urban organized banks are specilized to operate in that
environment. Basically they have developed procedures for dealing with
organized and established firms. When these banks are forced into the rural-
agricultural environment they are confronted with a completely different
informational problem. They will therefore seek out and lend to agricultural
producers who bear the greatest similarity to urban clients. These are
usually the largest, most educatedl and most modern (in terms of irrigation and
HYV technology). This is the group which benefits most from the introduction
of Urban banks. The medium farmers would tend to get some benefit because of
the erosion of monopoly profits of traditional lenders (arising mainly from
informational problems). But they would continue to borrow from them. The
- 92 -
smallest farmers do not benefit at all because the banks have so little
knowledge or competence in dealing with them that they cannot even offer any
potential competition to traditional lenders.
5.6 Interest Ceilings and BKB Performance
Table 28 gives the distribution of BKB loans by land holding and by
size of loans. The proportion of loans going to borrowers having 12.5 acres
to 33 acres of land rose sharply from 5% in 1976-77 to 11% in 1977-78.
Similarly the proportion of loans of amount greater than TK 3000 increased
from 12% to 40% of all loans. There was a decrease in the interest ceilings
in May 1977, but this was not applicable to the BKB and BSBL which already had
lower applicable ceilings. In August 1977 margin requirements of 50% were
imposed on all merchandise. We have shown in the analysis on margin
requirements, that for traditional borrower/merchants there would be a
tendency for loan interest rates to rise and loan amounts to fall. Further
some traders would now not get any loans at all. This provides an opportunity
for large farmers who do not normally engage in trade or in speculative
stocking to do so. Only the largest farmers would tend to have enough own
fund to meet margin requirements. They would thus take larger loans using the
increased part for speculative stocking. This is consistent with the shift in
loans towards the largest land owners from 5% to 11% of total loans. However
there is an increase in loan proportion from 28% to 39% in the 2.5 acre to 7.5
acre group. This suggests that some of the medium size land owners with
surplus funds may also have engaged in speculation.
Different land owners would tend to have different amounts of liquid
funds available for providing margin money. Therefore we do not expect a
proportional shift in the loan amounts taken. Table 28 shows that the
- 93 -
Tables 28: Banfgladesh Krishi Bank Borrower Characteristics
I. Distribution of Loans According to Size of Holding (Excluding Tea, Cold StorageTobacco Marketing & Processing); II. According to Size of Loans; III. According toSecurity Type.
1976-77 1977-78 1978-79 1979-80 1980-81I. % of all loans for year
Land holding of borrowers
Landless and upto 2.5 acres 54.70 39.13 42.74 35.72 32.082.5 to 7.5 acres 27.58 34.19 30.26 26.05 31.337.5 to 12.5 acres 13.10 15.37 13.80 25.36 16.5112.5 to 33 acres 4.62 11.31 13.20 12.87 20.08Total 100 100 100
Cumulative %
< 2.5 54.70 39.13 42.74 35.72 32.082.5 to 7.5 82.28 73.32 73.00 61.77 63.417.5 to 12.5 95.38 88.69 86.80 87.13 79.9212.5 to 33 1001 100 100 100 100
greatest shift was in the TK 3000 to less than TK 10,000 category, from 4% of
total loans to 24%.
In October 1980 the structure of interest ceilings was changed so
that agriculture was subject to a ceiling of 12%. The general ceiling,
applicable to storage, transport, trade, etc. was much higher at 15.5%. In
the section on interest ceilings it was shown that there would be a tendency
to shift out of agricultural lending into general lending (here it could be
agriculture related). It was shown earlier that BKB's disbursement
performance both in terms of growth rates and in terms of achievement of
targets rose progressively from 1976-77 to 1979-80. This trend was sharply
reversed in 1980-81; The growth rate declined from 103% to 58%, while
performance as percentage of target declined from 115% of target to 103% of
target (Table 26). This was accomplished by a shift of the loan distribution
away from the smallest loans of TK 1000 and less, to those of between TK
1000 and TK 10,000. The former declined from 25% of total in 1979-80 to only
8% in 1980-81, while the later increased from 33% to 47%.
5.7 Recovery performance
Many different measures of recovery performance have been used.
When it is not possible to separate out loans by maturity and by initial
starting time of loan, the best measure is the following: A ratio of the
total repayment during the year to the value of loans plus interest falling
due during that year. Another possible measure is the ratio of the repayment
of principal to the principal due during the year. The latter measure may be
useful when comparing different institutions and programs, with different
mandated interest ceilings or other restrictions. This runs into an
accounting problem, however. Banks which compound interest, transfer all
overdue interest to the principle account, in effect converting it to an
- 95 -
overdue loan. The problem of recovery performance varying merely because of
differences in rates of interest charged, may not be solved.
Another problem with both these measures, when used in a comparative
analysis, is that recovery performance can differ merely because of different
rates of growth of disbursement. ]Non repayment at the due date does not mean
that no further repayments will be made in future years. In fact repayments
are often stretched out over several years. For example, many banks in
Bangladesh are still receiving repayments on loans made in pre-liberation
times. For this reason banks with faster growth in disbursements would tend
to show poorer recovery performance.
A unique set of data is available for Bangladesh which allows us to
look at the pattern of loan repayment for a given loan. This relates to the
SACP/100 crore program, which was started in 1977. In this program all loans
had approximately the same term. Accounts were kept separately for each
years' program. These were initially on a calender year basis, but in 1979
were switched to a financial year basis, with the intervening program lasting
only 6 months. Data on accumulated recovery of principle is available for
each bank and each program at four points of time. A recovery profile can
therefore be constructed given total disbursements under each program for all
banks. A linear regression of accumulated recovery on time from
effective/average due date is used for this purpose. The results for the six
nationalized commercial banks and BKB are presented in Figures 1, 2 and 3.
The results by program are presented in Figure 4.
From Figure 1 it is clear that the recovery profile of the
Bangladesh Krisi Bank (BKB) lies entirely above that of others. This
superiority is more noteworthy given that the BKB's recovery performance under
the SACP is known (even to it) to be inferior to its recovery performance
Figure 1: Recovery Profiles by Banks for the Special Agricultural Credit Program
SONFLL
----------- MRAWRsN*JRNSRT
-. - JAnaT- RUPVLt
*---* PU-MLI
1 40.0- - 140. 0
120.0- 120.0
100.0 1 100.0
80.0 - 80.0
60.0- 60.0
40.0- - 40.0
20. 0 - / - 20. 0
0.0 20.00.0 10.0 20.0 30.0 40.0 50.0
Figure 2: Recovery Profiles: BKB, Sonali, Agrani and Janata Banks
--------
120.0- - 120.0
1 00/ a 10 e.o
60.0- va0,0
40.0 -u40.0
20.20.0 Io.o 10.0 20.0 30.0 40.0 50.
Figure 3: Recovery Profiles: Janata, Uttarg. Rupali and Pubali Banks
1_ _ __ _ _ __0_ __ _ __ _ _ __ _ _ - 2 .
UJJ.I .I 0.0
80.0 .- 80.0
60.0 ,' 60.0 0
°I~~~t-
40.0 . ' 40.0
20.0 - / -0.0
0.0 I -0.00.0 10.0 20.0 30.0 40.0 50.0
- 99 -
under normal programs. From Figures 1 and 2 we can also conclude that Sonali
bank's performance is quite close to that of BKB. It thus comes in the second
position even though initial recovery is lower than for Uttara and Agrani
banks. Given the differences in the intercept terms and slopes it is more
difficult to rank the others. Broadly speaking however, figures 1 to 3 show
that the performance of the BKB, the Sonali bank and the Uttara bank is better
than that of the Janata, Rupali and Pubali banks, with Agrani bank in an
intermediate position. Among the commercial banks the better performance of
the Sonali Bank is probably due to its larger rural branch network at the
start of the program, and its involvement with the IRDP program. The BKB-s
better performance is clearly due to its deeper and longer involvement in
agricultural lending.
Figure 4 compares the recovery performance for the different
programs for all banks taken together. The 1977 and 1978 programs are treated
separately while the 1979 and 1979-80 program data are aggregated so as to
have enough data points. The performance under the 1978 program was
definitely worse than that of the L977 program. There have been wide-spread
complaints of politicisation of the program in terms of the choice of
recipients. If true, this provides an explanation of the deterioration;
political pressures would take time! to build up and take effect. The 1979 and
1979-80 programs show significant improvement over the 1978 program. Their
performance relative to the 1977 pxogram is more difficult to evaluate:
initially lower recovery is made up in subsequent periods because of the
higher marginal recovery rate. At the end of 1979-80 banks were given
permission, independently and directly to select borrowers for the 1980-81
program. This depoliticisation affects the most recent programs more
strongly, but would also effect recovery from older programs. This is a
Figure 4: Recovery Profiler by SACP Programs
...... -------- PRO678
120.0-- 120.0
100.0 _ 100.0
80.0 80.0
40.0 40.0
20.0- - 20.00.0 10.0 20.0 30.0 40.0 50.0
- 101 -
possible explanation for the upward movement in recovery rates for the 1979
and 1979-80 programs.
Another explanation for the improvement in the 1979-80 program is
the introduction of penalty rates in February 1979. Banks were allowed under
this scheme to charge a penalty rate of 1% a month up to a maximum of 20%.
Given the normal interest of 12%, this permitted a rise in the interest rate
on overdue loans by as much as 8%. As all the banks considered, compound
interest, penalty interest rates would tend to raise the average interest
payable, in proportion to the delay in repayment. This would tend to increase
the slope of the recovery profile line for the 1979 and subsequent programs.
The application of penalty rates has however been quite variable, largely
because of lack of clarity about its applicability to SACP and other
agricultural lending. Only Sonali bank is known to apply the full penalty.
The BKB uses a maximum penalty of 2.5%, while Agrani bank uses a penalty of
only 1% for rural loans.
5.8 Bad Debts versus Liquidity Problems
The existence of such a recovery time profile suggests that bad
debts may not be a serious problem in agricultural lending. This is in fact
what most bankers involved in agricultural lending in Bangladesh believe. It
would be wrong to conclude, as some dlo, that there is no problem of bad debts
,,r non-repayment risk; this aspect is not captured well by the indices used
above. The analysis shows, however, that even with the best performance,
recovery of loans may normally be stretched over as much as three years.
I1lerefore liquidity may become a ser3Lous problem, particularly for
1antitutions which depend on refinancing of loans (or total loans minus
wverdues) such as BKB, BSBL and the lRDP system.
- 102 -
In the discussion about the liquidity guarantee it was noted that
BSBL has always used this facility, while BKB has never used it. The previous
section's analysis suggests that this may at least partly be due to the
latter's superior recovery performance (BSBL is not involved in the SACP).
Nevertheless, given the rapid growth of BKB lending in the past five years
liquidity could become a serious problem in future. In addition the
significantly lower rates of interest will no longer be a problem because BKB
can now charge penalty rates on overdues. Therefore the BKB's policy on use
of penalty rates may have to be reviewed to allow full use of permisable
penalty rates.
- 103 -
Footnotes
1/ Resume of Financial Institutions, Ministry of Finance, Government of
Bangladesh 1973 and 1975.
2/ See Introduction and Section 4.5 of Virmani (1982).
R_ferences
1. Virmani, Arvind, The Nature of Credit Markets in Developing Countries: A
Framework for Policy Analysis,World Bank Staff Working Paper No.
524, 1982.
World Bank An Analysis of Developing NEWCountry Adjustment
Publicationis Experiences in the 1970s: Low- Compounding and Discounting
of Related Income Asia Tables for Project AnalysisChristine Wallich (with a Guide to Their
Interest Staff Working Paper No. 487. 1981. 43 Applications)pages (including references). Second Edition, Revised aildStock No. WP 0487. S3. Expanded
Adjustment Experience and Aspects of Development Bank J. Price GittingerGrowth Prospects of the Senm- Management Project planners and analvsts will findIndustrial Countries William sDiMment . this book a convenient and time-sav-Frederick Jaspersen William Diamond and ing reference for the preparation andStFfederikin Pasperseno.47 913 Raghavan- analysis of development projects. Six-Staff Working Paper No. 477. 1981. 132 Deals exclusiveIv with the manage- decimal tables for 1 percent through 50pages (mcludtag 3 appendzxes). ment of development banks. The book percent show the compounding factorStock No. WP 0477. $5. is divided into eight sections, each for I and for I per annum, the sinking
dealing w,ith one aspect of manage- fund factor, the discount factor, theAdjustment in Low-Income ment of its problems, and of the var- present worth of an annuitv factor,Africa ious ways of dealing with them. and the capital recoverv factor. TheRobert Liebenthal EDI Series in Economic Development. The first edition of this book underwentStaff Working Paper No. 486. 1981. 62 Johns Hopkins University Press, 1982. seven printings in ten vears and waspages (including bibliography). 2nd printing, 1983. 311 pages. translated into Arabic, Chinese,Stock No. WP 0486. $3. LC 81-48174. ISBN 0-8018-2571-7, Stock French, and Spanish. This new edi-
No. H 271.$29.5 hrdcver;ISB 0- tion-with narrow-interval compound-Aggregate Demand and 8018-2572-5, Stock No. JH 2572, S12.95 tabes added frhier interestMacroeconomic Imbalances in paperback. rates, updated project examples, aThailand: Simulations with the Capital Accumulation in lators to perforu n the cocputar onsSIAM 1 Model Eastern and Southern Africa: A discussed, and an annotated bibliog-Wafik Grais Decade cf Setbacks raphv increases the proven usefulnessStaff Working Paper No. 448. 1981. 132 Ravi Gulhati and Gautam Datta of its predecessor, both in the class-pages (including 3 appendixes). Analyzes the magnitude of the setback room and at the project site.Stock No. WP 0448. $5. in capital accumulation in eastern and May 1984. About 208 pages.
southem Africa. This phenomenon is ISBN 0-8018-2409-5. Stock No. BK 2409.examined in twentv-eight statistical ta- $10.95.
NEW bles. The authors sample sixteen coun- Translations of this new edition will betries and rely on expert observations to available in 1985. Still available are theexplore the proximate causes of the following translations of the first editzon:
Alternative Mechanisms for setbacks. French: Tables d'interets composes et d'ac-Financing Social Security World Bank Staff Working Paper No. 562. tualistation. Economica, 4th printing,Parthasarathi Shome and Lyn 1983. 74 pages. 1979.Squire ISBN 0-8213-0169-1. Stock No. WP 0562. ISBN 2-7178-0205-3, Stock No. IB 0542,Reviews, clarifies, and evaluates theo- S3. $6.retical literature about the effect of so-cial securitv on capital accumulation Capital Market Imperfections Spanish: Tablas de interes compuesto y deand labor supply. Analyzes empirical and Economic Development descuento para evaluaci6n de proyectos.studies using U.S. data, the impact of Vinayak V. Bhatt and Alan R. Roe Editorial Tecnos, 1973; 4th printing, 1980.pay-as-you-go financed and fully Staff Working Paper No. 338. 1979. 87 ISBN 84-309-0716-5. Stock No. IB 0526.funded social security schemes, and zaages (including footnotes). S6.characteristics of optimal social secu- Stock No. WP 0338. $3.ritv svstems. This studv provides astarting point for evervone interestedin the relevance of existing theories for The Changing Nature of Export A Conceptual Approach to thefinancing social security in developing Finance and Its Implications Analysis of External Debt ofcountries. for Developing Countries the Developing CountriesStaff Working Paper No. 625. 2983. 62 Albert C. Cizauskas Robert Z. Aliberpages. Staff Working Paper No. 409. 1980. 43 Staff Working Paper No. 421. 1980. 25ISBN 0-8213-0292-2.Stock No. WP 0625. pages (including 3 annexes). pages (including appendix, references).$3. Stock No. Wr 0409. 53. Stock No. WP 0421. $3.
- NEW Staff Working Paper No. 632. 1984. 144 Growth and Structuralpages. Adjustment in East Asia
Development Finance Stock No. WP 0632. $5. Parvez HasanC.ompanies, State and Privately Staff Working Paper No. 529. 1982. 42C)wned: A Review NEW pages.David L. Gordon ISBN 0-8213-0102-0. Stock No. WP 0529.An informative guide to the function Economic Liberalization and $3.and design of development finance Stabilization Policies in Interest Rate Management incompanies as they are set up in devel- Argentina, Chile, and Developing Countries: Theoryoping countries. Case histories high- Uruguay: Applications of the and Simulation Results forlight the differences among these com- Monetary Approach to the adSmlto eut opanies-their institutional structure, Blnetof paymets South Koreamanagement stvle, financial perfor- Balance of Payments Sweder van Wijnbergenmance, and other features. Looks at Edited by Nicolas Ardto Barletta,ee gethe problems of resource mobilization Mario I. Blejer, and Luis Landau deposit rates raise output and lowerand strategies to overcome them. Twenty-eight leading intemational inflation in the short run, and increaseStaff Working Paper No. 578. 1983. 84 economists and regional specialists re- growth through their favorable impactpages. view the salient characteristics of the on savings rates. It concludes that thisISBN 0-8223-0226>4. Stock No. WP 0578. monetary approach to the balance of theory depends heavilv on the as-S3. pavments, examine the vanations in sumption that portfolio shifts into timeits application, and evaluate its suc- deposits come out of unproductive as-Development Prospects of cesses and failures. Emphasizes the sets, providing less intermediationCapital Surplus Oil-Exporting empirical evidence and dvnamic as- than the banking svstem. Impact ofCountries: Iraq, Kuwait, Libya, pects and costs. Provides an important changes in time deposit rates on infla-Catriesa Arabia, U ibAEr examination of economic policies and tion, capital, capital accumulation andQzatar, Saudi Arabia, UAE their effects in a region that looms medium term growth are discussed,Rudolf Habliitzel large in current deliberations about in- and empirical relevance is demon-Staff Working Paper No. 483. 1981. 53 ternational indebtedness and finance. strated through simulation runs with apages (including statistzcal tables). June 1984. About 240 pages. macroeconomic model of South Korea.Stock No. WP 0483. S3. ISBN 0-8213-0305-8. 517.50 paperback. World Bank Staff Working Paper No. 593.
Developments in and Prospects Energy Prices, Substitution, ISBN 0-8213-0288-8. Stock No. WP 0593.for the External Debt of the and Optimal Borrowing in the $3Developing Countries: 1970-80 Short Run: An Analysis ofand Beyond Adjustment in Oil-Importing International Adjustment inNicholas C. Hope Developing Countries the 1980sStaff Working Paper No. 488. 1981. 70 Ricardo Martn and Marcelo Vijay Joshipages (including 2 annexes, references). Selowsky Staff Working Paper No. 485. 1982. 57Stock No. WP 0488. S3. Staff Working Paper No. 466. 1981. 77 pages.
Domestic Resource under Generalized Currency Links between Taxes andMobilization in Pakistan: Floating: Comparative Analysis Economic Growth: SomeSelected Issues among Developing Countries Empirical EvidenceNizar Jetha, Shamshad Akhtar, Romeo M. Bautistaand M. Govinda Rao Staff Working Paper No. 436. 1980. 99 Keith MarsdenFouses on the relationship between pages (including appendix). Reviews the experience with growthtaxation and the three main compo- Stock No. WP 0436. S3. and taxation in twentv developing andnents of savings. Emphasizes tax re- developed countries, spanning a wideformn with a view to raising additional A General Equilibrium spectrum of incomes. Do countriesrevenues and encouraging household Analysis of Foreign Exchange with lower taxes experience moreand business savings. Proposals for tax Shortages in a Developing rapid expansion of investment, pro-reform take account of equityvconsid- Economy ductivity, employment, and govern-erations and the need to keep tax-in- Kemal Dervis, Jaime de Melo, and sheds new light on this and other kev
resources to a minimum. Highlights Sherman Robinson questions especiallv relevant to devel-appropriate policies on current ex- Staff Working Paper No. 443. 1981. 32 opment economists. It also examinespenditures, subsidies, user charges, pages (including references). the mechanisms bv which fiscal poli-public enterprise pricing, self-financing Stock No. WP 0443. 53. cies mav affect growth rates.of investment bv public enterprises. Staff Working Paper No. 605. 1983. 48Includes three annexes that examine pages.direct taxes, indirect taxes, and tax Prices subject to change without notice ISBN 0-8213-0215-9. Stock No. WP 0605.changes in Pakistan's 1983/84 budget. and may vary by country. $3.
NEW The Policy Experience of Private Bank Lending toTwelve Less Developed Developing Countries
Municipal Accounting for Countries, 1973-1978 Richard O'BrienDeveloping Countries Bela Balassa Staff Working Paper No. 482. 1981. 60David C. Jones Staff Working Paper No. 449. 1981. 36 pages (including appendix, bibliography).This manual is based on British prac- pages (inc,'uding appendix). Stock No. WP 0482. S3.tices and terminology of municipal ac- Stock No. WP 0449. P3.counting, modified to suit the needs of Private Capital Flows toother countries, especiallv those lack- The Political Structure of the Developing Countries anding a core of appropriately trained ac- New Protectionism Their Determinations:countants. Provides the basic princi- Doulas R. Nelson Historical Perspective, Recentples of municipal accounting tor those g * v acnwith little or no bookkeeping experi- Staff Working Paper No. 471. 1981. 57 Experience, and Futureence and proceeds through successive pages (including references). Prospectslevels of difficulty to some of the most Stock No. WP 0471. 53. Alex Flemingadvanced concepts currently in use, Staff Working Paper No. 484. 1981. 41including the pooling of loans. An im- pages.portant feature is the multitude ofpractical applications and examples of NEW Stock No. WP 0484. 53.forms and records. Private Direct ForeignA joint publication of the Chartered Price Distortions and Growth Investment in DevelopingInstitute of Public Finance and Ac- in Developing Countries Countriescountanc and the World Bank. Ramgopal Agarwala K. Billerbeck and Y. YasugiJune 1984. About 900 pages. Sixteen informative tables trace the Staff Working Paper No. 348. 1979, 101
ISBN 0-8213-0350-3. Stock No. BK 0350. distortion in Prices of foreign exchange pages (including 2 annexes).S30. and other factors affecting the growth Stock No. WP 0348. 55.
of developing countries. Based on sta-The Nature of Credit Markets tistics frorn thirtv-one developingin Developing Countries: A countnes. NEWFramework for Policy Analvsis Staff Working Paper No. 575. 1983. 78Arvind Virmani pages. Savings Mobilization throughStaff Working Paper No. 524. 1982. 204 ISBN 0-8213-0242-6. Stock No. WP 0575. Social Securitv: The Case ofpages. 53. Chile, 1916-1977ISBN 0-8213-0019-9. Stock No WP 0524. Christine Wallich
S5. Pricing "Policy for Development Describes the savings mobilization po-The Newly Industrializing Manage:ment tential in Chile and in five Asian pro-Developing Countries after the Gerald MI. Meier grams. Some sort of social securityOil Crisis Presupposing no formal training in program functions in almost all devel-economics, it explains the essential oping countries. Programs are oftenBela Balassa elements of a price svstem, the func- costly, whether measured in relationStaff Working Paper No. 437. 1980. 57 dons of prices, the various poiicies to GNP, government expenditure,pages (including appendix). that a government might pursue in government revenue, or the wage bill.Stock No. WP 0437. S3. cases of market failure, and the princi- This paper compares the successful
ples of public pricing of goods and systems.Notes on the Analysis of services provided by government en- Staff Working Paper No. 553. 1983. 109Capital Flows to Developing terprises. ;It also provides the would-be pages.Nations and the "Recycling" practitioner with an appreciation of the ISBN 0-8213-0123-3. Stock No. WP 0553.underlying logical structure of cost-Problem benefit project appraisal. To give sub-Ralph C. Bryant stance to the applied and policv di Short-Run Macro-EconomicStaff Working Paper No. 476. 1981. 67 mensions, manv of the readings are A P ipages. drawn from the experience of develop- Adjustment Polices m SouthStock No. WP 0476. S3. ment praclitioners and relate to such Korea: A Quantitative Analysis
important sectors as agriculture, in- Sweder van WijnbergenNotes on the Mechanics of dustrv, power, urban services, foreign Staff Working Paper No. 510. 1981. 182Growth and Debt trade, and emplovment. The principles pages (including 3 appendixes).Benjamin B. King outlined are therefore relevant to a ISBN 0-8213-0000-8. Stock No. WP 0510.A Practical model to explore the ay host of development problems.
in which cpai- The Johns Hopkins University Press. 1983.in which capital inflow from abroad af- 2772 pages (including bibliography and in-fects economic growth. dex).The Johns Hopkins University Press, 1968. LC 82-716. ISBN 0-8018-2803-1, Stock69 pages (including 4 annexes). No. TH 2803, 535 hardcover; ISBN 0-LC 68-8701. ISBN 0-8018-0338-1, Stock 8018-2804-X, Stock No. JH 2804, 512.95 Prices subject to change without noticeNo. IH 0338. 55 paverback. paperback. and may vary by country.
State Finances in IndiaA three-volume set of papers that ex-plores a range of issues relating to thenature of intergovernmental fiscal rela- Th p suc f Wtions in India. The pnmary source for World DebtTablesVol. 1: Revenue Sharing in India medium- and long-term E , ,' c .Christine WallichViol. rI: India-Studies in State Fi- extemal debt of mnanynalnces developing countries. =Christine WallichVol. III: The Measurement of Tax Ef- Suhas Ketkar, Asia-Pacificfcrt of State Governments, 1973-1976 Economist and Vice President,Raja J. Chelliah and Narain Sinha Marine Midland Bank, N.A.Staff Working Paper No. 523. 1982. vol.1, 85 pages, vol. 1I, 186 pages, vol. 11i, 85pages. ScOften the only reliableISB1N 0-8213-0013-X. vol. I, Stock No..ir WVP 1523, $3, vol. II, Stock No. WP source of information for2523, $5, vol. Ili, Stock no. WP 3523, S3. countries for which data
is hard to come by... Used quantitatively formacroeconomnic detail as well as qualitatively in
Structural Adjustment Policies reports discussing the debt picture. I find thein Developing Economies projected servicing payments a strong feature.09Bela BalassaBelaf WorkingsPaper No. 464. 1981. 36 Jonathan Kayes, InternationalStaff Working Paper No. 464. 1982. 36 Economist, RepublicPages. National Bank of New YorkStock No. WP 0464. 53.
Structural Aspects of Turkish World Debt Tables, 1983-84 EditionInflation: 1950-1979 The World Bank's invaluable reference Also available for the first timeM. Ataman Aksov guide to the external debt of develop- SStaff Working Paper No. 540. 1982. 118 ing countries. Essential planning tool ummary Reportpages. for economists, bankers, countrv risk Debt and the DevelopingISBN 0-8213-0098-9. Stock No. WP 0540. analysts, financial consultants and all World Current Trends55. thos~e interested in the global system Wol:CretTnd
of trade and pavments. Provides data and Prospectson the external debt of 103 developing Includes an overview and summary ta-
Thailand: An Analysis of countries augmented bv information, bles from the 1983-84 edition.Structural and Non-Structural where available, on major economic 1984. 64 pages.Adjustments aggregates plus indicators used to ana-Ame Drud, Wafik Grais, and lyze debt and creditworthiness. Shows Stock No. BK 0319, $6.50.IDusan Vujovic statistical tables by country, including Companion computerized datafigures for extemnal public debt out-Staff Working Paper No. 513. 1982. 93 standing, commitments, disburse- basepages (including appendix). ments, service payments, and net bor- Includes all debt information given in.'SBN 0-8213-0023-7. Stock No. WP 0513. rowings. Reports on private the unabridged volume, and, where'$3. nonguaranteed debt of 19 countries. available, offers continuous historical
Gives aggregate position of 13 major series for 1970-82 and projected debt-borrowers-countries with disbursed service payments for 1983-92. Write for
Trends in Rural Savings and and outstanding medium- and long- sample purchase agreement.Private Capital Formation in term total debt in excess of $13.5 bil- (9-track, phase-encoded, recordingIndia lion at the end of 1982. Includes peri- densitv 1600 bpi)Raj Krishna and G.S. odic supplements as fresh data are re- Stock No. IB 0500, $5,000 (service bur-Raychaudhuri eaus for reselling to their clients); StockWorld Bank Staff Working Paper No. 382. 1984. 328 pages. No. IB 0667, $2,000 (banks and commer-1980. 43 pages (including 2 tables, 3 ap- Stock No. BK 0315 $75 (annual subscrip- cial corporations); Stock No. IB 0666, $500pendixes, references). tion) (universities and libraries).
Stock No. WP 0382. $3.
E The World BankPublications Order Form
SEND TO: YOUR LOCAL DISTRIBUTOR OR TO WORLD BANK PUBLICATIONS(See the other side of this form.) P.O. BOX 37525
WASHINGTON, D.C. 20013 U.S.A.
Date
Name Ship to: {Enter if different from purchaser)
Title Name
Firm Title
Address Firm
City State Postal Code__ Address
Country Telephone ) City State_ Postal Code
Purchaser Reference No. _ Country Telephone
Check your method of payment.Enclosed is my W Check [3] International Money Order 3 Unesco Coupons D International Postal Coupon.Make payable to World Bank Publications for U. S. dollars unless you are ordering from your local distributor.
Charge my O VISA 7 MasterCard 7 American Express G Choice. (Credit cards accepted only for orders addressedto World Bank Publications.)
Credit Card Account Number Expiration Date Signature
OInvoice me and please reference my Purchase Order No.
Please ship me the items listed below.
Customer InternalStock Number Author/ Title Routing Code Quantity Unit Price Total Amount S
H _ =~~~~~~~~~~~~~~~~~~~~~~~~~~~~~~~~~~~~~~~~~~~~~~~~~~~~~~~~~~~~~~~~~ _____________
All prices subject to change. Prices may vary by country. Allow 6-8 weeks for delivery.
Subtotal Cost $
Thtal copies _ Air mail surcharge if desired ($2.00 each) $
Postage and handling for more than two complimentary items ($2.00 each) S
Total S
IBRD0053 Thank you for your order.
Distributors of World Attn: Mr. Giancarlo Bigazzi Attn: Mr. J.M. HernandezVia Lamarrnora A; Castello 37
Bank Publications 50121 Madrid
ARGENTINA Florence SRI LANKA AND THE MALDIVESCarlos Hirsch, SRL, JAPAN Lake House BookshopAttn: Ms. Monica Bustos Eastern Book Service Attn: Mr. Victor WalataraFlorida 165 4' piso Attn: Mr. Terumasa Hirano 41 Wad Ramanayake MawathaGaleria Guemes 37-3, Hongo 3-Chome, Bunkyo-ku 113 Colombo 2Buenos Aires 1307 Tokyo SWEDENAUSTRALIA, PAPUA NEW GUINEA, KENYA ABCE Fritzes Kungl, Hovbokhandel
FIJI, SOLOMON ISLANDS,Africa Book Services (E.A.) Ltd. Attn: Mr. Eide SegerbackFIJI, SOLOMON ISLANDS, Attn: Mr. M.B. Dar Regen 1g Ee2, Box 16356
VANUATU P.O. Box 45245 S-13 StockholmThe Australian Financial Review Nairobi SWITZERLANDInformation Service (AFRIS) KOREA, REPUBLIC OF Librairie PayotAttn: Mr. David Jamieson Pan Korea Book Corporation Attn: Mr. Henri de Perrot235-243 Jones Street Attn: Mr. Yoon-Sun Kim 6, rue GrenusBroadway P.O. Box 101, Kwanghwamun 1211 GenevaSydney, NSW 20001 Seoul TANZANIABELGIUM MALAYSIA Oxford Universitv PressPublications des Nations Unies University of Malaya Cooperative Attn: Mr. Anthony TheoboldAttn: Mr. Jean de Lannoy Bookshop Ltd. Maktaba Road, P.O. Box 5299av. du Roi 202 Attn: Mr. Mohammed Fahim Htj Dar es Salaam1060 Brussels Yacob THAILANDCANADA P.O. Box 1127, Jalan Pantai Baru Central Department Store, Head OfficeLe Diffuseur Kuala Lumpur Attn: Mrs. RatanaAttn: Mrs. Suzanne Vermette MEXICO 306 Silom RoadC.P. 85, Boucherville J4B 5E6 INFOTEC BangkokQuebec Attn: Mr. Jorge Cepeda Thailand Management Association
San Lorenzo 15311, Col. del Valle, Attn: Mrs. SunanLCiObrSeTArieAs Deleg. Benito Juarez 308 Silom RoadAttn: Mr. Hugo Chamberlain 031 Mexico, D.F. BangkokCalle 11-13, Av. Fernandez Guell MIDDLE EAST TUNISIASan Jose Middle East Marketing Research Societe Tunisienne de Diffusion
Bureau Attn: Mr. Slaheddine Ben HamidaDENMARK Attn: Mr. George Vassilou 5 Avenue de Carthage
Attn: Mr. Wilfried Roloff Makarios l Avenue TunisRosendems Alle 11 Nacosia TURKEYDK-1970 Copenhagen V. Cvprus Haset Kitapevi A.S.EGYPT, Arab Republic of (granch offices in Bahrain, Greece, Attn: Mr. Izzet IzerelAl Ahram Morocco, Kuwait, United Arab 469, Istiklal CaddesiAl Galaa Street Emirates. Jordan) Bevoglu-IstanbulCairo NETHERLANDS UNITED KINGDOM AND
MBE BV NORTHERN IRELANDFINLAND Attn: Mr. Gerhard van Bussell Microinfo Ltd.Akateeminen Kir;akauppa Noorderwal 38, Attn: Mr. Roy'SelwynAttn: Mr. Kari Litmanen 7241 BL Lochem Newman Lane, P.O. Box 3Keskuskatu 1, SF-00100 NORWAY Alton, Hampshire GU34 2PGHelsinki 10 Johan Grundt Tanum A.S. EnglandFRANCE Attn: Ms. Randi Mikkelborg UNITED STATESWorld Bank Publications P.O. Box 1177 Sentrum The World Bank Book Store66, avenue d'Ina Oslo 1 600 19th Street, N.W.75116 Paris PANAMA Washington, D.C. 20433GERMANY, Federal Republic of Ediciones Libreria Cultural Panamena (Postal address: P.O. Box 37525UNO-Verlag Attn: Mr. Luis Fernandez Fraguela R. Washington, D.C. 20013, U.S.A.)Attn: Mr. Joachim Krause Av. 7, Espana 16 Baker and Taylor CompanySimrockstrasse 23 Panama Zone 1 501 South Gladiola AvenueD-5300 Bonn I PHILIPPINES Momence, Illinois, 60954HONG KONG, MACAU National Book Store 380 Edison WayAsia 2000 Ltd. Attn: Mrs. Socorro C. Ramos Reno, Nevada, 89564Attn: Ms. Gretchen Wearing Smith 701 Rizal Avenue 50 Kirby Avenue6 Fl., 146 Prince Edward Road Manila Somerville, New Jersey, 08876Kowloon PORTUGAL Commerce, Georgia 30599INDIA Livraria PortugalUBS Publishers' Distributors Ltd. Rua Atonio Alves Martins 9730-E George Palmer H'ifhwayAttn: Mr. D.P. Veer 120Lanham, Maryland, 2076
New Delhi 110002 Lisbon Blackwell North America, Inc.(Branch offices in Bombav, Bangalore, SAUDI ARABIA 1001 Fries Mill RoadKanpur, Calcutta, and NMadras) Jarir Book Store Blackwood, New Jersey 08012INDONESIA Attn: Mr. Akram Al-Agil Sidnev Kramer BooksPt. Indira Limited' P.O. Box 3196 1722 P Street, N.W.Attn: Mr. Bambang Wahvudi Riyadh Washington, D.C. 20006)I, Dr. Sam Ratulanigi No~. 37 SINGAPORE, TAIWAN, BURMA United Nations BookshopJakarta Pusat Information Publications Private, Ltd. United Nations PlazaIRELAND Attn: Ms. Janet David New York, N.Y. 10017TDC Publishers 02-06 1st Floor, Pei-Fu Industrial VENEZUELAAttn: Mr. James Booth Building12 North Frederick Street 24 New Industrial Road Libreria del EsteDublin 1 Singapore Attn. Mr. Juan PericasAvda Francisco de Miranda, no. 52ITALY SPAIN Edificio Galipan, Aptdo. 60.337Licosa Commissionaria Sansoni SPA Mundi-Prensa Libros. S.A. Caracas 1060-A
The World Bank
Headquarters European Office Tokyo Office UI818 H Street, N.W. 66, avenue d'lena Kokusai BuildingWashington, D.C. 20433, U.S.A. 75116 ]'aris, France 1-1 Marunouchi 3-chome