Page 1
i
Final Report
Submitted by:
Dr. Georgios Karavalakis (Primary Investigator)
Jiacheng Yang
University of California
CE-CERT
Riverside, CA 92521
951-781-5799
951-781-5790 (fax)
Evaluation of Fuel Matrix Additive
Prepared for:
The Fuel Matrix, LLC
Tom Horst
513 W. Sunset Road
Henderson ▪ Nevada ▪ 89011
November 2015
Page 2
ii
Table of Contents
Table of Contents ii Executive Summary iii
1 Introduction 4 2 Experimental Procedures 4
Test Vehicle and Test Fuels 4 2.1
Test Cycles and Test Matrix 4 2.2
Emissions Testing and Measurements 5 2.3
3 Heavy-Duty Vehicle Chassis Dynamometer Testing Results 6 NOx Emissions Results 10 3.1
CO2 Emissions Results 12 3.2
CO Emissions Results 14 3.3
PM Emissions Results 16 3.4
THC Emissions Results 18 3.5
4 Summary 18
Appendix 20 Appendix A: Executive Order for Test Engine 20 Appendix B. Comprehensive Emission Results 22 Appendix C. Test Matrix 24
Appendix D. Fuel Properties Analysis Report 26
Page 3
iii
Executive Summary
Testing was conducted for a heavy-duty vehicle on CARB ULSD and two blends treated with
Fuel Matrix additive as part of an evaluation of gaseous and particulate emissions. The test
vehicle was fitted with a 2009 model year Cummins ISX engine and a diesel particulate filter
(DPF). Emissions and fuel economy measurements were made over the Heavy Heavy-Duty
Diesel Truck (HHDDT) Cruise High-Speed cycle using a heavy-duty chassis dynamometer. The
testing consisted of comparisons between the baseline CARB ULSD and the additized fuels.
Emphasis was given on carbon dioxide (CO2), carbon monoxide (CO), total hydrocarbons (THC),
oxides of nitrogen (NOx), and particulate matter (PM) emissions.
The results of this study are summarized below.
The use of Fuel Matrix additive resulted in important statistically significant NOx
reductions compared to the baseline CARB ULSD over the HHDDT Cruise High-Speed
cycle. The reductions in NOx emissions were on the order of 55.26% and 57.54%,
respectively, for the Fuel Matrix 1 (0.9 mL Fuel Matrix per gallon of CARB ULSD) and
Fuel Matrix 2 (0.80 mL Fuel Matrix per gallon of CARB ULSD) on a g/mile basis. The
reductions in NOx emissions on a g/bhp-hr basis were on the order of 58.12% and
59.61%, respectively, for the Fuel Matrix 1 and Fuel Matrix 2 compared to CARB
ULSD.
Overall, CO2 emissions showed reductions with the Fuel Matrix fuels compared to the
baseline CARB ULSD, with some reductions being statistically significant.
CO emissions showed decreases with the use of Fuel Matrix fuels compared to CARB
ULSD.
PM mass emissions for the baseline CARB ULSD and the Fuel Matrix fuels were found
to be at very low levels due to the presence of the DPF, with no statistically significant
differences between the test fuels.
Page 4
4
1 Introduction
Testing was conducted to evaluate the emissions performance of Fuel Matrix additive. The Fuel
Matrix additive was treated on a typical automotive CARB ultra-low sulfur diesel (ULSD) fuel
and subsequently tested on a truck with a 2009 Cummins ISX engine equipped with a diesel
particulate filter (DPF). The testing consisted of comparisons between the baseline operation
with CARB ULSD and operation with the additized Fuel Matrix fuel into CARB ULSD. This
included comparisons of emissions of carbon dioxide (CO2), carbon monoxide (CO), total
hydrocarbons (THC), oxides of nitrogen (NOx), and particular matter mass (PM) between the
baseline of the vehicle and the Fuel Matrix fuel additive for the same vehicle. The truck was
tested over hot-start tests using single, duplicate, and triplicate Heavy Heavy-Duty Diesel Truck
(HHDDT) Cruise Hi-Speed test cycle.
2 Experimental Procedures
Test Vehicle and Test Fuels 2.1
A 2010 heavy-duty truck with a 2009 Cummins engine was utilized for this program. This truck
was powered with a CARB ULSD and CARB ULSD, which treated with Fuel Matrix additive in
two different concentrations. A description of the test vehicle is provided in Table 2-1. The
emission control systems included direct diesel injection (DDI), exhaust gas recirculation (EGR),
engine control unit (ECM), oxidizing catalyst (OC), periodic trap oxidizer (PTOX) and a
turbocharger with a charge air cooler. The certification Executive Order for the engine tested are
provided in Appendix A.
Table 2-1. Engine and vehicle Specifications
The road load coefficients were calculated based on the frontal area of the vehicle and a factor
accounting for its general shape. The road load and associated coast down coefficients were
verified with chassis dynamometer coast downs prior to testing. The vehicle was tested at a test
weight of 65,000 lbs, which represents the averaged loaded weight of a Class 8 truck in the US.
The baseline CARB ULSD was a typical automotive California diesel fuel and procured from a
local fuel station. The CARB ULSD was treated with Fuel Matrix additive at 45 mL
concentration per 50 gallons of diesel fuel (Fuel Matrix 1). An additional test fuel was created
(Fuel Matrix 2), which contained 32 mL of Fuel Matrix additive per 40 gallons of diesel fuel.
Test Cycles and Test Matrix 2.2
Each fuel was tested using the Heavy Heavy-Duty Diesel Truck (HHDDT) Cruise Hi-Speed
driving cycle. Single, duplicate, and triplicate tests were conducted over the HHDDT Cruise Hi-
Speed cycle for all test fuels. The speed-time profile of the test cycle is shown in
Figure 2-1.
ManufacturerEngine
ModelEngine Family
Horse
powerDisplacement
Peak
Torque
Cummins ISX 435ST 9CEXH0912XAK435 HP @
1800 RPM14.9 L
1450/1650
FT-LB @
1200 RPM
Vehicle
Year
Empty
Weight
License
Plate #
2010 20,000 lbs WP64133
Mileage
International 3HSCUAPR0BN357675 467,027 miles
Engine
Model Year Engine Type
2009 Compression-ignition
VehicleManufacturer VIN number
Page 5
5
Figure 2-1. Description of a single HHDDT Cruise Hi-Speed Test Cycle
The following are basic parameters of a single HHDDT Cruise Hi-Speed cycle:
• Duration: 760 seconds / 12.67 minutes
• Distance: 10.55 miles
Each cycle was warmed up by 2 minutes of operation at 45 mph, so tests were conducted as ‘hot-
running’ tests. There was approximately a 20 minute soak period between tests for the
completion of the emissions measurements, instrument calibrations, and for PM filter changing.
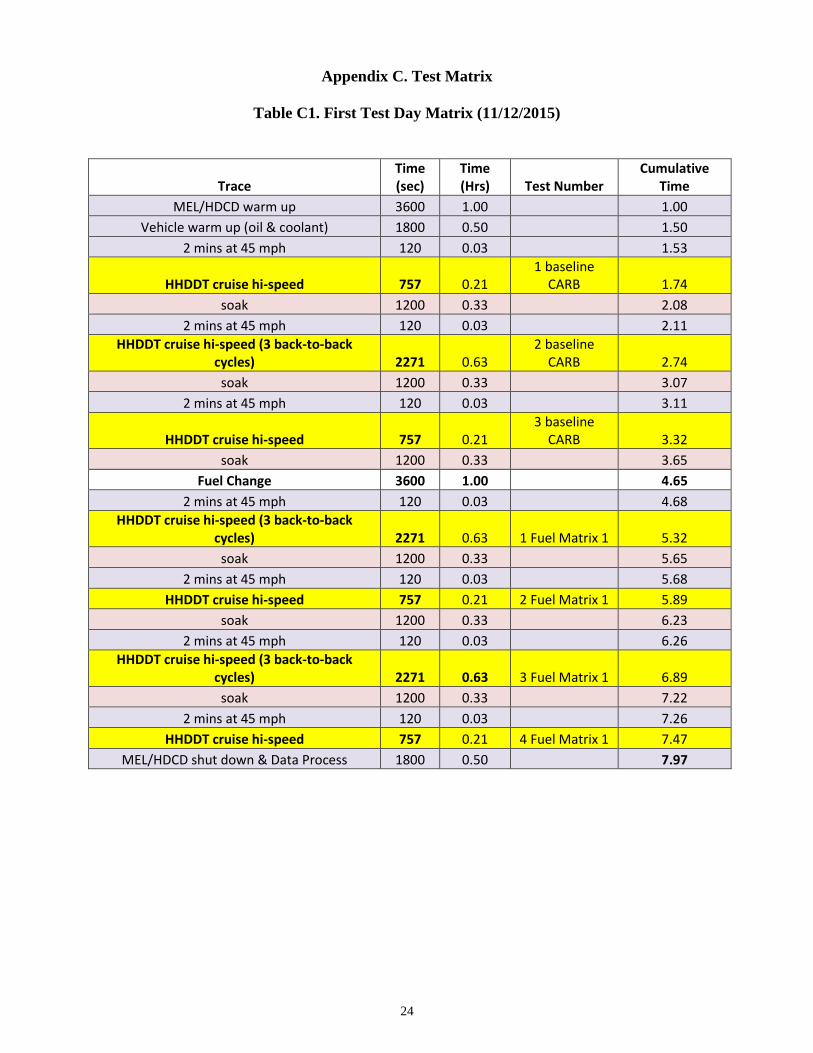
On the first day of testing, baseline CARB ULSD was conducted over two of single HHDDT
Cruise Hi-Speed and a triplicate HHDDT Cruise Hi-Speed test cycles. After a fuel change to
CARB fuel with Fuel Matrix 1, testing was conducted over two of the single HHDDT Cruise Hi-
Speed and two of the triplicate HHDDT Cruise Hi-Speed test cycles.
On the second day of testing, testing was started with two of the dual HHDDT Cruise Hi-Speed
test cycles with CARB ULSD with Fuel Matrix additive 2. After a fuel change, baseline CARB
ULSD was conducted over a dual HHDDT Cruise Hi-Speed test cycle.
In addition to the preconditioning before each test, the vehicle was also warmed up
approximately 30 minutes at the beginning of each test day to ensure that the vehicle would not
be in cold-start mode prior to any of the test sequences. The preconditioning cycles would warm
up both the vehicle and dynamometer to the testing conditions, thus reducing emissions
variability between tests.
A detailed test matrix for the two days of testing is provided in the Appendix B.
Page 6
6
Emissions Testing and Measurements 2.3
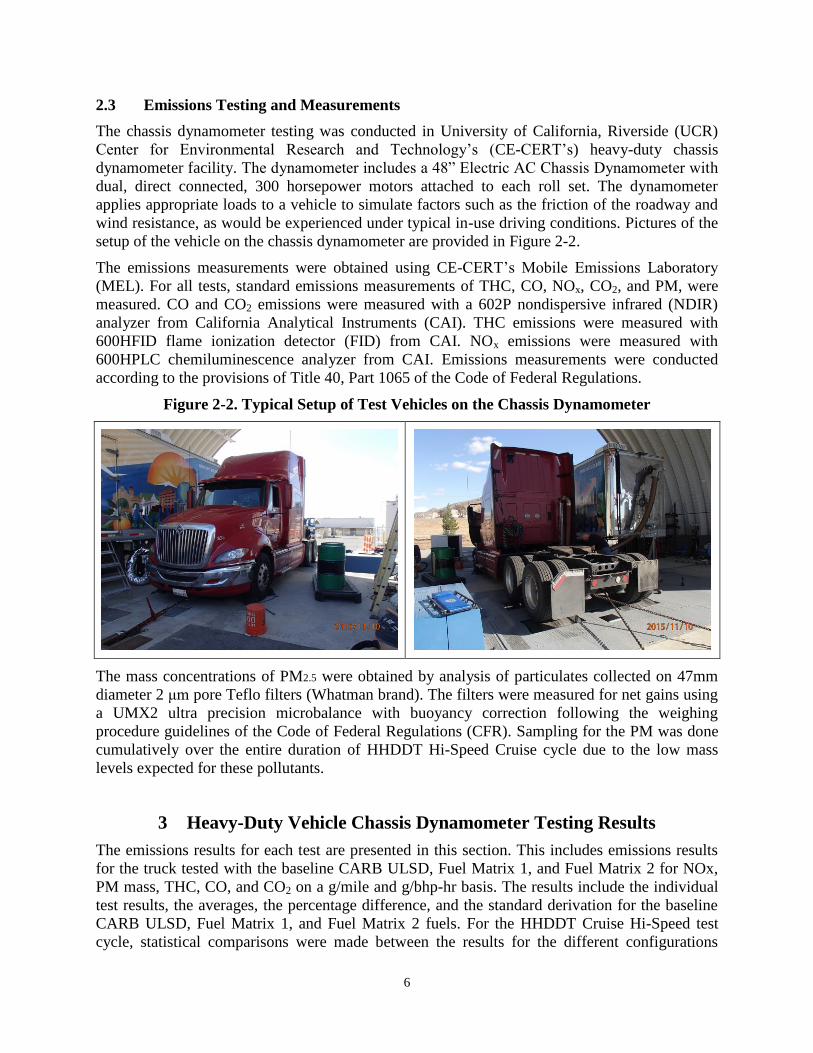
The chassis dynamometer testing was conducted in University of California, Riverside (UCR)
Center for Environmental Research and Technology’s (CE-CERT’s) heavy-duty chassis
dynamometer facility. The dynamometer includes a 48” Electric AC Chassis Dynamometer with
dual, direct connected, 300 horsepower motors attached to each roll set. The dynamometer
applies appropriate loads to a vehicle to simulate factors such as the friction of the roadway and
wind resistance, as would be experienced under typical in-use driving conditions. Pictures of the
setup of the vehicle on the chassis dynamometer are provided in Figure 2-2.
The emissions measurements were obtained using CE-CERT’s Mobile Emissions Laboratory
(MEL). For all tests, standard emissions measurements of THC, CO, NOx, CO2, and PM, were
measured. CO and CO2 emissions were measured with a 602P nondispersive infrared (NDIR)
analyzer from California Analytical Instruments (CAI). THC emissions were measured with
600HFID flame ionization detector (FID) from CAI. NOx emissions were measured with
600HPLC chemiluminescence analyzer from CAI. Emissions measurements were conducted
according to the provisions of Title 40, Part 1065 of the Code of Federal Regulations.
Figure 2-2. Typical Setup of Test Vehicles on the Chassis Dynamometer
The mass concentrations of PM2.5 were obtained by analysis of particulates collected on 47mm
diameter 2 μm pore Teflo filters (Whatman brand). The filters were measured for net gains using
a UMX2 ultra precision microbalance with buoyancy correction following the weighing
procedure guidelines of the Code of Federal Regulations (CFR). Sampling for the PM was done
cumulatively over the entire duration of HHDDT Hi-Speed Cruise cycle due to the low mass
levels expected for these pollutants.
3 Heavy-Duty Vehicle Chassis Dynamometer Testing Results
The emissions results for each test are presented in this section. This includes emissions results
for the truck tested with the baseline CARB ULSD, Fuel Matrix 1, and Fuel Matrix 2 for NOx,
PM mass, THC, CO, and CO2 on a g/mile and g/bhp-hr basis. The results include the individual
test results, the averages, the percentage difference, and the standard derivation for the baseline
CARB ULSD, Fuel Matrix 1, and Fuel Matrix 2 fuels. For the HHDDT Cruise Hi-Speed test
cycle, statistical comparisons were made between the results for the different configurations
Page 7
7
using a two-tailed, equal variance t-test, with the p-values for the t-test provided in the following
tables. Values are considered to be statistically significant for p < 0.1, which represents a 90%
confidence level. The statistically significant differences are shaded in the Tables 3-1 and 3-2.
The results for the HHDDT Cruise Hi-Speed test cycle are presented in g/mile and in g/bhp-hr in
Table 3-1 and Table 3-2, respectively. More details on the testing results are also included in
Appendix C.
Page 8
8
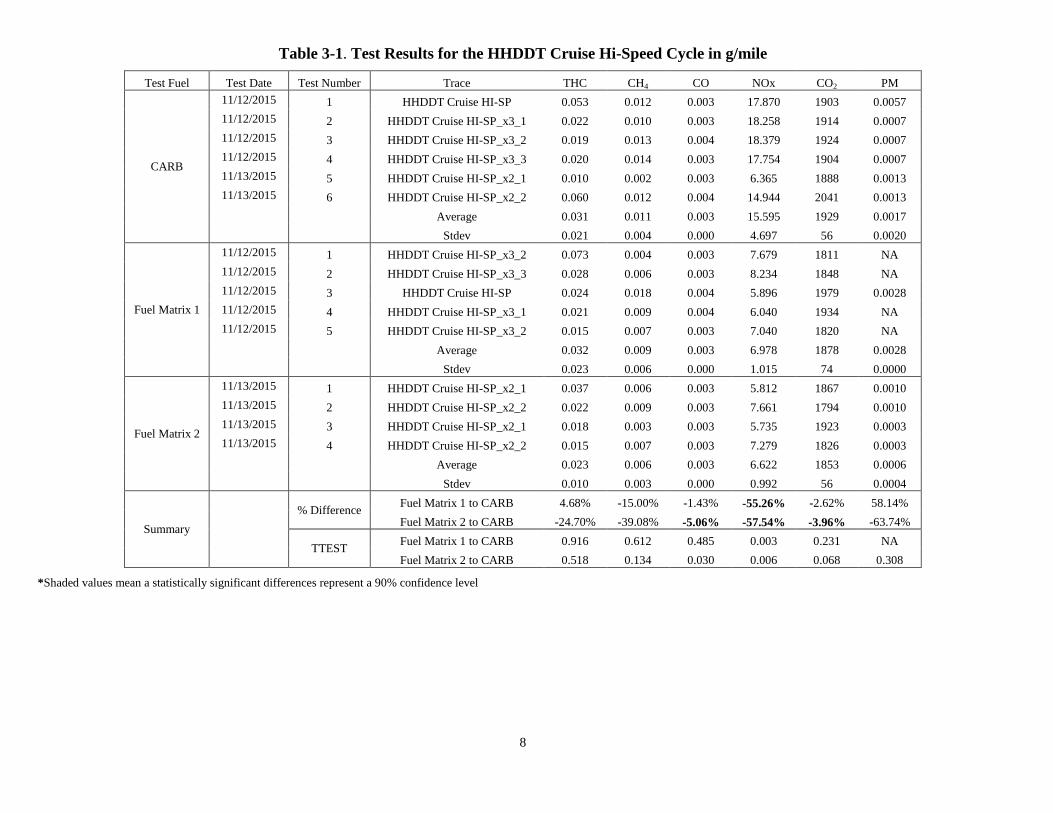
Table 3-1. Test Results for the HHDDT Cruise Hi-Speed Cycle in g/mile
Test Fuel Test Date Test Number Trace THC CH4 CO NOx CO2 PM
CARB
11/12/2015 1 HHDDT Cruise HI-SP 0.053 0.012 0.003 17.870 1903 0.0057
11/12/2015 2 HHDDT Cruise HI-SP_x3_1 0.022 0.010 0.003 18.258 1914 0.0007
11/12/2015 3 HHDDT Cruise HI-SP_x3_2 0.019 0.013 0.004 18.379 1924 0.0007
11/12/2015 4 HHDDT Cruise HI-SP_x3_3 0.020 0.014 0.003 17.754 1904 0.0007
11/13/2015 5 HHDDT Cruise HI-SP_x2_1 0.010 0.002 0.003 6.365 1888 0.0013
11/13/2015 6 HHDDT Cruise HI-SP_x2_2 0.060 0.012 0.004 14.944 2041 0.0013
Average 0.031 0.011 0.003 15.595 1929 0.0017
Stdev 0.021 0.004 0.000 4.697 56 0.0020
Fuel Matrix 1
11/12/2015 1 HHDDT Cruise HI-SP_x3_2 0.073 0.004 0.003 7.679 1811 NA
11/12/2015 2 HHDDT Cruise HI-SP_x3_3 0.028 0.006 0.003 8.234 1848 NA
11/12/2015 3 HHDDT Cruise HI-SP 0.024 0.018 0.004 5.896 1979 0.0028
11/12/2015 4 HHDDT Cruise HI-SP_x3_1 0.021 0.009 0.004 6.040 1934 NA
11/12/2015 5 HHDDT Cruise HI-SP_x3_2 0.015 0.007 0.003 7.040 1820 NA
Average 0.032 0.009 0.003 6.978 1878 0.0028
Stdev 0.023 0.006 0.000 1.015 74 0.0000
Fuel Matrix 2
11/13/2015 1 HHDDT Cruise HI-SP_x2_1 0.037 0.006 0.003 5.812 1867 0.0010
11/13/2015 2 HHDDT Cruise HI-SP_x2_2 0.022 0.009 0.003 7.661 1794 0.0010
11/13/2015 3 HHDDT Cruise HI-SP_x2_1 0.018 0.003 0.003 5.735 1923 0.0003
11/13/2015 4 HHDDT Cruise HI-SP_x2_2 0.015 0.007 0.003 7.279 1826 0.0003
Average 0.023 0.006 0.003 6.622 1853 0.0006
Stdev 0.010 0.003 0.000 0.992 56 0.0004
Summary
% Difference
Fuel Matrix 1 to CARB 4.68% -15.00% -1.43% -55.26% -2.62% 58.14%
Fuel Matrix 2 to CARB -24.70% -39.08% -5.06% -57.54% -3.96% -63.74%
TTEST
Fuel Matrix 1 to CARB 0.916 0.612 0.485 0.003 0.231 NA
Fuel Matrix 2 to CARB 0.518 0.134 0.030 0.006 0.068 0.308
*Shaded values mean a statistically significant differences represent a 90% confidence level
Page 9
9
Table 3-2. Test Results for the HHDDT Cruise Hi-Speed Cycle in g/bhp-hr
Test Fuel Test Date Test Number Trace THC CH4 CO NOx CO2 PM
CARB
11/12/2015 1 HHDDT Cruise HI-SP 0.020 0.005 0.001 6.694 713 0.0021
11/12/2015 2 HHDDT Cruise HI-SP_x3_1 0.008 0.004 0.001 6.805 713 0.0003
11/12/2015 3 HHDDT Cruise HI-SP_x3_2 0.007 0.005 0.001 6.650 696 0.0003
11/12/2015 4 HHDDT Cruise HI-SP_x3_3 0.007 0.005 0.001 6.490 696 0.0003
11/13/2015 5 HHDDT Cruise HI-SP_x2_1 0.004 0.001 0.001 2.270 673 0.0005
11/13/2015 6 HHDDT Cruise HI-SP_x2_2 0.022 0.004 0.001 5.415 740 0.0005
Average 0.011 0.004 0.001 5.721 705 0.0006
Stdev 0.008 0.002 0.000 1.765 22 0.0007
Fuel Matrix 1
11/12/2015 1 HHDDT Cruise HI-SP_x3_2 0.025 0.002 0.001 2.690 634 NA
11/12/2015 2 HHDDT Cruise HI-SP_x3_3 0.010 0.002 0.001 2.890 649 NA
11/12/2015 3 HHDDT Cruise HI-SP 0.008 0.006 0.001 1.913 642 0.0009
11/12/2015 4 HHDDT Cruise HI-SP_x3_1 0.007 0.003 0.001 2.018 646 NA
11/12/2015 5 HHDDT Cruise HI-SP_x3_2 0.005 0.003 0.001 2.470 638 NA
Average 0.011 0.003 0.001 2.396 642 0.0009
Stdev 0.008 0.002 0.000 0.422 6 0.0000
Fuel Matrix 2
11/13/2015 1 HHDDT Cruise HI-SP_x2_1 0.013 0.002 0.001 1.997 641 0.0003
11/13/2015 2 HHDDT Cruise HI-SP_x2_2 0.008 0.003 0.001 2.767 648 0.0003
11/13/2015 3 HHDDT Cruise HI-SP_x2_1 0.006 0.001 0.001 1.928 647 0.0001
11/13/2015 4 HHDDT Cruise HI-SP_x2_2 0.005 0.002 0.001 2.549 639 0.0001
Average 0.008 0.002 0.001 2.310 644 0.0002
Stdev 0.003 0.001 0.000 0.412 4 0.0001
Summary
% Difference
Fuel Matrix 1 to CARB -1.78% -22.02% -7.86% -58.12% -8.97% 38.88%
Fuel Matrix 2 to CARB -28.73% -41.70% -9.75% -59.61% -8.69% -65.64%
TTEST
Fuel Matrix 1 to CARB 0.967 0.424 0.001 0.003 0.000 NA
Fuel Matrix 2 to CARB 0.452 0.114 0.000 0.006 0.001 0.302
*Shaded values mean a statistically significant differences represent a 90% confidence level
Page 10
10
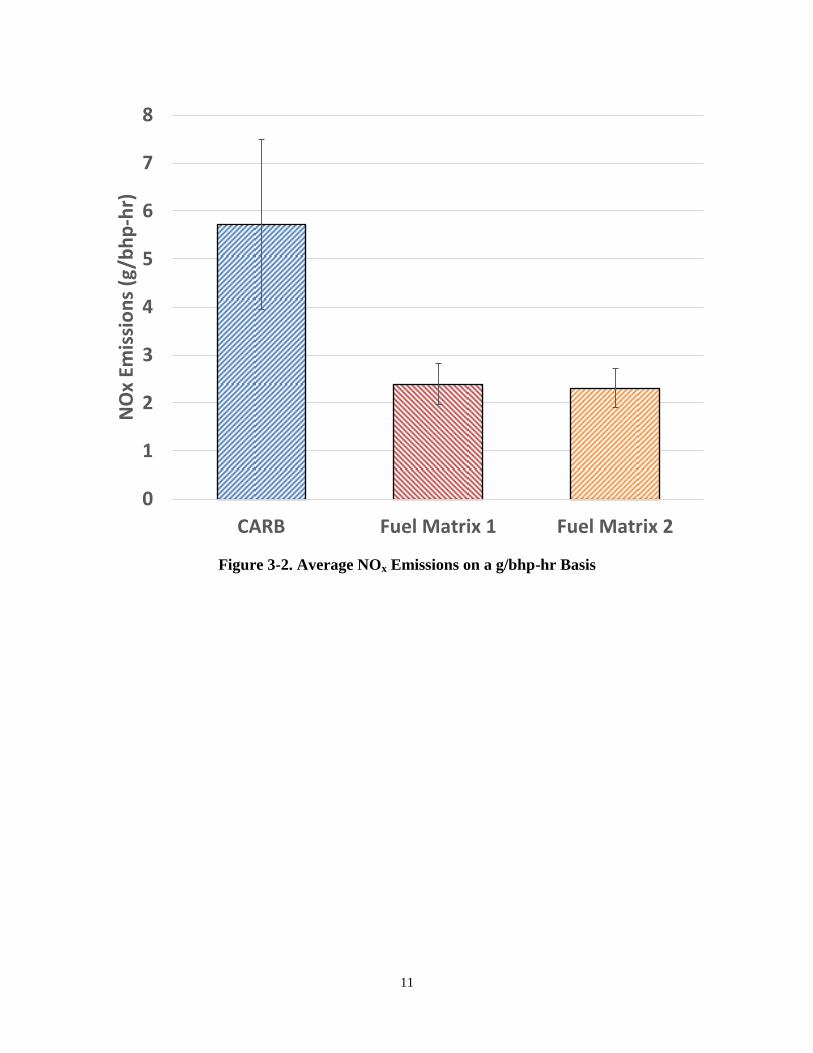
NOx Emissions Results 3.1
Average NOx emissions results for the truck with the CARB ULSD, Fuel Matrix 1, and Fuel
Matrix 2 are presented in Figure 3-1 and Figure 3-2 for the HHDDT Cruise Hi-Speed test cycle.
The results showed relatively consistent reductions in NOx emissions for the Fuel Matrix
additive, with reductions of 55.26% and 57.54%, respectively, for the Fuel Matrix 1 (0.9 mL
Fuel Matrix per gallon of CARB ULSD) and Fuel Matrix 2 (0.80 mL Fuel Matrix per gallon of
CARB ULSD) on a g/mile basis. The reductions in NOx emissions on a g/bhp-hr basis were on
the order of 58.12% and 59.61%, respectively, for the Fuel Matrix 1 (0.9 mL Fuel Matrix per
gallon of CARB ULSD) and Fuel Matrix 2 (0.80 mL Fuel Matrix per gallon of CARB ULSD).
The reductions in NOx emissions for the HHDDT Cruise Hi-Speed test cycle were all
statistically significant with a 90% confidence level.
The reduction in NOx emissions for the Fuel Matrix fuel relative to CARB ULSD was observed
for both the acceleration and the high-speed portion in the HHDDT Cruise High-Speed test
cycle, as shown in Figure 3-3. The real-time data (representative data was taken during the first
day of testing) presented in Figure 3-3 shows that during the acceleration periods, NOx
emissions for the Fuel Matrix 1 decreased approximately 50% compared to those of CARB
ULSD. For the high-speed portion of the test cycle, average NOx emissions for the Fuel Matrix 1
only accounted a third to those of CARB ULSD.
Figure 3-1. Average NOx Emissions on a g/mile Basis
0
5
10
15
20
CARB Fuel Matrix 1 Fuel Matrix 2
NO
x Em
issi
on
s (g
/mi)
Page 11
11
Figure 3-2. Average NOx Emissions on a g/bhp-hr Basis
0
1
2
3
4
5
6
7
8
CARB Fuel Matrix 1 Fuel Matrix 2
NO
x Em
issi
on
s (g
/bh
p-h
r)
Page 12
12
Figure 3-3. Real-Time NOx emissions comparison
CO2 Emissions Results 3.2
CO2 emissions results for the truck with the CARB ULSD, Fuel Matrix 1, and Fuel Matrix 2
fuels are presented in Figure 3-4 and Figure 3-5, respectively, for the HHDDT Cruise Hi-Speed
test cycle. The results reported here show some reductions in CO2 emissions with the use of Fuel
Matrix compared to CARB ULSD on a g/mile basis, but not at a statistically significant level. On
a g-bhp/hr basis the reductions in CO2 emissions with the additized fuels relative to CARB
ULSD were statistically significant.
0
10
20
30
40
50
60
70
0.0
0.2
0.4
0.6
0.8
1.0
1.2
0 200 400 600 800
Spp
ed
(m
ph
)
NO
x Em
issi
on
s (g
)
Cycle Time (s)
CARB Fuel Matrix 1 Speed (mph)
Page 13
13
Figure 3-4. Average CO2 Emissions on a g/mile Basis
1500
1600
1700
1800
1900
2000
2100
CARB Fuel Matrix 1 Fuel Matrix 2
CO
2 E
mis
sio
ns
(g/m
i)
Page 14
14
Figure 3-5. Average CO2 Emissions on a g/bhp-hr Basis
CO Emissions Results 3.3
CO emissions results for the truck with the CARB ULSD, Fuel Matrix 1, and Fuel Matrix 2 fuels
are presented in Figure 3-1 and Figure 3-7 for the HHDDT Cruise Hi-Speed test cycle. The
results showed relatively consistent decreases in CO emissions for the Fuel Matrix additive
relative to CARB ULSD, with these decreases being on the order of 1.43% and 5.06%,
respectively, for Fuel Matrix 1 and Fuel Matrix 2 on a g/mile basis, and on the order of 7.86%
and 9.75% for Fuel Matrix 1 and Fuel Matrix 2 on a g/bhp-hr basis compared to CARB ULSD.
The reductions in CO emissions were all statistically significant for the HHDDT Cruise Hi-
Speed test cycle, except for the Fuel Matrix 1 on a g/mile basis.
500
550
600
650
700
750
CARB Fuel Matrix 1 Fuel Matrix 2
CO
2 (
g/b
hp
-hr)
Page 15
15
Figure 3-6. Average CO Emissions on a g/mi Basis
0.0020
0.0022
0.0024
0.0026
0.0028
0.0030
0.0032
0.0034
0.0036
0.0038
CARB Fuel Matrix 1 Fuel Matrix 2
CO
Em
issi
on
s (g
/mi)
Page 16
16
Figure 3-7. Average CO Emissions on a g/bhp-hr Basis
PM Emissions Results 3.4
PM mass emissions, expressed in g/mile and g/bhp-hr, are shown in Figure 3-8 and Figure 3-9,
respectively. In general, PM mass emissions for the baseline CARB ULSD and the Fuel Matrix
fuels were found to be at very low levels due to the presence of the DPF. The results reported
here did not show any statistically significant differences in PM mass emissions between the test
fuels over the HHDDT Cruise Hi-Speed cycle.
0.0010
0.0011
0.0011
0.0012
0.0012
0.0013
0.0013
0.0014
CARB Fuel Matrix 1 Fuel Matrix 2
CO
Em
issi
on
s (g
/bh
p-h
r)
Page 17
17
Figure 3-8. Average PM Emissions on a g/mi Basis
0.0000
0.0005
0.0010
0.0015
0.0020
0.0025
0.0030
0.0035
0.0040
CARB Fuel Matrix 1 Fuel Matrix 2
PM
Em
issi
on
s (g
/mi)
Page 18
18
Figure 3-9. Average PM Emissions on a g/bhp-hr Basis
THC Emissions Results 3.5
THC emissions results for the truck with the CARB ULSD, Fuel Matrix 1, and Fuel Matrix 2
fuels did not show statistically significant fuel differences for the HHDDT Cruise Hi-Speed test
cycle. THC emissions showed mixed results for the Fuel Matrix Additive, with some increases
for the HHDDT Cruise Hi-Speed test cycle. It should be noted that THC emissions remained in
very low concentrations for all test fuels.
4 Summary
Testing was conducted for a heavy-duty vehicle on CARB ULSD and two blends treated with
Fuel Matrix additive as part of an evaluation of gaseous and particulate emissions. Emissions
measurements were made over the Heavy Heavy-Duty Diesel Truck (HHDDT) Cruise High-
Speed cycle using a heavy-duty chassis dynamometer.
0.0000
0.0002
0.0004
0.0006
0.0008
0.0010
0.0012
0.0014
CARB Fuel Matrix 1 Fuel Matrix 2
PM
Em
issi
on
s (g
/bh
p-h
r)
Page 19
19
The results of this study are summarized below.
The use of Fuel Matrix additive resulted in important statistically significant NOx
reductions compared to the baseline CARB ULSD over the HHDDT Cruise High-Speed
cycle. The reductions in NOx emissions were on the order of 55.26% and 57.54%,
respectively, for the Fuel Matrix 1 (0.9 mL Fuel Matrix per gallon of CARB ULSD) and
Fuel Matrix 2 (0.80 mL Fuel Matrix per gallon of CARB ULSD) on a g/mile basis. The
reductions in NOx emissions on a g/bhp-hr basis were on the order of 58.12% and
59.61%, respectively, for the Fuel Matrix 1 and Fuel Matrix 2 compared to CARB
ULSD.
Overall, CO2 emissions showed reductions with the Fuel Matrix fuels compared to the
baseline CARB ULSD, with some reductions being statistically significant.
CO emissions showed decreases with the use of Fuel Matrix fuels compared to CARB
ULSD.
PM mass emissions for the baseline CARB ULSD and the Fuel Matrix fuels were found
to be at very low levels due to the presence of the DPF, with no statistically significant
differences between the test fuels.
Page 20
20
Appendix
Appendix A: Executive Order for Test Engine
Page 22
22
Appendix B. Comprehensive Emission Results
Table B1. Comprehensive Emission Results in g/mi Basis
Emission Factors (g/mi)
Test Date Test ID Fuel Trace Dist mi THC CH4 NMHC CO NOx CO2 PM Comment
g/mi g/mi g/mi g/mi g/mi g/mi mg/mi
11/12/2015 201511120836 CARB HHDDT Cruise HI-SP 10.509 0.053 0.012 0.043 0.003 17.870 1902.7 0.006 Valid
11/12/2015 201511120917 CARB HHDDT Cruise HI-SP_x3_1 10.604 0.022 0.010 0.014 0.003 18.258 1914.3 0.001 Valid
11/12/2015 201511120917 CARB HHDDT Cruise HI-SP_x3_2 10.663 0.019 0.013 0.008 0.004 18.379 1923.7 0.001 Valid
11/12/2015 201511120917 CARB HHDDT Cruise HI-SP_x3_3 10.708 0.020 0.014 0.008 0.003 17.754 1903.8 0.001 Valid
11/12/2015 201511121039 CARB HHDDT Cruise HI-SP 10.710 0.922 0.028 0.907 0.004 7.136 2178.5 NA Regen
11/12/2015 201511121159 Fuel Matrix 1 HHDDT Cruise HI-SP_x3_1 10.550 0.797 0.011 0.795 0.004 8.645 2128.1 NA Regen
11/12/2015 201511121159 Fuel Matrix 1 HHDDT Cruise HI-SP_x3_2 10.652 0.073 0.004 0.070 0.003 7.679 1810.9 NA Valid
11/12/2015 201511121159 Fuel Matrix 1 HHDDT Cruise HI-SP_x3_3 10.362 0.028 0.006 0.023 0.003 8.234 1847.6 NA Valid
11/12/2015 201511121302 Fuel Matrix 1 HHDDT Cruise HI-SP 10.706 0.024 0.018 0.008 0.004 5.896 1979.2 0.003 Valid
11/12/2015 201511121344 Fuel Matrix 1 HHDDT Cruise HI-SP_x3_1 10.668 0.021 0.009 0.014 0.004 6.040 1934.0 NA Valid
11/12/2015 201511121344 Fuel Matrix 1 HHDDT Cruise HI-SP_x3_2 10.817 0.015 0.007 0.009 0.003 7.040 1819.9 NA Valid
11/12/2015 201511121344 Fuel Matrix 1 HHDDT Cruise HI-SP_x3_3 10.589 0.060 0.014 0.049 0.004 14.555 2065.2 NA Regen
11/12/2015 201511121444 Fuel Matrix 1 HHDDT Cruise HI-SP 10.641 0.384 0.019 0.371 0.004 18.638 2079.8 NA Regen
11/13/2015 201511130758 Fuel Matrix 2 HHDDT Cruise HI-SP_x2_1 10.702 0.037 0.006 0.032 0.003 5.812 1867.3 0.001 Valid
11/13/2015 201511130758 Fuel Matrix 2 HHDDT Cruise HI-SP_x2_2 10.691 0.022 0.009 0.014 0.003 7.661 1793.6 0.001 Valid
11/13/2015 201511130852 Fuel Matrix 2 HHDDT Cruise HI-SP_x2_1 10.625 0.018 0.003 0.016 0.003 5.735 1923.2 0.000 Valid
11/13/2015 201511130852 Fuel Matrix 2 HHDDT Cruise HI-SP_x2_2 10.663 0.015 0.007 0.009 0.003 7.279 1826.0 0.000 Valid
11/13/2015 201511130945 CARB HHDDT Cruise HI-SP_x2_1 10.671 0.010 0.002 0.008 0.003 6.365 1887.7 0.001 Valid
11/13/2015 201511130945 CARB HHDDT Cruise HI-SP_x2_2 10.662 0.060 0.012 0.050 0.004 14.944 2041.2 0.001 Valid
*Regeneration of DPF could cause large amount of PM and NOx emission, these regeneration cycles were not take into consideration into the fuel matrix performance evaluation
Page 23
23
Table B2. Comprehensive Emission Results in g/bhp-hr Basis
Test Date Test ID Fuel Trace Cycle Duration hp bhp-hr Distance THC CH4 NMHC CO NOx CO2 PM Comment
s mi g/bhp-hr g/bhp-hr g/bhp-hr g/bhp-hr g/bhp-hr g/bhp-hr g/bhp-hr
11/12/2015 201511120836 CARB HHDDT Cruise HI-SP 757 133.43 28.06 10.509 0.020 0.005 0.016 0.001 6.694 712.7 0.0021 Val id
11/12/2015 201511120917 CARB HHDDT Cruise HI-SP_x3_1 757 135.29 28.45 10.604 0.008 0.004 0.005 0.001 6.805 713.5 0.0003 Val id
11/12/2015 201511120917 CARB HHDDT Cruise HI-SP_x3_2 757 140.14 29.47 10.663 0.007 0.005 0.003 0.001 6.650 696.0 0.0003 Val id
11/12/2015 201511120917 CARB HHDDT Cruise HI-SP_x3_3 757 139.30 29.29 10.708 0.007 0.005 0.003 0.001 6.490 696.0 0.0003 Val id
11/12/2015 201511121039 CARB HHDDT Cruise HI-SP 757 154.24 32.43 10.710 0.305 0.009 0.300 0.001 2.356 719.4 NA Regen
11/12/2015 201511121159 Fuel Matrix 1 HHDDT Cruise HI-SP_x3_1 757 152.99 32.17 10.550 0.261 0.004 0.261 0.001 2.835 697.9 NA Regen
11/12/2015 201511121159 Fuel Matrix 1 HHDDT Cruise HI-SP_x3_2 757 144.60 30.41 10.652 0.025 0.002 0.024 0.001 2.690 634.4 NA Val id
11/12/2015 201511121159 Fuel Matrix 1 HHDDT Cruise HI-SP_x3_3 757 140.39 29.52 10.362 0.010 0.002 0.008 0.001 2.890 648.5 NA Val id
11/12/2015 201511121302 Fuel Matrix 1 HHDDT Cruise HI-SP 757 156.94 33.00 10.706 0.008 0.006 0.003 0.001 1.913 642.1 0.0009 Val id
11/12/2015 201511121344 Fuel Matrix 1 HHDDT Cruise HI-SP_x3_1 757 151.89 31.94 10.668 0.007 0.003 0.005 0.001 2.018 646.0 NA Val id
11/12/2015 201511121344 Fuel Matrix 1 HHDDT Cruise HI-SP_x3_2 757 146.64 30.83 10.817 0.005 0.003 0.003 0.001 2.470 638.5 NA Val id
11/12/2015 201511121344 Fuel Matrix 1 HHDDT Cruise HI-SP_x3_3 757 148.20 31.16 10.589 0.020 0.005 0.017 0.001 4.946 701.7 NA Regen
11/12/2015 201511121444 Fuel Matrix 1 HHDDT Cruise HI-SP 757 148.51 31.23 10.641 0.131 0.007 0.127 0.001 6.351 708.7 NA Regen
11/13/2015 201511130758 Fuel Matrix 2 HHDDT Cruise HI-SP_x2_1 757 148.16 31.15 10.702 0.013 0.002 0.011 0.001 1.997 641.4 0.0003 Val id
11/13/2015 201511130758 Fuel Matrix 2 HHDDT Cruise HI-SP_x2_2 757 140.74 29.59 10.691 0.008 0.003 0.005 0.001 2.767 647.9 0.0003 Val id
11/13/2015 201511130852 Fuel Matrix 2 HHDDT Cruise HI-SP_x2_1 757 150.29 31.60 10.625 0.006 0.001 0.005 0.001 1.928 646.6 0.0001 Val id
11/13/2015 201511130852 Fuel Matrix 2 HHDDT Cruise HI-SP_x2_2 757 144.80 30.45 10.663 0.005 0.002 0.003 0.001 2.549 639.5 0.0001 Val id
11/13/2015 201511130945 CARB HHDDT Cruise HI-SP_x2_1 757 142.29 29.92 10.671 0.004 0.001 0.003 0.001 2.270 673.2 0.0005 Val id
11/13/2015 201511130945 CARB HHDDT Cruise HI-SP_x2_2 757 139.94 29.43 10.662 0.022 0.004 0.018 0.001 5.415 739.6 0.0005 Val id
Emiss ion Factors (g/bhp-hr)
Page 24
24
Appendix C. Test Matrix
Table C1. First Test Day Matrix (11/12/2015)
Trace Time (sec)
Time (Hrs) Test Number
Cumulative Time
MEL/HDCD warm up 3600 1.00 1.00
Vehicle warm up (oil & coolant) 1800 0.50 1.50
2 mins at 45 mph 120 0.03 1.53
HHDDT cruise hi-speed 757 0.21 1 baseline
CARB 1.74
soak 1200 0.33 2.08
2 mins at 45 mph 120 0.03 2.11
HHDDT cruise hi-speed (3 back-to-back cycles) 2271 0.63
2 baseline CARB 2.74
soak 1200 0.33 3.07
2 mins at 45 mph 120 0.03 3.11
HHDDT cruise hi-speed 757 0.21 3 baseline
CARB 3.32
soak 1200 0.33 3.65
Fuel Change 3600 1.00 4.65
2 mins at 45 mph 120 0.03 4.68
HHDDT cruise hi-speed (3 back-to-back cycles) 2271 0.63 1 Fuel Matrix 1 5.32
soak 1200 0.33 5.65
2 mins at 45 mph 120 0.03 5.68
HHDDT cruise hi-speed 757 0.21 2 Fuel Matrix 1 5.89
soak 1200 0.33 6.23
2 mins at 45 mph 120 0.03 6.26
HHDDT cruise hi-speed (3 back-to-back cycles) 2271 0.63 3 Fuel Matrix 1 6.89
soak 1200 0.33 7.22
2 mins at 45 mph 120 0.03 7.26
HHDDT cruise hi-speed 757 0.21 4 Fuel Matrix 1 7.47
MEL/HDCD shut down & Data Process 1800 0.50 7.97
Page 25
25
Table C2. Second Test Day Matrix (11/13/2015)
Trace Time (sec)
Time (Hrs) Test Number
Cumulative Time
MEL/HDCD warm up 3600 1.00 1.00
Vehicle warm up (oil & coolant) 1800 0.50 1.50
2 mins at 45 mph 120 0.03 1.53
HHDDT cruise hi-speed (2 back-to-back cycles) 757 0.21 1 Fuel Matrix 2 1.74
soak 1200 0.33 2.08
2 mins at 45 mph 120 0.03 2.11
HHDDT cruise hi-speed (2 back-to-back cycles) 2271 0.63 2 Fuel Matrix 2 2.74
soak 1200 0.33 3.07
Fuel Change 3600 1.00 4.07
2 mins at 45 mph 120 0.03 4.11
HHDDT cruise hi-speed (2 back-to-back cycles) 2271 0.63
4 baseline CARB 4.74
MEL/HDCD shut down & Data Process 1800 0.50 5.24
Page 26
26
Appendix D. Fuel Properties Analysis Report
Test Method Property Units Value
D4052
API@60F 38.2
SPGr@60F 0.834
Density @ 15°C g/ml 0.8336
D5291 CH
Carbon wt% 85.96
Hydrogen wt% 13.68
Oxygen by difference wt% 0.36