Evaluation of full scale shear performance of tension anchor foundations:Load displacement curves and failure criteria
Paolo Bergamoa,1, Shane Donohuea,⁎, Damian Callanb, Adam Hollandb,2, John McCareyb,William Brownb,3, Michael McSherryb, Cillian Wardb, Giuseppina Amatoa, V. Sivakumara
a School of Natural and Built Environment, Queen's University Belfast, Stranmillis Road, BT95AG Belfast, Northern Ireland, UKb McLaughlin and Harvey Ltd., 15 Trench Rd, Newtownabbey BT36 4TY, Northern Ireland, UK
One of the biggest challenges faced by the offshore wave and tidal energy industry is the high cost ofconstructing and installing offshore foundations. Foundations based on post tensioned pile anchors can beeffectively proposed to tackle this issue. A series of full-scale direct shear tests were performed on-shore toevaluate the shear resistance of post-tensioned pile anchor foundations designed for securing tidal turbinedevices to a rock seabed. We focused, in particular, on the primary shear resistance mechanism of post-tensioned anchors, by applying a vertical force which mobilizes, a frictional force able to resist horizontalthrusts. Different load paths, involving monotonic or cyclic loading, were applied; several configurations for thefooting of the foundation were tested. The footing stress-displacement behavior and the stress conditions atsliding failure from a number of different testing configurations were compared and analyzed. A markedconsistency with the shear performance of natural rock joints was identified. This allows the behavior of tensionpile foundations subjected to substantial horizontal loads to be modeled using relationships developed for rockjoints, widely available in the literature. Additionally, the results obtained from different tests were also collatedconsidering the various configurations adopted for the foundation-rock system and the applied load paths, toidentify the factors that affect the shear resistance of the foundation.
1. Introduction
Among the most promising sources of renewable energy, theharvesting of electrical power from wind turbines or wave/tidal powergenerators, is a key resource in the area of the British Isles, because ofthe vast potential of offshore energy reserves (UK Government, 2003;DETINI, 2009; Renewable UK, 2013; EMEC, 2016). In this context, acritical problem currently encountered by civil engineering is therealization of adequate foundation systems for wind/wave/streamoffshore turbine devices. These foundations must be capable ofconnecting these structures to the seabed and of transferring the loadsapplied to the turbines safely to the ground (e.g. Adhikari andBhattacharya, 2011; Bhattacharya et al., 2012; Abhinav and Saha,2015). These demanding engineering tasks significantly affect theinstallation costs of such turbines and may constitute up to 35% ofthe installed cost (Byrne and Houlsby, 2003). This influences nega-tively the cost competitiveness per megawatt when compared to energy
from fossil fuels (DETINI, 2009).Over recent years, several foundation solutions for tidal power
generators have been developed and implemented. The most commonsolutions, that have been used for a range of different environments(e.g. water depth, nature of seabed), are: gravity foundations (e.g.McLaughlin and Harvey, 2016), piled foundations (e.g. Whittakeret al., 2007; Spagnoli et al., 2013), moored foundation solutions(Jeffcoate et al., 2015; Scotrenewables, 2016;), tripods with bucketsand suction buckets. The advantages and disadvantages of each ofthese systems have previously been established (IEA – RETD, 2012).Considering the need to meet challenging engineering requirementsand to reduce construction and deployment costs, the offshore founda-tion industry is continuously evolving, with new or hybrid solutionsbeing developed. Recently, the use of foundations for tidal turbinesbased on post-tensioned anchors has been proposed, jointly with asystem for their efficient installation in offshore environments (Callanet al., 2012). This foundation type aims to provide the tidal turbine
http://dx.doi.org/10.1016/j.oceaneng.2016.12.033Received 1 September 2016; Received in revised form 21 December 2016; Accepted 31 December 2016
with sufficient bearing resistance, whilst at the same time reducing theoverall size of the foundation when compared to gravity basedfoundations (thereby reducing concrete requirements). This systemconsists of small-diameter hollow bars drilled in the rocky seabed andsecured to the underlying rock volume by means of grout bond. Whentensioned using hydraulic jacks, they apply a vertical force on theunderwater structure that replicates the self-weight of a ballastedstructure to ensure its stability (Fig. 1). The technology of posttensioned anchors (hereafter referred to as “tension anchors”) is readilyavailable and widely used for a range of onshore applications (e.g. asmicropiles for foundations and anchorages, soil nails for reinforcingsoil, slopes or tunnels; see for instance standards BS EN 14490, 2010,and BS EN 14199, 2015, within Eurocode 7, 1997). Conversely, the useof tension anchors in underwater applications is less common, becauseof the difficulties in tensioning the anchors in the subsea environment,where access and operating conditions might be extremely difficult;hence these topics are currently the subject of industry research anddevelopment (Callan et al., 2012; Meggitt et al., 2013; Tiwari et al.,2014). Additionally, underwater structures may be subjected to sub-stantial horizontal loads, e.g. generated by tidal currents (de JesusHenriques et al., 2014) or induced by wave action, that the foundationsare required to resist. Studies found in the literature that discuss theperformance of piles or anchors embedded in rock mainly focus on theevaluation of their shaft resistance (see for instance Gu and Haberfield,2004; Serrano and Olalla, 2004, 2006) rather than on their behaviorwhen subjected to significant shear forces.
To assess the potential of tension anchor foundations to resistsignificant horizontal loads, as typically found in a tidal environment, aset of full scale, direct shear tests were conducted. These tests wereperformed onshore, on a particular foundation primarily designed tofix tidal stream turbines to a rock seabed (Callan et al., 2012),constituted by a circular footing connected to the bedrock by meansof a post-tensioned anchor. These trials are part of a wider experi-mental phase aimed at testing the performance of this foundationsystem prior to offshore installation in its planned working environ-ment (i.e. a shallow sea, with a depth of few tens of meters, withsubstantial tidal currents). In the experiments presented in this paper,the tension anchor foundation supports a specifically designed test rigthrough which normal and shear loads are applied to the foundation(Figs. 2 and 3). This experimental apparatus was installed in a schistquarry (Ballykinler, Co. Down, Northern Ireland) in order to test thetension anchor system on a weathered, poor quality rock. Additionaltests on other imported rock types were also carried out (e.g.sandstone, gritsone or granite rock, concrete). Several configurationsfor the footing of the foundation were adopted. Different loadingscenarios were applied during the tests, including (1) monotonicloading until the peak shear strength was mobilized, and (2) bidirec-tional cyclic shear loading until failure. The resultant shear and normal
displacements were measured at the foundation footing by means oflinear variable differential transformer (LVDT) sensors.
In both the experimental and subsequent analysis phases, attentionwas focused on the primary shear loading resistance mechanism ofpost-tensioned anchors, by applying a vertical force which mobilizes africtional force able to resist horizontal thrusts (Fig. 1). Indeed, theanchor itself also opposes horizontal movements; however, this me-chanism comes into play at large displacements, when the rock-foundation footing coupling has already failed, and the anchor providesthe residual shear resistance. The evaluation of the resistance providedby the anchor is, however, not within the scope of this work. Therefore,testing and analyses was focused on relatively small displacements, andfailure was considered to occur when the foundation footing-rockadhesion fails, so that the footing “slides” on the rock surface, savefor the constraint later posed by the anchor.
The experimental apparatus and details of the tests are described in“Experimental method” (Sections 2.1 and 2.2). The acquired datasetswere studied and interpreted with reference to the scientific literatureconcerning the shear behavior of natural rock joints (Section 2.3). Inthis area of study, a wide range of works have focused:
i) on the analysis of load-displacement relations for rock disconti-nuities prior to failure (e.g. Kuhlawy, 1975; Hungr and Coates,1978; Kulhawy, 1978; Bandis, 1980; Bandis et al., 1983);
ii) on the definition of criteria representing the state of stress at failurefor rock discontinuities (e.g. Patton, 1966; Jaeger, 1971; Barton,1973; Hoek and Brown, 1980).
For both aspects, the behavior displayed by the foundation footing-
Nomenclature
A areaα asperity anglec0 cohesion interceptdh shear, horizontal displacementdv normal, vertical displacementdvj vertical displacement related to the closure of the rock
joint and failure of asperities (net deformation or closure)dvr portion of vertical displacement due to solid rock com-
pressiondvt total vertical displacementfh shear, horizontal forcefha horizontal asymptotic load of the fh–dh curvefv normal, vertical force
φb basic friction angleKj stiffness numberKnji initial normal stiffness for rock joint closure or failureKnri initial normal stiffness of solid rock compressionksi initial shear stiffness referred to the fh–dh curveKsi initial shear stiffness referred to the τ–dh curvenj stiffness exponentRf failure ratioσn normal, vertical stressσna horizontal asymptote of the σn–dvr curveτ shear stressτa horizontal asymptotic of the τ–dh curveτmax shear stress at failureVm maximum achievable closure for a rock joint
Fig. 1. Sketch of tension anchor foundation system. When the anchor is tensioned, avertical force N (composed of tension in the anchor and self-weight) is applied to thestructure to be secured. Consequently a friction force Ff is mobilized, which enables thestructure to resist horizontal thrusts.
P. Bergamo et al. Ocean Engineering 131 (2017) 80–94
81
rock system in the tests carried out showed an appreciable degree ofconsistency with the response described and modeled for natural rockjoints in literature. This allows the relationships developed for rockjoints, widely considered in the literature, to be used for modeling theperformance of tension anchor foundations subjected to substantialhorizontal loads. The results obtained from different tests were alsoanalyzed considering the various configurations adopted for thefoundation-rock system and the applied load paths, to identify thefactors that affect the shear resistance of the foundation (“Results and
Discussion”, Section 3).
2. Experimental method
2.1. Experimental apparatus
The foundation tested in this study is a post-tensioned anchorfoundation (Callan et al., 2012). This is constituted by a ground anchorembedded in the rock mass, tensioned to exert a downward normalforce on the foundation footing, which is a circular steel frame placedon top of the rock surface (Fig. 1). The rock anchor is a titan threadedhollow bar, 73/53 mm diameter (Ischebeck Titan, 2016).
The tested foundation was installed at different locations in theoutcropping schist bedrock (unconfined compressive strength,UCS=39 MPa, rock-quality designation, RQD=40–50%) of a quarryin Ballykinler, Northern Ireland. The adopted installation followedmanufacturer's recommendations (Ischebeck Titan, 2016): the anchorwas installed in the rock mass with a sacrificial drill bit, using a rotarypercussive drilling technique and a weak cement grout as flushingmedium, pumped through the hollow center of the anchor. A maximumboring depth of approximately 6 m was reached. Towards the end ofthe drilling phase, a 0.4 water/cement ratio grout was injected, asrecommended by the anchor manufacturer (Ischebeck Titan, 2016).This grout displaced the weaker flushing medium and, when cured, itformed a bond around the lower portion of the anchor and the rockmass. A free anchor length of 4 m was achieved by de-bonding theupper section of the anchor bar, this included the section of the anchorwithin the foundation. Once the anchor was installed, its upper portion,emerging from the rock mass for 2 m, was encapsulated in thefoundation footing (Fig. 2a). The footing was constituted by twocircular steel elements (Fig. 2a), bolted on top of each other. The lowerelement, the one in contact with the rock, is comprised of a steeltubular section, 300 mm long (in dark blue in Fig. 2a), with an innerand outer diameter of 880 and 920 mm, respectively. The lower edge ofthe tubular pipe was shaped in two alternative configurations: in onecase, the edge was beveled with a bevel angle (β) of 45°; alternatively,the profile of the edge was flat (β=90°). It should be noted that theanchor, although sheathed in the foundation footing, was not coupled
Fig. 2. Experimental apparatus, foundation footing and test rig. a and b) Exploded view of the elements composing the foundation footing and shear testing rig. c) Overall view of test rigand foundation footing, with key dimensions indicated.
Fig. 3. Experimental apparatus. a) Sketch of the shear testing rig when installed on site,representing also the applied loads and the adopted spatial reference system. fh and fvidentify shear and normal forces, respectively. Superscript + and – indicate the sign(positive or negative) of the applied loads according to the adopted sign convention. b)picture of the test rig system.
P. Bergamo et al. Ocean Engineering 131 (2017) 80–94
82
with it, i.e. the anchor was not in direct contact with any of theelements of the shear foot. The system is described in detail by Callanet al. (2012).
The foundation footing was in turn housed into a bespoke designedand assembled shear testing rig (Figs. 2b, c), whose function was totransfer the externally applied loads to the footing. The test rig was anelongated fabricated steel frame composed by four 6 m long 305 UC 97steel beams, arranged into two layers, the two sides of the rig beingconnected by means of transversal steel members. Fig. 2c shows anoverall design of the testing rig and the foundation footing. When putin place, the rig rested, at one of its extremities, on the foundationfooting; the other end was enclosed and supported by a stabilizingframe also composed of steel elements (Fig. 3a). This frame wasrequired to prevent any rotational movement of the footing and toensure that the applied load was a purely horizontal load and not arotational one. Lubricated steel “knife edge” bearing pads were used toprevent up lift while reducing friction within the system. The stabilizingframe supported the underside of the rig on a slip bearing so thathorizontal load was resisted entirely by the interaction of the footingand foundation rock. Fig. 3a and b shows a sketch and a picture of thetest rig setup on site.
After the whole system (foundation and shear testing rig) had beeninstalled, the ground anchor was tensioned by means of four hydraulicjacks, placed on the upper surface of the rig. The applied tension ( fv
+ inFig. 3a) was progressively increased to the desired level of force,comprised within 490–1470 kN (50–150 t) depending on the differenttests (see Section 2.2). A similar system, based on hydraulic jacks, wassimultaneously used to apply a vertical force on the rig at the locationof the stabilizing frame ( f ′v
+ in Fig. 3a), to prevent an excessivelyasymmetrical loading of the testing rig, hence resisting the overturningmoment induced by horizontal loads. In this case, the applied force wasset to 441 kN (45 t) in all tests. Once the normal loads had beenbrought into operation, horizontal shear forces (fh in Fig. 3a) wereapplied on the testing rig frame using tensioning bars connecting bothends to anchor blocks. Shear loads were applied either in a singledirection, or alternately in both directions, depending on the desiredloading path. The displacements produced at the base of the foundationfooting, in the horizontal and, for some tests, vertical direction, weremeasured by means of LVDT's.
2.2. Experimental testing
A total of fourteen different tests were conducted using theexperimental apparatus described above. Each test, numbered from 1to 14, was characterized by a specific installation of the ground anchor,preparation and deployment of the foundation footing and loadingpath. In experiments including two or more successive loading phases,these are labeled with alphabet letters. Table 1 and Table 2 present asummary of the whole experimental work. See Tables A1–A4, inAppendix A, for a separate description of all tests. We illustrate herethe different experimental conditions adopted for each test.
2.2.1. Installation of the ground anchorAs described in Section 2.1, the first step in the execution of the
tests was the installation of the ground anchor, which was drilled intothe rock mass. Three different experimental setups were investigated:
i) The anchor was drilled into the schist constituting the naturaloutcropping bedrock at the test site of Ballykinler quarry (Fig. 4a).Different locations were chosen in the quarry, so that the founda-tion was installed on either a relatively competent or a weatheredschist. As summarized in Table 2, in tests 1, 6, 7, 8, 9, 10, 14 thefoundation footing was directly placed on the schist bedrock.
ii) Before drilling the anchor in the bedrock, a cylindrical hole, ~0.4 mdeep and with a diameter of ~1 m, was excavated into the schistrock. The anchor was then driven into the underlying rock volume,
which was subsequently backfilled with 40 MPa concrete (standardEN 206-1:2000; European Committee for Standardization, 2000).The concrete was then left to cure for 10 days (period between theinstallation of the experimental setup and the test execution); itthus formed a compact slab, encased in the bedrock mass and witha smooth upper surface, enclosing the upper segment of the buriedportion of the anchor (Fig. 4b). This preparation technique wasadopted for tests 2, 3, 4, 5 (Table 2). For these tests, the foundationfooting was hence placed on the smooth surface of a concrete slab.
iii) Before drilling the anchor in the bedrock, a trench was excavated inthe schist bedrock. A boulder of a different rock type was thenhoused in the trench and coupled with the surrounding schist massby adding 40 MPa concrete (standard EN 206-1:2000; EuropeanCommittee for Standardization, 2000). Here again, the concretecuring time corresponded to the period between the installation ofthe anchor and the shear test execution (10 days). Finally, theanchor was drilled into this two-layer rock mass, where the lowerlayer was constituted by the schist bedrock and the upper layer wasthe encased rockboulder it (Fig. 4c). Three different types of rockwere used: red sandstone (test 11), Mourne granite (test 12), andgritstone (test 13, Table 2). This preparation technique enabled thefoundation performance to be evaluated on better quality, smooth-er rock materials, when compared to the original schist bedrock ofthe test site.
2.2.2. Foundation footing preparationThe second step in the execution of the tests was the preparation
and deployment of the foundation footing (see Section 2.1 and Fig. 2a,b). Here again, three different alternatives were adopted in the tests:
i) The foundation footing was directly placed on the rock or concreteslab, its lower edge in direct contact with the underlying material.No grout layer (see below) was added between the shear foot andthe rock. This configuration was implemented for tests 1, 2, 3(Naked steel frame in Table 2).
ii) Before the footing was housed in the testing rig, its inner volumewas filled with grout and left to cure for 7 days. As a result, thefooting face in contact with the underlying rock or concrete slabwas a smooth flat surface, with an area A=0.665 m2 (Fig. 4d). Tests4 and 6 were conducted using this footing configuration (Groutedfooting in Table 2).
iii) The inner volume of the footing was filled with grout when thefooting had been already put in place, and left to cure forapproximately 14 days. The grout created a layer adhering to boththe steel frame of the footing and the underlying rock or concretesurface (Figs. 4e, f). Care was taken to avoid direct contact betweenthe anchor and the grout layer; the anchor bar was protected fromcontact with the grout using a closed cell foam (polystyrene)insulation to allow movement of the shear foot without generatingany shear resistance from the anchor bar. This procedure was
Table 1Maximum normal load applied before the start of the shear loading phase (fv0), expressedin kN and t.
Tests Normal load at the start ofshear loading phase (fv0)
P. Bergamo et al. Ocean Engineering 131 (2017) 80–94
83
followed in tests 5a, 7, 8, 9, 10, 11, 12, 13, 14 (Footing grouted inplace in Table 2). A partial exception was constituted by tests 5b-d.After reaching sliding failure at the end of experiment 5a (involvingthe failure of the grout-concrete slab bond, thus producing arugged contact surface), the subsequent tests (5b-d) were executedby repositioning the shear foot in its original place (interlocking thegrout asperities), without restoring the grout bond.
2.2.3. Loading pathAfter the foundation was completely installed and connected to the
testing rig, vertical and horizontal forces were applied as described insection Section 2.1, following the desired loading path. First, a normalforce (fv) was progressively applied on the test rig above the foundationby tensioning the ground anchor with hydraulic jacks (Fig. 3a). Thenormal force was increased up to the desired level (fv0, comprisedbetween 490 and 1470 kN, i.e. 50–150 t, depending on the differenttests), which was then intended to be kept constant in the followingphase of shear loading. See Table 1 for a complete list of the values offv0 adopted in all tests. Figs. 5a and b show a typical increment ofvertical force from 0 kN to the desired maximum value of 1471 kN, aswell as the produced resultant vertical displacements (dv) measured atthe base of the foundation footing (initial phase of test 14a).
Once the preset level of fv has been reached, the following phase ofapplication of shear loads (fh) was initiated. A variety of differentloading-unloading paths, with increasing levels of complexity, wasfollowed in the various tests:
i) Monotonically increasing the horizontal force, applied in a singledirection, until the condition of sliding failure at the base of thefoundation footing was achieved. The shear force was progressivelyincreased in 98 kN steps, with a 1 min interval between successiveload increments. When failure was considered imminent, the loadincrements decreased to 49 kN (5 t) steps. The condition of slidingfailure was characterized by a sudden and sharp increase ofhorizontal displacement measured at the footing (dh), in responseto a stable increase of applied shear load fh; the subsequent releaseof fh showed the predominance of unrecoverable, permanent sets(see Fig. 5c showing a typical load-displacement graph from a testinvolving a monotonic increase of fh to failure, test 5c). Overall,tests 1, 2, 3, 4, 5, 7, 8, 9b implemented this loading path.
ii) Repeated unidirectional loading-unloading cycles. Each cycle in-volved increasing fh to a maximum value (490 kN, 50 t), againthrough 98 kN steps separated by 1 min intervals. The loadingphase was then followed by a reduction to 0 kN, completed in asingle step. Tests 6 and 9a (Fig. 6a, b) implement this loading path.
iii) Repeated bidirectional loading-unloading cycles. Each cycle wascomprised of alternating load-unload paths in the positive andnegative direction (see Fig. 3a for sign reference), reaching thesame absolute value for the maximum applied load in eitherdirection (see Figs. 6c, d for an example from test 14a).Regarding the loading pattern, the horizontal force was progres-sively raised and decreased, through successive steps (49–98 kNsteps, tests 10–13) or a continuous increase/decrease (test 14,Fig. 6c, d). The average duration per full cycle was 3.5 min for thetests where |fh|max=490 kN (test 14a); 6.1 min for the tests with |fh|max=735 kN (tests 10a, 11a, 12a, 13a, 14b); 8.2 min for thetests where |fh|max=981 kN (tests 10b, 11b, 12b, 13b). The finalphases of tests 11, 13 and 14, involved cyclic amplitudes |fh| >981 kN, which resulted in sliding failure.
The different shear loading paths described above (monotonicallyincreasing, unidirectional or bidirectional cycles) were also combinedwithin the same test, in a succession of various loading phases (labeledwith letters, see Tables 1 and 2).
As shown by Figs. 6a and c, the phase of application of shear loadsis characterized by a gradual, limited decrease in the value of fvT
able
2Tab
lepresentingthearrangemen
tof
thefoundation-rocksystem
andad
optedsh
earload
ingpath.Thebe
velan
gle(β)of
thefootinged
geis
45°,
unless
differentlysp
ecified.
Materialunderlyingth
efo
undation
footing
Con
creteslab
Schistbe
drock
Sandston
eslab
Graniteslab
Gritstoneslab
Configura
tion
offo
undation
footing
Shearloadin
gpath
Nak
edsteelfram
eGroutedfooting
Foo
tinggrou
ted
inplace
Nak
edsteelfram
eGrouted
footing
Foo
tinggrou
tedin
place
Foo
tinggrou
tedin
place
Foo
tinggrou
ted
inplace
Foo
tinggrou
tedin
place
Mon
oton
ic,unidirection
alincrem
entof
f hto
failure
2a(β=90
°),2
b(β=90
°),2
c(β=90
°),3a
,3b
,3c
4a,4b
,4c
,5b
,5c
,5d
5a1a
(β=90
°),1b
(β=90
°),1c
(β=90
°)7(β=90
°),8,
9b(β=90
°)Unidirection
alcycles.Max
.f h49
0kN
.(no.
ofcycles)
6(9)
9a(5,β=90
°)
Bidirection
alcycles.Max
.|fh|=
490kN
.(no.
ofcycles)
14a(48)
Bidirection
alcycles.Max
.|fh|=
735kN
.(no.
ofcycles)
10a(5)
11a(5)
12a(5)
13a(5)
14b(46)
Bidirection
alcycles.Max
.|fh|=
981kN
.(no.
ofcycles)
10b(3)
11a(2)
12b(2)
13b(2)
Bidirection
alcycles
tofailure.M
ax.|f h|
>98
1kN
.(no.
ofcycles)
10c(3
–nofailure)
11c(4)
13c(4)
14c(8)
P. Bergamo et al. Ocean Engineering 131 (2017) 80–94
84
(applied normal force ensured by the hydraulic jacks tensioning theanchor). This decrease is due to i) the loss of fluid through jack gaskets(particularly evident in the initial phase of shear loading) and ii) theextension of jack cylinders made possible by the increasing vertical(downward) displacements of the foundation footing during the shearloading phase. The loss of pressure in the jacks exerting the normalload fv is limited, amounting to 10% and 12% in the two most extendedtests (test 14a and 14b), involving 48 and 46 cycles of bidirectionalshear loading, respectively.
Table 1 and Table 2 present an overall summary of the wholeexperimental work, describing how the different possible configura-tions for the foundation footing-rock system and the various loading
paths, illustrated above, were combined in a series of tests aimed atevaluating the performance of post tensioned anchor foundations in avariety of different conditions. Each test (numbered from 1 to 14), wascharacterized by a specific installation procedure leading to a particularconfiguration for the foundation-rock system; the corresponding load-ing paths, if constituted by two or more phases, are designated with aletter. See Tables A1–A4, in Appendix A, for a separate description ofall tests.
2.3. Relevant aspects of mechanical behavior of natural rock joints
This Section introduces relevant aspects of the mechanical behavior
Fig. 4. Different alternatives for the installation of ground anchor and the configuration of the foundation footing. Panels a-c: installation of ground anchor. a) Ground anchor drilled inschist bedrock. b) Anchor surrounded by a concrete slab. c) Anchor drilled into a two layer rock formation, the upper layer being constituted by a block of red sandstone (visible in thepicture), resting on schist bedrock. Panels d-f: configuration of foundation footing. a) Footing filled with grout and left to cure before its placement on site. b) Footing and grout layeradded when the footing was already in place. c) Lower element of the foundation footing and of grout layer cast in place. (For interpretation of the references to color in this figurelegend, the reader is referred to the web version of this article.)
Fig. 5. Application of vertical and horizontal loads and produced displacements. a) and b) Typical initial loading phase of performed tests, where the normal force was graduallyincreased from 0 kN to the desired value of 1471 kN (a). In b) the vertical displacements measured in this phase are shown (a and b refer to test 14a). c) Shear load-displacement graphin a typical test (test 5c) involving the unidirectional and monotonic increment of fh until sliding failure is reached. The following unloading path shows the prevalence of permanent sets.
P. Bergamo et al. Ocean Engineering 131 (2017) 80–94
85
of natural rock joints, which have been adopted to assist the inter-pretation of the shear test data produced in this study.
2.3.1. Load-displacement relationshipsAccording to the work of Bandis et al. (1983), the total normal
deformation (dvt) measured in a rock joint subjected to normal stressis constituted by the sum of two components,
d d d= +vt vr vj (1)
where dvr is the portion of vertical displacement due to solid rockcompression, and dvj is related to the closure of the rock joint andfailure of asperities, and it is referred to as net deformation or closure.Bandis et al. (1983) observed that at the initial loading states, the totalobserved deformation (dvt) is predominantly due to the displacementsoccurring across the joint interface (dvj). Successively, under increas-ing values of normal load, the joint closely reaches its closed state, andany further increase in normal stress (σn) is taken up by the solid rockbelow and above the joint (therefore dvr becomes dominant).According to Kulhawy (1975) and Bandis et al. (1983), the relationshipbetween σn and dvr may be expressed as a hyperbolic curve withdownward concavity, i.e. tending towards a horizontal asymptote onthe σn axis:
σd
=+
nvr
Kdσ
1nri
vr
na (2)
where Knri and σna are the initial tangent of the σn–dvr curve (orinitial normal stiffness of solid rock compression) and the horizontal
asymptote to the same curve, respectively. To model the behavior of netdeformation in rock joints (dvj), Bandis et al. (1983) suggested thefollowing equation, again a hyperbolic relation, but with an upwardoriented concavity (i.e. tending towards a vertical asymptote on the dvjaxis):
σd
d=
−n
vj
K
K
V vj1nji
nji
m (3)
where Knji is the initial normal stiffness for joint closure or failure(Knji being the ratio between the increase in applied normal stress andthe increase in produced dvj at σn→0), and Vm is the verticalasymptote to the hyperbola and it is the maximum achievable closurefor the joint (.i.e. the condition where the joint asperities are perfectlyinterlocked or have failed).
In a similar fashion, experimental observations of the shearbehavior of different types of rock joints and at different levels ofnormal stresses have led to the definition of hyperbolic form for shearload (fh) – shear displacement (dh) relationships (Kulhawy, 1978;Hungr and Coates, 1978; Bandis et al., 1983). In particular, Kulhawy(1978) has validly proposed and applied:
fd
=+h
h
kdf
1si
h
ha (4)
where ksi is the initial shear stiffness (the ratio between the increase inapplied load and the increase in resultant displacement at fh→0) andfha is the horizontal asymptotic load of the fh–dh hyperbolic curve.These two parameters can be correlated to the quality of the couplingbetween the two faces of the rock joint. According to Kulhawy's (1978)and Bandis et al.’s (1983) experimental observations, fresh planar andweathered rock joints are characterized by lower values of ksi and byhighly nonlinear fh–dh curves (i.e. by lower values of parameter fha inEq. (4)). Vice versa well interlocked, unweathered joints yield steeperand more linear fh–dh relations (features corresponding to higher ksiand fha). Kulhawy (1978) and Bandis et al. (1983) have also investi-gated the influence of the applied normal stress on shear load –displacement relationships, proposing and validating the followingequations:
kA
K K σ= = ( )sisi j n
nj(5)
fA
ττR
= =haa
max
f (6)
where A is the rock joint area (so that Ksi=ksi/A is the initial slope ofthe shear stress τ–dh curve, and τa=fha/A is its horizontal asymptote),Kj=stiffness number, nj=stiffness exponent, τmax=shear stress atfailure, which depends on σn according to the failure envelope (seeSection 2.3.2). Rf, or failure ratio, expresses the ratio of the failuredeviator stress to the deviator stress predicted by the hyperbola (Eq.(4)). Rf is ≤1 and it is related to the nonlinearity of the fh–dh curve;values close to 1 indicate a marked curvature of the hyperbola, whilelower values correspond to a more linear appearance of the fh–dhrelation.
2.3.2. Failure criterionSeveral strength criteria, correlating the levels of shear and normal
stress at failure, have been defined in the literature for rock masses(Patton, 1966; Jaeger, 1971; Barton, 1973; Hoek and Brown, 1980).Although their mathematical formulation may differ, all criteriaenvisage a failure envelope that, in a τmax (peak shear stress) versusσn (normal stress) representation, is characterized by a steeper slope at
Fig. 6. Unidirectional (a, b) and bidirectional (c, d) cyclic loading paths. a) Appliednormal and horizontal loads in a typical unidirectional cyclic loading test (test 9a). b)Measured horizontal displacements. c) Applied normal and horizontal loads in a typicalbidirectional cyclic loading experiment (first 10 cycles from test 14a). d) Correspondinghorizontal displacements.
P. Bergamo et al. Ocean Engineering 131 (2017) 80–94
86
low values of σn and by a gentler slope at higher values of σn. The twodifferent patterns are determined by the mechanisms controlling theshear resistance of the rock joints. At low values of σn, the shearresistance includes a component related to friction and a secondcomponent related to dilation. At higher σn the contribution of dilationbecomes negligible, and friction and cohesion are the mechanismscontrolling the shear resistance (Johnston and Lam, 1989; Roostaet al., 2006).
In agreement with these concepts, the shear strength criterion(Patton, 1966) defines a bi-linear envelope, expressed through thefollowing equations:
τ σ tan φ α= ( + )for low normal stressmax n b (7)
τ c tan φ= + ( )for high normal stressmax b0 (8)
where α is the asperity angle, φb is the basic friction angle and c0 is thecohesion intercept. The angle α is directly related to the dilatantbehavior of rock joints under shear loading (Huang et al., 1993;
Alejano and Alonso, 2005).
3. Results and discussion
3.1. Load-displacement relationships
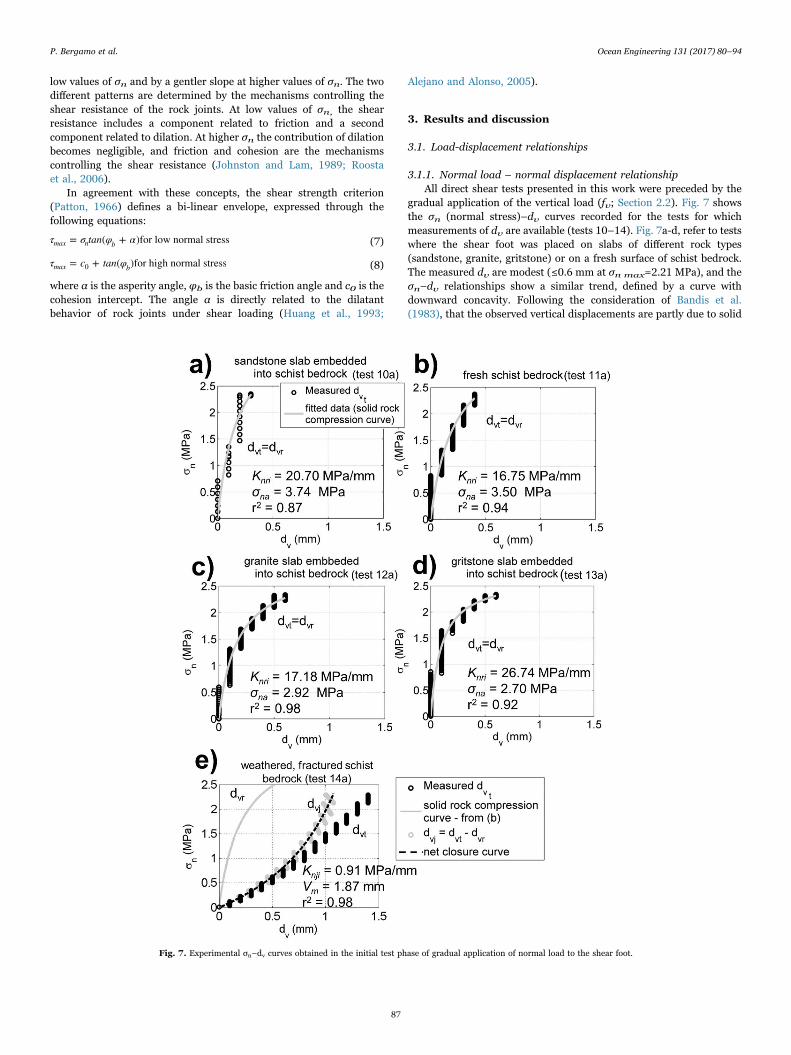
3.1.1. Normal load – normal displacement relationshipAll direct shear tests presented in this work were preceded by the
gradual application of the vertical load (fv; Section 2.2). Fig. 7 showsthe σn (normal stress)–dv curves recorded for the tests for whichmeasurements of dv are available (tests 10–14). Fig. 7a-d, refer to testswhere the shear foot was placed on slabs of different rock types(sandstone, granite, gritstone) or on a fresh surface of schist bedrock.The measured dv are modest (≤0.6 mm at σn max=2.21 MPa), and theσn–dv relationships show a similar trend, defined by a curve withdownward concavity. Following the consideration of Bandis et al.(1983), that the observed vertical displacements are partly due to solid
Fig. 7. Experimental σn–dv curves obtained in the initial test phase of gradual application of normal load to the shear foot.
P. Bergamo et al. Ocean Engineering 131 (2017) 80–94
87
rock compression and partly to closure or failure of asperities (Eq. (1)),as the rock surfaces in contact with the shear foot were relativelysmooth and flat, it was reasonably assumed that the contribution ofasperity closure to the measured deformation was negligible. Theobserved dv=dvt was, therefore, considered to be purely related tosolid rock compression (dvr); hence these data were fitted with Eq. (2)(gray lines in Fig. 7). It is worth remarking that the experimental σn-dvr curves observe the same trend defined by Kulhawy's (1975) andBandis et al.’s (1983) model (Eq. (2)), that is a hyperbola tendingtowards a horizontal asymptote. The data fitting is good, expressedhere and subsequently with the coefficient of determination, r2. Thevalues obtained for the constituent parameters of Eq. (2) (Knri andσna) lie in relatively narrow intervals (16.75–26.74 MPa/mm and2.70–3.74 MPa), suggesting similar behavior for the different config-urations of the foundation footing in solid rock compression.
In Fig. 7e, which corresponds to a test where the shear foot was incontact with weathered schist bedrock, the observed σn–dv relation-ship exhibits a different pattern (curve with upward concavity) andlarger values of vertical displacement. Considering the state of the rock,in this case the contribution of joint closure (dvj) could not beneglected, and therefore the measured dv=dvt=dvr+dvj (Eq. (1)).The dvr component in Fig. 7e was reasonably modeled using thehyperbolic curve from Fig. 7b, which refers to a test on fresh schist);gray line in Fig. 7b, also reported in Fig. 7e). The ratio between dvt anddvr at σn=1 MPa in Fig. 7e is 8, within the range of 5–30 obtained byBandis et al. (1983). Subtracting dvr from the measured displacementdvt, dvj is obtained (Eq. (1), gray circles in Fig. 7e), the componentrelated to the closure and/or failure of rock asperities. The obtainedσn–dvj graph was interpreted using the corresponding relationshipfrom Bandis et al. (1983; Eq. (3)), which defines a hyperbolic functionwith an upward concavity; this is actually the shape of the experimentalσn–dvj curve in Fig. 7e. The fitting between Eq. (3) and the experi-mental data is excellent (r2=0.98), and the resultant Vm and Kniparameters are 1.87 mm and 0.91 MPa/mm, both comparable tovalues expected for rugged and weathered rock joints according toBandis et al. (1983).
3.1.2. Shear load – shear displacement relationshipTo investigate the shear load – shear displacement behavior in all
tests for which horizontal measurements dh are available (tests 2–6and 8–14, Appendix A), the pre-peak shear load - shear displacementstage was considered from the experiments implementing a monotonicload to failure, or from the first loading path from cyclic tests (Table 2).
As shown in Fig. 8, the shear load -shear displacement curves fromdifferent tests consistently display non-linear behavior. This feature is
in agreement with experimental observations on natural rock joints, forwhich hyperbolic functions were proposed (Kulhawy, 1978; Hungr andCoates, 1978; Bandis et al., 1983). The fh–dh function introduced byKulhawy (1978; Eq. (4)) was applied to the experimental load –
displacement curves and the best fitting values of ksi (initial shearstiffness) and fha (horizontal asymptote of the curve) were determined.As shown in Fig. 8, the agreement between the hyperbolic function ofEq. (4) and the experimental data is excellent. ksi and fha, parametersdefining the shape of the fh–dh relationship, can be correlated to thequality of the coupling between the shear foot and the underlying rockor concrete surface. According to Kulhawy's (1978) and Bandis et al.(1983), planar and weathered rock joints are characterized by lowervalues of ksi and by highly nonlinear fh–dh curves (i.e. by lower valuesof parameter fha, Eq. (5)). By contrast, well interlocked, unweatheredjoints yield steeper, more linear fh–dh relationships (i.e. higher ksi andfha). Similar behavior can be traced in the load – displacementrelationships shown in Fig. 8. Figs. 8b, c both compare the fh–dhcurves for tests with the same applied normal stress and rock type, butin one case the shear foot was grouted in place, whereas in the othercase the grout was left to cure before putting the footing in place. Inboth cases, the presence of the bond ensured by the grout cured inplace resulted in a steeper and more linear fh–dh curve.
Fig. 9 displays the initial shear stiffness (ksi) and horizontalasymptote of the hyperbolic curve (fha) derived by fitting Eq. (4) tothe experimental fh–dh curves from all considered tests. The quanti-tative characterization of experimental fh–dh curves through theestimation of parameters ksi and fha is of fundamental importancewhen evaluating the shear performance of tensioned anchor founda-tions; steeper fh–dh curves imply smaller displacements at the samelevel of shear loading (hence less sliding work degrading the foundationfooting-rock coupling; Qiu and Plesha, 1991; Donohue and Bergamo,2016). The following trends in the distributions of the ksi,fha couplescan be identified in Fig. 9:
i) All factors that contribute to make the shear foot-rock/concretecoupling firmer result in an increase of ksi and/or fha. In particular,a) when only the steel frame of the shear foot is in contact with theunderlying concrete slab (red circles in Fig. 9), a 45° beveled edge(tests 3a,b,c), penetrating more easily into the concrete surface,yields higher ksi and fha as compared to a flat edge of the shear foot(tests 2a,b,c); b) an increase of the contact surface between theshear foot and rock/concrete via the filling of the foot steel framewith grout further improves the fh–dh curves (compare circles todots); c) when the grout is cast in place, i.e. when the grout exerts abond between the foot and the rock or concrete, a further increase
Fig. 8. Experimental fh–dh curves. a) fh–dh curve for a test involving the grouted shear foot superimposed to a concrete slab (test 4c), with fv0=1471 kN. No bond between the shear footand the concrete surface is present (footing not grouted in place). b) Comparison between fh–dh curves from two tests involving the grouted shear foot superimposed to a schist bedrock(tests 6 and 9a), with fv0=1471 kN. In one case the shear foot was grouted in place (hence there is a bond between the foot and the schist bedrock). In the other case no bond is present(footing grouted separately). c) Comparison between pre-peak fh–dh curves from two tests involving the grouted shear foot superimposed to a concrete slab (tests 4a and 5a), withfv0=490 kN. In one case the shear foot was grouted in place. In the other there is no bond.
P. Bergamo et al. Ocean Engineering 131 (2017) 80–94
88
of the ksi and/or fha is produced (compare circled with plain dots inFig. 9; see also Fig. 8b-c); d) when the shear foot is placed oncompact materials (gritstone, sandstone, granite, concrete) it per-forms better (higher ksi and fha) when compared to fractured andweathered rock such as schist bedrock; e) the presence of inter-locking asperities on the foot-rock/concrete contact area results ingreater ksi, fha as opposed to smooth surfaces; (compare red dotsmarked with “smooth” versus “rugged surface” labels).
ii) Given the same shear foot-rock/concrete configuration, ksi and fhagenerally increase as the applied vertical load (fv0) increases.
Feature (i) is in agreement with Kulhaway's (1978) and Bandiset al.’s (1983) observations, associating fractured and weathered rockjoints to highly nonlinear fh–dh curves, and well interlocked, unweath-ered joints to steeper and more linear fh–dh relationships.
As for the dependence of shear load – displacement relationship onthe applied normal load (ii, above), this trend is again in accordancewith the findings of Kulhawy's (1978) and Bandis et al. (1983),expressed in Eqs. (4)–(6). We applied these relationships to the testswhere shear loading paths were repeated at different levels of appliednormal stress (tests 2, 3, 4, 5), to estimate the parameters Kj, nj and Rf(Eqs. (5) and (6)), that describe the relationship between applied shear(τ=fh/A), normal stresses (σn=fv/A) and resultant horizontal displace-ments (dh). Here again, the fitting between experimental and simulatedτ-σn-dh curves was good (Fig. 10). Obtained Kj, nj lie at the lowerrange of values expected by Kulhawy (1978) and Bandis et al. (1983)from direct shear tests on rock discontinuities. Consistent with theoutcome of the same tests, Rf are comprised within 0–1, with valuesclose to 1 corresponding to highly nonlinear shear stress –displace-ment curves. Also, in agreement with Kulhawy's (1978) and Bandiset al.’s (1983) experimental observations, an improvement of the shearfoot-concrete coupling (thanks to sharper edges of the foot steel framein Fig. 10a-b, or thanks to interlocking asperities in Fig. 10c-d) resultsin an increase of Kj, nj values and a decrement of Rf (i.e. steeper τ–dhcurves).
Overall, the relationships derived from the literature have beensuccessfully applied to the load-displacement relationships observedfrom a tensioned anchor foundation placed on various types of rock
and concrete. These relationships have proven to be adequate inrepresenting (i) the normal load – normal displacement relation duringthe initial phase of gradual application of vertical load and (ii) the shearload – displacement curve in the subsequent stage of horizontalloading. This enabled changes in the shear load – displacement curvesintroduced by improvement of the foot-rock/concrete coupling to bequantified. Hence, these relationships can be proposed as a tool for theprediction of the response of tensioned anchor foundations underoperational loads as the parameters appearing in the equations (Eqs.(2)–(6)) are related to the quality and geometry of the contactingmaterials.
3.2. Failure criterion
Figs. 11a and b display the values of maximum shear load (fh max)and vertical load at the sliding failure of the shear footing. The couplesof fh, max, fv show two different trends, one for the tests where a groutlayer was added at the base of the foundation footing (Fig. 11a), andone for the tests where the steel frame of the footing was placed directlyon the rock or concrete surface, without grout (Fig. 11b). For the firstgroup of tests (Fig. 11a), the relationship between applied vertical loadand peak shear load appears to be a directly proportional. Thisbehavior suggests the prevalence of frictional and dilatant mechanismsin controlling the shear resistance of the foundation (Johnston andLam, 1989; Roosta et al., 2006), and it is well approximated by Patton's(1966) formulation of failure criterion for rock joints at low values ofnormal stress (Eq. (7)). The slope for this linear failure envelope is0.95, corresponding (Eq. (7)) to a sum of basic friction angle φb andasperity angle α equal to 44.2°, in good agreement with the value (45°)recovered by Hungr and Coates (1978) from direct shear tests onnatural rock joints. The fit between Patton's (1966) linear envelope andthe experimental data is good, with most of data points beingcomprised in a ± 25% interval. The only outlier is the failure conditionfrom test 5a, where the foundation shear foot was grouted in place andsuperimposed to a concrete slab (circled red dot in Fig. 11a). In thiscase, the bond exerted by the grout on the regular surface of theconcrete slab probably gave rise to a cohesive behavior that signifi-cantly increased the value of peak shear stress. Despite this, the general
Fig. 9. Parameters ksi and fha of the hyperbolic relation fh–dh (Eq. (4)) obtained from the analyzed shear loading paths (pre-peak shear load - shear displacement stage from theexperiments implementing a monotonic load to failure, or from the first loading path from cyclic tests). ksi, fha couples are subdivided in the three panels according to the value of normalload at the start of the shear loading path (fv0). Labels refer the name of each test. The bevel angle is included in the labels when β=90° (otherwise β=45°). Labels with “smooth” or“rugged surface” allow to appreciate the different performance of tests 4a,b,c versus 5b,c,d, otherwise characterized by the same configuration of the footing-concrete system.
P. Bergamo et al. Ocean Engineering 131 (2017) 80–94
89
Fig. 11. Maximum shear load and vertical load at the sliding failure of the shear footing. a) Maximum shear and normal loads at sliding failure for direct shear tests with a groutedfoundation footing. b) Maximum shear and normal loads at sliding failure for direct shear tests with an ungrouted foundation footing. Labels in (a) and (b) indicate the name of the testand the bevel angle if β=90°; β=45° otherwise. c) Conditions at failure from (a) and (b) expressed in terms of maximum shear and normal stresses.
Fig. 10. Shear stress – shear displacement (τ–dh) curves for different levels of applied normal stress σn. Black circles refer to experimental data; the gray lines correspond to data fittingby applying Eqs. (4)–(6). Close to each panel we report the values of Kj, nj and Rf (Eqs. (5) and (6)) that best fit the experimental data, as well as the determination coefficients r2. Valuesof normal and shear stress in panels (a) and (b) differ significantly from corresponding values in (c), (d) because the area of contact shear foot-concrete slab is different, whereas appliedloads and observed displacements are similar.
P. Bergamo et al. Ocean Engineering 131 (2017) 80–94
90
compliance to a consistent failure envelope in Fig. 11a is in agreementwith the experimental observation that mechanisms involved in theshear resistance of the shear foot-rock system, such as friction in rock-to-rock contact, depend little on lithology (Byerlee, 1978; De Blasio,2011). Indeed, the performance of the footings grouted in place (circleddots in Fig. 11a), was generally better than the tests where the groutlayer was added prior to the installation of the shear foot (plain dots inFig. 11a), with the exception of test 8. The improved behavior offeredby such footing configuration can be ascribed to the bond exerted bythe cured grout between the foundation footing and the underlyingrock surface. The bond strength improves the coupling between thefoundation and the rock; consequently, the horizontal force requiredfor shear failure is higher than the case where the grout layer is addedto the footing before its installation on the rock (in this case, there is nobond, as the grout cures separately from the rock). Even though theresults from cyclic tests highlighted a decrease of asperity angle duringthe iterative shearing process ( Donohue and Bergamo, 2016.), hencepotentially affecting the value of maximum horizontal load at failure,the number and type of tests reported in Fig. 11a were not significantfor a reliable comparison between monotonic and cyclic tests.Additionally, previous experimental studies have shown that the valueof normal stress or the shearing velocity have a greater impact on thevalue of shear stress at failure when compared to the influence ofloading/unloading cycles preceding failure of the rock joint (Jafariet al., 2003, 2004).
As for the shear tests conducted by directly placing the ungroutedsteel frame of the foundation footing on the rock or concrete surface,the horizontal loads determining sliding failure are significantly lower(compare Figs. 11a, b). Available data points can be quite wellapproximated with the Patton (1966) failure criterion at high normalstresses (Eq. (8)), suggesting both cohesion and frictional mechanismscontrol the shear resistance. The retrieved value of cohesion (209 kN,in terms of stresses c0=7.45 MPa) is high, comparable to the cohesivestrength of an average to good quality rock mass (Hoek, 2001). Thiscan be ascribed to the penetration of the steel frame of the shear foot inthe underlying concrete surface (up to 15 mm when fv≈1471 kN) forthe shear tests conducted on the concrete slab (red circles in Fig. 11b).As for the tests performed on schist (blue circles), the high value of c0 islikely to be related to interlocking between the hollow steel frame of theshear foot and the rock asperities. This interlocking/penetrationmechanism appears to have a limited dependency on the level ofvertical stress, as witnessed by the reduced slope of the failureenvelope. It is finally worth remarking that most of the values of fhmax from tests where the lower edge of the footing was beveled at 45°(tests 3a, b, c), lie in the upper portion of this interval, suggesting thegreater effectiveness of this configuration (as discussed in 3.1.2).
Fig. 11c shows the failure condition in Figs. 11a and b in terms ofshear and normal stresses at the base of the foundation footing (τmax
vs σn). The values of normal stress are distributed over two separateintervals (0.74–2.21 and 12.63–52.54 MPa) due to the two differenttesting configurations of the shear foot. When the section between thesteel frame of the shear foot and the rock surface is grouted, the appliedvertical loads are distributed over a wide area (approx. 0.665 m2) andconsequently σn values are comprised in a 0.74–2.21 MPa range. Viceversa, when only the steel frame of the shear foot is in contact with therock, the same vertical load is distributed over a much smaller area andnormal stress values are considerably higher (15–52.54 MPa).
Altogether, all data points appear to coherently follow Patton's(1966) failure criterion, which predicts linear behavior with nullcohesion intercept at low σn, while at higher normal stresses the slopeof the linear envelope is lower and a nonzero cohesion is present.
4. Conclusions
A series of direct shear tests were carried out at full scale with thepurpose of evaluating the potential of a tensioned anchor foundationsystem (designed to fasten tidal turbine devices to a rock seabed) toresist substantial shear loading. In both the testing and subsequentanalysis stages, we concentrated on the primary shear resistancemechanism of tensioned anchors. The resistance to horizontal dis-placement offered by the anchor itself, a mechanism that arises whenthe foundation footing – rock coupling has already failed, was notanalyzed. An ad-hoc experimental apparatus, comprising the tensionedanchor foundation enclosed in a testing rig for the application ofvertical and horizontal loads, was designed and installed at a test sitelocated in a schist quarry. The tests performed comprised a variety ofdifferent configurations for the foundation-rock system, different typesof rock (from weathered schist to compact rock or concrete slabs), andvarious loading paths. The horizontal and vertical load-displacementdatasets were studied with particular reference to i) the definition of acoherent load-displacement behavior, and ii) the definition of a failurecriterion for the condition of sliding failure. For both topics of study,relationships available in the literature that were developed for theanalysis of the mechanical behavior of natural rock discontinuities wereused and generally showed a good agreement with our experimentaldata, thus validating their use for the modeling of the performance oftensioned anchor foundations. In particular, i) the shear and normalload – displacement relations can be effectively modeled with hyper-bolic relations, whose mathematical parameters correlate with thearrangement of the footing-rock system and with the quality of the rockon which the foundation is installed; ii) the identified failure envelopeshows either a cohesive and frictional behavior or a frictional anddilatant behavior, depending on the configuration of the base of thefooting.
The key elements that improve the shear resistance of the founda-tion were also identified as: i) when the ungrouted steel frame of thefooting is placed on the rock, a greater shear resistance is obtained byshaping the lower edge of the shear foot with a 45° angle; ii) adding alayer grout below the foundation footing significantly increases theshear performance of the foundation; iii) adding this grout layer whenthe footing is already in place further improves the shear resistance ofthe foundation. The peak shear loads at sliding failure for monotonicand cyclic tests appeared to be relatively similar; however, due to thelack of a significant number of experiments systematically comparingmonotonic and cyclic loading paths before failure, it is not possible todraw any reliable conclusions on this topic. Additional tests and studiesregarding this subject are needed and envisaged for the future.
Acknowledgements
The work presented in this paper was part of the “Tension Piles forMarine Renewables” project funded by the Centre for AdvancedSustainable Energy (CASE), Invest Northern Ireland.
Appendix A
See Tables A1–A5.
P. Bergamo et al. Ocean Engineering 131 (2017) 80–94
91
Table
A2
Details
oftests4–5(groutedfootingplacedon
aconcreteslab
).
Test
num
ber
Footingco
nfigura
tion
Materialbelow
footing
f vatstart
oftest
(fv0)
f hloadpath
Reco
rdeddata
Failure
Test4a
Groutedfooting;
β=45
°Con
creteslab
490kN
Mon
oton
icload
increm
entto
max
.f h=34
3kN
f h,f v,dh
Yes
Test4b
Groutedfooting;
β=45
°Con
creteslab
981kN
Mon
oton
icload
increm
entto
max
.f h=78
4kN
f h,f v,dh
Yes
Test4c
Groutedfooting;
β=45
°Con
creteslab
1471
kNMon
oton
icload
increm
entto
max
.f h=11
77kN
f h,f v,dh
Yes
Test5a
Foo
tinggrou
tedin
place;β=45
°Con
creteslab
490kN
Mon
oton
icload
increm
entto
max
.f h=14
22kN
f h,f v,dh
Yes
Test5b
Groutedfooting;
β=45
°Con
creteslab
490kN
Mon
oton
icload
increm
entto
max
.f h=44
1kN
f h,f v,dh
Yes
Test5c
Groutedfooting;
β=45
°Con
creteslab
981kN
Mon
oton
icload
increm
entto
max
.f h=93
2kN
f h,f v,dh
Yes
Test5d
Groutedfooting;
β=45
°Con
creteslab
1471
kNMon
oton
icload
increm
entto
max
.f h=12
75kN
f h,f v,dh
Yes
Table
A1
Details
oftests1–3(foo
tingof
foundationconstitutedby
steelfram
eon
ly).
Test
num
ber
Footingco
nfigura
tion
Materialbelow
footing
f vatstart
oftest
(fv0)
f hloadpath
Reco
rdeddata
Failure
Test1a
Steelfram
eon
ly;β=
90°
Schistbe
drock
883kN
Mon
oton
icload
increm
entto
max
.f h=45
1kN
f h,f v
Yes
Test1b
Steelfram
eon
ly;β=
90°
Schistbe
drock
1177
kNMon
oton
icload
increm
entto
max
.f h=34
3kN
f h,f v
Yes
Test1c
Steelfram
eon
ly;β=
90°
Schistbe
drock
1471
kNMon
oton
icload
increm
entto
max
.f h=45
1kN
f h,f v
Yes
Test2a
Steelfram
eon
ly;β=
90°
Con
creteslab
490kN
Mon
oton
icload
increm
entto
max
.f h=22
1kN
f h,f v,dh
Yes
Test2b
Steelfram
eon
ly;β=
90°
Con
creteslab
981kN
Mon
oton
icload
increm
entto
max
.f h=36
8kN
f h,f v,dh
Yes
Test2c
Steelfram
eon
ly;β=
90°
Con
creteslab
1471
kNMon
oton
icload
increm
entto
max
.f h=49
0kN
f h,f v,dh
Yes
Test3a
Steelfram
eon
ly;β=
45°
Con
creteslab
490kN
Mon
oton
icload
increm
entto
max
.f h=29
4kN
f h,f v,dh
Yes
Test3b
Steelfram
eon
ly;β=
45°
Con
creteslab
981kN
Mon
oton
icload
increm
entto
max
.f h=34
3kN
f h,f v,dh
Yes
Test3c
Steelfram
eon
ly;β=
45°
Con
creteslab
1471
kNMon
oton
icload
increm
entto
max
.f h=39
2kN
f h,f v,dh
Yes
P. Bergamo et al. Ocean Engineering 131 (2017) 80–94
92
Table
A3
Details
oftests6–10
(groutedfootingplacedon
schistbe
drock).
Test
num
ber
Footingco
nfigura
tion
Materialbelow
footing
f vatstart
oftest
(fv0)
f hloadpath
Reco
rdeddata
Failure
Test6
Groutedfooting;
β=45
°Sc
histbe
drock
1471
kN9unidirection
alcycles
max
.f h=49
0kN
f h,f v,dh
No
Test7
Foo
tinggrou
tedin
place;β=45
°Sc
histbe
drock
1471
kNMon
oton
icload
increm
entto
max
.f h=10
30kN
f h,f v
Yes
Test8
Foo
tinggrou
tedin
place;β=90
°Sc
histbe
drock
1422
kNMon
oton
icload
increm
entto
max
.f h=12
75kN
f h,f v
dh
Yes
Test9a
Foo
tinggrou
tedin
place;β=90
°Sc
histbe
drock
1471
kN5unidirection
alcycles
max
.f h=49
0f h,f v
dh
No
Test9b
Foo
tinggrou
tedin
place;β=90
°Sc
histbe
drock
1471
kNMon
oton
icload
increm
entto
max
.f h=16
80kN
f h,f v
dh
Yes
Test10
aFoo
tinggrou
tedin
place;β=45
°Sc
histbe
drock
1471
kN5bidirection
alload
ingcycles,max
.|fh|=
735kN
f h,f v
dh,dv
No
Test10
bFoo
tinggrou
tedin
place;β=45
°Sc
histbe
drock
1471
kN3bidirection
alload
ingcycles,max
.|fh|=
981kN
f h,f v
dh,dv
No
Test10
cFoo
tinggrou
tedin
place;β=45
°Sc
histbe
drock
1471
kN3bidirection
alload
ingcycles,max
.|fh|=
981–
1716
kNf h,f v
dh,dv
No
Table
A4
Details
oftests11
–13
(groutedfootingplacedva
riou
srock
materials).
Test
num
ber
Footingco
nfigura
tion
Materialbelow
footing
f vatstart
oftest
(fv0)
f hloadpath
Reco
rdeddata
Failure
Test11
aFoo
tinggrou
tedin
place;β=
45°
Sandston
eslab
1471
kN5bidirection
alload
ingcycles,max
.|fh|=
735kN
f h,f v
dh,dv
No
Test11
bFoo
tinggrou
tedin
place;β=
45°
Sandston
eslab
1471
kN2bidirection
alload
ingcycles,max
.|fh|=
981kN
f h,f v
dh,dv
No
Test11
cFoo
tinggrou
tedin
place;β=
45°
Sandston
eslab
1471
kN4bidirection
alload
ingcycles,max
.|fh|=
1177
–12
16kN
f h,f v
dh,dv
Yes
Test12
aFoo
tinggrou
tedin
place;β=
45°
Graniteslab
1471
kN5bidirection
alload
ingcycles,max
.|fh|=
735kN
f h,f v
dh,dv
No
Test12
bFoo
tinggrou
tedin
place;β=
45°
Graniteslab
1471
kN2bidirection
alload
ingcycles,max
.|fh|=
981kN
f h,f v
dh,dv
No
Test13
aFoo
tinggrou
tedin
place;β=
45°
Griston
eslab
1471
kN5bidirection
alload
ingcycles,max
.|fh|=
735kN
f h,f v
dh,dv
No
Test13
bFoo
tinggrou
tedin
place;β=
45°
Griston
eslab
1471
kN3bidirection
alload
ingcycles,max
.|fh|=
981kN
f h,f v
dh,dv
No
Test13
cFoo
tinggrou
tedin
place;β=
45°
Griston
eslab
1471
kN4bidirection
alload
ingcycles,max
.|fh|=
1177
–16
67kN
f h,f v
dh,dv
Yes
P. Bergamo et al. Ocean Engineering 131 (2017) 80–94
93
References
Abhinav, K.A., Saha, N., 2015. Coupled hydrodynamic and geotechnical analysis of jacketoffshore wind turbine. Soil Dyn. Earthq. Eng. 73, 66–79.
Alejano, L.R., Alonso, E., 2005. Considerations of the dilatancy angle in rocks and rockmasses. Int. J. Rock Mech. Min. Sci. 42, 481–507.
Bandis, S.C., 1980. Experimental Studies of Scale Effects on Shear Strength andDeformation of Rock Joints (Ph.D. thesis). University of Leeds, UK.
Bandis, S.C., Lumsden, A.C., Barton, N.R., 1983. Fundamentals of rock jointdeformation. Int. J. Rock Mech. Min. Sci. Geomech. Abstr. 20 (6), (249 268).
Barton, N., 1973. Review of a new shear strength criterion for rock joints. Q. J. Eng. Geol.7, 287–332.
Bhattacharya, S., Cox, J.A., Lombardi, D., Wood, D.M., 2012. Dynamics of offshore windturbines supported on two foundations. Geotech. Eng. 166 (GE2), 159–169.
de Blasio, F.V., 2011. Introduction to the Physics of Landslide. Springer Publishing, NewYork.
BS EN 14199, 2015. Execution of Special Geotechnical Works –Micropiles. BSI, London.BS EN 14490, 2010. Execution of Special Geotechnical Works - Soil Nailing. BSI,
London.Byerlee, J., 1978. Friction of rocks. Pure Appl. Geophys. 116 (4), 615–626.Byrne, B.W., Houlsby, 2003. Foundations for offshore wind turbines. Philos. Trans. R.
Soc. Lond. A 361, 2909–2930.Callan, D., McCarey J., Holland A., 2012. A System and Method for the Installation of
Underwater Foundations. Patent No. WO/2012/123431.Donohue, S., Bergamo, P., 2016. Assessing the full-scale performance of tension pile
foundations under monotonic and cyclic shearing using direct shear tests. In:Proceedings of the 2nd International Conference on Offshore Renewable Energy(CORE 2016), ASRANet, Glasgow, UK.
EMEC, 2016. the European Marine Energy Centre Ltd. ⟨http://www.emec.org.uk/⟩(accessed 15.01.16.).
Eurocode 7, BS EN 1997, 1997. Eurocode 7: Geotechnical Design. BSI, London.European Committee for Standardization, 2000. EN 206-1 Concrete - Part 1:
Specification, Performance, Production and Conformity. CEN, Brussels.Gu, X.F., Haberfield, C.M., 2004. Laboratory investigation of shaft resistance for piles
socketed in Basalt. Int. J. Rock Mech. Min. Sci. 41 (3), 465.Hoek, E., 2001. Rock mass properties in underground mines. In: Hustrulid, W.A.,
Bullock, R.L. (Eds.), Underground Mining Methods: Engineering Fundamentals andInternational Case Studies. Society for Mining, Metallurgy, and Exploration (SME),Litleton, Colorado.
Hoek, E., Brown, E.T., 1980. Empirical strength criterion for rock masses. J. Geotech.Eng. Div. 106 (GT9), 1013–1035.
Huang, X., Haimson, B.C., Plesha, M.E., Qiu, X., 1993. An investigation of the mechanicsof rock joints – Part I laboratory investigation. Int. J. Rock Mech. Min. Sci. Geomech.Abstr. 30 (3), 257–269.
Hungr, O., Coates, D.F., 1978. Deformability of joints and its relation to rock foundationsettlements. Can. Geotech. J. 15, 239–249.
IEA – RETD, 2012. International Energy Authority Renewable Energy TechnologyDeployment: Offshore Renewable Energy. Routledge, London.
Jaeger, J.C., 1971. Friction of rocks and stability of rock slopes. Geotechnique 21 (2),97–134.
Jafari, M.K., Pellet, F., Boulon, M., Amini Hosseini, K., 2004. Experimental study ofmechanical behaviour of rock joints under cyclic loading. Rock Mech. Rock Eng. 37(1), 3–23.
Jafari, M.K., Hosseini, K.A., Peller, F., Boulon, M., Buzzi, O., 2003. Evaluation of theshear strength of rock joints subjected to cyclic loading. Soil Dyn. Earthq. Eng. 23,619–630.
Jeffcoate, P., Starzmann, R., Elsaesser, B., Scholl, S., Bischoff, S., 2015. Fieldmeasurements of a full scale tidal turbine. Int. J. Mar. Energy 12, 3–20.
de Jesus Henriques, T.A., Tedds, S.C., Botsari, A., Najafian, G., Hedges, T.S., Sutcliffe,C.J., Owen, I., Poole, R.J., 2014. The effects of wave-current interaction on theperformance of a model horizontal axis turbine. Int. J. Mar. Energy 8, 17–35.
Johnston, I.W., Lam, 1989. Shear behaviour of regular triangular concrete/rock joints –analysis. J. Geotech. Eng. 115 (5), 711–727.
Kulhawy, F.H., 1975. Stress deformation properties of rock and rock discontinuities. Eng.Geol. 9, 327–350.
Kulhawy, F.H., 1978. Geomechanical model for rock foundation settlement. J. Geotech.Eng. Div. 104 (GT2), 211–225.
Meggitt, D.J., Jackson, E., Machin, J., Taylor, R., 2013. Marine micropile anchor systemsfor marine renewable energy applications. In: Proceedings of the Oceans Conference,SanDiego, pp.1–7.
Patton, F.D., 1966. Multiple modes of shear failure in rocks. In: Proceedings of FirstCongress of International Society of Rock Mechanics, vol. 1, pp. 509–513.
Qiu, X., Plesha, M.E., 1991. A theory for dry wear based on energy. J. Tribol. 113,442–451.
Renewable UK, 2013. Wave and Tidal Energy in the UK. Renewable UK, London.Roosta, R.M., Sadaghiani, M.H., Pak, A., Saleh, Y., 2006. Rock joint modelling using
visco-plastic multilaminate model at constant normal load condition. Geotech. Geol.Eng. 24, 1449–1468.
Scotenewables, 2016. ⟨http://www.scotrenewables.com/⟩ (accessed 19.01.16.).Serrano, A., Olalla, C., 2004. Shaft resistance of a pile embedded in rock. Int. J. Rock
Mech. Min. Sci. 41, 21–35.Serrano, A., Olalla, C., 2006. Shaft resistance piles in rock: comparison between in situ
test data and theory using the Hoek and Brown failure criterion. Int. J. Rock Mech.Min. Sci. 43, 826–830.
DETINI, Department of Enterprise, Trade and Investment of Northern Ireland, 2009.Offshore Renewable Energy Strategic Action Plan. Department of Enterprise, Tradeand Investment, Belfast, 2012–2020.
Tiwari, P., Chandak, R., Yadav, R.K., 2014. Effect of salt water on compressive stength ofconcrete. J. Eng. Res. Appl. 4 (4), 38–42.
UK Government, 2003. Energy White Paper: Our Energy Future - Creating a Low CarbonEconomy. Department of Trade and Industry, (available at)⟨http://webarchive.nationalarchives.gov.uk/+/http:/www.berr.gov.uk/files/file10719.pdf⟩.
Whittaker, T., Collier D., Folley M., Henry A., Crowley M., 2007. The development ofoyster-a shallow water surging energy converter. In: Proceedings of the 7thEuropean Wave and Tidal Energy Conference, Porto, Portugal, 2007.
Table A5Details of test 14 (long term, cyclic loading tests on schist bedrock).
Test number Footing configuration Material belowfooting