Evaluation of Gap-filled SLC-OFF Imagery for Burn Severity Mapping Prepared by Randy McKinley, SAIC, May 2004 USGS EROS Data Center, Sioux Falls, SD Background: Satellite-derived burn severity maps are increasingly used to assess the effect of fires upon the landscape. Emergency response burn severity maps are used by Burned Area Emergency Response teams to plan mitigation efforts in order to reduce erosion and protect down stream water resources and infrastructure. They have a very short time frame (1-2 weeks) in which to finalize a burn severity map and make final recommendations in a formal report. Therefore, satellite imagery is acquired as soon as possible after the fire is contained or declared out. In the context of using gap-filled SLC-OFF imagery, this time constraint precludes the prospect of waiting for a subsequent acquisition to fill the gaps. Extended assessment burn severity maps are compiled using imagery acquired during the following growing season. The rationale is to allow time for the vegetation to exhibit signs of survival or delayed mortality. The non-emergency nature of the extended assessment permits the prospect of waiting for the acquisition of an appropriate gap-filling scene. Likewise, retrospective or otherwise non-emergency initial assessments have the opportunity to look for a gap-filling scene. This evaluation focused upon non-emergency burn severity mapping, however, some findings have relevance to emergency response mapping. The burn mapping methodology used for this analysis compares pre-fire and post-fire images to assess the effects of the fire on the landscape.
Transcript
Evaluation of Gap-filled SLC-OFF Imagery for Burn Severity Mapping Prepared by Randy McKinley, SAIC, May 2004 USGS EROS Data Center, Sioux Falls, SD Background: Satellite-derived burn severity maps are increasingly used to assess the effect of fires upon the landscape. Emergency response burn severity maps are used by Burned Area Emergency Response teams to plan mitigation efforts in order to reduce erosion and protect down stream water resources and infrastructure. They have a very short time frame (1-2 weeks) in which to finalize a burn severity map and make final recommendations in a formal report. Therefore, satellite imagery is acquired as soon as possible after the fire is contained or declared out. In the context of using gap-filled SLC-OFF imagery, this time constraint precludes the prospect of waiting for a subsequent acquisition to fill the gaps. Extended assessment burn severity maps are compiled using imagery acquired during the following growing season. The rationale is to allow time for the vegetation to exhibit signs of survival or delayed mortality. The non-emergency nature of the extended assessment permits the prospect of waiting for the acquisition of an appropriate gap-filling scene. Likewise, retrospective or otherwise non-emergency initial assessments have the opportunity to look for a gap-filling scene. This evaluation focused upon non-emergency burn severity mapping, however, some findings have relevance to emergency response mapping. The burn mapping methodology used for this analysis compares pre-fire and post-fire images to assess the effects of the fire on the landscape.
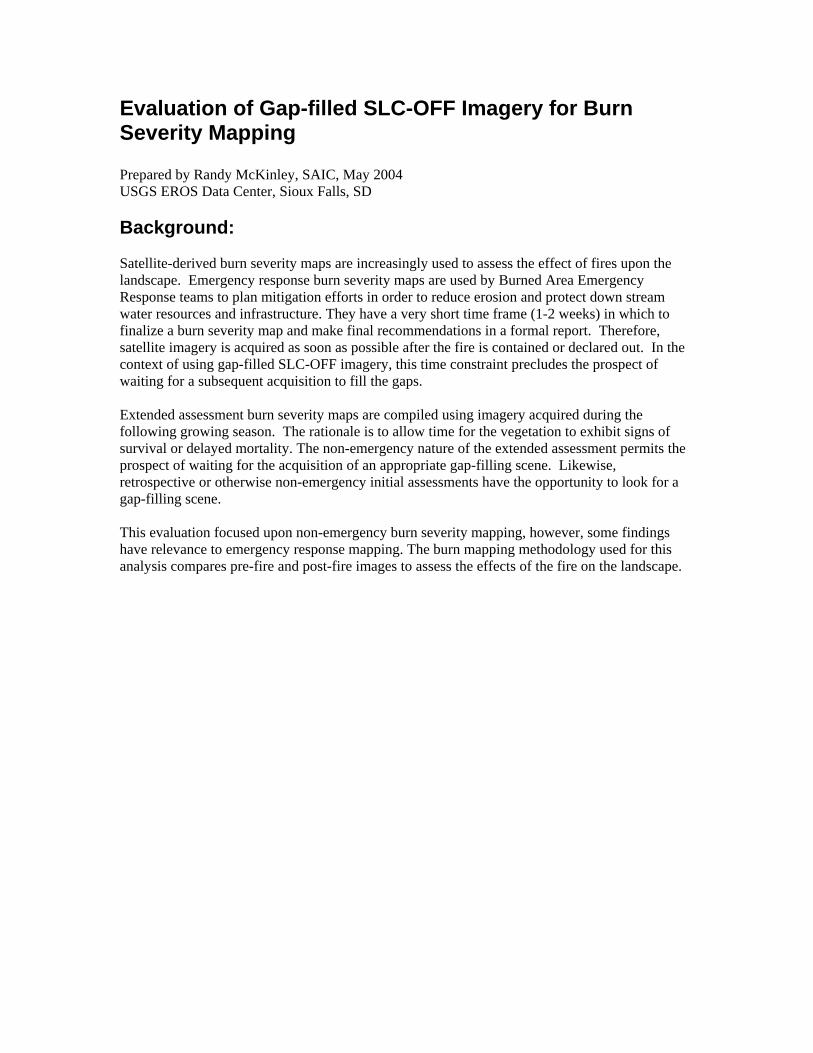
Figure 1. Landsat 7, Path/Row 41/36. Biscuit fire is reddish pink area at top of scene.
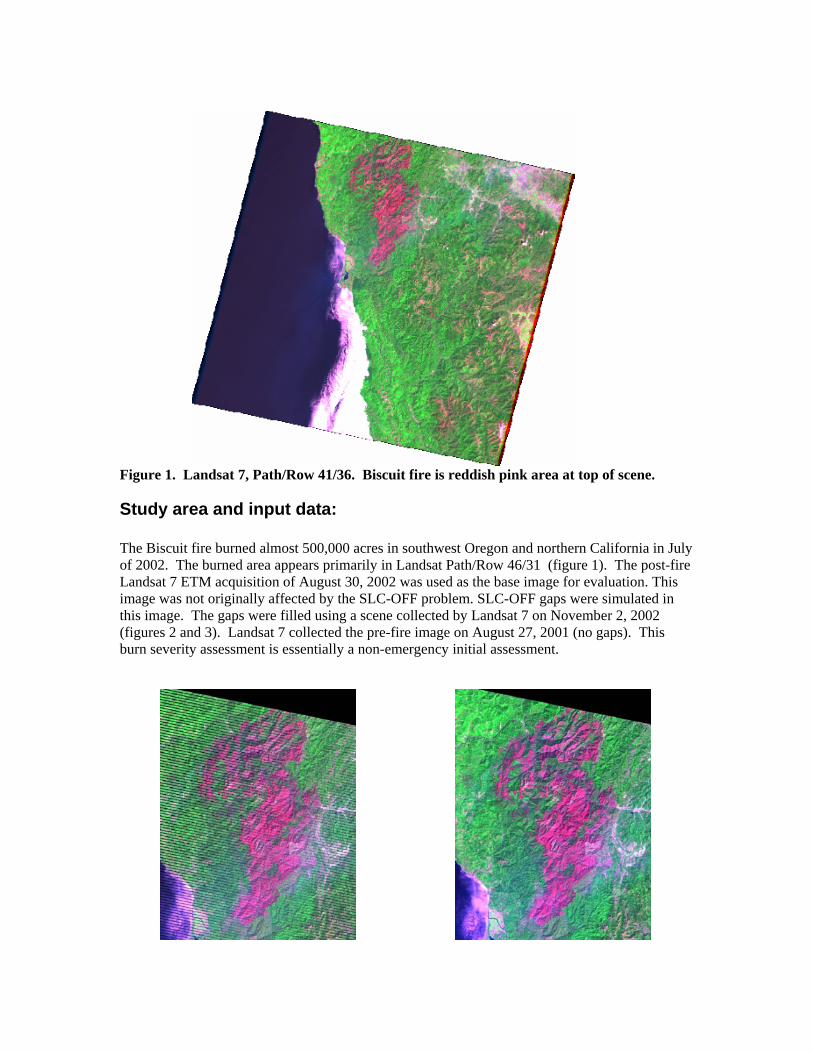
Study area and input data: The Biscuit fire burned almost 500,000 acres in southwest Oregon and northern California in July of 2002. The burned area appears primarily in Landsat Path/Row 46/31 (figure 1). The post-fire Landsat 7 ETM acquisition of August 30, 2002 was used as the base image for evaluation. This image was not originally affected by the SLC-OFF problem. SLC-OFF gaps were simulated in this image. The gaps were filled using a scene collected by Landsat 7 on November 2, 2002 (figures 2 and 3). Landsat 7 collected the pre-fire image on August 27, 2001 (no gaps). This burn severity assessment is essentially a non-emergency initial assessment.
Figure 2. Simulated gaps Gap-filled
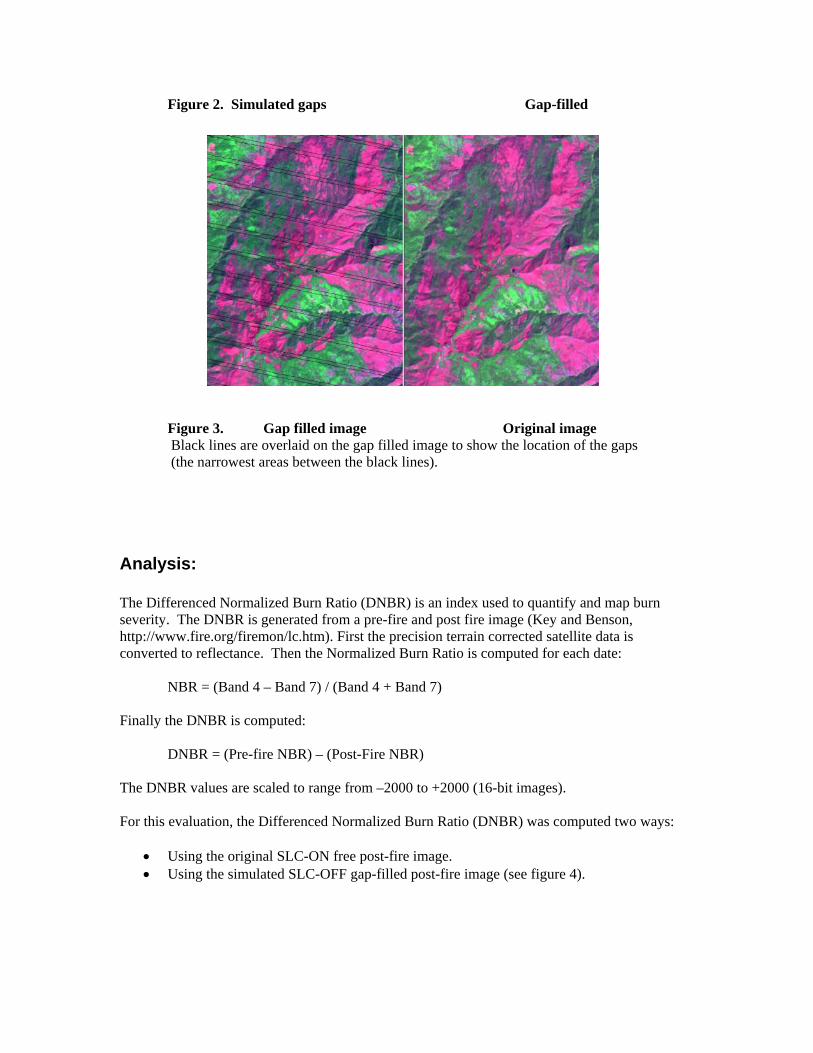
Figure 3. Gap filled image Original image re filled image show
Analysis:
he Differenced Normalized Burn Ratio (DNBR) is an index used to quantify and map burn
NBR = (Band 4 – Band 7) / (Band 4 + Band 7)
inally the DNBR is computed:
DNBR = (Pre-fire NBR) – (Post-Fire NBR)
he DNBR values are scaled to range from –2000 to +2000 (16-bit images).
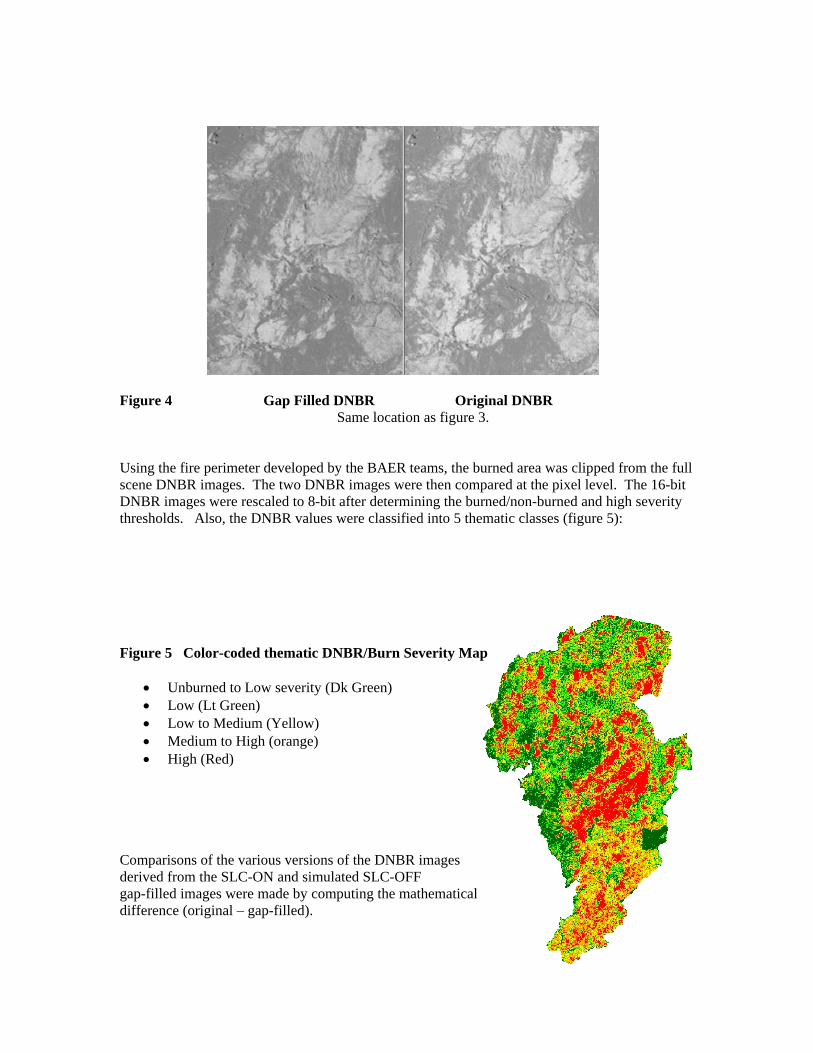
or this evaluation, the Differenced Normalized Burn Ratio (DNBR) was computed two ways:
• Using the original SLC-ON free post-fire image. image (see figure 4).
Black lines a overlaid on the gap to the location of the gaps (the narrowest areas between the black lines).
Tseverity. The DNBR is generated from a pre-fire and post fire image (Key and Benson, http://www.fire.org/firemon/lc.htm). First the precision terrain corrected satellite data is converted to reflectance. Then the Normalized Burn Ratio is computed for each date:
F
T F
• Using the simulated SLC-OFF gap-filled post-fire
Figure 4 Gap Filled DNBR Original DNBR Same location as figure 3. Using the fire perimeter developed by the BAER teams, the burned area was clipped from the full scene DNBR images. The two DNBR images were then compared at the pixel level. The 16-bit DNBR images were rescaled to 8-bit after determining the burned/non-burned and high severity thresholds. Also, the DNBR values were classified into 5 thematic classes (figure 5): Figure 5 Color-coded thematic DNBR/Burn Severity Map
• Unburned to Low severity (Dk Green) • Low (Lt Green) • Low to Medium (Yellow) • Medium to High (orange) • High (Red)
Comparisons of the various versions of the DNBR images derived from the SLC-ON and simulated SLC-OFF gap-filled images were made by computing the mathematical difference (original – gap-filled).
Results:
• 7.45 percent of the total burned area was affected by the gaps • If Biscuit fire had occurred at the western edge of the scene, 31.28 percent of the fire
would have been affected by the gaps. • If it had occurred at the eastern edge of the scene, 33.34 percent of the fire would have
been affected by the gaps 16 Bit DNBR comparison
• 1.79 percent of the DNBR pixel values in the gaps were the same as the original DNBR image
• DNBR differences in the gaps ranged from –1007 to1030 • The mean DNBR difference was –0.093 with a Std. Dev. of 23.775
For purposes of field validation of DNBR values, the validation team tries to sample areas where the DNBR values in a 3x3 pixel block are relatively homogenous. The team limits sampling to 3x3 pixel blocks where the range of DNBR values is 75 counts (sometimes 100) or less. On that basis, the following results were obtained:
• 69.33 percent of the DNBR pixel values in the gaps were within 75 points of the original DNBR values
• 79.93 percent of the DNBR pixel values in the gaps were within 100 points of the original DNBR values.
8 Bit DNBR comparison A rescaled DNBR product is typically delivered to BAER teams to facilitate image processing and display with less sophisticated image processing software. The original DNBR values were rescaled to 8-bit as follows:
DNBR <= 100 is rescaled to 20 DNBR > 100 and DNBR <= 660 are rescaled: (.4107 * DNBR) - 21 DNBR > 660 is rescaled to 250
• 35.66 percent of the rescaled DNBR pixel values in the gaps were the same as the
original DNBR image pixel values • Rescaled DNBR differences in the gaps ranged from –230 to +230 • The mean difference was –0.070 with a Std. Dev. of 8.596
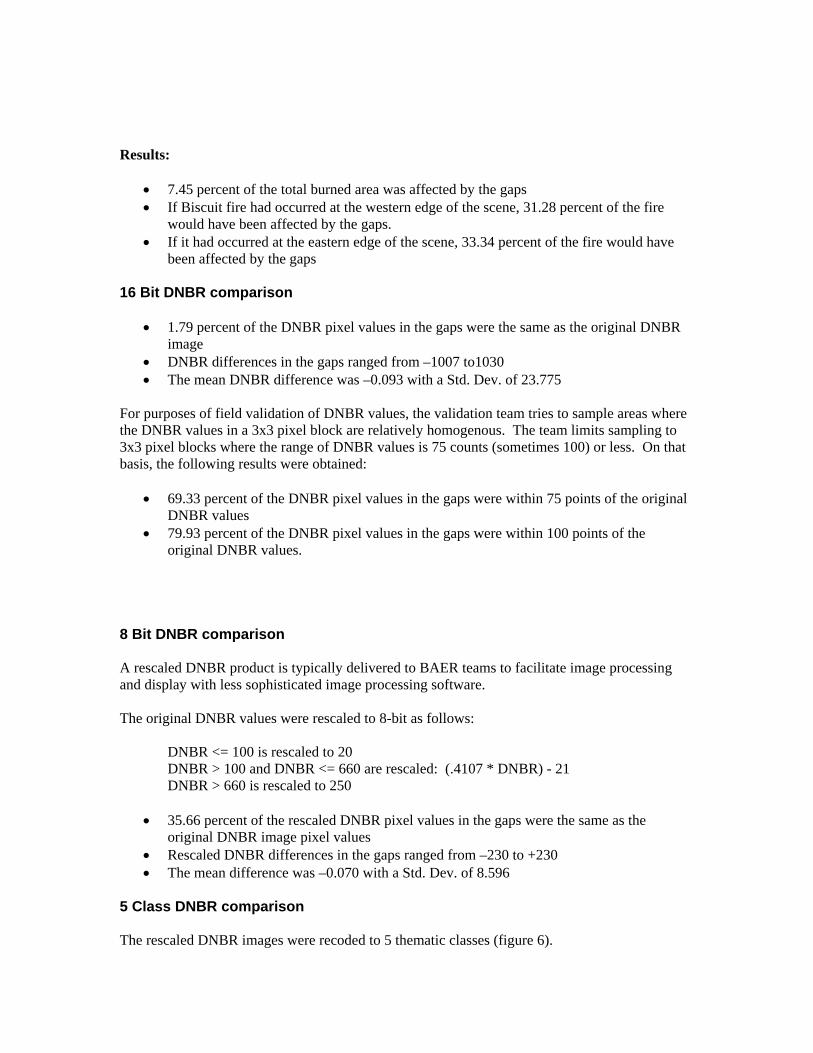
5 Class DNBR comparison The rescaled DNBR images were recoded to 5 thematic classes (figure 6).
Figure 6. Gap Filled Original In terms of the original DNBR values, the class thresholds were: Unburned to low severity: DNBR <= 100 Low DNBR > 100 and <= 248 Low to Medium DNBR > 248 and <= 433 Medium to High DNBR > 433 and <= 660 High DNBR > 660
• 68.96 percent of thematic pixels in the gaps were the same as the original thematic image The original 5 class thematic map was overlaid on the 16-bit DNBR difference image (DNBR original – DNBR gap filled) and summary statistics generated for each thematic class. For the entire burned area:
• Over 97 percent of EACH thematic class was unchanged or within 75 DNBR points of the original DNBR values (typically 91 % unchanged and 6 % within 75 points).
Discussion and Conclusion: Depending upon where a fire occurs within the scene (near the center vs. near the edge) has a large impact upon how much of the burned area is affected by gaps. In this case the fire was near
the center of the scene and only 7.45 percent of the burned area was affected by the scanline gaps. If the fire had occurred at the very edge of the scene, then the affected area would have exceeded 30 percent. If no other suitable sensor data are available, the BAER teams should still be able to use SLC-off imagery for emergency response. When looking at broad burn patterns on the landscape in order to prioritize mitigation efforts, the gaps should be little more than an aesthetic annoyance. The gaps are not big enough to obscure significant burn patterns and thus call into question the recommendations of the BAER team or jeopardize the mitigation efforts. This should be especially true of large fires such as the Biscuit. Not to long ago, BAER teams hand-sketched polygons on topographic maps while flying in helicopters or fixed wing aircraft to in order to produce burn severity maps. The scene selected to fill the gaps was acquired over two months after the initial scene. This investigator would have chosen the scene that was acquired only a month after the initial (October 1, 2002). There are a few clouds in the October scene that cover the burn area but it is believed that overall, the gap-filled data would have been improved by using a scene that more closely matched the illumination geometry of the initial scene. It is recommended that the end user be responsible for selecting the scene to be used for filling the scan gaps. Almost 70 percent of the per-pixel differences in the gap filled areas were within 75 DNBR points of the original value. Ninety seven percent of the total burned area showed no difference or was within 75 DNBR points of the original value. Thus the various analysis scenarios demonstrate that the gap-filled product is well suited for non-emergency burn severity assessment mapping.