6018 r2010 American Chemical Society pubs.acs.org/EF Energy Fuels 2010, 24, 6018–6033 : DOI:10.1021/ef100930m Published on Web 11/04/2010 Evaluation of Gas Production Potential from Marine Gas Hydrate Deposits in Shenhu Area of South China Sea Gang Li, † George J. Moridis, ‡ Keni Zhang, ‡ and Xiao-Sen Li* ,† † Key Laboratory of Renewable Energy and Gas Hydrate, Guangzhou Institute of Energy Conversion, Chinese Academy of Sciences, Guangzhou 510640, P. R. China, and ‡ Lawrence Berkeley National Laboratory, 1 Cyclotron Road, MS 90-1116, Berkeley, California 94720, United States Received July 21, 2010. Revised Manuscript Received September 17, 2010 The Shenhu Area is located in the Pearl River Mouth Basin, the northern continental slope of the South China Sea. In 2007, gas hydrate samples were recovered during the scientific expedition conducted by the China Geological Survey in the area. Using numerical simulation and currently available data from site measurements, including the water depth, thickness of the hydrate-bearing layer (HBL), sediment porosity, salinity, and pressures and temperatures at key locations, we developed preliminarily estimates of the production potential of these hydrates as gas-producing resource. We used measurements of ambient temperature in the sediments to determine the local geothermal gradient. Evidence from this and other field studies showed that the initial pressure distribution followed the hydrostatic gradient. Direct measure- ments from core samples provided estimates of the initial hydrate saturation and of the intrinsic permeabilities in the various strata of the system. The hydrate accumulations in the Shenhu Area appear to be hydrate deposits involving a single HBL within fine-textured sediments and boundaries (overburden and underburden layers) which have the same intrinsic permeabilities with the HBL. We investigated gas production from the Shenhu hydrates by means of depressurization and thermal stimulation using a single horizontal well placed in the middle of the HBL. The simulation results indicated that the hydrates dissociate along cylindrical interfaces around the well and along horizontal dissociation interfaces at the top and bottom of the HBL. Production is invariably lower than that attainable in a confined system, and thermal stimulation is shown to affect only a limited region around the well. The sensitivity analysis demonstrates the dependence of production on the level of depressurization, the initial hydrate saturation, the intrinsic permeability of the HBL, the temperature of the well, and the initial temperature of the HBL. A general observation is that gas production is low and is burdened with significant water production, making the hydrate accumulations at the Shenhu Area unattractive production targets with current technology. 1. Introduction 1.1. Background. Natural gas hydrates (NGH) are solid, nonstoichiometric compounds formed by host water mole- cules with small guest molecules, such as CH 4 ,C 2 H 6 ,C 3 H 8 , CO 2 ,H 2 S, etc. 1 Natural gas hydrate deposits involve mainly CH 4 and occur in the permafrost and in deep ocean sediment, where the necessary conditions of low temperature and high pressure exist for hydrate stability. Recent seismic explora- tions and geological researches show that natural gas hy- drates existing in the sediment constitute a large natural gas reservoir that invites consideration as a potential stra- tegic energy resource. 2,3 Techniques for gas production from hydrate deposit are based on three major dissociation prin- ciples, i.e., (1) depressurization, 4-6 involving a pressure P decrease below the dissociation pressure at a given tempera- ture T of the hydrate; (2) thermal stimulation, 7-9 involving raising T above the dissociation temperature at a given P of the hydrate; (3) inhibitor effects, 10 based on the use of chemicals, such as salts and alcohols to shift the hydrate P-T equilibrium. Among these possible methods for hydrate *To whom correspondence should be addressed. Telephone: þ86 20 87057037. Fax: þ86 20 87057037. E-mail: [email protected]. (1) Sloan, E. D.; Koh, C. A. Clathrate Hydrates of Natural Gases, 3rd ed.; CRC Press: Boca Raton, FL, 2008. (2) Collett, T. S. Gas hydrates as a future energy resource. Geotimes 2004, 49 (11), 24–27. (3) Klauda, J. B.; Sandler, S. I. Global Distribution of Methane Hydrate in Ocean Sediment. Energy Fuels 2005, 19 (2), 459–470. (4) Ahmadi, G.; Ji, C. A.; Smith, D. H. Production of natural gas from methane hydrate by a constant downhole pressure well. Energy Convers. Manage. 2007, 48 (7), 2053–2068. (5) Moridis, G. J.; Kowalsky, M. B.; Pruess, K. Depressurization- induced gas production from class 1 hydrate deposits. SPE Reservoir Eval. Eng. 2007, 10 (5), 458–481. (6) Li, G.; Li, X. S.; Chen, Q.; Chen, Z. Y. Numerical Studies of Gas Production from Gas hydrate zone in Shenhu Area, South China Sea. Acta Chim. Sin. 2010, 68 (11), 1083–1092. (7) Li, G.; Tang, L. G.; Huang, C.; Feng, Z.; Fan, S. S. Thermo- dynamic evaluation of hot brine stimulation for natural gas hydrate dissociation. J. Chem. Ind. Eng. (China) 2006, 57 (9), 2033– 2038. (8) Li, G.; Li, X. S.; Tang, L. G.; Li, Q. P. Control Mechanisms for Methane Hydrate Production by Thermal Stimulation. In The 6th International Conference on Gas Hydrate, Vancouver, British Columbia, Canada, 2008; Paper 5783. (9) Li, G.; Moridis, G. J.; Zhang, K.; Li, X. S. The Use of Huff and Puff Method in a Single Horizontal Well in Gas Production from Marine Gas Hydrate Deposits in the Shenhu Area of the South China Sea. In 2010 SPE International Oil & Gas Conference & Exhibition in China, Beijing, China, 2010; Paper 131160. (10) Li, G.; Li, X. S.; Tang, L. G.; Zhang, Y. Experimental investiga- tion of production behavior of methane hydrate under ethylene glycol stimulation in unconsolidated sediment. Energy Fuels 2007, 21 (6), 3388– 3393.
Transcript
6018r 2010 American Chemical Society pubs.acs.org/EF
Energy Fuels 2010, 24, 6018–6033 : DOI:10.1021/ef100930mPublished on Web 11/04/2010
Evaluation of Gas Production Potential from Marine Gas Hydrate Deposits in
Shenhu Area of South China Sea
Gang Li,† George J. Moridis,‡ Keni Zhang,‡ and Xiao-Sen Li*,†
†Key Laboratory of Renewable Energy and Gas Hydrate, Guangzhou Institute of Energy Conversion, Chinese Academy ofSciences, Guangzhou 510640, P. R. China, and ‡Lawrence Berkeley National Laboratory, 1 Cyclotron Road, MS 90-1116,
Berkeley, California 94720, United States
Received July 21, 2010. Revised Manuscript Received September 17, 2010
The Shenhu Area is located in the Pearl River Mouth Basin, the northern continental slope of the SouthChina Sea. In 2007, gas hydrate samples were recovered during the scientific expedition conducted by theChina Geological Survey in the area. Using numerical simulation and currently available data from sitemeasurements, including the water depth, thickness of the hydrate-bearing layer (HBL), sedimentporosity, salinity, and pressures and temperatures at key locations, we developed preliminarily estimatesof the production potential of these hydrates as gas-producing resource.Weusedmeasurements of ambienttemperature in the sediments to determine the local geothermal gradient. Evidence from this and other fieldstudies showed that the initial pressure distribution followed the hydrostatic gradient. Direct measure-ments from core samples provided estimates of the initial hydrate saturation and of the intrinsicpermeabilities in the various strata of the system. The hydrate accumulations in the Shenhu Area appearto be hydrate deposits involving a single HBL within fine-textured sediments and boundaries (overburdenand underburden layers) which have the same intrinsic permeabilities with the HBL. We investigated gasproduction from the Shenhu hydrates bymeans of depressurization and thermal stimulation using a singlehorizontal well placed in the middle of the HBL. The simulation results indicated that the hydratesdissociate along cylindrical interfaces around the well and along horizontal dissociation interfaces at thetop and bottom of the HBL. Production is invariably lower than that attainable in a confined system, andthermal stimulation is shown to affect only a limited region around the well. The sensitivity analysisdemonstrates the dependence of production on the level of depressurization, the initial hydrate saturation,the intrinsic permeability of the HBL, the temperature of the well, and the initial temperature of the HBL.A general observation is that gas production is low and is burdened with significant water production,making the hydrate accumulations at the Shenhu Area unattractive production targets with currenttechnology.
1. Introduction
1.1. Background. Natural gas hydrates (NGH) are solid,nonstoichiometric compounds formed by host water mole-cules with small guest molecules, such as CH4, C2H6, C3H8,CO2, H2S, etc.
1 Natural gas hydrate deposits involve mainlyCH4 andoccur in the permafrost and in deep ocean sediment,where the necessary conditions of low temperature and highpressure exist for hydrate stability. Recent seismic explora-tions and geological researches show that natural gas hy-drates existing in the sediment constitute a large naturalgas reservoir that invites consideration as a potential stra-tegic energy resource.2,3 Techniques for gas production from
hydrate deposit are based on three major dissociation prin-ciples, i.e., (1) depressurization,4-6 involving a pressure Pdecrease below the dissociation pressure at a given tempera-ture T of the hydrate; (2) thermal stimulation,7-9 involvingraising T above the dissociation temperature at a given P ofthe hydrate; (3) inhibitor effects,10 based on the use ofchemicals, such as salts and alcohols to shift the hydrateP-T equilibrium. Among these possible methods for hydrate
*To whom correspondence should be addressed. Telephone: þ86 2087057037. Fax: þ86 20 87057037. E-mail: [email protected].(1) Sloan, E.D.; Koh, C.A.ClathrateHydrates of Natural Gases, 3rd ed.;
CRC Press: Boca Raton, FL, 2008.(2) Collett, T. S. Gas hydrates as a future energy resource. Geotimes
2004, 49 (11), 24–27.(3) Klauda, J. B.; Sandler, S. I. Global Distribution of Methane
Hydrate in Ocean Sediment. Energy Fuels 2005, 19 (2), 459–470.(4) Ahmadi,G.; Ji, C.A.; Smith,D.H. Production of natural gas from
methane hydrate by a constant downhole pressure well.EnergyConvers.Manage. 2007, 48 (7), 2053–2068.(5) Moridis, G. J.; Kowalsky, M. B.; Pruess, K. Depressurization-
induced gas production from class 1 hydrate deposits. SPE ReservoirEval. Eng. 2007, 10 (5), 458–481.
(6) Li, G.; Li, X. S.; Chen, Q.; Chen, Z. Y. Numerical Studies of GasProduction from Gas hydrate zone in Shenhu Area, South China Sea.Acta Chim. Sin. 2010, 68 (11), 1083–1092.
(7) Li, G.; Tang, L. G.; Huang, C.; Feng, Z.; Fan, S. S. Thermo-dynamic evaluation of hot brine stimulation for natural gashydrate dissociation. J. Chem. Ind. Eng. (China) 2006, 57 (9), 2033–2038.
(8) Li, G.; Li, X. S.; Tang, L. G.; Li, Q. P. Control Mechanisms forMethane Hydrate Production by Thermal Stimulation. In The 6thInternational Conference on Gas Hydrate, Vancouver, British Columbia,Canada, 2008; Paper 5783.
(9) Li, G.; Moridis, G. J.; Zhang, K.; Li, X. S. The Use of Huff andPuff Method in a Single Horizontal Well in Gas Production fromMarine Gas Hydrate Deposits in the Shenhu Area of the South ChinaSea. In 2010 SPE International Oil & Gas Conference & Exhibition inChina, Beijing, China, 2010; Paper 131160.
(10) Li, G.; Li, X. S.; Tang, L. G.; Zhang, Y. Experimental investiga-tion of production behavior of methane hydrate under ethylene glycolstimulation in unconsolidated sediment.EnergyFuels 2007, 21 (6), 3388–3393.
6019
Energy Fuels 2010, 24, 6018–6033 : DOI:10.1021/ef100930m Li et al.
dissociation for gas production, depressurization appears tobe the most efficient.11-16
The Blake Ridge hydrate accumulation offshore theCarolinas,17 in which large volumes of gas hydrate arerelatively evenly distributed through vast volumes of fine-grained and relatively undeformed sediment at low (2-4%average, with a maximum estimate of 5-12%) saturations,has been extensively studied since the ocean drilling program(ODP) Leg 164.18 A preliminary estimate of the gas resourceat the Blake Ridge is up to 19.3� 1012 m3 (13.7� 109 t underthe standard atmospheric condition).18 Unfortunately, theprospects for economic recovery of natural gas from thishighly disseminated resource in the fine-grained sediment oflow permeability are very poor with current technologies.14,19
However, a numerical simulation indicates that the hydrateaccumulations at Blake Ridge with the free gas reservoirbeneath the hydrate bearing layer may be of economic valuefor industry production.20
Recent studies11,12,16 have also indicated that, under cer-tain conditions, gas can be produced from natural hydratedeposits at high rates over long periods using conventionaltechnology based on vertical wells. There are also simulationresults from horizontal well studies13,16 that show significantadvantages over vertical wells during production from Class 2and Class 3 deposits.
1.2. Shenhu Area. Recent studies have documented theoccurrence of significant gas hydrate deposits in the ShenhuArea of the South China Sea. The Shenhu Area is located inthe near southeast of Shenhu Underwater Sandy Bench inthe middle of the north slope of the South China Sea, betweenXisha Trough and Dongsha Islands. Tectonically, the re-search area is located in the Zhu II Depression of thePearl River Mouth Basin (Figure 1), which has been in theprocess of tectonic subsidence since themiddleMiocene. It is
characterized by a high sedimentation rate21 and thicksediments of 1000-7000 m, with organic matter contentsof 0.46-1.9%.22 The geological and thermodynamic condi-tions in the Shenhu Area are conducive to the formation andstability of gas hydrates.
1.3. Hydrates in the Shenhu Area. Gas hydrate sampleswere collected at three sites (SH2, SH3, and SH7) duringa recent scientific expedition conducted by the China Geo-logical Survey in the Shenhu area of the northern SouthChina Sea in May 2007.21,23-26 This was the first indicationof abundant hydrates in this area, which raised its visibility asa potentially important area for gas hydrate exploitationin China.
From site measurements that included formation thermalconductivity analysis at 19 sites, the heat flow in the ShenhuArea was estimated to ranges from 74.0 to 78.0 mW/m2
(with an average of 76.2 mW/m2). Estimates of the geother-mal gradient were based on in situ temperature measure-ments at five drilling sites within the research area (includingsite SH7, onwhich this study focuses), and ranged from 43 to67.7 �C/km. These create thermodynamic conditions thatfavor the formation of stable gas hydrates. The depth andthickness of the gas hydrate zone are controlled by the T, P,and salinity, with the water temperature at the ocean floorTOF and the geothermal gradient in the sediments being thekey parameters. In the South China Sea,TOF is in the 4-5 �Crange for water depths exceeding 1 000 m.21,24
The drilling results from the hydrate layer in the ShenhuArea, measured from both nonpressure and pressurizedcores, indicate that the top of the hydrate layers are located155-229 m below the seafloor (mbsf), and their thicknessvaries from 10 to 43 m. These hydrate layers occur at waterdepths 1108-1245m. The sediment porosity φ and the in situsalinity XS in the Shenhu Area, measured from the pressurecores, are 33-48%and 0.0290-0.0315, respectively; theTOF
and XS at the seafloor are 3.3-3.7 �C and 0.0328-0.0334,respectively. The P-wave velocity and gamma density of pres-sure coresof the site SH7used in this studyare shown inTable 1.The wire-line logging features of site SH7 were described byWu et al.,21,24,25 Zhang et al., 26 and Schultheiss et al.27
(11) Moridis, G. J.; Reagan, M. T. Gas Production from OceanicClass 2 Hydrate Accumulations. In The Offshore Technology Confer-ence, Houston, Texas, 2007; Paper OTC 18866.(12) Moridis,G. J.;Reagan,M.T. Strategies forGasProduction from
Oceanic Class 3 Hydrate Accumulations. In The Offshore TechnologyConference, Houston, Texas, 2007; Paper OTC 18865.(13) Moridis, G. J.; Reagan,M. T.; Zhang, K. The Use of Horizontal
Wells in Gas Production from Hydrate Accumulations. In The 6thInternational Conference on Gas Hydrate, Vancouver, British Columbia,Canada, 2008; Paper 5722.(14) Moridis, G. J.; Collett, T. S.; Boswell, R.; Kurihara,M.; Reagan,
M. T.; Koh, C.; Sloan, E. D. Toward Production from Gas Hydrates:Current Status, Assessment of Resources, and Simulation-Based Eva-luation of Technology and Potential. SPE Reservoir Eval. Eng. 2009,12 (5), 745–771.(15) Moridis, G. J.; Reagan, M. T.; Kim, S. J.; Seol, Y.; Zhang, K.
Evaluation of theGas ProductionPotential ofMarineHydrateDepositsin the Ulleung Basin of the Korean East Sea. SPE J. 2009, 14 (4), 759–781.(16) Kurihara, M.; Funatsu, K.; Ouchi, H.; Masuda, Y.; Narita, H.
Investigation on Applicability of Methane Hydrate Production Meth-ods to Reservoirs with Diverse Characteristics. In The 5th InternationalConference on Gas Hydrate, Trondheim, Norway, 2005; Paper 3003.(17) Borowski, W. S. A review of methane and gas hydrates in the
dynamic, stratified system of the Blake Ridge region, offshore south-eastern North America. Chem. Geol. 2004, 205 (3-4), 311–346.(18) Collett, T. S.; Ladd, J. Detection of gas hydrate with downhole
logs and assessment of gas hydrate concentrations (saturations) and gasvolumes on the Blake Ridge with electrical resistivity log data. InProceedings ODP Scientific Results; Paull, C. K., Matsumoto, R., Wallace,P. J., Dillon, W. P., Eds.; TAMU: College Station, TX, 2000; Vol. 164, pp179-191.(19) Moridis, G. J.; Sloan, E. D. Gas production potential of disperse
low-saturation hydrate accumulations in oceanic sediments. EnergyConvers. Manage. 2007, 48 (6), 1834–1849.(20) Su, Z.; Cao, Y.; Wu, N. A model for predicting gas well
performance of free gas zone beneath hydrate layer. J. Pet. Sci. Eng.2010, 71 (3-4), 179–186.
(21) Wu, N. Y.; Zhang, H. Q.; Yang, S. X.; Liang, J. Q.; Wang, H. B.Preliminary Discussion on Natural Gas Hydrate (NGH) ReservoirSystem of Shenhu Area, North Slope of South China Sea. Nat. GasInd. 2007, 27 (9), 1–6.
(22) McDonnell, S. L.; Max, M. D.; Cherkis, N. Z.; Czarnecki, M. F.Tectono-sedimentary controls on the likelihood of gas hydrate occur-rence near Taiwan. Mar. Pet. Geol. 2000, 17, 929–936.
(23) Wu, N. Y.; Zhang, H. Q.; Su, X.; Yang, S. X.; Zhang, G.;Liang, J. Q.; Lu, J.; Gong, J.; Scheltheiss, P.; Holland, M. Highconcentrations of hydrate in disseminated forms found in very fine-grained sediments of Shenhu area, South China Sea. Terra Nostra 2007,1-2, 236–237.
(24) Wu, N. Y.; Yang, S. X.; Zhang, H. Q.; Liang, J. Q.;Wang, H. B.;Su, X.; Fu, S. Y. Preliminary discussion on gas hydrate reservoir systemof Shenhu Area, North Slope of South China Sea. In The 6th Interna-tional Conference on Gas Hydrate, Vancouver, British Columbia, Canada,2008; Paper 5700.
(25) Wu, N. Y.; Yang, S. X.; Zhang, H. Q.; Liang, J. Q.;Wang, H. B.;Lu, J. A. Gas Hydrate System of Shenhu Area, Northern South ChinaSea:Wire-line Logging, Geochemical Results and Preliminary Re-sources Estimates. In Offshore Technology Conference, Houston, Texas,2010; Paper 20485.
(26) Zhang, H. Q.; Yang, S. X.; Wu, N. Y.; Scheltheiss, P.; Holland,M.; Zhang, G. X.; Liang, J. Q.; Lu, J., A.; Rose, K. High ConcentrationHydrate in Disseminated forms Obtained in Shenhu Area, North Slopeof SouthChina Sea. InThe 6th International Conference on GasHydrate,Vancouver, British Columbia, Canada, 2008; Paper 5701.
(27) Schultheiss, P.; Holland,M.; Humphrey, G.Wireline coring andanalysis under pressure: Recent use and future developments of theHYACINTH system. Sci. Drill. 2009, 7, 44–50.
6020
Energy Fuels 2010, 24, 6018–6033 : DOI:10.1021/ef100930m Li et al.
Natural hydrate accumulations are divided into four mainclasses.5,11,12 Class 1 accumulations are composed of twolayers, including the hydrate-bearing layer (HBL) and anunderlying two-phase fluid (containingmobile gas and liquidwater) zone. Class 2 deposits include an HBL underlain by azone ofmobile water. Class 3 accumulations involve only anHBL, without underlying mobile fluid zones (and usuallybounded by low-permeability overburden and under-burden). Class 4 deposits involve disperse low-saturationoceanic hydrate without confining boundaries, which arenot likely to have production potential. The hydrate accu-mulations in the Shenhu Area involve a single HBL withinfine-textured sediments and boundaries (overburden andunderburden layers) which have the same intrinsic perme-abilities with the HBL.
These deposits are considered “challenging” hydrates (CH)for gas production, as they are characterized by the HBLwithout the confinement of the boundaries, which have thesamepermeabilitieswithHBL, typeCH-B in the terminologyofMoridis et al.,28 in addition to incidence in fine-texturedsediments of low-permeability (type CH-k) such as siltsand clays.21,23-26
1.4. Objectives. The main objective of this study is theevaluation of the gas production potential of recently dis-covered marine gas hydrate deposits in the Shenhu Area ofthe South China Sea, as well as the factors affecting it. Because
of the generally low productivity of such challenging oceanicdeposits, only horizontalwells are considered in this analysis.Several possible production methods and horizontal wellconfigurations are investigated, and the sensitivity of gasproduction to various formation and operation parametersand conditions is assessed.
2. System Description and Production Strategies
2.1. Method of Production. Earlier studies12,14,15 indicatedthat depressurization is the simplest and most promisinghydrate dissociation method, and possibly the only practicaloption in the majority of hydrate deposits, because of itstechnical and economic effectiveness. Significant coolingin the vicinity of vertical wellbores (caused by both theendothermic reaction of hydrate dissociation and the Joule-Thompson effect) may induce secondary hydrate forma-tion. This problem, which can lead to flow blockage if leftuntreated, can be alleviated through the application of thermalstimulation (periodic or continuous, mainly by means ofwarm water injection), thus enhancing production whenused in conjunction with the main dissociation method,i.e., depressurization.6,11,12 However, pure thermal stimula-tion appears to be very ineffective as a gas productionmethod when used as the main dissociation strategy.12
Constant-pressure production appears to be the mosteffective method (if not the only option).12 During the initialstage of production (which constitutes a large part of theentire production period), when the formation effectivepermeability keff is very low because of the presence of thesolid hydrate, constant-P production allows a continuousincrease in the gas production rateQPT. This is caused by thecontinuously increasing keff in the deposit as SH declines inthe course of hydrate dissociation. Furthermore, by settingthe well pressure PW > PQ (i.e., the P at the quadruple point),constant-P production provides the necessary bottomholepressure control to eliminate the possibility of ice formationand significantly reduce the formation of secondary hydrates.
Despite the well-documented superiority of depressurization-induced dissociation, the low instrinsic permeability k and
Figure 1. (a) Location of research area, ShenhuArea, north slope of South China Sea and (b) bathymetric map of gas hydrate drilling area withsites drilled in the research area.
Table 1. P-Wave Velocity and Gamma Density of Pressure Cores in
ShenhuArea, SouthChina Sea (MSCL-PLogging of PressureCores)
(28) Moridis, G. J.; Reagan, M. T.; Boyle, K. L.; Zhang, K. Evalua-tion of the Gas Production Potential of Challenging Hydrate Deposits.InTOUGHSymposium, LawrenceBerkeleyNational Laboratory, Berkeley,CA, 2009.
Energy Fuels 2010, 24, 6018–6033 : DOI:10.1021/ef100930m Li et al.
the limited confinement effect of the boundaries in the CH-kand CH-B deposits may hinder its application in the ShenhuArea. Aggressive depressurization is inadvisible because itcan lead to significant pressure drops in the vicinity of the well,in addition to very large water production. Warm waterinjection is not recommended because of the limited effec-tiveness of thermal dissociation methods and of the adversepressure and relative permeability regime of any gas releasedfrom dissociation and attempting to flow toward the well. Inthis study, production is based on hydrate dissociation inducedby a combination of depressurization (the dominant mecha-nism) and thermal stimulation (in a supporting role), and gasis produced using horizontal wells operating under a constant-pressure regime. The production method attempts to overcomethe shortcoming of depressurization and thermal stimulationand is described below.
2.2. Well Design and Description. We consider only hori-zontal wells (Figure 2) in this study because earlier studies13,29,30
showed that the performance of horizontal wells is superior tothat of vertical wells in gas production, one of the reasonsbeing that they virtually eliminate the problem of secondaryhydrate formation. We evaluate the performance of a singlehorizontal well of rW = 0.1 m placed in the middle of the22 m-thick HBL (Figures 2a and 3a) at the SH7 site ofthe Shenhu Area.
We use the new well design proposed by Moridis et al.,28
which combines a mild constant-P depressurization regime
with a thermal stimulation process that provides heat to theHBL by means of warm water (originating from deeper,warmer reservoirs) circulating inside the wellbore withoutinjection into the deposit (Figure 2b). The higher T aroundthe well is expected to promote hydrate dissociation, inaddition to preventing the formation of secondary hydratesaround the wellbore. The mild depressurization regime ofthis well design is designed to prevent excessive water pro-duction, and the constant-P production regime eliminatesthe possibility of excessive pressure drops. The continuousaddition of heat without resorting to warm water injectioninto the HBL does not negate (even partially) the effects ofdepressurization, does not further burden the relative perme-ability regime of the gas evolving fromdissociation, and doesnot inhibit flow to the well.
3. Numerical Models and Simulation Approach
3.1. Numerical Simulation Code. For this numerical simu-lation study, we used both the serial and parallel versions ofthe TOUGHþHYDRATE code.31,32 This code can modelnonisothermal hydration reactions, phase behavior, andflowof fluids andheat under the conditions typical of naturalCH4-hydrate deposits in complex geologic media. It includesboth an equilibrium and a kinetic model of hydrate formation
Figure 2. (a) System geometry and configuration of the horizontal well producing from the hydrate deposit at the SH7 site of the Shenhu Area,South China Sea and (b) the new well design for concurrent heat addition and gas production.24.
(29) Reagan, M. T.; Boyle, K. L.; Zhang, K. Sensitivity Analysis ofGas Production fromClass 2 and Class 3 Hydrate Deposits. InOffshoreTechnology Conference, Houston, Texas, 2008; Paper 19554.(30) Rutqvist, J.; Moridis, G. J. Numerical Studies on the Geome-
chanical Stability of Hydrate-Bearing Sediments. SPE J. 2009, 14 (2),267–282.
(31) Moridis, G. J.; Kowalsky, M. B.; Pruess, K. TOUGHþHY-DRATE v1.1 User’s Manual: A Code for the Simulation of SystemBehavior in Hydrate-Bearing Geologic Media; Lawrence Berkeley Na-tional Laboratory: Berkeley, CA, 2009.
(32) Zhang, K.; Moridis, G. J.; Wu, Y. S.; Pruess, K. A DomainDecomposition Approach for Large-Scale Simulations of Flow Pro-cesses in Hydrate-Bearing Geologic Media. In The 6th InternationalConference on Gas Hydrate, Vancouver, British Columbia, Canada, 2008;Paper 5480.
Energy Fuels 2010, 24, 6018–6033 : DOI:10.1021/ef100930m Li et al.
and dissociation. Themodel accounts for heat and up to fourmass components (i.e., water, CH4, hydrate, and water-solubleinhibitors such as salts or alcohols) that are partitioned amongfour possible phases: gas, aqueous liquid, ice, and hydrate. Atotal of 15 states (phase combinations) can be described bythe code, which can handle any combination of hydrate dis-sociation mechanisms and can describe the phase changesand steep solution surfaces typical of hydrate problems. Inthis code, the impact of the movement and the volume expan-sion of the sediments are neglected.
3.2. Geometry, Domain Discretization, and System Proper-
ties. The geologic system in this study corresponds to the siteSH7 at the Shenhu Area. Analysis of hydrate sample from thissite indicated almost pure (99.2%) CH4-hydrate in clayeysediments. The system properties and initial conditions thatwere used in the simulations are shown in Table 2. In theabsence of direct measurements of the flow properties of theporous media at the site, the estimates of k, φ, and the wet-tability properties (capillary pressure and relative permeabil-ities, with all related parameters) in Table 2were based on thesimilarity of these fine media (silts and clays) to similarlytextured soils with known properties. The wellbore was simu-lated as a pseudoporous medium with φ = 1.0, k = 5.0 �10-9 m2 (5000 darcys), a capillary pressure Pcap = 0, andaqueous and gas relative permeabilites (krA and krG) as linearfunctions of the aqueous and gas phase saturations (SA andSG), respectively.
The seafloor at this site is at 1108 m depth, and the HBLextends from 155 to 177 m interval below the seafloor (22 mthick). As in all simulations of this kind, the domain includesan additional 30 m of underburden and overburden (havingthe same flow properties as the HBL), above and below whichboundaries of constant conditions (P and T) are imposed. The30m-thicknesswas shown to be sufficiently large for an accu-rate description of (a) the heat flow regime through theoverburden and underburden during amaximum of 30 yearsof production5,11,12 and (b) of the pressure and flow regime,given the low k and the mild depressurization regime.
The geometry and configuration of the hydrate deposit, aswell as the corresponding simulationgrid, are shown inFigure3.Because of the limited confinement effect of the boundariesabove the HBL and the tendency of gas from hydrate dis-sociation to accumulate at the top of the formation where anupper dissociation interface develops,11,12,14,30 the well isplaced at the center of the HBL (rather than at the top),i.e., at x = 0 and z = 0 in the coordinates of the grid inFigure 3b. Because of symmetry about the well, only half ofthe domain (x g 0) is simulated. Assuming uniformity ofbehavior along the length of the horizontal well (i.e., ignor-ing possible heel to toe deviations in behavior), only a singleunit of length Δy = 1 m needed to be simulated. A no-flowboundary (i.e., no fluid flow and heat transfer) is applied atx = 45 m, indicating a well spacing of 90 m. A 1000 m-longwell is assumed in all cases.
Figure 3. (a) Schematic of the marine hydrate deposit at the SH7 site of the ShenhuArea, South China Sea and (b) grid used in the simulations.
Energy Fuels 2010, 24, 6018–6033 : DOI:10.1021/ef100930m Li et al.
The hybrid grid in Figure 3b comprises 11 259 nonuni-formly sized elements, of which 11 034 are active (the remain-ing being boundary cells). The uppermost and lowermostlayers, which are inactive boundary cells, correspond to theconstant-P andT conditions discussed earlier. Because of theimportance of a high definition in the vicinity of thewellbore,a very fine discretization is used (with gridblocks smallerthan 0.1 m across) in the region defined by the center of thewell and for r<7.5m (Figure 3b). Outside this region,Δx=0.5m, but discretization along the z-axis is generally nonuni-form. It is fine (Δze 0.5 m) in the HBL, at the bottom of theoverburden, and at the top of the underburden, but itbecomes coarser for z> 22 m and for z<-22 m. Such finediscretization is necessary to correctly describe the spatialdistributions of important properties and conditions in thedomain and to yield accurate predictions of production.5,11
Assuming an equilibrium reaction of hydrate dissociation,31,33
this grid results in 44136 coupled equations that are solvedsimultaneously.
3.3. Initial Conditions. The geothermal gradient was esti-mated from in situ measurements:21 the temperatures of thesample SH7B-FPWS1 (137 mbsf), SH7B-FPWS2 (180 mbsf),and SH7B-FPWS3 (196 mbsf) at site SH7 were 12.49, 14.39,and 15.04 �C, respectively. From these T-measurements andthe known TOF, the local (average) geothermal gradient atthe SH7 site was computed as dT/dz=0.0432 �C/m and wasused to obtain T-estimates at the constant-condition bound-aries (upper and lower) of the domain.
With the use of the system geometry (Figure 2a), all theT-related information, the known density of the ocean wateras a function of P, T, and salt concentration (1035 kg/m3 atTOF and atmospheric pressure), the known phase saturation
distributions (SH= 0.44 and SA= 0.56 in the HBL; SH= 0and SA = 1 in both the overburden and the underburden),and the general rule that the pressure distribution in hydratesystems follows the hydrostatic gradient,11,12 the P- andT-distribution of the initial P- and T-distribution presup-posed knowledge of the formation (a) porosity φ and (b) wetand dry thermal conductivity, kΘRw and kΘRD, respectively;the former was determined from in situ measurements,21,23-25
and reasonable estimates were used for the latter (Table 2).The initial P at the HBL bottom (z = -1285 m) wasestimated as PB = 13.83 MPa (Figures 2a and 3a;Table 2), which is close to the equilibrium hydrate pressureat the temperature TB = 14.15 �C of the HBL base and forXS = 0.0305.
The thermodynamic desirability of hydrate deposits as gasproduction targets increases with the proximity of PB to theequilibrium pressure at TB because such systems are easy todestabilize with mild depressurization or thermal stimula-tion. The gas hydrate accumulation at the SH7 site of theShenhu Area appears to be such a thermodynamicallyappealing target, but this thermodynamic attractiveness isonly one of the factors, insufficient by itself, that determinesthe overall production potential of a deposit.
4. Production from Site SH7 in Shenhu Area: The
Reference Case
4.1. Reference Case. The properties and conditions per-taining to the reference case are listed in Table 2. Thetemperature of the circulating hot water in the well TW =14 �C, i.e., roughly equal to the initial temperature TB at thebase of the HBL and very slightly warmer than the initialtemperature at the elevation of the horizontal well (=13.7 �C).Such a low TW effects minimal thermally induced dissocia-tion of hydrates in the HBL that can only begin once P hasdropped below the equilibrium pressure corresponding to
Table 2. Properties and Conditions of the Hydrate Deposit at Site SH7 in Shenhu Area, South China Sea
parameter value
overburden thickness ΔZO 30 mHBL thickness ΔZH 20 munderburden thickness ΔZU 30 mwell position above the HBL base ΔZW 11 minitial pressure PB (at base of HBL) 13.83 MPainitial temperature TB (at base of HBL) 287.31 K (14.15 �C)initial saturation in the HBL SH = 0.44, SA = 0.56gas composition 100% CH4
(33) Kowalsky, M. B.; Moridis, G. J. Comparison of kinetic andequilibrium reaction models in simulating gas hydrate behavior inporous media. Energy Convers. Manage. 2007, 48 (6), 1850–1863.
6024
Energy Fuels 2010, 24, 6018–6033 : DOI:10.1021/ef100930m Li et al.
TW. The driving force of the depressurization process ΔPW =P0 - PW = 0.8P0, 0.5P0, 0.2P0, and 0.1P0, where PW is theconstant bottomhole pressure at which the well operates andP0 = 13.7 MPa is the initial P in the HBL at the elevation ofthe production well. The ΔPW = 0.2P0 case is treated as thebase case in this study. Of the ΔPW levels explored here,0.2P0 (base case) and 0.1P0 are routinely attained in fieldoperations, 0.5P0 represents the outer envelope of fieldapplication, and 0.8P0 is an extreme case of depressurization.
4.2. Gas and Water Production. Figure 4 shows the evolu-tion of the volumetric rate of CH4 production in the gasphase (QPG), the total gas production (QPT) at the well, andthe gas released from hydrate dissociation (QR). The differ-ence QPD = QPT - QPG describes the produced gas that isdissolved in the produced aqueous phase. Note that QPT
exceeds QR in all the different ΔPW cases and that QPG ismuch smaller than QPT, which means that the source of the
majority of the produced gas is CH4 dissolved in the water,rather than from the free gas phase. Figure 5 shows thepercentage of hydrate dissociated in the entire simulateddomain. As shown in Figure 4a, QR decreases to a very lowlevel (QR < 0.01 ST m3/day/m of well) at t = 5600 and10 000 days in ΔPW = 0.8P0 and 0.5P0 cases, respectively;the corresponding hydrate dissociation percentage shown inFigure 5 approaches 1.0, which indicates that almost all thehydrate in the deposit disappears at that time. In theΔPW=0.2P0 and 0.1P0 cases, there are still hydrates in the deposit atthe end of the production periods (t = 30 years).
A local maximum ofQPT = 17.3 ST m3/day/m of the wellis reached before a decline begins at about t=390 days in theΔPW = 0.2P0 case (Figure 4b). The QPTmax for the entiredeposit reaches 3.46 � 104 ST m3/day (1.22 MMSCFD).Meanwhile, the corresponding QR shows the similar profileas QPT as shown in Figure 4b.
This is attributed to a combination of (a) an increase in theeffective permeability in the vicinity of the well at early times ofthe production process (approximately t = 0-390 days) be-cause of the hydrate dissociation on this area under the constantdriving force of depressurization; (b) the breakthrough of thewater from the underburden (Figure 10), which provides an-other source of water to reduce the effect of depressurization ongas production at the well; (c) some gas may escape from thedissociated zone in the deposit (in the initial HBL) to the oceanthrough overburden because of buoyancy, especially after thewater breakthrough from the overburden to the cylindricaldissociated zone around the well; (d) the resulting lower T,which further slows dissociation after 390 days.
Figure 6 shows the corresponding water production ratesQW and gas-to-water ratios RGW= VP/MW, whereVP is thecumulative volume of the produced CH4, and MW is thecumulative mass of the produced water. RGW provides ameasure of the hydrate system response and the effectivenessof dissociation as a gas-producing method. In ΔPW = 0.2P0
case, QW over 6000 kg/day/m of well is reached after approxi-mately t=1100days.Thewaterproduction rate isQW=1.2�107kg/day (1.2� 104 ton/D),which is unmanageable, andRGW
is prohibitively low (RGW < 5 ST m3 of CH4/m3 of H2O/m
ofwell). A higherΔPW (the driving force of depressurization)appears to have a remarkable effect on gas production,
Figure 4.Volumetric rate of CH4 production in the gas phase (QPG),the total gas production (QPT) at the well and released from hydratedissociation (QR) using the depressurization method with ΔPW =0.8P0, 0.5P0, 0.2P0, and 0.1P0, T0 = 13.7 �C during gas productionfrom the methane hydrate deposit in this study.
Figure 5. Percentage of hydrate dissociated % using the depressur-ization method with ΔPW = 0.8P0, 0.5P0, 0.2P0, and 0.1P0, T0 =13.7 �C during gas production from the methane hydrate deposit inthis study.
(34) Moridis, G. J.; Seol, Y.; Kneafsey, T. J. Studies of reactionkinetics of methane hydrate dissociation in porous media. In The 5thInternational Conference on Gas Hydrate, Trondheim, Norway, 2005;Paper 1004.(35) van Genuchten, M. T. A Closed-Form Equation for Predicting
the Hydraulic Conductivity of Unsaturated soils. Soil Sci. Soc. Am. J.1980, 44, 892–898.
Energy Fuels 2010, 24, 6018–6033 : DOI:10.1021/ef100930m Li et al.
long-term QPT < 20 ST m3/day/m of well in the ΔPW =0.2P0 case (Figure 4), while for the ΔPW= 0.8P0 case, long-term QPT < 4.00 � 104 ST m3/day (1.41 MMSCFD) andabout 7 times lower than the rule-of-thumb for commerciallyviable production rates from offshore gas wells.
4.3. Spatial Distribution of SH and SG. Figures 7-11 showthe evolution of theSH,SG,T, andXS distributions over timein the HBL (-11 < z < 11) using the depressurizationmethod for gas production, with ΔPW = 0.2P0 and T0 =13.7 �C, while Figure 9 shows the evolution of the P dis-tribution over time in the entire deposit (-41 < z < 41, seeFigure 3a). Comparison of the hydrate spatial distributionover 30 years to the initial HBL provides a measure of thehydrate dissociation profile.
Figures 7 and 8 show the evolution of the SH and SG
spatial distribution over time in the HBL. The figures show(i) the initial hydrate dissociation around the well, withlimited cylindrical dissociation interface; (ii) the evolutionof the upper and the lower dissociation interface; (iii) themergence of the lower dissociation interface and the cylindrical
Figure 7.Evolution of spatial distribution ofSHwhenΔPW=0.2P0 during gas production from themethane hydrate deposit at the SH7 Site ofthe Shenhu Area, South China Sea.
Figure 6. Evolution QW and RGW using the depressurizationmethod with ΔPW = 0.8P0, 0.5P0, 0.2P0, and 0.1P0, T0 = 13.7 �Cduring gas production from the methane hydrate deposit in thisstudy.
Energy Fuels 2010, 24, 6018–6033 : DOI:10.1021/ef100930m Li et al.
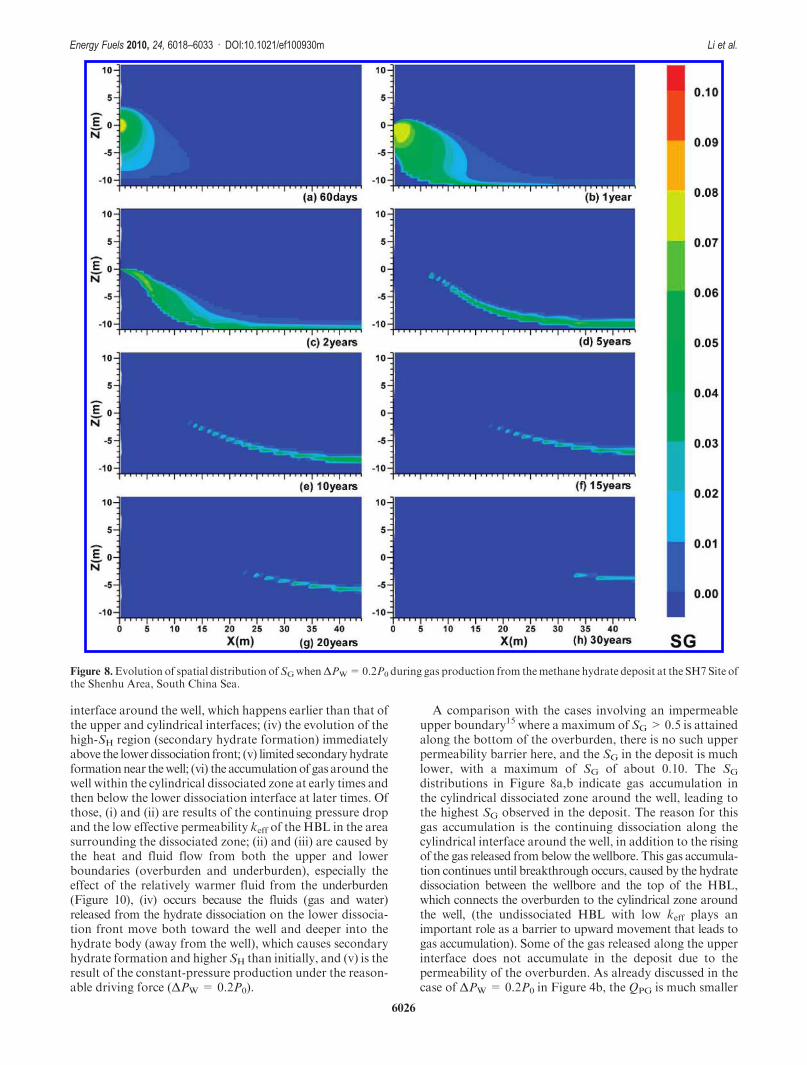
interface around the well, which happens earlier than that ofthe upper and cylindrical interfaces; (iv) the evolution of thehigh-SH region (secondary hydrate formation) immediatelyabove the lowerdissociation front; (v) limited secondaryhydrateformationnear thewell; (vi) the accumulationof gas around thewell within the cylindrical dissociated zone at early times andthen below the lower dissociation interface at later times. Ofthose, (i) and (ii) are results of the continuing pressure dropand the low effective permeability keff of the HBL in the areasurrounding the dissociated zone; (ii) and (iii) are caused bythe heat and fluid flow from both the upper and lowerboundaries (overburden and underburden), especially theeffect of the relatively warmer fluid from the underburden(Figure 10), (iv) occurs because the fluids (gas and water)released from the hydrate dissociation on the lower dissocia-tion front move both toward the well and deeper into thehydrate body (away from the well), which causes secondaryhydrate formation and higher SH than initially, and (v) is theresult of the constant-pressure production under the reason-able driving force (ΔPW = 0.2P0).
A comparison with the cases involving an impermeableupper boundary15 where a maximum of SG> 0.5 is attainedalong the bottom of the overburden, there is no such upperpermeability barrier here, and the SG in the deposit is muchlower, with a maximum of SG of about 0.10. The SG
distributions in Figure 8a,b indicate gas accumulation inthe cylindrical dissociated zone around the well, leading tothe highest SG observed in the deposit. The reason for thisgas accumulation is the continuing dissociation along thecylindrical interface around the well, in addition to the risingof the gas released from below the wellbore. This gas accumula-tion continues until breakthrough occurs, caused by the hydratedissociation between the wellbore and the top of the HBL,which connects the overburden to the cylindrical zone aroundthe well, (the undissociated HBL with low keff plays animportant role as a barrier to upward movement that leads togas accumulation). Some of the gas released along the upperinterface does not accumulate in the deposit due to thepermeability of the overburden. As already discussed in thecase of ΔPW = 0.2P0 in Figure 4b, the QPG is much smaller
Figure 8.Evolution of spatial distribution ofSGwhenΔPW=0.2P0 during gas production from themethane hydrate deposit at the SH7 Site ofthe Shenhu Area, South China Sea.
Energy Fuels 2010, 24, 6018–6033 : DOI:10.1021/ef100930m Li et al.
than QPT and decreases rapidly to a very low level (less than0.01 ST m3/day/m of well) from about t = 270-800 days,which means there is little methane produced in the gasphase. TheSGdistribution over 2 years in Figure 8 (Figure 8cand beyond) validate the hypothesis that the disappearanceof the upper barrier and the upper water breakthrough leadto gas losses through the overburden toward the surface, withundesirable consequences, such as low QPT (Figure 4b) andlowRGW (Figure 6), if such releases cannot be contained.14,15
The small gas accumulation (with local SG < 0.1) immedi-ately below the lower dissociation interface could not beproduced as gas phase from the well and rises toward theoverburden over 2 years.
The emergence of the lower dissociation interface and thecylindrical interface around the well at about 1 year in Figure 7is remarkable. As already discussed in the case of ΔPW =0.2P0 in Figure 4b, the QPT declines monotonically afterabout t=390 days because of the water breakthrough fromthe underburden to the cylindrical dissociated zone aroundthe well (in other words, the lower dissociation interface andthe cylindrical interface have merged) that causes the pro-motion of water (rather than gas) production and allevia-tion of the effect of depressurization on gas production atthe well. This water flow from the underburden to the well
affects theSGdistribution around thewell (especially evidentin Figure 8c and beyond). Although there is cooling effectcaused by the endothermic hydrate dissociation, the tem-perature in the HBL at t= 1 year is even higher than that inthe initial HBL (Figure 10), which validate the hypothesis ofwater flow from the underburden.
4.4. Spatial Distribution ofP.Figure 9 shows the evolutionof the P distribution over time within the entire deposit(-41< z<41), withΔPW=0.2P0 andT0= 13.7 �Cduringgas production. White lines in Figure 9 indicate the initialpositionof the topandbase of theHBLat z=11and z=-11,respectively (Figure 3a). Figure 9 shows (i) the evolution ofthe pressure gradient around the well over time; (ii) thepressure drop in the overburden and underburden; (iii) thejaggedP distribution and the inflections near the interface ofthe dissociated and undissociated zone in theHBL. Of those,(i) and (ii) result from the characteristic of the permeabilitiesof boundaries, and (iii) results from fluid flow caused by gasand water dissociated from the hydrate.
Figure 9a,b shows a confined cylindrical zone, corre-sponding to the dissociated zone shown in Figure 7a,b,with pressure gradients oriented toward the well. The con-stant pressure in the well with ΔPW = 0.2P0 is about PW =11.2 MPa. The radius of the cylindrical low-pressure zone
Figure 9.Evolution of spatial distribution ofPwhenΔPW=0.2P0 during gas production from themethane hydrate deposit at the SH7 Site ofthe Shenhu Area, South China Sea.
Energy Fuels 2010, 24, 6018–6033 : DOI:10.1021/ef100930m Li et al.
(defined as the zone with pressure lower than 12.5 MPa)around the well is larger than 2 m as shown in Figure 9a,b.As the pressure in the well PW remains constant during theentire production process, the pressure gradients and spatialdistributions are affected by the hydrate dissociation and thecorresponding fluid flowpatterns. The cylindrical zone aroundthe well could be more effectively depressurized, owing to thelow effective permeability keff of theHBL in the area surround-ing the dissociated zone (cylindrical low-pressure zone). InFigure 9c-h, as the water breaks through from the under-burden and overburden to the dissociated zone around thewell, the radius of the cylindrical low-pressure zone aroundthe well decreases to approximately 1 m.
The pressures in the overburden and underburden dropsignificantly because of fluid flow toward the production well.As shown in Figure 9a-d, in the first 5 years, the pressuresin the overburden and underburden drop significantly overtime, while the P distribution in the overburden and under-burden changes only slightly from 10 to 30 years (Figure 9eand beyond). The reason for this is that after 10 years,
hydrate distribution in the HBL has a limited effect on thefluid flow in the system, and the pressure distribution becomespractically stable.
In Figure 9a-d, there are inflections in the P contours atthe top white line indicating the initial position of the topHBL at z = 11. Also, in Figure 9b-f, obvious jagged Pdistributions are shown near (especially above) the lowerwhite line, which indicate the initial position of the base ofthe HBL at z=-11. All the inflections and jagged positionsshown inFigure 9 correspond to the interface of the dissociatedand undissociated zone in the HBL shown in Figure 7.
4.5. Spatial Distribution of T. Figure 10 shows the evolu-tion of theT distribution over time in theHBLwhenΔPW=0.2P0 during production. The low-T zone (defined as thezone with T<11.5 �C) in Figure 10b,c occurs in the vicinityof the upper dissociation interface (Figure 7b,c), whichindicates cooling as dissociation and production proceed.The low-T zone disappears inFigure 10d andbeyondbecauseof encroachment by warmer water flowing from the over-burden (where there is an inversion of the geothermal gradient,
Figure 10. Evolution of spatial distribution of T when ΔPW= 0.2P0 during gas production from the methane hydrate deposit at the SH7 Siteof the Shenhu Area, South China Sea.
Energy Fuels 2010, 24, 6018–6033 : DOI:10.1021/ef100930m Li et al.
as a result of dissociation-induced cooling in the HBL). Thewarmerwater rising from the underburden is clearly depictedby the spatial distribution ofT in the vicinity of the lower dis-sociation interface (Figure 7). All fluids of different originand temperature, including the original free water in theHBL, the gas andwater produced fromhydrate dissociation,the water from the overburden, and the warmer water risingfrom the underburden, converge toward the well.
4.6. Spatial Distribution of XS. Figure 11 shows thedistribution of the salt concentration (expressed as the massfraction of saltXS in the aqueous phase) over time in theHBL(-11 < z < 11) using the depressurization method, withΔPW=0.2P0 and T0= 13.7 �C during gas production frommethane hydrate deposit in this work. The dilution effect ofdissociation on salinity is clearly shown inFigure 11. Becausethe salts cannot be included in the hydrate crystals, freshwater is released from hydrate dissociation and reduces thewater salinity in situ. Thus, the locations of intense dissocia-tion activity can be identified as the loci of low salinity.15
Unlike the cases with impermeable boundaries, whichmeans
the limited replenishment of salinity from water flowing fromnearly impermeable boundaries,15 the salinity distributionsin Figure 11 are significantly affected by the water flow fromthe overburden and underburden.
In Figure 11a,b, the maximum XS reduction is observednear the well, corresponding to the cylindrical dissociatedzone in Figure 7 and the low T zone in Figure 10, which isaffected by the water flow from the overburden. In Figure 11cand beyond, the spatial distribution and shapes of the XS
reduction areas are similar to the undissociated zone shown inFigure 7 and reflect the continuous flow of saline water fromthe boundaries, along the dissociation hydrate boundary, andto the well.
5. Sensitivity analysis of production from site SH7 of the
Shenhu Area
In thiswork,we investigated the sensitivity of gasproductionto the following conditions and parameters: the initial hydratesaturation SH0, the intrinsic permeability k, the temperature
Figure 11. Evolution of spatial distribution of XS when ΔPW = 0.2P0 during gas production from the methane hydrate deposit at the SH7Site of the Shenhu Area, South China Sea.
Energy Fuels 2010, 24, 6018–6033 : DOI:10.1021/ef100930m Li et al.
of the circulating hot water in the well TW, and the initialtemperature T0.
5.1. Sensitivity to SH0. Figures 12 and 13 show, respec-tively, the dependences of (a)QPG,QPT,QR, and the percent-age of hydrate dissociated in the HBL and (b) QW and RGW
on the initial hydrate saturation SH0. For the reference case,SH0 = 0.44, which is already discussed above.
As already shown in Figure 4, a local maximum ofQPT=17.3 STm3/day/mofwell is reached before a decline begins atabout t=390 days, for theΔPW=0.2P0 case with the initialhydrate saturation SH0= 0.44 (reference case). As shown inFigure 12, the maximum ofQPT= 21.5 STm3/day/m of wellis reached at about t=265 days when SH0= 0.30, while themaximum of QPT = 13.0 ST m3/day/m of well is reached atabout t=680 days when SH0= 0.60. A lower SH0 leads to ahigher maximum of QPT reached much earlier than thehigher SH0 cases. The reason for this is that the higher initialkeff in the lower SH0 cases leads to a faster depressurizationand hydrate dissociation earlier in the production process.
After reaching the maximum, a decline of QPT begins,which lasts to the end of the simulation, and a lowerSH0 leadsto a lower QPT over long time, because of the lower totalquantity of hydrate in-place at lower initial saturations. QR
decreases to a very low level (QR<0.6 STm3/day/m of well)at t=7600days for the lowestSH0=0.30, and the correspond-ing hydrate dissociation percentage shown in Figure 12 risesabove 0.98, which indicate that almost all the hydrate in thedeposit disappears at that time. In the SH0 = 0.44 and 0.60cases, there is still hydrate in the deposit at the end of theproduction periods (t = 30 years).
In Figure 13, in the initial period of the productionprocess, the water production rate QW increases with adecreasing SH0 (corresponding to a larger SA). While theeffect of QPT is weaker than that of the QW dependence onSH0 (QPT and QW both increase with decreasing SH0), RGW
decreases with the decrease of SH0 at early times of theproduction process. After a long production time, bothQPT and RGW decrease with decreasing SH0. In general, moregas is produced for higher SH0. Additionally, the gas-to-waterratio RGW is favored by a high SH0.
5.2. Sensitivity to the Intrinsic Permeability k. Figures 14and 15 show, respectively, the dependences of (a) QPG, QPT,
QR, and the percentage of hydrate dissociated in the HBLand (b) QW and RGW on the intrinsic permeability k of thedomain (including the HBL, overburden, and underburden)for the ΔPW = 0.2P0 case.
Reducing k from 75 to 0.1 mD results in significantdeterioration of gas production performance. In the longterm,QPT is reduced from about 4.0 STm3/day/m of well fork = 75 mD to less than 0.1 ST m3/day/m of well when k =0.1 mD (Figure 14). In the k e 75 mD cases, there are stillhydrates in the deposit after 30 years of production.
The water production rate QW shown in Figure 15 alsodecreases with a decrease of k, and this positive effect isdominant comparing with the gas production reduction. Inother words, a declining k is favorable for the relativecriterion of production performanceRGW (Figure 15). Thereis continuous gas escape via the overburden, caused by thelimited confinement effect of the boundaries, and a contin-uous influx of water through the boundaries (including boththe overburden and underburden) during the productionprocedure in this study. The gas production rate QPT isaffected by the permeability of the overburden rather than
Figure 12. Sensitivity analysis: effect of SH0 on QPG, QPT, QR andthe percentage of hydrate dissociatedwhenΔPW=0.2P0 during gasproduction from the methane hydrate deposit at the SH7 Site of theShenhu Area, South China Sea (SH0 = 0.44 in the reference case).
Figure 13. Sensitivity analysis: effect of SH0 on the evolution QW
andRGWwhenΔPW=0.2P0 during gas production from themethanehydrate deposit at the SH7 Site of the ShenhuArea, South China Sea(SH0 = 0.44 in the reference case).
Figure 14. Sensitivity analysis: effect of k on QPG, QPT, QR and thepercentage of hydrate dissociated when ΔPW = 0.2P0 during gasproduction from the methane hydrate deposit at the SH7 Site of theShenhu Area, South China Sea (k = 75 mD in the reference case).
Energy Fuels 2010, 24, 6018–6033 : DOI:10.1021/ef100930m Li et al.
underburden, while the water production rate QW decreaseswith the decrease in k of both of them.
5.3. Sensitivity to TW. Figure 16 shows the dependences ofQPG,QPT,QR, andRGWon the temperature of the circulatinghotwater in thewell (TW=50, 90, 130 �C) for theΔPW=0.2P0
case. In the reference case, TW = 14 �C, i.e., very close to theinitial HBL temperature at the location (elevation) of the well.
With an increase in TW from 14 to 130 �C, both the totalgas production rateQPT and the rate of the gas released fromhydrate dissociation QR increased very slightly (Figure 16).Thus, the higherTWappears to have a limited (topractically no)effect on gas production, confirming the results of an earlierstudy.28 One of the reasons for this is the limited efficiency ofconduction as the main heat transfer mechanism, with therate of its propagation declining significantly over time as thevolume around the well increases as a function of r2.20 Further-more, the opposite direction of the conductive and advectiveheat flows, from the well to the deposit and from the HBLtoward the well as part of the fluid flow, during the produc-tion process confines the heat stimulation effect to a verylimitied zone around the well.
In Figure 16, the volumetric rate of CH4 production in thegas phase QPG increases with increasing TW. As alreadydiscussed in the TW = 14 �C cases of Figures 4 and 8, thegas produced in the gas phase QPG decreases to less than0.01 STm3/day/mofwell at about t=800 days, withmost ofthe free gas in the deposit accumulating early in the cylind-rical zone around the well. In Figure 16, (a) the maximum ofQPG and (b) the time to reach QPG < 0.01 ST m3/day/m ofwell increases with increasing TW, because most free gas isaccumulated in the cylindrical zone around the well, wherethe local SH and SG are significantly affected by TW. Thehigher the TW, the more hydrate dissociated and gas accu-mulates in this zone, leading to higherQPG and a slowerQPG
decline. The gas-to-water ratios RGW appear practicallyinsensitive to TW because of the limited overall effect of TW
on dissociation.5.4. Sensitivity toT0.Figure 17 shows theP-T equilibrium
relationship in the phase diagram of the water-CH4-hydratesystem. In this study, theT0 sensitivity analysis is investigatedthrough the following two cases: (i) T0 is reduced by approxi-mately 2.5 �C (from T0 = 13.7 �C at the well location in the
reference case toT0- 2.5=11.2 �C), while keeping the samegeothermal gradient and P equal to P0 = 13.7 MPa in thereference case; (ii) T0 is increased by approximately 2.5 �C(fromT0= 13.7 �C at thewell location toT0þ 2.5=16.2 �C),the geothermal gradient remains unchanged, and P is in-creased to the corresponding equilibrium Peq = 18.7 MPa(reflecting a deeper, warmer deposit). Cases (i) and (ii) are,respectively, represented by points B and C in Figure 17, whilethe reference case is point A.
Figure 18 shows the dependences of QPG, QPT, QR, andRGW on the hydrate stability, as quantified by the initialtemperature T0 in the HBL at z=0 (the position of the pro-duction well). As discussed above, in the reference case, theinitial pressure PB at the base of the HBL is slightly higherthan the equilibrium pressure corresponding to TB, and it isrelatively easy to destabilize the hydrate with mild depres-surization. In Figure 18, the colder and more stable system(T0 - 2.5 = 11.2 �C) results in consistently lower QPT. Asexpected, over the first 10 years, QR in the colder system(T0- 2.5) is lower than that in the reference case (T0), whichindicates that the hydrate dissociation is reduced in the
Figure 15. Sensitivity analysis: effect of k on the evolution QW andRGW when ΔPW = 0.2P0 during gas production from the methanehydrate deposit at the SH7 Site of the Shenhu Area, South ChinaSea (k = 75 mD in the reference case).
Figure 16. Sensitivity analysis: effect of TW on QPG, QPT, QR, andRGW when ΔPW = 0.2P0 during gas production from the methanehydrate deposit at the SH7 Site of the Shenhu Area, South ChinaSea (TW = 14 �C in the reference case).
Figure 17. Phase diagram of the water-CH4-hydrate system: thecases investigated in the analysis of sensitivity of production to theinitial reservoir temperature T0.
Energy Fuels 2010, 24, 6018–6033 : DOI:10.1021/ef100930m Li et al.
colder system.After 10years,QR in the colder system(T0- 2.5)is slightly higher, becausemorehydrate remains undissociated inthe deposit (i.e., there is more hydrate available to dissociate)in the colder system at long times. The difference betweenQPT and QR in the colder system (T0 - 2.5) is smaller thanthat in the reference case, especially when QR is almost thesame after 10 years because the effective permeability keff islower in the presence of more hydrate within the deposit inthe colder system. TheRGW shows a different dependence onT0 over time in Figure 18, indicating lower initial gasproduction in the more stable (colder) system and slightlyhigherRGW after about 3 years. For a givenΔPW, the higherthe T0 (and the closer to the equilibrium temperature) in thehydrate deposit, the better the reservoir performance is in termsof both gas production (increasing) and water production(decreasing).
The characteristics of the curve profiles of (a) QPG, QPT,QR, and (b) RGW in the deeper and warmer system (P0 =18.7 MPa, T0 = 16.2 �C) in Figure 18 show a similardependence on T0. Thus, a higher T0 leads to initially largerQPT and QW and larger QR and RGW. In this case, the QR
(T0 þ 2.5) decreases rapidly at about t = 9600 days,indicating the disappearance of hydrate in the deposit. Inthe reference case (Figure 7), the hydrates in the deposit arenot exhausted even at t = 30 years. In general, the depositwith higher initial temperature is a more desirable produc-tion target.
6. Summary and Conclusions
In this work, we investigated the gas production potentialfrom marine gas hydrate deposits at site SH7, in the ShenhuArea of the South China Sea, during the China GeologicalSurvey of 2007. From the numerical simulation results, thefollowing conclusions are drawn: (1) On the basis of the fieldmeasurement of the hydrate sample from site SH7 (includingthe temperatures at the different depth of the deposit), thelocal geothermal gradient, the equilibriumpressure at the baseof the hydrate layer, and the general tendency of hydratedeposits to follow the hydrostatic gradient, the initial condi-tions in the hydrate deposit in this study were calculated andthe systemwas brought to equilibrium. (2) During themodeled
30 years of continuous production,QPT exceededQR in all thecases with a different driving force ΔPW, and QPG was muchsmaller than QPT, which indicated that the majority of theproduced gas came from CH4 dissolved in water rather thanfromthe freegasphase.A localmaximumofQPT=17.3STm3/day/m of well is reached, before a decline begins at aboutt = 390 days in the reference case (ΔPW = 0.2P0), and thecorrespondingQR shows the similar profile asQPT. (3) In thereference case, for a well spacing of 90m and a horizontal wellwith the length of 1000 m, the QPTmax for the entire depositreaches 3.46� 104 STm3/day (1.22MMSCFD), which is over7 times lower than the rule-of-thumb for commercially viableproduction rates from offshore gas wells. The correspondingwater production rate is aboutQW=1.2� 107 kg/day (1.2�104 ton/D), which is unmanageable, andRGW is prohibitivelylow (RGW<5STm3 of CH4/m
3 ofH2O/mofwell). (4) In thisstudy, the dissociation is characterized by the followingfeatures: evolution of the initial cylindrical hydrate dissocia-tion interface around the well, evolution of the upper andlower dissociation interfaces at the top and the bottom of thehydrate layer, the mergence of the lower and the cylindricalinterfaces, which is earlier than that of the upper and cylind-rical interfaces, and gas accumulation initially around the wellwithin the cylindrical dissociated zone and immediately belowthe lower dissociation interface at later times of the produc-tion periods. (5) The temperature distribution in the depositconfirmed the earlier conclusion that there is fluid flow fromboth the upper and lower boundaries. The disappearance ofthe low-T zoneabove thewell (causedbyhydrate dissociation)indicates the relatively warmer water flows and heat flowsfrom the overburden (where there is an inversion of geother-mal gradient because of dissociation-induced cooling in theHBL). Also, the temperature increase immediately below thewell is caused by the warmer water rising from the under-burden. (6) The analysis of sensitivity toSH0 indicated that themaximum of the total gas production rate QPT increasedinitially with a decrease in SH0 but declined in the long runwith a decrease inSH0 because of a leaner resource. In general,a higher SH0 is associated with a higher gas production and amore favorable RGW. (7) Sensitivity analysis indicated thatsignificant deterioration of gas production performance isobservedwith a declining intrinsic permeability k of the deposit(including the overburden, the HBL, and the underburden)despite an improvement in the RGW performance. (8) Theanalysis of sensitivity to the temperature of the circulating hotwater in the well TW indicates that the higher TW has apractically negligible effect on gas production performance,with practically no impact onbothQPT andRGW.This indicatesthat of the combination of depressurization and thermal stim-ulation that is possible in the well design used in this study,depressurization is the only active dissociation method, thusconfirming earlier observations about its superior effective-ness (be orders ofmagnitude5). The reason for this is the narroweffective range of TW around the well, caused by the limitedefficiency of conduction as the main heat transfer mechanismand the opposite direction of the conductive and advectiveheat flows. (9) The analysis of sensitivity to the initial tem-perature in the middle of the HBL T0 indicates that deeper,warmer deposits have consistently a higher production po-tential, but this does not mean that they can attain commer-cially viable performance. (10) After conducting a thoroughsensitivity analysis involving reasonable system parametersand conditions, it appears that the hydrate accumulations atthe SH7 site of the ShenhuArea in the SouthChina Sea do not
Figure 18. Sensitivity analysis: effect of lower T0 on QPG, QPT, QR,and RGW when ΔPW = 0.2P0 during gas production from themethane hydrate deposit at the SH7 Site of the Shenhu Area, SouthChina Sea (P0 = 13.7 MPa, T0 = 13.7 �C in the reference case).
Energy Fuels 2010, 24, 6018–6033 : DOI:10.1021/ef100930m Li et al.
appear to be promising candidates for gas production whenusing current horizontal well technology.
Acknowledgment. This work was supported by NationalNatural Science Foundation of China (Grants 20773133,51004089, and 51076155), CASKnowledge Innovation Program(Grant KGCX2-YW-3X6), Science & Technology Programof Guangdong Province (Grant 2009B050600006), and CASMagnitude Science and Technology Apparatus DevelopmentProgram (Grant YZ200717), which are gratefully acknowledged.The contribution ofG. J.Moridis was supported by theAssistantSecretary for Fossil Energy, Office of Natural Gas and Petro-leum Technology, through the National Energy TechnologyLaboratory, under the U.S. Department of Energy, ContractNo. DE-AC02-05CH11231. The authors are indebted to MattReagan and Dan Hawkes for their insightful comments.
Nomenclature
C = specific heat (J/kg/K)k= intrinsic permeability (m2)keff = effective permeability (m2)krA = aqueous relative permeability (m2)krG = gas relative permeability (m2)kΘ = thermal conductivity (W/m/K)kΘRD = thermal conductivity of dry porous medium
(W/m/K)kΘRw = thermal conductivity of fully saturated porous
medium (W/m/K)kΘI = thermal conductivity of ice (W/m/K)MW = the cumulative mass of the produced water (m3 of
H2O)P = pressure (Pa)PB = initial pressure at base of HBL (Pa)P0 = initial pressure in the middle of HBL (Pa)PW = pressure at the well (Pa)PQ = pressure at the quadruple point (Pa)QPD = QPT - QPG (ST m3/day/m of well)QW = mass rate of aqueous phase production at the well
(kg/day/m of well)QPG=volumetric rate of CH4 production at the well in the
gas phase (ST m3/day/m of well)QPT= volumetric rate of total CH4 production at the well
(ST m3/day/m of well)QR = volumetric rate of CH4 release from hydrate dis-
sociation (ST m3/day/m of well)
r= radius (m)RGW = the gas to water production ratio (ST m3 of CH4/
m3 of H2O/m of well)S = phase saturationt = times (days)T = temperature (�C)TB = initial temperature at base of HBL (�C)T0F = temperature at the ocean floor (�C)T0 = initial temperature in the middle of HBL (�C)VP = the cumulative volume of the produced CH4 (ST m3
of CH4)x,y,z = Cartesian coordinates (m)XS = salinityΔPW = driving force of depressurization, P0 - PW (Pa)Δx = discretization along the x-axis (m)Δz = discretization along the z-axis (m)ΔZH = HBL thickness (m)ΔZO = overburden thickness (m)ΔZU = underburden thickness (m)ΔZW = well position above the HBL base (m)φ = porosityFR = grain density (kg/m3)λ= van Genuchten exponent, Table 2
Subscripts and Superscripts
0 = denotes initial stateA = aqueous phaseB = base of HBLcap = capillarye = equilibrium conditionsG = gas phaseH = solid hydrate phaseI = ice phaseirA = irreducible aqueous phaseirG = irreducible gasn= permeability reduction exponent, Table 2nG = gas permeability reduction exponent, Table 2O = overburdenP = production streamR = rockS = salinityU = underburdenW = well