Evaluation of GE Water & Process Technology’s UF Membrane at Various Water Quality Parameters Name: Doo Hyun Chung ([email protected]), Harvey Mudd College Advisors: Dr. Jaehong Kim ([email protected]) Dr. Pyung Kyu Park ([email protected]) Department of Civil and Environmental Engineering, Georgia Institute of Technology HMC Liaison Advisor: Dr. Nancy Lape ([email protected]) Department of Engineering, Harvey Mudd College The main limitation of the ultrafiltration (UF) process in drinking water treatment is membrane fouling. This constant-flux, pilot-scale research evaluates General Electrics (GE) Water & Process Technology’s UF211/UFC211 membrane at various source water conditions such as different humic acid (HA) concentrations, turbidity, pH, alkalinity and calcium ion concentrations. Different backwashing intervals were also tested to see what effects backwashing has on membrane fouling. Membrane performance was evaluated in terms of pilot plant run time and the resulting foulants were characterized. The results show that humic acid fouls membrane by adsorption and pore blocking while bentonite is mainly responsible for forming a cake layer on the surface of the membrane. pH and alkalinity did not affect the membrane performance. High calcium concentrations were found to change HA characteristics dramatically and GE’s UF membrane was found to be incapable of filtering out this transformed HA. Shorter Backwashing interval improved backwashing efficiency. However, presence of calcium dramatically reduced backwashing efficiency. For further applications, these results can be used to optimize the best operating configurations for a filtering unit to process source water of different qualities. I. Introduction Since 1990’s the applications of membrane processes such as microfiltration (MF), ultrafiltration (UF), nanofiltration (NF) and reverse osmosis (RO) have rapidly increased in full- scale water and wastewater treatment [1-4]. Especially, during the past decade UF has emerged as one of the most reliable, cost-effective, and sustainable unit process for the production of drinking water [5]. Capillary UF is usually used as a final treatment step in advanced treatment plans all over the world to successfully remove viruses, bacteria and the finest particles. Today, such plant treats different types of waters (mainly surface water and ground water, typically of high turbidity) at a rate between 1000 m 3 /d and 150,000 m 3 /d [6]. UF technology has been adopted and developed by General Electrics (GE) Water & Process Technology and currently, GE’ s filtration module with UF membrane is filtering faucet water to provide drinking water of highest quality to regular households. Recently, GE has shown interest in bringing the same membrane technology out of households where the pre- filtered water quality is much worse off. The ultimate goal of this project is to be able to bring a filtering machine to places where fresh water is scarce, such as developing countries or tsunami sites, quickly take samples of local water, analyze the water quality and finally operate the filtering machine at the optimal settings to provide fresh water to people in need. The objective of this preliminary research is to evaluate the performance of GE’s UF membrane at various conditions such as different normal organic matter (NOM) loadings, turbidity, pH, alkalinity, calcium ion concentrations, and backwashing interval.
Transcript
Evaluation of GE Water & Process Technology’s UF Membrane at
Various Water Quality Parameters Name: Doo Hyun Chung ([email protected]), Harvey Mudd College
The main limitation of the ultrafiltration (UF) process in drinking water treatment is membrane fouling. This constant-flux, pilot-scale research evaluates General Electrics (GE) Water & Process Technology’s UF211/UFC211 membrane at various source water conditions such as different humic acid (HA) concentrations, turbidity, pH, alkalinity and calcium ion concentrations. Different backwashing intervals were also tested to see what effects backwashing has on membrane fouling. Membrane performance was evaluated in terms of pilot plant run time and the resulting foulants were characterized. The results show that humic acid fouls membrane by adsorption and pore blocking while bentonite is mainly responsible for forming a cake layer on the surface of the membrane. pH and alkalinity did not affect the membrane performance. High calcium concentrations were found to change HA characteristics dramatically and GE’s UF membrane was found to be incapable of filtering out this transformed HA. Shorter Backwashing interval improved backwashing efficiency. However, presence of calcium dramatically reduced backwashing efficiency. For further applications, these results can be used to optimize the best operating configurations for a filtering unit to process source water of different qualities.
I. Introduction
Since 1990’s the applications of membrane processes such as microfiltration (MF),
ultrafiltration (UF), nanofiltration (NF) and reverse osmosis (RO) have rapidly increased in full-
scale water and wastewater treatment [1-4]. Especially, during the past decade UF has emerged
as one of the most reliable, cost-effective, and sustainable unit process for the production of
drinking water [5]. Capillary UF is usually used as a final treatment step in advanced treatment
plans all over the world to successfully remove viruses, bacteria and the finest particles. Today,
such plant treats different types of waters (mainly surface water and ground water, typically of
high turbidity) at a rate between 1000 m3/d and 150,000 m
3/d [6].
UF technology has been adopted and developed by General Electrics (GE) Water &
Process Technology and currently, GE’s filtration module with UF membrane is filtering faucet
water to provide drinking water of highest quality to regular households. Recently, GE has
shown interest in bringing the same membrane technology out of households where the pre-
filtered water quality is much worse off. The ultimate goal of this project is to be able to bring a
filtering machine to places where fresh water is scarce, such as developing countries or tsunami
sites, quickly take samples of local water, analyze the water quality and finally operate the
filtering machine at the optimal settings to provide fresh water to people in need. The objective
of this preliminary research is to evaluate the performance of GE’s UF membrane at various
conditions such as different normal organic matter (NOM) loadings, turbidity, pH, alkalinity,
calcium ion concentrations, and backwashing interval.
It is generally accepted that NOM represent main foulant for surface waters. Within
NOM, humic substances and polysaccharides were shown to be critical to UF due to membrane
adsorption and pore blocking [7-12]. Humic substances are refractory anionic macromolecules of
low to moderate molecular weight. They contain both aromatic and aliphatic components with
primarily carboxylic and phenolic functional groups with carboxylic functional groups
accounting for 60%-90% of all functional groups. Therefore, humic substances are generally
negatively charged in the pH range of natural waters [8, 13].
Humic substances in water stabilize inorganic particles such as bentonite by readily
adsorbing to mineral surfaces [14]. Mallevialle et al. [15] characterized the fouling layer formed
by NOM in presence of inorganic particles. They found that the fouling layer was composed
mostly of clay and organic matter, which was found to be packed under the inorganic fouling
layer. Previous studies also revealed that NOM adsorption is influenced by divalent cations and
pH [16-18]. Especially, calcium had very strong influence on destabilizing the particles [19, 20].
Therefore, the combined interactions between humic substances and other substances in aquatic
environments are very complicated, even more so in membrane studies as the fouling mechanism
not only deals with chemical interactions but also physical ones.
There have been many extensive studies to investigate the exact fouling mechanisms of
specific substances. In this particular study, the focus is not so much on understanding the exact
fouling mechanisms. Rather, more emphasis will be put on generating big pictures of the effects
of particular water quality parameters on membrane fouling. In this paper, direct-flow UF using
outside-in hollow fiber membranes with source water of various quality and different operating
conditions is analyzed to find the effect of each water quality parameter on the membrane
performance in terms of pilot plant run time and its cake characteristics.
II. Calculations
Calculation of Permeate Flux
The permeate flux J (L T-1
) is calculated by
where Q (L
3 T
-1) is the volumetric flow rate and Am (L
2) is the total outside area of the
membrane fibers.
Categorization of Fouling Materials
For a fouled membrane unit, the fouling materials were split into three categories: i)
deposited particles in form of reversible cakes that can be eliminated by a process of running
water and air across the surface of the membrane fibers called flushing, ii) absorbed or gelled
organic and inorganic compounds, which can be cleaned by chemical cleaning, and iii) any other
compounds that cannot be removed by chemical cleaning. Resistance was correspondingly
categorized as cake resistance (Rc, type i), reversible resistance (Rrf, type ii) and irreversible
resistance (Rif, type iii).
Cake Filtration
The permeate flux J (L T-1
) of a fluid with absolute viscosity μ (ML-1
T-1
) during
filtration under a transmembrane pressure ΔP (ML-1
T-2
) is given by Darcy’s law as
where Rm (L-1
) is the membrane resistance. This equation is used to calculate the resistance of
each type of foulant which corresponds to how much foulant of each type is present after
filtration.
III. Materials and Methods
Materials
Calcium chloride and bentonite were purchased from Fisher Scientific (Pittsburgh, PA). Humic
acid sodium salt was obtained from Sigma-Aldrich (St. Louis, MO). 1 N HCl was prepared by
diluting 37% HCl (Acros Organic, Morris Plains, NJ). 1 N NaOH was prepared by dissolving
NaOH pellet (Fisher Scientific, Pittsburgh, PA) in water purified by the Mili-Q water purification
system (Millipore, Billerica, MA). Humic acid stock solution was prepared by adding 2 g of
humic acid sodium salt to 1 L of Milli-Q water. Bentonite stock solution was prepared by adding
10 g of bentonite to 1 L of Milli-Q water. UF membrane (Model UF211 / UFC211) was provided
by GE Water & Process Technology. Its specifications appear in Table 1.
Table 1: Specifications of UF membrane used in this research Manufacturer GE Water & Process Technologies
Model UF 211 / UFC 211
Size (l x w x h) 63.5” x 16” diameter
Inside Diameter of Fiber 0.016” (0.4mm)
Outside Diameter of Fiber 0.032” (0.8mm)
Flow Direction outside in
Membrane Construction Hollow fiber
Membrane Material Polyvinylidene Fluoride (PVdF)
Membrane Surface Characteristics Hydrophilic
Membrane Charge <slightly> negative /positive Non ionic
Nominal Molecular Weight Cutoff 100,000 Daltons
Nominal Membrane Pore Size 0.02 microns
Synthetic Source Water
Source water was prepared by the following procedure: 1) Deionized (DI) water
provided by Georgia Institute of Technology’s lab facility was poured into a 20-L container up to
about 80% of total volume; 2) Sodium Bicarbonate (NaHCO3) was added to control alkalinity (0,
50, 150 mg CaHCO3/L); 3) Calcium Chloride (CaCl2) was added to control calcium
concentration (0, 0.5, 5 mM); 4) Humic acid was added for NOM control (0, 2, 10, 50 mg C/L);
5) Bentonite was added to control turbidity (0, 5, 20, 50 NTU); 6) pH was controlled at 5, 7, and
9 with 1 N HCl and 1 N NaOH; 7) DI water was poured into the container to make total volume
20 L. The solution was thoroughly mixed after each step to avoid any possible chemical change
due to uneven concentration gradient as humic acid is reported to change for different
concentrations of metal ions such as calcium [21]. The temperature for all source water was
maintained at 21- 22 °C.
Water Quality Measurements
When the source water was prepared, samples were taken to measure humic acid
concentration, turbidity and pH. Humic acid concentration in stock solution was measured as
total organic carbon (TOC) by a TOC analyzer (TOC-V ws, Shimadzu Scientific Instruments,
Columbia, MD), and as UV absorbance at 254 nm (UVA254) by a spectrophotometer (8453
UV/VIS spectrophotometer, Agilent Technologies, Inc., Santa Clara, CA). Once UVA254 was
calibrated with TOC, only UVA254 was used to monitor humic acid concentration as UVA254
correlates to TOC measurements [22-24]. Before each UVA measurement, samples were filtered
with 0.45 μm membrane filter (Supor®-450 PALL Life Science, Port Washington, NY).
Turbidity was measured with a Hach Corporation’s turbidimeter (Hach 2100N, Hach Company,
Loveland, CO). Finally, pH was measured with Accumet AR50 pH meter (Fisher Scientific,
Pittsburgh, PA).
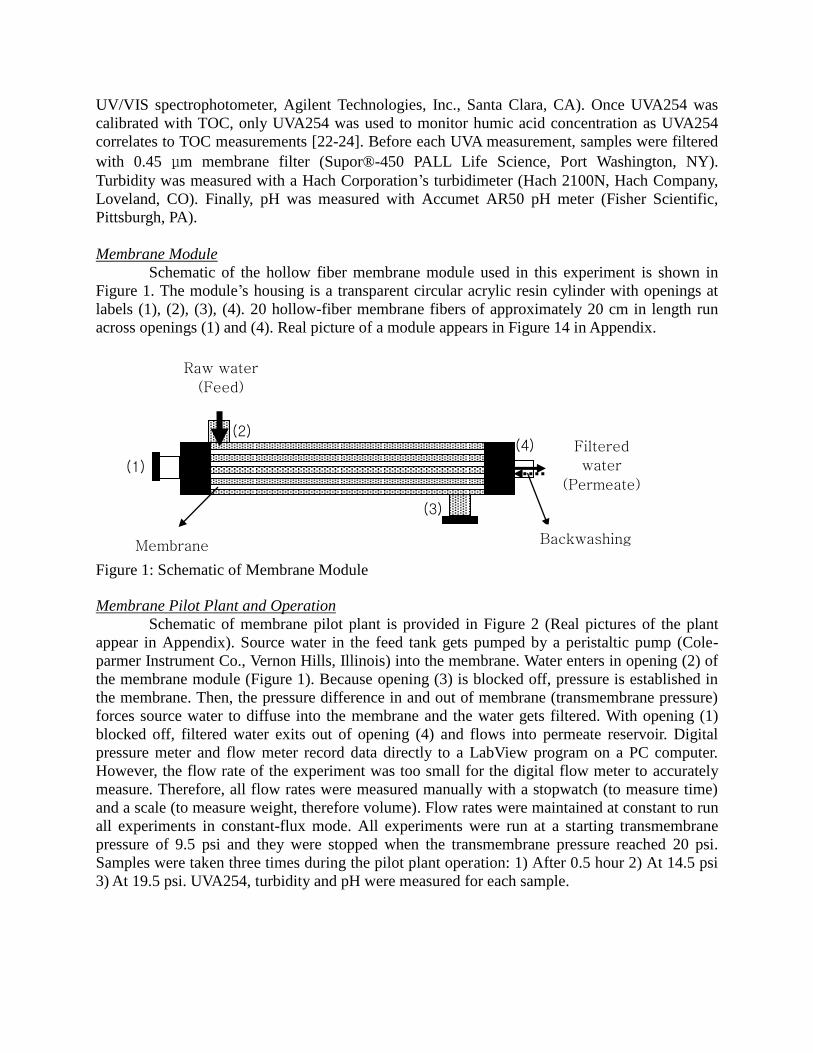
Membrane Module
Schematic of the hollow fiber membrane module used in this experiment is shown in
Figure 1. The module’s housing is a transparent circular acrylic resin cylinder with openings at
labels (1), (2), (3), (4). 20 hollow-fiber membrane fibers of approximately 20 cm in length run
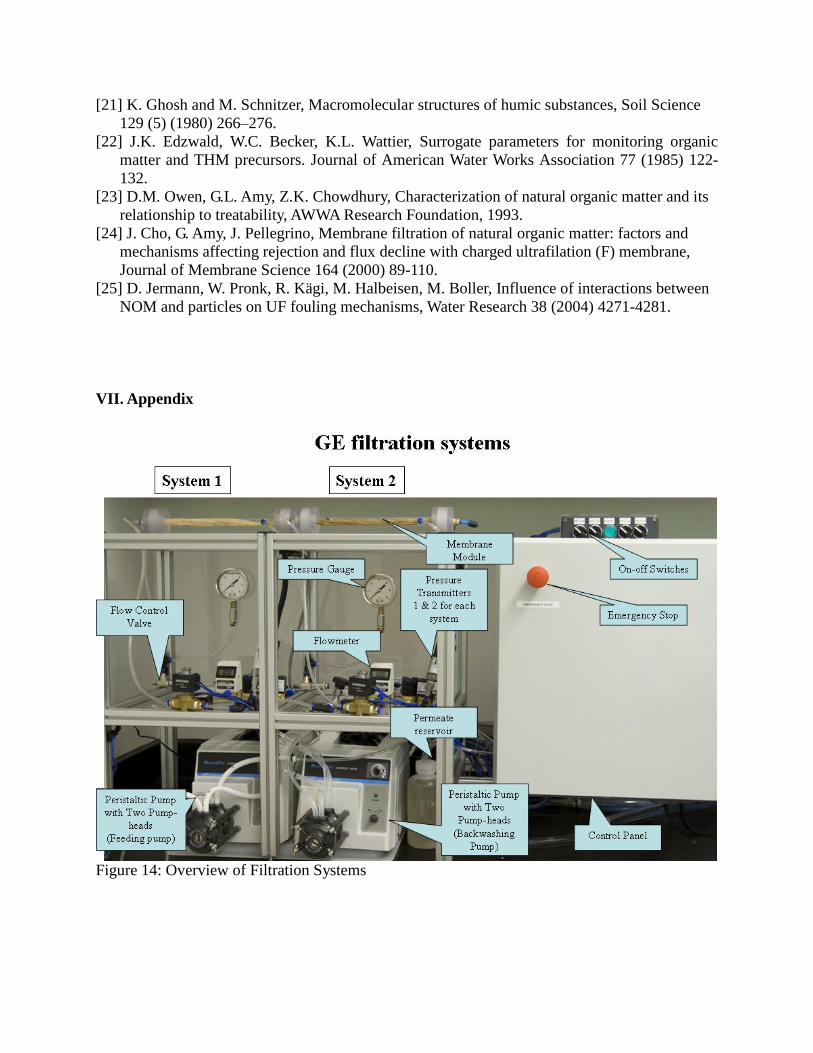
across openings (1) and (4). Real picture of a module appears in Figure 14 in Appendix.
Figure 1: Schematic of Membrane Module
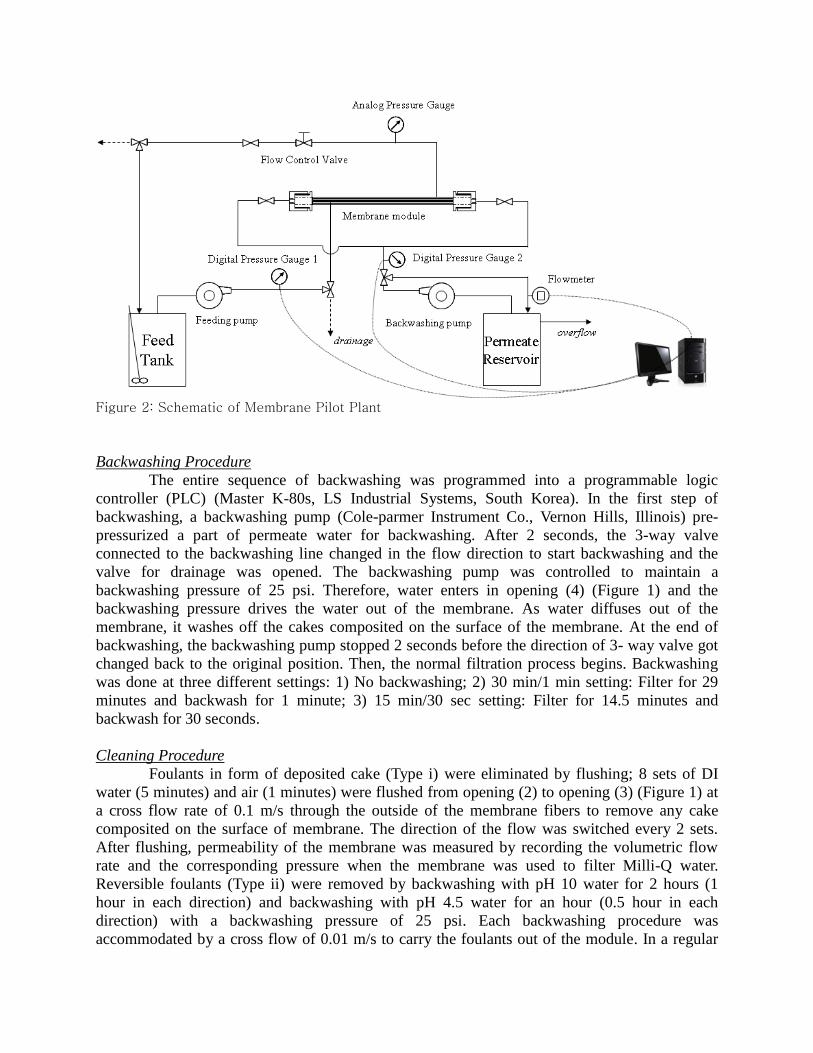
Membrane Pilot Plant and Operation
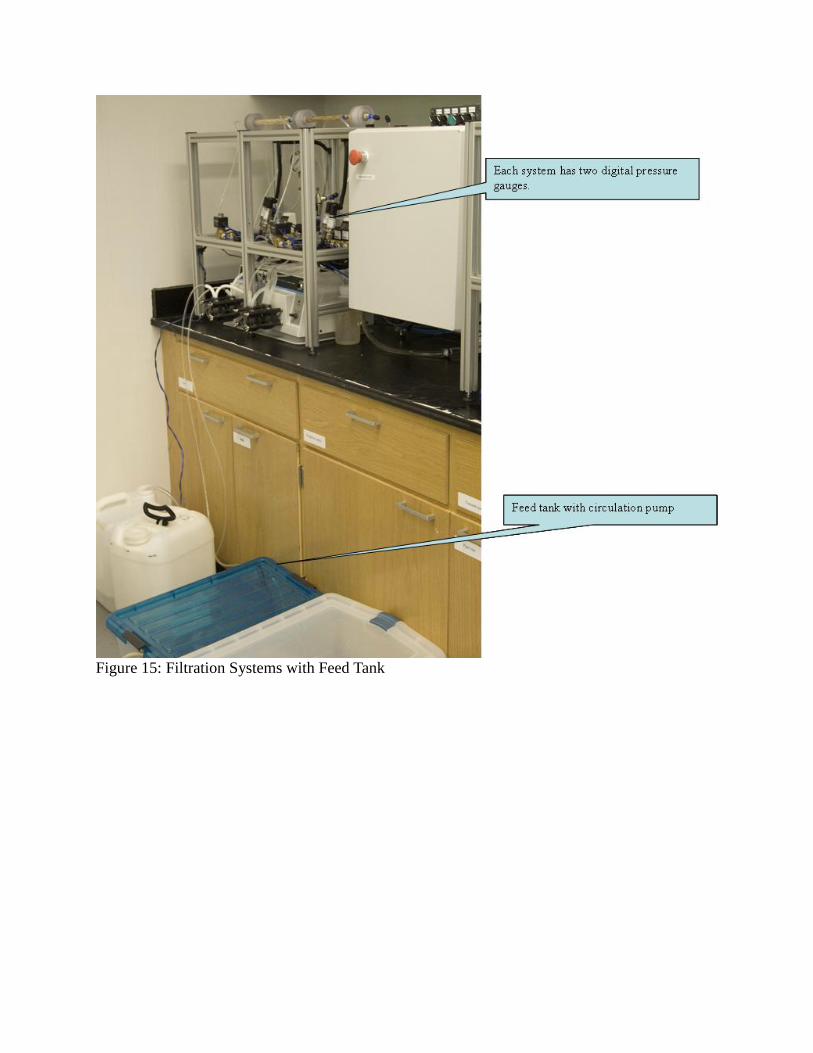
Schematic of membrane pilot plant is provided in Figure 2 (Real pictures of the plant
appear in Appendix). Source water in the feed tank gets pumped by a peristaltic pump (Cole-
parmer Instrument Co., Vernon Hills, Illinois) into the membrane. Water enters in opening (2) of
the membrane module (Figure 1). Because opening (3) is blocked off, pressure is established in
the membrane. Then, the pressure difference in and out of membrane (transmembrane pressure)
forces source water to diffuse into the membrane and the water gets filtered. With opening (1)
blocked off, filtered water exits out of opening (4) and flows into permeate reservoir. Digital
pressure meter and flow meter record data directly to a LabView program on a PC computer.
However, the flow rate of the experiment was too small for the digital flow meter to accurately
measure. Therefore, all flow rates were measured manually with a stopwatch (to measure time)
and a scale (to measure weight, therefore volume). Flow rates were maintained at constant to run
all experiments in constant-flux mode. All experiments were run at a starting transmembrane
pressure of 9.5 psi and they were stopped when the transmembrane pressure reached 20 psi.
Samples were taken three times during the pilot plant operation: 1) After 0.5 hour 2) At 14.5 psi
3) At 19.5 psi. UVA254, turbidity and pH were measured for each sample.
Raw water
(Feed)
Membrane
Filtered
water
(Permeate)
Backwashing
(1)
(2)
(3)
(4)
Figure 2: Schematic of Membrane Pilot Plant
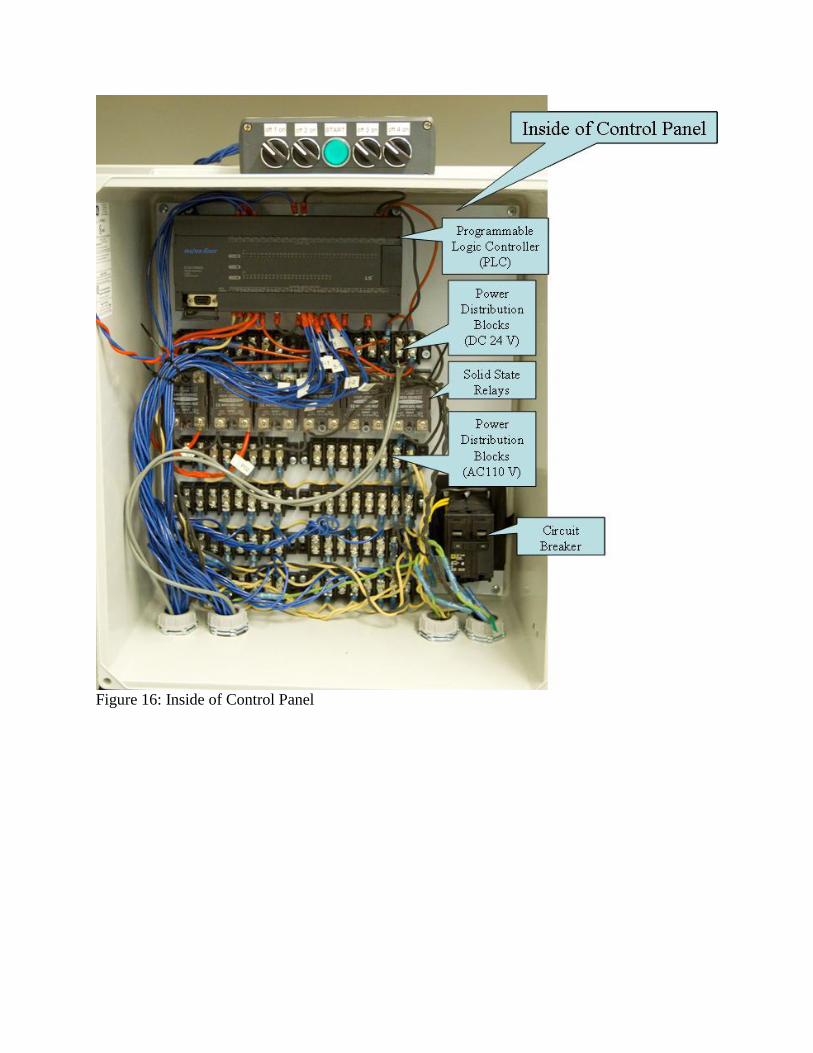
Backwashing Procedure
The entire sequence of backwashing was programmed into a programmable logic
controller (PLC) (Master K-80s, LS Industrial Systems, South Korea). In the first step of
backwashing, a backwashing pump (Cole-parmer Instrument Co., Vernon Hills, Illinois) pre-
pressurized a part of permeate water for backwashing. After 2 seconds, the 3-way valve
connected to the backwashing line changed in the flow direction to start backwashing and the
valve for drainage was opened. The backwashing pump was controlled to maintain a
backwashing pressure of 25 psi. Therefore, water enters in opening (4) (Figure 1) and the
backwashing pressure drives the water out of the membrane. As water diffuses out of the
membrane, it washes off the cakes composited on the surface of the membrane. At the end of
backwashing, the backwashing pump stopped 2 seconds before the direction of 3- way valve got
changed back to the original position. Then, the normal filtration process begins. Backwashing
was done at three different settings: 1) No backwashing; 2) 30 min/1 min setting: Filter for 29
minutes and backwash for 1 minute; 3) 15 min/30 sec setting: Filter for 14.5 minutes and
backwash for 30 seconds.
Cleaning Procedure
Foulants in form of deposited cake (Type i) were eliminated by flushing; 8 sets of DI
water (5 minutes) and air (1 minutes) were flushed from opening (2) to opening (3) (Figure 1) at
a cross flow rate of 0.1 m/s through the outside of the membrane fibers to remove any cake
composited on the surface of membrane. The direction of the flow was switched every 2 sets.
After flushing, permeability of the membrane was measured by recording the volumetric flow
rate and the corresponding pressure when the membrane was used to filter Milli-Q water.
Reversible foulants (Type ii) were removed by backwashing with pH 10 water for 2 hours (1
hour in each direction) and backwashing with pH 4.5 water for an hour (0.5 hour in each
direction) with a backwashing pressure of 25 psi. Each backwashing procedure was
accommodated by a cross flow of 0.01 m/s to carry the foulants out of the module. In a regular
backwashing procedure, water enters in (4). Because opening (1) is blocked off, the backwashing
pressure drives water out of membrane, removing any remaining foulants from membrane pores
and surfaces. Because cross flow enters in opening (3), water exits out to opening (2) and goes
out to drainage. The reverse direction proceeds in the same manner from opening (1) to opening
(3) and cross flow from opening (2) to (3). Permeability of the membrane was measured the
same way as described above.
Table 2: Summary of Important Water Quality Parameters
* indicates the standard condition
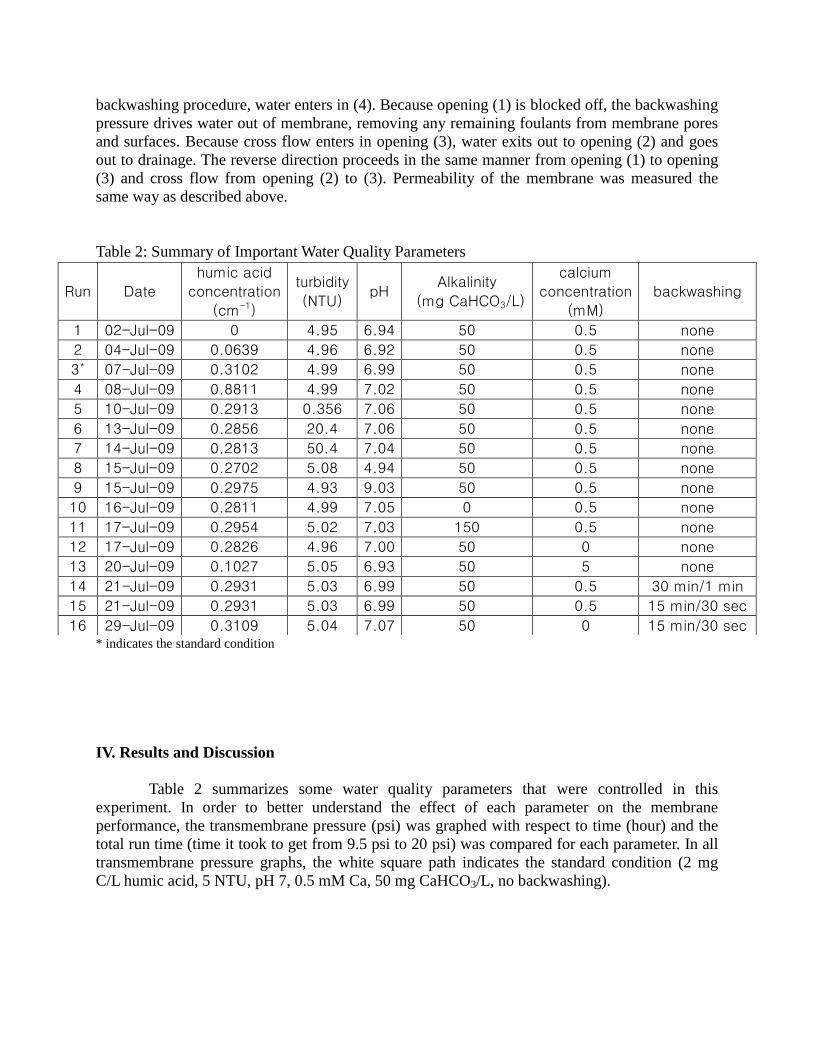
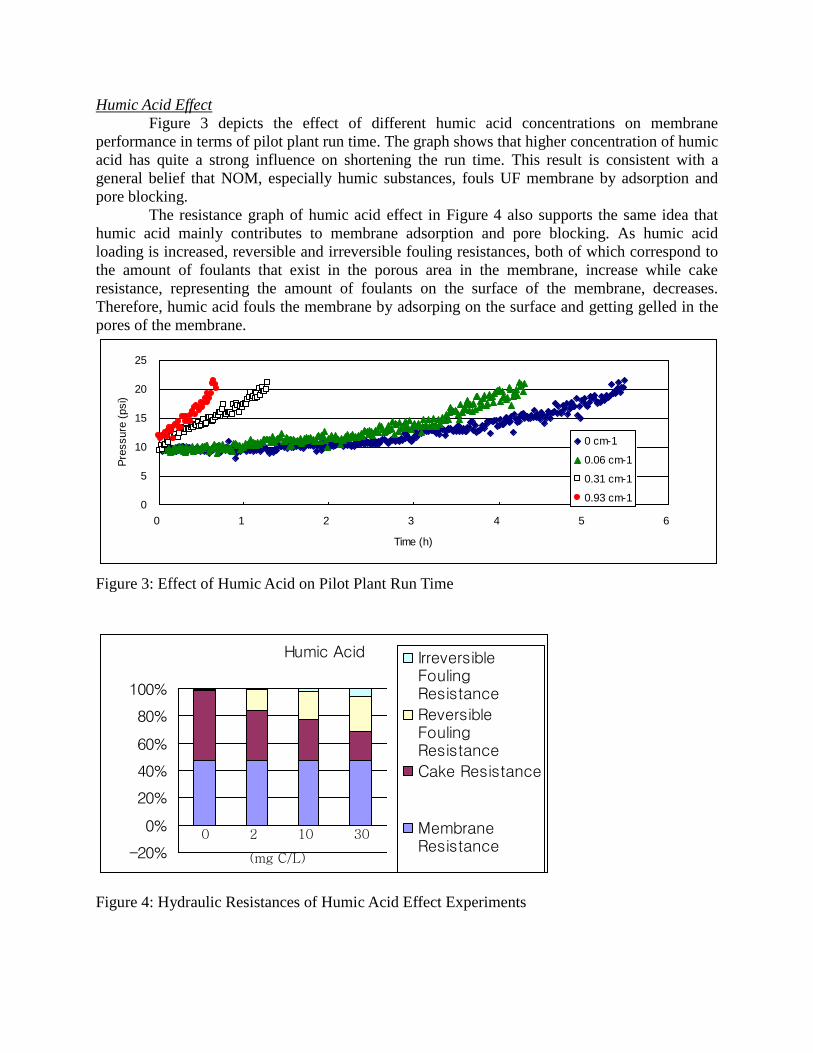
IV. Results and Discussion
Table 2 summarizes some water quality parameters that were controlled in this
experiment. In order to better understand the effect of each parameter on the membrane
performance, the transmembrane pressure (psi) was graphed with respect to time (hour) and the
total run time (time it took to get from 9.5 psi to 20 psi) was compared for each parameter. In all
transmembrane pressure graphs, the white square path indicates the standard condition (2 mg
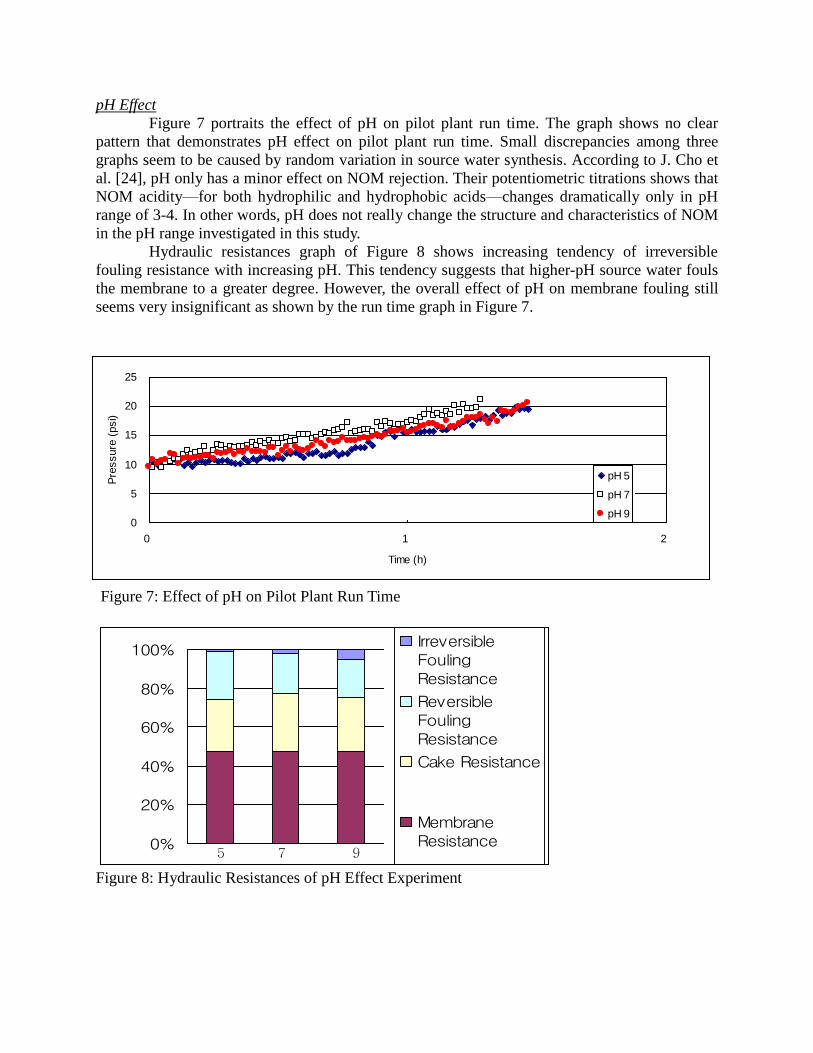
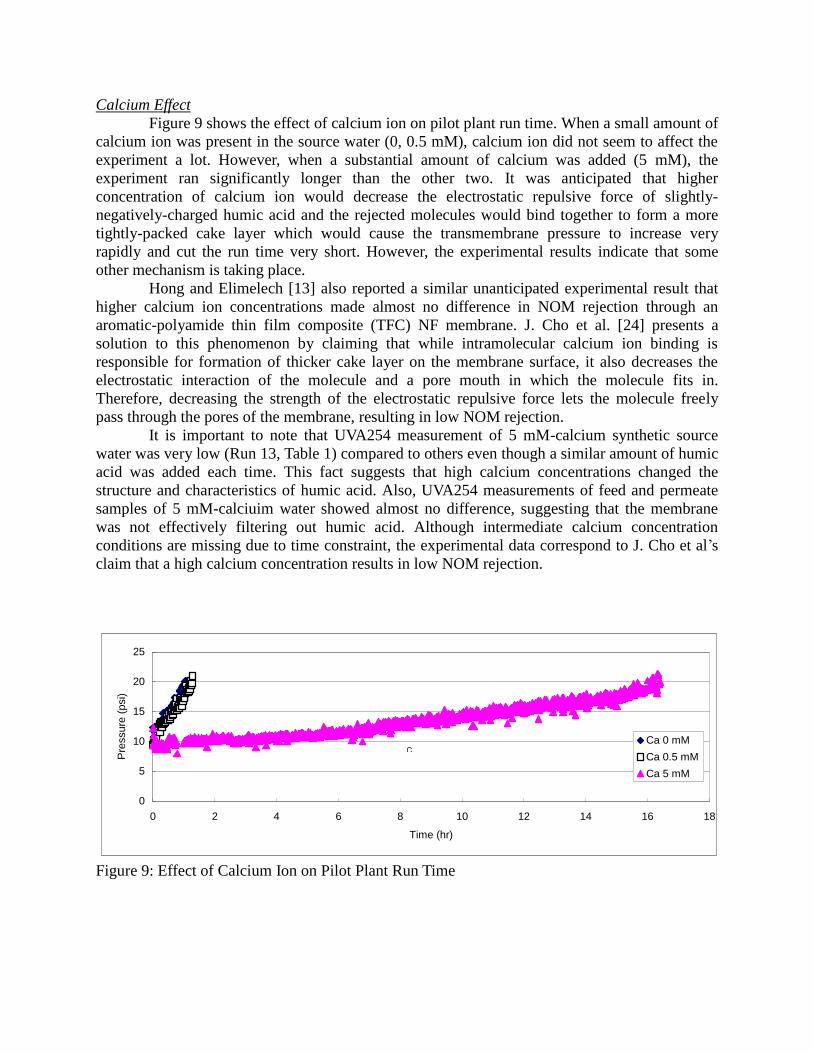
C/L humic acid, 5 NTU, pH 7, 0.5 mM Ca, 50 mg CaHCO3/L, no backwashing).