Evaluation of Genetic Structure and Population Estimate In New Jersey Black Bears (Ursus americanus) Jane E. Huffman, MS, PhD, MPH Project Director Terri Ombrello, BS Drew Zellner, MS Northeast Wildlife DNA Laboratory Applied DNA Sciences East Stroudsburg University
Transcript
Evaluation of Genetic Structure and Population Estimate InNew Jersey Black Bears (Ursus americanus)
Jane E. Huffman, MS, PhD, MPH Project DirectorTerri Ombrello, BSDrew Zellner, MSNortheast Wildlife DNA LaboratoryApplied DNA SciencesEast Stroudsburg UniversityEast Stroudsburg, PA 18301
New Jersey Black Bear (Ursus americanus) Population Estimate Report 2010
2
AcknowledgementsWe would like to thank the following people and organization for logistical support andfunding.
NJ Division of Fish & WildlifeKelcey BurguessPatrick CarrHeather MadoniaMichael MadoniaAnthony McBrideAmy SchweitzerChuck Sliker
3
INTRODUCTION
History of Black Bears In New Jersey
Black bears are native to New Jersey and are the largest land mammal in NJ. They are anintegral part of the state's natural heritage and a vital component of healthy ecosystems.Since the 1980s the New Jersey black bear population has been increasing and expandingits range both southward and eastward from the forested areas of northwestern NewJersey. Within the most densely populated state in the nation, black bears are thriving andthere are now confirmed bear sightings in all 21 of New Jersey's counties.
The growing population has primarily been due to increased black bear habitat asagriculture lands reverted to mature forests, protection afforded by game animal status,and increasing bear populations in Pennsylvania and New York which pushed animalsinto the state. A New Jersey black bear management plan concluded in 1997 that habitatfragmentation and human population growth has made it untenable to continuemaintaining a black bear population at its present level (450 to 550). They suggested itbe reduced and maintained at 272 to 340. In the first hunting season in 30 years, in 2003,more than 300 bears were killed and the population in the hunt area was estimated to be1,777 (Brown, 2009).
To better manage the growing black bear population and respond to black bearcomplaints, the Division formed the Black Bear Project Team in 2001. The Division andBlack Bear Project Team use a comprehensive approach to managing black bears andfostering coexistence between people and bears.Expansion of Black Bear Populations into NJIn New York State the Catskill region in the Southern Bear Range contains a populationof 1,500 to 2,000 black bears.
The Southern Black Bear Range is made up of much of the Allegany Plateau, the CatskillMountains and the Taconic Highlands. This range extends from the southwest corner ofthe state, easterly along the Pennsylvania border, through south central New York in theBinghamton area, into the Catskill Mountains and to southern Orange and RocklandCounties at the New Jersey border. Although the actual numbers are not known, it is clearthat a portion of the bear population in this range is an expansion of Pennsylvania’s bearpopulation. There is considerable evidence of bears freely passing from one state toanother. Some significant parcels of forested property stretch from the New Jersey borderand follow northeast along Interstate 87 to the Hudson River. This is a primary corridorfor bear immigration from and into New Jersey.
The immigration and emigration of bears to and from adjoining states is an importantconsideration for black bear management. Bears immigrate from New York andPennsylvania into New Jersey
Biologists have monitored black bear (Ursus americanus) populations using annualLincoln-Petersen (L-P) estimates of population size derived from the fraction of marked
4
bears recovered in the harvest (Diefenbach et al. 2004).In 2001 the Pennsylvania black bear population was estimated at 12,000 (Ternent 2005).New Jersey projected that as of 2003 there were 3,278 adult bears residing in the state(Carr and Burguess 2002).
Currently, only fourteen states use DNA analysis to complete population estimates fortheir black bear populations along with mark – recapture techniques (Table 1).
Table 1: List of Methods used to calculate population estimates and to conduct other bearresearch for each U.S. state.
StateMethods of Population Estimationand Research Article
AL Capture/release; tagged, radio collared (Clark 1999)
AKMark/recapture (Lincoln-Peterson), futurebiomarking, DNA (Peacock 2002)
AZ not found not foundAR hunter harvested estimations (Estridge and Henderdon 2006)
CAcementum annuli analysis, hunter surveys,& harvest data (CA Dept. Fish and Game 1998)
CO GPS and Tracking (Baruch-Mordo, S. 2007)
CT Trap-mark-releaseConnecticut Department of EnvironmentalProtection
DE believed to be extirpated n/a
FLhabitat assessment, nuisance complaints,bear roadkill, and sightings (Eason, T.H. 2003)
GA DNA capture/release and radio collars South Carolina Dept. of Natural ResourcesHI no bears found in Hawaii n/aID harvest data Idaho Fish and GameIL believed to be extirpated n/aIN believed to be extirpated n/aIA believed to be extirpated n/aKS believed to be extirpated Kansas Department of Wildlife and Parks
NH hunter surveysNew Hampshire Fish and GameDepartment
NJ mark/recapture future: DNA analysis (Carr and Burguess 2002)NM capture, GIS, and Annuli analysis (Costello, C. et. al 2001)
State Methods of Population Estimation andResearch Article
NY bear harvests, non-hunting mortality, andnuisance complaints (Bureau of Wildlife 2007)
NC hunter and automobile killed bear informationand teeth collection
North Carolina Wildlife ResourcesCommission
ND believed to be extirpated n/aOH not found n/aOK DNA Analysis, mark/recapture, radio collars (Cook, R.L. 2005)OR not found n/aPA harvest data, mark-recapture (Ternent 2006)RI not found n/a
SC DNA mark/recapture South Carolina Dept. of NaturalResources
SD DNA mark/recapture South Carolina Dept. of NaturalResources
TN DNA mark/recapture South Carolina Dept. of NaturalResources
TX Collecting hair and tissue samples for futureDNA analysis (Cook, R.L. 2005)
UT Current: harvest; Future: cementum annulianalysis and track transects (Black 2000)
VT radio collars; hunter harvest information Vermont Fish and Wildlife Department
VA harvest, nuisance reports, and structure (Virginia Department of Game andInland Fisheries 2002)
WA current project- using DNA analysis (Koehler, G. 2001)
WV mark/recapture and radio transmitters West Virginia Department of NaturalResources
WI harvest information, and bait station visitationcalculations (Rolley, R.E. and M.P. Woodford 2007)
WY Current:hunter harvest information, Futureresearch: DNA mark/recapture (Trophy Game Section (WY) 2007)
Genetic Fingerprinting to Estimate Bear Population Numbers
The recent development of using genetic fingerprinting to estimate size of wildlifepopulations has provided bear biologists with a more efficient tool to estimate bearnumbers than traditional mark-recapture techniques. The technique was pioneered withgrizzly bears and black bears in British Columbia (Woods et al. 1999).
6
Genetic analyses offer important insights into the population structure and connectivityamong wide-ranging animals such as bears. Genetic data provide information abouthistoric and current levels of gene flow among populations, as well as information aboutgenetic diversity and fitness, relatedness, and movement patterns within populations(Queller et al. 1993; Paetkau et al. 1998; Schenk et al. 1998; Woods et al. 1999).Genetic information is essential to estimating population viability and evaluating possiblemanagement decisions
Population genetics provides a finer scale perspective, requiring genetic markers of finerresolution, or greater variability, than phylogeography. Microsatellites have beenwidespread in wildlife population genetics research (Snow & Parker 1998). Thedistribution of allele frequencies can be informative regarding definition of geneticpopulations, the geographic ranges of populations, changes in population size anddetection of recent population bottlenecks (Deyoung & Honeycutt 2005). Populationassignment tests use allele frequencies to detect population structure and determine thenatal population of an individual (Paetkau et al. 1995).
Measuring levels of genetic variation is an important aspect of conservation genetics.The informativeness of such measurements is related to the variability of the geneticmarkers used; a particular concern in species, such as bears, which are characterized bylow levels of genetic variation resulting from low population densities and small effectivepopulation size.
Population Genetics
The detection and location of genetic discontinuities is important to managing naturalwildlife populations, and is an important first step in more complex analyses of theprocesses affecting genetic patterns (Manel et al., 2003; Scribner et al., 2005). Geneticpatterns are characterized by the distribution of alleles within populations or across space(Epperson, 2003; Manel et al., 2003). These patterns may depart from randomness,panmxia, due to various forms of isolation: geographic distance (Wright, 1943), dispersalbarriers (Manni et al., 2004), landscape resistance (Cushman et al., 2006), behaviorfactors (Deyoung, Honeycutt, 2005), or temporal factors (Vandewoestijne, Baguette,1999). Identifying genetic patterns and correlating them with influential landscapefeatures can provide ecological information, reveal cryptic population structure andsecondary contact between previously isolated populations (Manel et al., 2003). Thereare many applied examples. Genetic structure has been used to infer metapopulationdynamics (Manier, Arnold, 2005). Differences in spatial genetic structure related tolandscape patches has been used to determine effects of anthropogenic landscape changeon dispersal and gene flow (Banks et al., 2005).
7
Objectives
We used genetic data to estimate the effective population size of black bears in NewJersey and to evaluate population structure, and landscape-genetic relationships.
Specific objectives and research questions addressed included:
Objective 1: Describe population genetic structure and diversity of black bears in NJ.Determine effective population size .
Objective 2: Relate population genetic patterns to the landscape of New Jersey.
Is there evidence for increasing genetic isolation with geographic distance?
MATERIALS AND METHODS
Sample Collection and DNA Extraction
All samples of black bear DNA were provided by the New Jersey Division of Fish andWildlife (NJDFW). Tissue samples were collected from hunter harvested bears andresearch trapped bears. The tissue samples consisted of ear punches. Bears were sampledfrom the 4 bear management zones in NJ (Figure 1).
Figure 1 Bear management zones in NJ.
8
Samples were preserved in 95% ethanol and stored at -80°C. Three hundred sampleswere chosen to represent the greatest geographical distribution. A 2-3mm portion of theear punch was used for extraction of DNA. DNA was extracted using the MO BIO TissueExtraction Kit (MO BIO Laboratories, Inc. Carlsbad, CA.), using standard protocols.DNA was quantified using a Quantech fluorometer (Barnstead International, DubuqueIA.) and was amplified using PCR (Polymerase Chain Reaction).
PCR was performed on a 20uL solution consisting of 10uL of Promega Master Mix(Promega, Madison, WI.), 2.5uL of both forward and reverse primers, 50ng of DNA, anddistilled water. The primers used for PCR amplification were the following sixmicrosatellite loci (Table 2): G10B, G10X, G10M, G1D, G10C, G1A, G10J, G10L,G10P, Mu50, G10H, G10O, Mu59, and G10U (Paetkau and Strobeck 1994, Paetkau andStrobeck 1995, Paetkau et al., 1998, and Taberlet et al., 1997). Amplification wasperformed on a Thermo Scientific Thermal Cycler (Thermo Fisher Scientific Inc.,Waltham, MA.) using the following times and temperatures; 5 minutes at 95°C, then 35cycles of 1 minute at 95°C, 1 minute at 57°C, 58°C, or 60°C depending on themicrosatellite (Table 2), and 1 minute at 72°C. The extension reaction was set at 72°Cfor 5 minutes. The PCR products were then kept at 4°C until used within 1 to 3 days.
PCR Product Analysis
Microsatellite analysis was completed on the Applied Biosystems Genetic Analyzer 3130using the Genemapper 3.7 program (Applied Biosystems, Foster City, CA.). The primersused in PCR were dyed (Table 3) so that certain markers could be multiplexed. Fourpools were made using particular quantities of the PCR products shown in Table 2. Thepooled samples were then prepped for the Applied Biosystems Genetic Analyzer 3130(AB3130) by taking 9uL of High Dye, 0.25uL of Liz Standard, and 0.5uL of pooledsample and running PCR using standard protocol.
Table 2: Pooling Quantities for the Applied Biosystems Genetic Analyzer 3130 whichwere determined by this study.Pool 1 Pool 2 Pool 3 Pool 4G10B: 2.5uLG10M: 5uLG1D: 5uLG10C: 5uL
G1A: 2.5uLG10L: 10uLG10P: 10uL
Mu50: 5uLG10H: 10uLG10O: 10uLG10U: 10uL
G10X: 10uLG10J: 10uLMu59: 10uL
Statistical analysis of the microsatellite data was performed using GenAlEx v6 (Peakalland Smouse 2001), and Microsatellite Toolkit v3.1 (Park 2001). This provided theexpected heterozygosity, polymorphism information content, allelic frequency, andprobability of identity to be calculated for each of the markers. These calculationsdetermined the rank and value of the individual markers that would be best for futurepopulation estimate and genetic identification projects.
9
AnalysisGenotyping Error EstimationAccurately identifying individual’s genotypes is critical for population estimationbecause genotyping errors can bias population estimates (Waits and Leberg 2000; Creelet al. 2003). To minimize errors, we carefully scrutinized the data as Paetkau (2003)suggested, reexamining, and reamplifying where necessary, samples that differed by 1or 2 alleles to verify the difference was real.
RESULTS
Objective 1: Describe population genetic structure and diversity of black bears in NJ.Determine the effective population size of black bears in New Jersey.
The effective population size is the number of breeding individuals in an idealizedpopulation that would show the same amount of dispersion of allele frequencies underrandom genetic drift or the same amount of inbreeding as the population underconsideration.
In 2001 a mark recapture population estimate was calculated to be 1777 black bears (Carrand Burguess 2003). The effective population size was calculated for bears inmanagement zones 1 and 3. The sample size from zones 2 and 4 were small. Theanimals from these zones were used for the calculation of allelic frequencies.These estimates have always been linked with a mark-recapture estimate (Lincoln-Peterson Index). Figure 1 shows the effective population size for New Jersey black bearsfrom 2001 (1), 2003 (2), 2005 (3), and 2009 (4). The decrease in effective population sizefrom 46.7 to 35.3 may be the result of the bear hunt conducted in 2003.
Figure 1 Effective population size for NJ black bears from 2001 (1), 2003 (2), 2005(3) and 2009 (4).
10
Table 1 shows the effective population size for management zones 1 and 3, with thesample size utilized for the genotyping.
Table 1. Effective population size for management zones 1 and 3. Sample size forgenotyping is indicated along with mark recapture data.
Year ManagementZone
EffectivePopulationSize
PopulationEstimate M/R
Study SampleSize -genotyping
2001 1 & 3 22.695%CI(16.1-33.8)
1777 (Carr andBurguess2003)
36
2003 1 & 3 46.795%CI(33.4-70.1)
(333 animalsharvested)
69
2005 1 & 3 35.395%CI(29.4-42.4)
(298 animalsharvested)
175
2009 1 & 3 69.1 95%CI(68.5-81.9)
3438 This study 345
The data indicates a steady increase in the effective population size of black bears.NJ Fish & Wildlife conducted a black bear hunt in 2003 and 2005. A total of 631 animalswere harvested during the two hunts. Assuming a population estimate of 1146 animalsafter the two hunts and a 3 fold increase in EPS from 2001 to 2009 the number of bearsmay be assumed to be 3438.
What is the optimal sampling design for future population monitoring?The optimal sampling design would be to include DNA analysis along with Mark –Recapture techniques. These techniques should include both research trapping fortagging animals, hair snaring, and a yearly harvest to obtain genetic and mark recaptureinformation.
Obtaining accurate population estimates for black bear (Ursus americanus) is importantwhen implementing adaptive management principles in harvest strategies. Most state andprovincial black bear population estimates are based on known harvest rates orextrapolation from small mark-recapture studies (Garshelis and Hristienko 2006).
Objective 2: Relate population genetic patterns to the landscape of New Jersey.
ALLELE No. Zone 1 (97) Zone 2(16) Zone 3(248) Zone 4 (14)G10L
There is no evidence for increasing genetic isolation with geographic distance in NewJersey. The animals are not restricted in their movements.
APPENDIX
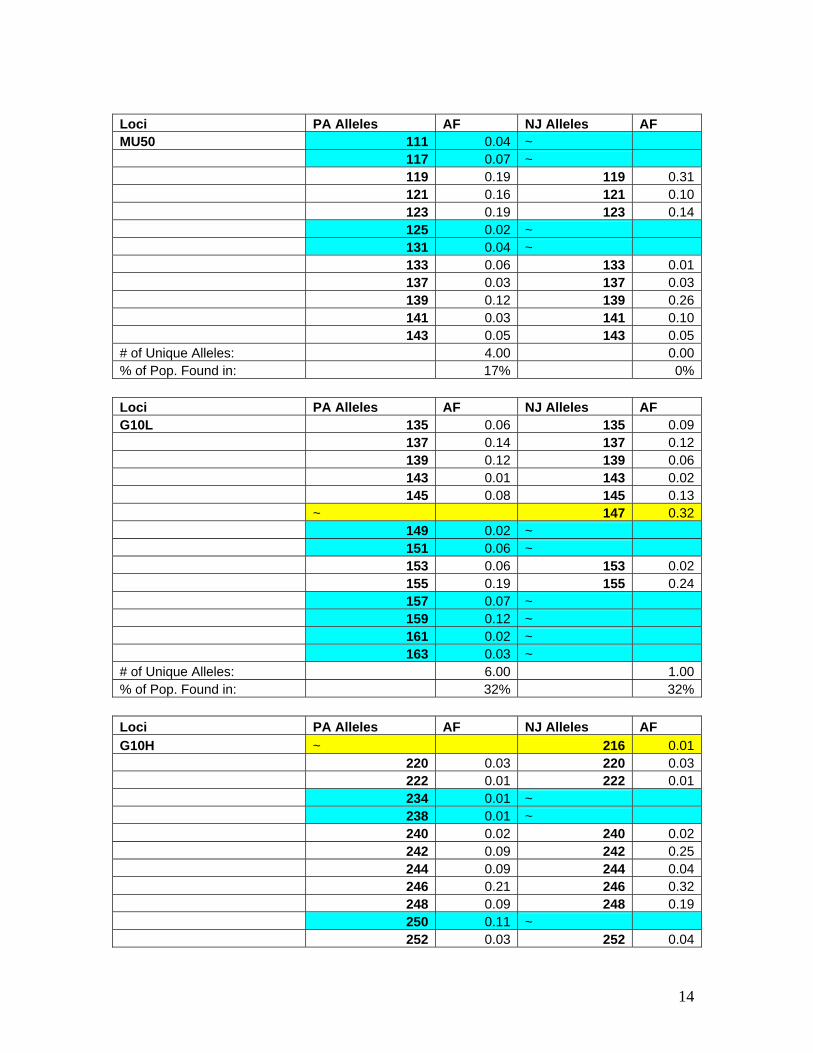
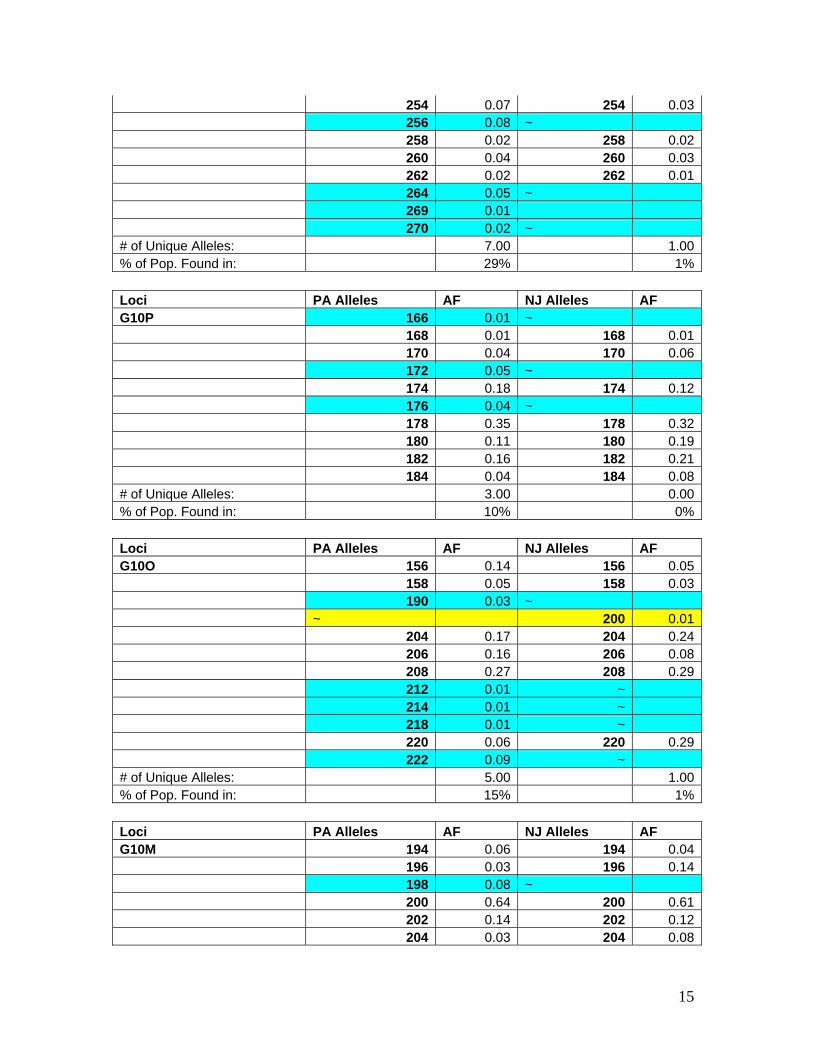
Table A comparison of alleles located for the thirteen microsatellite markers whenlooking at New Jersey and Pennsylvania black bear populations. Alleles are highlightedin blue (alleles that are unique to Pennsylvania black bears) and yellow (alleles that areunique to New Jersey black bears) to better visualize differences between the two states.Allelic frequencies are listed to show how often the alleles appear in the population. Thenumber of unique alleles, and how often they appear throughout the population, iscalculated at the bottom of the tables.
Loci PA Alleles AF NJ Alleles AFG10M 194 0.06 194 0.04 196 0.03 196 0.14 198 0.08 ~ 200 0.64 200 0.61 202 0.14 202 0.12 204 0.03 204 0.08
16
206 0.02 ~ # of Unique Alleles: 2.00 0.00% of Pop. Found in: 10% 0%
Loci PA Alleles AF NJ Alleles AFG10C 108 0.09 108 0.18 ~ 110 0.01 112 0.01 ~ 114 0.23 114 0.30 116 0.22 116 0.37 118 0.37 118 0.14 120 0.08 ~ # of Unique Alleles: 2.00 1.00% of Pop. Found in: 9% 1%
Loci PA Alleles AF NJ Alleles AFG10X ~ 185 0.08 ~ 187 0.04 189 0.12 189 0.04 191 0.09 191 0.04 193 0.41 193 0.63 195 0.09 ~ 197 0.03 ~ 199 0.03 ~ 201 0.06 ~ 205 0.09 ~ 207 0.03 ~ 209 0.06 209 0.17# of Unique Alleles: 6.00 2.00% of Pop. Found in: 33% 12%
Examining Two Possible New Jersey Black Bear Populations
There has been some speculation over the idea that the highways of New Jerseyform boundaries that split the bear population in half. Instead of simply having NewJersey bears, the bear population is instead categorized as two populations known as theNew Jersey/New York bear population and the New Jersey/Pennsylvania population.The NJ/NY population is thought to be isolated from the NJ/PA population by Route 80and Route 94.
To test this theory, the New Jersey bear samples were split into two separatepopulations defined by the stated highways, and any other man-made or natural obstaclethat would dissuade the black bear from migrating into the opposite territory. The twopopulations consisted of 26 samples that made up NJ/NY population and 24 samples thatmade up the NJ/PA population. The alleles from the two groups were compared for eachmicrosatellite marker and are shown in Table 1. G10M and G1A showed no alleles to beunique between the two possible populations. The other eleven microsatellite markershowever found differences between the NJ/PA, and NJ/NY bears. A total of 14 alleles
17
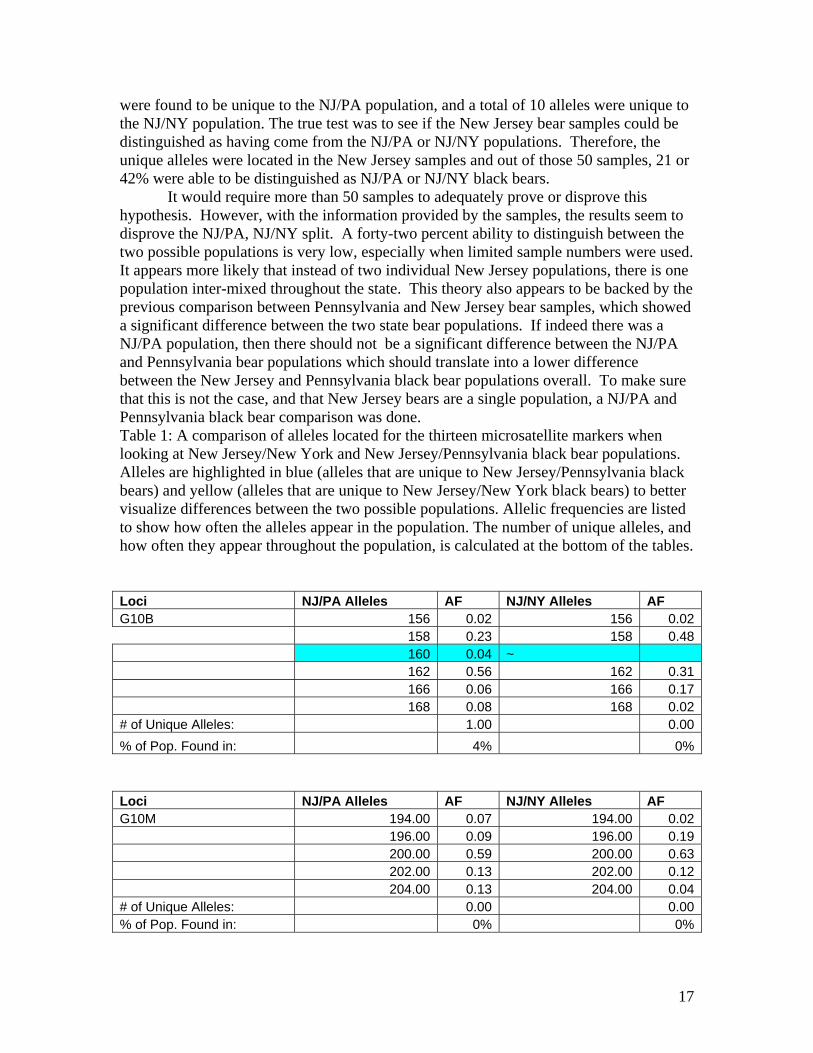
were found to be unique to the NJ/PA population, and a total of 10 alleles were unique tothe NJ/NY population. The true test was to see if the New Jersey bear samples could bedistinguished as having come from the NJ/PA or NJ/NY populations. Therefore, theunique alleles were located in the New Jersey samples and out of those 50 samples, 21 or42% were able to be distinguished as NJ/PA or NJ/NY black bears.
It would require more than 50 samples to adequately prove or disprove thishypothesis. However, with the information provided by the samples, the results seem todisprove the NJ/PA, NJ/NY split. A forty-two percent ability to distinguish between thetwo possible populations is very low, especially when limited sample numbers were used.It appears more likely that instead of two individual New Jersey populations, there is onepopulation inter-mixed throughout the state. This theory also appears to be backed by theprevious comparison between Pennsylvania and New Jersey bear samples, which showeda significant difference between the two state bear populations. If indeed there was aNJ/PA population, then there should not be a significant difference between the NJ/PAand Pennsylvania bear populations which should translate into a lower differencebetween the New Jersey and Pennsylvania black bear populations overall. To make surethat this is not the case, and that New Jersey bears are a single population, a NJ/PA andPennsylvania black bear comparison was done.Table 1: A comparison of alleles located for the thirteen microsatellite markers whenlooking at New Jersey/New York and New Jersey/Pennsylvania black bear populations.Alleles are highlighted in blue (alleles that are unique to New Jersey/Pennsylvania blackbears) and yellow (alleles that are unique to New Jersey/New York black bears) to bettervisualize differences between the two possible populations. Allelic frequencies are listedto show how often the alleles appear in the population. The number of unique alleles, andhow often they appear throughout the population, is calculated at the bottom of the tables.
Loci NJ/PA Alleles AF NJ/NY Alleles AFG10B 156 0.02 156 0.02
158 0.23 158 0.48 160 0.04 ~ 162 0.56 162 0.31 166 0.06 166 0.17 168 0.08 168 0.02# of Unique Alleles: 1.00 0.00% of Pop. Found in: 4% 0%
Loci NJ/PA Alleles AF NJ/NY Alleles AFG10M 194.00 0.07 194.00 0.02 196.00 0.09 196.00 0.19 200.00 0.59 200.00 0.63 202.00 0.13 202.00 0.12 204.00 0.13 204.00 0.04# of Unique Alleles: 0.00 0.00% of Pop. Found in: 0% 0%
Loci NJ/PA Alleles AF NJ/NY Alleles AFG10O 156 0.08 156 0.04 158 0.08 ~ 200 0.03 ~ 204 0.28 204 0.21 206 0.13 206 0.04 208 0.28 208 0.31 220 0.15 220 0.40# of Unique Alleles: 2.00 0.00% of Pop. Found in: 11% 0%
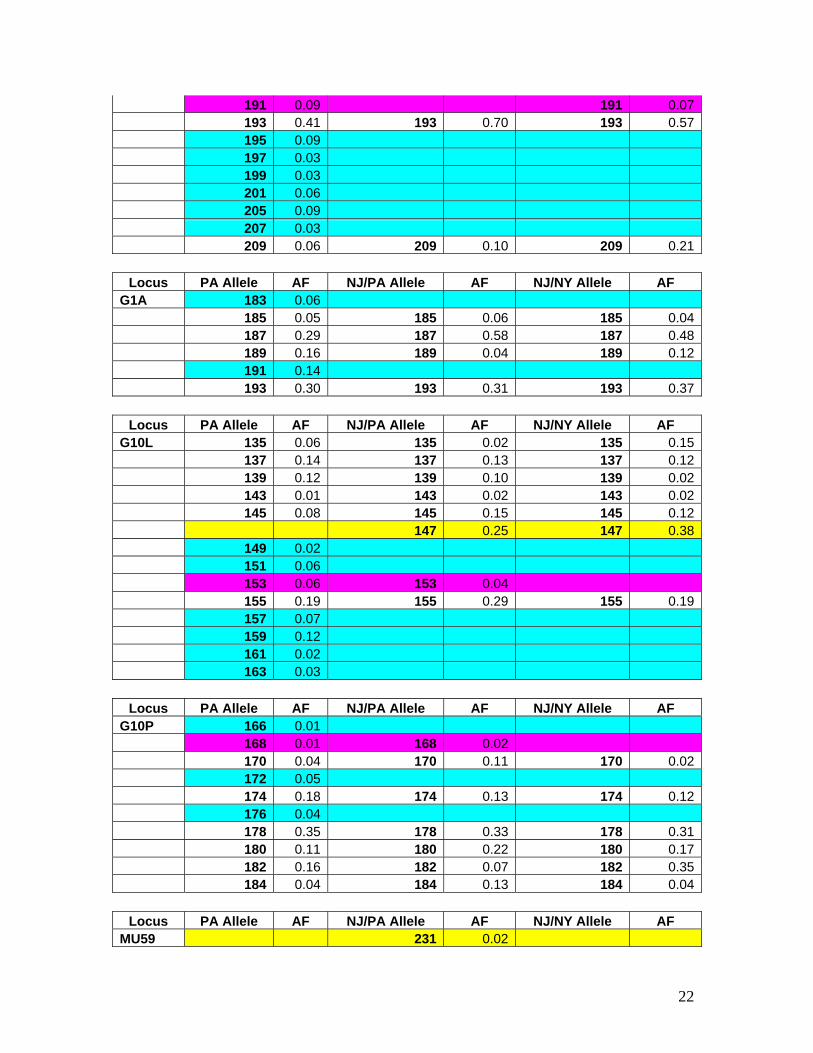
Table 2 Unique alleles are highlighted and compared for each of the 13 microsatellitemarkers. The alleles were color coded for the different sample groups; PA (blue), NJ/PA(yellow), NJ/NY (green), PA & NJ/PA (purple), PA & NJ/NY (pink), and NJ/PA &NJ/NY (tan).
Locus PA Allele AF NJ/PA Allele AF NJ/NY Allele AFG10B 156 0.02 156 0.02 156 0.02 158 0.31 158 0.23 158 0.48 160 0.02 160 0.04 162 0.29 162 0.56 162 0.31 164 0.11 166 0.26 166 0.06 166 0.17
Allelic frequencies for the unique alleles found were analyzed. Because of the lownumber of individuals being looked at for the NJ/PA and NJ/NY populations, only thealleles that were highly frequent (found in at least 10% of the population) wereconsidered significant. Looking at table 2, there are three microsatellite markers thatshow unique alleles that are highly significant, G10X, G10L, and Mu59. Although G10Xhas alleles that meet the criteria, the high frequency is more likely due to the low numberof samples that showed alleles for this marker, than for the fact that the alleles arestrongly unique. G10L shows the allele 147 to be strongly unique to both NJ/NY andNJ/PA being found in 38% and 25% of the respective populations, and 0% in thePennsylvania bear samples. Mu59 also shows a unique allele, number 239, to be stronglyunique to the NJ/PA population as being present in 20% of the population. Even though itdoes not appear significantly in the NJ/NY population, it does appear in 4% of it, and isnot found at all in the larger Pennsylvania population. This gives more evidence to thebelief that New Jersey black bears are likely to be one population that have slightdifferences from the Pennsylvania population. More samples from Zone 1 should beevaluated.
Highways may cause bears some hesitation upon crossing, but the high number ofbear road kills should show that it will not stop a bear entirely. Also, bears may be ableto swim across rivers and streams, but it may be possible that the Delaware Rivercombined with route 209, 611, and 32 are what provide a larger barrier between the NewJersey and Pennsylvania populations. The alleles do show differences between NewJersey and Pennsylvania black bear populations, but in order to confirm that the NewJersey population is a single population requires more samples. It is important tocompare the New Jersey samples to New York black bear samples as well to provide anoverall tri-state bear assessment.
25
REFERENCES
Baruch-Mordo, S. Black Bear-Human conflicts in Colorado: Spatiotemporal Patterns andPredictors. M.S. Thesis. May 2007.(http://welcome.warnercnr.colostate.edu/research/bear/)
Black, H. 2000. Monitoring Utah Black Bear Populations. Utah Black Bear ManagementPlan. 00-23. pg. 15-16.
Bureau of Wildlife-Black Bear Management Team, 2003. 2007. Black Bears in NewYork: Natural History, Range and Interactions with People. Second Edition. NewYork State Department of Environmental Conservation. Pg. 10.
California Department of Fish and Game; Wildlife Programs Branch. 1998. Black BearManagement Plan July 1998.
Carr, P.C. and K. Burguess. 2003. Estimation of Population Size of Black Bears inNorthern New Jersey. New Jersey Division of Fish and Wildlife. pp.1-14.
Clark, J.D. 1999. The Black Bear in Alabama. Alabama’s Treasured Forests. Pg. 24-25.
Connecticut Department of Environmental Protection:http://www.ct.gov/dep/cwp/view.asp?a=2723&q=326166&depNav_GID=1655
Cook, R.L. 2005. East Texas Black Bear Conservation and Management Plan 2005-2015.Texas Parks and Wildlife Department. Pg. 21-23
Costello, C.M., D.E. Jones, K.A.Green Hammond, R.M. Inman, K.H. Inman, B.C.Thompson, R.A. Deitner, and H.B. Quigley. 2001. A Study of Black BearEcology in New Mexico with Models for Population Dynamics and HabitatSuitability. New Mexico Department of Game and Fish.
Diefenbach, D. R., J. L. Laake, and G. L. Alt. 2004. Spatio-temporal and demographicvariation in the harvest of black bears: implications for population estimation. Journal ofWildlife Management 68:947–959.
Dreher, B.P., S.R. Winterstein, K.T. Scribner, P.M. Lukacs, D.R. Etter, G. J. M. Rosa,V.A. Lopez, S. Libants, and K.B. Filcek. 2007. Noninvasive Estimation of BlackBear Abuindance Incorporating Genotyping Errors and Harvested Bear. Journalof Wildlife Management 71:2684-2693.
Eason, T.H. 2003. Conservation Strategy for Black Bears in Florida. Florida Fish andWildlife Conservation Committee.
Estridge, R. and S. Henderson. 2006. 2006 Black Bear Harvest Report. Arkansas Gameand Fish Comission; Wildlife Management Division.
26
Garshelis, D. A. and H. Hristienko. 2006. State and provincial estimates ofAmerican black bear numbers versus assessments of population trends. Ursus17:1-7.Grizzly Bear and Black Bear Ecology (NMRSC Research):
http://www.nrmsc.usgs.gov/research/grizzlyb.htm
Hristienko, H. and J. E. McDonald Jr. 2007. Going into the 21St century: a perspective ontrends and controversies in the management of the American black bear. Ursus 18:1, 72-88.
Idaho Fish and Game:http://fishandgame.idaho.gov/cms/tech/CDC/cwcs_pdf/monitoring%20and%20adaptive%20management.pdf
Kansas Department of Wildlife and Parks:http://www.kdwp.state.ks.us/news/other_services/publications/fish_and_wildlife_management
Kentucky Department of Fish and Wildlife Resources:http://fw.ky.gov/Navigation.asp?cid=100
Koehler, G. 2001. Job Progress Report- Federal Aid in Wildlife Restoration: LargeCarnivore Ecology and Populations Status. Pg. 6.
Lansford, K.C. 2007. Nevada Board of Wildlife Commissioners Policy for theManagement of American Black Bear. Pg. 6.
Maine Department of Inland Fisheries and Wildlife:http://www.maine.gov/ifw/wildlife/species/bear/
Minnesota Department of Natural Resources:http://www.dnr.state.mn.us/fwt/back_issues/june97/bears.html
Mowat, G. and C. Strobeck. 2000. Estimating population size of grizzly bears using haircapture, DNA profiling, and mark-recapture analysis. Journal of Wildlife Management64:183-193
New Hampshire Fish and Game Department:http://www.ct.gov/dep/cwp/view.asp?a=2723&q=326166&depNav_GID=1655
North Carolina Wildlife Resources Commission:http://www.ncwildlife.org/fs_index_07_conservation.htm
Paetkau, D. and C. Strobeck. 1994. Microsatellite analysis of genetic variation in blackbear populations. Molecular Ecology 3:489-495.
Paetkau, D., W. Calvert, I. Stirling, and C. Strobeck. 1995. Microsatellite analysis of
27
population structure in Canadian polar bears. Molecular Ecol. 4:347-354.
Paetkau, D. and C. Strobeck. 1998. Ecological genetic studies of bears usingmicrosatellite analysis. Ursus 10:299-306.
Paetkau, D., G.F. Shields, and C. Strobeck. 1998. Gene flow between insular, coastaland interior populations of brown bears in Alaska. Molecular Ecol. 7:1283-1292.
Peacock, E. 2002. Kuiu Island Black Bear Population Estimation Using Biomarking andDNA. Alaska Department of Fish and Game, Division of Wildlife Conservation.Reseach Performance Report.
Rolley, R.E. and M.P. Woodford. 2007. Black Bear Population Analysis. WisconsinDepartment of Natural Resources.
South Carolina Department of Natural Resources:http://www.dnr.sc.gov/wildlife/bear/dnasampling.html
Spiker, H.A, and S.L. Bittner. 2004. Wildlife and Heritage Service Black BearManagement Plan 2004-2013. Maryland Department of Natural Resources.Pg.3-6
Ternent, M. A. 2006. Management and Biology of Black Bears in Pennsylvania: TenYear Plan (2006-2015). Pennsylvania Game Commission.
Trophy Game Section Management/Research Branch. 2007. Wyoming Black BearManagement Plan.
Vermont Fish and Wildlife Department:http://www.vtfishandwildlife.com/wildlife_biggame.cfm#bb
Virginia Department of Game and Inland Fisheries. 2002. Virginia Black BearManagement Plan 2001-2010. Pg. 20-21.
West Virginia Department of Natural Resources:http://www.wvdnr.gov/hunting/BBear.shtm
Young, B. 2006. Conservation and Management of Black Bears in Mississippi.Mississippi Department of Wildlife, Fisheries, and Parks.