463
Final Evaluation of Impacts to Underground Sources of Drinking Water by Hydraulic Fracturing of Coalbed Methane Reservoirs

Final
Evaluation of Impacts toUnderground Sources ofDrinking Water by HydraulicFracturing of CoalbedMethane Reservoirs

ii
Office of WaterOffice of Ground Water and Drinking Water (4606M)EPA 816-R-04-003www.epa.gov/safewaterJune 2004
Printed on Recycled Paper

iii
EPA 816-R-04-003
Evaluation of Impacts to Underground Sources of DrinkingWater by Hydraulic Fracturing of
Coalbed Methane Reservoirs
FINAL
June 2004
United States Environmental Protection AgencyOffice of Water
Office of Ground Water and Drinking WaterDrinking Water Protection Division
Prevention Branch1200 Pennsylvania Avenue, NW (4606M)
Washington, DC 20460

iv
TABLE OF CONTENTS
Page
EXECUTIVE SUMMARY ES-1ES-1 How Does CBM Play a Role in the Nation’s Energy Demands? ES-2ES-2 What Is Hydraulic Fracturing? ES-4ES-3 Why Did EPA Evaluate Hydraulic Fracturing? ES-7ES-4 What Was EPA’s Project Approach? ES-8ES-5 How Do Fractures Grow? ES-10ES-6 What Is in Hydraulic Fracturing Fluids? ES-11ES-7 Are Coalbeds Located within USDWs? ES-13ES-8 Did EPA Find Any Cases of Contaminated Drinking Wells Caused by
Hydraulic Fracturing in CBM Wells? ES-13ES-9 What Are EPA’s Conclusions? ES-16
CHAPTER 1. INTRODUCTION 1-11.1 EPA’s Rationale for Conducting This Study 1-21.2 Overview of Hydraulic Fracturing 1-31.3 EPA’s Authority to Protect Underground Sources of Drinking Water 1-41.4 Potential Effects of Hydraulic Fracturing of Coalbed Methane Wells
on USDWs 1-61.5 Study Approach 1-71.6 Stakeholder Involvement 1-81.7 Information Contained within This Report 1-9
CHAPTER 2. STUDY METHODOLOGY 2-12.1 Overview of the Study Methods 2-12.2 Information Sources 2-3
2.2.1 Literature Reviews 2-42.2.2 Department of Energy 2-52.2.3 Interviews 2-52.2.4 Field Visits 2-62.2.5 Federal Register Notice to Identify Reported Incidents 2-7
2.3 Review Process 2-7
CHAPTER 3. CHARACTERISTICS OF COALBED METHANE PRODUCTION AND ASSOCIATED HYDRAULIC FRACTURING PRACTICES 3-1
3.1 Introduction 3-13.2 Hydraulic Fracturing 3-4
3.2.1 The Hydraulic Fracturing Process 3-43.2.2 Factors Affecting Fracture Behavior 3-5
3.3 Fracturing Fluids 3-103.3.1 Quantifying Fluid Recovery 3-113.3.2 Mechanisms Affecting Fluid Recovery 3-12
3.4 Measuring and Predicting the Extent of Fluid Movement 3-153.4.1 Direct Measurements 3-163.4.2 Indirect Measurements 3-183.4.3 Model Estimates 3-193.4.4 Limitations of Fracture Diagnostic Techniques 3-20
3.5 Summary 3-22

v
CHAPTER 4. HYDRAULIC FRACTURING FLUIDS 4-14.1 Introduction 4-14.2 Types of Fracturing Fluids and Additives 4-2
4.2.1 Gelled Fluids 4-34.2.2 Foamed Gels 4-54.2.3 Water and Potassium Chloride Water Treatments 4-64.2.4 Acids 4-64.2.5 Fluid Additives 4-74.2.6 Proppants 4-8
4.3 The Fate and Transport of Stimulation Fluids Injected into Coal and SurroundingRock During Hydraulic Fracturing of Coalbed Methane Reservoirs (with a Special Focuson Diesel Fuel) 4-11
4.3.1 Point-of-Injection Calculation 4-134.3.2 Fracturing Fluid Recovery 4-154.3.3 The Influence of the Capture Zone 4-164.3.4 Fate and Transport Considerations 4-16
4.4 Summary 4-29
CHAPTER 5. SUMMARY OF COALBED METHANE BASIN DESCRIPTIONS 5-15.1 The San Juan Basin 5-15.2 The Black Warrior Basin 5-25.3 The Piceance Basin 5-35.4 The Uinta Basin 5-45.5 The Powder River Basin 5-55.6 The Central Appalachian Basin 5-65.7 The Northern Appalachian Basin 5-75.8 The Western Interior Coal Region 5-85.9 The Raton Basin 5-105.10 The Sand Wash Basin 5-115.11 The Washington Coal Regions (Pacific and Central) 5-125.12 Summary 5-14
CHAPTER 6. WATER QUALITY INCIDENTS 6-16.1 The San Juan Basin (Colorado and New Mexico) 6-2
6.1.1 Summary of Reported Incidents 6-26.1.2 State Agency Follow-Up in the San Juan Basin 6-46.1.3 Major Studies That Have Been Conducted in the San Juan Basin 6-5
6.2 The Powder River Basin (Wyoming and Montana) 6-96.3 The Black Warrior Basin (Alabama) 6-10
6.3.1 Summary of Reported Incidents 6-106.3.2 State Agency Follow-Up (Alabama Oil and Gas Board) 6-11
6.4 The Central Appalachian Basin (Virginia and West Virginia) 6-136.4.1 Summary of Virginia Incidents 6-146.4.2 State Agency Follow-Up (Virginia DMME) 6-15
6.5 Summary 6-16
CHAPTER 7. CONCLUSIONS AND RECOMMENDATIONS 7-17.1 Reported Water Quality Incidents 7-17.2 Fluid Injection Directly into USDWs or into Coal Seams Already in Hydraulic
Communication with USDWs 7-27.3 Breach of Confining Layer 7-37.4 Conclusions 7-5

vi
REFERENCES MR-1
APPENDIX A: Department of Energy - Hydraulic Fracturing White Paper APP. A-1
APPENDIX B: Quality Assurance Plan APP. B-11.0 Project Management APP. B-11.1 Project and Task Organization APP. B-11.2 Problem Definition and Background APP. B-31.3 Project and Task Description APP. B-41.4 Quality Objectives and Criteria APP. B-51.5 Special Training and Certification APP. B-61.6 Documents and Records APP. B-72.0 Data Generation and Acquisition APP. B-72.1 Non-Direct Measurements APP. B-72.2 Data Management APP. B-93.0 Assessment and Oversight APP. B-94.0 Data Validation and Usability APP. B-104.1 Data Review, Verification, and Validation APP. B-104.2 Reconciliation with User Requirements APP. B-11
4.2.1 Drawing Conclusions APP. B-124.2.2 Communication of Findings APP. B-12
ATTACHMENT 1. THE SAN JUAN BASIN A1-11.1 Basin Geology A1-11.2 Basin Hydrology and USDW Identification A1-31.3 Coalbed Methane Production Activity A1-51.4 Summary A1-8
ATTACHMENT 2. THE BLACK WARRIOR BASIN A2-12.1 Basin Geology A2-12.2 Basin Hydrology and USDW Identification A2-22.3 Coalbed Methane Production Activity A2-22.4 Summary A2-6
ATTACHMENT 3. THE PICEANCE BASIN A3-13.1 Basin Geology A3-13.2 Basin Hydrology and USDW Identification A3-33.3 Coalbed Methane Production Activity A3-53.4 Summary A3-6
ATTACHMENT 4. THE UINTA COAL BASIN A4-14.1 Basin Geology A4-14.2 Basin Hydrology and USDW Identification A4-24.3 Coalbed Methane Production Activity A4-44.4 Summary A4-5
ATTACHMENT 5. THE POWDER RIVER COAL BASIN A5-15.1 Basin Geology A5-15.2 Basin Hydrology and USDW Identification A5-45.3 Coalbed Methane Production Activity A5-55.4 Summary A5-9

vii
ATTACHMENT 6. THE CENTRAL APPALACHIAN COAL BASIN A6-16.1 Basin Geology A6-16.2 Basin Hydrology and USDW Identification A6-36.3 Coalbed Methane Production Activity A6-56.4 Summary A6-7
ATTACHMENT 7. THE NORTHERN APPALACHIAN COAL BASIN A7-17.1 Basin Geology A7-17.2 Basin Hydrology and USDW Identification A7-27.3 Coalbed Methane Production Activity A7-57.4 Summary A7-6
ATTACHMENT 8. THE WESTERN INTERIOR COAL REGION A8-18.1 Basin Coals A8-1
8.1.1 Arkoma Basin Coals A8-28.1.2 Cherokee Basin Coals A8-28.1.3 Forest City Basin Coals A8-2
8.2 Basin Hydrology and USDW Identification A8-38.2.1 Arkoma Basin Hydrology and USDW Identification A8-38.2.2 Cherokee Basin Hydrology and USDW Identification A8-48.2.3 Forest City Basin Hydrology and USDW Identification A8-6
8.3 Coalbed Methane Production Activity A8-98.3.1 Arkoma Basin Production Activity A8-98.3.2 Cherokee Basin Production Activity A8-108.3.3 Forest City Basin Production Activity A8-11
8.4 Summary A8-11
ATTACHMENT 9. THE RATON BASIN A9-19.1 Basin Geology A9-19.2 Basin Hydrology and USDW Identification A9-29.3 Coalbed Methane Production Activity A9-39.4 Summary A9-5
ATTACHMENT 10. THE SAND WASH COAL BASIN A10-110.1 Basin Geology A10-110.2 Basin Hydrology and USDW Identification A10-310.3 Coalbed Methane Production Activity A10-410.4 Summary A10-5
ATTACHMENT 11. THE WASHINGTON COAL REGION (PACIFIC ANDCENTRAL) A11-1
11.1 Basin Geology A11-111.1.1 Pacific Coal Region Geology A11-211.1.2 Central Coal Region Geology A11-4
11.2 Basin Hydrology and USDW Identification A11-511.3 Coalbed Methane Production Activity A11-5
11.3.1 Pacific Coal Region Production Activity A11-611.3.2 Central Coal Region Production Activity A11-6
11.4 Summary A11-7

viii
LIST OF TABLES
EXECUTIVE SUMMARYES-1 Coal Basins Production Statistics and Activity Information in the U.S. ES-3ES-2 Evidence in Support of Coal-USDW Co-Location in U.S. Coal Basins ES-14
CHAPTER 33-1 Limitations of Fracture Diagnostic Techniques 3-21
CHAPTER 44-1 Characteristics of Undiluted Chemicals Found in Hydraulic Fracturing Fluids 4-9
(Based on MSDSs)4-2 Estimated Concentrations of Diesel Contaminants in Fracturing Fluids at the
Point-of-Injection and Factors Affecting Their Concentrations and Movementin Groundwater 4-18
CHAPTER 55-1 Evidence in Support of Coal–USDW Co-Location in U.S. Coal Basins 5-15
APPENDIX A: Department of Energy - Hydraulic Fracturing White PaperTable 1 Sources of Data APP. A-4Table 2 Fracturing Fluids and Conditions for Their Use APP. A-6Table 3 Typical Ranges of Young’s Modulus for Various Lithologies APP. A-8Table 4 Acceptable Levels for Mixed Water APP. A-12Table 5 Summary of Chemical Additives APP. A-13Table 6 Limitations of Fracture Diagnostic Techniques APP. A-21
APPENDIX B: Quality Assurance PlanB-1 Peer Review Panel APP. B-2
ATTACHMENT 1A1-1 Chemical Components of Typical Fracture/Stimulation Fluids Used for
San Juan Coalbed Methane Wells A1-9
ATTACHMENT 2A2-1 Chemical Components Previously Used in Typical Fracturing/Stimulation
Fluids for Alabama Coalbed Methane Wells A2-8
ATTACHMENT 5A5-1 Average Water Quality Results from Produced Waters A5-8
ATTACHMENT 6A6-1 Relative Locations of USDWs and Methane-Bearing Coalbeds A6-5
ATTACHMENT 7A7-1 Relative Locations of USDWs and Methane-Bearing Coalbeds A7-4
ATTACHMENT 8A8-1 Relative Locations of USDWs and Potential Methane-Bearing Coalbeds,
Arkoma Basin A8-4A8-2 Relative Locations of USDWs and Potential Methane-Bearing Coalbeds,
Cherokee Basin A8-6A8-3 Relative Locations of USDWs and Potential Methane-Bearing Coalbeds,
Forest City Basin A8-8

ix
LIST OF FIGURES
EXECUTIVE SUMMARYES-1 Major U.S. Coal Basins ES-3ES-2 A Graphical Representation of the Hydraulic Fracturing Process
in Coalbed Methane Wells ES-5ES-3 Hypothetical Mechanisms – Direct Fluid Injection into a USDW ES-9ES-4 Hypothetical Mechanisms – Fracture Creates Connection to USDW ES-10ES-5 and ES-6 Photos from a Hydraulic Fracturing Visit ES-12
CHAPTER 11-1 Locus Map of Major U.S. Coal Basins 1-21-2 Hypothetical Mechanisms – Direct Fluid Injection into a USDW 1-101-3 Hypothetical Mechanisms – Fracture Creates Connection to USDW 1-11
CHAPTER 33-1 Major United States Coal Basins 3-243-2 Geography of an Ancient Peat-Forming System 3-253-3 Schematic Representation of “Face Cleat” and “Butt Cleat” 3-263-4 A Graphical Representation of the Hydraulic Fracturing Process in
Coalbed Methane Wells 3-273-5 Water and Gas Production Over Time 3-293-6 Side-View of a Vertical Hydraulic Fracture Typical of Coalbeds 3-303-7 Plan View of Vertical, Two-Winged Coalbed Methane Fracture Showing the
Reservoir Region Invaded by Fracturing Fluid Leakoff 3-313-8 Plan View (Looking Down the Wellbore) of a Vertical Hydraulic Fracture 3-32
CHAPTER 44-1 through 4-11 Photos from a Hydraulic Fracturing Field Visit 4-20
CHAPTER 55-1 Locus Map of Major United States Coal Basins 5-17
APPENDIX A: Department of Energy - Hydraulic Fracturing White PaperFig. 1 Typical Input Data for a P3D Model APP. A-4Fig. 2 Fracture Treatment Optimization Project APP. A-5Fig. 3 Local In-Situ Stress and Depth APP. A-7Fig. 4 Cased Hole Test Configuration APP. A-9Fig. 5 Typical Stress Test Pump-In/Shut-In APP. A-9Fig. 6 Closure Pressure Analysis APP. A-9Fig. 7 PKN Geometry APP. A-10Fig. 8 KGD Geometry APP. A-10Fig. 9 Width from a P3D Model APP. A-11Fig. 10 Width and Height from P3D Model APP. A-11Fig. 11 Definition of Fracture Conductivity APP. A-14Fig. 12 Effective Stress on Proppant APP. A-14Fig. 13 Effect of Stress on Conductivity APP. A-15Fig. 14 Selecting a Fracture Fluid APP. A-16Fig. 15 Fracturing Using Coil Tubing APP. A-17Fig. 16 Proppant Selection Based on Closure Pressure APP. A-17Fig. 17 Economic Analysis APP. A-18Fig. 18 Principle of Microseismic Fracture Mapping APP. A-20

x
ATTACHMENT 1A1-1 Regional Tectonic Setting of the San Juan Basin A1-10A1-2 Generalized Hydrogeologic Cross-Section of the San Juan Basin A1-11A1-3 Isopach Map of the Fruitland Formation Including Pictured Cliffs Tongues A1-12A1-4 Cross Section S-10 from Figure A1-3, a Stratigraphic Strike Section A1-13A1-5 Cross Section D-20 from Figure A1-3, a Stratigraphic Dip Section from the
Fruitland to the Ojo Alamo A1-14A1-6 Cross Section E-W from Figure A1-3, a Stratigraphic Strike Section from
the Southeastern San Juan Basin, Showing the Erosional Fruitland-OjoAlamo Contact A1-15
A1-7 Areas of the San Juan Basin That Exhibit Similar Characteristics for Production,Coal Properties, and Hydrologic Pressure A1-16
A1-8 Map of the Potentiometric Surface of the Fruitland Aquifer A1-17A1-9 General Ground Water Flow in the Fruitland/Pictured Cliffs Aquifer System,
San Juan Basin A1-18A1-10 Generalized Flow Paths of the Fruitland/Pictured Cliffs Aquifer System,
San Juan Basin A1-19A1-11 Equipotentials and Flow Paths from Ground Water Flow Modeling
of the San Juan Basin A1-20A1-12 Chloride Concentration Map (mg/L) of Waters of the Fruitland Aquifer,
San Juan Basin A1-21A1-13 Histograms of Water Analyses (mg/L) from the Fruitland/Pictured Cliffs
Aquifer System in the North Central and South-Margin Areas of the San Juan Basin A1-22A1-14 Direction of Ground Water Flow and Dissolved Solids Concentration in
Tertiary Rocks A1-23A1-15 Outline of the Fairway Zone of Area 1 of the San Juan Basin A1-24A1-16 Conceptual Schematic (Plan View) of Tensile Fracture and Shear Failure
in Coal Formed by Openhole Cavitation Cycling A1-25A1-17 Table of Fracture Stimulation Treatments in the Fruitland Formation of the
San Juan Basin A1-26A1-18 Density of Wells in the Northern Portion of Area 1 in the San Juan Basin,
as of 12/31/1990 A1-27A1-19 Fruitland Net Coal Map A1-28A1-20 Plan View of a Vertical, Two-Winged Coalbed Methane Fracture Showing
the Reservoir Region Invaded by Fracturing Fluid Leakoff A1-29
ATTACHMENT 2A2-1 Coalbed Methane Fields of Alabama A2-9A2-2 Coal Cycles of the Pottsville Formation in the Black Warrior Basin A2-10A2-3 Cross-Section of the Pottsville Formation in the Deerlick Creek Field A2-11A2-4 Hydrogeologic Cross-Section of the Pottsville Formation in the Brookwood Field A2-12A2-5 TDS Concentration of Pottsville Aquifer, Black Warrior Basin, Alabama A2-13A2-6 TDS Concentration of the Mary Lee Coal Seam of the Pottsville Aquifer in the
Eastern Part of the Black Warrior Basin, Alabama A2-14A2-7 Generalized Increase in TDS Concentration with Depth in the Pottsville Aquifer,
Black Warrior Basin, Alabama A2-15A2-8 “Stiff” Diagram of Water Salinity A2-16A2-9 Relationship of Water Salinity to Structural Features in the Oak Grove Field,
Black Warrior Basin, Alabama A2-17A2-10 Productive Coal Seams and the Typical Number of Stimulations Per Well as
of 1993, Black Warrior Basin, Alabama A2-18A2-11 Sketch of a Vertical, Unconfined Fracture Typical of the Black Warrior Basin A2-19

xi
ATTACHMENT 3A3-1 Tectonic Map of the Piceance Basin A3-8A3-2 Stratigraphic Section of the Piceance Basin A3-9A3-3 Generalized Depth to Base of Coal – Cameo Group A3-10A3-4 Locations of Gas Fields A3-11A3-5 Exploration Target Areas, Piceance Basin A3-12A3-6 Diagrammatic East – West Sections of Hydrologic System A3-13A3-7 Dominant Chemical Constituents in the Two Major Bedrock Aquifers A3-14
ATTACHMENT 4A4-1 Index Map of Coal Fields in Uinta Basin, Utah A4-6A4-2 Stratigraphic Column for the Cretaceous of the Castle Valley A4-7A4-3 Cross Section of Cretaceous Rocks A4-8
ATTACHMENT 5A5-1 Location of the Powder River Basin of Wyoming and Montana A5-10A5-2 Map of the Development of Coalbed Methane in the Powder River Basin A5-11A5-3 Conceptual Cross Section of the Powder River Basin (West – East) A5-12A5-4 Stratigraphic Diagram of Geology in the Powder River Basin A5-13A5-5 Detailed Cross Section of the Wasatch and Fort Union Formations
in the Powder River Basin A5-14A5-6 Conceptual Cross Section (West – East) of the Fort Union Formation
in the Eastern Powder River Basin Near Gillette, Wyoming A5-15A5-7 Conceptual Cross Section Near the Center of the Powder River Basin A5-16A5-8 Conceptual Cross Section in the Western Powder River Basin
Near Lake DeSmet A5-17A5-9 Graph of Coalbed Methane Production and Wells in Service in the
Powder River Basin, 1989 to 1999 A5-18
ATTACHMENT 6A6-1 Area of Highest Methane Concentration A6-8A6-2 Structural Features A6-9A6-3 Representative Stratigraphic Column of Pennsylvanian Age Formations A6-10A6-4 Isopach Map: Thickness of Cover Over the Pocahontas No. 3 Coalbed A6-11A6-5 Isopach Map: Thickness of Cover Over the Pocahontas No. 4 Coalbed A6-12A6-6 Isopach Map: Thickness of Cover Over the Fire Creek – Lower Horsepen Coalbed A6-13A6-7 Isopach Map: Thickness of Cover Over Beckley – War Creek Coalbed A6-14A6-8 Isopach Map: Thickness of Cover Over the Sewell/Lower Seaboard Coalbed A6-15A6-9 Isopach Map: Thickness of Cover Over the Leager/Jawbone Coalbed A6-16
ATTACHMENT 7A7-1 Index Map Showing County Names A7-7A7-2 Structure Map A7-8A7-3 Generalized Stratigraphic Column of the Northern Appalachian Coal Basin A7-9A7-4 Isopach Map: Depth of Cover to the Brookville/Clarion Group Coals A7-10A7-5 Isopach Map: Depth of Cover to the Kittanning Group Coals A7-11A7-6 Isopach Map: Depth of Cover to the Freeport Group Coals A7-12A7-7 Isopach Map: Depth of Cover to the Pittsburgh Group Coals A7-13A7-8 Isopach Map: Depth of Cover to the Sewickley Group Coals A7-14A7-9 Isopach Map: Depth of Cover to the Waynesburg Group Coals A7-15

xii
ATTACHMENT 8A8-1 Western Interior Coal Basin – Index Map of the Arkoma, Cherokee and
Forest City Basins A8-13A8-2 Western Interior Coal Basin – Generalized Stratigraphic Column of the
Pennsylvanian System in the Arkoma Basin A8-14A8-3 Western Interior Coal Basin – Stratigraphic Column of the Cherokee Group
in the Cherokee Basin A8-15A8-4 Western Interior Coal Basin – Forest City Basin Study Area A8-16A8-5 Counties, Aquifers, and Physiographic Provinces of Arkansas A8-17A8-6 Counties, Aquifers, and Physiographic Provinces of Oklahoma A8-18A8-7 Counties, Aquifers, and Physiographic Provinces of Kansas A8-19A8-8 Counties, Aquifers, and Physiographic Provinces of Missouri A8-20A8-9 Western Interior – Detail of Forest City Basin with Detail of Cherokee Basin
in Missouri A8-21A8-10 Water Quality (TDS) of Lower Paleozoic Aquifers in Kansas A8-22A8-11 Counties, Aquifers, and Physiographic Provinces of Iowa A8-23A8-12 Western Interior Coal Basin – Quality of Ground Water in the Paleozoic Aquifers
of Missouri A8-24A8-13 Counties, Aquifers, and Physiographic Provinces of Nebraska A8-25
ATTACHMENT 9A9-1 Structure Contour Map on Top Trinidad Sandstone A9-6A9-2 Structural Cross Section A9-7A9-3 Generalized Stratigraphy of Cenozoic and Mesozoic Units A9-8A9-4 Vermejo Formation – Total Coal Isopach A9-9A9-5 Overburden to Coal Interval A9-10A9-6 Location of Stratigraphic Cross Sections A9-11A9-7 Cross Section A – A1 A9-12A9-8 Cross Section C – C1 A9-13A9-9 Potentiometric Surface Map for Raton Basin A9-14A9-10 Relationship Between Gas Content and Depth Below Potentiometric
Surface for Two Groups of Coal Rank A9-15A9-11 Historical Gas and Water Production for Typical Well Showing How
Water Withdrawal Decreases and Methane Production Increases A9-16A9-12 Historical Gas and Water Production for Ozzello 42-1 Well Showing
Water Withdrawal Increasing with Gas Production A9-17
ATTACHMENT 10A10-1 Location of the Sand Wash Basin of Colorado and Wyoming A10-7A10-2 Diagram of Geologic Formations within the Sand Wash Basin
and Neighboring Basins A10-8A10-3a Map of Coal and Geologic Features Within the Sand Wash Basin A10-9A10-3b Conceptual Cross Section C – C1 A10-10A10-4 Location of the Sand Wash Basin in Relation to the Western Interior Seaway
of Upper Cretaceous Times A10-11A10-5 Ground Water Quality Trends in the Sand Wash Basin A10-12A10-6 Comparison of Features Relevant to Coalbed Methane
Production – San Juan Basin and Sand Wash Basin A10-13
ATTACHMENT 11A11-1 The Pacific Coal Region Showing Targeted Subbasins Used for
Coalbed Methane Estimates A11-8A11-2 The Central Coal Region A11-9A11-3 Major Coal-Bearing Areas in Western Washington A11-10A11-4 Stratigraphy for Three Coal Districts of the Pacific Coal Region A11-11A11-5 Structural Map of the Central Columbia Basin and Yakima Fold Belt A11-12

EPA 816-R-04-003
Evaluation of Impacts to Underground Sources June 2004of Drinking Water by Hydraulic Fracturing ofCoalbed Methane Reservoirs ES-1
Executive Summary
The U.S. Environmental ProtectionAgency (EPA, or the Agency)conducted a study that assesses thepotential for contamination ofunderground sources of drinkingwater (USDWs) from the injectionof hydraulic fracturing fluids intocoalbed methane (CBM) wells. Toincrease the effectiveness andefficiency of the study, EPA hastaken a phased approach. Apartfrom using real world observationsand gathering empirical data, EPAalso evaluated the theoreticalpotential for hydraulic fracturing toaffect USDWs. Based on theinformation collected and reviewed, EPA has concluded that the injection of hydraulicfracturing fluids into CBM wells poses little or no threat to USDWs and does not justifyadditional study at this time. EPA’s decision is consistent with the process outlined inthe April, 2001 Final Study Design, which is described in Chapter 2 of this report.
The first phase of the study, documented in this report, is a fact-finding effort basedprimarily on existing literature to identify and assess the potential threat to USDWsposed by the injection of hydraulic fracturing fluids into CBM wells. EPA evaluated thatpotential based on two possible mechanisms. The first mechanism was the directinjection of fracturing fluids into a USDW in which the coal is located, or injection offracturing fluids into a coal seam that is already in hydraulic communication with aUSDW (e.g., through a natural fracture system). The second mechanism was the creationof a hydraulic connection between the coalbed formation and an adjacent USDW.
EPA also reviewed incidents of drinking water well contamination believed to beassociated with hydraulic fracturing and found no confirmed cases that are linked tofracturing fluid injection into CBM wells or subsequent underground movement offracturing fluids. Although thousands of CBM wells are fractured annually, EPA did notfind confirmed evidence that drinking water wells have been contaminated by hydraulicfracturing fluid injection into CBM wells.
EPA has determined that in some cases, constituents of potential concern (section ES-6)are injected directly into USDWs during the course of normal fracturing operations. Theuse of diesel fuel in fracturing fluids introduces benzene, toluene, ethylbenzene, andxylenes (BTEX) into USDWs. BTEX compounds are regulated under the Safe DrinkingWater Act (SDWA).
A USDW is defined as an aquifer or a portion of anaquifer that: A. 1. Supplies any public water system; or
2. Contains sufficient quantity of groundwater tosupply a public water system; andi. currently supplies drinking water for human
consumption; orii. contains fewer than 10,000 milligrams per
liter (mg/L) total dissolved solids (TDS); and B. Is not an exempted aquifer.
NOTE: Although aquifers with greater than 500 mg/LTDS are rarely used for drinking water supplieswithout treatment, the Agency believes that protectingwaters with less than 10,000 mg/L TDS will ensure anadequate supply for present and future generations.

EPA 816-R-04-003
Evaluation of Impacts to Underground Sources June 2004of Drinking Water by Hydraulic Fracturing ofCoalbed Methane Reservoirs ES-2
Given the concerns associated with the use of diesel fuel and the introduction of BTEXconstituents into USDWs, EPA recently entered into a Memorandum of Agreement(MOA) with three major service companies to voluntarily eliminate diesel fuel fromhydraulic fracturing fluids that are injected directly into USDWs for CBM production(USEPA, 2003). Industry representatives estimate that these three companies performapproximately 95 percent of the hydraulic fracturing projects in the United States. Thesecompanies signed the MOA on December 15, 2003 and have indicated to EPA that theyno longer use diesel fuel as a hydraulic fracturing fluid additive when injecting intoUSDWs.
ES-1 How Does CBM Play a Role in the Nation’s Energy Demands?
CBM production began as a safety measure in underground coalmines to reduce theexplosion hazard posed by methane gas (Elder and Deul, 1974). In 1980, the U.S.Congress enacted a tax credit for non-conventional fuels production, including CBMproduction, as part of the Crude Oil Windfall Profit Act. In 1984, there were very fewCBM wells in the U.S.; by 1990, there were almost 8,000 CBM wells (Pashin andHinkle, 1997). In 1996, CBM production in 12 states totaled about 1,252 billion cubicfeet, accounting for approximately 7 percent of U.S. gas production (U.S. Department ofEnergy, 1999). At the end of 2000, CBM production from 13 states totaled 1.353 trillioncubic feet, an increase of 156 percent from 1992. During 2000, a total of 13,973 CBMwells were in production (GTI, 2001; EPA Regional Offices, 2001). According to theU.S. Department of Energy, natural gas demand is expected to increase at least 45percent in the next 20 years (U.S. Department of Energy, 1999). The rate of CBMproduction is expected to increase in response to the growing demand.
In evaluating CBM production and hydraulic fracturing activities, EPA reviewed thegeology of 11 major coal basins throughout the United States (Figure ES-1). The basinsshown in red have the highest CBM production volumes. They are the Powder RiverBasin in Wyoming and Montana, the San Juan Basin in Colorado and New Mexico, andthe Black Warrior Basin in Alabama. Hydraulic fracturing is or has been used tostimulate CBM wells in all basins, but it has not frequently been used in the PowderRiver, Sand Wash, or Pacific Coal Basins. Table ES-1 provides production statistics for2000 and information on hydraulic fracturing activity for each of the 11 basins in 2000.

EPA 816-R-04-003
Evaluation of Impacts to Underground Sources June 2004of Drinking Water by Hydraulic Fracturing ofCoalbed Methane Reservoirs ES-3
Figure ES-1. Major United States Coal Basins
Table ES-1. Coal Basins Production Statistics and Activity Information in the U.S.
BasinNumber of CBMProducing Wells
(Year 2000)*
Production of CBMin Billions of CubicFeet (Year 2000)*
Does HydraulicFracturing Occur?
Powder River 4,200 147 Yes (but infrequently)
Black Warrior 3,086 112 Yes
San Juan 3,051 925 Yes
Central Appalachian 1,924 52.9 Yes
Raton Basin 614 30.8 Yes
Uinta 494 75.7 Yes
Western Interior 420 6.5 Yes
Northern Appalachian 134 1.41 Yes
Piceance 50 1.2 Yes
Pacific Coal 0 0 Yes (but infrequently)
Sand Wash 0 0 Yes (but infrequently)
* Data provided by the Gas Technology Institute and EPA Regional Offices. Production figures include CBMextracted using hydraulic fracturing and other processes.

EPA 816-R-04-003
Evaluation of Impacts to Underground Sources June 2004of Drinking Water by Hydraulic Fracturing ofCoalbed Methane Reservoirs ES-4
ES-2 What Is Hydraulic Fracturing?
CBM gas is not structurally trapped in the natural fractures in coalbeds. Rather, most ofthe methane is adsorbed to the coal (Koenig, 1989; Winston, 1990; Close, 1993). Toextract the CBM, a production well is drilled through the rock layers to intersect the coalseam that contains the CBM. Next, fractures are created or existing fractures areenlarged in the coal seam through which the CBM can be drawn to the well and pumpedto the surface.
Figure ES-2 illustrates what occurs in the subsurface during a typical hydraulic fracturingevent. This diagram shows the initial fracture creation, fracture propagation, proppantplacement, and the subsequent fracturing fluid recovery/groundwater extraction stage ofthe CBM production process. The actual extraction of CBM generally begins after aperiod of fluid recovery/groundwater extraction. The hydraulically created fracture actsas a conduit in the rock or coal formation, allowing the CBM to flow more freely fromthe coal seams, through the fracture system, and to the production well where the gas ispumped to the surface.
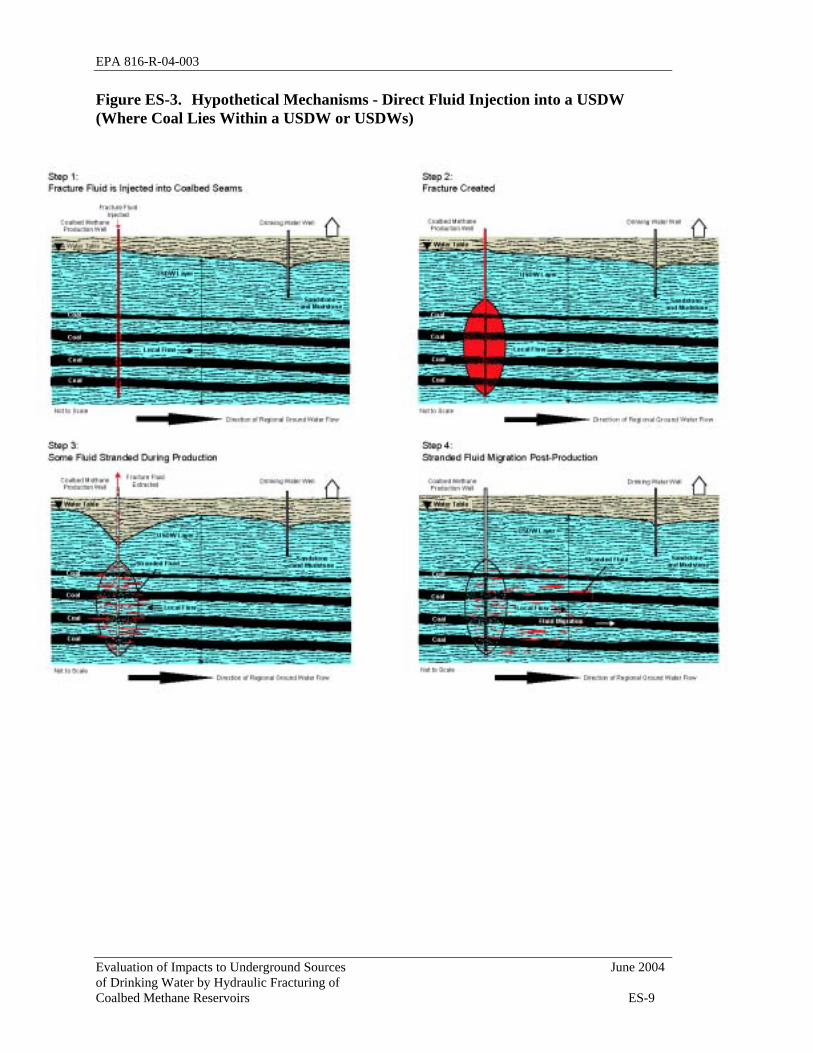
To create or enlarge fractures, a thick fluid, typically water-based, is pumped into thecoal seam at a gradually increasing rate and pressure. Eventually the coal seam is unableto accommodate the fracturing fluid as quickly as it is injected. When this occurs, thepressure is high enough that the coal fractures along existing weaknesses within the coal(steps 1 and 2 of Figure ES-1). Along with the fracturing fluids, sand (or some otherpropping agent or “proppant”) is pumped into the fracture so that the fracture remains“propped” open even after the high fracturing pressures have been released. Theresulting proppant-containing fracture serves as a conduit through which fracturing fluidsand groundwater can more easily be pumped from the coal seam (step 3 of Fig. ES-1).
To initiate CBM production, groundwater and some of the injected fracturing fluids arepumped out (or “produced” in the industry terminology) from the fracture system in thecoal seam (step 4 of Figure ES-1). As pumping continues, the pressure eventuallydecreases enough so that methane desorbs from the coal, flows toward, and is extractedthrough the production well (step 5 of Figure ES-1). In contrast to conventional gasproduction, the amount of water extracted declines proportionally with increasing CBMproduction. In some basins, huge volumes of groundwater are extracted from theproduction well to facilitate the production of CBM.

EPA 816-R-04-003
Evaluation of Impacts to Underground Sources June 2004of Drinking Water by Hydraulic Fracturing ofCoalbed Methane Reservoirs ES-5
Figure ES-2. A Graphical Representation of the Hydraulic Fracturing Process inCoalbed Methane Wells

EPA 816-R-04-003
Evaluation of Impacts to Underground Sources June 2004of Drinking Water by Hydraulic Fracturing ofCoalbed Methane Reservoirs ES-6
Figure ES-2. A Graphical Representation of the Hydraulic Fracturing Process inCoalbed Methane Wells (Continued)

EPA 816-R-04-003
Evaluation of Impacts to Underground Sources June 2004of Drinking Water by Hydraulic Fracturing ofCoalbed Methane Reservoirs ES-7
ES-3 Why Did EPA Evaluate Hydraulic Fracturing?
SDWA requires EPA and EPA-authorized states to have effective programs to preventunderground injection of fluids from endangering USDWs (42 U.S.C. 300h et seq.). Underground injection is the subsurface emplacement of fluids through a well bore (42U.S.C. 300h(d)(1)). Underground injection endangers drinking water sources if it mayresult in the presence of any contaminant in underground water which supplies or canreasonably be expected to supply any public water system, and if the presence of such acontaminant may result in such system’s noncompliance with any national primarydrinking water regulation (i.e., maximum contaminant levels (MCLs)) or may otherwiseadversely affect the health of persons (42 U.S.C. 300h(d)(2)). SDWA’s regulatoryauthority covers underground injection practices, but the Act does not grant authority forEPA to regulate oil and gas production.
In 1997, the Eleventh Circuit Court ruled, in LEAF v. EPA [LEAF v. EPA, 118F.3d 1467(11th Circuit Court of Appeals, 1997)], that because hydraulic fracturing of coalbeds toproduce methane is a form of underground injection, Alabama’s EPA-approvedUnderground Injection Control (UIC) Program must effectively regulate this practice. Inthe wake of the Eleventh Circuit’s decision, EPA decided to assess the potential forhydraulic fracturing of CBM wells to contaminate USDWs. EPA’s decision to conductthis study was also based on concerns voiced by individuals who may be affected byCBM development, Congressional interest, and the need for additional informationbefore EPA could make any further regulatory or policy decisions regarding hydraulicfracturing.
The Phase I study is tightly focused to address hydraulic fracturing of CBM wells anddoes not include other hydraulic fracturing practices (e.g., those for petroleum-based oiland gas production) because: (1) CBM wells tend to be shallower and closer to USDWsthan conventional oil and gas production wells; (2) EPA has not heard concerns fromcitizens regarding any other type of hydraulic fracturing; and (3) the Eleventh Circuitlitigation concerned hydraulic fracturing in connection with CBM production. The studyalso does not address potential impacts of non-injection related CBM productionactivities, such as impacts from groundwater removal or production water discharge. EPA did identify, as part of the fact-finding process, citizen concerns regardinggroundwater removal and production water.

EPA 816-R-04-003
Evaluation of Impacts to Underground Sources June 2004of Drinking Water by Hydraulic Fracturing ofCoalbed Methane Reservoirs ES-8
ES-4 What Was EPA’s Project Approach?
Based on public input, EPA decided to carry out this study in discrete phases to betterdefine its scope and to determine if additional study is needed after assessing the resultsof the preliminary phase(s). EPA designed the study to have three possible phases,narrowing the focus from general to more specific as findings warrant. This reportdescribes the findings from Phase I of the study. The goal of EPA’s hydraulic fracturingPhase I study was to assess the potential for contamination of USDWs due to theinjection of hydraulic fracturing fluids into CBM wells and to determine based on thesefindings, whether further study is warranted.
Phase I is a fact-finding effort based primarily on existing literature. EPA reviewedwater quality incidents potentially associated with CBM hydraulic fracturing, andevaluated the theoretical potential for CBM hydraulic fracturing to affect USDWs. EPAresearched over 200 peer-reviewed publications, interviewed approximately 50employees from industry and state or local government agencies, and communicated withapproximately 40 citizens and groups who are concerned that CBM production affectedtheir drinking water wells.
For the purposes of this study, EPA assessed USDW impacts by the presence or absenceof documented drinking water well contamination cases caused by CBM hydraulicfracturing, clear and immediate contamination threats to drinking water wells from CBMhydraulic fracturing, and the potential for CBM hydraulic fracturing to result in USDWcontamination based on two possible mechanisms as follows:
1. The direct injection of fracturing fluids into a USDW in which the coal islocated (Figure ES-3), or injection of fracturing fluids into a coal seam that isalready in hydraulic communication with a USDW (e.g., through a naturalfracture system).
2. The creation of a hydraulic connection between the coalbed formation and anadjacent USDW (Figure ES-4).
EPA 816-R-04-003
Evaluation of Impacts to Underground Sources June 2004of Drinking Water by Hydraulic Fracturing ofCoalbed Methane Reservoirs ES-9
Figure ES-3. Hypothetical Mechanisms - Direct Fluid Injection into a USDW(Where Coal Lies Within a USDW or USDWs)

EPA 816-R-04-003
Evaluation of Impacts to Underground Sources June 2004of Drinking Water by Hydraulic Fracturing ofCoalbed Methane Reservoirs ES-10
Figure ES-4. Hypothetical Mechanisms - Fracture Creates Connection to USDW
ES-5 How Do Fractures Grow?
In many CBM-producing regions, the target coalbeds occur within USDWs, and thefracturing process injects “stimulation” fluids directly into the USDWs. In otherproduction regions, target coalbeds are adjacent to the USDWs (i.e., either higher orlower in the geologic section). Because shorter fractures are less likely to extend into aUSDW or connect with natural fracture systems that may transport fluids to a USDW, theextent to which fractures propagate vertically influences whether hydraulic fracturingfluids could potentially affect USDWs.

EPA 816-R-04-003
Evaluation of Impacts to Underground Sources June 2004of Drinking Water by Hydraulic Fracturing ofCoalbed Methane Reservoirs ES-11
The extent of the fractures is difficult to predict because it is controlled by thecharacteristics of the geologic formation (including the presence of natural fractures), thefracturing fluid used, the pumping pressure, and the depth at which the fracturing is beingperformed. Fracture behavior through coals, shales, and other geologic strata commonlypresent in coal zones depends on site-specific factors such as the relative thickness andin-situ stress differences between the target coal seam(s) and the surrounding geologicstrata, as well as the presence of pre-existing natural fractures. Often, a high stresscontrast between adjacent geologic strata results in a barrier to fracture propagation. Anexample of this would be where there is a geologic contact between a coalbed and anoverlying, thick, higher-stress shale.
Another factor controlling fracture height can be the highly cleated nature of somecoalbeds. In some cases, highly cleated coal seams will prevent fractures from growingvertically. When the fracturing fluid enters the coal seam, it is contained within the coalseam’s dense system of cleats and the growth of the hydraulic fracture will be limited tothe coal seam (see Appendix A).
Deep vertical fractures can propagate vertically to shallower depths and develop ahorizontal component (Nielsen and Hansen, 1987, as cited in Appendix A: DOE,Hydraulic Fracturing). In the formation of these "T-fractures," the fracture tip may fillwith coal fines or intercept a zone of stress contrast, causing the fracture to turn anddevelop horizontally, sometimes at the contact of the coalbed and an overlying formation.(Jones et al., 1987; Morales et al., 1990). For cases where hydraulically inducedfractures penetrate into, or sometimes through, formations overlying coalbeds, they aremost often attributed to the existence of pre-existing natural fractures or thinly inter-bedded layering.
ES-6 What Is in Hydraulic Fracturing Fluids?
Fracturing fluids consist primarily of water or inert foam of nitrogen or carbon dioxide. Other constituents can be added to fluids to improve their performance in optimizingfracture growth. Components of fracturing fluids are stored and mixed on-site. FiguresES-5 and ES-6 show fluids stored in tanks at CBM well locations.
During a hydraulic fracturing job, water and any other additives are pumped from thestorage tanks to a manifold system placed on the production wells where they are mixedand then injected under high pressure into the coal formation (Figure ES-6). Thehydraulic fracturing in CBM wells may require from 50,000 to 350,000 gallons offracturing fluids, and from 75,000 to 320,000 pounds of sand as proppant (Holditch et al.,1988 and 1989; Jeu et al., 1988; Hinkel et al., 1991; Holditch, 1993; Palmer et al., 1991,1993a, and 1993b). More typical injection volumes, based on average injection volumedata provided by Halliburton for six basins, indicate a maximum average injectionvolume of 150,000 gallons of fracturing fluids per well, with a median average injectionvolume of 57,500 gallons per well (Halliburton, Inc., 2003).

EPA 816-R-04-003
Evaluation of Impacts to Underground Sources June 2004of Drinking Water by Hydraulic Fracturing ofCoalbed Methane Reservoirs ES-12
Figure ES-5. Water used for the fracturing fluid is stored on-site in large, uprightstorage tanks and in truck-mounted tanks.
EPA reviewedmaterial safetydata sheets todetermine thetypes of additivesthat may bepresent infracturing fluids. Water or nitrogenfoam frequentlyconstitutes thesolute infracturing fluidsused for CBM
stimulation. Other components of fracturing fluids contain benign ingredients, but insome cases, there are additives with constituents of potential concern. Because muchmore gel can be dissolved in diesel fuel as compared to water, the use of diesel fuelincreases the efficiency in transporting proppant in the fracturing fluids. Diesel fuel isthe additive of greatest concern because it introduces BTEX compounds, which areregulated by SDWA.
A thorough discussion of fracturing fluid components and fluid movement is presented inChapter 4.
Figure ES-6. The fracturing fluids, additives, and proppant are pumped from thestorage tanks to a manifold system placed on the wellhead where they are mixedjust prior to injection.

EPA 816-R-04-003
Evaluation of Impacts to Underground Sources June 2004of Drinking Water by Hydraulic Fracturing ofCoalbed Methane Reservoirs ES-13
ES-7 Are Coalbeds Located within USDWs?
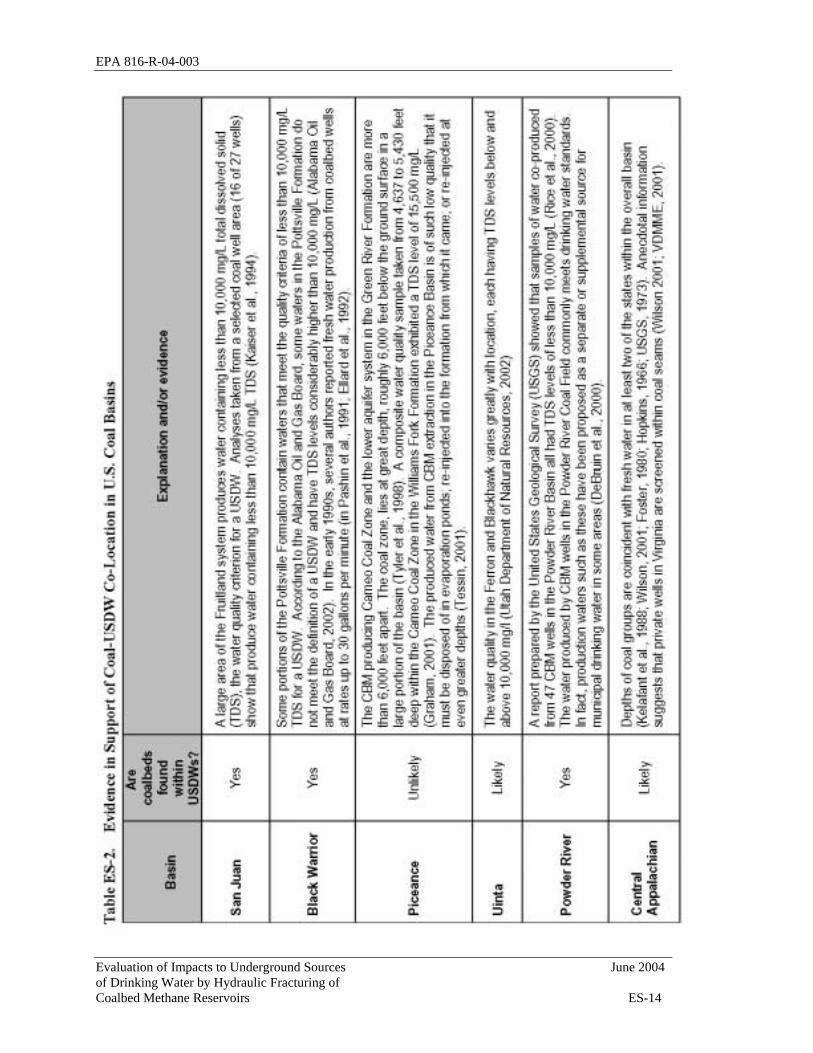
EPA reviewed information on 11 major coal basins to determine if coalbeds are co-located with USDWs and to understand the CBM activity in the area. If coalbeds arelocated within USDWs, then any fracturing fluids injected into coalbeds have thepotential to contaminate the USDW. As described previously, a USDW is notnecessarily currently used for drinking water and may contain groundwater unsuitable fordrinking without treatment. EPA found that 10 of the 11 basins may lie, at least in part,within USDWs. Table ES-2 identifies coalbed basin locations in relation to USDWs andsummarizes evidence used as the basis for the conclusions.
ES-8 Did EPA Find Any Cases of Contaminated Drinking Water Wells Caused byHydraulic Fracturing in CBM Wells?
EPA did not find confirmed evidence that drinking water wells have been contaminatedby hydraulic fracturing fluid injection into CBM wells. EPA reviewed studies andfollow-up investigations conducted by state agencies in response to citizen reports thatCBM production resulted in water quality and quantity incidents. In addition, EPAreceived reports from concerned citizens in each area with significant CBM development. These complaints pertained to the following basins:
• San Juan Basin (Colorado and New Mexico);• Powder River Basin (Wyoming and Montana);• Black Warrior Basin (Alabama); and• Central Appalachian Basin (Virginia and West Virginia).
Examples of concerns and claims raised by citizens include:
• Drinking water with strong, unpleasant taste and odor.• Impacts on fish, and surrounding vegetation and wildlife.• Loss of water in wells and aquifers, and discharged water creating artificial
ponds and swamps not indigenous to region.
Water quantity complaints were the most predominant cause for complaint by privatewell owners. After reviewing data and incident reports provided by states, EPA sees noconclusive evidence that water quality degradation in USDWs is a direct result ofinjection of hydraulic fracturing fluids into CBM wells and subsequent undergroundmovement of these fluids. Several other factors may contribute to groundwaterproblems, such as various aspects of resource development, naturally occurringconditions, population growth, and historical well-completion or abandonment practices. Many of the incidents that were reported (such as water loss and impacts on nearby floraand fauna from discharge of produced water) are beyond the authorities of EPA underSDWA and the scope of Phase I of this study.
EPA 816-R-04-003
Evaluation of Impacts to Underground Sources June 2004of Drinking Water by Hydraulic Fracturing ofCoalbed Methane Reservoirs ES-14

EPA 816-R-04-003
Evaluation of Impacts to Underground Sources June 2004of Drinking Water by Hydraulic Fracturing ofCoalbed Methane Reservoirs ES-15

EPA 816-R-04-003 Executive Summary
Evaluation of Impacts to Underground Sources June 2004of Drinking Water by Hydraulic Fracturing ofCoalbed Methane Reservoirs ES-16
ES-9 What Are EPA’s Conclusions?
Based on the information collected and reviewed, EPA has determined that the injectionof hydraulic fracturing fluids into CBM wells poses little or no threat to USDWs. Continued investigation under a Phase II study is not warranted at this time.
As proposed in the Final Study Design (April 2001), Phase I of the study was a limited–scope assessment in which EPA would:
• Gather existing information to review hydraulic fracturing processes,practices, and settings;
• Request public comment to identify incidents that have not been reported toEPA;
• Review reported incidents of groundwater contamination and any follow-upactions or investigations by other parties (state or local agencies, industry,academia, etc.); and,
• Make a determination regarding whether further investigation is needed,based on the analysis of information gathered through the Phase I effort.
EPA’s approach for evaluating the potential threat to USDWs was an extensiveinformation collection and review of empirical and theoretical data. EPA reviewedincidents of drinking water well contamination believed to be associated with hydraulicfracturing and found no confirmed cases that are linked to fracturing fluid injection intoCBM wells or subsequent underground movement of fracturing fluids. Althoughthousands of CBM wells are fractured annually, EPA did not find confirmed evidencethat drinking water wells have been contaminated by hydraulic fracturing fluid injectioninto CBM wells.
EPA also evaluated the theoretical potential for hydraulic fracturing to affect USDWsthrough one of two mechanisms:
1. Direct injection of fracturing fluids into a USDW in which the coal is located,or injection of fracturing fluids into a coal seam that is already in hydrauliccommunication with a USDW (e.g., through a natural fracture system).
2. Creation of a hydraulic connection between the coalbed formation and anadjacent USDW.
Regarding the question of injection of fracturing fluids directly into USDWs, EPAconsidered the nature of fracturing fluids and whether or not coal seams are co-locatedwith USDWs. Potentially hazardous chemicals may be introduced into USDWs whenfracturing fluids are used in operations targeting coal seams that lie within USDWs. In

EPA 816-R-04-003 Executive Summary
Evaluation of Impacts to Underground Sources June 2004of Drinking Water by Hydraulic Fracturing ofCoalbed Methane Reservoirs ES-17
particular, diesel fuel contains BTEX compounds, which are regulated under SDWA. However, the threat posed to USDWs by the introduction of some fracturing fluidconstituents is reduced significantly by the removal of large quantities of groundwater(and injected fracturing fluids) soon after a well has been hydraulically fractured. In fact,CBM production is dependent on the removal of large quantities of groundwater. EPAbelieves that this groundwater production, combined with the mitigating effects ofdilution and dispersion, adsorption, and potentially biodegradation, minimize thepossibility that chemicals included in the fracturing fluids would adversely affectUSDWs.
Because of the potential for diesel fuel to be introduced into USDWs, EPA requested,and the three major service companies agreed to, the elimination of diesel fuel fromhydraulic fracturing fluids that are injected directly into USDWs for CBM production(USEPA, 2003). Industry representatives estimate that these three companies performapproximately 95 percent of the hydraulic fracturing projects in the United States.
In evaluating the second mechanism, EPA considered the possibility that hydraulicfracturing could cause the creation of a hydraulic connection to an adjacent USDW. Thelow permeability of relatively unfractured shale may help to protect USDWs from beingaffected by hydraulic fracturing fluids in some basins. If sufficiently thick and relativelyunfractured shale is present, it may act as a barrier not only to fracture height growth, butalso to fluid movement. Shale’s ability to act as a barrier to fracture height growth isprimarily due to the stress contrast between the coalbed and the shale. Another factorcontrolling fracture height can be the highly cleated nature of some coalbeds. In somecases, when the fracturing fluid enters the coal seam, it is contained within the coalseam’s dense system of cleats and the growth of the hydraulic fracture will be limited tothe coal seam (see Appendix A).
Some studies that allow direct observation of fractures (i.e., mined-through studies)indicate many fractures that penetrate into, or sometimes through, one or moreformations overlying coalbeds can be attributed to the existence of pre-existing naturalfractures. However, given the concentrations and flowback of injected fluids, and themitigating effects of dilution and dispersion, adsorption, and potentially biodegradation,EPA does not believe that possible hydraulic connections under these circumstancesrepresent a significant potential threat to USDWs.
It is important to note that states with primary enforcement authority (primacy) for theirUIC Programs implement and enforce their regulations, and have the authority underSDWA to place additional controls on any injection activities that may threaten USDWs.States may also have additional authorities by which they can regulate hydraulicfracturing. With the expected increase in CBM production, the Agency is committed toworking with states to monitor this issue.

EPA 816-R-04-003 Executive Summary
Evaluation of Impacts to Underground Sources June 2004of Drinking Water by Hydraulic Fracturing ofCoalbed Methane Reservoirs ES-18
REFERENCES
Alabama Oil and Gas Board. 2002. Public Comment OW-2001-0002-0029 to "DraftEvaluation of Impacts to Underground Sources of Drinking Water by HydraulicFracturing of Coalbed Methane Reservoirs." Federal Register. Vol. 63, No. 185.p. 33992, September 24, 2002.
Andrews, R.D., B.J. Cardott, and T. Storm. 1998. The Hartshorne Play in SoutheasternOklahoma: regional and detailed sandstone reservoir analysis and coalbed-methane resources. Oklahoma Geological Survey, Special Publication 98-7.
Bostic, J.L., L.L. Brady, M.R. Howes, R.R. Burchett, and B.S. Pierce. 1993. Investigation of the coal properties and the potential for coal-bed methane in theForest City Basin. US Geological Survey, Open File Report 93-576.
Close, Jay. C. 1993. Natural Fractures in Coal; Chapter 5 of AAPG Studies in Geology38, “Hydrocarbons from Coal”, pp. 119-133.
Colorado Oil and Gas Conservation Commission. 2001. http://www.oil-gas.state.co.us/
Condra, G.E. and E.C. Reed. 1959. The geological section of Nebraska. NebraskaGeological Survey Bulletin 14A, 1959.
Cordova, R.M. 1963. Reconnaissance of the ground-water resources of the ArkansasValley Region, Arkansas. Contributions to the Hydrology of the United States,Geological Survey Water-Supply Paper 1669-BB, 1963.
DASC website. 2001a. Kansas elevation map. http://gisdasc.kgs.ukans.edu/dasc/kanview.html
DASC website. 2001b. Ozark Aquifer base map. http://gisdasc.kgs.ukans.edu/dasc/kanview.html
DeBruin, R.H., R.M. Lyman, R.W. Jones, and L.W. Cook. 2000. Information Pamphlet7. Wyoming State Geological Survey.
Dion, N.P. 1984. Washington Ground-Water Resources. In National Water Summary,US Geological Survey Water-Supply Paper No. 2275, pp. 433-438.
Duigon, M.T. and M.J. Smigaj. 1985. First report on the hydrologic effects ofunderground coal mining in Southern Garrett County, Maryland, US GeologicalSurvey Report of Investigations No. 41.

EPA 816-R-04-003 Executive Summary
Evaluation of Impacts to Underground Sources June 2004of Drinking Water by Hydraulic Fracturing ofCoalbed Methane Reservoirs ES-19
Elder, C.H. and M. Deul. 1974. Degasification of the Mary Lee coalbed near OakGrove, Jefferson county, Alabama, by vertical borehole in advance of mining; USBureau of Mines Report 7968.
Ellard, J.S., R.P. Roark, and W.B. Ayers. 1992. Geologic controls on coalbed methaneproduction: an example from the Pottsville formation, Black Warrior Basin,Alabama USA. Symposium on Coalbed Methane Research and Development inAustralia. James Cook University, p. 45-61.
Eleventh Circuit Court of Appeals, 1997. LEAF v. EPA, 118F.3d 1467.
Flowerday, C.F., R.D. Kuzelka, and D.T. Pederson, compilers. 1998. The GroundWater Atlas of Nebraska.
Foster, J.B. 1980. Fresh and saline ground-water map of West Virginia. US GeologicalSurvey, West Virginia Geological and Economic Survey, Map WV-12.
Friedman, S.A. 1982. Determination of reserves of methane from coalbeds for use inrural communities in eastern Oklahoma. Oklahoma Geological Survey, SpecialPublication 82-3, 1982.
Gas Technology Institute (GTI). 2001. Personal communication with GTI staff.
Graham, G. 2001. Colorado Division of Water Resources, personal communication withstaff.
Halliburton, Inc. 2003. Personal communication with Halliburton staff, fracturing fluidexpert, Steve Almond. April 2003.
Hinkel, J.J., K.H. Nimerick, K. England, J.C. Norton, and M. Roy. 1991, Design andevaluation of stimulation and workover treatments in coal seam reservoirs;Proceedings 1991 Coalbed Methane Symposium, University of Alabama(Tuscaloosa), Tuscaloosa, p. 453-458.
Holditch, S.A., J.W. Ely, M.E. Semmelbeck, R.H. Carter, J. Hinkle, and R.G. Jeffrey. 1988. Enhanced recovery of coalbed methane through hydraulic fracturing; SPEPaper 18250, Proceedings 1988 SPE Annual Technical Conference andExhibition (Production Operations and Engineering), p. 689.
Holditch, S.A., J.W. Ely, and R.H. Carter. 1989. Development of a coal seam fracturedesign manual; Proceedings, 1989 Coalbed Methane Symposium, Tuscaloosa,Alabama, pp. 299-320.
Holditch, S.A., 1993, Completion methods in coal-seam reservoirs; Journal of PetroleumTechnology, v.45 n.3 (March 1993), pp. 270-276.

EPA 816-R-04-003 Executive Summary
Evaluation of Impacts to Underground Sources June 2004of Drinking Water by Hydraulic Fracturing ofCoalbed Methane Reservoirs ES-20
Hopkins, Herbert T. 1966. Fresh-saline water interface map of Kentucky. USGeological Survey, Kentucky Geological Survey, Series X.
Jeu, S.J., T.L. Logan, and R.A. McBane. 1988, Exploitation of deeply buried coalbedmethane using different hydraulic fracturing techniques; SPE paper 18253,Proceedings 63rd Annual Technical Conference (Houston).
Jones, A.H., Bell, G.J., and Morales, R.H. 1987. Examination of potential mechanismsresponsible for the high treatment pressures observed during stimulation ofcoalbed reservoirs; SPE Paper 16421, Proceedings, Department of Energy/SPESymposium: Gas from Low Permeability Reservoirs, p. 317.
Kaiser, W.R., Swartz, T.E., and Hawkins, G.J. 1994. Hydrologic framework of theFruitland formation, San Juan Basin. New Mexico Bureau of Mines and MineralsBulletin 146: Coalbed methane in the upper Cretaceous Fruitland formation, SanJuan Basin, New Mexico and Colorado, pp. 133-164.
Kelafant, J.R., D.E. Wicks, and V.A. Kuuskraa. March 1988. A geologic assessment ofnatural gas from coal seams in the Northern Appalachian Coal Basin. TopicalReport – Final Geologic Report (September 1986 – September 1987).
Macfarlane, A. 2001. Kansas Geological Survey, personal communication.
Morales, R,H, McLennan, J.D., Jones, A.H., and Schraufnagel, R.A. 1990. Classification of treating pressures in coal fracturing; Proceedings of the 31st U.S.Symposium on Rock Mechanics, 31, pp. 687-694.
National Water Summary. 1984. Hydrologic events, selected water-quality trends, andground-water resources. United States Geological Survey Water-Supply PaperNo. 2275.
Nielsen, P. E. and Hanson, M. E. 1987. Analysis and Implications of Three FractureTreatments in Coals at the USX Rock Creek Site Near Birmingham, Alabama,1987 Coalbed Methane Symposium, Tuscaloosa, AL (Nov. 16-19, 1987).
OCC (Oklahoma Corporation Commission), Depth to Base of Treatable Water MapSeries, 2001.
Palmer, I.D., N.S. King, and D.P. Sparks. 1991. The character of coal fracturetreatments in Oak Grove field, Black Warrior basin, SPE paper no. 22914,Proceedings, 1991 Society of Petroleum Engineers annual technical conferenceand exhibition, pp.277-286.

EPA 816-R-04-003 Executive Summary
Evaluation of Impacts to Underground Sources June 2004of Drinking Water by Hydraulic Fracturing ofCoalbed Methane Reservoirs ES-21
Palmer, I.D., N.S. King, and D.P. Sparks. 1993a. The character of coal fracturetreatments in the Oak Grove field, Black Warrior basin; In Situ, Journal of CoalResearch, v.17 (3), pp. 273-309.
Palmer, I.D., S.W. Lambert, and J.L. Spitler. 1993b. Coalbed methane well completionsand stimulations. Chapter 14 of AAPG Studies in Geology 38, pp. 303-341.
Pashin, J.C. and F. Hinkle. 1997. Coalbed Methane in Alabama. Geological Survey ofAlabama Circular 192, 71pp.
Pashin, J.C., W.E. Ward, R.B. Winston, R.V. Chandler, D.E. Bolin, K.E. Richter, W.E. Osborne, and J.C. Sarnecki. 1991. Regional analysis of the Black Creek-Cobbcoalbed methane target interval, Black Warrior Basin, Alabama. AlabamaGeological Survey Bulletin 145, 127pp.
Platt, S. January, 2001. US EPA Region 3, personal communication.
Quarterly Review. 1993. Coalbed methane – state of the industry. Methane From CoalSeams Technology, August, 1993.
Rice, C.A., M.S. Ellis, and J.H. Bullock, Jr. 2000. Water co-produced with coalbedmethane in the Powder River Basin, Wyoming: preliminary compositional data. US Geological Survey Open-File Report 00-372.
Sedam, A.C. and R.B. Stein. 1970. Saline ground-water resources of Ohio. HydrologicInvestigations Atlas HA-366, Department of the Interior, US Geological Survey.
Tessin, R. 2001. Colorado Oil and Gas Conservation Commission, personalcommunication.
Tyler, R., A.R. Scott, and W.R. Kaiser. 1998. Defining coalbed methane explorationfairways: An example from the Piceance Basin, Rocky Mountain Foreland. Western United States, Conference Document, March 23-25. http://georef.cos.com/cgi-bin/getRec?un=2001-012340
U.S. Department of Energy. 1999. Environmental Benefits of Advanced Oil and GasExploration and Production Technology, Office of Fossil Energy, p 8.
U.S. Environmental Protection Agency. 2001. Personal communication with EPARegional staff.

EPA 816-R-04-003 Executive Summary
Evaluation of Impacts to Underground Sources June 2004of Drinking Water by Hydraulic Fracturing ofCoalbed Methane Reservoirs ES-22
US Environmental Protection Agency. 2003. A Memorandum of Agreement BetweenThe United States Environmental Protection Agency And BJ Services Company,Halliburton Energy Services, Inc., and Schlumberger Technology CorporationElimination of Diesel Fuel in Hydraulic Fracturing Fluids Injected intoUnderground Sources of Drinking Water During Hydraulic Fracturing of CoalbedMethane Wells, December 12, 2003. http://www.epa.gov/safewater/uic/pdfs/moa_uic_hyd-fract.pdf
United States Geological Survey (USGS). 1971. State of Ohio, 1:500,000 topographicmap.
USGS. 1973. State of Kentucky, 1:500,000 topographic map. National WaterSummary. 1984. Hydrologic events, selected water-quality trends, and ground-water resources. United States Geological Survey Water-Supply Paper No. 2275.
Utah Department of Natural Resources. 2002. Public Comment OW-2001-0002-0090to "Draft Evaluation of Impacts to Underground Sources of Drinking Water byHydraulic Fracturing of Coalbed Methane Reservoirs." Federal Register. Vol.63, No. 185. p. 33992, September 24, 2002.
Virginia Department of Mines, Minerals, and Energy (VDMME). 2001. Personalcommunication with VDMME staff.
Wilson, R. February, 2001. Director, Virginia Division of Gas & Oil, Department ofMines, Minerals, and Energy, personal communication.
Winston, R.B. 1990. Vitrinite reflectance of Alabama’s bituminous coal; AlabamaGeological Survey Circular 139, 54 pp.
Zebrowitz, M.J., J.R. Kelafant, and C.M. Boyer. 1991. Reservoir characterization andproduction potential of the coal seams in Northern and Central AppalachianBasins. Proceedings of the 1991 Coalbed Methane Symposium, The Universityof Alabama/Tuscaloosa, May 13-16, 1991.

xiii
List of Acronyms and Abbreviations
Fg/g Micrograms per gram
Fg/L Micrograms per liter
ADEM Alabama Department of Environmental Management
Bbl/min Barrel per minute
Bcf Billion cubic feet
Bgs Below ground surface
BHP Bottom hole pressure
BLM Bureau of Land Management
BTEX Benzene, toluene, ethylbenzene, xylenes
Btu British thermal unit
CBM Coalbed methane
CDH Colorado Department of Health
CCL Contaminant Candidate List
CDWR Colorado Division of Water Resources
CFR Code of Federal Regulations
CMHPG Carboxymethylhydroxypropylguar
COGCC Colorado Oil and Gas Conservation Commission
DASC Data Access and Support Center
DNR Department of Natural Resources
DOE Department of Energy
EPA Environmental Protection Agency
g Gram
g/mL Grams per milliliter
GRI Gas Research Institute
GTI Gas Technology Institute
GSA Geological Survey of Alabama
HCl Hydrochloric acid
xiv
HEC Hydroxyethylcellulose
HPG Hydroxypropylguar
KCl Potassium chloride
L Liter
LEAF Legal Environmental Assistance Foundation
Mcf Million cubic feet
MCL Maximum contaminant level
md Millidarcy
mg/L Milligrams per liter
mL Milliliter
MOA Memorandum of Agreement
MSDS Material Safety Data Sheet
MTBE Methyl tert butyl ether
NMOCD New Mexico Oil Conservation Division
NPDEA National Pollution Discharge Elimination System
OGB Oil and Gas Board
OGWDW Office of Ground Water and Drinking Water
P3D Pseudo 3 Dimensional
PAH Polynuclear aromatic hydrocarbons
POM Polycyclic organic matter
ppm Parts per million
PRBRC Powder River Basin Resource Council
PRCMIC Powder River Coalbed Methane Information Council
psi Pounds per square inch
SDWA Safe Drinking Water Act
SEO State Engineer’s Office
SJRA San Juan Regional Authority
TBEG Texas Bureau of Economic Geology

xv
Tcf Trillion cubic feet
TDS Total dissolved solids
TGD Tennessee Geology Division
UIC Underground Injection Control
USBM United States Bureau of Mines
USDW Underground Source of Drinking Water
USGS United States Geological Survey
VDMME Virginia Division of Oil and Gas, within the Department of Mines, Minerals and Energy
wt. Weight

xvi
Glossary
Adsorption Adhesion of gas molecules, ions or molecules in solution to the surface of solid bodieswith which they are in contact.
Alluvial aquifer A water-bearing deposit of unconsolidated material (e.g., sand and gravel) left behind bya river or other flowing water.
Amphoteric Having both basic and acidic properties.
Anaerobic Bacteria Bacteria that thrive in oxygen-poor environments.
Anisotropic Having some physical property that varies with direction from a given location.
Annulus The space between the casing (the material that is used to keep the well stable; typicallythis material is steel) in a well and the wall of the hole, or between two concentric stringsof casing, or between casing and tubing.
Anticline A fold of layered, sedimentary rocks whose core contains stratigraphically older rocks,the shape of the fold is generally convex upward.
Aureole A ring surrounding a volcanic intrusion where the surrounding rock has been altered.
Azimuth The direction of a horizontal line as measured on an imaginary horizontal circle.
Bedrock aquifer An aquifer located in the solid rock underlying unconsolidated surface materials (i.e.,sediment). Solid rock can bear water when it is fractured.
Billion cubic feet A unit typically used to define gas production volumes in the coalbed methane industry; 1Bcf is roughly equivalent to the volume of gas required to heat approximately 12,000households for one year (based on the Department of Energy's average household energyconsumption statistic, 2001).
Biogenic A direct product of the physiological activities of organisms.
Bituminous From the base word bitumen, referring to a general term for various solid and semi-solidhydrocarbons that are able to join together and are soluble in carbon bisulfide (e.g.,asphalts).
Breaker A fracturing fluid additive that is added to break down the viscosity of the fluid.
Breccia A coarse-grained clastic rock composed of angular broken rock fragments held togetherby a mineral cement or a fine-grained matrix.
Brecciated Consisting of angular fragments cemented together.
Btu British thermal unit; a unit of measure used to define energy.
Butt Cleat The coal cleat set that abuts into face cleats.
Capture Zone The portion of an aquifer that contributes water to a particular pumping well.

xvii
Cavitation Cycling Also known as cavity completion, an alternative completion technique to hydraulicfracturing, in which a cavity is generated by alternately pumping in nitrogen and blowingdown pressure.
Cleats Natural fractures in coal that often occur in systematic sets, through which gas and watercan flow.
CMHPG Carboxymethyl hydroxypropylguar; a form of guar gel.
Craton A part of the earth’s crust that has attained stability and has been relatively undeformedfor a long time; the term is restricted to continents, and includes both shield andplatform.
Crosslinker An additive that when added to a linear gel, will create a complex, high viscosity,pseduoplastic fracturing fluid.
Crosslinked Gel A gel to which a crosslinker has been added (see crosslinker).
Darcy A measure of the permeability of rock or sediment.
Desorption Liberation of tightly held methane gas molecules previously bound to the solid surface ofthe coal.
Epiclastic Formed from the fragments or particles broken away (by weathering and erosion) frompre-existing rocks to form an altogether new rock in a new place.
Evapotranspiration The portion of precipitation returned to the air through evaporation and transpiration.
Face Cleat A coal cleat set that is through-going and continuous.
Flowback The process of causing fluid to flow back to the well out of a fracture after a hydraulicfracturing event is completed.
Fracture Conductivity The capability of the fracture to conduct fluids under a given hydraulic head difference.
Geophone A seismic detector, placed on or in the ground, that responds to ground motion at itspoint of location.
Graben An elongate, down-dropped block that is bounded by nearly parallel faults on both sides.
Guar Organic powder thickener, typically used to make viscous fracturing fluids, completelysoluble in hot and cold water, insoluble in oils, grease and hydrocarbons.
HCl Molecular formula for hydrochloric acid; can be used in diluted form in the hydraulicfracturing process to fracture limestone formations and to clean up perforations incoalbed methane fracturing treatments.
HEC Hydroxyethylcellulose; a form of guar gel.
Hydraulic Conductivity (see permeability)
Injectate In relation to the coalbed methane industry, this is the fracturing fluid injected into acoalbed methane well.
Isopach A line drawn on a map through points of equal true thickness of a designatedstratigraphic unit or group of stratigraphic units.

xviii
Isotopic Rocks formed in the same environment, i.e. in the same sedimentary basin or geologicprovince.
Isotropic A medium, such as unconsolidated sediments or a rock formation, whose properties arethe same in all directions.
KCl Molecular formula for potassium chloride.
Lacustrine Pertaining to, produced by, or formed in a lake or lakes.
Laminar Flow Water flow in which the stream lines remain distinct and the flow direction at every pointremains unchanged with time; non-turbulent flow.
Leakoff The magnitude of pressure exerted on a formation that causes fluid to be forced into theformation. In common usage, leakoff is often considered the movement of fluid out ofprimary fractures and into a geologic formation, either through small existing permeablepaths (connected pores and natural fracture networks) or through smallpathways created or enlarged in the rock through the fracturing process.
Lenticular Pertaining to a discontinuous, lens-shaped (saucer-shaped) stratigraphic body.
Linear Gel A simple guar-based fracturing fluid usually formulated using guar and water withadditives or guar with diesel fuel.
Lithology The description of rocks based on mineralogic composition and texture.
Millidarcy The customary unit of measurement of fluid permeability; equivalent to 0.001 Darcy.
Mcf Million cubic feet; a unit typically used to define gas production volumes in the coalbedmethane industry; 1 Mcf is roughly equivalent to the volume of gas required to heatapproximately 12 households for one year (based on the Department of Energy'saverage household energy consumption statistic, 2001); Mcf can sometimes represent1,000 cubic feet.
mg/L Milligrams per liter; typically used to define concentrations of a dissolved compound in afluid.
Mined-through studies Mined-through studies are projects in which coalbeds have been actually mined through(i.e., the coal has been removed) so that remaining coal and surrounding rock can beinspected, after the coalbeds have been hydraulically fractured. These studies provideunique subsurface access to investigate coalbeds and surrounding rock after hydraulicfracturing.
Moduli Plural of modulus (often referred to as bulk modulus), the ratio of stress to strain,abbreviated as “k”. The bulk modulus is an elastic constant equal to the applied stressdivided by the ratio of the change in volume to the original volume of a body.
Overthrust A low-angle thrust fault of large scale, with total displacement (lateral or vertical)generally measured in kilometers.
Pad An initial volume of fluid that is used to initiate and propagate a fracture before aproppant is placed.
Paleochannels Old or ancient river channels preserved in the subsurface as lenticular sandstones.

xix
Permeability The capacity of a porous rock, sediment, or soil to transmit a fluid; it is a measure of therelative ease of fluid flow under equal pressure and from equal elevations.
Physiographic A region of which all parts are similar in geologic structure and climate and which hashad a unified geomorphic history; its relief features differ significantly from those ofadjacent regions.
Play A productive coalbed methane formation, or a productive oil or gas deposit.
Potentiometric The total head of ground water, defined by the level to which water will rise in a well.
ppm Parts per million; typically used to define concentrations of a dissolved compound in afluid; equivalent to 1 mg/L.
Primacy The right to self-establish, self-enforce and self-regulate environmental standards; thisenforcement responsibility is granted by EPA to States and Indian Tribes.
Primary porosity The porosity preserved from some time between sediment deposition and the final rock-forming process; (e.g., the spaces between grains of sediment).
Proppant Granules of sand, ceramic or other minerals that are wedged within the fracture and actto “prop” it open after the fluid pressure from fracture injection has dissipated.
psi Pounds per square inch; a unit of pressure.
Rank The degree of metamorphism in coal; the basis of coal classification into a natural seriesfrom lignite to anthracite.
Screen-out Term used to describe a fracturing job where proppant placement has failed.
Secondary porosity The porosity created through alteration of rock, commonly by processes such as,dissolution and fracturing.
Semianthracite Term used to identify coal rank; specifically representing coal that possesses a fixed-carbon content of 86% to 92%.
Stratigraphy The study of rock strata; concerning all characteristics and attributes of rocks and theirinterpretation in terms of mode of origin and geologic history.
Subbituminous A black coal, intermediate in rank between lignite and bituminous.
Subgraywacke A sedimentary rock (sandstone) that contains less feldspar, and more and better-roundedquartz grains than graywacke; intermediate in composition between graywacke andorthoquartzite; it is lighter-colored and better-sorted, and has less matrix thangreywacke.
Surficial Pertaining to or lying in or on a surface; specific to the surface of the earth.
Syncline A fold of layered, sedimentary rocks whose core contains stratigraphically youngerrocks; shape of fold is generally concave upward.
Tcf Trillion cubic feet; a unit typically used to define gas production volumes in the coalbedmethane industry; 1 Tcf is roughly equivalent to the volume of gas required to heatapproximately 12 million households for one year (based on the Department of Energy'saverage household energy consumption statistic, 2001).

xx
Thermogenic A direct product of high temperatures, (e.g. Thermogenic methane).
Toughness The point at which enough stress intensity has been applied to a rock formation, so that afracture initiates and propagates.
Transmissivity A measure of the amount of water that can be transmitted horizontally through a unitwidth by the full saturated thickness of the aquifer under a hydraulic gradient of one.
Up-warp The uplift of a region; usually a result of the release of isostatic pressure, e.g. the meltingof an ice sheet.
Viscosity The property of a substance to offer internal resistance to flow; internal friction.
Volcaniclastic Composed of fragments or particles, and related to volcanic processes either by formingas the result of explosive processes or due to the weathering and erosion of volcanicrocks.

EPA 816-R-04-003 Chapter 1Introduction
Evaluation of Impacts to Underground Sources June 2004of Drinking Water by Hydraulic Fracturing ofCoalbed Methane Reservoirs 1-1
Chapter 1Introduction
Section 1421 of SDWA tasks EPA with protecting USDWs for all current and futuredrinking water supplies across the country (see section 1.3 for the complete definition ofa USDW). EPA’s UIC Program is responsible for ensuring that fluids injected into theground (for purposes including waste disposal, oil field brine disposal, enhancedrecovery of oil and gas, mining, and emplacement of other fluids) do not endangerUSDWs.
EPA, through its UIC Program, conducted a fact-finding effort based primarily onexisting literature. The goal of this study was to assess the potential for contamination ofUSDWs due to the injection of hydraulic fracturing fluids into coalbed methane wells andto determine, based on these findings, whether further study is warranted. For thepurposes of this study, EPA assessed USDW impacts by the presence or absence ofdocumented drinking water well contamination cases caused by coalbed methanehydraulic fracturing, clear and immediate contamination threats to drinking water wellsfrom coalbed methane hydraulic fracturing, and the potential for coalbed methanehydraulic fracturing to result in USDW contamination based on two possible mechanismsas follows:
1. Direct injection of fracturing fluids into a USDW in which the coal is located,or injection of fracturing fluids into a coal seam that is already in hydrauliccommunication with a USDW (e.g., through a natural fracture system).
2. Creation of a hydraulic connection between the coalbed formation and anadjacent USDW.
EPA obtained information for this study from literature searches, field visits, a review ofreported groundwater contamination incidents in areas where coalbed methane isproduced, and solicitation of information from the public on any impacts to groundwaterbelieved to be associated with hydraulic fracturing.
EPA also reviewed 11 major coal basins throughout the United States to determine ifcoalbeds are co-located with USDWs and to understand the coalbed methane activity inthe area (Figure 1-1). The basins shown in red have the highest coalbed methaneproduction volumes. They are the Powder River Basin in Wyoming and Montana, theSan Juan Basin in Colorado and New Mexico, and the Black Warrior Basin in Alabama. Hydraulic fracturing is or has been used to stimulate coalbed methane wells in all basins,although it has not frequently been used in the Powder River, Sand Wash, or Pacific CoalBasins.

EPA 816-R-04-003 Chapter 1Introduction
Evaluation of Impacts to Underground Sources June 2004of Drinking Water by Hydraulic Fracturing ofCoalbed Methane Reservoirs 1-2
Figure 1-1. Locus Map of Major United States Coal Basins
1.1 EPA’s Rationale for Conducting This Study
Although coalbed methane has many environmental advantages over traditional energysources, concerns have been raised regarding the environmental impacts of coalbedmethane production. Coalbed methane production in certain areas has led togroundwater depletion and production water discharge issues (i.e., issues that are notassociated with the quality of USDWs). Citizens, state agencies, producers, and theregional EPA offices in those areas are working in concert to better understand andmitigate these potential problems.
This study examines the potential for hydraulic fracturing fluid injection into coalbedmethane wells to contaminate USDWs. EPA conducted this study in response toallegations that hydraulic fracturing of coalbed methane wells has affected the quality ofgroundwater (i.e., issues that are associated with the mandates of the UIC Program). State oil and gas agencies receiving such complaints have indicated that, based on theirinvestigations, hydraulic fracturing of coalbed methane wells has not contributed to waterquality degradation in USDWs.
In response to an Eleventh Circuit Court of Appeals (hereafter, “the Court”) decision[LEAF v. EPA, 118F.3d 1467 (11th Cir, 1997)], the State of Alabama recently

EPA 816-R-04-003 Chapter 1Introduction
Evaluation of Impacts to Underground Sources June 2004of Drinking Water by Hydraulic Fracturing ofCoalbed Methane Reservoirs 1-3
supplemented its rules governing the hydraulic fracturing of wells to include additionalrequirements to protect USDWs during the hydraulic fracturing of coalbeds for methaneproduction. Prior to the Court’s decision, EPA had not considered hydraulic fracturing asan underground injection activity, because the Agency did not consider production wellstimulation as an activity subject to UIC regulations. Nevertheless, the Court held thatthe injection of fluids for the purpose of hydraulic fracturing constitutes undergroundinjection as defined under SDWA, that all underground injection must be regulated, andthat hydraulic fracturing of coalbed methane wells in Alabama must be regulated underAlabama’s UIC program.
In the wake of the Eleventh Circuit Court decision, EPA decided to assess the potentialfor hydraulic fracturing fluid injection into coalbed methane wells to contaminateUSDWs. EPA’s decision to conduct this study was also based on concerns voiced byindividuals who may be affected by coalbed methane development, Congressionalinterest, and the need for additional information before EPA could make any furtherregulatory or policy decisions regarding hydraulic fracturing.
1.2 Overview of Hydraulic Fracturing
Hydraulic fracturing is a technique used by the oil and gas industry to improve theproduction efficiency of oil and coalbed methane wells. The hydraulic fracturing processuses high hydraulic pressures to initiate a fracture. A hydraulically induced fracture actsas a conduit in the rock or coal formation that allows the oil or coalbed methane to travelmore freely from the rock pores to the production well that can bring it to the surface.
In the case of coalbed methane gas production, the gas is not structurally “trapped” underpressure. Rather, most of the coalbed methane is adsorbed within small pores in the“micro-porous matrix” of the coal (Koenig, 1989; Winston, 1990; Close, 1993). Whencoalbed methane production begins, water is first pumped out (or “produced” in theindustry terminology) from the fractures, joints, and cleats (i.e., tiny, disconnectedclusters of fractures) in the coal until the pressure declines to the point that methanebegins to desorb from the coal matrix itself (Gray, 1987).
To extract the coalbed methane, a production well is drilled through rock layers tointersect the coal seam that contains the coalbed methane. Next, a fracture is created orenlarged in the coal seam to connect the well bore to the coalbed joint/cleat system. Tocreate such a fracture, a thick, water-based fluid is pumped into the coal seam at agradually increasing rate. At a certain point, the coal seam will not be able toaccommodate the fracturing fluid as quickly as it is being injected. When this occurs, thepressure is high enough that the coal gives way, and a fracture is created or an existingfracture is enlarged. To hold the fracture open, a propping agent, usually sand(commonly known as “proppant”), is pumped into the fracture so that when the pumpingpressure is released, the fracture does not close completely because the proppant is

EPA 816-R-04-003 Chapter 1Introduction
Evaluation of Impacts to Underground Sources June 2004of Drinking Water by Hydraulic Fracturing ofCoalbed Methane Reservoirs 1-4
“propping” it open. The resulting fracture filled with proppant becomes a conduitthrough which water can flow to the production well, thus depressurizing the coal matrix,allowing for the desorption of methane and its flow towards the production well.
The extent of the fracture in a coalbed is controlled by the characteristics of the geologicformation (including the presence of natural fractures), the fracturing fluid used, thepumping pressure, and the depth at which the fracturing is performed. Whether thefracture grows taller or longer is determined by the properties of the surrounding rock. Ahydraulically created fracture will always take the path of least resistance through thecoal seam and surrounding formations.
A more comprehensive discussion of the fracturing process and the fracturingfluids/additives used in hydraulic fracturing of coalbed methane wells is presented inChapters 3 and 4, respectively.
1.3 EPA’s Authority to Protect Underground Sources of Drinking Water
SDWA requires EPA and EPA-authorized states to have effective programs to preventunderground injection of fluids from endangering USDWs (42 U.S.C. 300h et seq.). Underground injection is the subsurface emplacement of fluids through a well bore (42U.S.C. 300h(d)(1)). Underground injection endangers drinking water sources if it mayresult in the presence of any contaminant in underground water which supplies or canreasonably be expected to supply any public water system, and if the presence of suchcontaminant may result in such system’s noncompliance with any national primarydrinking water regulation (i.e., maximum contaminant levels) or may otherwise adverselyaffect the health of persons (42 U.S.C. 300h(d)(2)). SDWA’s regulatory authorityextends to underground injection practices; SDWA does not provide a general grant ofauthority for EPA to regulate oil and gas production.
A USDW is defined in the UIC regulations at 40 CFR 144.3 as an aquifer or a portion ofan aquifer that:
“A. 1. Supplies any public water system; or2. Contains sufficient quantity of groundwater to supply a
public water system; andi. currently supplies drinking water for human
consumption; orii. contains fewer than 10,000 milligrams per liter
(mg/L) total dissolved solids (TDS); and B. Is not an exempted aquifer.”
The water quality standard for USDWs is more stringent than EPA’s National SecondaryDrinking Water Standards for potable water, which cover aesthetic concerns such as taste

EPA 816-R-04-003 Chapter 1Introduction
Evaluation of Impacts to Underground Sources June 2004of Drinking Water by Hydraulic Fracturing ofCoalbed Methane Reservoirs 1-5
and odor. These secondary standards recommend a TDS limit of 500 mg/L (40 CFR143.3).
An accurate understanding of the definition of USDW requires understanding of twoother terms: public water system and aquifer exemption.
A public water system is defined at 40 CFR 141.2 as:
“A system for the provision to the public of water for human consumptionthrough pipes or, after August 5, 1998, other constructed conveyances, ifsuch a system has at least 15 service connections or regularly serves anaverage of at least twenty-five individuals daily at least 60 days out of theyear.”
To better quantify the definition of USDW, EPA determined that any aquifer yieldingmore than 1 gallon per minute can be expected to provide sufficient quantity of water toserve a public water system and therefore falls under the definition of a USDW (U.S.EPA Memorandum, 1993). EPA also assumes that all aquifers contain sufficient quantityof groundwater to supply a public water system, unless proven otherwise throughempirical data.
An aquifer exemption may be granted under certain circumstances. According to 40CFR 144.3, an exempted aquifer meets the definition of a USDW, but has been exemptedaccording to the procedures in 40 CFR 144.7. An aquifer, or portion thereof, can bedesignated as an exempted aquifer, if it meets the following criteria (40 CFR 146.4):
1. It does not currently serve as a source of drinking water; and,
2. It cannot now and will not in the future serve as a source of drinking waterbecause it is:
• Mineral, hydrocarbon, or geothermal energy producing, or can bedemonstrated to be commercially producible; or
• Situated at a depth or location which makes recovery of water for drinkingwater purposes economically or technologically impractical; or
• So contaminated that it would be economically or technologicallyimpractical to render that water fit for human consumption; or
• Located over a Class III well mining area subject to subsidence orcatastrophic collapse; or,
3. The TDS content of the groundwater is more than 3,000 and less than 10,000mg/L and, it is not reasonably expected to supply a public water system.

EPA 816-R-04-003 Chapter 1Introduction
Evaluation of Impacts to Underground Sources June 2004of Drinking Water by Hydraulic Fracturing ofCoalbed Methane Reservoirs 1-6
All requests for aquifer exemptions must be approved by the EPA Administrator or anauthorized representative. A list of exempted aquifers, for states where such exemptionsexist, is maintained by the state agency managing the UIC program or the regional EPAoffice. A comprehensive list or map identifying all USDWs in every state does not exist.Identification of USDWs is an ongoing effort, as is EPA’s consideration of aquiferexemptions. For example, coalbed methane production wells using hydraulic fracturingto stimulate production may be located in areas that coincide with existing aquiferexemptions.
Currently, injection associated with hydraulic fracturing of coalbed methane productionwells is regulated only in Alabama under the state UIC program, and that injectionactivity falls under the category of Class II wells (Alabama Oil and Gas Board,Administrative Code, Oil and Gas Report 1, 400-3). Class II wells include the injectionof brines and other fluids that are associated with oil and gas production.
1.4 Potential Effects of Hydraulic Fracturing of Coalbed Methane Wells onUSDWs
EPA identified two possible mechanisms by which hydraulic fracturing fluid injectioninto coalbed methane wells might affect the quality of USDWs:
1. The direct injection of fracturing fluids into a USDW in which the coal islocated (Figure 1-2), or injection of fracturing fluids into a coal seam which isalready in hydraulic communication with a USDW (e.g., through a naturalfracture system).
2. The creation of a hydraulic connection between the coalbed formation and anadjacent USDW.
Fracturing fluids can be directly or indirectly injected into a USDW, depending on thelocation of the coalbed relative to a USDW. In many coalbed methane-producing regions,the target coalbeds occur within USDWs, and the fracturing process injects stimulationfluids directly into the USDWs (Figure 1-2 at the end of the chapter). In other productionregions, target coalbeds are adjacent to the USDWs, which are either higher or lower in thegeologic section. EPA investigated the potential for fractures to extend throughstratigraphic layers that separate coalbeds and USDWs and the potential for stimulationfluids to indirectly enter a USDW during the fracturing process (Figure 1-3 at the end ofthe chapter).
Local geologic conditions may interfere with the complete recovery of fracturing fluidsinjected into a formation. As a result, some of the fracturing fluids may be “stranded” inthe USDW (Figures 1-2 and 1-3). Any hazardous constituents in the stimulation fluids

EPA 816-R-04-003 Chapter 1Introduction
Evaluation of Impacts to Underground Sources June 2004of Drinking Water by Hydraulic Fracturing ofCoalbed Methane Reservoirs 1-7
could potentially contaminate groundwater in a USDW and any drinking water suppliesthat rely on the USDW.
1.5 Study Approach
Given the enormous variation in geology among and within coalbed basins in the UnitedStates, any initial evaluation of potential impacts by hydraulic fracturing of coalbeds onUSDWs at a national level would necessarily be broadly focused. Based on public input,EPA decided to carry out this study in discrete phases to better define its scope and todetermine if additional study is needed after assessing the results of the preliminaryphase(s). EPA designed the study to have three possible phases, changing the focus fromgeneral to more specific as findings warrant.
Phase I of the study is a fact-finding effort based primarily on existing literature toidentify and assess the potential threat to USDWs posed by hydraulic fracturing fluidinjection into coalbed methane wells. It is designed to determine if site-specific detailedstudies, including collection of new data, are needed. An overview of the methodologyused for Phase I is provided below; a detailed discussion of this methodology is providedin Chapter 2.
In Phase I, EPA:
• Conducted a literature review for information on hydraulic fracturingprocesses, hydraulic fracturing fluids and additives, the geologic settings ofand the hydraulic fracturing practices used in the 11 major coal basins (Figure1-1), and the identification of coal seams that are co-located with USDWs.
• Published a request in the Federal Register (66 FR 39396 (U.S. EPA, 2001))for information from the public, as well as governmental and regulatoryagencies, regarding incidents of groundwater contamination believed to beassociated with hydraulic fracturing of coalbed methane wells.
• Reviewed reported incidents of groundwater contamination and any follow-upactions or investigations by other parties such as state or local agencies,industry, and academia.
• Conducted field visits in three states.
In addition, EPA collaborated with the Department of Energy (DOE) to produce adocument that details the technical aspects of hydraulic fracturing in the oil and gasindustry. This document is included as Appendix A to this report.

EPA 816-R-04-003 Chapter 1Introduction
Evaluation of Impacts to Underground Sources June 2004of Drinking Water by Hydraulic Fracturing ofCoalbed Methane Reservoirs 1-8
EPA also provided support for a site-specific study, which was conducted by theGeological Survey of Alabama (GSA). This study attempts to address a concern that iscentral to USDW contamination and drawdown issues: the degree to which flow isconfined within coalbeds in coalbed methane fields. Information on the GSA study isavailable at http://www.gsa.state.al.us/gsa/3DFracpage/3Dfracstudy.htm.
1.6 Stakeholder Involvement
EPA took several steps to fully involve the public and all stakeholders during the study. These steps included:
• Publishing Federal Register notices:
- requesting comments on the study plan (65 FR 45774 (USEPA, 2000)); - requesting information from the public on any impacts to groundwater
believed to be associated with hydraulic fracturing of coalbed methanewells (66 FR 39396 (USEPA, 2001));
- Requesting comments on the August 2002 draft of the study (67 FR 55249(USEPA, 2002)).
• Holding a public meeting to obtain additional stakeholder input on theproposed study plan published in the July 2000 Federal Register notice (65FR 45774 (USEPA, 2000))
• Providing periodic updates for stakeholders in the form of writtencommunication.
• Maintaining a Web site where stakeholders can view the project documentsand provide information to EPA.
EPA also received and reviewed comments from 105 commenters submitted in responseto the August 2002 Federal Register notice (67 FR 55249 (USEPA, 2002)), whichannounced the availability of the August 2002 version of this Phase I study report. EPAincorporated many of these comments into this final Phase I report. A summary of thepublic comments and EPA’s responses is provided in, “Public Comment and ResponseSummary for the Study on the Potential Impacts of Hydraulic Fracturing of CoalbedMethane Wells on Underground Sources of Drinking Water” (EPA 816-R-04-004),available on EPA’s electronic docket.

EPA 816-R-04-003 Chapter 1Introduction
Evaluation of Impacts to Underground Sources June 2004of Drinking Water by Hydraulic Fracturing ofCoalbed Methane Reservoirs 1-9
1.7 Information Contained within This Report
This Phase I report is composed of an executive summary, 7 chapters, 11 attachments,and 2 appendices. The main chapters address the following topics:
• Chapter 2, Study Methodology, discusses in detail EPA’s method forcollecting information under Phase I of the study.
• Chapter 3, Characteristics of Coalbed Methane Production and AssociatedHydraulic Fracturing Practices, discusses the hydraulic fracturing process as itapplies to coalbed methane production.
• Chapter 4, Hydraulic Fracturing Fluids, describes the use and nature ofhydraulic fracturing fluids and their additives. It also discusses EPA’sevaluation of the fate and transport of fracturing fluids that are injected intotargeted coal layers during the hydraulic fracturing process.
• Chapter 5, Summary of Coalbed Methane Basin Descriptions, brieflydescribes each of the 11 major coal basins in the United States and discussesthe potential for impacts to USDWs in these basins.
• Chapter 6, Water Quality Incidents, in response to stakeholders’recommendations, summarizes water quality and quantity complaints receivedfrom citizens pertaining to hydraulic fracturing, coalbed methane production,and well stimulation.
• Chapter 7, Summary of Findings, summarizes the major findings presented inChapters 3 through 6.
In addition, Chapters 3 through 6 contain numerous figures and tables to help readersvisualize the hydraulic fracturing process and to help summarize some of the keyinformation in the report.
The attachments to the report are a collection of in-depth hydrologic investigations of the11 coal basins, focusing primarily on the coalbed methane production activities and therelationship between coalbed and USDW locations within these 11 basins. Theattachments expand the discussions of Chapter 5 with greater details on the specificgeology and gas production activities for the 11 basins.
Appendix A, Hydraulic Fracturing, contains DOE’s technical report on hydraulicfracturing. Appendix B, Quality Assurance Protocol, explains the quality assurance andquality control measures EPA used to conduct this study.

EPA 816-R-04-003 Chapter 1Introduction
Evaluation of Impacts to Underground Sources June 2004of Drinking Water by Hydraulic Fracturing ofCoalbed Methane Reservoirs 1-10
Figure 1-2. Hypothetical Mechanism - Direct Fluid Injection Into a USDW (Coalwithin USDW)

EPA 816-R-04-003 Chapter 1Introduction
Evaluation of Impacts to Underground Sources June 2004of Drinking Water by Hydraulic Fracturing ofCoalbed Methane Reservoirs 1-11
Figure 1-3. Hypothetical Mechanism - Fracture Creates Connection to USDW

EPA 816-R-04-003 Chapter 2Study Methodology
Evaluation of Impacts to Underground Sources June 2004of Drinking Water by Hydraulic Fracturing ofCoalbed Methane Reservoirs 2-1
Chapter 2Study Methodology
This chapter outlines EPA’s approach for completing Phase I of the study. This chapterdescribes the development of the study, the information collection and review processthat EPA used, and the internal and external review process for the report.
2.1 Overview of the Study Methods
EPA developed the Phase I study methodology to assess the potential for contaminationof USDWs due to the injection of hydraulic fracturing fluids into coalbed methane wells,and to determine, based on these findings, whether further study is warranted.
On July 25, 2000, EPA published a Federal Register notice (65 FR 45774 (USEPA,2000)) requesting comment on a conceptual study design in order to receive stakeholderinput on how an EPA study should be structured. On August 24, 2000, EPA held apublic meeting to obtain additional stakeholder input on the proposed study design. EPAreceived more than 80 sets of comments from industry, state oil and gas agencies,environmental groups, and individual citizens in response to the Federal Register noticeand public meeting. A summary of these comments can be viewed on EPA's Web site atwww.epa.gov/safewater/uic/cbmstudy.
EPA revised its study approach in response to the comments it received on the conceptualstudy design. The final study design, “Study Design for Evaluating the Impacts toUnderground Sources of Drinking Water by Hydraulic Fracturing of Coalbed MethaneReservoirs”, was released in April 2001 and is available on the website referenced above. One significant change in the final study design was EPA’s decision to complete thestudy in a phased approach to efficiently address the stated project objectives. Thisphased approach, similar in design to that used in other complex studies, would allowEPA to use information gained in one phase to focus on the need for, and direction of,subsequent phases.
Phase I of the study was intended as a limited-scope assessment that would enable theAgency to determine if hydraulic fracturing of coalbed methane wells clearly poses littleor no threat to USDWs, or if the practice may pose a threat. In Phase I, EPA:
• Gathered existing information to review hydraulic fracturing processes,practices and settings;
• Requested public comment to identify incidents that had not been reported toEPA; and
• Reviewed reported incidents of groundwater contamination and any follow-up

EPA 816-R-04-003 Chapter 2Study Methodology
Evaluation of Impacts to Underground Sources June 2004of Drinking Water by Hydraulic Fracturing ofCoalbed Methane Reservoirs 2-2
actions or investigations by other parties (state or local agencies, industry,academia, etc.).
In addition, as recommended by commenters, EPA decided to compile accounts ofpersonal experiences with coalbed methane impacts on drinking water wells. Theseexperiences are summarized in Chapter 6.
In its final study design, EPA indicated that the Agency would make a determinationregarding whether further investigation was needed after analyzing the Phase Iinformation. Specifically, EPA determined that it would not continue into Phase II of thestudy if the investigation found that no hazardous constituents were used in fracturingfluids, hydraulic fracturing did not increase the hydraulic connection between previouslyisolated formations, and reported incidents of water quality degradation could beattributed to other, more plausible causes.
EPA identified two possible mechanisms by which hydraulic fracturing fluid injectioninto coalbed methane wells could potentially affect the quality of USDWs:
1. Direct injection of fracturing fluids into a USDW in which the coal is located,or injection of fracturing fluids into a coal seam that is already in hydrauliccommunication with a USDW (e.g., through a natural fracture system).
2. Creation of a hydraulic connection between the coalbed formation and anadjacent USDW.
To determine if contamination might occur through either mechanism, EPA collectedinformation on:
1. Hydraulic fracturing practices.
2. Hydraulic fracturing fluids and additives to determine whether thesesubstances contain hazardous constituents.
3. The hydrogeology of the coalbed methane basins, including the identificationof coal seams that are located in USDWs.
4. Water quality incidents potentially associated with hydraulic fracturing.
EPA anticipated that sufficient information would be available to evaluate the impacts ofdirect injection into USDWs because the main considerations are the location of the coalformations relative to USDWs and the chemical constituents in hydraulic fracturingfluids. The Agency further anticipated that documenting USDW impacts via the creationof a hydraulic connection between the coalbed formation and adjacent USDW(s) wouldbe more difficult. This is because more detailed, site-specific, geological information or

EPA 816-R-04-003 Chapter 2Study Methodology
Evaluation of Impacts to Underground Sources June 2004of Drinking Water by Hydraulic Fracturing ofCoalbed Methane Reservoirs 2-3
data for specific fracturing events needed to definitively document such a hydrauliccommunication are not readily available. Site-specific data include:
• Water quantity and quality conditions in a USDW (or a well) both before andafter a fracturing event;
• Location, dimensions, and conductivity of fractures created during thecoalbed stimulation event;
• Measured changes in groundwater flow between the USDW and coalbeds orother aquifers; and
• Impacts of other, unrelated, hydrologic and water quality processes that couldalso be affecting the USDW.
2.2 Information Sources
EPA obtained available literature and information through:
• Literature reviews.
• Coordination with DOE.
• Interviews with companies that perform hydraulic fracturing and interviewswith citizens, local and state authorities, the Bureau of Land Management andEPA Region 8 personnel.
• Field visits.
• Responses to EPA’s Federal Register request (66 FR 39396 (U.S. EPA,2001)) for information on incidents of groundwater contamination believed tobe associated with hydraulic fracturing of coalbed methane wells.
EPA researched more than 200 peer-reviewed publications, interviewed approximately50 employees from industry and state or local government agencies, and communicatedwith approximately 40 citizens and groups who are concerned that CBM productionaffected their drinking water wells.
The procedure that EPA used to obtain information from each of these sources isdiscussed in more detail below. A copy of the quality assurance protocol that EPAemployed to verify all the sources of data used to write this report is provided asAppendix B.

EPA 816-R-04-003 Chapter 2Study Methodology
Evaluation of Impacts to Underground Sources June 2004of Drinking Water by Hydraulic Fracturing ofCoalbed Methane Reservoirs 2-4
2.2.1 Literature Reviews
EPA conducted a review of existing literature and information on hydraulic fracturing forcoalbed methane production. The focus of the literature review was to obtaininformation on topics 1 through 3 listed in Section 2.1, above.
The degree to which information was available for each of the 11 coalbed basins in thereport was variable. The amount of information available depended on the extent ofexploration and production in each basin.
EPA conducted an extensive literature search, using the Engineering Index and GeoRefon-line reference databases, for abstracts from technical articles, books, and proceedings.EPA also conducted Internet-based searches to locate additional information usingrelevant Web sites located using various search engines, including GoogleTM, Yahoo®,and Alta Vista®. EPA used specialized search engines, such as those provided on stategeological survey Web sites and by the Gas Technology Institute (GTI) for specificqueries. All relevant Web sites were logged in project books and referenced in this reportwhen cited.
EPA conducted these literature searches by subject topics and using the following keywords, either separately or in combination: coal basin, coalbed methane, cross-linkedgel, fracturing fluid additives, fracturing fluid technology, fracturing fluid performance,fracturing fluids, ground water, hydraulic fracturing, hydraulic fracture dimension,hydraulic fracture growth, hydrology, linear gel, methane gas production, nitrogen foam,underground sources of drinking water, and USDWs. EPA printed, catalogued, andsurveyed all results of searches for pertinent journal articles, books, and conferenceproceedings containing information that might meet the specific data needs of this report.
EPA acquired most of the pertinent articles, which were identified from the EngineeringIndex and GeoRef on-line reference databases, from the University of Texas Library inAustin because this library’s holdings include an extensive collection of publicationsrelated to oil and gas production. EPA researched references from the University ofTexas documents and acquired those documents that were relevant to the study. Only asmall fraction of the pertinent articles, specifically proprietary articles and articlespublished for overseas conferences were unavailable. EPA also acquired articles fromGTI. EPA has archived, by topic, all papers collected for the study.
To verify key information extracted from the literature, EPA contacted by phone relevantorganizations such as state regulatory agencies, state geological surveys, natural gascompanies, GTI, and service companies. The Agency used telephone logs to documentall communications. Personal conversations with the employees of the variousorganizations yielded additional information in the form of reports, figures, and maps, aswell as statements based on best professional judgment and experience. These werecollected, documented, and referenced in conjunction with the literature identified in theliterature searches. The majority of the literature pertaining to coalbed methane basins

EPA 816-R-04-003 Chapter 2Study Methodology
Evaluation of Impacts to Underground Sources June 2004of Drinking Water by Hydraulic Fracturing ofCoalbed Methane Reservoirs 2-5
and hydraulic fracturing was written in the early to mid 1990s. According to the TexasBureau of Economic Geology (TBEG) (personal communication, TBEG Staff, 2000),this period of intense activity was a result of the emphasis placed on gas exploration bythe Section 29 Tax Credit of the Crude Oil Windfall Profit Tax Act of 1980 and researchgrants to industry, academia, and government agencies. The Section 29 credit does not,however, apply to coal gas wells drilled after December 31, 1992.
2.2.2 Department of Energy
EPA reviewed information from DOE’s “White Paper” on hydraulic fracturing practices.This paper addresses the following topics:
• Objectives of hydraulic fracturing.• How candidate wells are selected for hydraulic fracturing.• How fracture treatments are designed.• Field operation considerations.• Physics of fracture formation in coalbeds.• Fracturing fluids.• Stimulation techniques used for developing coalbeds.• Instrumentation/methods for tracking fractures.
The complete DOE paper is included as Appendix A, and excerpts from this paper areincluded in Chapter 3, Characteristics of Coalbed Methane Production and AssociatedHydraulic Fracturing Practices.
2.2.3 Interviews
EPA contacted hydraulic fracturing service companies including BJ Services Company,Halliburton Energy Services, Inc., and Schlumberger Technology Corporation, as well asa fracturing fluids producer, Hercules, Inc., to obtain information regarding the content ofhydraulic fracturing fluids and additives they use or manufacture. Two companies,Halliburton and Schlumberger, provided EPA with material safety data sheets (MSDSs)for several hydraulic fracturing fluids and additives. The MSDSs were reviewed todetermine the nature of the constituents in fracturing fluids used to stimulate coalbedmethane production. These topics are discussed in Chapter 4, Hydraulic FracturingFluids.
EPA also evaluated reports from individuals and organizations that are concerned thattheir drinking water supplies were affected by hydraulic fracturing. These reportedpersonal experiences came from Colorado, New Mexico, Wyoming, Alabama, andVirginia. In response to these reports, EPA conducted telephone interviews with citizens,local and state authorities, the Bureau of Land Management and EPA Region 8personnel. EPA also evaluated state agency responses to any complaints received by EPAor state agencies. The Agency also evaluated the available data to determine whether

EPA 816-R-04-003 Chapter 2Study Methodology
Evaluation of Impacts to Underground Sources June 2004of Drinking Water by Hydraulic Fracturing ofCoalbed Methane Reservoirs 2-6
there is sufficient information to reveal the source of the alleged water qualitycontamination.
2.2.4 Field Visits
EPA conducted field visits in Colorado, Kansas, and Virginia to better understand howlocal coalbed methane production activities may vary from basin to basin. In addition,during the field visits, EPA was able to meet with concerned local citizens and stateagencies to discuss coalbed methane production issues. A summary of these field visitsis outlined below.
In August 2000, EPA met with a group of concerned citizens, officials from the ColoradoOil and Gas Conservation Commission, and representatives of the La Plata Countygovernment. EPA witnessed a fracturing event, reviewed records including temperaturelogs of past fracturing events conducted on coalbed methane wells, and performed areconnaissance of the area allegedly affected by coalbed methane production.
In August 2001, EPA met with the Virginia Department of Mines, Minerals and Energy,the agency that regulates the coalbed methane production industry in Virginia. TheDepartment provided information about the state’s investigation of water qualityincidents potentially associated with coalbed methane production in the CentralAppalachian Valley. The Department also submitted water quality incident reports forreview by EPA. During this visit, EPA met with concerned citizens in Virginia. Citizensgroups from Buchannan and surrounding counties were invited to meet with EPA andDOE staff to discuss water quality issues believed to be related to local hydraulicfracturing of coalbed methane wells. Notes from the meeting are referenced in Chapter6.
EPA also organized a field visit with Consol Energy, Inc. and Halliburton to witness ahydraulic fracturing event. Halliburton performed a hydraulic fracture job on a coalbedmethane well in western Virginia using equipment, fracturing fluids, and techniques,which are typical of those described in the literature. EPA was able to observe thefracturing process and collect information, including MSDSs from the service companyand gas company engineers. The information from this field visit was used tosupplement the data on hydraulic fracturing fluids in Chapter 4.
In November 2001, EPA witnessed a fracturing event in Wilson County, Kansas, to gaina better understanding of the regional geology and hydraulic fracturing practices in thearea. In attendance were Colt Energy (the well operator); Consolidated IndustrialServices, Inc. (the service company conducting the fracture job); and two state agencies,the Kansas Corporation Commission, and the Missouri Department of Natural Resources.MSDSs for fracturing fluids typically used in the area were also provided to EPA by theKansas Corporation Commission.

EPA 816-R-04-003 Chapter 2Study Methodology
Evaluation of Impacts to Underground Sources June 2004of Drinking Water by Hydraulic Fracturing ofCoalbed Methane Reservoirs 2-7
2.2.5 Federal Register Notice to Identify Reported Incidents
EPA provided an opportunity for the public to submit information on any impacts togroundwater believed to be associated with hydraulic fracturing through a request forpublic comment (66 FR 39396 (USEPA, 2001)). EPA also sent copies of the FederalRegister notice with a cover letter to county-level public health and/or environmentalofficials in counties that may be producing coalbed methane. In addition, letters weresent to stakeholders informing them that the Federal Register notice had been published. Responses to the Federal Register notice are available at EPA’s water docket (docketnumber W-01-09; Water Docket (MC 4101); Rm EB 57; U.S. Environmental ProtectionAgency; 1200 Pennsylvania Avenue, NW; Washington, DC 20460; phone number: (202)566-2426). A summary of the comments is provided in Chapter 6.
2.3 Review Process
This report has benefited from a series of internal and external technical reviews. EPAverified information through telephone interviews with state and local officials, as well asthrough the Agency’s internal quality assurance process. EPA conducted a qualityassurance review of the data collection procedures as well as a review of the individualliterature sources cited in the report. In addition, more than nine EPA offices reviewedand commented on the draft report. Other federal agencies that reviewed the draft reportincluded DOE and the U.S. Geological Survey (USGS).
In 2001, EPA also submitted the draft report to a scientific peer-review panel consistingof experts from industry, academia, and government agencies. The panel’s task was toreview the draft report and provide comments on the descriptions and conclusionsdeveloped by EPA. The panel also provided information about additional data sources tosupplement those used in the report. Following receipt of comments on the draft report,EPA made the appropriate changes to the document prior to its publication and release.
EPA made the report available for public comment by an announcement in the FederalRegister on August 28, 2002 (67 FR 55249 (USEPA, 2002)). The 60-day publiccomment period officially ended on October 28, 2002. The Agency received andreviewed comments from 105 commenters and incorporated many of these commentsinto this final Phase I report. A summary of the public comments and EPA’s responses isprovided in, “Public Comment and Response Summary for the Study on the PotentialImpacts of Hydraulic Fracturing of Coalbed Methane Wells on Underground Sources ofDrinking Water” (EPA 816-R-04-004), available on EPA’s electronic docket.

EPA 816-R-04-003 Chapter 3Characteristics of CBM Production and Associated HF Practices
Evaluation of Impacts to Underground Sources June 2004of Drinking Water by Hydraulic Fracturing ofCoalbed Methane Reservoirs 3-1
Chapter 3Characteristics of Coalbed Methane Productionand Associated Hydraulic Fracturing Practices
Understanding the practice of hydraulic fracturing as it pertains to coalbed methaneproduction is an important first step in evaluating its potential impacts on the quality ofUSDWs. This chapter presents the following: an overview of the geologic processesleading to coal formation, an overview of coalbed methane production practices, adiscussion of fracture behavior, a review of the literature on the use and recovery offracturing fluids, a discussion of mechanisms affecting fluid recovery, and a summary ofthe methods used for measuring and predicting fracture dimensions and fracturing fluidmovement. In addition, several diagrams have been included at the end of this chapter tohelp illustrate many of these topics. Specifically, Figures 3-1 through 3-8 show thelocation of the coal basins, the geography of a peat-forming system, the geometry ofnatural cleats and hydraulically induced fractures, an overview of the hydraulic fracturingprocess, the relationship between water and gas production rates, and side and plan viewsof vertical hydraulic fractures.
3.1 Introduction
Coalbed methane is a gas formed as part of the geological process of coal generation, andis contained in varying quantities within all coal. Coalbed methane is exceptionally purecompared to conventional natural gas, containing only very small proportions of “wet”compounds (e.g., heavier hydrocarbons such as ethane and butane) and other gases (e.g.,hydrogen sulfide and carbon dioxide). Coalbed gas is over 90 percent methane, and issuitable for introduction into a commercial pipeline with little or no treatment (Rice,1993; Levine, 1993).
From the earliest days of coal mining, the flammable and explosive gas in coalbeds hasbeen one of mining’s paramount safety problems. Over the centuries, miners havedeveloped several methods to extract the coalbed methane from coal and mine workings.Coalbed methane well production began in 1971 and was originally intended as a safetymeasure in underground coalmines to reduce the explosion hazard posed by methane(Elder and Deul, 1974).
In 1980, the United States Congress enacted a tax credit for “Non-conventional energyproduction.” In 1984, there were only several hundred coalbed methane wells in theUnited States and most were used for mine de-methanization. By 1990, the anticipatedexpiration of the tax credit contributed to a dramatic increase in the number of coalbedmethane wells nationwide. In addition, DOE and GTI supported extensive research intocoalbed exploration and production methods. Federal tax credits and State SeveranceTax exemptions served to subsidize the development of coalbed methane resources (Soot,

EPA 816-R-04-003 Chapter 3Characteristics of CBM Production and Associated HF Practices
Evaluation of Impacts to Underground Sources June 2004of Drinking Water by Hydraulic Fracturing ofCoalbed Methane Reservoirs 3-2
1991; Pashin and Hinkle, 1997). The federal tax credits and incentives expired at the endof 1992, but coalbed methane exploration, development, and reserves have remainedstable or increased (Stevens et al., 1996). At the end of 2000, coalbed methaneproduction from 13 states totaled 1.353 trillion cubic feet, an increase of 156 percentfrom 1992. During 2000, a total of 13,973 coalbed methane wells were in production(GTI; EPA Regional Offices, 2001). By the end of 2000, coalbed methane productionaccounted for about 7 percent of the total United States dry gas production and 9 percentof proven dry gas reserves (EIA, 2001).
Coal is defined as a rock that contains at least 50 percent organic matter by weight. Theprecursor of coal is peat, plant matter deposited over time in fresh-water swampsassociated with coastal deltaic rivers. The coal resources from which coalbed methane isderived have similar geologic origins. In the United States, they are usually found ingeologic formations that are approximately 65-325 million years old. Coal formationoccurred during a time of moderate climate and broad inland oceans. Sea level rose andfell in conjunction with tectonic forces (i.e., subsidence and uplift of land masses) andmelting/freezing cycles of decreases and increases in the polar ice masses. As a result,coastal environments such as coastal deltas and peat swamps migrated landward whensea levels rose and moved seaward when sea levels fell, marked by cycles ofsubmergence and emergence. With these cycles of rising and falling sea levels, what wasa peat swamp at one time would later be under 100 feet of water. The cycle of sea levelrising and falling is marked in the geologic record as cycles of inter-layered deep andshallow water sediments.
The type of sediments deposited at a given location varied with the depth of submergence(Figure 3-2). Generally, carbon-rich organic plant matter was deposited in shallow peatswamps, sand was deposited along beaches and other near-shore, shallow marineenvironments, and silts and clays and calcium-rich muds were deposited further off-shorein deeper marine environments. Subjected to high pressure over considerable time (dueto burial under subsequent sediments), the peats were transformed into coal, the sand intosandstone, the silts and clays into shales, siltstones, and mudstones, and the calcium-richmuds were transformed into limestones. These coal-bearing inter-layered sedimentarysequences are sometimes referred to as “coal cycles.” The idealized coal cycle consistsof repeated sequences of very fine-grained sediments (shales and limestones) overlain bycoarser sediments (siltstones and sandstones), and then capped by coal. The sequencerepeats with shales and limestones over the coal, followed by siltstones and sandstones,then more coal, and so on. Sometimes certain formations are missing from thesequences, so coal is often, though not always, overlain by shales and limestones.
The sedimentation patterns in these fluctuating coastal environments over geologic timescale determined the presence, thickness, and geometry of present-day coalbeds. Thenumber of coal cycles determines the number of resulting coalbeds. For example, theBlack Warrior Basin of Alabama includes up to 10 cycles, whereas the San Juan Basin(New Mexico and Colorado) contains as few as 3. The short, rising and falling sea levelcycles reflected in the Black Warrior Basin geology produced many thin coalbeds,

EPA 816-R-04-003 Chapter 3Characteristics of CBM Production and Associated HF Practices
Evaluation of Impacts to Underground Sources June 2004of Drinking Water by Hydraulic Fracturing ofCoalbed Methane Reservoirs 3-3
ranging from less than 1 inch to as much as 4 feet thick (Carrol et al., 1993; Pashin,1994a and 1994b), whereas the stable, long-term cycles of the San Juan Basin producedfewer, but thicker coalbeds, with single coalbeds up to 70 feet thick (Kaiser and Ayers,1994).
Peat is transformed into coal when it is buried by accumulating sediment and heated inthe subsurface over geologic time. The “rank” of coal describes the amount of energy(measured in British thermal units or Btus) it contains, and is a function of the proportionand type of organic matter, the length and temperature of burial, and the influences ofsubsequent hydrogeologic and tectonic processes (Carrol et al., 1993; Levine, 1993; Rice,1993). Methane is generated as part of the process whereby peat is transformed into coal.The origin of methane in coal of low rank, such as bituminous coal, is primarily biogenic(i.e., the result of bacterial action on organic matter) (Levine 1993, as cited by theAlabama Oil and Gas Board, 2002). Low rank coals tend to have lower gas content thanhigh rank coals such as anthracite. Anthracite can have extremely high gas content, butthe gas tends to desorb so slowly that anthracite is an insignificant source of coalbedmethane (Levine, 1993, as cited by the Alabama Oil and Gas Board, 2002). Commercialcoalbed methane production takes place in coals of mid-rank, usually low- to high-volatile bituminous coals (Levine, 1993; Rice, 1993).
A network of fractures, joints, and a sub-network of small joints called cleats commonlycharacterize the physical structure of coalbeds. Joints are larger, systematic, near-verticalfractures within the coal, generally spaced from several feet to several dozen feet apart(Close, 1993; Levine, 1993). There are two types of cleats: the primary, morecontinuous cleats are called face cleats, while the abutting cleats are called butt cleats(Laubach and Tremain 1991; Close, 1993; Levine, 1993) (Figure 3-3). The butt cleatsappear as the rungs on a ladder that are bounded on each side by the face cleats. Thespacing between cleats is often roughly proportional to the thickness of coal cut by thecleats; thin coals have more closely spaced cleats and thick coals more widely spacedcleats (Laubach et al., 1998, as cited by Olson, 2001).
The primary (or natural) permeability of coal is very low, typically ranging from 0.1 to30 millidarcies (md) (McKee et al., 1989). According to Warpinski (2001), because coalis a very weak (low modulus) material and cannot take much stress without fracturing,coal is almost always highly fractured and cleated. The resulting network of fracturescommonly gives coalbeds a high secondary permeability (despite coal’s typically lowprimary permeability). Groundwater, hydraulic fracturing fluids, and methane gas canmore easily flow through the network of fractures. Because hydraulic fracturinggenerally enlarges pre-existing fractures and rarely creates new fractures (Steidl, 1993;Diamond, 1987a and b; Diamond and Oyler, 1987), this network of natural fractures isvery important to the extraction of methane from the coal.

EPA 816-R-04-003 Chapter 3Characteristics of CBM Production and Associated HF Practices
Evaluation of Impacts to Underground Sources June 2004of Drinking Water by Hydraulic Fracturing ofCoalbed Methane Reservoirs 3-4
3.2 Hydraulic Fracturing
This section provides an overview of the hydraulic fracturing process, and the factors thataffect fracture behavior and fracture orientation. Figure 3-4 provides a simplifiedgraphical representation of a hypothetical hydraulic fracturing event in a coalbed methanewell. This diagram shows the fracture initiation and propagation stages, as well as theproppant placement and fracturing fluid recovery stages. Only horizontal fractures areshown in this diagram, although hydraulically induced fractures are often verticallyoriented.
3.2.1 The Hydraulic Fracturing Process
Hydraulic fracturing is a technique used by the oil and gas industry to improve theproduction efficiency of oil and coalbed methane wells. The extraction of coalbedmethane is enhanced by hydraulically enlarging and/or creating fractures in the coalzones. The resulting fracture system facilitates pumping of groundwater from the coalzone, thereby reducing pressure and enabling the methane to be released from the coaland more easily pumped through the fracture system back to the well (and then throughthe well to the surface). To initiate the process, a production well is drilled into thetargeted coalbeds. Fracturing fluids containing proppants are then injected under highpressure into the well and specifically into the targeted coalbeds in the subsurface.
The fracturing fluids are injected into the subsurface at a rate and pressure that are toohigh for the targeted coal zone to accept. As the resistance to the injected fluidsincreases, the pressure in the injecting well increases to a level that exceeds thebreakdown pressure of the rocks in the targeted coal zone, and the rocks “breakdown”(Olson, 2001). In this way, the hydraulic fracturing process “fractures” the coalbeds (andsometimes other geologic strata within or around the targeted coal zones). This processsometimes can create new fractures, but most often opportunistically enlarges existingfractures, increasing the connections of the natural fracture networks in and around thecoalbeds (Steidl 1993; Diamond 1987a and b; Diamond and Oyler, 1987). The pressure-induced fracturing serves to connect the network of fractures in the coalbeds to thehydraulic fracturing well (which subsequently will serve as the methane extraction orproduction well). The fracturing fluids pumped into the subsurface under high pressurealso deliver and emplace the “proppant.” The most common proppant is fine sand; underpressure, the sand is forced into the natural and/or enlarged fractures and acts to “prop”open the fractures even after the fracturing pressure is reduced. The increasedpermeability due to fracturing and proppant emplacement facilitates the flow andextraction of methane from coalbeds.
Methane within coalbeds is not structurally “trapped” by overlying geologic strata, as inthe geologic environments typical of conventional gas deposits. Only about 5 to 9percent of the coalbed methane is present as “free” gas within the joints and cleats ofcoalbeds. Most of the coalbed methane is contained within the coal itself (adsorbed tothe sides of the small pores in the coal) (Koenig, 1989; Winston, 1990; Close, 1993).

EPA 816-R-04-003 Chapter 3Characteristics of CBM Production and Associated HF Practices
Evaluation of Impacts to Underground Sources June 2004of Drinking Water by Hydraulic Fracturing ofCoalbed Methane Reservoirs 3-5
Before coalbed methane production begins, groundwater and injected fracturing fluidsare first pumped out (or “produced” in industry terminology) from the network offractures in and around the coal zone. The fluids are pumped until the pressure declinesto the point that methane begins to desorb from the coal (Gray, 1987).
Coalbed methane production initially requires pumping and removing significantamounts of water to sufficiently reduce the hydrostatic pressure in the subsurface so thatmethane can desorb from the coal before methane extraction can begin. Coalbedmethane is produced at close to atmospheric pressure (Ely et al., 1990; Schraufnagel,1993). The proportion of water to methane pumped is initially high and declines withincreasing coalbed methane production (Figure 3-5). In contrast, in the production ofconventional petroleum-based gas, the production of gas is initially high, and as gasproduction continues over time and the gas resources are progressively depleted, gasproduction decreases and the amount of water pumped increases.
Almost every coalbed targeted for methane production must be hydraulically fractured toconnect the production well bore to the coalbed fracture network (Holditch et al., 1988).Although the general hydraulic fracturing process (described above) is generally similaracross the country, the details of the process can differ significantly from location tolocation depending on the site-specific geologic conditions. For example, although mosthydraulic fracturing wells are completely cased except for openings at the targeted coalzone, many wells in the San Juan Basin are fractured by creating a cavity in the open-hole section. Also, in contrast to the typical fracturing job, many wells in the BlackWarrior Basin are stimulated more than once. Here, when wells are open to multiple coalseams, the hydraulic fracturing process may involve several or multiple fracturing events,using from 2 to 5 hydraulic fracture treatments per well (depending on number of seamsand spacing between seams). Many coalbed methane wells are re-fractured at some timeafter the initial treatment in an effort to re-connect the wellbore to the production zones toovercome plugging or other well problems (Holditch, 1990; Saulsberry et al., 1990;Palmer et al., 1991a and 1991b; Holditch, 1993). Also, in response to site-specific coalgeology and the economics of coalbed methane production where coal seams are thin andvertically separated by up to hundreds of feet of intervening rock) operators might designfracture treatments to enhance the vertical dimension and perform several fracturetreatments within a single well to produce methane in an economically viable fashion,(Ely, et al., 1990; Holditch, 1990; Saulsberry et al., 1990; Spafford, 1991; Holditch,1993).
3.2.2 Factors Affecting Fracture Behavior
Fracture behavior is of interest because it contributes to an understanding of the potentialimpact of fracturing fluid injection on USDWs; the opportunities for fracture connectionswithin or into a USDW are affected by the extent to which a hydraulically inducedfracture grows. Specifically, when hydraulic fracturing fluids are injected intoformations that are not themselves USDWs, the following scenarios are of potentialconcern:

EPA 816-R-04-003 Chapter 3Characteristics of CBM Production and Associated HF Practices
Evaluation of Impacts to Underground Sources June 2004of Drinking Water by Hydraulic Fracturing ofCoalbed Methane Reservoirs 3-6
• The hydraulically induced fracture may extend from the target formation intoa USDW.
• The hydraulically induced fracture may connect with natural (existing)fracture systems and/or porous and permeable formations, which mayfacilitate the movement of fracturing fluids into a USDW.
Fracture behavior through coal and other geologic formations commonly present aboveand below coalbeds depends on site-specific factors such as the following:
1. Physical properties, types, thicknesses, and depths of the targeted coalbeds aswell as those of the surrounding geologic formations.
2. Presence of existing natural fracture systems and their orientation in thecoalbeds and surrounding formations.
3. Amount and distribution of stress (i.e., in-situ stress), and the stress contrastsbetween the targeted coalbeds and surrounding formations.
4. Hydraulic fracture stimulation design including volume of fracturing fluidinjected into the subsurface as well as the fluid injection rate and fluidviscosity.
Many of these factors are interrelated and together will influence whether and how farhydraulic fractures will propagate into or beyond coalbeds targeted for fracturing. Thesefactors are discussed below.
Properties of Coalbeds and Surrounding Formations
Coalbed depth and rock types in the coal zone have important fundamental influences onfracture dimensions and orientations. According to Nielsen and Hansen (1987, as cited inAppendix A: DOE, Hydraulic Fracturing), generally, at depths of less than 1,000 feet,the direction of least principal stress tends to be vertical and, therefore, at these relativelyshallow depths fractures typically have more of a horizontal than a vertical component.Here, horizontal fractures tend to be created because the hydraulically induced pressureforces the walls of the fracture to open in the direction of least stress (which is vertical),creating a horizontal fracture. At these shallower depths, the horizontal fractures resultfrom the low vertical stress due to the relatively low weight of overlying geologicmaterial (due to the shallow depth). Shallow vertical fractures are most likely due to thepresence of natural (existing) vertical fractures, from which hydraulically inducedvertical fractures can initiate. Generally, in locations deeper than 1,000 feet, the leastprincipal stress tends to be horizontal so vertical fractures tend to form. Vertical fracturescreated in these greater depths can propagate vertically to shallower depths and develop ahorizontal component (Nielsen and Hansen, 1987 as cited in Appendix A: DOE,Hydraulic Fracturing). In the formation of these "T-fractures," the fracture tip may fill

EPA 816-R-04-003 Chapter 3Characteristics of CBM Production and Associated HF Practices
Evaluation of Impacts to Underground Sources June 2004of Drinking Water by Hydraulic Fracturing ofCoalbed Methane Reservoirs 3-7
with coal fines or intercept a zone of stress contrast, causing the fracture to turn anddevelop horizontally, sometimes at the contact of the coalbed and an overlying formation.
In many coalbed methane basins, the depths, lithologic properties, and stress fields of thecoal zones result in hydraulic fractures that are higher than they are long (“length” refersto horizontal distance from the well bore) (Diamond, 1987a; Morales et al., 1990; Zuberet al., 1990; Holditch et al., 1989; Palmer and Sparks, 1990; Jones and Schraufnagel,1991; Steidl, 1991; Wright, 1992; Palmer et al., 1991a and 1993a). Almost all of the sitesstudied by Diamond (1987a and b) had vertical fractures, and about half had horizontalfractures.
Naceur and Touboul (1990) state that the primary mechanisms controlling fracture heightare contrasts in the physical properties of the rock strata within and surrounding the coalzone being fractured. Contrasts in strata stresses, moduli, leakoff, and toughness affectfracture growth, with stress contrasts being the most important mechanism controllingfracture height (Naceur and Touboul 1990). (Stress is discussed in more detail later inthis section.) Moduli are the ratios of stress to strain in various formations. Leakoff isthe magnitude of pressure exerted on a formation that causes fluid to be forced into theformation. The fluid may be flowing into the pore spaces of the rock or into cracksopened and propagated into the formation by the fluid pressure. Toughness can bedefined as the point at which enough stress intensity has been applied to a rock formation,so that a fracture initiates and propagates. Coal is generally very weak (with lowmodulus) and easily fractures. Siltstones, sandstones, and mudstones (other rock typescommonly occurring in coal zones) tend to have higher moduli, greater toughness andfracture less easily (Warpinski, 2001). Thick shales, which commonly overlie coalbeds,often act as a barrier to fracture growth (see Appendix A).
Another factor controlling fracture height can be the highly cleated nature of somecoalbeds. In some cases, highly cleated coal seams will prevent fractures from growingvertically. When the fracturing fluid enters the coal seam, it is contained within the coalseam’s dense system of cleats and the growth of the hydraulic fracture will be limited tothe coal seam (see Appendix A).
The low permeability of relatively unfractured shale may help to protect USDWs frombeing affected by hydraulic fracturing fluids in some basins. If sufficiently thick andrelatively unfractured shales are present, they may act as a barrier not only to fractureheight growth, but also to fluid movement. The degree to which any formation overlyingtargeted coalbeds will act as a hydraulic barrier will depend on site-specific factors.
The lithology of coalbeds and surrounding formations is variable in the basins wherecoalbed methane is produced. Although common, the idealized coal cycle (with shalesoverlying coalbeds) is not always present in all coal basins or necessarily in all parts ofany basin. Although Holditch (1993) states that fracture heights can grow where the coalseam is bounded above or below by sandstone, Warpinski (2001) states that highlylayered formations or very permeable strata, such as some sandstones, can act to inhibit

EPA 816-R-04-003 Chapter 3Characteristics of CBM Production and Associated HF Practices
Evaluation of Impacts to Underground Sources June 2004of Drinking Water by Hydraulic Fracturing ofCoalbed Methane Reservoirs 3-8
fracture growth. Some of the coal seams of the San Juan Basin are bounded below bysandstone. In some locations in each of the other basins, coalbeds are underlain by,overlain by, or interbedded with sandstones. Additional detail on the stratigraphy withineach basin is provided in the attachments to this study.
Differences in fracture behavior may also be due in part to very small (but influential)layers or irregularities that exist in the rocks as part of the sedimentation process thatcreated them. Therefore, a valid measurement of rock properties relevant to fracturebehavior at one location may not adequately represent the properties of similar rock atanother location (Hanson et al., 1987; Jones et al., 1987a and 1987b; Palmer et al., 1989;Morales et al., 1990; Naceur and Touboul, 1990; Jones and Schraufnagel, 1991; Palmeret al., 1993b; Elbel, 1994). For example, the presence of a shallow clay layer as thin as10 millimeters at the upper contact of a coal seam can cause a vertically propagating,shallow hydraulic fracture to “turn” horizontal and fail to penetrate the next overlyingcoal seam (Jones et al., 1987a; Palmer et al., 1989; Morales et al., 1990; Palmer et al.,1991b and 1993b). In other cases, hydraulic fractures may penetrate into or even, asshown in the case of some thin shales, completely through overlying shale layers(Diamond, 1987a and b; Diamond and Oyler, 1987). Warpinski et al. (1982) found thateven microscopically-thin ash beds can influence hydraulic fracture propagation. In otherwords, the site-specific geology can play a key role in influencing fracture behavior. Inaddition to the effects of the rock type and sometimes even thin layers within strata,natural fractures also play a role in fracture behavior and fracture propagation.
Natural Fracture Systems
Steidl (1993), based on his “mined-through” studies, concluded that high coalbedmethane production depends greatly on the presence of pre-existing natural fracturesystems. Hydraulic fracturing tends to widen naturally occurring planes of weakness andrarely creates new fractures, as based on observations by Diamond (1987a and b) andDiamond and Oyler (1987) in their mined-through studies. (“Mined-through” studiesprovide unique subsurface access to investigate coalbeds and surrounding rock afterhydraulic fracturing. Mined-through studies are reviewed in more detail in section 3.4.1.)Diamond and Oyler (1987) also noted that this opportunistic enlarging of preexistingfractures appears to account for those cases where hydraulic fractures propagate from thetargeted coalbeds into overlying rock, and their studies found penetration into overlyinglayers in nearly half of the fractures intercepted by underground mines.
Importantly, in several locations in the Diamond (1987a and b) study sites, fluorescentpaint was injected along with the hydraulic fracturing fluids and the paint was found innatural fractures from 200 to slightly more than 600 feet beyond the sand-filled(“propped”) portions of hydraulically induced or enlarged fractures. This suggests thatthe induced/enlarged fractures link into the existing fracture network system and thathydraulic fracturing fluids can move beyond, and sometimes significantly beyond, thepropped, sand-filled portions of hydraulically induced fractures (Steidl 1993; Diamond1987a and b; Diamond and Oyler, 1987). The mined-through studies did not conduct

EPA 816-R-04-003 Chapter 3Characteristics of CBM Production and Associated HF Practices
Evaluation of Impacts to Underground Sources June 2004of Drinking Water by Hydraulic Fracturing ofCoalbed Methane Reservoirs 3-9
systematic assessments of the extent of the fractures into or through the roof rock shalesthat were immediately above the mined coal (the rock strata immediately above a minedcoal layer is referred to as the “roof rock”).
In-Situ Stress and Stress Contrasts
In-situ stress and the relative stress of neighboring geologic strata are importantinfluences on fracture behavior. A discussion of in-situ stress is provided in DOE’s paper“Hydraulic Fracturing” (provided as Appendix A). In-situ stress is described as:
“Underground formations are confined and under stress… [The graphicbelow] illustrates the local stress state at depth for an element offormation. The stresses can be divided into 3 principal stresses… [In thegraphic below,] σ1 is the vertical stress, σ2 is the maximum horizontalstress, while σ3 is the minimum horizontal stress, where σ1>σ2>σ3. Thisis a typical configuration for coalbed methane reservoirs. However,depending on geologic conditions, the vertical stress could also be theintermediate (σ2) or minimum stress (σ3). These stresses are normallycompressive and vary in magnitude throughout the reservoir, particularlyin the vertical direction (from layer to layer). The magnitude and directionof the principal stresses are important because they control the pressurerequired to create and propagate a fracture, the shape and vertical extent ofthe fracture, the direction of the fracture, and the stresses trying to crushand/or embed the propping agent during production.”
Local in-situ stress at depth.
According to (Naceur and Touboul 1990), the contrast in stress between adjacent rockstrata within and surrounding the targeted coal zone is the most important mechanismcontrolling fracture height. Stress contrast is important in determining whether a fracturewill continue to propagate in the same direction when it hits a geologic contact betweentwo different rock types. Often, a high stress contrast results in a barrier to fracture
σ 1
2σ
3σ
σ 1 3σ 2σ> >
σ 1σ 1
2σ 2σ
3σ 3σ
σ 1 3σ 2σ> >σ 1σ 1 3σ 3σ 2σ 2σ> >
σ 1σ 1
2σ 2σ
3σ 3σ
σ 1 3σ 2σ> >σ 1σ 1 3σ 3σ 2σ 2σ> >
σ 1σ 1
2σ 2σ
3σ 3σ
σ 1σ 1 3σ 3σ 2σ 2σ> >σ 1σ 1 3σ 3σ 2σ 2σ> > 2σ 2σ> >

EPA 816-R-04-003 Chapter 3Characteristics of CBM Production and Associated HF Practices
Evaluation of Impacts to Underground Sources June 2004of Drinking Water by Hydraulic Fracturing ofCoalbed Methane Reservoirs 3-10
propagation. An example of this would be where there is a geologic contact between acoalbed and an overlying, thick, higher-stress shale.
Hydraulic Fracture Stimulation Design
The procedures and fracturing fluids used to stimulate coalbed methane wells can differfrom operator to operator in a single basin due to local characteristics of geology anddepth and to perceived advantages of cost, effectiveness, production characteristics, orother factors. On a larger scale, although fracture stimulations in coalbed methaneprojects in different basins may share common rock types and characteristics, fracturebehavior can differ significantly. Discussions on hydraulic fracturing practices in 11individual coal basins are included in Chapter 5 and in Attachments 1 through 11.
Aspects of fracture behavior, such as fracture dimensions (height, length, and width), areaffected by the different fracturing approaches taken by the operator during a hydraulicfracturing event. Generally, the larger the volume of fracturing fluids injected, the largerthe potential fracture dimensions. Fluid injection rates and viscosity can also affectfracture dimensions (Olson, 2001; Diamond and Oyler, 1987). Large injection volumesalso often result in extensive networks of induced fractures. Gelled water treatments mayresult in the widest and longest fractures, but this occurrence cannot be concluded withcertainty from the mined-through studies (Diamond and Oyler, 1987; Diamond 1987aand b).
The effects of these operator-controlled actions interact with and are influenced by thephysical properties, depths, and in-situ stress of the geologic formations being fractured(as listed above). For example, if a hydraulically induced fracture has a relativelyconstant height due to a geologic layer acting as a barrier to fracture propagation, and thefracture is forced to grow and increase in volume (through an increased volume offracturing fluid), the fracture will mainly grow in length. Also, increasing fluid viscositycan increase the pressure due to injection, resulting in greater fracture width, and thusoften shorter fractures (Olson, 2001).
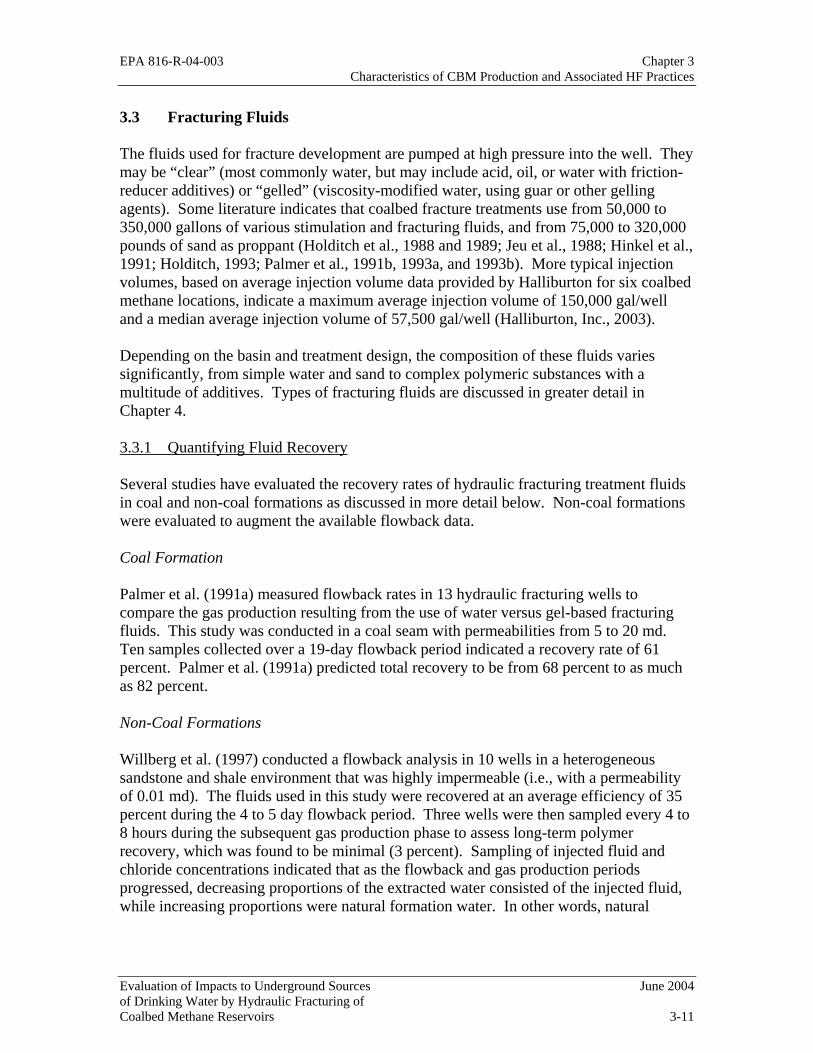
EPA 816-R-04-003 Chapter 3Characteristics of CBM Production and Associated HF Practices
Evaluation of Impacts to Underground Sources June 2004of Drinking Water by Hydraulic Fracturing ofCoalbed Methane Reservoirs 3-11
3.3 Fracturing Fluids
The fluids used for fracture development are pumped at high pressure into the well. Theymay be “clear” (most commonly water, but may include acid, oil, or water with friction-reducer additives) or “gelled” (viscosity-modified water, using guar or other gellingagents). Some literature indicates that coalbed fracture treatments use from 50,000 to350,000 gallons of various stimulation and fracturing fluids, and from 75,000 to 320,000pounds of sand as proppant (Holditch et al., 1988 and 1989; Jeu et al., 1988; Hinkel et al.,1991; Holditch, 1993; Palmer et al., 1991b, 1993a, and 1993b). More typical injectionvolumes, based on average injection volume data provided by Halliburton for six coalbedmethane locations, indicate a maximum average injection volume of 150,000 gal/welland a median average injection volume of 57,500 gal/well (Halliburton, Inc., 2003).
Depending on the basin and treatment design, the composition of these fluids variessignificantly, from simple water and sand to complex polymeric substances with amultitude of additives. Types of fracturing fluids are discussed in greater detail inChapter 4.
3.3.1 Quantifying Fluid Recovery
Several studies have evaluated the recovery rates of hydraulic fracturing treatment fluidsin coal and non-coal formations as discussed in more detail below. Non-coal formationswere evaluated to augment the available flowback data.
Coal Formation
Palmer et al. (1991a) measured flowback rates in 13 hydraulic fracturing wells tocompare the gas production resulting from the use of water versus gel-based fracturingfluids. This study was conducted in a coal seam with permeabilities from 5 to 20 md.Ten samples collected over a 19-day flowback period indicated a recovery rate of 61percent. Palmer et al. (1991a) predicted total recovery to be from 68 percent to as muchas 82 percent.
Non-Coal Formations
Willberg et al. (1997) conducted a flowback analysis in 10 wells in a heterogeneoussandstone and shale environment that was highly impermeable (i.e., with a permeabilityof 0.01 md). The fluids used in this study were recovered at an average efficiency of 35percent during the 4 to 5 day flowback period. Three wells were then sampled every 4 to8 hours during the subsequent gas production phase to assess long-term polymerrecovery, which was found to be minimal (3 percent). Sampling of injected fluid andchloride concentrations indicated that as the flowback and gas production periodsprogressed, decreasing proportions of the extracted water consisted of the injected fluid,while increasing proportions were natural formation water. In other words, natural

EPA 816-R-04-003 Chapter 3Characteristics of CBM Production and Associated HF Practices
Evaluation of Impacts to Underground Sources June 2004of Drinking Water by Hydraulic Fracturing ofCoalbed Methane Reservoirs 3-12
formation water was able to bypass viscous gel trapped in the formation and flow into theproduction wells.
The authors further cited laboratory studies indicating that water may flow past the gel insand such as that used as proppant in these studies (Willberg et al., 1997). Because thegel is more viscous than water, it is easier for water to respond to pumping and flowthrough the formation towards the production well. As Willberg et al. (1997) writes,“Production of formation water effectively competes and eventually supersedes residualfracturing fluid recovery, thereby limiting the overall cleanup efficiency.” Given that theenvironments in which coalbed methane is produced are also generally saturated withwater, and similar sands are used as proppants, it is possible that gel recovery is impededin much the same way in coalbed methane stimulations.
Willberg et al. (1998) conducted another flowback analysis and described the effect offlowback rate on cleanup efficiency in an initially dry, very low permeability (0.001 md)shale. Some wells in this study were pumped at low flowback rates (less than 3 barrelsper minute (bbl/min). Other wells were pumped more aggressively at greater than 3bbl/min. Thirty-one percent of the injected fluids were recovered when low flowbackrates were applied over a 5-day period. Forty-six percent of the fluids were recoveredwhen aggressive flowback rates were applied in other wells over a 2-day period.Additional fluid recovery (10 percent to 13 percent) was achieved during the subsequentgas production phase, resulting in a total recovery rate of 41 percent to 59 percent.Willberg speculated that the lower recovery rate in the 1997 study was due to thepumping of large amounts of formation water during the recovery process, compared tothe 1998 study that was conducted in a relatively dry environment.
3.3.2 Mechanisms Affecting Fluid Recovery
A variety of site-specific factors will influence the recovery efficiency of fracturingfluids. These factors are summarized as follows:
• Fluids can “leakoff” (flow away) from the primary hydraulically inducedfracture into smaller secondary fractures. The fluids then become trapped inthe secondary fractures and/or pores of porous rock.
• Fluids can become entrapped due to the “check-valve effect,” whereinfractures narrow again after the injection of fracturing fluid ceases, formationpressure decreases, and extraction of methane and groundwater begins.
• Some fluid constituents can become adsorbed to coal or react chemically withthe formation.
• Some volume of the fluids, moving along the hydraulically induced fracture,may move beyond the capture zone of the pumping well, and thus cannot be
EPA 816-R-04-003 Chapter 3Characteristics of CBM Production and Associated HF Practices
Evaluation of Impacts to Underground Sources June 2004of Drinking Water by Hydraulic Fracturing ofCoalbed Methane Reservoirs 3-13
recovered during fluid recovery. The capture zone of the production well isthat portion of the aquifer that contributes water to the well.
• Some fluid constituents may not completely mix with groundwater andtherefore would be difficult to recover during production pumping.
Each of these mechanisms is discussed in greater detail in this section.
Fluid Leakoff
Fluids can be “lost” (i.e., remain in the subsurface unrecovered) due to “leakoff” intoconnected fractures and the pores of porous rocks (Figure 3-7). Fracturing fluids injectedinto the primary hydraulically induced fracture can intersect and flow (leakoff) intopreexisting smaller natural fractures. Some of the fluids lost in this way may occur veryclose to the well bore after traveling minimal distances in the hydraulically inducedfracture before being diverted into other fractures and pores. The volume of fracturingfluids that may be lost in this way depends on the permeability of the rocks and thesurface area of the fracture(s).
The high injection pressures of hydraulic fracturing can force the fracturing fluids to betransported deep into secondary fractures. The cleats in coal are presumed to play animportant role in leakoff (Olson, 2001). Movement into smaller fractures and cleats canbe to a point where flowback efforts will not recover them. The pressure reductioncaused by pumping during subsequent production is not sufficient to recapture all thefluid that has leaked off into the formation. The loss of fluids due to leakoff into smallfractures and pores is minimized by the use of cross-linked gels, discussed in more detailin Chapter 4.
Check-Valve Effect
A check-valve effect occurs when natural or propagating fractures open and allow fluidsto flow through when fracturing pressure is high, but subsequently prevent the fluidsfrom flowing back towards the production well as they close after fracturing pressuredecreases (Warpinski et al., 1988; Palmer et al., 1991a). A long fracture can be pinchedoff at some distance from the well. This reduces the effective fracture length available totransport methane from various locations within the coalbed to the production well.Fluids trapped beyond the “pinch point” are unlikely to be recovered during flowback.
In most cases, when the fracturing pressure is released, the fracture closes in response tonatural subsurface compressive stresses. Because the primary purpose of hydraulicfracturing is to increase the effective permeability of the target formation and connectnew or widened fractures to the well, a closed fracture is of little use. Therefore, acomponent of coalbed methane production well development is to “prop” the fractureopen, so that the enhanced permeability from the pressure-induced fracturing persistseven after fracturing pressure is terminated. To this end, operators use a system of fluids

EPA 816-R-04-003 Chapter 3Characteristics of CBM Production and Associated HF Practices
Evaluation of Impacts to Underground Sources June 2004of Drinking Water by Hydraulic Fracturing ofCoalbed Methane Reservoirs 3-14
and “proppants” to create and preserve a high-permeability fracture-channel from thewell into the formation.
The check-valve effect takes place in locations beyond the zone where proppants havebeen emplaced (or in smaller secondary fractures that have not received any proppant).Because of the heterogeneous, stratified, and fractured nature of coal deposits, it is likelythat some volume of stimulation fluid cannot be recovered due to its movement intozones that were not completely “propped.”
Adsorption and Chemical Reactions
Adsorption and chemical reactions can prevent the fluid from being recovered.Adsorption is the process by which fluid constituents adhere to a solid surface (i.e., thecoal, in this case) and are thereby unavailable to flow with groundwater. Adsorption tocoal is likely; however, adsorption to other surrounding geologic material (e.g., shale,sandstone) is likely to be minimal. Another possible reaction affecting the recovery offracturing fluid constituents is the neutralization of acids (in the fracturing fluids) bycarbonates in the subsurface.
Movement of Fluids Outside the Capture Zone
Fracturing fluids injected into the target coal zone flow into fractures under very highpressure. The hydraulic gradients driving fluid flow away from the well during injectionare much greater than the hydraulic gradients pulling fluid flow back towards theproduction well during flowback and production pumping. Some portion of the coalbedmethane fracturing fluids could be forced along the hydraulically induced fracture to apoint beyond the capture zone of the production well. The size of the capture zone willbe affected by the regional groundwater gradients, as well as by the drawdown caused bythe well. If fracturing fluids have been injected to a point outside of the well’s capturezone, they will not be recovered through production pumping and, if mobile, may beavailable to migrate through an aquifer. Site-specific geologic, hydrogeologic, injectionpressure, and production pumping details would provide the information needed toestimate the dimension of the production well capture zone and the extent to which thefracturing fluids might travel, disperse, and dilute.
Incomplete Mixing of Fracturing Fluids with Water
Steidl (1993) documented the occurrence of a gelling agent that did not dissolvecompletely and formed clumps at 15 times the injected concentration in the fractureinduced by one well. Steidl (1993) also directly observed, in his mined-through studies,gel hanging in stringy clumps in many other fractures induced by that one well. AsWillberg et al. (1997) noted, laboratory studies indicate that fingered flow of water pastresidual gel may impede fluid recovery. Therefore, some fracturing fluid gels appear notto flow with groundwater during production pumping and remain in the subsurfaceunrecovered. Such gels are unlikely to flow with groundwater during production, but

EPA 816-R-04-003 Chapter 3Characteristics of CBM Production and Associated HF Practices
Evaluation of Impacts to Underground Sources June 2004of Drinking Water by Hydraulic Fracturing ofCoalbed Methane Reservoirs 3-15
may present a source of gel constituents to flowing groundwater during and afterproduction.
3.4 Measuring and Predicting the Extent of Fluid Movement
Because fractures can possibly connect with or even extend into USDWs, fracture heightis relevant to the issue of whether hydraulic fracturing fluids can affect USDWs. Currentmethods of measuring or predicting fracture growth, including mathematical models, aredescribed. The models are effective in setting parameters for a given hydraulic fractureoperation. Coalbed methane well operators have a financial incentive to keep thehydraulically induced fracture generally within the target coal zone so that expenditureson hydraulic horsepower, fracturing fluids, and proppants are minimized for commercialextraction of methane from the coal. In addition, a detailed review is included on“mined-through” studies that were conducted primarily by the U.S. Bureau of Mines.These studies provide unique information on the direct measurement of the dimensionsand other characteristics of fractures created in coal seams and surrounding strata byhydraulic fracturing. Paint, injected with the fracturing fluids, was used as a tracer insome of these studies, enabling one of the most direct measurements of the extent of fluidmovement due to hydraulic fracturing.
The particular stratigraphy of a fracturing site will determine what fracture heights aresignificant with respect to USDWs. That is, a given fracture height may be consideredsmall at a particular site in one basin, but may be more significant in another basin wherethere is a smaller vertical separation between hydraulically fractured coalbeds and aUSDW. The extent of fracturing is controlled by the characteristics of the geologicformations (including the presence of shales or natural fractures), the volume and type offracturing fluid used, the pumping pressure, and the depth at which the fracturing isperformed. Several methods are available to operators to measure or predict the extent towhich fracture stimulation fluid moves and the related values of maximum inducedfracture extension and “propped” fracture height. Propped height (i.e., height in thefracture to which proppant has been distributed) was found to be 60 percent to 75 percentof total vertical fracture height (Mavor et al., 1991; Rahim and Holditch, 1992; Nolte andSmith, 1981; Nolte and Economides, 1991; Zuber et al., 1991). Furthermore, in caseswhere proppant “screens out” or emplacement partially fails, proppant may exist in 20percent or less of fracture height.
Both the current and some older methods for estimating fracture dimensions arediscussed below. In general, these methods fall into three areas: direct measurements;indirect measurements; and model estimates. Terminology in the literature regardingfracture dimensions is sometimes inconsistent; some articles describe “measured”fracture dimensions when referring to indirect measures or even model estimates.
EPA 816-R-04-003 Chapter 3Characteristics of CBM Production and Associated HF Practices
Evaluation of Impacts to Underground Sources June 2004of Drinking Water by Hydraulic Fracturing ofCoalbed Methane Reservoirs 3-16
3.4.1 Direct Measurements
Direct measures include mined-through (or mineback) studies (where mining ofsubsurface coal seams that were previously hydraulically fractured allows direct access tofractures for measurement); dye tracing conducted in conjunction with mined-throughstudies; downhole cameras (used to visually inspect fractures in the borehole), includingborehole image logging and downhole video logging; surface and downhole tiltmeters;and microseismic monitoring (or imaging). Fracture geometry is most dependablymeasured by microseismic monitoring or downhole tiltmeters (Warpinski, 2001), or bytracers (Diamond and Oyler, 1987). Downhole cameras can be used only in open boreholes (uncased wells), so fracture measurements using cameras do not reflectconventional coalbed methane fracturing that typically occurs in cased wells. Bothdownhole cameras and mined-through approaches to fracture measurements are limitedto areas exposed by the wellbore and mining activities, respectively. Nonetheless, themined-through studies provide the most direct approach for estimating fracturedimensions.
Mined-Through Studies
Twenty-two coalbeds were hydraulically fractured, subsequently mined-through, andinvestigated several months to several years later in Pennsylvania, Alabama, WestVirginia, Illinois, Virginia, and Utah (Diamond 1987a and b; Diamond and Oyler 1987).Similar studies have been conducted by Jeffrey et al. (1993) in Queensland, Australia,and Steidl (1991a; 1991b; 1993) in the Black Warrior Basin, Alabama. The Diamondstudies were designed to evaluate the effect of the hydraulic fracturing treatment onmining safety. All the mined-through studies enabled direct observation of inducedfractures and surrounding material and evaluation of the movement of sand proppant andfracturing fluids through both induced and natural fractures. Eight of the treatmentsincluded fluorescent paint in the injected fluid to aid in mapping fluid movement(Diamond 1987a and b).
Steidl (1993) found that fracture widths were typically 0.1 inch, but could be as wide as 4inches. Measured sand-filled (propped) fractures were 2 to 526 feet in length (Steidl1993, Jeffrey et al., 1993), although Steidl found a sand-free extension of a sand-filledfracture 870 feet from the borehole. Diamond (1987a and b) found treatment fluidsbeyond the sand-filled portions of the fractures using paint injected with the fracturingfluids. In most of the wells where paint was injected, the paint was found 200 to 300 feetbeyond the sand-filled portions of fractures. However in one borehole, paint extendedout from the well bore for 630 feet, although the sand-filled portion of the fracture wasonly 95 feet in extent (Diamond, 1987a and b). These paint-coated fractures wereproduced using typical hydraulic fracturing processes in fairly typical coalbed methanegeologic conditions.
Fluorescent paint was observed in locations that indicated fluids did not travel in a directlinear path from the induced fracture. Fluids often followed a stair-step pathway through

EPA 816-R-04-003 Chapter 3Characteristics of CBM Production and Associated HF Practices
Evaluation of Impacts to Underground Sources June 2004of Drinking Water by Hydraulic Fracturing ofCoalbed Methane Reservoirs 3-17
the coalbed (Diamond and Oyler, 1987). The fluorescent paint was also useful foridentifying small fractures penetrated by treatment fluids but not by sand proppant. Multiple small, parallel fractures were penetrated by treatment fluids at many of thelocations studied. Given that treatment fluids have been documented to travel more thansix times farther than sand proppant, studies looking at the dimensions of sand-filledfractures alone are unlikely to capture the extent of fluid movement within and beyondcoalbed methane reservoirs (Diamond, 1987a and b).
About half of the sites studied by Diamond (1987a and b) and Diamond and Oyler (1987)had fractures penetrating beyond the coalbeds into the roof rock (the rock overlying thecoal in the mined areas). Jeffrey et al. (1993) found that most of the proppant in three oftheir four treatments was found in the roof rock. Thus, mined-through studies inAustralia and in six states in the United States found that hydraulic fracturing fluidspenetrated into, and, when shales were very thin, through strata surrounding coalbeds in50 percent of stimulations in the United States and 75 percent of the stimulations inAustralia. The mined-through studies, however, generally cannot provide measures ofhow far the fractures actually extend, since mining did not extend beyond the coal andinto the roof rock.
Other Direct Measurements
A discussion of other fracture diagnostic methods is provided in DOE’s paper “HydraulicFracturing” (provided as Appendix A).
“Fracture diagnostics involves analyzing the data before, during and aftera hydraulic fracture treatment to determine the shape and dimensions ofboth the created and propped fracture. Fracture diagnostic techniqueshave been divided into several groups (Cipolla and Wright, 2000).
Direct far field techniques
Direct far field methods are comprised of tiltmeter fracture mapping andmicroseismic fracture mapping techniques. These techniques requiredelicate instrumentation that has to be emplaced in boreholes surroundingand near the well to be fracture treated. When a hydraulic fracture iscreated, the expansion of the fracture will cause the earth around thefracture to deform. Tiltmeters can be used to measure the deformation andto compute the approximate direction and size of the created fracture.Surface tiltmeters are placed in shallow holes surrounding the well to befracture treated and are best for determining fracture orientation andapproximate size. Downhole tiltmeters are placed in vertical wells atdepths near the location of the zone to be fracture treated. As with surfacetiltmeters, downhole tiltmeter data can be analyzed to determine theorientation and dimensions of the created fracture, but are most useful fordetermining fracture height. Tiltmeters have been used on an

EPA 816-R-04-003 Chapter 3Characteristics of CBM Production and Associated HF Practices
Evaluation of Impacts to Underground Sources June 2004of Drinking Water by Hydraulic Fracturing ofCoalbed Methane Reservoirs 3-18
experimental basis to map hydraulic fractures in coal seams (Nielson andHanson, 1987).
Microseismic fracture mapping relies on using a downhole receiver arrayof accelerometers or geophones to locate microseisms or micro-earthquakes that are triggered by shear slippage in natural fracturessurrounding the hydraulic fracture. … In essence, noise is created in azone surrounding the hydraulic fracture. Using sensitive arrays ofinstruments, the noise can be monitored, recorded, analyzed and mapped.
…Microseismic monitoring has traditionally been too expensive to beused on anything but research wells, but its cost has dropped dramaticallyin the past few years, so although still expensive (on the order of $50,000to $100,000), it is being used more commonly throughout the industry. …If the technology is used at the beginning of the development of a field,however, the data and knowledge gained are often used on subsequentwells, effectively spreading out the costs.
Direct near-wellbore techniques
Direct near-wellbore techniques are run in the well that is being fracturetreated to locate or image the portion of fracture that is very near (inches)the wellbore. Direct near-wellbore techniques…[include] borehole imagelogging [and] downhole video logging, and caliper logging. If a hydraulicfracture intersects the wellbore, these direct near-wellbore techniques canbe of some benefit in locating the hydraulic fracture.
However, these near-wellbore techniques are not unique and cannotsupply information on the size or shape of the fracture once the fracture is2-3 wellbore diameters in distance from the wellbore. In coal seams,where multiple fractures are likely to exist, the reliability of these directnear-wellbore techniques are even more speculative. As such, very few ofthese direct near-wellbore techniques are used on a routine basis to lookfor a hydraulic fracture.”
3.4.2 Indirect Measurements
Indirect measures of fracture dimensions include pressure analyses (sometimes referredto as net, treating, or bottom hole pressure analyses that are sometimes analyzed inconjunction with proppant volume assessments) and radioactive tracing. (Radioactivetracing can be conducted on either fracturing fluids or proppants. It is sometimes referredto as a “tagged” study, and is typically measured through gamma ray logging.) Pressureanalyses generally monitor bottom hole pressures (BHPs) over time to infer fracturepropagation. For example, declining net pressure during water/gel pumping stagesindicates rapid fracture height growth (Saulsberry, et al., 1990). Proppant volumes and

EPA 816-R-04-003 Chapter 3Characteristics of CBM Production and Associated HF Practices
Evaluation of Impacts to Underground Sources June 2004of Drinking Water by Hydraulic Fracturing ofCoalbed Methane Reservoirs 3-19
historical fracturing and methane production data are used to improve estimates based onpressure analyses. Fracture heights and lengths that are inferred by pressure analyses arecommonly described in the literature as “measured.” Radioactive tracers provide onlyapproximate estimates of fracture dimensions because they are measured in near-wellboreenvironments.
3.4.3 Model Estimates
The other main category of indirect measures of fracture dimensions is hydraulic fracturemodeling. The basic elements of fracture modeling were developed between 1955 and1961 (Nolte and Economides, 1991). Many modeling studies were conducted to aid inthe design of fracture stimulation treatments (i.e., to determine the volume and pump rateof fluids and proppants that are required to achieve a desired fracture geometry).
Model estimates of fracture heights and lengths are common, including estimates usingthree-dimensional (and quasi-three dimensional) models. Modeling capabilities haveadvanced considerably in the last several 15 years, and the newest P3D (pseudo 3dimensional) models simultaneously predict height, width, and length based on treatmentinput data and reservoir parameters (Olson, 2001). A discussion of indirect fracturemodeling techniques is provided by DOE in the “Hydraulic Fracturing” paper (providedas Appendix A). An excerpt from that paper is provided below.
“The indirect fracture techniques consist of hydraulic fracture modeling of netpressures, pressure transient test analyses, and production data analyses. Becausethe fracture treatment data and the post-fracture production data are normallyavailable on every well, the indirect fracture diagnostic techniques are the mostwidely used methods to estimate the shape and dimensions of both the created andthe propped hydraulic fracture.
The fracture treatment data can be analyzed with a P3D fracture propagationmodel to determine the shape and dimensions of the created fracture. The P3Dmodel is used to history match the fracturing data, such as injection rates andinjection pressures. Input data, such as the in-situ stress and permeability in keylayers of rock can be varied (within reason) to achieve a history match of the fielddata.
Post-fracture production and pressure data can be analyzed using a 3D reservoirsimulator to estimate the shape and dimensions of the propped fracture. Values offormation permeability, fracture length and fracture conductivity can be varied inthe reservoir model to achieve a history match of the field data.
The main limitation of these indirect techniques is that the solutions are notunique and require as much fixed data as possible. For example, if the engineerhas determined the formation permeability from a well test or production testprior to the fracture treatment, so that the value of formation permeability is

EPA 816-R-04-003 Chapter 3Characteristics of CBM Production and Associated HF Practices
Evaluation of Impacts to Underground Sources June 2004of Drinking Water by Hydraulic Fracturing ofCoalbed Methane Reservoirs 3-20
known and can be fixed in the models, the solution concerning values of fracturelength become more unique. Most of the information in the literature concerningpost-fracture analyses of hydraulic fractures has been derived from these indirectfracture diagnostic techniques.”
There are several caveats regarding the use and interpretation of model estimates. In-situstress values of the target coal seams and surrounding strata are important model inputs.Actual in-situ stress measurements are very difficult to obtain and are rarely conducted(Warpinski, 2001). Therefore, almost all modeling is conducted using inferred stressvalues (as estimated, for example, from the mechanical and lithological properties ofrocks from, or similar to those in, the target coal zone). Given the geologic variabilityand site-specific influences on fracture behavior described above, the reliability offracture height and length estimates obtained from various models is obviouslyinfluenced by the quality of the inferred model inputs regarding geologic factors.
Models also necessarily rely on simplifying assumptions to simulate fracture propagationand behavior through sometimes complex geologic zones. As with all modeling, thereliance on inferred input variables and some assumptions introduces some subjectivity tothe modeling process. Dependable modeling requires knowledge of and allowance forthe detailed stratigraphy of the geologic strata throughout the coal zone. (It was noted insection 3.2.2 that thin clay layers or ash beds can influence fracture behavior.) Simplifiedgeologic models might represent the subsurface as 2 to 3 distinct geologic layers, toreduce computing and data requirements, when a 30- or 50-layer model may be necessaryto accurately predict fracture height (Rahim et al., 1998). Nevertheless, models arenecessary simplifications of fracture behavior in the geologic subsurface, and significantresearch has been conducted in the last several decades so that model estimates offracture behavior in methane-producing coalbeds are now an invaluable tool for industry.
3.4.4 Limitations of Fracture Diagnostic Techniques
Warpinski (1996) discussed many of these same fracture diagnostic techniques. Ingeneral, the best fracture diagnostics techniques are expensive and used only in researchwells. Fracture diagnostic techniques can provide important data when entering a newproduction area or a new formation. However, for coalbed methane wells, where costsmust be minimized to maintain profitability, the best fracture diagnostic techniques arerarely used and are often considered to be prohibitively expensive. Warpinksi (2001) further provided other general conclusions regarding estimates offracture dimensions:
• Fracture heights inferred from pressure data are almost always greater than thecorresponding heights measured with the more dependable microseismicmonitoring or tiltmeters.

EPA 816-R-04-003 Chapter 3Characteristics of CBM Production and Associated HF Practices
Evaluation of Impacts to Underground Sources June 2004of Drinking Water by Hydraulic Fracturing ofCoalbed Methane Reservoirs 3-21
• Actual fracture lengths may be greater or less than the lengths estimated frommodels or inferred from pressure analyses, depending on many site-specificgeologic factors.
• Fracture geometry can be accurately measured using microseismic monitoringand measured somewhat using downhole tiltmeters. These technologies havebeen found to be invaluable for determining how fractures actually behave.
Table 3-1 lists certain diagnostic techniques and their limitations.
Table 3-1. Limitations of Fracture Diagnostic Techniques (Appendix A: DOE,Hydraulic Fracturing)
Parameter Technique Limitation
Fracture Height Tracer logs Shallow depth of investigation; shows height only near the wellbore
Fracture Height Temperature logs Difficult to interpret; shallow depth of investigation; shows height only near wellbore
Fracture Height Stress profiling Does not measure fracture directly; must be calibrated with in-situ stress tests
Fracture Height P3D models Does not measure fracture directly; estimates vary depending on which model is used
Fracture Height Microseismic Optimally requires nearby offset well; difficult to interpret; expensive
Fracture Height Tiltmeters Difficult to interpret; expensive and difficult to conduct in the field
Fracture Length P3D models Length inferred, not measured; estimates vary greatly depending on which model isused
Fracture Length Well testing Large uncertainties depending upon assumptions and lack of prefracture well test data
Fracture Length Microseismic Optimally requires nearby offset well; difficult to interpret; expensive
Fracture Length Tiltmeters Difficult to interpret; expensive and difficult to conduct in the field
Fracture Azimuth Core techniques Expensive to cut core and run tests; multiple tests must be run to assure accuracy
Fracture Azimuth Log techniques Requires open hole logs to be run; does not work if natural fractures are not present
Fracture Azimuth Microseismic Analysis intensive; expensive for determination of azimuth
Fracture Azimuth Tiltmeters Useful only to a depth of 5,000 feet; requires access to large area; expensive
From: Appendix A, DOE, Hydraulic Fracturing

EPA 816-R-04-003 Chapter 3Characteristics of CBM Production and Associated HF Practices
Evaluation of Impacts to Underground Sources June 2004of Drinking Water by Hydraulic Fracturing ofCoalbed Methane Reservoirs 3-22
3.5 Summary
Coalbed methane development began as a safety measure to extract methane, anexplosion hazard, from coal prior to mining. Since 1980, coalbed methane productionhas grown rapidly, spurred by tax incentives to develop non-conventional energyproduction. At the end of 2000, coalbed methane production from 13 states totaled 1.353trillion cubic feet, an increase of 156 percent from 1992. At year-end 2000, coalbedmethane production accounted for about 7 percent of the total United States dry gasproduction and 9 percent of proven dry gas reserves (EIA, 2001).
Methane within coalbeds is not “trapped” under pressure as in conventional gasscenarios. Only about 5 to 9 percent of the methane is present as “free” gas within thenatural fractures, joints, and cleats. Almost all coalbed methane is adsorbed within themicro-porous matrix of the coal (Koenig, 1989; Winston, 1990; Close, 1993).
Coalbed methane production starts with high-pressure injection of fracturing fluids andproppant into targeted coal zones. The resulting induced or enlarged fractures improvethe connections of the production well to the fracture networks in and around the coalzone. When production begins, water is pumped from the fractures in the coal zone toreduce pressure in the formation. When pressures are adequately reduced, methanedesorbs from the coal matrix, moves through the network of induced and natural fracturesin the coal toward the production well, and is extracted through the well and to thesurface.
Fractures that are created at shallow depths (less than approximately 1,000 feet) typicallyhave more of a horizontal than a vertical component. Vertical fractures created at deeperdepths can propagate vertically to shallower depths where they may develop a horizontalcomponent. These “T-fractures” may involve the fracture “turning” and developinghorizontally at a coalbed-mudstone interface.
Fracture behavior through coal, shale, and other geologic strata commonly present in coalzones depends on site-specific factors such as relative thicknesses and in-situ stressdifferences between the target coal seam(s) and the surrounding geologic strata, as wellas the presence of pre-existing natural fractures. Often, a high stress contrast betweenadjacent geologic strata results in a barrier to fracture propagation. This occurs in coalzones where there is a geologic contact between a high-stress coal seam and an overlying,thick, relatively low-stress shale.
The fluids used for fracture development are injected at high pressure into the targetedcoal zone in the subsurface. These fluids may be “clear” (primarily consisting of water,but may include acid, oil, or water with friction-reducer additives) or “gelled” (viscosity-modified water using guar or other gelling agents). Hydraulic fracturing in coalbedmethane wells may require 50,000 to 350,000 gallons of fracturing fluids and 75,000 to320,000 pounds of sand as proppant to prop or maintain the opening of fractures after theinjection (fracturing) pressure is reduced (Holditch et al., 1988 and 1989; Jeu et al., 1988;

EPA 816-R-04-003 Chapter 3Characteristics of CBM Production and Associated HF Practices
Evaluation of Impacts to Underground Sources June 2004of Drinking Water by Hydraulic Fracturing ofCoalbed Methane Reservoirs 3-23
Hinkel et al., 1991; Holditch, 1993; Palmer et al., 1991b, 1993a, and 1993b). Moretypical injection volumes, based on average injection volume data provided byHalliburton for six coalbed methane locations, indicate a maximum average injectionvolume of 150,000 gal/well and a median average injection volume of 57,500 gal/well(Halliburton, Inc., 2003).
In any fracturing job, some fracturing fluids cannot be recovered and are said to be “lost”to the formation. Palmer (1991a) observed that for fracture stimulations in multi-layeredcoal formations, 61 percent of stimulation fluids were recovered during a 19-dayproduction sampling of a coalbed methane well in the Black Warrior Basin. He furtherestimated that from 68 percent to possibly as much as 82 percent would eventually berecovered. A variety of site-specific factors, including leakoff into the coal seams andsurrounding strata, the check-valve effect, adsorption and other geochemical processes,and flow through the hydraulic fracture beyond the well’s capture zone will serve toreduce recovery of hydraulic fracturing fluids injected into subsurface coal zones topromote coalbed methane extraction.
The mined-through studies by the U.S. Bureau of Mines (see Diamond, 1987a and b) andothers provide important directly-measured characteristics of hydraulic fracturing in coalseams and surrounding strata. Further, paint tracer studies conducted as part ofDiamond’s (1987a and b) mined-through studies can provide estimates on the extent ofhydraulic fracturing fluid movement, which may be greater than the extent of sand-filled(propped) hydraulic fracture heights or lengths given fluid movement through naturalfractures. These estimates of the extent of fluid movement are usually limited by the areaexposed to mining.
A significant amount of diagnostic research has been conducted in the last decadeenabling industry to develop a practical, applied understanding of general fracturebehavior as it relates to methane production. Operators use a number of techniques toestimate fracture dimensions to design fracture stimulation treatments to minimizeexpenditures on hydraulic horsepower, fracturing fluids, and proppants. Modeling isincreasingly more sophisticated, but still commonly depends on at least some inferred(and subjective) input data. Reliable fracture height and length can be measuredaccurately by microseismic monitoring and tiltmeters (Warpinksi, 2001).

EPA 816-R-04-003 Chapter 3Characteristics of CBM Production and Associated HF Practices
Evaluation of Impacts to Underground Sources June 2004of Drinking Water by Hydraulic Fracturing ofCoalbed Methane Reservoirs 3-24
Figure 3-1. Major United States Coal Basins

EPA 816-R-04-003 Chapter 3Characteristics of CBM Production and Associated HF Practices
Evaluation of Impacts to Underground Sources June 2004of Drinking Water by Hydraulic Fracturing ofCoalbed Methane Reservoirs 3-25
Figure 3-2. Geography of an Ancient Peat-Forming System

EPA 816-R-04-003 Chapter 3Characteristics of CBM Production and Associated HF Practices
Evaluation of Impacts to Underground Sources June 2004of Drinking Water by Hydraulic Fracturing ofCoalbed Methane Reservoirs 3-26
Figure 3-3. Schematic Representation of “Face Cleat” (F) and “Butt Cleat” (B)

EPA 816-R-04-003 Chapter 3Characteristics of CBM Production and Associated HF Practices
Evaluation of Impacts to Underground Sources June 2004of Drinking Water by Hydraulic Fracturing ofCoalbed Methane Reservoirs 3-27
Figure 3-4. A Graphical Representation of the Hydraulic Fracturing Process inCoalbed Methane Wells

EPA 816-R-04-003 Chapter 3Characteristics of CBM Production and Associated HF Practices
Evaluation of Impacts to Underground Sources June 2004of Drinking Water by Hydraulic Fracturing ofCoalbed Methane Reservoirs 3-28
Figure 3-4. A Graphical Representation of the Hydraulic Fracturing Process inCoalbed Methane Wells (Continued)

EPA 816-R-04-003 Chapter 3Characteristics of CBM Production and Associated HF Practices
Evaluation of Impacts to Underground Sources June 2004of Drinking Water by Hydraulic Fracturing ofCoalbed Methane Reservoirs 3-29
Figure 3-5. Water And Gas Production Over Time

EPA 816-R-04-003 Chapter 3Characteristics of CBM Production and Associated HF Practices
Evaluation of Impacts to Underground Sources June 2004of Drinking Water by Hydraulic Fracturing ofCoalbed Methane Reservoirs 3-30
Figure 3-6. Side-View of a Vertical Hydraulic Fracture Typical of Coalbeds

EPA 816-R-04-003 Chapter 3 Characteristics of CBM Production and Associated HF Practices
Evaluation of Impacts to Underground Sources June 2004 of Drinking Water by Hydraulic Fracturing of Coalbed Methane Reservoirs 3-31
Figure 3-7. Plan View (Looking Down the Wellbore) of Vertical, Two-Winged Coalbed Methane Fracture Showing the Reservoir Region Invaded by Fracturing Fluid Leakoff

EPA 816-R-04-003 Chapter 3Characteristics of CBM Production and Associated HF Practices
Evaluation of Impacts to Underground Sources June 2004of Drinking Water by Hydraulic Fracturing ofCoalbed Methane Reservoirs 3-32
Figure 3-8. Plan View of a Vertical Hydraulic Fracture

EPA 816-R-04-003 Chapter 4Hydraulic Fracturing Fluids
Evaluation of Impacts to Underground Sources June 2004of Drinking Water by Hydraulic Fracturing ofCoalbed Methane Reservoirs 4-1
Chapter 4
Hydraulic Fracturing Fluids
This chapter summarizes the information EPA collected on the types and volumes offracturing fluids and additives that may be used for hydraulic fracturing of coalbedmethane wells. This chapter also provides EPA’s evaluation of the fate and transport offracturing fluids that are injected into targeted coal layers during the hydraulic fracturingprocess. This evaluation was conducted to provide the Agency with information onwhether a Phase II study is warranted. Captioned photographs in this chapter show theuse of fracturing fluids at a coalbed methane well (Figures 4-1 through 4-11 at the end ofthis chapter).
4.1 Introduction
The types and use of fracturing fluids have evolved greatly over the past 60 years andcontinue to evolve. The U.S. oil and gas industry has used fluids for fracturing geologicformations since the early 1940s (Ely, 1985). The Handbook of Stimulation Engineering(Ely, 1985), a comprehensive history of the evolution of hydraulic fracturing fluids in theoil and gas industry, was used as a source of information for this chapter. In addition,EPA identified fluids and fluid additives commonly used in hydraulic fracturing throughliterature searches, reviews of relevant MSDSs provided by service companies, anddiscussions with field engineers, service company chemists, and state and federalemployees.
Available scientific literature indicates that hydraulic fracturing fluid performancebecame a prevalent research topic in the late 1980s and the 1990s. Most of the literaturepertaining to fracturing fluids relates to the fluids’ operational efficiency rather than theirpotential environmental or human health impacts. There is very little documentedresearch on the environmental impacts that result from the injection and migration ofthese fluids into subsurface formations, soils, and USDWs. Some of the existingliterature does offer information regarding the basic chemical components present inmost of these fluids. The composition of fracturing fluids and additives is discussed indetail in the next section.
The main goal of coalbed hydraulic fracturing is to create a highly conductive fracturesystem that will allow flow through the methane-bearing coal zone to the production wellused to extract methane (and groundwater). Hydraulic fracturing fluids are used toinitiate and/or expand fractures, as well as to transport proppant into fractures in coalbedformations. Proppants are sand or other granular substances injected into the formationto hold or “prop” open coal formation fractures created by hydraulic fracturing. Theviscosity of fracturing fluids is considered when they are formulated, to provide forefficient transport and placement of proppant into a fracture. Most of the fracturing

EPA 816-R-04-003 Chapter 4Hydraulic Fracturing Fluids
Evaluation of Impacts to Underground Sources June 2004of Drinking Water by Hydraulic Fracturing ofCoalbed Methane Reservoirs 4-2
fluids injected into the formation are pumped back out of the well along withgroundwater and methane gas (see section 3.3 in Chapter 3 for a more detailed discussionof fracturing fluid recovery).
4.2 Types of Fracturing Fluids and Additives
Service companies have developed a number of different oil- and water-based fluids andtreatments to more efficiently induce and maintain permeable and productive fractures.The composition of these fluids varies significantly, from simple water and sand tocomplex polymeric substances with a multitude of additives. Each type of fracturingfluid has unique characteristics, and each possesses its own positive and negativeperformance traits. For ideal performance, fracturing fluids should possess the followingfour qualities (adapted from Powell et al., 1999):
• Be viscous enough to create a fracture of adequate width.
• Maximize fluid travel distance to extend fracture length.
• Be able to transport large amounts of proppant into the fracture.
• Require minimal gelling agent to allow for easier degradation or “breaking”and reduced cost.
Water-based fracturing fluids have become the predominant type of coalbed methanefracturing fluid (Appendix A: DOE, Hydraulic Fracturing). However, fracturing fluidscan also be based on oil, methanol, or a combination of water and methanol. Methanol isused in lieu of, or in conjunction with, water to minimize fracturing fluid leakoff andenhance fluid recovery (Thompson et al., 1991). Polymer-based fracturing fluids madewith methanol usually improve fracturing results, but require 50 to 100 times the amountof breaker (e.g., acids used to degrade the fracturing fluid viscosity, which helps toenhance post-fracturing fluid recovery) (Ely, 1985). In some cases, nitrogen or carbondioxide gas is combined with the fracturing fluids to form foam as the base fluid. Foamsrequire substantially lower volumes to transport an equivalent amount of proppant.Diesel fuel is another component of some fracturing fluids although it is not used as anadditive in all hydraulic fracturing operations. A variety of other fluid additives (inaddition to the proppants) may be included in the fracturing fluid mixture to performessential tasks such as formation clean up, foam stabilization, leakoff inhibition, orsurface tension reduction. These additives include biocides, fluid-loss agents, enzymebreakers, acid breakers, oxidizing breakers, friction reducers, and surfactants such asemulsifiers and non-emulsifiers. Several products may exist in each of these categories.On any one fracturing job, different fluids may be used in combination or alone atdifferent stages in the fracturing process. Experienced service company engineers willdevise the most effective fracturing scheme, based on formation characteristics, using thefracturing fluid combination they deem most effective.

EPA 816-R-04-003 Chapter 4Hydraulic Fracturing Fluids
Evaluation of Impacts to Underground Sources June 2004of Drinking Water by Hydraulic Fracturing ofCoalbed Methane Reservoirs 4-3
The main fluid categories are:
• Gelled fluids, including linear or cross-linked gels.
• Foamed gels.
• Plain water and potassium chloride (KCl) water.
• Acids.
• Combination treatments (any combination of 2 or more of the aforementionedfluids).
Some of the fluids and fluid additives may contain constituents of potential concern.Table 4-1, at the end of section 4.2.6, lists examples of chemicals found in hydraulicfracturing fluids according to the MSDSs provided by service companies, and potentialhuman health effects associated with the product. It is important to note that informationpresented in MSDSs is for pure product. Each of the products listed in Table 4-1 issignificantly diluted prior to injection.
EPA also obtained two environmental impact statements that were prepared by theBureau of Land Management (BLM). In these impact statements, BLM identifiedadditional chemical compounds that may be in fracturing fluids including methyl tertbutyl ether (MTBE) (U.S. Department of the Interior, CO State BLM, 1998).However, EPA was unable to find any indications in the literature, on MSDSs, or ininterviews with service companies that MTBE is used in fracturing fluids to stimulatecoalbed methane wells.
4.2.1 Gelled Fluids
Water alone is not always adequate for fracturing certain formations because its lowviscosity limits its ability to transport proppant. In response to this problem, the industrydeveloped linear and cross-linked fluids, which are higher viscosity fracturing fluids.Water gellants or thickeners are used to create these gelled fluids. Gellant selection isbased on formation characteristics such as pressure, temperature, permeability, porosity,and zone thickness. These gelled fluids are described in more detail below.
Linear Gels
A substantial number of fracturing treatments are completed using thickened, water-based linear gels. The gelling agents used in these fracturing fluids are typically guargum, guar derivatives such as hydroxypropylguar (HPG) andcarboxymethylhydroxypropylguar (CMHPG), or cellulose derivatives such ascarboxymethylguar or hydroxyethylcellulose (HEC). In general, these products arebiodegradable. Guar is a polymeric substance derived from the seed of the guar plant

EPA 816-R-04-003 Chapter 4Hydraulic Fracturing Fluids
Evaluation of Impacts to Underground Sources June 2004of Drinking Water by Hydraulic Fracturing ofCoalbed Methane Reservoirs 4-4
(Ely, 1985). Guar gum, on its own, is non-toxic and, in fact, is a food-grade productcommonly used to increase the viscosity and elasticity of foods such as ice cream.
To formulate a viscous fracturing gel, guar powder or concentrate is dissolved in a carrierfluid such as water or diesel fuel. Increased viscosity improves the ability of thefracturing fluid to transport proppant and decreases the need for more turbulent flow.Concentrations of guar gelling agents within fracturing fluids have decreased over thepast several years. It was determined that reduced concentrations provide better andmore complete fractures (Powell et al., 1999).
Diesel fuel has been frequently used in lieu of water to dissolve the guar powder becauseits carrying capacity per unit volume is much higher (Halliburton, Inc., 2002). “Diesel isa common solvent additive, especially in liquid gel concentrates, used by many servicecompanies for continuous delivery of gelling agents in fracturing treatments” (GRI,1996). Diesel does not enhance the efficiency of the fracturing fluid; it is merely acomponent of the delivery system (Halliburton, Inc., 2002). Using diesel instead of waterminimizes the number of transport vehicles needed to carry the liquid gel to the site(Halliburton, Inc., 2002).
The percentage of diesel fuel in the slurried thickener can range between 30 percent andalmost 100 percent, based on the MSDSs summarized in Table 4-1. Diesel fuel is apetroleum distillate and may contain known carcinogens. One such component of dieselfuel is benzene, which, according to literature sources, can make up anywhere between0.003 percent and 0.1 percent by weight of diesel fuel (Clark and Brown, 1977; R.Morrison & Associates, Inc., 2001). Slurried diesel and gel are diluted with water priorto injection into the subsurface. The dilution is approximately 4 to 10 gallons ofconcentrated liquid gel (guar slurried in diesel) per 1,000 gallons of make-up water toproduce an adequate polymer slurry (Halliburton, Inc., Virginia Site Visit, 2001;Schlumberger, Ltd., 2001; Consolidated Industrial Services, Inc., Virginia Site Visit,2001; BJ Services, 2001).
Cross-linked Gels
One major advance in fracturing fluid technology was the development of cross-linkedgels. The first cross-linked gels were developed in 1968 (Ely, 1985). When cross-linking agents are added to linear gels, the result is a complex, high-viscosity fracturingfluid that provides higher proppant transport performance than do linear gels (Messina,Inc. Web site, 2001; Ely, 1985; Halliburton Inc., Virginia Site Visit, 2001). Cross-linkingreduces the need for fluid thickener and extends the viscous life of the fluid indefinitely.The fracturing fluid remains viscous until a breaking agent is introduced to break thecross-linker and, eventually, the polymer. Although cross-linkers make the fluid moreexpensive, they can considerably improve hydraulic fracturing performance, henceincreasing coalbed methane well production rates.

EPA 816-R-04-003 Chapter 4Hydraulic Fracturing Fluids
Evaluation of Impacts to Underground Sources June 2004of Drinking Water by Hydraulic Fracturing ofCoalbed Methane Reservoirs 4-5
Cross-linked gels are typically metal ion-cross-linked guar (Ely, 1985). Servicecompanies have used metal ions such as chromium, aluminum, titanium, and other metalions to achieve cross-linking (Ely, 1985). In 1973, low-residue (cleaner) forms of cross-linked gels, such as cross-linked hydroxypropylguar, were developed (Ely, 1985).
According to MSDSs summarized in Table 4-1, cross-linked gels may contain boric acid,sodium tetraborate decahydrate, ethylene glycol, and monoethylamine. Theseconstituents are hazardous in their undiluted form and can cause kidney, liver, heart,blood, and brain damage through prolonged or repeated exposure. According to a BLMenvironmental impact statement, cross-linkers may contain hazardous constituents suchas ammonium chloride, potassium hydroxide, zirconium nitrate, and zirconium sulfate(U.S. Department of the Interior, CO State BLM, 1998). Concentrations of thesecompounds in the fracturing fluids were not reported in the impact statement. The finalconcentration of cross-linkers is typically 1 to 2 gallons of cross-linker per 1,000 gallonsof gel (Halliburton, Inc., Virginia Site Visit, 2001; Schlumberger, Ltd., 2001).
4.2.2 Foamed Gels
Foam fracturing technology uses foam bubbles to transport and place proppant intofractures. The most widely used foam fracturing fluids employ nitrogen or carbondioxide as their base gas. Incorporating inert gases with foaming agents and waterreduces the amount of fracturing liquid required. Foamed gels use fracturing fluids withhigher proppant concentrations to achieve highly effective fracturing. The gas bubbles inthe foam fill voids that would otherwise be filled by fracturing fluid. The highconcentrations of proppant allow for an approximately 75-percent reduction in the overallamount of fluid that would be necessary using a conventional linear or cross-linked gel(Ely, 1985; Halliburton, Inc., Virginia Site Visit, 2001). Foaming agents can be used inconjunction with gelled fluids to achieve an extremely effective fracturing fluid(Halliburton, Inc., Virginia Site Visit, 2001).
Foam emulsions experience high leakoff; therefore, typical protocol involves the additionof fluid-loss agents, such as fine sands (Ely, 1985; Halliburton, Virginia Site Visit, 2001).Foaming agents suspend air, nitrogen, or carbon dioxide within the aqueous phase of afracturing treatment. The gas/liquid ratio determines if a fluid will be true foam orsimply a gas-energized liquid (Ely, 1985). Carbon dioxide can be injected as a liquid,whereas nitrogen must be injected as a gas to prevent freezing (Halliburton, Inc., VirginiaSite Visit, 2001).
According to the MSDSs summarized in Table 4-1, foaming agents can containdiethanolamine and alcohols such as isopropanol, ethanol, and 2-butoxyethanol. Theycan also contain hazardous substances including glycol ethers (U.S. Department of theInterior, CO State BLM, 1998). One of the foaming agent products listed in Table 4-1can cause negative liver and kidney effects, although the actual component causing theseeffects is not specified on the MSDS. The final concentration is typically 3 gallons of

EPA 816-R-04-003 Chapter 4Hydraulic Fracturing Fluids
Evaluation of Impacts to Underground Sources June 2004of Drinking Water by Hydraulic Fracturing ofCoalbed Methane Reservoirs 4-6
foamer per 1,000 gallons of gel (Halliburton, Inc., Virginia Site Visit, 2001;Schlumberger, Ltd., 2001).
4.2.3 Water & Potassium Chloride Water Treatments
Many service companies use groundwater pumped directly from the formation or treatedwater for their fracturing jobs. In some coalbed methane well stimulations, proppants arenot needed to prop fractures open, so simple water or slightly thickened water can be acost-effective substitute for an expensive polymer or foam-based fracturing fluid withproppant (Ely, 1985). Hydraulic fracturing performance is not exceptional with plainwater, but, in some cases, the production rates achieved are adequate. Plain water has alower viscosity than gelled water, which reduces proppant transport capacity.
Similar to plain water, another fracturing fluid uses water with potassium chloride (KCl)in addition to small quantities of gelling agents, polymers, and/or surfactants (Ely, 1985).Potassium chloride is harmless if ingested at low concentrations.
4.2.4 Acids
Acids are used in limestone formations that overlay or are interbedded within coals todissolve the rock and create a conduit through which formation water and coalbedmethane can travel (Ely, 1985). Typically, the acidic stimulation fluid is hydrochloricacid or a combination of hydrochloric and acetic or formic acid. For acid fracturing to besuccessful, thousands of gallons of acid must be pumped far into the formation to etch theface of the fracture (Ely, 1985). Some of the cellulose derivatives used as gelling agentsin water and water/methanol fluids can be used in acidic fluids to increase treatmentdistance (Ely, 1985). As discussed in section 4.2.5, acids may also be used as acomponent of breaker fluids.
In addition, acid can be used to clean up perforations of the cement surrounding the wellcasing prior to fracturing fluid injection (Halliburton, Inc., Virginia Site Visit, 2001;Halliburton, Inc., 2002). The cement is perforated at the desired zone of injection to easefracturing fluid flow into the formation (Halliburton, Inc., Virginia Site Visit, 2001;Halliburton, Inc., 2002).
Table 4-1 provides information on formic and hydrochloric acids. Acids are corrosive,and can be extremely hazardous in concentrated form. Acids are substantially dilutedwith water-based or water-and-gas-based fluids prior to injection into the subsurface.The injected concentration is typically 1,000 times weaker than the concentrated versionspresented in the product MSDSs (Halliburton, Inc., Virginia Site Visit, 2001;Schlumberger, Ltd., 2001).

EPA 816-R-04-003 Chapter 4Hydraulic Fracturing Fluids
Evaluation of Impacts to Underground Sources June 2004of Drinking Water by Hydraulic Fracturing ofCoalbed Methane Reservoirs 4-7
4.2.5 Fluid Additives
Several fluid additives have been developed to enhance the efficiency and increase thesuccess of fracturing fluid treatments. The major categories of these additives are definedand briefly described in the following sections.
Breakers
Breaker fluids are used to degrade the fracturing fluid viscosity, which helps to enhancepost-fracturing fluid recovery, or flowback. Breakers can be mixed with the fracturingfluid during pumping, or they can be introduced later as an independent fluid. There area variety of breaker types including time-release and temperature-dependent types. Mostbreakers are typically acids, oxidizers, or enzymes (Messina, Inc. Web site, 2001).According to a BLM environmental impact statement, breakers may contain hazardousconstituents, including ammonium persulfate, ammonium sulphate, copper compounds,ethylene glycol, and glycol ethers (U.S. Department of the Interior, CO State BLM,1998). Concentrations of these compounds in the fracturing fluids were not presented inthe environmental impact statement.
Biocides
One hydraulic fracturing design problem that arises when using organic polymers infracturing fluids is the incidence of bacterial growth within the fluids. Due to thepresence of organic constituents, the fracturing fluids provide a medium for bacterialgrowth. As the bacteria grow, they secrete enzymes that break down the gelling agent,which reduces the viscosity of the fracturing fluid. Reduced viscosity translates into poorproppant placement and poor fracturing performance. To alleviate this degradation inperformance, biocides, bactericides, or microbicides are added to the mixing tanks withthe polymeric gelling agents to kill any existing microorganisms (e.g., sulfate-reducingbacteria, slime-forming bacteria, algae), and to inhibit bacterial growth and deleteriousenzyme production. Bactericides are typically hazardous by nature (Messina, Inc. Website, 2001). They may contain hazardous constituents, including polycyclic organicmatter (POM) and polynuclear aromatic hydrocarbons (PAHs) (U.S. Department of theInterior, CO State BLM, 1998).
Information from MSDSs for a biocide and a microbicide is summarized in Table 4-1.These concentrated products are substantially diluted prior to injection into thesubsurface. Typical dilution in the make-up water is 0.1 to 0.2 gallons of microbicide in1,000 gallons of water (Halliburton, Inc., Virginia Site Visit, 2001; Schlumberger, Ltd.,2001).
EPA 816-R-04-003 Chapter 4Hydraulic Fracturing Fluids
Evaluation of Impacts to Underground Sources June 2004of Drinking Water by Hydraulic Fracturing ofCoalbed Methane Reservoirs 4-8
Fluid-Loss Additives
Fluid-loss additives restrict leakoff of the fracturing fluid into the exposed rock at thefracture face. Because the additives prevent excessive leakoff, fracturing fluideffectiveness and integrity are maintained. Fluid-loss additives of the past and presentinclude bridging materials such as 100 mesh sand, 100 mesh soluble resin, and silicaflour, or plastering materials such as starch blends, talc silica flour, and clay (Ely, 1985).
Friction Reducers
To optimize the fracturing process, water-based fluids must be pumped at maximum ratesand fluids must be injected at maximum pressures. Increasing flow velocities andpressures in this manner can lead to undesirable levels of friction within the injection welland the fracture itself. In order to minimize friction, friction reducers are added to water-based fracturing fluids. The friction reducers are typically latex polymers or copolymersof acrylamides. They are added to slick water treatments (water with solvent) atconcentrations of 0.25 to 2.0 pounds per 1,000 gallons (Ely, 1985). Some examples offriction reducers are oil-soluble anionic liquid, cationic polyacrilate liquid, and cationicfriction reducer (Messina, Inc. Web site, 2001).
Acid Corrosion Inhibitors
Corrosion inhibitors are required in acid fluid mixtures because acids will corrode steeltubing, well casings, tools, and tanks. The solvent acetone is a common additive incorrosion inhibitors (GRI, 1996). Information from MSDSs for acid inhibitors issummarized in Table 4-1. These products can affect the liver, kidney, heart, centralnervous system, and lungs. They are quite hazardous in their undiluted form. Theseproducts are diluted to a concentration of 1 gallon per 1,000 gallons of make-up waterand acid mixture (Halliburton, Inc., Virginia Site Visit, 2001; Schlumberger, Ltd., 2001).Acids and acid corrosion inhibitors are used in very small quantities in coalbed methanefracturing operations (500 to 2,000 gallons per treatment).
4.2.6 Proppants
The purpose of a proppant is to prop open a hydraulic fracture. An ideal proppant shouldproduce maximum permeability in a fracture. Fracture permeability is a function ofproppant grain roundness, proppant purity, and crush strength. Larger proppant volumesallow for wider fractures, which facilitate more rapid flowback to the production well.Over a period of 30 minutes, 4,500 to 15,000 gallons of fracturing fluid will typicallytransport and place approximately 11,000 to 25,000 pounds of proppant into the fracture(Powell et al., 1999).

EPA 816-R-04-003 Chapter 4Hydraulic Fracturing Fluids
Evaluation of Impacts to Underground Sources June 2004of Drinking Water by Hydraulic Fracturing ofCoalbed Methane Reservoirs 4-9

EPA 816-R-04-003 Chapter 4Hydraulic Fracturing Fluids
Evaluation of Impacts to Underground Sources June 2004of Drinking Water by Hydraulic Fracturing ofCoalbed Methane Reservoirs 4-10

EPA 816-R-04-003 Chapter 4 Hydraulic Fracturing Fluids
Evaluation of Impacts to Underground Sources June 2004of Drinking Water by Hydraulic Fracturing ofCoalbed Methane Reservoirs 4-11
4.3 The Fate and Transport of Stimulation Fluids Injected into Coal andSurrounding Rock During Hydraulic Fracturing of Coalbed MethaneReservoirs (with a Special Focus on Diesel Fuel)
Diesel fuel is sometimes a component of gelled fluids. Diesel fuel contains constituents ofpotential concern regulated under SDWA – benzene, toluene, ethylbenzene, and xylenes(i.e., BTEX compounds). The use of diesel fuel in fracturing fluids poses the greatestthreat to USDWs because BTEX compounds in diesel fuel exceed the MCL at the point-of-injection (i.e. the subsurface location where fracturing fluids are initially injected).
The remainder of this section presents EPA’s qualitative evaluation of the fate andtransport of fracturing fluids injected into targeted coal layers in the subsurface duringhydraulic fracturing. Although EPA’s MOA with the three major service companies haslargely eliminated diesel fuel from fracturing fluids injected directly into any USDWs,there may still be rare instances in which diesel fuel is used by other service companies oroperators (USEPA, 2003). Therefore an evaluation of the use of diesel fuel in fracturingfluid, which also provides follow-up on the draft of this report published in August, 2002,is included in this chapter.
EPA revised its procedure for assessing the potential effects of fracturing fluid constituentson USDWs from the procedure presented in the August 2002 draft of this report as follows:
• EPA has revised the fraction of BTEX compounds in diesel used to estimate thepoint-of-injection concentrations from a single value to a documented broaderrange of values for the fraction of BTEX in diesel fuel. For example, thefraction of benzene in diesel was revised from 0.00006gbenzene/gdiesel to a rangewith a minimum value of 0.000026 gbenzene/gdiesel and a maximum value of 0.001gbenzene/gdiesel. If the maximum value for benzene in diesel is used to estimatethe concentration of benzene at the point-of-injection, the resulting estimate is17 times higher than that presented in the Draft Report.
• In this report, EPA used more current values for two of the parameters used toestimate the point-of-injection concentrations of BTEX compounds.Specifically, the estimates in this report use a density of the diesel fuel-gelmixture of 0.87 g/mL compared to 0.84 g/mL in the Draft Report, and a fractionof diesel fuel in gel of 0.60 gdiesel/ggel compared to 0.52 gdiesel/ggel in the DraftReport. The use of these more current values does not affect the order ofmagnitude of the revised point-of-injection calculations.
• The August 2002 Draft Report included estimates of the concentration ofbenzene at an idealized, hypothetical edge of the fracture zone located 100 feetfrom the point-of-injection. Based on new information and stakeholder input,EPA concluded that the edge of fracture zone calculation is not an appropriatemodel for reasons including:

EPA 816-R-04-003 Chapter 4 Hydraulic Fracturing Fluids
Evaluation of Impacts to Underground Sources June 2004of Drinking Water by Hydraulic Fracturing ofCoalbed Methane Reservoirs 4-12
- Mined-through studies reviewed by EPA indicated that hydraulicfracturing injection fluids had traveled several hundred feet beyond thepoint-of-injection.
- The assumption of well-mixed concentrations within the idealizedfracture zone is insufficient. One mined-through study indicated anobserved concentration of gel in a fracture that was 15 times the injectedconcentration, with gel found to be hanging in stringy clumps in manyfractures. The variability in gel distribution in hydraulic fracturesindicates that the gel constituents are unlikely to be well mixed ingroundwater.
- Based on more extensive review of the literature, the width of a typicalfracture was estimated to be much thinner than that used in the DraftReport (0.1 inch versus 2 inches). The impact of the reduced width of atypical fracture is that the calculated volume of fluid that can fit within afracture is less. After an initial volume calculation using the new width,EPA found that the volume of the space within the fracture area may nothold the volume of fluid pumped into the ground during a typicalfracturing event. Therefore, EPA assumes that a greater volume offracturing fluid must “leakoff” to intersecting smaller fractures thanwhat was assumed in the Draft Report, or that fluid may move beyondthe idealized, hypothetical “edge of fracture zone.” This assumption issupported by field observations in mined-through studies, which indicatethat fracturing fluids often take a stair-step transport path through thenatural fracture system.
• In the Draft Report, EPA approximated the edge of fracture zone concentrationsconsidering only dilution. Based on new information and stakeholder input onthe Draft Report, EPA does not provide estimates of concentrations beyond thepoint-of-injection in the final report. Developing such concentration valueswith the precision required to compare them to MCLs would require thecollection of significant amounts of site-specific data. This data in turn wouldbe used to perform a formal risk assessment, considering numerous fate andtransport scenarios. These activities are beyond the scope of this Phase I study.
The remainder of this section includes a discussion of the following components of EPA’sanalysis:
• The concentrations of BTEX at the point-of-injection.
• The percentage of fracturing fluids recovered during the recovery process.
• The influence of the capture zone.

EPA 816-R-04-003 Chapter 4 Hydraulic Fracturing Fluids
Evaluation of Impacts to Underground Sources June 2004of Drinking Water by Hydraulic Fracturing ofCoalbed Methane Reservoirs 4-13
• Factors that would increase or decrease the concentrations of BTEX remainingin the subsurface.
The first step in EPA’s analysis of the potential threat to USDWs from the injection offracturing fluids was calculating the point-of-injection concentrations of BTEX introducedfrom diesel fuel in the gelling agent. In Step 2, EPA considered factors that affect thedegree to which hydraulic fracturing fluids are recovered. Steps 3, 4, and 5 provideanalyses of physical/chemical, hydrogeological, and biological processes that could affectthe fate and transport of hazardous chemicals introduced into coal seams. These steps aresummarized in Table 4-2.
4.3.1 Point-of-Injection Calculation
The formulations or “recipes” for fracturing fluids differ among service companies andamong sites; the amount of fracturing fluid used will also vary. Thus, a range of point-of-injection concentrations likely exists. According to field paperwork obtained during EPA’ssite visits (Consolidated Industrial Services, Inc., 2001; Halliburton, 2001) and informationprovided by three service company scientists (BJ Services, 2001; Halliburton, 2001;Schlumberger, Ltd., 2001), between 4 and 10 gallons of diesel-containing gelling agent areadded to each 1,000 gallons of water used in hydraulic fracturing, when diesel is used. Inaddition, the fraction of BTEX in diesel may range by up to two orders of magnitude(Potter and Simmons, 1998). The lower and upper ranges of the values presented in Potterand Simmons (1998), as well as the three different values cited for gelling agent, were usedto estimate point-of-injection concentrations for each of three fracturing fluid recipes (i.e.,the ratio of fracturing gel to water). The resulting 24 point-of-injection calculations areprovided in Table 4-2. These estimates provide the basis for a qualitative assessmentregarding whether a Phase II study is warranted.
The following example illustrates how EPA estimated the concentrations of BTEX at thepoint-of-injection. Due to the variations in the recipe used by service companies, EPA’sanalysis begins with three different possible scenarios, as follows:
• Low ratio: 4 gallons of gel per 1,000 gallons of water
• Medium ratio: 6 gallons of gel per 1,000 gallons of water
• High ratio: 10 gallons of gel per 1,000 gallons of water

EPA 816-R-04-003 Chapter 4 Hydraulic Fracturing Fluids
Evaluation of Impacts to Underground Sources June 2004of Drinking Water by Hydraulic Fracturing ofCoalbed Methane Reservoirs 4-14
The concentration of benzene in fracturing fluid at the point-of-injection ([benzene]inj) canbe calculated using the following equation:
[benzene]inj = (rgw) x (ρdg) x (fdg) x (fbd) x (3,785 mLgel/galgel) x (1 galwater/3.785 Lwater) x (106 Fg/g)
Where:
rgw = the ratio of diesel fuel-gel mixture to injection water (galgel/1,000 galwater)(4 galgel/1,000galwater, 6galgel/1,000 galwater, and 10 galgel/1,000 galwater represent the low, medium,and high ratios, respectively)
ρdg = the density of the diesel fuel-gel mixture (ggel/mLgel) = 0.84 ggel/mLgel (Halliburton, 2002)
fdg = the fraction of diesel fuel in the gel (gdiesel/ggel) = 0.52 gdiesel/ggel (Halliburton, 2002)
fbd = the fraction of benzene in diesel fuel (gbenzene/gdiesel) = 0.000026 to 0.001 gbenzene/gdiesel (Potter andSimmons, 1998)
3,785 mLgel/galgel = volume conversion factor
1 galwater/3.785 Lwater = volume conversion factor
106 Fg/g = mass conversion factor
The concentration of benzene at the point-of-injection is calculated for the three gel/waterratios and the minimum and maximum concentrations of benzene in diesel fuel.
Using rgw = 4 galgel/1,000galwater and fbd = 0.000026 gbenzene/gdiesel as an example,[benzene]inj is calculated as follows:
[benzene]inj = (4 galgel/1,000galwater) x (0.84 ggel/mLgel) x (0.52 gdiesel/ggel) x(0.000026 gbenzene/gdiesel) x (3,785 mLgel/galgel) x (1 galwater/3.785 Lwater) x (1,000 mL/L) x (106 Fg/g) = 45 Fg/L
Table 4-2 summarizes the estimated injection concentrations of each BTEX constituent forthe three assumed gel/water ratios and the minimum and maximum concentrations ofBTEX in diesel fuel. It also presents the MCL for each compound. Many of the estimatedconcentrations of BTEX exceed the MCL at the point-of-injection.
Table 4-2 and the remainder of this section provide a qualitative assessment of the fate andtransport processes that could attenuate the concentrations of BTEX in groundwater.Factors that would influence the availability of constituents of potential concern infracturing fluids and decrease their concentrations include:
• Fluid Recovery - much of the fluid is eventually pumped back to the surface.
• Adsorption and entrapment - some of these constituents will undergo adsorptionto the coal or become entrapped in the formation.

EPA 816-R-04-003 Chapter 4 Hydraulic Fracturing Fluids
Evaluation of Impacts to Underground Sources June 2004of Drinking Water by Hydraulic Fracturing ofCoalbed Methane Reservoirs 4-15
• Biodegradation - some fracturing fluid constituents, such as benzene, mayundergo partial biodegradation.
4.3.2 Fracturing Fluid Recovery
Following the injection of fracturing fluids into the subsurface through coalbed methanewells (i.e., production wells), considerable amounts of the fracturing fluids are removed.During the recovery process, the injected fluids and ambient groundwater are pumped outof the formation through the production well to reduce formation pressure, enablingmethane desorption and extraction. Palmer et al. (1991a) found that 61 percent offracturing fluids were recovered based on samples collected from coalbed methane wellsover a 19-day period. Their study predicted total recovery to be between 68 and 82percent.
Palmer et al. (1991a) also discussed the possibility that a “check-valve effect” could trapsome of the fracturing fluid on one side (i.e., upgradient, during production) of a collapsedor narrowed fracture, preventing the fluid from flowing back to the production well. Thischeck-valve effect can occur in both natural and induced fractures when the fracturesnarrow again after the injection of fracturing fluid ceases, formation pressure decreases,and extraction of methane and groundwater begins.
Another factor preventing full recovery of injected fluids is the high injection pressure usedduring hydraulic fracturing operations. Fracturing fluids are forced into the subsurfaceunder high pressure to enlarge and propagate existing fractures. The hydraulic gradientsthat cause fluids to flow away from the well during injection are much greater than thehydraulic gradients that occur during fluid recovery. As a result, some of the fracturingfluids will travel beyond the capture zone of the production well. The capture zone of aproduction well is the portion of the aquifer that contributes water to the well. The size ofthis zone will be affected by regional groundwater gradients, and by the drawdown causedby the well (USEPA, 1987). Fluids that flow beyond the capture zone of the productionwell generally are not recovered during the flowback process.
Gel contained in fracturing fluids may be unrecovered because its properties differ fromthat of water and highly soluble constituents of fracturing fluids. One mined-through studyreviewed by EPA described evidence of gel clumps within many fractures (Steidl, 1993).One observed concentration of gel in a fracture was 15 times the injected concentration.When the fluids exist as undissolved gel, they may remain attached to the sides of thefractures or be trapped within smaller fractures or pores present in formations that surroundthe coalbed. The mined-through studies suggest that such fluids are unlikely to flow withgroundwater during production, but they may present a source of gel constituents toflowing groundwater subsequent to fluid recovery. Fate and transport processes discussedlater in this section can serve to reduce gel constituent concentrations that may result fromtrapped fluids. Mechanisms that may affect the recovery of fracturing fluids are discussedin section 3.3.2 of Chapter 3.

EPA 816-R-04-003 Chapter 4 Hydraulic Fracturing Fluids
Evaluation of Impacts to Underground Sources June 2004of Drinking Water by Hydraulic Fracturing ofCoalbed Methane Reservoirs 4-16
4.3.3 The Influence of the Capture Zone
The recovery process typically lasts approximately 10-20 years. During that time,groundwater within the production well’s capture zone flows toward the production well.Assuming complete mixing, the predicted recovery of injected BTEX is between 68 and 82percent (Palmer et al., 1991a). Thus, between 20 and 30 percent of the BTEX injected isexpected to remain in the formation. It is reasonable to expect that most of the unrecoveredfluid lies outside the capture zone and that the residual concentrations of BTEX within thecapture zone are substantially less than the injection concentrations. Chemicals such asBTEX that are not recovered from within the capture zone during groundwater productionmay be diluted by groundwater that flows into the formation to replace production water.Additional attenuation from sorption and biodegradation may occur. Subsequent toproduction, dispersion and diffusion may serve to reduce residual BTEX concentrations.The fracturing fluids that flow beyond the capture zone are affected by regionalgroundwater flow and may be diluted by groundwater.
4.3.4 Fate and Transport Considerations
BTEX that has moved beyond the production well’s capture zone is of the greatest concern.The fate and transport mechanisms that may affect BTEX concentrations beyond thecapture zone are evaluated in this section. Factors that would likely decrease exposureconcentrations and/or availability of BTEX include attenuation through groundwater flowdynamics, biological processes, and adsorption.
BTEX outside of the capture zone will likely be transported by groundwater flowingaccording to regional hydraulic gradients. This flow and transport are not influenced byproduction pumping. Nevertheless, mechanical dispersion will cause BTEX to spreadhorizontally and vertically in the aquifer, thereby reducing the concentrations. The degreeof mechanical dispersion depends in part on the velocity of flow and increases withincreased travel distance. Dilution can have a significant effect on the BTEXconcentrations that could migrate to drinking water wells, especially if these wells arehundreds to thousands of feet from a hydraulically induced fracture. The process ofmolecular diffusion (i.e., the movement of BTEX from areas of higher to lowerconcentration due to the concentration differences) will further reduce BTEXconcentrations. Collectively, mechanical dispersion and molecular diffusion are referred toas hydrodynamic dispersion (Fetter, 1994).
The biodegradation of diesel fuel constituents, including BTEX, has been studied in othergeologic settings and laboratory studies and may lead to reductions in concentrations incoalbeds given the appropriate site conditions. No information was found about theoccurrence of biodegradation or biodegradation rates of BTEX in coalbeds or surroundingrock. In order for biodegradation to occur, organisms capable of using BTEX as a foodsource must be present and conditions such as favorable pH, salinity, and sometimes theavailability of oxygen, nitrogen, and phosphorous must be met to ensure bacterial survival.Generally, substantial benzene degradation occurs in aerobic environments. The levels ofoxygen in a particular formation vary widely depending primarily on the depth of coalbeds

EPA 816-R-04-003 Chapter 4 Hydraulic Fracturing Fluids
Evaluation of Impacts to Underground Sources June 2004of Drinking Water by Hydraulic Fracturing ofCoalbed Methane Reservoirs 4-17
from the surface. Data regarding biodegradation of benzene in an anaerobic environmentindicates a range from no degradation to relatively slow degradation (USEPA, 1999).
As groundwater flows through a formation, chemicals such as BTEX may be retarded byadsorption. Although adsorption in coalbeds is likely, quantification of adsorption isdifficult in the absence of laboratory or site-specific studies (due to competition foradsorption between BTEX and more lipophilic and less soluble constituents of diesel fueland coal, and fracture thickness). Other processes, such as desorption of BTEX from thecoal surface, and dissolution of BTEX from the gel phase may play a role in BTEXtransport. Entrapment of gel in pore spaces and fractures may also influence the degree towhich BTEX is available to groundwater. In some cases, the gel may be entrapped in sucha way that it is neither available to flow back towards the production well nor flow towardsa USDW in response to regional groundwater gradients.
According to the information listed on MSDSs provided to EPA, several of the constituentsof potential concern listed in Table 4-1 can have toxic effects when people are exposed tosufficiently high concentrations through the susceptible route(s) of exposure (i.e.,inhalation, ingestion, skin contact). However, only the BTEX compounds originating fromdiesel fuel are regulated under SDWA. None of the other constituents in Table 4-1 appearon the Agency's draft Contaminant Candidate List (CCL). The drinking water CCL is theprimary source of priority contaminants for evaluation by EPA’s drinking water program.Contaminants on the CCL are known or anticipated to occur in public water systems andmay require regulations under SDWA. Information on the GSA study is available athttp://www.epa.gov/fedrgstr/EPA-WATER/2004/April/Day-02/w7416.htm.
Further, EPA does not believe that the other Table 4-1 constituents potentially contained infracturing fluids are introduced through coalbed methane fracturing in concentrations highenough to pose a significant threat to USDWs. First, it is EPA’s understanding, based onconversations with field engineers and on witnessing three separate fracturing events, thatfracturing fluids used for coalbed methane fracturing do not contain most of theconstituents listed in Table 4-1. Second, if the Table 4-1 constituents were used, EPAbelieves some of the same hydrodynamic phenomena listed in steps 2 and 4 (flowback,dilution and dispersion), step 3 (adsorption and entrapment), and potentially step 5(biodegradation) would minimize the possibility that chemicals included in the fracturingfluids would adversely affect USDWs.

EPA 816-R-04-003 Chapter 4 Hydraulic Fracturing Fluids
Evaluation of Impacts to Underground Sources June 2004of Drinking Water by Hydraulic Fracturing ofCoalbed Methane Reservoirs 4-18

EPA 816-R-04-003 Chapter 4Hydraulic Fracturing Fluids
Evaluation of Impacts to Underground Sources June 2004of Drinking Water by Hydraulic Fracturing ofCoalbed Methane Reservoirs 4-19
4.4 Summary
Fracture engineers select fracturing fluids based on site-specific characteristics includingformation geology, field production characteristics, and economics. Hydraulic fracturingoperations vary widely in the types of fracturing fluids used, the volumes of fluidrequired, and the pump rates at which they are injected. Based on the information EPAcollected, water or nitrogen foam frequently constitutes the solute in fracturing fluidsused for coalbed methane stimulation. Other components of fracturing fluids used tostimulate coalbed methane wells may contain only benign ingredients, but in some cases,they contain constituents such as diesel fuel that can be hazardous in their undilutedforms. Fracturing fluids are significantly diluted prior to injection.
Water with a simple sand proppant can be adequate to achieve a desired fracture at somesites. In some cases, water must be thickened to achieve higher proppant transportcapabilities. Thickening can be achieved by using linear or cross-linked gelling agents.Cross-linkers are costly additives compared to simple linear gels, but a fluid’s fracturingefficiency can be greatly improved using cross-linkers. Foam fracturing fluids can beused to considerably reduce the amount of injected fluid required. The reduced watervolume requirement translates into a space and cost savings at the treatment site becausefewer water tanks are needed. Foam fracturing fluids also promote rapid flowback andreduced volumes of flowback water requiring disposal.
The use of diesel fuel in fracturing fluids poses the greatest potential threat to USDWsbecause the BTEX constituents in diesel fuel exceed the MCL at the point-of-injection.Given the concerns with the use of diesel fuel, EPA recently entered into agreements withthree major service companies to eliminate diesel fuel from hydraulic fracturing fluidsinjected directly into USDWs to stimulate coalbed methane production. Industryrepresentatives estimate that these three companies perform approximately 95 percent ofthe hydraulic fracturing projects in the United States.
In situations when diesel fuel is used in fracturing fluids, a number of factors woulddecrease the concentration and/or availability of BTEX. These factors include fluidrecovery during flowback, adsorption, dilution and dispersion, and potentiallybiodegradation of constituents. For example, Palmer et al. (1991a) documented that onlyabout one-third of fracturing fluid that is injected is expected to remain in the formation.EPA expects fate and transport considerations would minimize the possibility thatchemicals included in fracturing fluids would adversely affect USDWs.

EPA 816-R-04-003 Chapter 4Hydraulic Fracturing Fluids
Evaluation of Impacts to Underground Sources June 2004of Drinking Water by Hydraulic Fracturing ofCoalbed Methane Reservoirs 4-20
Figures 4-1 and 4-2.Liquid nitrogen tankertrucks transport gas to thesite for nitrogen foamfracturing. Nitrogen willtravel through pipes to bemixed with water and afoaming agent at thewellhead prior toinjection. The foam isused to create andpropagate the fracturedeep within the targetedcoal seam.

EPA 816-R-04-003 Chapter 4Hydraulic Fracturing Fluids
Evaluation of Impacts to Underground Sources June 2004of Drinking Water by Hydraulic Fracturing ofCoalbed Methane Reservoirs 4-21
Figures 4-3 and 4-4.Chemicals are stored on site in a support truck. Fracturing fluid additives suchas the foaming agent can be pumped directly from storage containers to mixtanks.

EPA 816-R-04-003 Chapter 4Hydraulic Fracturing Fluids
Evaluation of Impacts to Underground Sources June 2004of Drinking Water by Hydraulic Fracturing ofCoalbed Methane Reservoirs 4-22
Figure 4-5.The fracturing fluid (water with additives) is stored on site in large, upright storage tanks.Each tank contains mix water imported from off-site, or formation water extracted directlyfrom the gas well.
Figure 4-6.Gelled water is pre-mixed in a truck-mounted mixing tank. Photograph shows a batch oflinear, guar-based gel. This gel is used to transport the sand proppant into the fracturepropagated by the nitrogen foam treatment.

EPA 816-R-04-003 Chapter 4Hydraulic Fracturing Fluids
Evaluation of Impacts to Underground Sources June 2004of Drinking Water by Hydraulic Fracturing ofCoalbed Methane Reservoirs 4-23
Figure 4-7.The fracturing fluids, additives, and proppant are pumped to the wellhead and mixedjust prior to injection. The flow rate of each injected component is monitoredcarefully from an on-site control center.

EPA 816-R-04-003 Chapter 4Hydraulic Fracturing Fluids
Evaluation of Impacts to Underground Sources June 2004of Drinking Water by Hydraulic Fracturing ofCoalbed Methane Reservoirs 4-24
Figures 4-8 and 4-9.Electronic monitoring systems provide constant feedback to the service company’s operators.Fluid flow rates and pressure buildup within the formation are monitored to ensure that fracturegrowth is safe and controlled.

EPA 816-R-04-003 Chapter 4Hydraulic Fracturing Fluids
Evaluation of Impacts to Underground Sources June 2004of Drinking Water by Hydraulic Fracturing ofCoalbed Methane Reservoirs 4-25

EPA 816-R-04-003 Chapter 4Hydraulic Fracturing Fluids
Evaluation of Impacts to Underground Sources June 2004of Drinking Water by Hydraulic Fracturing ofCoalbed Methane Reservoirs 4-26
Figures 4-10 and 4-11.Fluid that is extractedfrom the well issprayed through adiffuser and stored in alined trench until it isdisposed of off-site ordischarged.

EPA 816-R-04-003 Chapter 5Summary of Coalbed Methane Descriptions
Evaluation of Impacts to Underground Sources June 2004of Drinking Water by Hydraulic Fracturing ofCoalbed Methane Reservoirs 5-1
Chapter 5Summary of Coalbed Methane Basin Descriptions
As part of the Phase I study EPA conducted an extensive literature review to collect informationregarding the major coal basins in the United States. Eleven major coal basins were identified inthe United States and are shown in Figure 5-1 at the end of the chapter (those basins shaded inred have the highest coalbed methane production volumes). The goals of this review were toassess the following for each of the 11 major coal basins:
• The physical relationship between the coalbeds and the USDWs.
• Whether hydraulic fracturing is or has been used to stimulate coalbed methane wellsin production basins.
• The types of fluids used to create the fractures.
• If possible, whether the potential for contaminants to enter a USDW exists.
This information is necessary to evaluate whether hydraulic fracturing is practiced within a basinand the types of fluids used in the fracturing process. More importantly, this informationestablishes whether the coal formations lie within a USDW, creating the potential for hydraulicfracturing fluid injection to threaten USDWs. A USDW is not necessarily currently used fordrinking water and may contain groundwater unsuitable for drinking without treatment. In somecases, very little information was uncovered by EPA regarding certain topics for some of thebasins.
Each of the 11 major basins is described in this chapter and in Table 5-1 (immediately followingsection 5.12 of this chapter). In addition, a more comprehensive description of the geology,hydrology, and coalbed methane production activity for each basin is provided in Attachments 1through 11 of this report.
5.1 The San Juan Basin
The San Juan Basin covers an area of about 7,500 square miles straddling the Colorado-NewMexico state line in the Four Corners region (Figure 5-1). It measures roughly 100 miles longnorth to south and 90 miles wide. The Continental Divide trends north to south along the eastside of the basin.
The major coal-bearing unit in the San Juan Basin is known as the Fruitland Formation. Coalbedmethane production occurs primarily in coals of the Fruitland Formation, but some coalbedmethane is trapped in the underlying and adjacent Pictured Cliffs sandstone. Many wells arecompleted in both zones. The coals of the Fruitland Formation are very thick compared to

EPA 816-R-04-003 Chapter 5Summary of Coalbed Methane Descriptions
Evaluation of Impacts to Underground Sources June 2004of Drinking Water by Hydraulic Fracturing ofCoalbed Methane Reservoirs 5-2
coalbeds in eastern basins: the thickest coals range from 20 to over 40 feet. Total net thicknessof all coalbeds ranges from 20 to over 80 feet throughout the San Juan Basin, compared to 5 to15 feet in eastern basins.
Coalbed methane wells in the San Juan Basin range from 550 to 4,000 feet in depth, and about2,550 wells were operating in 2001 (Colorado Oil and Gas Conservation Commission and NewMexico Oil Conservation Division, 2001). The San Juan Basin is the most productive coalbedmethane basin in North America. In 1996, coalbed methane production there averaged about800 thousand cubic feet per day per well and totaled over 800 billion cubic feet (Bcf) for thatyear (Stevens et al., 1996). This total rose to 925 Bcf in 2000 (GTI, 2002)).
The majority of coalbed methane development and hydraulic fracturing in the northernportion of the San Juan Basin takes place within a USDW. The waters in parts of the FruitlandFormation usually contain less than 10,000 mg/L TDS, which is the water quality criterion for aUSDW. In the northern half of the formation, most waters contain less than 3,000 mg/L, andwells near the outcrop produce water that contains less than 500 mg/L TDS.
Fracturing fluids used in the San Juan Basin include hydrochloric acid; slick water (water mixedwith solvent); linear and crosslinked gels; and, since 1992, nitrogen- or carbon dioxide-basedfoams (Harper et al., 1985; Jeu et al., 1988; Holditch et al., 1988; Palmer et al., 1993b; Choate etal., 1993). Data are not readily available concerning fracture growth and height within theFruitland Formation.
5.2 The Black Warrior Basin
The Black Warrior Basin is the southernmost of the three basins that compose the AppalachianCoal Region of the eastern United States. The basin covers about 23,000 square miles inAlabama and Mississippi. It is approximately 230 miles long from west to east andapproximately 188 miles wide from north to south (Figure 5-1). Basin coalbed methaneproduction is limited to the bituminous coalfields of west-central Alabama, primarily in Jeffersonand Tuscaloosa Counties.
Coalbed methane production in the Black Warrior Basin is confined to the Pennsylvanian-agedPottsville Formation. The ancient coastline of prehistoric Alabama was characterized by 8 to 10“coal-deposition cycles” of rising and falling sea levels. Each cycle features mudstone at thebase of the cycle (deeper water) and coalbeds at the top (emergence). Most coalbed methanewells tap the Black Creek/Mary Lee/Pratt cycles and range from 350 to 2,500 feet deep(Holditch, 1990).
Coalbed methane production in the Black Warrior Basin is among the highest in the UnitedStates. In 1996, about 5,000 coalbed methane wells were permitted in Alabama. In 2000, thisnumber increased to over 5,800 wells (Alabama Oil and Gas Board, 2002). Coalbed methanewells have production rates that range from less than 20 to more than 1 million cubic feet (Mcf)per day per well (Alabama Oil and Gas Board, 2002). Between 1980 and 2000, coalbed methane

EPA 816-R-04-003 Chapter 5Summary of Coalbed Methane Descriptions
Evaluation of Impacts to Underground Sources June 2004of Drinking Water by Hydraulic Fracturing ofCoalbed Methane Reservoirs 5-3
wells in Alabama produced roughly 1.2 trillion cubic feet (Tcf) of gas. According to GTI,annual gas production was 112 Bcf in 2000 (GTI, 2002).
Some portions of the Pottsville Formation contain waters that meet the quality criterion of lessthan 10,000 mg/L TDS for a USDW. According to the Alabama Oil and Gas Board, somewaters in the Pottsville Formation do not meet the definition of a USDW and have TDS levelsconsiderably higher than 10,000 mg/L.
Early literature indicates that most of the wells in production in the early 1990s have beenhydraulically fractured an average of two to six times to achieve acceptable production rates(Holditch et al., 1988; Holditch, 1990; Palmer et al., 1993a and 1993b).
5.3 The Piceance Basin
The Piceance Coal Basin is entirely within the northwest corner of the Colorado (Figure 5-1).The coalbed methane reservoirs are found in the Upper Cretaceous Mesaverde Group, whichcovers about 7,225 square miles of the basin.
The Mesaverde Group ranges in thickness from about 2,000 feet on the west to about 6,500 feeton the east side of the basin (Johnson, 1989). The depth to the methane-bearing Cameo-Wheeler-Fairfield coal zone is about 6,000 feet. Two-thirds of the coalbed methane occurs incoals deeper than 5,000 feet, and the Piceance Basin is one of the deepest coalbed methane areasin the United States (Quarterly Review, August 1993).
The depth of the coals in the Piceance Basin inhibits permeability, making it difficult to extractthe coalbed methane. This, in turn, has slowed coalbed methane development in the basin.However, it is estimated that 80 trillion to 136 Tcf of coalbed methane are contained in theCameo-Wheeler-Fairfield coal zone of the basin (Tyler et al., 1998). Total coalbed methaneproduction was 1.2 Bcf in 2000 (GTI, 2002).
The Piceance Basin contains both alluvial and bedrock aquifers. Unconsolidated alluvialaquifers (narrow and thin deposits of sand and gravel formed primarily along stream courses) arethe most productive aquifers in the Piceance Basin. The bedrock aquifers are known as theupper and lower Piceance Basin aquifer systems. The upper aquifer system is about 700 feetthick, and the lower aquifer system is about 900 feet thick. Water at depth in the Piceance Basinappears to be of poor quality, minimizing its chance of being designated a USDW. In general,the potable water wells in the Piceance Basin extend no further than 200 feet in depth, based onwell records maintained by the Colorado Division of Water Resources. A composite waterquality sample taken from 4,637 to 5,430 feet deep in the Cameo coal zone exhibited a TDSlevel of 15,500 mg/L (Graham, 2001).
Hydraulic fracturing is practiced in this basin. A variety of fluids are used for fracturing,including water with sand proppant and gelled water and sand. In some cases, hydraulic

EPA 816-R-04-003 Chapter 5Summary of Coalbed Methane Descriptions
Evaluation of Impacts to Underground Sources June 2004of Drinking Water by Hydraulic Fracturing ofCoalbed Methane Reservoirs 5-4
stimulations created multiple short (100-foot), fractures around the wells (Quarterly Review,August 1993).
It is unlikely that any USDWs and coals targeted for methane production (generally currentlylocated at great depth, such as 4,000 feet below the ground surface and deeper) would coincide inthis basin. The thousands of feet of stratigraphic separation between the coal gas bearing CameoZone and the lower aquifer system in the Green River Formation should prevent any of theeffects from the hydrofracturing of gas-bearing strata from reaching either the upper or the lowerbedrock aquifers.
Research suggests that exploration may target areas where groundwater circulation may enhancegas accumulation in the coal and associated sandstones (Tyler et al., 1998). Under theseexploration and development conditions, a USDW located in shallower Cretaceous rocks nearthe margins of the basin could be affected by hydraulic fracturing. The depth of methane-bearing coals (about 6,000 feet) seems to indicate that, in the Piceance Basin, the chances ofcontaminating any overlying, shallower USDWs (no deeper than about 1,000 feet) from injectionof hydraulic fracturing fluids and subsequent subsurface fluid transport are minimal. Thecoalbed methane producing Cameo Zone and the deepest known aquifer, the lower bedrockaquifer, have a stratigraphic separation of over 6,000 feet.
5.4 The Uinta Basin
The Uinta Coal Basin is mostly within eastern Utah; a very small portion of the basin is innorthwestern Colorado (Figure 5-1). The basin covers approximately 14,450 square miles(Quarterly Review, August 1993). The Uinta Basin is stratigraphically continuous with thePiceance Basin of Colorado, but is structurally separated from it by the Douglas Creek Arch, anuplift near the Utah – Colorado state line.
Coal seams occur in the Cretaceous Mancos Shale and the Upper Cretaceous Mesaverde Group(Quarterly Review, 1993). Two major formations targeted for coalbed methane exploration arethe Mancos Shale’s Ferron Sandstone Member, which include the coals most targeted(approximately 90 percent of the time) for exploration (Petzet, 1996) and the Mesaverde Group’sBlackhawk Formation, which contains about 14 coal zones (Petzet, 1996). The Ferron Coals areinterbedded with sandstone and form a wedge of clastic sediment 150 to 750 feet thick. Depthsto coal in the Ferron Sandstone range from 1,000 to over 7,000 feet below ground surface(Garrison et al., 1997). The Blackhawk Formation consists of coal seams interbedded withsandstone and a combination of shale and siltstone. Coals tapped in the Blackhawk Formationare 4,200 to 4,400 feet below the surface (Gloyn and Sommer, 1993).
Full-scale exploration in the Uinta Basin began in the 1990s (Quarterly Review, 1993). Thedatabase covering the Uinta Basin indicates that there are about 1,255 coalbed methane wells inproduction in the basin (Osborne, 2002). The coalbed methane potential of the Uinta Basin,revised by the Utah Geological Survey in the early 1990s, has been estimated to be between 8trillion and more than 10 Tcf (Gloyn and Sommer, 1993).

EPA 816-R-04-003 Chapter 5Summary of Coalbed Methane Descriptions
Evaluation of Impacts to Underground Sources June 2004of Drinking Water by Hydraulic Fracturing ofCoalbed Methane Reservoirs 5-5
At some locations, the groundwater in the Ferron Coals and Blackhawk Formations would notqualify as USDWs. According to the Utah Department of Natural Resources (DNR), Division ofOil, Gas and Mining, the water there varies greatly by location, each location having some TDSlevels below and some above 10,000 mg/L (Utah DNR, 2002). In general, the quality ofBlackhawk water is higher than Ferron water. For example, the most recent UIC applicationnoted the combined quality of input water to be approximately 31,000 mg/L TDS for theDrunkards Wash Field (Ferron) and 9,286 mg/L TDS for the Castlegate Field (Blackhawk).
Fracturing fluid use is documented in the literature pertaining to the Uinta Basin. One companyreported performing hydraulic fracturing stimulations using cross-linked borate gel with 250,000pounds of proppant (Quarterly Review, 1993). Others report that they fractured wells with low-residue gel fracturing fluids and foams (Quarterly Review, 1993). GTI places the annual coalbedmethane production in the Uinta Basin at 75.7 Bcf in 2000 (GTI, 2002).
The Blackhawk Formation is underlain by 300 feet of shale and sandstone, which separate itfrom the Castlegate Sandstone aquifer. It is underlain by similar geologic strata, which separateit from the Star Point Sandstone. Only in highly faulted areas is there a reasonable possibilitythat hydraulic fracturing fluids could migrate down to the Star Point Sandstone.
5.5 The Powder River Basin
The Powder River Basin is in northeastern Wyoming and southern Montana (Figure 5-1). Thebasin covers approximately 25,800 square miles (Larsen, 1989), approximately 75 percent ofwhich is in Wyoming. Fifty percent of the Powder River Basin is believed to have the potentialfor coalbed methane production (Powder River Coalbed Methane Information Council, 2000).Annual production volume was estimated at 147 Bcf in 2000 (GTI, 2002). In 2002, wells in thePowder River Basin produced about 823 Mcf per day of coalbed methane (DOE, 2002).
Coalbeds in this region are interspersed at varying depths with sandstones, mudstone,conglomerate, limestone, and shale. The majority of the potentially productive coal zones rangefrom about 450 feet to over 6,500 feet below ground surface (Montgomery, 1999). Theuppermost formation is the Wasatch Formation, extending from land surface to 1,000 feet deep.Most coal seams in the Wasatch Formation are continuous and thin (6 feet or less). The FortUnion Formation lies directly below the Wasatch Formation and can be as much as 6,200 feetthick (Law et al., 1991). The coalbeds in this formation are typically most abundant in the upperportion, called the Tongue River member. This member is typically 1,500 to 1,800 feet thick, ofwhich up to a composite total of 350 feet of coal can be found in various beds. The thickest ofthe individual coalbeds is over 200 feet (Flores and Bader, 1999). Recent estimates of coalbedmethane reserves in the Powder River Basin range from 7 trillion to 40 Tcf (Montgomery, 1999;PRCMIC, 2000).
The Fort Union Formation that supplies municipal water to the City of Gillette is the sameformation that contains the coals that are developed for coalbed methane. The coalbeds containand transmit more water than the sandstones. The sandstones and coalbeds have been used for

EPA 816-R-04-003 Chapter 5Summary of Coalbed Methane Descriptions
Evaluation of Impacts to Underground Sources June 2004of Drinking Water by Hydraulic Fracturing ofCoalbed Methane Reservoirs 5-6
the production of both water and coalbed methane. The water produced from the coalbeds meetsthe quality criterion for USDWs of less than 10,000 mg/L TDS.
EPA’s understanding is that hydraulic fracturing currently is not widely used in this region dueto concerns about the potential for increased groundwater flow into the coalbed methaneproduction wells (due to fracturing of impermeable formations adjacent to the coal, and thecreation of a hydraulic connection to adjacent aquifers) and the collapse of open hole wells incoal upon dewatering. According to the available literature, where hydraulic fracturing has beenused in this basin, it has not been an effective method for extracting methane. Hydraulicfracturing has been done primarily with water, or gelled water and sand, although recorded useof a solution of potassium chloride was identified in the literature.
5.6 The Central Appalachian Basin
The Central Appalachian Coal Basin is the middle of three basins that compose the AppalachianCoal Region of the eastern United States. It includes parts of Kentucky, Tennessee, Virginia,and West Virginia (Figure 5-1) and covers approximately 23,000 square miles. The greatestpotential for methane development is in a small, 3,000-square-mile area in southwest Virginiaand south central West Virginia (Kelafant, et al., 1988).
The coal basin consists of six Pennsylvanian age coal seams (Zebrowitz et al., 1991, and Zuber,1998). These coal seams typically occur as multiple coalbeds or seams that are widelydistributed (Zuber, 1998). The coal seams, from oldest to youngest (West Virginia/Virginianame), are the Pocahontas No. 3, Pocahontas No. 4, Fire Creek/Lower Horsepen, Beckley/WarCreek, Sewell/Lower Seaboard, and Iager/Jawbone (Kelafant et al., 1988). The Pocahontas coalseams include the Squire Jim and Nos. 1 to 7; Nos. 3 and 4 are the thickest and cover the mostarea. Most of the coalbed methane (2.7 Tcf) occurs in the Pocahontas seams (Kelafant et al.,1988). In southwest Virginia and south central West Virginia, target coal seams achieve theirgreatest thickness and occur at depths of about 1,000 to 2,000 feet (Kelafant et al., 1988).
The Nora Field in southwestern Virginia is one of the better-known coalbed methane productionfields. According to the Virginia Division of Gas and Oil, over 700 coalbed methane wells weredrilled in the Nora Field in 2002 (Virginia Division of Gas and Oil, 2002). The VirginiaDivision of Gas and Oil also indicated that, in 2002, more than 1,800 coalbed methane wellswere drilled in southwestern Virginia’s Buchanan County (VA Division of Gas and Oil, 2002.)GTI reported that the entire basin produced 52.9 Bcf of gas in 2000 (GTI, 2002).
Because most of the coal strata dip, a coalbed methane well’s location in the basin maydetermine if hydraulic fracturing during the well’s development will affect the water quality ofsurrounding USDW. For instance, on the northeastern side of the basin, the depth to thePocahontas No. 3 coalbed is less than 500 feet. This depth gradually increases to over 2,000 feetfarther westward across this portion of the basin, in the direction of the dip of the coal seam.Therefore, a well tapping this seam in the eastern portion of the basin may be within a USDW,but a well tapping the seam in the western portion of the basin may be below the base of a

EPA 816-R-04-003 Chapter 5Summary of Coalbed Methane Descriptions
Evaluation of Impacts to Underground Sources June 2004of Drinking Water by Hydraulic Fracturing ofCoalbed Methane Reservoirs 5-7
USDW. In addition, the base of the freshwater is not flat, but rather undulating. These factorsindicate that the relationship between a coalbed and a USDW must be determined on a site-specific basis.
Hydraulic fracturing is a common practice in this region. Foam and water are the fracturingfluids of choice, and sand serves as the proppant. Additives can include hydrochloric acid, scaleinhibitors, and microbicides. Pocahontas Oil & Gas, a subsidiary of Consol Energy, Inc., invitedEPA personnel to a well where a hydraulic fracturing treatment was being performed byHalliburton Energy Services, Inc. Halliburton staff said that typical fractures extend from 300 to600 feet from the well bore in either direction, but that fractures have been known to extend fromas few as 150 feet to as many as 1,500 feet in length (Halliburton Inc., Virginia Site Visit, 2001).According to the fracturing engineer on-site, fracture widths range from one-eighth of an inch toalmost one and one-half inches (Halliburton, Inc., Virginia Site Visit, 2001).
Since some coalbed methane exploration has moved to shallower seams, the Commonwealth ofVirginia has instituted a voluntary program concerning depths at which hydraulic fracturing maybe performed (Virginia Division of Oil and Gas, 2002). The program involves an operator’sdetermination of the elevation of the lowest topographic point and the elevation of the deepestwater well within a 1,500-foot radius of any proposed extraction well (Wilson, 2001). Hydraulicfracturing should occur at least 500 feet beneath than the lower of these two points.
5.7 The Northern Appalachian Basin
The Northern Appalachian Coal Basin is the northernmost of the three basins that make up theAppalachian Coal Region of the eastern United States. It includes parts of Pennsylvania, WestVirginia, Ohio, Kentucky, and Maryland (Figure 5-1). The basin lies completely within theAppalachian Plateau geomorphic province and covers approximately 43,700 square miles(Adams et al., 1984, as cited by Pennsylvania Department of Conservation and NaturalResources, 2002). The Northern Appalachian basin trends northeast to southwest. The RomeTrough, a major graben structure, forms the southeastern and southern structural boundaries.The basin is bounded on the northeast, north, and west by outcropping Pennsylvanian-agedsediments (Kelafant et al., 1988).
The six Pennsylvanian-aged coal zones composing the Northern Appalachian Coal Basin are theBrookville-Clarion, Kittanning, Freeport, Pittsburgh, Sewickley, and Waynesburg. These coalunits are within the Pottsville, Allegheny, and the Monongahela Groups (Kelafant et al., 1988).Coal seam depths range from surface outcrops to as much as 2,000 feet below ground surface,with most coal occurring at depths shallower than 1,000 feet (Quarterly Review, 1993). Thesedepth differences arise due to the dip of the coalbeds. The total thickness of the Pennsylvanian-aged coal system averages 25 feet; however, better developed seams within the coal zones canincrease in thickness by up to twice the average (Quarterly Review, 1993).
Coalbed methane has been produced in commercial quantities from the Pittsburgh coalbed of theNorthern Appalachian Coal Basin since 1932 (Lyons, 1997), after the discovery of the Big Run
EPA 816-R-04-003 Chapter 5Summary of Coalbed Methane Descriptions
Evaluation of Impacts to Underground Sources June 2004of Drinking Water by Hydraulic Fracturing ofCoalbed Methane Reservoirs 5-8
Field in Wetzel County, West Virginia, in 1905 (Hunt and Steele, 1991). As of 1993, O’BrienMethane Production, Inc. had at least 20 wells in Pennsylvania’s southern Indiana County(Quarterly Review, 1993). Coalbed methane production development in the NorthernAppalachian Basin has lagged, however, due to insufficient reservoir knowledge, inadequatewell-completion techniques, and coalbed methane ownership issues revolving around whetherthe gas is owned by the mineral owner or the oil and gas owner (Zebrowitz et al., 1991).Discharge of produced waters has also proven to be problematic (Lyons, 1997) for coalbedmethane field operators in the Northern Appalachian Coal Basin. Total coalbed methaneproduction stood at 1.41 Bcf in 2000 (GTI, 2002). As of October 2002, 185 coalbed methanewells were producing coalbed methane in Pennsylvania (Pennsylvania Department ofConservation and Natural Resources, 2002).
The Northern Appalachian Basin is situated in the Appalachian Plateau’s physiographicprovince. The primary aquifer in this area is a Pennsylvanian sandstone aquifer underlain bylimestone aquifers (USGS, 1984). Water quality data from eight historic Northern AppalachianCoal Basin projects show that estimated TDS levels ranged from 2,000 to 5,000 mg/L at depthsof 500 to 1,025 feet below ground surface (Zebrowitz et al., 1991), well within EPA’s waterquality criterion of 10,000 mg/L TDS for a USDW (40 CFR §144.3). Depths to the bottoms ofthe USDWs vary greatly in the basin and are better determined on a site-specific basis.
Hydraulic fracturing fluids used in the Northern Appalachian Basin have included water andsand, and nitrogen foam and sand (Hunt and Steele, 1991). The Christopher CoalCompany/Spindler Wells Project, which took place from 1952 to 1959, stimulated 1 well with 12quarts of nitroglycerin (Hunt and Steele, 1991). In the Vesta Mines Project of WashingtonCounty, Pennsylvania, the United States Bureau of Mines used gelled water and sand tocomplete 5 wells in the Pittsburgh Seam (Hunt and Steele, 1991).
Because most of the coal strata dip, a well’s location in a basin determines whether the well iscoincident with a USDW. For example, in the Pittsburgh Coal Group in Pennsylvania, the depthto the top of the coal group varies from outcrop to about 1,200 feet in the very southwesterncorner of the state (Kelafant et al., 1988). The approximate depth to the bottom of the USDW is450 feet. Therefore, production wells operating down to approximately 450 feet couldpotentially be hydraulically connected to the USDW.
5.8 The Western Interior Coal Region
The Western Interior Coal Region comprises three coal basins, the Arkoma, the Cherokee, andthe Forest City Basins, and encompasses portions of six states: Arkansas, Oklahoma, Kansas,Missouri, Nebraska, and Iowa (Figure 5-1). The Arkoma Basin covers about 13,500 squaremiles in Arkansas and Oklahoma. The Cherokee Basin is part of the Cherokee PlatformProvince, which covers approximately 26,500 square miles (Charpentier, 1995) in Oklahoma,Kansas, and Missouri. The Forest City Basin covers about 47,000 square miles (QuarterlyReview, 1993) in Iowa, Kansas, Missouri, and Nebraska.

EPA 816-R-04-003 Chapter 5Summary of Coalbed Methane Descriptions
Evaluation of Impacts to Underground Sources June 2004of Drinking Water by Hydraulic Fracturing ofCoalbed Methane Reservoirs 5-9
In the Arkoma Basin, major middle-Pennsylvanian coalbeds occur within the Hartshorne,McAlester, Savanna, and Boggy Formations (Quarterly Review, 1993). The Hartshorne coals ofthe Hartshorne Formation are the most important for methane production in the Arkoma Basin.Their depth ranges from 600 to 2,300 feet in two productive areas of southeastern Oklahoma(Quarterly Review, 1993). In the Cherokee Basin, the primary coal seams targeted by operatorsare the Riverton Coal of the Krebs Formation and the Weir-Pittsburg and Mulky coals of theCabaniss Formation (Quarterly Review, 1993). The Riverton and Weir-Pittsburg seams areabout 3 to 5 feet thick and range from 800 to 1,200 feet deep, while the Mulky Coal, whichranges up to 2 feet thick, occurs at depths of 600 to 1,000 feet (Quarterly Review, 1993).Individual coal seams in the Cherokee Group of the Forest City Basin range from a few inches toabout 4 feet thick, with seams up to 6 feet thick (Brady, 2002; Smith, 2002). Depths to the top ofthe Cherokee Group coals range from approximately the surface to 230 feet below groundsurface in the shallower portion of the basin, in southeastern Iowa, to about 1,220 feet in thedeeper part of the basin, in northeastern Kansas (Bostic et al., 1993).
As of March 2000, there were 377 coalbed methane wells in the Arkoma Basin of easternOklahoma, ranging in depth from 589 to 3,726 feet (Oklahoma Geological Survey, 2001). TheArkoma Basin contains an estimated 1.58 to 3.55 Tcf of gas reserves, primarily in the Hartshornecoals (Quarterly Review, 1993). In the Cherokee Basin, unknown amounts of coalbed methanegas have been produced with conventional natural gas for over 50 years (Quarterly Review,1993). Targeted coalbed methane production increased in the late 1980s, and at least 232coalbed methane wells had been completed as of January 1993 (Quarterly Review, 1993). TheCherokee Basin contains an estimated 1.38 Mcf of gas per square mile (Stoeckinger, 1989) in thetargeted Mulky, Weir-Pittsburg, and Riverton coal seams of the Cherokee Group (QuarterlyReview, 1993). In total, the basin contains approximately 36.6 Bcf of gas. However, thePetroleum Technology Transfer Council (1999) indicates that there are nearly 10 Tcf of gas ineastern Kansas alone (PTTC, 1999). The Forest City Basin was relatively unexplored in 1993,with about 10 coalbed wells concentrated in Kansas’ Atchison, Jefferson, Miami, Leavenworth,and Franklin Counties (Quarterly Review, 1993). The Forest City Basin contains an estimated 1Tcf of gas (Nelson, 1999). For the entire region, coalbed methane production was 6.5 Bcf in2000 (GTI, 2002).
According to the National Water Summary (1984), there are no principal aquifers in the portionsof Oklahoma and Arkansas in the Arkoma Basin, only small alluvial aquifers bounding rivers.Water quality test results from the targeted Hartshorne seam in Oklahoma have shown the waterto be highly saline (Quarterly Review, 1993). The base of fresh water in Arkansas is about 500to 2,000 feet below ground surface (Cordova, 1963). However, Cordova (1963) does not define“fresh water.” While the majority of the Cherokee Basin does not contain a principal aquifer, theOzark and Douglas aquifers are contained within the basin (National Water Summary, 1984).The confined Ozark Aquifer, composed of weathered and sandy dolomites, typically containswater wells that extend from 500 to 1,800 feet in depth (National Water Summary, 1984). Theusually unconfined Douglas Aquifer is a sandstone channel of the Pennsylvanian Age (NationalWater Summary, 1984). Wells are usually 5 to 400 feet deep in this aquifer. In Kansas, depth tothe base of the Ozark Aquifer is roughly 1,750 feet below ground surface (Ozark Aquifer BaseMap, 2001). In Oklahoma, the Cherokee Basin also contains the Garber-Wellington and

EPA 816-R-04-003 Chapter 5Summary of Coalbed Methane Descriptions
Evaluation of Impacts to Underground Sources June 2004of Drinking Water by Hydraulic Fracturing ofCoalbed Methane Reservoirs 5-10
Vamoosa-Ada aquifers (National Water Summary, 1984). Water well depths in these twoaquifers usually range from 100 to 900 feet (National Water Summary, 1984). The Forest CityBasin contains the Jordan Aquifer, the Dakota Aquifer, and glacial drift, alluvial, and Paleozoic-aged rock aquifers. Wells in these aquifers commonly range in depth from 300 to 2,000 feet, 100to 600 feet, 10 to 300 feet, 10 to 150 feet, and 30 to 2,200 feet, respectively (National WaterSummary, 1984). Throughout the Western Interior Coal Region, water quality sampling hasshown TDS levels to range from 500 to 40,000 mg/L (Missouri Division of Geological Surveyand Water Resources, 1967).
Hydraulic fracturing is common in the Western Interior Coal Basin. Fracturing fluids such aslinear gel, acid, and nitrogen foam were used extensively in the Western Interior coal regionbefore 1992, and slick water treatments became common in 1993. Hydraulic fracturing is stillpracticed in the basin.
Based on depths to the Hartshorne Coal (0 to 4,500 feet in Arkansas) and the base of fresh water(500 to 2,000 feet in Arkansas), it appears that coalbed methane extraction wells in the ArkomaBasin could be coincident with potential USDWs in Arkansas (Andrews et al., 1998; Cordova,1963). Based on maps provided by the Oklahoma Corporation Commission (2001) showing thedepths of the 10,000 mg/L TDS groundwater quality boundary in Oklahoma, coalbed methanewells and USDWs would most likely not coincide in Oklahoma. This is based on depths to coalstypically greater than 1,000 feet (Andrews et al., 1998) and depths to the base of the USDWtypically shallower than 900 feet (OCC Depth to Base of Treatable Water Map Series, 2001).
In the Cherokee Basin, coalbed methane wells targeting the Cherokee Group coals in Kansascoincide with USDWs. Depths to the top of coalbeds range from 800 to 1,200 feet (QuarterlyReview, 1993) while the depth to the base of fresh water is estimated at 1,750 feet (Mappedinformation from the Kansas Data Access and Support Center (DASC), 2001a). Moreinformation concerning water quality is required prior to any determination of coalbed methanewell/USDW co-location in Missouri. However, current levels of coalbed methane activity areminimal in that state. In addition, since only a very small portion of the Cherokee Basin fallswithin Missouri, this portion of the basin needs to be delineated more precisely to see whichUSDWs are in this small part of the basin. Last, in the Forest City Basin, there appears to belittle relationship between water supplies and coalbeds that may be used for coalbed methaneextraction. However, aquifer and well information from the National Water Summary (1984)indicates that a co-location of the two could exist in Nebraska. More information is needed todefine the relationship between coalbeds and USDWs in the Forest City Basin.
5.9 The Raton Basin
The Raton Basin covers about 2,200 square miles in southeastern Colorado and northeasternNew Mexico (Figure 5-1). It is the southernmost of several major coal-bearing basins along theeastern margin of the Rocky Mountains. The basin extends 80 miles north to south and as muchas 50 miles east to west (Stevens et al., 1992). It is an elongate, asymmetric syncline, 20,000 to25,000 feet thick in the deepest part.

EPA 816-R-04-003 Chapter 5Summary of Coalbed Methane Descriptions
Evaluation of Impacts to Underground Sources June 2004of Drinking Water by Hydraulic Fracturing ofCoalbed Methane Reservoirs 5-11
There are two major coal formations in the Raton Basin, the Vermejo and the Raton. TheVermejo coals range from 5 to 35 feet thick, while the Raton coal layers range from 10 to morethan 140 feet thick. Although the Raton Formation is much thicker and contains more coal thanthe Vermejo Formation, individual coal seams in the Raton are less continuous and generallythinner.
Methane resources for the basin have been estimated at approximately 10.2 Tcf in the Vermejoand Raton Formations (Stevens et al., 1992). As of 1992, about 114 coalbed methaneexploration wells had been drilled in the basin (Quarterly Review, 1993). According to GTI, theaverage coalbed methane production rate of wells in the Raton Basin was close to 300 thousandcubic feet per day, and annual production in 2000 was 30.8 Bcf (GTI, 2002).
The coal seams of the Vermejo and Raton Formations developed for methane production alsocontain water that meets the criterion for a USDW. The underlying Trinidad Sandstone andother sandstone beds in the Vermejo and Raton Formations, as well as intrusive dikes and sills,also contain water of sufficient quality to be used as drinking water.
Coalbed methane well stimulation using hydraulic fracturing techniques is common in the RatonBasin. Records show that fracturing fluids used are typically gels and water with sandproppants. Hemborg (1998) showed that in most cases water yield decreased dramatically asmethane production continued over time. However, some wells exhibited increased waterproduction as methane production continued or increased. Two causal factors were suggested(Hemborg, 1998) for the rise in water production:
1. Well stimulation had increased the well’s zone of capture to include adjacent water-bearing sills or sandstones that were hydraulically connected to recharge areas, or;
2. Well stimulation had created a connection between the coal seams and the underlyingwater-bearing Trinidad Sandstone.
5.10 The Sand Wash Basin
The Sand Wash Basin is in northwestern Colorado and southwestern Wyoming. It is part of theGreater Green River Coal Region, which includes the Washakie Basin, the Great Divide (RedDesert) Basin, and the Green River Basin (Figure 5-1). These sub-basins are separated by upliftscaused by deformation of the basement rock. For example, the Sand Wash Basin is separatedfrom the adjacent Washakie Basin by the Cherokee Arch, an anticline ridge that runs east to westalong the Colorado – Wyoming border. The Greater Green River Coal Region, in total, coversan area of approximately 21,000 square miles. The Sand Wash Basin covers approximately5,600 square miles, primarily in Moffat and Routt Counties of Colorado.
The coal-bearing formations in the region include the Iles, Williams Fork, the Fort Union, andthe Wasatch Formations. The total thickness of the coal seams in these formations can be up to150 feet (Quarterly Review, 1993). Of all the formations, the Williams Fork is the most

EPA 816-R-04-003 Chapter 5Summary of Coalbed Methane Descriptions
Evaluation of Impacts to Underground Sources June 2004of Drinking Water by Hydraulic Fracturing ofCoalbed Methane Reservoirs 5-12
significant coal-bearing unit because it has the thickest and most extensive coalbeds. Coal-bearing strata are 5,000 feet deep along the basin’s western portions and outcrop along itssouthern and eastern margins. The coal seams are interbedded with sandstones and shale. Thethickest total coal deposits in the Williams Fork Formation, up to 129 feet, are centered on Craig,CO. These deposits are composed of several separate seams up to 25 feet thick interspersedbetween layers of sedimentary rock.
Coalbed methane resources in the Sand Wash Basin have been estimated at 101 Tcf.Approximately 90 percent of this gas is in the Williams Fork Formation. Approximately 24 Tcfof coalbed methane are located less than 6,000 feet below ground surface (Kaiser et al., 1994a).Some investigation and very limited commercial development of this resource have occurred,mostly in the late 1980s and early 1990s. Records from the Colorado Oil and Gas Commissionindicate that approximately 31 Bcf of coalbed methane was produced in Moffat County during1995 (Colorado Oil and Gas Conservation Commission, 2001). There appears to be nocommercial production at present (GTI, 2002). Development of coalbed methane resources inthe Sand Wash Basin has been slower than in many other areas due to limited economicviability. The need for extensive dewatering in most wells has been a limiting factor,compounded by relatively low coalbed methane recovery. In recent years, permits for new gaswells have been issued, indicating that there may be some continued interest in this area(Colorado GIS, 2001).
Kaiser and Scott (1994) summarized their extensive investigation of groundwater movementwithin the Fort Union and Mesaverde Group. The Mesaverde Group is a highly transmissiveaquifer. The coal seams within the group may be the most permeable part of the aquifer. Lateralflow within the Fort Union Formation is slower. Groundwater quality in the basin varies greatly.Typically, chloride and TDS concentrations within the coal-bearing Mesaverde Group are lowand potentially within potable ranges in the eastern portion of the basin, implying the existenceof a USDW. TDS concentrations increase as the water migrates toward the central and westernmargins of the basin. TDS concentrations significantly higher than the 10,000 mg/L USDWwater quality standard have been detected in the western portion of the basin.
The use of fracturing fluids, specifically water and sand proppant, has been reported for thisbasin. No record of any other fluid types has been noted. Although variable, the water qualitywithin the fractured coals indicates the presence of USDWs within the coalbeds.
5.11 The Washington Coal Regions (Pacific and Central)
The Pacific Coal Region (Figure 5-1) is approximately 6,500 square miles and lies along thewestern and eastern flanks of the Cascade Range, from Canada into northern Oregon within thePuget downwarp structure. Bellingham, Seattle, Tacoma, and Olympia in Washington, andPortland, Oregon, lie in or adjacent to the sub-basins. The Central Coal Region (Figure 5-1)primarily lies within the Columbia Plateau, between the Cascade Range to the west and theRocky Mountains to the east, in Idaho. This region extends from the Okanogan highlands to thenorth to the Blue Mountains to the south, and encompasses approximately 63,320 square miles.

EPA 816-R-04-003 Chapter 5Summary of Coalbed Methane Descriptions
Evaluation of Impacts to Underground Sources June 2004of Drinking Water by Hydraulic Fracturing ofCoalbed Methane Reservoirs 5-13
The coal-bearing deposits of the Pacific and the Central Coal Regions are Cretaceous to EoceneAge and formed within fluvial and deltaic depositional environments prior to the uplift of theCascade Mountain Range. The thick coalbeds of the Pacific and Central Basins are thought toresult from peat accumulations in poorly drained swamps of the lower deltas, while the thinnercoalbeds probably formed in the better drained upper deltas (Buckovic, 1979 as cited by Choateet al., 1980). The complex stratigraphy and structural deformation of the coals of the PacificCoal Region are major obstacles to the exploration and development of gas fields. Although thecoals of the Central Coal Region may not be as greatly deformed and unpredictable as those inthe Pacific Coal Region, they are obscured by the Columbia River Basalt Group, in whichindividual basalt flows up to 300 feet thick can cover thousands of square miles.
The occurrence of methane in groundwater is one factor leading to the identification of the gaspotential in Washington. Methane in groundwater occurs in the basalts, but only in confinedaquifers (porous or fractured zones near the top or bottom of a basalt layer) and is thought tohave migrated upward from underlying coalbeds. Choate et al. (1980) estimated coalbedmethane resources for four target sub-basins representing 1,800 square miles of the Pacific CoalRegion to be 0.3 trillion to 24 Tcf. Methane had been encountered in 67 oil and gas explorationwells drilled in this region by 1984. Gas was found at depths of less than 500 feet in 25 wells,less than 1,000 feet in 38 wells, and less than 2,000 feet in 50 wells. Pappajohn and Mitchell(1991) estimated the coalbed methane potential of the Central Coal Region to be more than 18Bcf per square mile. The operation of the Rattlesnake Hills gas field between 1913 and 1941 inthe western part of the Central Coal region indicates that greater potential for development mayexist. According to the available literature, there were no producing fields in either the PacificCoal Region or the Central Coal Region in Washington as of 2000 (GTI, 2001).
Water supply wells and irrigation wells in the Columbia River Basalts and water wells innumerous different lithologies in the Pacific Coal Region have been recognized as containingmethane. Data demonstrating the co-location of a coal seam and a USDW were found for PierceCounty, where methane gas test well results report TDS levels far less than the 10,000 mg/LUSDW water quality threshold (Dion, 1984). These aquifers can be classified as USDWs. Datademonstrating the co-location of a coal seam and a USDW was found for Pierce County, wheremethane gas test well results report TDS levels of 1,330 to 1,660 mg/L, which is far less than theUSDW classification limit (Dion, 1984). Development of methane in the Central Coal Regionmay have some impact on highly productive basalt aquifers already used as large sources ofirrigation water for agriculture (Dion, 1984).
Hydraulic fracturing of coalbed methane wells using sand and nitrogen foam treatments has beendocumented (Quarterly Review August, 1993). However, optimal stimulation and completionmethods for use in the structurally difficult Pacific gas region are yet to be applied and proven.

EPA 816-R-04-003 Chapter 5Summary of Coalbed Methane Descriptions
Evaluation of Impacts to Underground Sources June 2004of Drinking Water by Hydraulic Fracturing ofCoalbed Methane Reservoirs 5-14
5.12 Summary
Hydraulic fracturing of coalbed methane production wells has been documented in each basin,although it is not widely practiced in the Powder River, Sand Wash Basin, or the WashingtonCoal Regions. Ten of the eleven major coal basins in the United States are located at leastpartially within USDWs. The literature also indicates that hydraulic fracturing may haveincreased or have the potential to increase the communication between coal seams and adjacentaquifers in two of the basins: the Powder River and Raton Basins. This may be the explanationfor higher than expected withdrawal rates for production water in the Raton Basin followingsome fracturing treatments. In the Powder River Basin, concerns over the creation of such ahydraulic connection are cited as one reason why hydraulic fracturing of coalbed methanereservoirs is not widely practiced in the region.

EPA 816-R-04-003 Chapter 5Summary of Coalbed Methane Descriptions
Evaluation of Impacts to Underground Sources June 2004of Drinking Water by Hydraulic Fracturing ofCoalbed Methane Reservoirs 5-15

EPA 816-R-04-003 Chapter 5Summary of Coalbed Methane Descriptions
Evaluation of Impacts to Underground Sources June 2004of Drinking Water by Hydraulic Fracturing ofCoalbed Methane Reservoirs 5-16

EPA 816-R-04-003 Chapter 5Summary of Coalbed Methane Descriptions
Evaluation of Impacts to Underground Sources June 2004of Drinking Water by Hydraulic Fracturing ofCoalbed Methane Reservoirs 5-17
Figure 5-1. Locus Map of Major United States Coal Basins

EPA 816-R-04-003 Chapter 6Water Quality Incidents
Evaluation of Impacts to Underground Sources June 2004of Drinking Water by Hydraulic Fracturing ofCoalbed Methane Reservoirs 6-1
Chapter 6Water Quality Incidents
While Chapters 3 through 5 describe the theoretical and technical background for thepotential contamination of USDWs from hydraulic fracturing fluid injection into coalbedmethane wells, this chapter summarizes citizens’ accounts of water quality and quantityincidents. These reports reflect the opinions of citizens living near coalbed methaneoperations who expressed concerns about contaminated drinking water wells and wellsexperiencing water quantity impacts such as reduced production. EPA has, throughletters and telephone calls, contacted and been contacted by citizens who believed theirwater wells were affected by coalbed methane production in the San Juan, Black Warrior,Central Appalachian, and Powder River Basins. Stakeholders commenting on the studymethodology (65 FR 45774 (USEPA, 2000)) asked that EPA consider personalexperiences regarding coalbed methane impacts on drinking water wells in addition todata from formal studies.
As a result of the stakeholder comments, EPA published a request in the Federal Register(66 FR 39396 (USEPA, 2001)) for information from the public, as well as governmentaland regulatory agencies, regarding incidents of groundwater contamination believed to beassociated with hydraulic fracturing of coalbed methane wells. In addition, the Agencynotified over 500 local and county agencies in areas of potential coalbed methaneproduction making them aware of the Federal Register notice, but EPA received noinformation regarding citizen complaints from these officials. Therefore, EPA believes itknows the major geographic areas where citizens have reported problems that theyattribute to coalbed methane development. These areas are concentrated in the mostactive basins: the San Juan, Black Warrior, Central Appalachian, and Powder RiverBasins. The Agency has included relevant information from the water quantity andquality incident reports that it has received.
Many of the reported incidents (such as impacts to water supply quantities or the effectsof discharged groundwater extracted during the coalbed methane production process) areoutside of the scope of SDWA and beyond the scope of this Phase I of the study.However, all incidences reported in response to the Federal Register request are includedso that this study can be as inclusive as possible with respect to reported incidences andnot inadvertently exclude a relevant reported incident. This study is specifically focusedon assessing the potential for contamination of USDWs from the injection of hydraulicfracturing fluids into coalbed methane wells, and determining based on these findings,whether further study is warranted.
It is important to note that activities or conditions other than hydraulic fracturing fluidinjection may account for some of the reported incidences of the contamination ofdrinking water wells. These potential causes include surface discharge of fracturing and

EPA 816-R-04-003 Chapter 6Water Quality Incidents
Evaluation of Impacts to Underground Sources June 2004of Drinking Water by Hydraulic Fracturing ofCoalbed Methane Reservoirs 6-2
production fluids, poorly sealed or poorly installed production wells, and improperlyabandoned production wells.
For this phase of the study (Phase I), EPA consulted with state agencies to determine ifthey had received reports of groundwater problems, to learn of any follow-up stepstypically taken by the state, and to determine the states’ overall findings regarding anyimpacts that hydraulic fracturing of coalbed methane wells may have had ongroundwater.
This chapter summarizes correspondence EPA has had with individual citizens and states,organized by basin, as follows:
• San Juan Basin (Colorado and New Mexico).
• Powder River Basin (Wyoming and Montana).
• Black Warrior Basin (Alabama).
• Central Appalachian Basin (Virginia and West Virginia).
6.1 The San Juan Basin (Colorado and New Mexico)
For over a decade, citizens in the San Juan Basin region have reported that coalbedmethane development has resulted in increased concentrations of methane and hydrogensulfide in their water wells. Other complaints about coalbed methane developmentinclude the loss of water, the appearance of anaerobic bacteria in water wells, and thetransient appearance of particulates in well water. In conversations with EPA, mostcitizens and local government officials did not specify hydraulic fracturing as the causeof well water problems. Summaries of reported incidents and state follow-up arediscussed in sections 6.1.1 and 6.1.2, respectively.
EPA reviewed the BLM study summarizing the history of methane seeps, citizencomplaints, and follow-up investigations related to conventional gas and coalbedmethane development in the San Juan Basin to determine if they contained informationpertaining to coalbed methane hydraulic fracturing and its impact, if any, on the qualityof water in drinking water aquifers in the basin. A summary of pertinent findings isprovided in section 6.1.3.
6.1.1 Summary of Reported Incidents
• EPA spoke with a former county employee who, earlier in his career, hadworked for Exxon performing hydraulic fracturing jobs (Holland, 1999). As acounty employee, he took measurements for methane and hydrogen sulfideinside homes in response to citizen complaints. He indicated that there were

EPA 816-R-04-003 Chapter 6Water Quality Incidents
Evaluation of Impacts to Underground Sources June 2004of Drinking Water by Hydraulic Fracturing ofCoalbed Methane Reservoirs 6-3
no significant problems until the shallowest formation of coal (the FruitlandFormation) began being developed. He believed that the main route ofcontamination is from older, poorly cemented wells, and he estimated thathundreds of wells have been affected. He said the biggest problemsassociated with the apparent effects of coalbed methane development are theexplosive levels of methane and the toxic levels of hydrogen sulfide in homes.In his opinion, this is due to the removal of water, rather than to hydraulicfracturing.
• The San Juan Citizens Alliance estimated that hundreds of private water wellshave been affected by coalbed methane production in the area of Durango,CO. These complaints include the following:
- A lawyer representing several Durango citizens whose wells werecontaminated, allegedly due to coalbed methane development, saidthere have always been methane seeps in the river, which havemanifested as bubbling water (McCord, 1999). In the early 1980s,however, people began to see increased concentrations of natural gasin their water wells shortly after companies began producing methanefrom the Fruitland Formation.
- One individual reported that two of his wells were degraded becauseof increased methane levels. According to this individual, hisneighbor’s pump house door was blown off, presumably as a result ofexplosive levels of methane. Amoco bought three ranches after countyofficials tested indoor air and found extremely high levels of methane.This individual also told EPA staff that an area of the Southern Utetribal land has increased levels of hydrogen sulfide at the surface. Hereported he had also heard of black water due to pulverized coal.
- Another private well owner claimed that her neighbors’ wells arecontaminated by gas infiltration from dewatering. First methanecontaminates the well, then hydrogen sulfide, then anaerobic bacteria.She claimed that data exists showing that methane concentrations inwater have increased by 1,000 parts per million (ppm).
• EPA Region 8 received letters from citizens concerned that coalbed methanedevelopment had contaminated their water with methane and hydrogensulfide.
• During a visit to Durango, CO, EPA met with several citizens who claimed tohave experienced problems with their water due to coalbed methanedevelopment. Most of the citizens experienced water loss, but two wellowners from New Mexico claimed that the quality of their water was affectedby hydraulic fracturing. According to their accounts, the water turned cloudy

EPA 816-R-04-003 Chapter 6Water Quality Incidents
Evaluation of Impacts to Underground Sources June 2004of Drinking Water by Hydraulic Fracturing ofCoalbed Methane Reservoirs 6-4
with grayish sediment a day or two after nearby fracturing events. Eventually,the well water returned to its normal appearance.
EPA also toured the area during that visit. EPA staff viewed areas wherepatches of grass and trees were turning brown and dying. In some places,large, old-growth trees located within the patch indicated that the areapreviously had prolonged normal soil conditions. Many citizens and somelocal officials believed that the areas suffered from increased methane anddecreased air in the soil gas in the shallow root zone.
• A La Plata County official reported that citizens have called to complain thatwell water flow decreases when coalbed methane wells are hydraulicallyfractured (Keller, 1999). He reported that “a lot” of people are hauling waterdue to water loss. The county official said that, in two separate reports, wellowners noticed problems with their well water approximately 2 weeks afternearby fracturing events. They reportedly believe hydraulic fracturing isresponsible because the timing of the water loss coincides with the fracturing.Citizens know when gas producers fracture wells because they can see andhear the operation, which involves several trucks, tanks, manifolds, andmobile trailers. The county official noted that the formation being developed,the Fruitland Formation, is located approximately 2,400 feet below groundsurface (bgs), and water wells are generally drilled from 100 feet to 200 feetbgs. He qualified his statements by indicating that wells do go dry for avariety of reasons.
• EPA contacted the Colorado Department of Health (CDH), which has primacyfor the UIC Program under SDWA. An official with whom EPA spoke saidCDH believes that water removal associated with coalbed methanedevelopment has caused problems in private water wells (Bodnar, 1999).
• EPA received one complaint from a citizen living in the Raton Basin inTrinidad, CO. She reported that water wells in her area have begun to declinein production and quality, often producing more and more gas. She believesthe decline of water wells in her area is due to dewatering associated withcoalbed methane production.
6.1.2 State Agency Follow-Up in the San Juan Basin
Colorado Oil and Gas Conservation
The Colorado Oil and Gas Conservation Commission (COGCC) is responsible forenvironmental issues related to oil and gas production in the state. The COGCC respondsto every complaint called in to its office (Baldwin, 2000).

EPA 816-R-04-003 Chapter 6Water Quality Incidents
Evaluation of Impacts to Underground Sources June 2004of Drinking Water by Hydraulic Fracturing ofCoalbed Methane Reservoirs 6-5
The COGCC staff believes that increased methane concentrations in water wells andbuildings in some areas are partially due to old, improperly abandoned gas wells andolder, deeper conventional gas wells in which the Fruitland Formation was notcompletely isolated. The state bases its opinions on monitoring and studies conducted inthe San Juan Basin in response to complaints (see section 6.1.3). According to COGCCofficials, the state’s mitigation program focused on sealing old, improperly abandonedgas wells and appears to have reduced methane concentrations in approximately 27percent of the water wells sampled. They believe that methane concentrations willdecrease over time in other water wells where the source of the methane was gas wells.There are other areas of the San Juan Basin where the methane in water wells is producedby methanogenic bacteria in the aquifer. Methane concentrations in water wells in theseareas probably will not decrease.
Officials cite studies that use stable carbon and hydrogen isotopes of methane and gascomposition to differentiate between thermogenic methane from the Fruitland,Mesaverde, and Dakota Formations, and biogenic methane that is produced in shallowerformations by naturally occurring methanogenic bacteria. By 1998, approximately two-thirds of the water wells for which gas isotopic analyses had been performed appeared tocontain biogenic gas, while one-third appeared to contain thermogenic gas.
The state also noted that, in the interior basin, 1,100 feet of shale separates the FruitlandFormation and the shallow formations in which private wells are completed.
New Mexico Oil Conservation Division
EPA spoke with a District Geologist employed by the New Mexico Oil ConservationDivision (NMOCD). He said that several years ago the office received many complaintsthat methane had contaminated water wells (Chavez, 2001). The state held water fairs atwhich anyone could have his or her water tested. In addition, the state initiated aprogram for cemented wells (some active, some abandoned) that prohibited open holes100 feet above the casing string. The District Geologist indicated that the programseemed to solve the problem and that NMOCD has not received many subsequentcomplaints.
6.1.3 Major Studies That Have Been Conducted in the San Juan Basin
As noted previously, EPA reviewed a BLM study on the San Juan Basin to determine if itcontained information pertaining to coalbed methane hydraulic fracturing and its impact,if any, on the quality of water in drinking water aquifers in the basin. EPA’s review ofthis report focused on the two potential mechanisms by which hydraulic fracturing mayaffect the quality of USDWs: 1) direct injection of hydraulic fracturing fluids into aUSDW or injection of fracturing fluids into a coal seam already in hydrauliccommunication with a USDW (e.g., through a natural fracture system), and 2) creation ofa hydraulic connection between the coalbed formation and an adjacent USDW. Thereports did not specifically address hydraulic fracturing, and only very little information

EPA 816-R-04-003 Chapter 6Water Quality Incidents
Evaluation of Impacts to Underground Sources June 2004of Drinking Water by Hydraulic Fracturing ofCoalbed Methane Reservoirs 6-6
indirectly addresses the question specific to this study: Does the injection of hydraulicfracturing fluids into coalbed methane wells contaminate USDWs? The studies provided information on evidence that a hydraulic connection exists betweencoalbeds in the Fruitland Formation and overlying shallow aquifers and on possibleconduits that may be the basis of the hydraulic connection. For example, the presence ina shallow aquifer of methane documented to be from the underlying Fruitland Formationis indirect evidence of a hydraulic connection, through some type of conduit, between theFruitland Formation and shallower formations. Evidence that a hydraulic connection exists between coalbeds and the shallow aquifer
The U.S. Department of the Interior’s BLM (1999) provides a history of gas seeps andmethane contamination of drinking water wells in the San Juan Basin. This section willreview the evidence that indicates the existence of a hydraulic connection between thedeep coalbeds and shallow USDWs.
Even prior to oil and gas drilling operations, shallow water wells in the San Juan Basinproduced methane gas. Some wells in the Cedar Hill, NM, area of the basin werereported to have a strong sulfur odor. Some shallow water wells around the basin rimpenetrated the Fruitland and Menefee coalbeds and produced methane (BLM, 1999).Thus, coalbed methane was the source of at least some of the observed methanecontamination. Water from the Fruitland coalbed discharges in the western part of thebasin and migrates upward across the Kirtland shale into the Animas and San Juan Rivers(Stone et al., 1983). In areas such as La Plata County, CO, along the northern andwestern rims of the basin, the methane presumably moves through natural fractures.
In the interior of the basin, gas seeps were observed in pastures in the Animas RiverValley south of Durango near Bondad, CO, and Cedar Hill, NM, in the early to mid-1980s. Bubbles were also observed in the Animas River and in the tap water of ruralproperties in these areas. Methane was responsible for explosions in several pumphouses. A landowner in New Mexico reported that gas was bubbling out of his alfalfafield and in the Animas River in 1985. Gas seeps were likely the cause of patches ofdead grass growing in soils overlying the Mesaverde sandstone (BLM, 1999). Thus,conduits between methane-containing units and the surface were present both at the rimand in the interior of the basin.
After coalbed methane production began in the basin in the late 1980s, a local citizens’group voiced concerns that natural gas contamination of drinking water wells hadincreased in La Plata County. One study reported that 34 percent of the 205 domesticwater wells tested in the county showed measurable concentrations of methane (BLM,1999). This appears to indicate that there is a conduit for fluid to flow to the shallowerUSDW and its drinking water wells.

EPA 816-R-04-003 Chapter 6Water Quality Incidents
Evaluation of Impacts to Underground Sources June 2004of Drinking Water by Hydraulic Fracturing ofCoalbed Methane Reservoirs 6-7
Shortly after the start of coalbed methane production in the basin, 11 coalbed methanewells were drilled within 2 miles of the Pine River Ranches Subdivision at the rim of theSan Juan Basin. Nine to 35 feet of alluvium separate the surface from the FruitlandFormation coals in this area. A number of problems were reported following the onset ofcoalbed methane production. A man who complained that his well was contaminatedwith methane saw streams of gas bubbles in the nearby Los Pinos River. His report ofmethane contamination was confirmed by the San Juan Regional Authority (SJRA),which investigated reported contamination of this well and nearby wells. The other wellswere also contaminated with methane. Two of the 4 residences near the 11 coalbedmethane wells contained explosive levels of methane in crawl spaces (BLM, 1999). Themethane sampled in the shallow wells and the bubbling river and the high concentrationsof methane detected in residences suggest that coalbed methane was following someconduit from the Fruitland Formation to the surface or to shallow USDWs.
Evidence that methane in shallow drinking water wells originates in the FruitlandFormation (location of the coalbeds targeted by hydraulic fracturing)
Several lines of evidence show that methane detected in alluvial wells is not a result ofsewage-derived methane contamination (BLM, 1999). Rather, the methane in thedomestic wells studied originates either in conventional gas reservoirs such as the Dakotasandstone and the Lewis Shale or in the coals of the Fruitland Formation.
The composition of the gas in samples from shallow, private drinking water wells wasanalyzed to confirm the well owners’ observations. The data obtained showed that themethane in approximately half of the samples appeared to have originated in theFruitland Formation coalbeds and not from other possible sources such as septic tanks(BLM, 1999).
Similar sampling and analyses conducted in an additional study cited by BLM (1999)concluded that gas in a domestic well in alluvium overlying the Fruitland Formation hadthe same gas composition and carbon-13 isotope ratio as gas from a nearby gas well alsoin the Fruitland Formation. This study found that C13 isotopic signatures of individualnear-surface gas samples correlated with production gas from discrete formations beneaththe study area (BLM, 1999). In addition, an area resident’s well contained 680 ppmTDS, primarily sodium bicarbonate. Fruitland-produced water has the same composition,although other domestic wells in the area do not. (TDS values tend to be in the 100 to200 ppm in these other domestic wells.) Both the gas and the water analyses indicate thatthe shallow aquifer in the area (from which the methane-contaminated domestic wellsdraw drinking water) is in hydraulic communication with the deeper Fruitland Formationcoalbeds.
Possible conduits for fluid movement from the coalbeds to the aquifer
Several studies have assessed possible natural or manmade conduits to account for theconfirmed occurrence of methane in wells tapping the shallow aquifer that overlies the

EPA 816-R-04-003 Chapter 6Water Quality Incidents
Evaluation of Impacts to Underground Sources June 2004of Drinking Water by Hydraulic Fracturing ofCoalbed Methane Reservoirs 6-8
deeper coalbeds in the Fruitland Formation. Possible pathways enabling methane tomove from a deep source to a shallow aquifer include natural fractures, hydraulicallyinduced fractures, disposed of produced water from coalbed methane wells, and poorlyconstructed, sealed, or cemented conventional gas wells, coalbed methane wells, shallowdrinking water wells, and cathodic protection wells installed to protect oil and gaspipelines from corrosion (BLM, 1999).
The history of documented gas seeps and methane occurrence in water wells indicatesthat natural fractures probably serve as conduits in parts of the basin where coalformations are near or at the surface and in the interior of the basin, where the coalformations are deeper. These conduits may enable hydraulic fracturing fluids to travelfrom targeted coalbeds to shallow aquifers. However, there is no unequivocal evidencethat this fluid movement is occurring and, even given the presence of these possibleconduits, other hydrogeologic conditions (such as certain pressure gradients, etc.) wouldbe required for fluid movement from targeted coalbeds to shallow aquifers.
A study comparing soil-gas-methane concentrations adjacent to 352 gas-well casings and192 groundwater wells found that the gas-well annuli (i.e., the spaces between the steelwell casings and the walls of the drilled bore holes) were frequently the reason methanemoved from the coalbeds to the near-surface environment (BLM, 1999). Thus, gas-wellannuli are clearly one type of conduit for movement of methane from deeper sources upto overlying shallow aquifers.
The possibility of leaking gas wells acting as conduits through which methane flows fromthe Fruitland Formation to shallow aquifers was investigated by a joint Colorado Oil andGas Conservation Commission/BLM study (BLM 1999). One hundred twenty waterwells were tested for methane before and after nearby gas wells were “remediated”(better sealed). The study concluded that the relationship between gas well remediationand lower methane concentrations in drinking water was “complex” and may have beenaffected by the lingering presence of methane in drinking water after gas wellremediation. More than half the water wells showed no significant changes in methaneoccurrence, a quarter showed lower methane levels, and one-tenth showed increasedmethane.
In summary, there appears to be evidence that methane seeps and methane in shallowgeologic strata and water wells may occur because the methane moves through a varietyof conduits. These conduits include natural fractures; poorly constructed, sealed, orcemented manmade wells used for various purposes. No reports provide directinformation regarding hydraulic fracturing. Methane, fracturing fluid, and water with anaturally high TDS content could possibly move through any of these conduits. In somecases, improperly sealed gas wells have been remediated, resulting in decreasedconcentrations of methane in drinking water wells.

EPA 816-R-04-003 Chapter 6Water Quality Incidents
Evaluation of Impacts to Underground Sources June 2004of Drinking Water by Hydraulic Fracturing ofCoalbed Methane Reservoirs 6-9
6.2 The Powder River Basin (Wyoming and Montana)
EPA spoke with several individuals familiar with coalbed methane activity in the PowderRiver Basin area who believe coalbed methane production is causing water quantityissues. These individuals have reported that dewatering during coalbed methaneproduction resulted in loss of water from wells and in flooding problems on the surface.Many of the drinking water wells in the Powder River Basin are screened and completedin the same formation being dewatered for methane production. According to aconsulting hydrogeologist, as much as 1 million gallons of water are pumped from eachcoalbed methane production well during its lifetime. Consequently, the aquifer hasdropped 200 feet in some areas (Merchat, 1999). EPA has also learned that, as of 1999,oil and gas companies have drilled 2,000 wells in the Powder River Basin, and theyreportedly plan to drill 15,000 in total (Merchat, 1999). However, deeper aquifers areavailable, and the oil and gas companies have drilled new water wells in those aquifersfor private individuals.
Reports of incidents in the Powder River Basin are summarized below. However,hydraulic fracturing is performed infrequently in the Powder River Basin, and no oneliving in that area has reported problems relating to the process. Many of the complaintsrelate to water quantity issues, which are beyond the scope of this study.
EPA contacted the state and local offices of the Wyoming Health Department and theWater Quality Division of the Wyoming Department of Environmental Quality todetermine if these departments had received complaints of water quality degradation dueto coalbed methane production. Local authorities reported one complaint of blacksediments in drinking water, but most concerns centered on water loss and floodingcaused by large quantities of water discharged at the surface (Heath, 1999). There hasbeen discussion among stakeholders regarding the handling of large volumes of waterbrought to the surface during coalbed methane production. Some individuals remainconcerned about the consequences of dewatering aquifers, which include loss of theresource, effects on soil chemistry, flooding, and the potential for coalbed fires andsubsidence.
EPA spoke with a consultant for the Powder River Basin Resource Council (PRBRC), acitizen’s group formed around environmental issues associated with coalbed methaneproduction (Merchat, 1999). He stated that the biggest concern among people in the areais loss of water. However, some have had problems with increased methane content intheir water. He said people reported methane in the water results in frothing and bubbles.The water is generally used for agricultural purposes and for drinking water. He said thateach methane well produces millions of gallons of water in its lifetime. The discharge ofwater has created new ponds and swamps that are not naturally occurring in that region.The secondary effects from pumping water are subsidence and clinker beds (burningcoal). When underground coal catches fire from lightning, it burns until it reachesgroundwater. However, if there is no groundwater, the fire will continue to burn. Thecost of manually extinguishing those fires is enormous. Furthermore, the burning of the

EPA 816-R-04-003 Chapter 6Water Quality Incidents
Evaluation of Impacts to Underground Sources June 2004of Drinking Water by Hydraulic Fracturing ofCoalbed Methane Reservoirs 6-10
coal can leave behind benzo(a)pyrene and other polycyclic aromatic hydrocarbons thatare toxic and/or carcinogenic and could affect drinking water.
EPA Region 8 is participating in a study that addresses the environmental effects of allaspects of coalbed methane development and not just hydraulic fracturing.
6.3 The Black Warrior Basin (Alabama)
The LEAF v. EPA case arose from an alleged water quality degradation related toactivities in Alabama. As discussed in Chapter 1, the Eleventh Circuit Court’s 1997decision in LEAF v. EPA, 118F.3d 1467, held that because hydraulic fracturing ofcoalbeds to produce methane is a form of underground injection, Alabama’s EPA-approved UIC Program must effectively regulate this practice (11th Cir, 1997). Inresponse to the Court’s decision, Alabama supplemented its rules governing thefracturing of wells to include additional requirements that govern the protection ofUSDWs during the hydraulic fracturing of coalbed methane. Summaries of reportedincidents are presented in section 6.3.1 below.
6.3.1 Summary of Reported Incidents
• In the drinking water well case that precipitated LEAF v. EPA, an individualcomplained that drinking water from his well contained a milky whitesubstance and had strong odors shortly after a fracturing event. He alsoreported that six months after the fracturing event his water had increasinglybad odors and occasionally contained black coal fines. The EPAAdministrative Record regarding the Alabama Class II UIC Program containsother similar descriptions of well water problems.
• Another Alabama citizen reported to EPA problems with her drinking waterwell that began in 1989. In her letter, the citizen reported that her propertywas located near a coalbed methane gas well and that there was coal mining inthe area. She wrote that she believes hydraulic fracturing of the coalbedmethane well adversely affected her drinking water well, and coal resourceexploitation in the area caused various, significant environmental damage.The individual believed that the hydraulic fracturing contributed to wellcontamination because, shortly after a fracturing event, her kitchen watercontained globs of black, jelly-like grease and smelled of petroleum. She saidher drinking water turned brown and contained slimy, floating particles. Shereported that her neighbors also said their water smelled like petroleum.
She included, as an attachment, a letter from the Alabama Oil and Gas Board(OGB) approving the use of proppants tagged with radioactive material. Theirapproval was based on the hydrogeology and the absence of water wells in theimmediate area, the depths of the coal intervals to be fractured, well

EPA 816-R-04-003 Chapter 6Water Quality Incidents
Evaluation of Impacts to Underground Sources June 2004of Drinking Water by Hydraulic Fracturing ofCoalbed Methane Reservoirs 6-11
construction, and adherence to a program designed to monitor and containradioactive material at the surface. Also attached was a letter from EPARegion 4 describing analytical results for samples the Agency collected fromher drinking water well on June 26, 1990. The results indicated no purgeableand extractable organic compounds were detected. In addition, the letter saidthat a water/oil inter-phase detector was used to determine if petroleumproducts were floating in the well, and none was detected.
• An Alabama homeowner complained to the Natural Resources DefenseCouncil that recovered hydraulic fracturing fluid from a nearby coalbedmethane well installation was allowed to drain from the coalbed methane wellsite to a location near her home. She claimed that this fluid was initiallyobtained from an abandoned strip-mining quarry that had been used as alandfill for municipal and industrial waste. As this fluid drained from thefracturing site, the homeowner asserted, it killed all animal and plant life in itspath. She further stated that shortly after this fracturing event and theassociated runoff, her 110-foot deep drinking water well became contaminatedwith brown, slimy, petroleum-smelling fluid similar to the dischargedfracturing fluid from the coalbed methane well site.
• In response to EPA’s July 2001 call for information on water quality incidents(found in Water Docket W-01-09), an individual reported that her drinkingwater well had become filled with methane gas, causing it to hiss (66 FR39396 (USEPA, 2001)); the tap water became cloudy, oily, and had a strong,unpleasant odor. In addition, the tap water left behind an oily film andcontained fine particles. The drinking water well owner had her well tested bya private consultant, who confirmed the presence of methane.
The Alabama OGB tested this drinking water well, but only looked fornaturally occurring contaminants. EPA also sampled and tested this drinkingwater well, but not until 6 months after the event. No mention is made of theanalytical results obtained from the drinking water well by these agencies.
6.3.2 State Agency Follow-Up (Alabama Oil and Gas Board)
LEAF v. EPA originated in Alabama. The water well that was reportedly contaminated asa result of hydraulic fracturing operations was sampled independently by the AlabamaOGB, the Alabama Department of Environmental Management (ADEM), and EPARegion 4. Water analyses performed by these agencies indicated that the water well hadnot been contaminated as a result of the fracturing operation. The Alabama OGBreported to EPA that it investigates every complaint it receives, and it does not believethat hydraulic fracturing has affected water wells. Investigations include research intohistorical water quality data, some of which pre-dates coalbed methane activity. Suchhistorical information is important because the coal-bearing Pottsville Formation oftencontains high concentrations of iron. Groundwater from this formation may contain iron-

EPA 816-R-04-003 Chapter 6Water Quality Incidents
Evaluation of Impacts to Underground Sources June 2004of Drinking Water by Hydraulic Fracturing ofCoalbed Methane Reservoirs 6-12
reducing bacteria, which can sometimes result in such water having an unpleasant taste orodor, or containing a white or red-brown, stringy, gelatinous material (Valkenburg andothers, 1975, as cited by the Alabama OGB, 2002). In addition, sudden iron staining canoccur in water with a history of good quality. Water well yield can also decline due tothe presence of iron-reducing bacteria in high concentrations.
According to the Alabama OGB, one factor considered in each investigation is whetherhistorical data are available on water quality in a particular area, including data that pre-date coalbed methane activity. Published reports and open-file data show that the qualityof water in the coal-bearing Pottsville Formation can vary from good to very poor. Datacollected from the 1950s through 1970s in localities throughout a large area where thePottsville Formation has served as a source of water contain reports of water having “badtaste,” “bad odors,” “oily films or sheens,” and waters causing “red stains” and “blackstains” (Geological Survey of Alabama, 1930s to Present; Johnston, 1933, as cited by theAlabama OGB, 2002).
The Alabama OGB reported to EPA that it has investigated several complaints ofmethane gas in water wells. In each instance, the Alabama OGB determined that thewater well problem was unrelated to coalbed methane extraction operations, which oftenwere not occurring in the areas of reported water problems. Moreover, in some areasmethane gas was reported in water wells many years before the advent of undergroundmining and the commercial development of this resource (Geological Survey ofAlabama, 1930s to Present, as cited by the Alabama OGB, 2002). The problem ofmethane gas in water wells has generally occurred where water wells, usually less than200 feet deep, penetrated gas-bearing coal strata, particularly following low rainfall yearsthat caused a lowering of water tables. In these areas, there commonly had been a recentincrease in the drilling of water wells and an acceleration in the rates of water withdrawalfrom the aquifer. When sufficient amounts of water are removed from these water wells,methane can begin to desorb from the coal seams and be produced.
Alabama’s regulations have been approved by EPA for incorporation into Alabama’sClass II UIC Program. Operators must provide written certification to the Board that theproposed fracturing operation will not occur in a USDW or that the fracturing fluids donot exceed the MCLs in 40 CFR §141 Subparts B and G. Fracturing is prohibited fromground surface to 299 feet bgs. For all fracture jobs performed between 300 feet and 749feet bgs, the company must perform a reconnaissance of fresh-water supply wells within¼ mile of the well to be fractured, submit a fracturing program to the OGB, and performa cement bond log analysis. For fracturing events performed between 750 feet and 1,000feet bgs, only a cement bond log is required. For fracturing events performed below1,000 feet bgs, operators must submit to the Alabama OGB the depth to be fractured, wellconstruction information, cementing specifications, and logs identifying overlying,impervious strata.
In Alabama, Rule 400-3-8-.03 states that coalbeds shall not be hydraulically fractureduntil written approval of the Oil and Gas Supervisor has been obtained. The Supervisor

EPA 816-R-04-003 Chapter 6Water Quality Incidents
Evaluation of Impacts to Underground Sources June 2004of Drinking Water by Hydraulic Fracturing ofCoalbed Methane Reservoirs 6-13
must be notified when an approved fracturing operation is to occur so that an agent of theBoard may be present. In order to receive approval, operators must submit details of theproposed fracturing operation. The Board’s staff evaluates each proposal for complianceto ensure USDW protection. Basic information that must be submitted with an operator’sproposal to hydraulically fracture a well includes details on the depths of coalbeds to befractured; construction of the well, including casing and cementing specifications; ageophysical log showing the type and thickness of impervious strata overlying theuppermost coalbed to be fractured; and, if the operation is to be performed in a USDW-bearing interval, a statement certifying that fracturing fluids will not exceed the MCLs offederally mandated primary drinking water regulations (40 CFR §141 Subparts B and G).In addition to the basic information, a fracturing program, a water well inventory within a¼-mile radius, and a cement bond log must be provided with fracturing proposals in thedepth interval 300 to 749 feet. Since water supply wells are generally shallower thancoalbeds, Alabama’s Rule 400-3-8-.03 was designed to increasingly strengthen therequirements for USDW protection with decreasing depths of proposed fracturingoperations. Furthermore, the fracturing of coalbeds shallower than 300 feet is prohibited.
6.4 The Central Appalachian Basin (Virginia and West Virginia)
EPA became aware of several complaints relating to the effects of coalbed methaneproduction on sources of drinking water in the southwestern portion of Virginia throughcorrespondence initiated by citizens. Information about water quality incidents wasgathered through meetings and telephone conversations with members of the VirginiaDivision of Oil and Gas within the Department of Mines, Minerals and Energy(VDMME); local health officials; and representatives of a county citizen’s group. Intotal, VDMME provided EPA with over 70 “Complaint Detail Reports” (registeredbetween 1990 and 2001) that related to drinking water source impacts by coalbedmethane development.
Although the majority of the incidents outlined in the complaints pertain to water-lossissues, approximately one-quarter relate to water quality. Virginians living near coalbedmethane production areas reported private well and spring water contaminationevidenced by oily films, soaps, iron oxide precipitates, black sediments, methane gas, andbad odor and taste. Reports of water loss in the well ranged from noticeably reducedsupply rates to total loss of water from domestic drinking water wells. Summaries ofreported incidents and state follow-up are discussed in sections 6.4.1 and 6.4.2,respectively.

EPA 816-R-04-003 Chapter 6Water Quality Incidents
Evaluation of Impacts to Underground Sources June 2004of Drinking Water by Hydraulic Fracturing ofCoalbed Methane Reservoirs 6-14
6.4.1 Summary of Virginia Incidents
• The state received complaints of soap bubbles flowing from residentialhousehold fixtures. VDMME attributes soap coming out of water faucets tothe drilling process associated with both conventional wells and coalbedmethane wells. Soaps are used to extract drilling cuttings from the boreholebecause the foam expands, rises, and, as it rises, carries the cuttings to thesurface (Wilson, 2001). These soaps may migrate from the borehole into thedrinking water zone that supplies private wells during drilling of the shallowportion of the hole and before the required groundwater casing is cemented inplace. In the few occurrences of soap contamination, water was provided untilthe soap was completely purged from the contributing area surrounding theirwater well.
• In early August 2001, EPA met with approximately 15 to 20 residents ofBuchanan and Dickenson Counties in Virginia. Coalbed methane productionactivity is steadily increasing in the area surrounding Buchanan County sincethe coal reserves in this area have proven to be extremely profitable sourcesfor coalbed methane in recent years (Wilson, 2001). The subjects of thecitizen complaints were very similar to those logged in the VDMMEcomplaint reports. Residents described the presence of black sediments, ironprecipitates, soaps, diesel fuel smells, and increased methane gas in drinkingwater from their wells. One resident brought a water sample collected fromher drinking water well. The water was translucent with a dark gray color andwith dark black suspended sediment. Several other citizens reported drinkingwater supplies diminishing or drying up entirely. One resident of BuchananCounty said that he had an ample water supply from his drinking well for over54 years, until shortly after coalbed methane wells were installed on hisproperty. He reported that within 60 days of the coalbed methane wellinstallations, his 276-foot deep drinking water supply well, which used toproduce over 20 gallons per minute of potable flow, dried up. The residentmentioned that over 380 homes in the region do not have potable water as aresult of coalbed methane mining activities.
Most of the residents said that their complaints to the state usually resulted ininvestigations without resolution. Some residents mentioned that the gascompanies were providing them with potable water to compensate for thecontamination or loss of their drinking water wells. However, the residentssaid that this was not adequate compensation for the impacts to, or loss of,their private drinking water supplies.
• EPA was able to record numerous complaints through telephoneconversations and e-mails with Virginia residents, who reported that theybelieved their drinking water wells had been affected by coalbed methaneindustry activities. All the logged complaints were from Buchanan and

EPA 816-R-04-003 Chapter 6Water Quality Incidents
Evaluation of Impacts to Underground Sources June 2004of Drinking Water by Hydraulic Fracturing ofCoalbed Methane Reservoirs 6-15
Dickenson Counties. Complaints include water loss, soapy water, dieselodors, iron and sulfur in wells, rashes from showering, gassy taste, and murkywater. One report discusses a miner who was burned by a fluid, possiblyhydrochloric acid used in hydraulic fracturing, that infiltrated a mineshaft.Another report describes the contamination of a stream and the resulting fishkills caused by the runoff from drilling fluids. One complainant explainedthat several thousand wells had “gone dry, overnight.” According to theindividuals EPA spoke with, compensation to homeowners for these impactsis in the form of money, newly drilled wells to replace dry or contaminatedwells or temporary provision of potable water, which is supplied “until thingsclear out.”
6.4.2 State Agency Follow-Up (VDMME)
VDMME, Division of Gas and Oil, is responsible for responding to environmental issuesassociated with oil and gas development; it investigates every water problem reported.Responses may include an interview with the citizen reporting the problem, a site visit,water well testing, or a review of the physical aspects of the water well and surroundingactivities. According to Robert Wilson of VDMME, his agency tests for contaminantsthat may be introduced by drilling such as chlorides, oil and grease, and volatile organics.The results of those analyses are compared to baseline values. VDMME witnessessurface casing and plugging jobs as part of its oversight duties. VDMME reviewsinformation from drilling and completion reports to assist with investigations intocomplaints.
Based on investigations of the more than 70 complaints received, VDMME believes thatcoalbed methane production has not affected private drinking water wells. VDMMErecognizes soap migrating into drinking water wells, but considers this only a transientproblem. While a number of complaints report a noticeable reduction in or a total loss ofdrinking water supply, in almost all cases, the state investigator determined that the waterloss was not likely to be caused by local hydraulic fracturing events or coalbed methaneproduction activity because:
• The distance from the private well to the nearest coalbed methane well is toofar (1,500 feet or more) to have any impact.
• There is no hydrologic connection between the water contribution zones of theprivate and coalbed methane wells; therefore, it is physically impossible forcoalbed methane wells to affect private drinking water wells.
• The well was constructed according to VDMME regulatory guidelines;therefore, a sufficient buffer exists between the private well and the coalbedmethane well.

EPA 816-R-04-003 Chapter 6Water Quality Incidents
Evaluation of Impacts to Underground Sources June 2004of Drinking Water by Hydraulic Fracturing ofCoalbed Methane Reservoirs 6-16
• The existing supply was reduced because of recent drought conditions in theregion.
• The complainant experienced mechanical difficulty with his or her pumpingsystem, which led to a reduction in pumped water; however, the supply wasnot affected.
According to VDMME, these citizen complaints refer to incidents that can occur duringthe drilling of any type of well, not just coalbed methane. The few incidents of this kindwere equally divided between conventional wells and coalbed wells (VDMME, 2002).
6.5 Summary
In this chapter, EPA has presented information (in addition to technical, conceptual, ortheoretical information presented previously) on personal experiences with regard tocoalbed methane activities and their potential (or perceived potential) to impact drinkingwater wells. These personal accounts of potential incidences in four producing coalbasins across the United States do not present scientific findings. However, the body ofreported problems considered collectively suggest that water quality (and quantity)problems might be associated with some of the production activities common to coalbedmethane extraction. These activities include surface discharge of fracturing andproduction fluids, aquifer/formation dewatering, water withdrawal from production wells,methane migration through conduits created by drilling and fracturing practices, or anycombination of these. Other potential sources of drinking water problems include variousaspects of resource development, naturally occurring conditions, population growth andhistorical practices.
In several of the coalbed methane investigation areas, local agencies concluded thathydraulic fracturing could not affect drinking water wells. Generally, these conclusionswere based on there being a significant horizontal and/or vertical distance between thecoalbed methane production wells and the drinking water wells.

EPA 816-R-04-003 Chapter 7 Conclusions and Recommendations
Evaluation of Impacts to Underground Sources June 2004of Drinking Water by Hydraulic Fracturing ofCoalbed Methane Reservoirs 7-1
Chapter 7Conclusions and Recommendations
Under SDWA, EPA’s UIC Program is responsible for ensuring that fluids injected intothe ground do not endanger USDWs. The goal of the Phase I study was to assess thepotential for contamination of USDWs due to the injection of hydraulic fracturing fluidsinto coalbed methane wells, and to determine, based on these findings, whether furtherstudy is warranted.
EPA’s approach for evaluating the potential for contamination of USDWs was anextensive information collection and review of empirical and theoretical data. EPAreviewed water quality incidents potentially associated with hydraulic fracturing andevaluated the theoretical potential for hydraulic fracturing to affect the quality of USDWsthrough one of two mechanisms:
1. Direct injection of fracturing fluids into a USDW in which the coal is located,or injection of fracturing fluids into a coal seam that is already in hydrauliccommunication with a USDW (e.g., through a natural fracture system).
2. Creation of a hydraulic connection between the coalbed formation and anadjacent USDW.
7.1 Reported Water Quality Incidents
Citizens from Wyoming, Montana, Alabama, Virginia, Colorado, and New Mexicocontacted EPA because they were concerned that their water wells were affected bycoalbed methane production. The major geographic areas where citizens reportedexperiencing problems due to coalbed methane development are concentrated in the coalbasins with the most coalbed methane activities – the San Juan, Black Warrior, CentralAppalachian, and Powder River Basins. This study was initiated, partly, in response tothose citizens’ concerns. EPA followed-up on letters and telephone calls from citizensand resulting leads to understand specific complaints and citizens’ concerns.
EPA published a Federal Register notice (66 FR 39396 (USEPA, 2001) requestinginformation on water quality incidents believed to be associated with hydraulic fracturingof coalbed methane wells. EPA notified over 500 local and/or county agencies in areaswith potential coalbed methane production activity to make them aware of the FederalRegister notice requesting information on coalbed methane-related complaints. TheAgency received no information on complaints from these officials.

EPA 816-R-04-003 Chapter 7 Conclusions and Recommendations
Evaluation of Impacts to Underground Sources June 2004of Drinking Water by Hydraulic Fracturing ofCoalbed Methane Reservoirs 7-2
EPA reviewed responses and follow-up actions conducted by state agencies to addressgroundwater complaints involving coalbed methane. Hydraulic fracturing is not widelypracticed in the Powder River Basin (which includes Wyoming and Montana) andconcerned citizens from that area reported surface water and groundwater quantityproblems rather than specifying hydraulic fracturing as a problem. Studies ofgroundwater quality in the San Juan Basin (which includes parts of Colorado and NewMexico) do not address hydraulic fracturing directly. However, problems withgroundwater quantity and quality in Colorado may have plausible explanations other thanhydraulic fracturing activities. For example, natural fractures, and poorly constructed,sealed, or cemented wells used for various purposes, may provide conduits for methaneto move into shallow geologic strata and water wells, or even to surface water (BLM,1999). The New Mexico Oil Conservation Division reported that citizens beganreporting increased levels of methane in their water wells after coalbed methanedevelopment began in the San Juan Basin. New Mexico initiated a plugging andabandonment program to seal old, improperly abandoned production wells, whichappears to have mitigated the problem (Chavez, 2001).
EPA also obtained individual incident reports from Virginia. None of Virginia’s follow-up investigations provided evidence that hydraulic fracturing of coalbed methane wellshad caused drinking water well problems. Incidents in Alabama were investigated by theAlabama Oil and Gas Board, the Alabama Department of Environmental Management,and EPA Region IV. Samples from drinking water wells did not test positive forconstituents found in fracturing fluids. After reviewing all the available data and incidentreports, EPA sees no conclusive evidence that water quality degradation in USDWs is adirect result of injection of hydraulic fracturing fluids into coalbed methane wells andsubsequent underground movement of these fluids.
7.2 Fluid Injection Directly into USDWs or into Coal Seams Already InHydraulic Communication with USDWs
To determine if USDWs are threatened by the direct injection of fracturing fluids into aUSDW, EPA: 1) reviewed information on 11 major U.S. coal basins mined for coalbedmethane to determine if coal seams lie within USDWs, and 2) identified components offracturing fluids. EPA also used the information on the 11 major U.S. coal basins as wellas information collected on water quality incidents potentially associated with hydraulicfracturing to determine if coal seams are already in hydraulic communication withUSDWs. Hydraulic fracturing has been, or is being, performed in every basin reviewed.As summarized in Table 5-1 in Chapter 5, evidence suggests that coalbeds in 10 of the 11major coal basins in the United States are located at least partially within USDWs. Thecoalbeds in the Piceance Basin in Colorado, however, are several thousand feet belowUSDWs, and are unlikely to be in hydraulic communication with USDWs.

EPA 816-R-04-003 Chapter 7 Conclusions and Recommendations
Evaluation of Impacts to Underground Sources June 2004of Drinking Water by Hydraulic Fracturing ofCoalbed Methane Reservoirs 7-3
Hydraulic fracturing fluids injected into coalbed methane wells consist primarily ofwater, or inert nontoxic gases, and/or nitrogen foam and guar (a naturally occurringsubstance derived from plants). According to information gathered from MSDSs, on-sitereconnaissance of fracturing jobs, and interviews with service company employees, somehydraulic fracturing fluids may contain constituents of potential concern. Table 4.1 inChapter 4 lists examples of chemicals found in hydraulic fracturing fluids according tothe MSDSs. Constituents of potential concern include the following substances eitheralone or in combination: bactericides, acids, diesel fuel, solvents, and/or alcohols.Although the largest portion of fracturing fluid constituents is nontoxic (>95% byvolume), direct fluid injection into USDWs of some potentially toxic chemicals does takeplace.
For example, potentially hazardous chemicals are introduced into USDWs when dieselfuel is used in fracturing fluids in operations targeting coal seams that lie within USDWs.Diesel fuel contains constituents of potential concern regulated under SDWA – benzene,toluene, ethylbenzene, and xylenes (i.e., BTEX compounds). However, the threat posedto USDWs by introduction of these chemicals is reduced significantly by coalbedmethane production’s dependence on the removal of large quantities of groundwater (andinjected fracturing fluids) soon after a well has been hydraulically fractured. EPAbelieves that this groundwater production, combined with the mitigating effects ofdilution and dispersion, adsorption, and potentially biodegradation, minimize thepossibility that chemicals included in the fracturing fluids would adversely affectUSDWs.
Because of the potential for diesel fuel to be introduced into USDWs, EPA requested, andthe three major service companies agreed, to eliminate diesel fuel from hydraulicfracturing fluids that are injected directly into USDWs for coalbed methane production.Industry representatives estimate that these three companies perform approximately 95percent of the hydraulic fracturing projects in the United States. These companies signedan MOA on December 15, 2003 and have indicated to EPA that they no longer use dieselfuel as a hydraulic fracturing fluid additive when injecting into USDWs for coalbedmethane production (USEPA, 2003).
7.3 Breach of Confining Layer
The second mechanism by which hydraulic fracturing may affect the quality of USDWsis fracturing through a hydrologic confining layer, and creation of a hydrauliccommunication between a coal seam and an overlying USDW. If sufficiently thick andrelatively unfractured shale is present, however, it may act as a barrier not only tofracture height growth, but also to fluid movement.

EPA 816-R-04-003 Chapter 7 Conclusions and Recommendations
Evaluation of Impacts to Underground Sources June 2004of Drinking Water by Hydraulic Fracturing ofCoalbed Methane Reservoirs 7-4
A hydraulic fracture will propagate perpendicularly to the minimum principal stress. Insome shallow formations, the least principal stress is the overburden stress; thus, thehydraulic fracture will be horizontal. In deeper reservoirs, the least principal stress willlikely be horizontal; thus, the hydraulic fracture will be vertical. In general, horizontalfractures are most likely to exist at shallow depths (less than 1,000 feet) (Nielsen andHansen, 1987 as cited in Appendix A: DOE, Hydraulic Fracturing). Most coal seamscurrently used for methane production are relatively shallow compared to conventionaloil production wells, but still lie deeper than 1,000 feet.
Hydraulic fracturing may have increased or have the potential to increase thecommunication between coal seams and adjacent formations in some instances. Forexample, in the Raton Basin, some fracturing treatments resulted in higher than expectedwithdrawal rates for production water. Those increases, according to literature publishedby the Colorado Geologic Survey, may be due to well stimulations creating a connectionbetween targeted coal seams and an adjacent sandstone aquifer (Hemborg, 1998). In thePowder River Basin, concerns over the creation of such a hydraulic connection are citedas one reason why hydraulic fracturing of coalbed methane reservoirs is not widelypracticed in the region. Some studies that allow direct observation of fractures (i.e.,mined-through studies) also provided evidence that fractures move through interbeddedlayers, sometimes taking a stair-step pathway through complex fracture systems, andsometimes enter or propagate through geologic strata above the coal (i.e., roof rock)(Diamond, 1987a and b; Diamond and Oyler, 1987; Jeffrey et al., 1993).
Fracture height is important to the issue of whether or not hydraulic fracturing fluids canaffect USDWs because shorter fractures are less likely to extend into a USDW or connectwith natural fracture systems that may transport fluids to a USDW. The extent of afracture is controlled by the characteristics of the geologic formation (including thepresence of natural fractures), the volume and types of fracturing fluid used, the pumpingpressure, and the depth at which the fracturing is being performed. Deep verticalfractures can propagate vertically to shallower depths and develop a horizontalcomponent (Nielsen and Hansen, 1987, as cited in Appendix A: DOE, HydraulicFracturing). In these “T-fractures,” the presence of coal fines or a zone of stress contrastmay cause the fracture to “turn” and develop horizontally, sometimes at the contact of thecoalbed and an overlying formation (Jones et al., 1987b; Morales et al., 1990).
The low permeability of relatively unfractured shale may help to protect USDWs frombeing affected by hydraulic fracturing fluids in some basins. At some sites, shale may actnot only as a hydraulic barrier, but also as a barrier to fracture height growth. Shale’sability to act as a barrier to fracture height growth is due primarily to the stress contrastbetween the coalbed and the higher-stress shale (see Appendix A)
Another factor controlling fracture height can be the highly cleated nature of somecoalbeds. In some cases, highly cleated coal seams will prevent fractures from growingvertically. When the fracture fluid enters the coal seam, it is contained within the coal

EPA 816-R-04-003 Chapter 7 Conclusions and Recommendations
Evaluation of Impacts to Underground Sources June 2004of Drinking Water by Hydraulic Fracturing ofCoalbed Methane Reservoirs 7-5
seam’s dense system of cleats and the growth of the hydraulic fracture will be limited tothe coal seam (see Appendix A).
Mined-through studies indicate many hydraulic fractures that penetrate into, orsometimes through, formations overlying coalbeds can be attributed to the existence ofpre-existing natural fractures. However, given the concentrations and flowback ofinjected fluids, and the mitigating effects of fate and transport processes, EPA does notbelieve that possible hydraulic connections under these circumstances represent asignificant potential threat to USDWs.
7.4 Conclusions
Based on the information collected and reviewed, EPA has concluded that the injection ofhydraulic fracturing fluids into coalbed methane wells poses little or no threat to USDWsand does not justify additional study at this time. This decision is consistent with theprocess outlined in the April, 2001 Final Study Design, in which EPA indicated that itwould determine whether further investigation was needed after analyzing the Phase Iinformation. Specifically, EPA determined that it would not continue into Phase II of thestudy if the investigation found that no hazardous constituents were used in fracturingfluids, hydraulic fracturing did not increase the hydraulic connection between previouslyisolated formations, and reported incidents of water quality degradation were attributed toother, more plausible causes.
Although potentially hazardous chemicals may be introduced into USDWs whenfracturing fluids are injected into coal seams that lie within USDWs, the risk posed toUSDWs by introduction of these chemicals is reduced significantly by groundwaterproduction and injected fluid recovery, combined with the mitigating effects of dilutionand dispersion, adsorption, and potentially biodegradation. Additionally, EPA hasreached an agreement with the major service companies to voluntarily eliminate dieselfuel from hydraulic fracturing fluids that are injected directly into USDWs for coalbedmethane production.
Often, a high stress contrast between adjacent geologic strata results in a barrier tofracture propagation. This may occur in those coal zones where there is a geologiccontact between a coalbed and a thick, higher-stress shale that is not highly fractured.Some studies that allow direct observation of fractures (i.e., mined-through studies)indicate many fractures that penetrate into, or sometimes through, formations overlyingcoalbeds can be attributed to the existence of pre-existing natural fractures. However,and as noted above, given the concentrations and flowback of injected fluids, and themitigating effects of dilution and dispersion, fluid entrapment, and potentiallybiodegradation, EPA does not believe that possible hydraulic connections under thesecircumstances represent a significant potential threat to USDWs.

EPA 816-R-04-003 Chapter 7 Conclusions and Recommendations
Evaluation of Impacts to Underground Sources June 2004of Drinking Water by Hydraulic Fracturing ofCoalbed Methane Reservoirs 7-6
EPA also reviewed incidents of drinking water well contamination believed to beassociated with hydraulic fracturing and found no confirmed cases that are linked tofracturing fluid injection into coalbed methane wells or subsequent undergroundmovement of fracturing fluids. Although thousands of coalbed methane wells arefractured annually, EPA did not find confirmed evidence that drinking water wells havebeen contaminated by hydraulic fracturing fluid injection into coalbed methane wells.
Public Comment and Response Summary
for the Study on the PotentialImpacts of Hydraulic Fracturing
of Coalbed Methane Wells onUnderground Sources of
Drinking Water
FINAL

Printed on Recycled Paper
Office of WaterOffice of Ground Water and Drinking Water (4606M)EPA 816-R-04-004www.epa.gov/safewaterJune 2004

EPA 816-R-04-004
Public Comment and Response Summaryfor the Study on the Potential Impacts of
Hydraulic Fracturing of Coalbed Methane Wells onUnderground Sources of Drinking Water
FINAL
June 2004
United States Environmental Protection AgencyOffice of Water
Office of Ground Water and Drinking WaterDrinking Water Protection Division
Prevention Branch1200 Pennsylvania Avenue, NW (4606M)
Washington, DC 20460

Public Comment and Response Summary for June 2004Hydraulic Fracturing CBM Study FINALi
TABLE OF CONTENTS
LIST OF ACRONYMS AND ABBREVIATIONS . . . . . . . . . . . . . . . . . . . . . . . . . . . . . . . . . iv
I. INTRODUCTION . . . . . . . . . . . . . . . . . . . . . . . . . . . . . . . . . . . . . . . . . . . . . . . . . . . . . . . . . . 1
II. SCOPE OF THE STUDY . . . . . . . . . . . . . . . . . . . . . . . . . . . . . . . . . . . . . . . . . . . . . . . . . . . 5A. Areas Not Included in the Review . . . . . . . . . . . . . . . . . . . . . . . . . . . . . . . . . . . . . . . . . . . 5
1. Focus of the Report . . . . . . . . . . . . . . . . . . . . . . . . . . . . . . . . . . . . . . . . . . . . . . . . . . . 52. Monitoring . . . . . . . . . . . . . . . . . . . . . . . . . . . . . . . . . . . . . . . . . . . . . . . . . . . . . . . . . . 63. Use of Modeling Results . . . . . . . . . . . . . . . . . . . . . . . . . . . . . . . . . . . . . . . . . . . . . . . . 8
B. Literature Used for the Study . . . . . . . . . . . . . . . . . . . . . . . . . . . . . . . . . . . . . . . . . . . . . . . 8C. Basins Included in the Study . . . . . . . . . . . . . . . . . . . . . . . . . . . . . . . . . . . . . . . . . . . . . . 9D. Citizen Complaints/Instances of Water Well Contamination . . . . . . . . . . . . . . . . . . . . . . 9E. Peer Review Panel . . . . . . . . . . . . . . . . . . . . . . . . . . . . . . . . . . . . . . . . . . . . . . . . . . . . . . 11
III. FRACTURE FLUIDS . . . . . . . . . . . . . . . . . . . . . . . . . . . . . . . . . . . . . . . . . . . . . . . . . . . . 12A. Components of Fracturing Fluids . . . . . . . . . . . . . . . . . . . . . . . . . . . . . . . . . . . . . . . . . . 12
1. Health Effects . . . . . . . . . . . . . . . . . . . . . . . . . . . . . . . . . . . . . . . . . . . . . . . . . . . . . . . 12
2. Diesel Fuel . . . . . . . . . . . . . . . . . . . . . . . . . . . . . . . . . . . . . . . . . . . . . . . . . . . . . . 133. MTBE . . . . . . . . . . . . . . . . . . . . . . . . . . . . . . . . . . . . . . . . . . . . . . . . . . . . . . . . . . . . . 14
B. Comparison of Concentrations of Hydraulic Fracturing Fluid Components to MCLs . . 15C. Concentrations of Constituents in Fracturing Fluids/Fluid Recovery Rates . . . . . . . . . . 15
1. Estimates of Concentrations of Constituents in Fracturing Fluids . . . . . . . . . . . . . . . 152. Fluid Recovery Rates . . . . . . . . . . . . . . . . . . . . . . . . . . . . . . . . . . . . . . . . . . . . . . . . . 183. Amount of Fracturing Fluids . . . . . . . . . . . . . . . . . . . . . . . . . . . . . . . . . . . . . . . . . . . 194. Movement of Fracturing Fluids . . . . . . . . . . . . . . . . . . . . . . . . . . . . . . . . . . . . . . . . . 19
IV. FRACTURE BEHAVIOR AND PRACTICES . . . . . . . . . . . . . . . . . . . . . . . . . . . . . . . . 20A. Fracture Growth . . . . . . . . . . . . . . . . . . . . . . . . . . . . . . . . . . . . . . . . . . . . . . . . . . . . . . . . 20B. Multiple Fractures . . . . . . . . . . . . . . . . . . . . . . . . . . . . . . . . . . . . . . . . . . . . . . . . . . . . . . 21C. Relationship of Drinking Water Wells to Hydraulic Fracturing Activities . . . . . . . . . . . 22D. Differences in State Geology . . . . . . . . . . . . . . . . . . . . . . . . . . . . . . . . . . . . . . . . . . . . . . 22

Public Comment and Response Summary for June 2004Hydraulic Fracturing CBM Study FINALii
V. REGULATION OF HYDRAULIC FRACTURING PRACTICES . . . . . . . . . . . . . . . . 23A. States' Authority . . . . . . . . . . . . . . . . . . . . . . . . . . . . . . . . . . . . . . . . . . . . . . . . . . . . . . . . 23B. Regulation of Hydraulic Fracturing under SDWA . . . . . . . . . . . . . . . . . . . . . . . . . . . . . 23
VI. LANGUAGE USED IN THE REPORT . . . . . . . . . . . . . . . . . . . . . . . . . . . . . . . . . . . . . . 24A. Use of the Term "USDW" . . . . . . . . . . . . . . . . . . . . . . . . . . . . . . . . . . . . . . . . . . . . . . . 24B. Use of Scientific Terms . . . . . . . . . . . . . . . . . . . . . . . . . . . . . . . . . . . . . . . . . . . . . . . . . . 25C. Use of Qualifying Language . . . . . . . . . . . . . . . . . . . . . . . . . . . . . . . . . . . . . . . . . . . . . . 25
VII. CHAPTER-SPECIFIC COMMENTS . . . . . . . . . . . . . . . . . . . . . . . . . . . . . . . . . . . . . . 26A. Glossary . . . . . . . . . . . . . . . . . . . . . . . . . . . . . . . . . . . . . . . . . . . . . . . . . . . . . . . . . . . . . . 26B. Other Executive Summary Comments . . . . . . . . . . . . . . . . . . . . . . . . . . . . . . . . . . . . . . . 26C. Other Chapter 1 Comments (Introduction) . . . . . . . . . . . . . . . . . . . . . . . . . . . . . . . . . . . 27D. Other Chapter 2 Comments (Methodology) . . . . . . . . . . . . . . . . . . . . . . . . . . . . . . . . . . 28E. Other Chapter 3 Comments (Characteristics of CBM Production and HF Practices) . . . 28F. Other Chapter 4 Comments (HF Fluids) . . . . . . . . . . . . . . . . . . . . . . . . . . . . . . . . . . . . . 28G. Other Chapter 5 Comments (Basin Descriptions) . . . . . . . . . . . . . . . . . . . . . . . . . . . . . . 28H. Other Chapter 6 Comments (Water Quality Incidents) . . . . . . . . . . . . . . . . . . . . . . . . . . 29I. Other Chapter 7 Comments (Conclusions and Recommendations) . . . . . . . . . . . . . . . . 30
VIII. BASIN DESCRIPTIONS . . . . . . . . . . . . . . . . . . . . . . . . . . . . . . . . . . . . . . . . . . . . . . . . 30A. San Juan Basin . . . . . . . . . . . . . . . . . . . . . . . . . . . . . . . . . . . . . . . . . . . . . . . . . . . . . . . . . 30B. Black Warrior Basin . . . . . . . . . . . . . . . . . . . . . . . . . . . . . . . . . . . . . . . . . . . . . . . . . . . . 31C. Piceance Basin . . . . . . . . . . . . . . . . . . . . . . . . . . . . . . . . . . . . . . . . . . . . . . . . . . . . . . . . . 31D. Uinta Basin . . . . . . . . . . . . . . . . . . . . . . . . . . . . . . . . . . . . . . . . . . . . . . . . . . . . . . . . . . . 31E. Powder River Basin . . . . . . . . . . . . . . . . . . . . . . . . . . . . . . . . . . . . . . . . . . . . . . . . . . . . . 31F. Central Appalachian Basin . . . . . . . . . . . . . . . . . . . . . . . . . . . . . . . . . . . . . . . . . . . . . . . 31G. Northern Appalachian Basin . . . . . . . . . . . . . . . . . . . . . . . . . . . . . . . . . . . . . . . . . . . . . . 32H. Western Interior Basin . . . . . . . . . . . . . . . . . . . . . . . . . . . . . . . . . . . . . . . . . . . . . . . . . . . 32I. Raton Basin . . . . . . . . . . . . . . . . . . . . . . . . . . . . . . . . . . . . . . . . . . . . . . . . . . . . . . . . . . . 32J. Sand Wash Basin . . . . . . . . . . . . . . . . . . . . . . . . . . . . . . . . . . . . . . . . . . . . . . . . . . . . . . . 32K. Washington Coal Regions (Pacific and Central) . . . . . . . . . . . . . . . . . . . . . . . . . . . . . . . 32

Public Comment and Response Summary for June 2004Hydraulic Fracturing CBM Study FINALiii
LIST OF TABLES
TABLE 1: LIST OF PUBLIC COMMENTERS . . . . . . . . . . . . . . . . . . . . . . . . . . . . . . . . . . . . . 2

Public Comment and Response Summary for June 2004Hydraulic Fracturing CBM Study FINALiv
LIST OF ACRONYMS AND ABBREVIATIONS
BLM Bureau of Land ManagementBTEX Benzene, Toluene, Ethylbenzene, and XylenesCBM Coalbed MethaneCCL Contaminant Candidate ListCFR Code of Federal RegulationsCOGCC Colorado Oil and Gas Conservation CommissionEIS Environmental Impact StatementEPA United States Environmental Protection Agency or AgencyFR Federal RegisterGWPC Ground Water Protection CouncilMCL Maximum Contaminant LevelMOA Memorandum of AgreementMSDS Material Safety Data SheetMTBE Methyl Tert Butyl EtherNAS National Academy of SciencePWS Public Water SystemRfD Reference DoseSDWA Safe Drinking Water ActUCMR Unregulated Contaminant Monitoring RegulationUIC Underground Injection Control ProgramUSDW Underground Source of Drinking Water

1 US Environmental Protection Agency. 2002. Underground Injection Control (UIC) Program; HydraulicFracturing of Coalbed Methane (CBM) Wells Report--Notice. Federal Register. Vol. 67, No. 167. p. 55249, August28, 2002.
Public Comment and Response Summary for June 2004Hydraulic Fracturing CBM Study FINAL1
Public Comment and Response Summaryfor the Study on the Potential Impacts of Hydraulic Fracturing of
Coalbed Methane Wells on Underground Sources of Water
I. INTRODUCTION The United States Environmental Protection Agency's (EPA's) Office of Ground Water andDrinking Water completed its Phase I study, which assesses the potential for contamination ofunderground sources of drinking water (USDWs) from the injection of hydraulic fracturingfluids into coalbed methane (CBM) wells. EPA (or the Agency) began collecting information onhydraulic fracturing in the fall of 2000. Based on the information collected and reviewed, EPAhas concluded that the injection of hydraulic fracturing fluids into CBM wells poses little or nothreat to USDWs and does not justify additional study at this time. The draft report, titled, "Draft Evaluation of Impacts to Underground Sources of Drinking Waterby Hydraulic Fracturing of Coalbed Methane Reservoirs" (hereafter referred to as the draftreport), was made available for public comment by an announcement in the Federal Register onAugust 28, 2002.1 The 60-day public comment period officially ended on October 28, 2002.
The Agency received and reviewed comments from 105 commenters. Several of these weresigned by multiple parties (which were counted as one commenter), including a few coalitions ofenvironmental organizations. The commenters include private citizens; environmental andcitizen groups; government agencies at the local, state, and national levels; oil and gascompanies; trade associations; and four other commenters that do not fit these categories. Table1 below provides a listing of these commenters.

Public Comment and Response Summary for June 2004Hydraulic Fracturing CBM Study FINAL2
TABLE 1: LIST OF PUBLIC COMMENTERS
Docket ID1 Edocket ID(OW-2001-0002)2 Organization (State)
Environmental/Citizens GroupsII-D1.014 045 Bull Mountain Landowners Association (MT)II-D1.025 055 Land and Water Fund of the Rockies (CO)II-D1.040 068 Dickenson County Citizens Committee (VA)II-D1.046 074 Western Organization of Resource Councils and Coalition of
11 Other Environmental/Citizens Groups (DC)II-D1.055 043 Coalition of 28 Environmental/Citizens Groups (varies)II-D1.060 085 Oil & Gas Accountability Project and Coalition of 34 Other
Environmental/Citizens Groups (CO)II-D1.072 100 National Resources Defense Council (DC)II-D1.101 139 San Juan Citizen's Alliance (CO)II-D1.076; II-D2.001; II-D2.002 106 - 109 Kentucky Resources Council, Inc. (KY)Private Citizens II-D1.004 033 Citizen (AK)II-D1.050 031 Citizen (AL)II-D1.012; II-D1.017 041; 048 Citizen (CA - 2)II-D1.002; II-D1.003; II-D1.006;II-D1.008; II-D1.009; II-D1.011;II-D1.016; II-D1.018; II-D1.022;II-D1.023; II-D1.024; II-D1.026;II-D1.030; II-D1.031; II-D1.032;II-D1.034; II-D1.037; II-D1.038;II-D1.043; II-D1.044; II-D1.049;II-D1.058; II-D1.065; II-D1.067;II-D1.081; II-D1.083; II-D1.084;II-D1.085; II-D1.086; II-D1.087;II-D1.088; II-D1.089; II-D1.093;II-D1.095; II-D1.097; II-D1.099;II-D1.100; II-D1.102; II-D2.008
110; 032; 035;037; 038; 040;047; 049; 052;053; 054; 056;060; 061; 112;128; 065; 066;071; 072; 075;083; 092; 094;118; 120; 121;122; 123; 124;125; 126; 131;133; 135; 137;138; 140; 148
Citizen (CO - 39)
II-D1.015; II-D1.027; II-D1.029;II-D1.041; II-D1.098
046; 057; 059;069; 136
Citizen (FL - 5)
II-D1.007 036 Citizen (KS)II-D1.039; II-D1.048; II-D2.007 067; 030; 142 Citizen (MT - 3)II-D1.005; II-D1.033; II-D1.051 034; 062; 076 Citizen (NM - 3)II-D1.013; II-D1.019 044; 050 Citizen (NY - 2)II-D1.042 070 Citizen (UT)II-D1.028; II-D1.094 058; 132 Citizen (state unknown - 2)State/Local/Federal AgenciesII-D1.010 039 Sandia National Laboratories (NM)II-D1.045 073 San Miguel County Board of Commissioners (CA)II-D1.047 029 Alabama Oil and Gas Board (AL)II-D1.057 082 State of New Mexico Energy, Minerals and Natural
Resources Department (NM)II-D1.059 084 Virginia Division of Gas and Oil (VA)II-D1.061 086 Colorado Geological Survey (CO)II-D1.062 087; 088 Michigan Department of Environmental Quality (MI)II-D1.063 089 Pennsylvania Department of Conservation and Natural
Resources (PA)II-D1.064 090 State of Utah Department of Natural Resources, Division of
Oil, Gas and Mining (UT)II-D1.066 093 Alaska Oil and Gas Conservation Commission (AK)

TABLE 1: LIST OF PUBLIC COMMENTERS
Docket ID1 Edocket ID(OW-2001-0002)2 Organization (State)
Public Comment and Response Summary for June 2004Hydraulic Fracturing CBM Study FINAL3
II-D1.068 095 State of South Dakota (SD)II-D1.069 096 Ohio Department of Natural Resources (OH)II-D1.073 101; 102 Conservation Division of the Kansas Corporation
Commission (KS)II-D1.079 116 State of Louisiana, Department of Natural Resources (LA)II-D1.080 117 Colorado Oil & Gas Conservation Commission (CO)II-D1.082 119 State of Missouri Department of Natural Resources,
Geological Survey & Resource Assessment Division (MO)II-D1.092 130 Indiana Department of Natural Resources, Division of Oil and
Gas (IN)II-D1.096 134 State of Oklahoma, Office of the Secretary of Energy (OK)II-D1.103 147 Delta County Commissioners (CO)II-D2.006 141 Office of Fossil Energy, Department of Energy (DC)II-D2.009 149 Ohio Department of Natural Resources, Division of Mineral
Resources Management (OH)Oil and Gas CompaniesII-D1.070 097 Halliburton Energy Services (TX)II-D1.075 105 Chevron Texaco North American Upstream (TX)II-D1.090 127 Shell Exploration & Production Company (TX)Trade AssociationsII-D1.035 113 Domestic Petroleum Council (DC)II-D1.036 064 Independent Petroleum Association (DC)II-D1.052 077 Interstate Oil and Gas Compact Commission (OK)II-D1.053 080 Independent Oil & Gas Association of West Virginia (WV)II-D1.054 042 Coalbed Methane Association of Alabama (AL)II-D1.056 081 Oklahoma Independent Petroleum Association (OK)II-D1.071 099 Ground Water Protection Council (OK)II-D1.074 104 American Petroleum Institute (DC)OtherII-D1.020 051 Pace Law School (NY)II-D1.021 111 University of Montana, Montana Bureau of Mines and
Geology, Montana Tech (MT)II-D1.077 114 Steven Harper, Attorney at Law (CO)II-D1.078 129 Hansen Environmental Consultants (WA)1 Docket Identification numbers are assigned by the Water Docket in order to track each public comment with aunique identification number. Note that if a comment has a prefix of "II-D2," it indicates that the comment wasreceived after the October 28, 2002 comment deadline. Comments with the following docket logs were updates,repeats, or clarifications of other comments: II-D1.91; II-D2.03; II-D2.04; and II-D2.05. 2 An electronic version of each public comment is available through EPA's electronic public docket and commentsystem, EPA Dockets at http://www.epa.gov/edocket/. Each comment begins with the prefix "OW-2001-0002-". Edocket numbers were assigned to comment materials, as well as other relevant background documents in theorder they were posted to the edocket Web site.

Public Comment and Response Summary for June 2004Hydraulic Fracturing CBM Study FINAL4
The remainder of this document contains summaries of the major public comments and EPA'sresponses related to the Agency's August 2002 report. The document is divided into seven othermajor sections as follows:
• Section II: Scope of the Study discusses public comments and EPA's responses onareas not included in the study, the literature used for the review, the number of coalbasins included in the study, citizen complaints regarding water well contamination,and the peer review panel who reviewed the initial draft of the report.
• Section III: Fracturing Fluids describes public comments and EPA's responsesrelated to the components of fracturing fluids, EPA's comparison of the concentrationof fracturing fluid constituents to maximum contaminant levels (MCLs), EPA'sestimates for the concentrations of fracturing fluid chemicals at the point-of-injectionand the edge of the fracture zone, the amount of fracturing fluids that is recoveredfrom CBM reservoirs, the amount of fracturing fluids used in hydraulic fracturingprocedures, and the movement of "stranded" fluids in the coalbed formations.
• Section IV: Fracture Behavior and Practices discusses comments raised andEPA's responses to these comments regarding fracture growth, multiple fracturing ofthe same well, the relationship of drinking water wells to hydraulic fracturingactivities, and differences in state geology.
• Section V: Regulation of Hydraulic Fracturing Practices describes comments andthe Agency's responses regarding the states' authority over hydraulic fracturingpractices, and the regulation of hydraulic fracturing under the Safe Drinking WaterAct (SDWA).
• Section VI: Language Used in the Report summarizes specific comments and theAgency's responses related to the use of the term "USDW" in the report, use ofscientific terms, and the tone of the language in the report.
• Section VII: Chapter-Specific Comments describes comments and the Agency'sresponse regarding the glossary, executive summary, and Chapters 1 through 7 thatwere not already covered under Sections II through VI of this document.
• Section VIII: Basin Descriptions describes comments that pertain to the basin-specific descriptions in Attachments 1 through 11 of the report and EPA's response tothese comments. The comments and responses in Section VIII do not includecomments that were already discussed in Sections II through VII of this document.

Public Comment and Response Summary for June 2004Hydraulic Fracturing CBM Study FINAL5
II. SCOPE OF THE STUDY
A. Areas Not Included in the Review1. Focus of the Report Summary of Comments: One commenter indicated that the report should have focused on thepossible impacts to human health instead of the hydraulic fracturing process. This commenteradded that Chapter 4 of the report should have focused on dose-response curves and not on theproperties of hydraulic fracturing fluids. The commenter also stated that EPA should have beenable to conduct this analysis because the Agency should have access to research conducted onthe toxicity of all constituents used in CBM production.
Another commenter stated that the study did not address the uncertainty in the risk assessmentdue to omissions and errors in the data used for the study. This commenter indicated that someof the reasons for these omissions and errors could be inadequate reporting by private wellowners and counties, inadequate testing, and inadequate enforcement which would result in anunderassessment of risk. This commenter also indicated that the report does not address riskresulting from deviations and failures in drilling, fracturing, and monitoring practices, especiallyfor newer wells, or sufficiently address the testing error for volatile chemicals used in hydraulicfracturing.
EPA Response: The Phase I study was not intended to be a risk assessment, but rather, to be afact-finding effort based primarily on existing literature to assess the potential threat to USDWsfrom the injection of hydraulic fracturing fluids into CBM wells and to determine based on thesefindings, whether additional study is warranted. The study is tightly focused on hydraulicfracturing of CBM wells and does not include other aspects of drilling or CBM production. EPAreviewed water quality incidents potentially associated with hydraulic fracturing, as well asevaluated the theoretical potential for hydraulic fracturing to affect USDWs. EPA researchedover 200 peer-reviewed publications, interviewed approximately 50 employees from industryand state or local government agencies, and communicated with approximately 40 citizens andgroups who are concerned that CBM production affected their drinking water wells.
For the purposes of this study, EPA assessed USDWs impacts by the presence or absence ofdocumented drinking water well contamination cases caused by CBM hydraulic fracturing, clearand immediate contamination threats to drinking water wells from CBM hydraulic fracturing,and the potential for CBM hydraulic fracturing to result in USDW contamination based on twopossible mechanisms described below.
1. Direct injection of fracturing fluids into a USDW in which the coal is located, orinjection of fracturing fluids into a coal seam that is already in hydrauliccommunication with a USDW (e.g., through a natural fracture system).
2. Creation of a hydraulic connection between the coalbed formation and an adjacentUSDW.
EPA's report includes a discussion of the types of fracturing fluids and additives, and fluidvolumes that may be used in hydraulic fracturing operations. This discussion is intended to

Public Comment and Response Summary for June 2004Hydraulic Fracturing CBM Study FINAL6
provide further background on the hydraulic fracturing process. In addition, the study provides areview of the fate and transport of injected fluids in the subsurface in order to determine whethera detailed risk assessment is warranted.
2. MonitoringSummary of Comments: Several commenters questioned how EPA could decide whetherhydraulic fracturing poses a risk to USDWs without collecting or reviewing monitoring data. Several commenters wanted EPA to proceed to Phase II of the study and to install monitoringwells in areas where hydraulic fracturing of CBM wells was occurring. One commenterrecommended that, at a minimum, EPA identify whether any type of monitoring has beenconducted by consulting firms, local or state agencies, or members of the academic community,and if this monitoring exists, to include the results in the report.
Another commenter recommended that EPA, in cooperation with the National Academy ofScience (NAS), conduct unannounced inspections of hydraulic fracturing projects in order tocollect samples of hydraulic fracturing fluids, and observe and measure the total volume ofinjected hydraulic fracturing fluid. This commenter also recommended that EPA establishreference doses (RfDs) and MCLs for all chemicals currently used in hydraulic fracturing fluidsin significant volumes.
EPA Response: EPA has researched and reviewed a variety of monitoring information that maybe related to the issue of possible conduits for fracturing fluid transport into USDWs. These dataare discussed in Chapter 6 of the report. For example, EPA reviewed a 1999 Bureau of LandManagement (BLM) report which focused on monitoring and data interpretation of methaneconcentrations in groundwater in the San Juan Basin area. EPA reviewed this report todetermine if it contained information pertaining to hydraulic fracturing of CBM and its impacts,if any, to the quality of water in drinking water aquifers in this basin.
Chapter 6 of the report provides a detailed discussion of citizen complaints and state responses totheir concerns. Complaints were responded to by various state agencies, and many of thoseresponses included testing of water for contaminants. For example, the Virginia Department ofMines, Minerals and Energy is responsible for: responding to environmental issues associatedwith oil and gas development (including CBM); investigating all reported water problems; andtesting water samples for contaminants that may be introduced by drilling (such as chlorides, oiland grease, and volatile organics).
EPA disagrees that monitoring data is needed to determine whether a Phase II study iswarranted. As discussed in the previous response, EPA conducted an extensive literature review,conducted numerous interviews, reviewed water quality incidents potentially associated withhydraulic fracturing, and evaluated the theoretical potential for hydraulic fracturing to affectUSDWs. EPA's decision that the injection of hydraulic fracturing fluids into CBM wells poseslittle or no threat to USDWs and does not justify additional study at this time is consistent withthe process outlined in the April, 2001 Final Study Design. In its final study design, EPAindicated that the Agency would make a determination regarding whether further investigationwas needed after analyzing the Phase I information.

Public Comment and Response Summary for June 2004Hydraulic Fracturing CBM Study FINAL7
EPA has recently taken a specific and important measure to address one of the primary concernsregarding hydraulic fracturing fluid – the use of diesel fuel. During EPA's research, the Agencyrealized that diesel is sometimes used a component of fracturing fluids and is of specific concernbecause it contains BTEX compounds (benzene, toluene, ethylbenzene, and xylenes) for whichMCLs have been established under SDWA. Because of the potential problem diesel can cause,EPA requested its removal from hydraulic fracturing fluids. On December 15, 2003, EPAentered into a Memorandum of Agreement (MOA) with three major service companies – BJServices Company, Halliburton Energy Services, Inc., and Schlumberger TechnologyCorporation – to voluntarily eliminate diesel fuel from hydraulic fracturing fluids that areinjected directly into USDWs for CBM production. If necessary, these companies will selectreplacements that will not cause hydraulic fracturing fluids to endanger USDWs. Industryrepresentatives estimate that these three companies conduct an estimated 95 percent of thehydraulic fracturing projects in the United States. These three have indicated to EPA that theyno longer use diesel fuel as a hydraulic fracturing fluid additive when injecting into USDWs.
EPA, through its Underground Injection Control (UIC) Program, as authorized under SDWA Part C, Sections 1421-1426), is responsible for ensuring that fluids injected into the ground donot endanger USDWs or cause a public water system (PWS) to violate its drinking waterstandards due to the contamination of a USDW by these injected fluids. Most states haveprimary enforcement authority (primacy) for implementation of the UIC Program, and thus havethe authority under SDWA to place controls on any injection activities that may threatenUSDWs. 40 CFR 145.12, Requirements for Compliance Evaluation Programs, requires thatauthorized states have programs for periodic inspections of injection operations. States may alsohave additional authorities by which they can regulate hydraulic fracturing. While surpriseinspections are not specifically mandated, state programs have a responsibility to conductinspections, as necessary, to determine compliance with permit conditions, and to verify theaccuracy of monitoring data and other information. EPA requires that all UIC inspectors becertified in, and that inspectors be knowledgeable about, proper operation of injection facilities,protection of USDWs, and SDWA requirements.
Regarding the establishment of RfDs and MCLs for all hydraulic fracturing fluid chemicals usedin significant volumes, EPA follows an established procedure for identifying the contaminantsfor which these standards will be set. The Contaminant Candidate List (CCL) and theUnregulated Contaminant Monitoring Regulation (UCMR) are the primary review mechanismsby which EPA identifies drinking water contaminants which pose the most urgent threat topublic health. The CCL process uses the best available information on contaminants of concernand emerging contaminants to prioritize according to potential public health threat, and identifycandidates for possible regulation. The UCMR provides occurrence information for determininghuman exposure, establishing the baseline for health effects and economic analyses, contaminantco-occurrence analyses, and treatment technology evaluation (related to the CCL contaminants). After identifying the top priorities for regulatory determination, EPA begins the process ofdetermining RfDs and associated enforceable standards for protection of public health.
3. Use of Modeling ResultsSummary of Comments: One commenter recommended that EPA compare the results ofhydraulic fracturing after the process to "modeling" conducted before the process to "providesome degree of predictability of the impact of the fracturing before the actual work is done."

Public Comment and Response Summary for June 2004Hydraulic Fracturing CBM Study FINAL8
This commenter also recommended that any modeling should consider the effect of otherexisting activities and conditions that could affect the outcome of the model (e.g., existing oiland gas wells, water wells, location and type of surface structures). This commenter also statedthat consideration of the impact of these "man induced activities and conditions" should be anintegral part of any fracture program and of any analysis of CBM fracturing impact. Thiscommenter stated that the fracturing process and fluids alone may not cause "harm" within thestudy's parameters, but when coupled with the existing "man induced conditions" could cause"considerable damage and risk."
EPA Response: As discussed in Chapter 3 of the report, operators use a number of techniques toestimate fracture dimensions to design fracture stimulation treatments. Operators have afinancial incentive to keep the hydraulically induced fracture generally within the target coalzone, so that expenditures on hydraulic horsepower, fracturing fluids, and proppants areminimized. For precise and statistically reliable measurements, however, fracture height andlength can be measured (as opposed to modeled) accurately by microseismic monitoring. Tiltmeter measurements can also provide fracture height and length measurements somewhataccurately. The results of hydraulic fracturing "after the process" have also been investigated inthe mined-through studies by the U.S. Bureau of Mines and others. These studies provideimportant, directly-measured characteristics of hydraulic fracturing in coal seams andsurrounding strata. In addition, paint tracer studies conducted as part of mined-through studiescan provide lower bound estimates on the extent of fluid movement.
During its analysis of the threat of CBM fracturing practices on USDWs, EPA considered theimpact of human activities (such as improperly sealed or abandoned wells). Chapter 6 of thereport summarizes citizen complaints and resulting investigations by state agencies into possibleimpacts of hydraulic fracturing on drinking water wells and surface waters. In some cases,improperly sealed gas wells have been remediated, resulting in decreased concentrations ofmethane in drinking water wells.
B. Literature Used for the StudySummary of Comments: Some commenters indicated that the literature used for the study wasoutdated. Another commenter questioned whether the search terms that the Agency used to findreferences for the report would locate "health-related" literature. This commenter alsoquestioned whether the acronym "USDW" and/or "underground sources of drinking water" wasused as a search term. Another commenter stated that the report was "simply a compilation ofexisting data, with no new information, references, or conclusions."
EPA Response: The search terms used by the Agency did not include health-related termsbecause the study's goals did not include conducting a human-health risk assessment orconducting a new investigation into the toxicity of any of the components of hydraulic fracturingfluids.

2 US Environmental Protection Agency. 2001. Underground Injection Control; Request for Information of
Ground Water Contamination Incidents Believed To Be Due to Hydraulic Fracturing of Coalbed MethaneWells. Federal Register. Vol. 66, No. 146. p. 39396, July 30, 2001.
Public Comment and Response Summary for June 2004Hydraulic Fracturing CBM Study FINAL9
As stated in the study design (66 FR 39396)2, EPA focused the study on a review of existingdata. EPA's literature search included publications and documents that were publically availableas of December 2000/January 2001. EPA reviewed over 200 peer-reviewed publications. Muchof the appropriate literature comes from the mid-1990s when funding was available for this kindof research. EPA also reviewed additional studies recommended by commenters and the peerreview panelists, and incorporated information from these documents into the study, whenappropriate. Further, EPA obtained information for the study through interviews withapproximately 50 employees from industry and state or local government agencies, andcommunication with approximately 40 citizens and groups who are concerned that CBMproduction affected their drinking water wells.
C. Basins Included in the Study Summary of Comments: One commenter questioned why EPA's report only included 11 basins. This commenter indicated that there are 16 separate basins considered to have CBM resources inthe lower 48 states. Further, the commenter stated that the Illinois Basin, which was notdiscussed in the study, is a major coal-bearing region in the central Midwest.
EPA Response: EPA's literature search did not find any CBM activity or hydraulic fracturing inthe Illinois Basin. Other basins which have little or no current CBM production activity (e.g.,Alaska) were also omitted from the study.
D. Citizen Complaints/Instances of Water Well ContaminationSummary of Comments: Many commenters stated that EPA and state agencies have not done anadequate job of investigating citizen complaints related to contamination of water wells nearhydraulically fractured CBM wells. Some commenters also stated that the Agency disregardedthese complaints by concluding in its draft report that hydraulic fracturing of CBM wells poses alow risk. Some commenters also believed that the volume of complaints was enough to warrantthe need for the Agency to continue its study. One commenter criticized the Agency for onlyhaving a 30-day collection period associated with the July 30, 2001 Federal Register notice inwhich the Agency requested information on groundwater contamination incidents that could bedue to hydraulic fracturing of CBM wells. This commenter added that EPA's outreach effortswere unlikely to have reached the general public, and also recommended that EPA set uphotlines and make resources available to "allow immediate, comprehensive investigations ofcitizen complaints related to hydraulic fracturing impacts on USDWs."
Conversely, others commenters indicated that based on the volume of hydraulic fracturingactivities, that if the threat to public health from hydraulic fracturing of CBM wells weresignificant, confirmed instances of water well contamination would exist. Some of these

3 US Environmental Protection Agency. 2000. Underground Injection Control (UIC) Program; ProposedCoal Bed Methane (CBM) Study Design. Federal Register. Vol. 65, No. 143. p. 45774, July 25, 2000.
Public Comment and Response Summary for June 2004Hydraulic Fracturing CBM Study FINAL10
commenters indicated that EPA's report should acknowledge the 1998 study conducted by theGround Water Protection Council (GWPC), "Survey Results On Inventory and Extent ofHydraulic Fracturing in Coalbed Methane Wells in the Producing States," GWPC (December 15,1998) because this survey of state oil and gas regulators provides further support for EPA's studyconclusions.
EPA Response: The response of state agencies and EPA to citizen complaints are documented inChapter 6. EPA has responded to complaints, particularly at the Regional level. For instance, inthe Powder River Basin, located in Wyoming and Montana, citizen complaints dealt primarilywith water quantity issues, which were beyond the scope of this study. EPA Region 8 isparticipating in a study that addresses the environmental effects of all aspects of CBMdevelopment and not just hydraulic fracturing. In response to citizen complaints, the AlabamaDepartment of Environmental Management and EPA Region 4 also conducted independentsampling on wells in the Black Warrior Basin. Water analyses indicated that the wells had notbeen contaminated as a result of the hydraulic fracturing activities.
In some regions responses to citizen complaints are made primarily at the state level. Forexample, the Colorado Department of Health and the Colorado Oil and Gas ConservationCommission (COGCC) responds to many complaints. In Colorado, the primary response of theCOGCC to citizen complaints has been the remediation of old, improperly sealed gas wells. Theremediation of such wells has reduced methane concentrations in approximately 27 percent ofthe water wells sampled. Reduction of methane concentrations in many of the additional wells isexpected over time due to the COGCC's efforts.
Regarding public outreach efforts need improvement, EPA has made considerable efforts toensure its outreach and communications reach the general public. In addition to making theAugust 2002 draft available for public comments, EPA's outreach steps included:
• Publishing Federal Register notices (EPA's primary mechanism forcommunicating with the public): - requesting comment on how an EPA study should be structured (65 FR
45774)3; - requesting information on any impacts to groundwater believed to be
associated with hydraulic fracturing (66 FR 39396) (see footnote 2)including a mailing to over 200 county agencies making them aware of theFederal Register notice; and
- requesting comments on the August 2002 draft of the study (67 FR 55249) (see footnote 1).
• Holding a public meeting on August 24, 2000, to obtain additional stakeholderinput on the study. Several of these commenters recommended that EPA's studyinclude accounts of personal experiences with regard to CBM impacts ondrinking water wells. These experiences are discussed in Chapter 6.

Public Comment and Response Summary for June 2004Hydraulic Fracturing CBM Study FINAL11
• Providing periodic updates for stakeholders, including citizens groups, in the formof written communication; and
• Maintaining a Web site where stakeholders can view the project documents; getupdates on the progress of the project (including announcements of the release ofFederal Register notices); and provide information to EPA.
Regarding the comment that EPA only provided 30 days for the public to provide information onCBM-related groundwater contamination incidents following the July 30, 2001 Federal Registernotice, note that the Agency has considered all complaints received from the public, regardlessof the time at which EPA received them. In addition, EPA's Web sitewww.epa.gov/safewater/uic/cbmstudy.html has a link to a form that allows people to submitinformation on the potential effects of hydraulic fracturing.
In response to the commenter's suggestion regarding hotlines, EPA has its Safe Drinking WaterHotline, which callers within the United States may reach at (800) 426-4791. Citizens arewelcome to contact EPA or the states regarding these issues.
Regarding the comment about the volume of CBM activities and lack of confirmed instances ofwater well contamination, during its review, EPA found no confirmed cases that are linked tofracturing fluid injection into CBM wells or subsequent underground movement of fracturingfluids. Although thousands of CBM wells are fractured annually, EPA did not find confirmedevidence that drinking water wells have been contaminated by hydraulic fracturing fluidinjection into CBM wells. EPA has included language to that effect in its final report,"Evaluation of Impacts to Underground Sources of Drinking Water by Hydraulic Fracturing ofCoalbed Methane Reservoirs", June 2004, EPA document number: EPA 816-R-04-003(hereafter referred to as final report).
E. Peer Review Panel Summary of Comments: Many commenters questioned the composition of EPA's peer reviewpanel, who reviewed the initial draft report. These commenters stated that this panel was heavilybiased toward industry that has a stake in the outcome of the study. These commentersrecommended that EPA convene a panel that is free of conflict of interest. Some recommendedusing members of the NAS as panelists.
One commenter indicated that he could not ascertain the composition of the panel althoughAppendix B of the report is supposed to contain a table with the list of the peer review panel. Another commenter stated that EPA made it very difficult for the public to obtain a copy of thepeer review report, and that these comments were not attached in an appendix as originallypromised.
EPA Response: EPA has a formal Agency Peer Review Policy that establishes the criteria andrequirements for independent evaluation of scientific and technical studies and documents. Consistent with that policy, the Agency established a seven-member technical expert peer reviewpanel, who performed a technical review of the study. Panel members were selected byidentifying individuals with scientific or technical expertise in hydraulic fracturing through

4 Palmer, I.D., Fryar, R.T., Tumino, K.A., and Puri, R. 1991. Comparison between gel-fracture andwater-fracture stimulations in the Black Warrior basin; Proceedings 1991 Coalbed Methane Symposium, Universityof Alabama (Tuscaloosa), pp. 233-242).
Public Comment and Response Summary for June 2004Hydraulic Fracturing CBM Study FINAL12
reviewing peer-reviewed publications in scientific journals and through communications withprofessional societies, trade and business associations, state organizations, and other federalagencies. EPA considered over 20 candidates before selecting 7 individuals based on theirexperience in the fields of hydraulic fracturing, rock mechanics, and/or natural gas production,and for their varying perspectives (industry, state government, academia, and a nationallaboratory). The charge to this committee was to review the report to determine if: 1) the reportis complete, thorough, and accurate; and 2) the scientific/technical studies reviewed are appliedin a sound, unbiased manner.
EPA posted the list of these reviewers and their qualifications on its Web site atwww.epa.gov/safewater/uic/cbmstudy.html. EPA inadvertently omitted the table that identifiesthe peer reviewers in Appendix B of the draft report. This table is included in the final report.
III. FRACTURE FLUIDS
A. Components of Fracturing Fluids1. Health EffectsSummary of Comments: Many commenters were concerned about the amount and health effectsof certain chemicals used in hydraulic fracturing fluids and cited these concerns as reasons tocontinue the study. Some argued that very small quantities of toxic chemicals, such as benzeneor methyl tert butyl ether (MTBE), could contaminate millions of gallons of groundwater.
Other commenters were concerned about the way in which the constituents of fracturing fluidsand their potential health effects were presented in the draft report. For example, one commenterwanted the report to clearly convey the following: a wide variety of fracturing fluids exist, thehealth effects identified in the report apply to only some of the constituents that may or may notbe present in the fracturing fluid, the health effects are associated with the product in its "pureform," and all the fluids additives are greatly diluted during fracturing operations.
EPA Response: As discussed in section II.A.2, EPA has recently entered into agreements withthree major service companies to voluntarily eliminate diesel fuel from hydraulic fracturingfluids injected directly into USDWs for CBM production. Compounds such as benzene arecomponents of diesel. These agreements will significantly reduce the use of diesel fuel inhydraulic fracturing fluids that are injected directly into USDWs for CBM production.
Chapter 4 of the final report provides a general description of the fate and transport processeswhich would minimize potential exposure to chemicals used in hydraulic fracturing fluids. Based on a 1991 fracturing fluid recovery study conducted in coal by Palmer et al., as much as68 to 82 percent of the fracturing fluids may be removed when the methane is extracted.4 Thisstudy is discussed in Chapter 3 of the report. As detailed in Chapter 4 of the report, the

5 U.S. Department of the Interior, Bureau of Land Management, Colorado State Office. 1998. GlenwoodSpring Resource Area: Oil & Gas Leasing Development, Draft Supplemental Environmental Impact Statement, June1998.
Public Comment and Response Summary for June 2004Hydraulic Fracturing CBM Study FINAL13
unrecovered fluids will undergo processes that may limit their availability, concentration, andmovement. These fluids may be significantly diluted and dispersed as they are transportedthrough the subsurface. They may also interact chemically or physically with geologic materialwhich may retard their movement and further disperse their concentrations.
EPA identified fluids and fluid additives commonly used in hydraulic fracturing throughliterature searches, reviews of relevant material safety data sheets (MSDSs) provided by servicecompanies, and discussions with field engineers, service company chemists, and state and federalemployees. The draft and final reports provide a discussion of the wide variety of hydraulicfracturing fluids that may be used. Table 4-1 of the report lists components that may becontained in fracturing fluids based on MSDSs. The final report emphasizes that not allfracturing fluid constituents, identified in Table 4-1 of this report, may be present in fracturingfluids, that the potential human health effects presented in the table apply to these compounds intheir pure form, and that these compounds are significantly diluted prior to use.
An environmental impact statement (EIS) prepared by the BLM also identified MTBE as acompound that may be found in fracturing fluid (U.S. Department of the Interior, CO StateBLM, 1998).5 However, EPA was unable to find any indications in the literature, on MSDSs, orin interviews with service companies that MTBE is used in fracturing fluids to stimulate CBMwells. 2. Diesel FuelSummary of Comments: Several commenters supported EPA's recommendation that theindustry use "water-based" alternatives in lieu of hazardous constituents such as diesel fuel. Some argued that EPA should make this a requirement and not a recommendation. Some ofthese commenters pointed to EPA's recommendation to "remove any threat whatsoever" fromhydraulic fracturing fluid as a contradiction to the study's conclusions and as a reason to continuethe study.
Conversely, several commenters indicated that there are valid reasons for using certainchemicals to enhance CBM production and that in choosing alternatives, the CBM well operatorsmust take into account the specific geologic conditions of the site. These commentersrecommended that EPA "encourage flexibility" with respect to the production of methane. Oneof these commenters noted that the draft report suggests that water-based alternatives are: currently available, feasible, and acceptable substitutes for diesel-based gels. This commenterindicated that the report findings should recognize that more research is needed on thesepotential alternatives. This commenter added that not all of the potential alternatives to the useof diesel may be water-based, citing polymer-based alternatives as one possibility. Thiscommenter recommended that the term "water-based alternatives" be changed to read "non-diesel-based alternatives."

Public Comment and Response Summary for June 2004Hydraulic Fracturing CBM Study FINAL14
One commenter indicated that in the State of Alabama, diesel is not used nor is it approved forhydraulic fracturing. The commenter added that service companies in his state primarily use alinear gel composed of guar gum, a surfactant, and silica.
EPA Response: The discussion of potential alternatives to the use of diesel is not included in thefinal report because it is outside the scope of the study. Instead, the report highlights the MOAwith three major service companies to voluntarily eliminate the use of diesel fuel in hydraulicfracturing fluids injected directly into USDWs for the purpose of CBM production and ifnecessary, select replacements that will not cause hydraulic fracturing fluids to endangerUSDWs (see the response to comment in section II.A.2).
Regarding the comment on the use of diesel in the State of Alabama, Table A2-1 in Attachment2 of the draft and final report indicates that diesel is not used in that state.
3. MTBE Summary of Comments: Several commenters were concerned about the use of MTBE infracturing fluids. Many of them included the following statement in their comments: "only 28tablespoons of MTBE could contaminate millions of gallons of groundwater."
One commenter indicated that the report contains several inconsistent statements regardingMTBE as a component of fracturing fluids. This commenter noted that in Chapter 4 of the draftreport, EPA states that, based on its literature reviews and interviews with service companies, theAgency did not find any evidence that MTBE is used in fracturing fluids. This commenter alsoindicated that later in the same chapter, EPA states that "some gelling agents can containhazardous substances including . . . [MTBE.]," and cites as its source a Supplemental EISissued by BLM. This commenter provided arguments why he believed that the supplementalEIS was in error in listing MTBE as a potential component in fracturing fluids. This commenterfurther recommended that EPA should not have used this EIS as a source for identifyingconstituents in fracturing fluids or at a minimum, should have indicated the shortcomingsassociated with using this type of document to determine the components of fracturing fluids. This commenter provided a detailed discussion of some of the problems with using thisparticular EIS.
EPA Response: As stated in the response to comment in section III.A.1, an EIS prepared by theColorado State BLM (1998) identified MTBE as a compound that may be found in fracturingfluid. EPA found no information in the literature, MSDSs, or through interviews with servicecompanies indicating that MTBE is used in fracturing fluids to stimulate CBM wells. MTBE isnot used during the manufacture of diesel fuel. It is generally only added to gasoline. However,in an effort to be fully inclusive of all the Agency's literature search findings, EPA included theinformation found in the EIS and noted that EPA was not able to confirm MTBE use infracturing fluids.
B. Comparison of Concentrations of Hydraulic Fracturing Fluid Components to MCLsSummary of Comments: A few commenters questioned the appropriateness of EPA's use ofMCLs to compare the projected concentrations of fracturing fluids that may be injected into

Public Comment and Response Summary for June 2004Hydraulic Fracturing CBM Study FINAL15
USDWs. The commenters argued that MCLs apply to "treated water" and that the waterassociated with the formations in which hydraulic fracturing occurs would not be suitable fordrinking water without first being treated.
EPA Response: Under the mandate of SDWA, EPA establishes MCLs as enforceable maximumpermissible levels for contaminants in drinking water, to ensure the safety of public drinkingwater supplies. Because the concern about contamination relates to USDWs, which are actual orfuture supplies of drinking water for human consumption, MCLs are used in this study asstandard reference points to compare calculated or anticipated levels of contaminants inhydraulic fracturing fluids and in the subsurface. MCLs provide a context for discussionsregarding the concentrations of individual contaminants.
C. Concentrations of Constituents in Fracturing Fluids/Fluid Recovery Rates1. Estimates of Concentrations of Constituents in Fracturing FluidsSummary of Comments: EPA received several comments on its estimates of the concentrationsof the constituents of concern in fracturing fluids that may be present at the point-of-injectionand at the edge of the fracture zone. Many commenters were alarmed about the estimatedconcentrations of some of these constituents such as benzene because they were above the MCL. Further, some were concerned that EPA had revised its estimates since publication of the report. Conversely, other commenters indicated that EPA had overstated these concentrations. Each ofthese comments is discussed in more detail below.
One commenter indicated that EPA's estimates for the constituents of concern at the edge of thefracture zone, which assume a dilution factor of 30, still exceed drinking water standards forbenzene, aromatics, 1-methylnapthalene, and methanol. This commenter added that EPAestimated high concentrations for the estimated point-of-injection for some chemicals for whichdrinking water standards have not yet been developed. This commenter acknowledged that theseconcentrations will be reduced as they mix with groundwater; however, he stated that very smallamounts of some chemicals like benzene and MTBE can contaminate millions of liters ofgroundwater. Further, this commenter noted that most CBM wells are hydraulically fracturedmore than once, and therefore, "the groundwater in which it resides," will receive multiple dosesof the fracturing fluids chemicals. The commenter stated a figure from the report that between50,000 and 350,000 gallons of fracturing fluids are typically used in coalbed fracture treatments. Another commenter indicated that the report does not recognize that some of the constituents infracturing fluids may affect human health at very low concentrations. This commenter addedthat with the potentially thousands of CBM wells being developed, the problem is magnified.
Several commenters claimed that EPA revised its calculations after the draft report was released.Some of these commenters indicated that EPA changed its scientific and policy conclusionsunder pressure from industry. One commenter provided detailed comments on the revisedcalculations. This commenter argued that EPA changed some of the parameters that were usedin the draft report (such as length and height of a fracture, volume of injected hydraulicfracturing fluids, percentage of unrecovered hydraulic fracturing fluids) and they resulted insmaller estimated concentrations, including a revised estimate for benzene that does not exceedthe MCL. This commenter questioned the basis for EPA's revising its estimates.

Public Comment and Response Summary for June 2004Hydraulic Fracturing CBM Study FINAL16
Other commenters were concerned that EPA did not adequately explain the assumptions used togenerate its calculations. For example, one commenter indicated that it was unclear whetherEPA based its estimates at the edge of the fracture zone on a specific fracture length or fractureradius. Some commenters also stated that EPA did not consider factors that would influence theavailability and decrease the concentrations of the constituents at the edge of the fracture zone. These factors included: the recovery of the majority of the fracturing fluid, the relatively lowpermeability of coalbed formations will limit the movement of groundwater away from thewellbore, the coal will adsorb some of the constituents onto its surfaces, acids react with certainrock constituents and become spent, and some fracturing fluid constituents such as benzene willbiodegrade. Some commenters also recommended that EPA's report should further emphasizethat any constituents of concern in fracturing fluids are present only in very minimal amounts.
One commenter indicated that EPA had "significantly mischaracterized the nature of itsestimates at both the point-of-injection and the edge of the fracture zone" because EPA had useda "worst case" scenario for estimating these concentrations. The commenter stated that, althoughthe report indicates that EPA used mid-range values, the Agency used the maximum amount ofdiesel fuel that service companies reported to EPA instead of an average value. This commenteralso explained why he believed that some of the point-of-injection concentrations that werepresented in Table 4-2 of the draft report, such as that estimated for methanol, appeared to beinconsistent with the discussion in the text. Further, this commenter also recommended thatEPA include its newer calculations in the report.
EPA Response: The values presented in the draft report are oversimplified estimates based ondilution alone and are not accurate enough to predict that a 30 times decrease is above or belowthe MCL. In the final report, EPA has revised its procedure for assessing the potential effect offracturing fluid constituents on USDWs from that presented in the August 2002 draft as follows:
• The draft report included point-of-injection calculations for all constituents that maybe contained in fracturing fluids. The final report focuses only on those constituentsfor which MCLs are established (i.e., BTEX compounds).
• EPA has revised the fraction of BTEX compounds in diesel used to estimate thepoint-of-injection concentrations from a single value to a documented broader rangeof values for the fraction of BTEX in diesel fuel. For example, the fraction ofbenzene in diesel was revised from 0.00006gbenzene/gdiesel to a range with a minimumvalue of 0.000026 gbenzene/gdiesel and a maximum value of 0.001 gbenzene/gdiesel. If themaximum value for benzene in diesel is used to estimate the concentration of benzeneat the point-of-injection, the resulting estimate is 17 times higher than that presentedin the draft report.
• In the final report, EPA used more current values for two of the parameters used toestimate the point-of-injection concentrations of BTEX compounds. Specifically, theestimates in this report use a density of the diesel fuel-gel mixture of 0.87 g/mLcompared to 0.84 g/mL in the draft report, and a fraction of diesel fuel in gel of 0.60gdiesel/ggel compared to 0.52 gdiesel/ggel in the draft report. The use of these more currentvalues does not affect the order of magnitude of the revised point-of-injectioncalculations.

Public Comment and Response Summary for June 2004Hydraulic Fracturing CBM Study FINAL17
• The August 2002 draft report included estimates of the concentration of benzene at anidealized, hypothetical edge of the fracture zone located 100 feet from the point-of-injection. Based on new information and stakeholder input, EPA concluded that theedge of fracture zone calculation is not an appropriate model for reasons including:
- Mined-through studies reviewed by EPA indicated that hydraulic fracturinginjection fluids had traveled several hundred feet beyond the point-of-injection.
- The assumption of well-mixed concentrations within the idealized fracturezone is insufficient. One mined-through study indicated an observedconcentration of gel in a fracture that was 15 times the injected concentration,with gel found to be hanging in stringy clumps in many fractures. Thevariability in gel distribution in hydraulic fractures indicates that the gelconstituents are unlikely to be well mixed in groundwater.
- Based on more extensive review of the literature, the width of a typicalfracture was estimated to be much thinner than that used in the draft report(0.1 inch versus 2 inches). The impact of the reduced width of a typicalfracture is that the calculated volume of fluid that can fit within a fracture isless. After an initial volume calculation using the new width, EPA found thatthe volume of the space within the fracture area may not hold the volume offluid pumped into the ground during a typical fracturing event. Therefore,EPA assumes that a greater volume of fracturing fluid must "leakoff" tointersecting smaller fractures than what was assumed in the draft report, orthat fluid may move beyond the idealized, hypothetical "edge of fracturezone." This assumption is supported by field observations in mined-throughstudies, which indicate that fracturing fluids often take a stair-step transportpath through the natural fracture system.
• In the draft report, EPA approximated the edge of fracture zone concentrationsconsidering only dilution. Based on new information and stakeholder input onthe draft report, EPA does not provide estimates of concentrations beyond thepoint-of-injection in the final report. Developing such concentration values withthe precision required to compare them to MCLs would require the collection ofsignificant amounts of site-specific data. This data in turn would be used toperform a formal risk assessment, considering numerous fate and transportscenarios. These activities are beyond the scope of Phase I of this study.
• In Chapter 4 of the final report, EPA provides a qualitative evaluation of the fateand transport of unrecovered fracturing fluids on residual concentrations of BTEXin groundwater. EPA describes in Chapter 4 how subsurface flow wouldsignificantly disperse and dilute BTEX compounds in groundwater, minimizingpotential exposure to these constituents. BTEX compounds may also interactchemically or physically with geologic material which may retard their movementand further disperse their concentrations.

Public Comment and Response Summary for June 2004Hydraulic Fracturing CBM Study FINAL18
See also EPA's response to comment in section III.A.1 of this document.
No data or conclusions in the final report or in any previous draft were altered to accommodateany industry parties, states, environmental groups, or others. This study was a thorough andtransparent data collection and technical evaluation exercise. The report and its conclusionswere prepared by career technical staff at EPA.
The study was designed based upon a transparent process including public comment on theconceptual study design which included comments from state drinking water and oil and gasagencies, industry, environmental groups, and private citizens. EPA consulted with experts inthe United States Geological Survey and the Department of Energy. Consistent with principlesof good science, a draft of the study was subjected to a technical peer review from hydraulicfracturing experts. The conclusions of the study were not submitted for review to any privatesector parties.
2. Fluid Recovery RatesSummary of Comments: Many commenters were concerned that a large percentage of fracturingfluid remains behind and is available to potentially migrate into USDWs, citing these concernsas a reason to continue EPA's study. Some commenters indicated that EPA was inconsistent inthe recovery percentages that the Agency cited in the report. Two commenters noted that therecovery experiment that is referenced in the report only ran for 19 days and that additionalfracturing fluids may be recovered after that time. Another commenter stated that one fluidrecovery rate (i.e., 61 percent) should not be "indiscriminately applied to over 14,000 CBMwells."
Some commenters cited a study by three Amoco scientists in which the study found "that asignificant volume of fracturing fluids is not withdrawn." These commenters explained that thescientists found that the gelling agents used in the fracturing fluids remained in the coal samplesalthough they had been flushed with water and strong acids. The commenters argued that, sincethese chemicals are not fully recovered, they could "serve as continuous sources of groundwatercontamination."
EPA Response: Section III.A.1 provides a discussion of processes that can limit the availability,concentration, and movement through groundwater of unrecovered fracturing fluids. EPA hasensured that the recovery percentages cited in the report are both internally consistent andconsistent with the literature reviewed. Three studies on recovery rates of hydraulic fracturingfluids were reviewed in Chapter 3 of the report. Only one of these studies, Palmer et al., 1991,involved hydraulic fracturing of coalbeds (refer to footnote 1 for the study reference). Thus, thePalmer study was considered the most relevant of the three studies for the purposes of thisreport. The final report clarifies that the recovery rate of 61 percent was based on a 19-dayflowback period. Palmer et al., 1991, predicted recovery rates as high as 82 percent over alonger recovery period.

6 Puri, R., G.E. King, and I.D. Palmer, 1991, "Damage to Coal Permeability During Hydraulic Fracturing,"Society of Petroleum Engineers Proceedings from Rocky Mountain Regional Meeting and Low-PermeabilityReservoirs Symposium, Denver, CO, p. 109-115, (SPE #21813).
Public Comment and Response Summary for June 2004Hydraulic Fracturing CBM Study FINAL19
Regarding the study by three Amoco scientists, EPA contacted one of the commenters to obtaina copy of the study to review.6 The commenter was unable to provide the study and EPA'sadditional library research efforts were also unsuccessful at obtaining this study.
3. Amount of Fracturing FluidsSummary of Comments: Some commenters were concerned about the volume of fracturingfluids used in a "typical fracturing job" and cited the following statement from the report,"Coalbed fracture treatments typically use 50,000 to 350,000 gallons of various fracturing fluids,and from 75,000 to 320,000 pounds of sand as proppant... ." Others questioned the accuracy ofthe quantities of fracturing fluid and proppant cited in the report, stating that these figures weremore consistent with a massive hydraulic fracture. Another commenter stated that the uniqueproperties that make many coal formations effective receptacles for methane also allow them tohold large quantities of water. This commenter stated that injection of hydraulic fracturing fluidsinto USDWs risks permanent contamination of these USDWs because fracturing fluids oftencontain large amounts of toxic chemicals.
EPA Response: EPA has clarified in the final report that more typical injection volume may becloser to a maximum of 150,000 gal/well, and a median value of 57,500 gal/well. These valuesare based on average injection volume data provided by Halliburton for six CBM locations.
Refer to section III.A.1 regarding factors that would influence the availability, concentration, andmovement of fracturing fluids and their constituents.
4. Movement of Fracturing FluidsSummary of Comments: Some commenters stated that unrecovered fracturing fluids will flowtoward the well because of the pressure gradients. Others noted that this was only true while thewell was in production. These commenters argued that once pumping stops, the aquifer willattempt to resume a normal flow pattern and the remaining hydraulic fracturing fluids will movefreely within the coalbed formation.
EPA Response: Chapter 4 of the final report has been expanded to more clearly explain:
• hydraulic gradients that occur during injection versus those during fluid recovery;
• the significance of the capture zone of the production well on fracturing fluidrecovery (i.e., the portion of the aquifer that contributes water to the well); and
• the movement of fracturing fluids (and what influences their movement) both insideand outside the capture zone.

Public Comment and Response Summary for June 2004Hydraulic Fracturing CBM Study FINAL20
IV. FRACTURE BEHAVIOR AND PRACTICES
A. Fracture GrowthSummary of Comments: EPA received many comments on the statements in its report that,"Vertical fracture heights in coalbeds have been measured in excess of 500 feet and lengths canreportedly reach up to 1,500 feet." Some of these commenters stated that these distancesindicate the potential for communication with and contamination of USDWs. Other commentersbelieved that these measurements were incorrect. Some commenters also discussed whetherconfining layers act as barriers to vertical fracture growth.
One commenter described in detail why he believed that confining layers above and below thehydraulically fractured coal formations would also be fractured and permeated by fluids. Thiscommenter noted that the fracture heights cited in the report exceed the thickness of the thickestcoal formations identified in the report. In addition, this commenter noted that the reportindicates that some of the coal seams are bounded by sandstone and conglomerate (which havedifferent lithological properties, and therefore different fracturing properties, than shale). Further, he indicated that the report supports his position that the risk for migration of fracturingfluids into adjacent USDWs is significant because it indicates that "Stimulation fluids in coalpenetrate from 50 to 100 feet away from the fracture and into the surrounding formation. Inthese and other cases, when stimulation ceases and production resumes, these chemicals may notbe completely recovered and pumped back to the CBM well, and, if mobile, may be available tomigrate through an aquifer." This commenter also noted that the report shows that many of thecoal formations are located in mountainous regions such as the Rocky Mountains andAppalachian Mountains. The commenter stated that the rock formations in these regions,including the coal formations, have been subjected to intense orogenic and tectonic stressresulting in regional, systematic fractures and faults. The commenter argued that it is likely thatcoal formations, and other rocks above and below them, are characterized by cracks andfractures, and that because of these deformation features, rates of groundwater transport tend tobe higher.
One commenter indicated that the report's description of how fractures travel is incorrect (i.e.,they travel horizontally vs. vertically). This commenter added that there is some verticalexpansion as the fracture moves horizontally but that this is not the primary direction offracturing. This commenter stated that their state geologists estimate vertical fracture heights at50 to 60 feet. Another commenter provided detailed comments on the studies that wereconducted on fracture height growths. This commenter indicated that he had been involved innumerous fracture experiments (in all types of reservoirs) where the fracture height has actuallybeen measured (using microseismic or downhole tiltmeter), as well as in mineback tests wherehydraulic fractures have been excavated. Based on his experience, the fracture height has alwaysbeen less than or equal to the height that would be predicted by just using stresses in the variouslayers (which the commenter indicated was the only factor considered in all the references usedin the draft report). The commenter reported that in some cases, the differences were factors oftwo or three. This commenter also provided detail on factors that influence fracture heightgrowth, such as horizontal stress in the coal, the horizontal stress in the surrounding layers, thecharacteristics of the layering, and the type of hydraulic fracturing fluids being pumped.

Public Comment and Response Summary for June 2004Hydraulic Fracturing CBM Study FINAL21
Another commenter noted that the discussion on fracture dimensions in the report was based onliterature from 1993 and earlier, but acknowledged that there were "virtually no post-1993published reports on hydraulic fracturing." The commenter recommended that EPA contactoperators, service companies, and state regulatory agencies for current practices and models. Further, this commenter noted that newer data based on more sophisticated FracPro models areavailable for many basins. He added that, in his state, model results indicate that fracture heightis "generally less than 100 feet, whereas fracture half length is typically between 150 and 700feet." This commenter also noted that the report should state that the fracture heights have been"modeled" not "measured" because vertical fracture heights have never been fully measured inthe field.
EPA Response: EPA has revised Chapter 3 to provide clarification on the characterization offracturing behavior during hydraulic stimulations. The statement that fractures have been"measured in excess of 500 feet and lengths can reach up to 1,500 feet" has been removedbecause it refers to modeled estimates, rather than direct measurements. Instead, the results of22 mined-through studies have been summarized, because they provide direct measurements ofthe dimensions of hydraulic fractures, as well as lower bounds on the extent of fracturing fluidmovement. Chapter 3 has also been revised to better distinguish between fracturecharacterizations based on modeling vs. those that are directly measured.
In addition, EPA has revised Chapter 3 to clarify the issue of hydraulic barriers and barriers tofracture growth above coalbeds. EPA agrees with the commenter that when shales overlyingtargeted coals are extensively fractured, they may not act as barriers to hydraulic fracture growthor as hydraulic barriers. On the other hand, thick, relatively unfractured shale may present abarrier to upward fracture growth because of the stress contrast between the coalbed and the overlying shale. Deep vertical fractures can propagate vertically to shallower depths anddevelop a horizontal component. In the formation of these "T-fractures," the fracture tip may fillwith coal fines or intercept a zone of stress contrast, causing the fracture to turn and develophorizontally, sometimes at the contact of the coalbed and an overlying formation.
B. Multiple FracturesSummary of Comments: Some commenters raised concern over the statement in the draft reportthat "each well, over its lifetime is fractured several times" and urged EPA to continue to PhaseII of the study. Others questioned the accuracy of EPA's statement that wells are fracturedmultiple times. One commenter indicated that in their state, most wells have not been re-fractured multiple times but that instead, two to four coal groups were generally fractured in eachwell.
EPA Response: EPA has revised the statements regarding multiple stimulations in Chapter 3. Inthe draft report EPA stated that "many coalbeds are refractured at sometime after the initialtreatment." The text has been revised to indicate that the literature on refracturing that wasreviewed pertains only to the Black Warrior Basin. EPA's extensive literature review did notfind any information indicating that wells are fractured multiple times in any basin other than theBlack Warrior Basin.
C. Relationship of Drinking Water Wells to Hydraulic Fracturing Activities

Public Comment and Response Summary for June 2004Hydraulic Fracturing CBM Study FINAL22
Summary of Comments: Some commenters were concerned about the potential for fracturingfluids to contaminate USDWs due to the high occurrence of coal reservoirs within USDWs. Onecommenter cited a statement from the report "if coalbeds are located within USDWs, then anyfracturing fluids injected into coalbeds have the potential to contaminate the USDW." Thecommenter added that the report indicates that as much as 91 percent of U.S. coal reservoirs maybe located within USDWs.
Two commenters indicated that hydraulic fracturing activities take place at depths far belowgroundwater sources used as drinking water sources. One of these commenters added that hiscompany's records show that it conducts hydraulic fracturing at shallow depths, (i.e., less than300 feet below ground surface), in less than one percent of all hydraulic fracturing jobs. Thiscommenter provided this as one reason that he believed that hydraulic fracturing is unlikely topose a threat to drinking water.
EPA Response: EPA found that 10 of the 11 coal basins, included in the study, may lie, at leastin part, within USDWs. Given the concerns associated with the use of diesel fuel and theintroduction of BTEX constituents into USDWs, EPA negotiated an MOA with three majorhydraulic fracturing service companies for the voluntary elimination of diesel fuel in hydraulicfracturing fluids injected directly into USDWs for the purpose of CBM production. Nevertheless, even when fracturing fluids are injected directly into coalbeds located in USDWs,fracturing fluid components are likely to be significantly diluted and dispersed, as well as subjectto other fate and transport processes (discussed in Chapter 4) which are likely to lower theirconcentrations or prevent their mobility underground. Also see the response to comment insection III.A.1.
D. Differences in State GeologySummary of Comments: Several commenters indicated that the report did not adequatelyaddress the variability present in the different geologic formations that are subject to hydraulicfracturing, and therefore, did not address the possible impacts associated with that variabilityregarding regional groundwater flow and/or the occurrence and distribution of CBM resources,on assessing the potential threat of hydraulic fracturing on USDWs. One commenter indicatedthat to accurately represent the threats to USDWs, risk levels should be "differentiated based onmodeling and actual data on similar geologic conditions."
EPA Response: EPA agrees that variability of geologic formations and regional groundwaterflow are key to the assessment and understanding of the potential threat to USDWs posed byhydraulic fracturing. The study findings and conclusions are based on literature from each of the11 major coal basins in the United States. In addition, the draft and final report contains separateattachments which discuss basin-specific geologic and hydrogeologic investigations related toeach of the 11 basins. The discussions provided were intended to characterize regional coalbasin methane production with respect to its effect on USDWs and to supplement the generalizedinformation provided within the body of the report. EPA also agrees that if modeling risk levels,the variability of geologic conditions should be considered. However, such a modeling exerciseis beyond the scope of the current study.

Public Comment and Response Summary for June 2004Hydraulic Fracturing CBM Study FINAL23
V. REGULATION OF HYDRAULIC FRACTURING PRACTICES
A. States' AuthoritySummary of Comments: Several commenters recommended that EPA expand its discussion inthe final report of the states' role in regulating hydraulic fracturing. Others suggested clarifyingthe language from the draft report regarding states' authority to regulate hydraulic fracturing. For example, one commenter indicated that EPA's statement, "States with primacy for their UICprogram enforce and have the authority to place controls on any injection activities that maythreaten USDW's" implies that state UIC Programs can or would regulate hydraulic fracturing. The commenter recommended that EPA add clarifying language that removes the implicationthat hydraulic fracturing is commonly regulated under UIC Programs.
One commenter stated that the report was inaccurate in its description of Virginia's authority toplace restrictions on the depth at which hydraulic fracturing can occur. The commenterindicated that the "restrictions" are instead voluntary procedures. The commenter also clarifiedthe purpose of these procedures.
EPA Response: EPA did not conduct a systematic review of state regulations of hydraulicfracturing and, therefore, has no basis for expanding its discussion of the state's role in theregulation of hydraulic fracturing. However, the Agency added clarifying language regardingthe state's ability to regulate hydraulic fracturing. EPA also added clarifying wording to thereport regarding Virginia's voluntary program.
B. Regulation of Hydraulic Fracturing under SDWASummary of Comments: Several commenters wanted EPA to regulate hydraulic fracturing ofCBM wells under SDWA and did not believe that recommended measures such as using"water-based alternatives" instead of diesel were sufficient. One commenter stated that based onLegal Environmental Assistance Foundation, Inc. v. U.S. E.P.A., 118 F.3d 1467, 1470 (11th Cir.1997), EPA is to decide how to regulate hydraulic fracturing under SDWA, and not to determinewhether "further investigation was necessary to evaluate any potential threats" before EPA acts.Another commenter was concerned whether EPA was using the presence of documented cases of"health harm from non-regulation" as the criterion for determining whether to regulate hydraulicfracturing injection activities under SDWA. This commenter argued that the purpose of the UICProgram is "to forestall and prevent such harm by isolating the injected fluids from aquifers thatare or could be developed as USDWs"; and therefore, using proven harm as a regulatorythreshold goes against the purpose and intent of the law.
Conversely, other commenters indicated that EPA should "recognize the need for industry to beallowed reasonable flexibility in the means that its uses to produce CBM." These commentersalso indicated that under 42 U.S.C. § 300h(b)(2), Congress intended that EPA not imposerestrictions through the UIC Program that interfere with or impede activities related to oil andgas development unless such restrictions are essential for preventing endangerment of drinkingwater sources. Another commenter specifically recommended that UIC permits not be requiredfor hydraulic fracturing practices.

Public Comment and Response Summary for June 2004Hydraulic Fracturing CBM Study FINAL24
EPA Response: Based on the information collected and reviewed, EPA has determined that theinjection of hydraulic fracturing fluids into CBM wells poses little or no threat to USDWs. Continued investigation under a Phase II study is not warranted at this time. The lack ofconfirmed incidents of drinking water well contamination due to hydraulic fracturing fluidinjection from past hydraulic fracturing activities was one among many factors EPA considered. If threats to USDWs from hydraulic fracturing of CBM wells were significant, EPA wouldexpect to have found confirmed instances of drinking water well contamination from thepractice. Although thousands of CBM wells are fractured annually, EPA did not find confirmedevidence that drinking water wells have been contaminated by the injection of hydraulicfracturing fluids into CBM wells.
EPA's recent agreements with three major service companies, discussed in section II.A.2, willsignificantly reduce the use of diesel fuel in hydraulic fracturing fluids that are injected directlyinto USDWs for CBM production.
It is important to note that states with primary enforcement authority (primacy) for their UICPrograms implement and enforce their regulations, and have the authority under SDWA to placeadditional controls on any injection activities that may threaten USDWs. States may also haveadditional authorities by which they can regulate hydraulic fracturing. With the expectedincrease in CBM production, the Agency is committed to working with states to monitor thisissue.
VI. LANGUAGE USED IN THE REPORT
A. Use of the Term "USDW" Summary of Comments: Some commenters indicated that EPA used the term "USDW" toobroadly. In particular, one commenter indicated that the report "carelessly utilizes the USDWterm in the context of hydrocarbon bearing formations." This commenter added that thesehydrocarbon-bearing aquifers subjected to hydraulic fracturing are unlikely to be used fordrinking water, especially without treatment for two reasons: 1) the high total dissolved solidslevel of the waters in these formations; 2) the waters in these formations may be considered an"exempted aquifer" under SDWA because the aquifer is mineral, hydrocarbon, or geothermalenergy producing, or can be demonstrated to be commercially producible. This commenter alsostated that the inferences in the report, that some risks may be attributed to hydraulic fracturing,conflict with "the reality that such a formation would not be used for water supply withouttreatment, if it were ever to be used."
EPA Response: EPA disagrees that it has applied the term "USDW" too broadly in the report. SDWA mandates the protection of USDWs from injection activities – "if such injection mayresult in the presence in underground water which supplies or can reasonably be expected tosupply any PWS of any contaminant, and if the presence of such contaminant may result in suchsystem's not complying with any national primary drinking water regulation or may otherwiseadversely affect the health of persons." The broad definition of a USDW by Congress was toensure that future USDWs would be protected, even where those aquifers were not currentlyused as a drinking water source or could not be used without some form of water treatment such

Public Comment and Response Summary for June 2004Hydraulic Fracturing CBM Study FINAL25
as desalination. It is also important to note that an exempted aquifer is a USDW, but is exemptfrom regulation.
B. Use of Scientific TermsSummary of Comments: A few commenters provided corrections to some of the terminologyused in the report. One commenter felt that there was a general misuse of geologic terminologyin the report, and specifically indicated that the geologic terms "system," "formation," and"seams" should not have been used interchangeably. This commenter provided other specificclarifications or corrections to some of the discussions in the report (e.g., Section 3.1 regardingthe depositional history of coal-bearing rocks in the United States).
EPA Response: EPA appreciates the careful review of the report by many of the commenters. EPA has revised some of the terminology used in the report and incorporated some of theclarifications suggested by the commenters.
C. Use of Qualifying LanguageSummary of Comments: Both the commenters that supported EPA's conclusions and those whoopposed it indicated that the tone of the language used throughout the report conflicted withEPA's conclusions. Commenters cited examples of this language that included the following:
• "Based on the information collected, the potential threats to USDWs posed by hydraulicfracturing appear to be low and do not justify additional study.";
• ..."the apparent risk to public health from hydraulic fracturing is not compelling enoughto warrant expending resources on a phase II effort"; and
• "the apparent threat to public health from hydraulic fracturing."
One of the commenters indicated that this language showed "a weak articulation of EPA'sconfidence in its own report." Many of the commenters who were opposed to EPA's findings,pointed to EPA's qualified statements as a reason to continue the study.
Another commenter, who supported EPA's findings, stated that the primary definition of theword, "apparent," is, "something that is clearly seen or understood, obvious, self-evident,glaring." This commenter, among others who supported the Agency's findings, recommendedthat EPA replace all uses of the word "apparent" when describing the threat posed to USDWs byhydraulic fracturing with words that more accurately describe the low likelihood of this threat.
EPA Response: In the final report, EPA has eliminated the use of the word "apparent" and"appears" to describe its study conclusions and has made the language more consistent with thereport's results.
VII. CHAPTER-SPECIFIC COMMENTS

Public Comment and Response Summary for June 2004Hydraulic Fracturing CBM Study FINAL26
This summary of chapter-specific comments focuses mainly on those comments that have notbeen summarized within the issue-specific Sections II through VI of this document. Commentswere received on almost every chapter of the document, ranging from minor editorialsuggestions, to factual corrections. EPA appreciates the thorough comments that were submittedregarding the contents of the hydraulic fracturing report. The Agency has considered allcomments, researched the accuracy of some comments (where necessary), and incorporatedcomments where appropriate.
A. GlossarySummary of Comments: One commenter submitted recommended changes to the list ofacronyms and abbreviations, and the glossary pertaining to "M"; "KCl"; "pad"; and the phrase,"wells that have been 'screened-out' cannot be used for gas production."
EPA Response: After reviewing and checking on the accuracy of the above comments, EPAincorporated changes to the glossary and list of acronyms, where appropriate.
B. Other Executive Summary CommentsSummary of Comments: EPA received many comments that were specific to the executivesummary of the report, including recommendations for revising the text, tables, and figures. Afew commenters suggested that the language regarding the findings and conclusions of the studyneeds to be clearer and stronger (e.g., qualifiers such as "appear to be low" and "persuasiveevidence" weakens the conclusions). Another suggested that, in general, the executive summaryand the main document need to point out that not all USDWs are currently being used nor willthey ever be used as sources of drinking water. Some commenters felt that the executivesummary was inappropriately long and provided suggestions for making the section shorter,including eliminating all tables from this section. Many commenters provided specific editorialcomments.
A few commenters expressed concern regarding the "graphic language" in Table ES-2 (Summaryof MSDSs for Hydraulic Fracturing Fluid Additives) used to describe the health effects offracturing fluids, and noted that they felt it may be unnecessarily alarming, and potentiallymisleading to readers (i.e., it does not clarify that the health effects only pertain to someconstituents that may or may not be present in the fracturing fluids). Commenters added thatTable ES-2 suggests that linear gel delivery systems always contain diesel and does not indicatethat fluid additives are greatly diluted. One commenter felt that the information provided inTable ES-4 (Evidence in Support of Coal-USDW Co-Location in U.S. Coal Basins) was toogeneral, and believed that the information should just be presented in the more detailed sectionsfrom which it was summarized. Other commenters were concerned that the informationprovided in Table ES-5 (Summary of Reported Incidents that Associate Water Quality/Quantitywith Coalbed Methane (CBM) Activity) could be misleading to the public.
One commenter felt that the executive summary figures in general were "confusing andmisleading." Other commenters questioned the accuracy and clarity of Figure ES-2 (GraphicalRepresentation of the Hydraulic Fracturing Process in Coalbed Methane Wells), which depicts

Public Comment and Response Summary for June 2004Hydraulic Fracturing CBM Study FINAL27
drinking water wells drawing down into coal seams. One commenter questioned the accuracy ofthe illustrations in Figures ES-3 (Direct Fluid Injection into a USDW (Coal within USDW)) andES-4 (Fracture Creates Connection to USDW) regarding the depth of the water wells and thedirection of fluid migration (i.e., fracturing fluids are shown to be flowing away from the wellbore toward the drinking water wells). The commenter pointed out that the descriptive text onpage ES-10 conflicts with the depiction of fluid migration in Figure ES-4.
EPA Response: EPA has reviewed and considered all comments regarding the executivesummary of the document. The Agency originally designed the executive summary to be astand-alone document. Because many readers of such a document (such as Congress or theleaders of various stakeholder organizations) may have limited time to dedicate to the review ofa large technical document, EPA included essential summary information, including tables andfigures, in the executive summary. However, based on the comments received, EPA has pareddown the executive summary by taking out most of the tables and summarizing key informationfrom these tables in narrative form. EPA incorporated many of the specific suggestions relatedto the figures (e.g., decreasing the depth of drinking water wells), and in some instances,provided clarifying language to explain the figures.
C. Other Chapter 1 Comments (Introduction)Summary of Comments: A few commenters provided comments regarding the Introduction tothe hydraulic fracturing report. Comments included questions about the accuracy of the figures,and how they were depicted: groundwater flow; the relation between well depths and coalseams; and the point-of-injection for the fracturing fluids. One commenter objected to thestatement that the study was "based on a high level of interest of stakeholders..." when it was thecommenters' understanding that it was based only on a "handful" of complaints.
EPA Response: The statement that the study was "based on a high level of interest ofstakeholders..." is an accurate statement but the term "stakeholders" was vague. To be moredescriptive, Chapter 1 of the final report indicates that a reason for conducting the study was"concerns voiced by individuals who may be affected by coalbed methane development. . ." TheAgency addressed each of the other comments by either incorporating suggested language ormaking relevant clarifications in the document language and figures.
D. Other Chapter 2 Comments (Methodology)No substantive comments received on this chapter.
E. Other Chapter 3 Comments (Characteristics of CBM Production and HF Practices)Summary of Comments: EPA received several comments regarding the information in Chapter3. In particular, several commenters questioned the study's assumptions regarding recovery ratesand fracture heights. A more detailed summary of the comments received on these topics can befound in sections III.C.2 and IV.A, respectively. One commenter had several specific questionsregarding statements made in this chapter, including: the meaning of the term "conventionalcoal mines"; statements regarding the number of CBM wells in Alabama; the discussion of the

Public Comment and Response Summary for June 2004Hydraulic Fracturing CBM Study FINAL28
origin of CBM; the statement that "coal has very little natural permeability"; contradictionsbetween the discussion of fluids migration in this chapter compared to that shown in FiguresES-4 and 1-3; accuracy and clarity of statements regarding the rate of fluid recovery; and thestatement that many CBM wells are re-fractured.
EPA Response: EPA appreciates the detailed comments that were submitted regarding Chapter3 of the hydraulic fracturing report. The Agency made several editorial corrections andclarifications to this chapter based on these comments. A more detailed response regardingrecovery rates, fracture heights, and re-fracturing of the same wells can be found in sectionsIII.C.2, IV.A, and IV.B, respectively.
F. Other Chapter 4 Comments (HF Fluids)Summary of Comments: Comments specific to Chapter 4 of the report included questions aboutthe calculation of the constituents of concern at the point-of-injection, and other editorialcomments and suggestions.
EPA Response: In response to comments received on Chapter 4, EPA has incorporatedclarifying language regarding its calculations of BTEX compounds at the point-of-injection. Other editorial corrections and clarifications have also been incorporated. For a discussion ofhow EPA revised its procedure for assessing the potential effect of fracturing fluid constituentson USDWs from that presented in the draft report, refer to section III.C.1.
G. Other Chapter 5 Comments (Basin Descriptions)Summary of Comments: Several comments were received regarding the basin descriptions,including updates from a few states on the numbers of wells in the applicable basins. Onecommenter suggested additional references that should be used to correct some of the statementsregarding the Pottsville Formation. The other four commenters each provided specific editorialsuggestions on one of the following four basins: the Central Appalachian Basin, the NorthernAppalachian Basin, the Uinta Basin, and the Powder River Basin.
EPA Response: EPA has incorporated the updated well information provided by states. Allother editorial comments were considered, and most were incorporated. Other basin-specificissues are discussed in section VIII of this document.
H. Other Chapter 6 Comments (Water Quality Incidents)Summary of Comments: Several comments were received regarding the water quality incidentschapter of the report. Commenters made specific editorial suggestions, and providedclarifications about specific complaints, additional information about how their state investigatescomplaints, and information about state-specific hydraulic fracturing regulations. Onecommenter stated that the discussion of the Pottsville, Allegheny, Conemaugh, andMonongahela Groups were "oversimplified" and questioned the conflicting use of the terms"cyclothem" and "complex" when describing the depositional environments of the AlleghenyGroup.

Public Comment and Response Summary for June 2004Hydraulic Fracturing CBM Study FINAL29
A few commenters expressed concern that the descriptions of public complaints (including theinformation summarized in Table 6-2) are presented in the report as if the information wasfactual, without linking the complaints to actual findings following the state and EPAinvestigations. One commenter indicated that EPA does not present any data from stateagencies, which suggests to the commenter that no real scientific studies were conducted. Commenters recommended that the complaints be immediately followed by a summary of theevaluation and resolution of the complaint. One recommendation was that, if kept in the report,the information be moved to an appendix.
Finally, some commenters felt that EPA was contradictory regarding the question of whetherhydraulic fracturing of CBM wells threaten USDWs. For example, one commenter indicatedthat EPA had concluded in Chapter 6 that there is insufficient evidence to determine if there is alink between fracturing and USDW contamination. However, elsewhere in Chapter 6, EPAstates that "water quality problems might be associated with some of the variety of productionactivities common to CBM extraction. These production activities include... methane migrationthrough conduits created by drilling and fracturing practices..."
EPA Response: In response to stakeholder's comments on EPA's original study methodology,EPA compiled citizen complaints and reported incidences of CBM impacts on drinking waterwells and included these accounts in Chapter 6 of the report. In the final report, EPA hasclarified the rationale for including citizen complaints in its report.
The final report also clarifies that many of the reported impacts (such as impacts to water supplyquantities and effects of discharge of groundwater extracted in the CBM production process)included in Chapter 6 are outside of the scope of SDWA and beyond the scope of the Phase Istudy. The goal of the Phase I study was to assess the potential for contamination of USDWsdue to the injection of hydraulic fracturing fluids into CBM wells, and to determine based onthese findings if further study is warranted. EPA also incorporated information that wasprovided by states regarding incident reports, and state-specific regulations. Finally, the Agencytook Table 6-2 out of the document because, as suggested by some commenters, summarizingcitizen complaints in a tabular format oversimplified this information, and created a potential formisinterpretation. The information in Table 6-2 is presented in detail in the main body ofChapter 6.
See also EPA's response to comment in section II.D of this document regarding other issuespertaining to water contamination incidents and citizen complaints.
I. Other Chapter 7 Comments (Conclusions and Recommendations)
Summary of Comments: Most comments received regarding Chapter 7 of the report also relateback to prior report chapters. Several commenters had specific suggestions or questionsregarding the conclusions and recommendations section of the report. Some of thesecommenters agreed with the conclusions of the study, but recommended that EPA put moreemphasis on the conclusions, and include information about the findings of the study earlier inthe document. Specifically, commenters suggested that, at the beginning of the document, EPAinclude a statement clarifying that: "EPA finds no evidence of harm from hydraulic fracturing

Public Comment and Response Summary for June 2004Hydraulic Fracturing CBM Study FINAL30
while investigating the reported incidents that spurred the study." These commenters felt thatEPA's findings that Phase II of the study is unnecessary, and that little or no public health threatis posed by hydraulic fracturing should be more strongly stated in the conclusions of the report.
Note that commenter opinions regarding Chapter 7 of the report do not reflect the overallcommenter perspectives regarding the outcome and conclusions of the study. Most of thecommenters expressed opinions regarding the study's conclusions, but did not state them withinthe context of Chapter 7.
EPA Response: EPA has reviewed all commenter suggestions regarding Chapter 7, andincorporated the majority of these comments where appropriate. Other revisions to Chapter 7,which relate back to changes in previous chapters, have been made in order to ensure internalconsistency within the document.
VIII. BASIN DESCRIPTIONS
This summary of basin-specific comments focuses mainly on those comments that have not beensummarized within the issue-specific Sections II through VI of this document. Many commentswere received that provided minor editorial suggestions and factual corrections regarding basindescriptions. The Agency has considered all comments, researched the accuracy of somecomments (where necessary), and incorporated public comments where appropriate.
A. San Juan BasinSummary of Comments: One commenter provided suggested edits and corrections pertaining tothe San Juan Basin geology, hydrology and USDW identification, and CBM production activity. This commenter also provided additional references.
EPA Response: EPA reviewed and considered all suggested edits and corrections and hasincorporated revisions to the San Juan Basin descriptions. EPA also reviewed the additionalreferences provided by the commenter, and incorporated additional pertinent information.
B. Black Warrior BasinSummary of Comments: One commenter provided a variety of editorial comments and factualclarifications regarding the Black Warrior Basin. Examples of information the commenterquestioned include: coal thickness; total dissolved solids levels; number of active Class II wellsin this area; fracture height vs. length; and chemical components of fracturing fluids.
EPA Response: EPA has incorporated into the final report the majority of the commenter'ssuggestions regarding the description of the Black Warrior Basin.
C. Piceance Basin

Public Comment and Response Summary for June 2004Hydraulic Fracturing CBM Study FINAL31
Summary of Comments: One commenter provided a brief description of the activities andprogress of the pilot program in the White River Dome field.
EPA Response: The final report contains the information provided by the commenter.
D. Uinta BasinSummary of Comments: One commenter indicated that the information on the Castlegate Fieldis out of date. The commenter clarified that the field is currently in production, and explainedwhy he believes that cross-contamination from the Blackhawk to the Castlegate Sandstone andStar Point Sandstone (as indicated in the report) is unlikely.
EPA Response: EPA has made revisions to the basin description based on this information.
E. Powder River BasinSummary of Comments: No substantive comments were submitted on this section.
F. Central Appalachian BasinSummary of Comments: One commenter provided clarifications and corrections regarding CBMactivity, regulations, and drinking water sources in Virginia.
EPA Response: EPA has incorporated many of the commenter's clarifications into the basindescription.
G. Northern Appalachian BasinSummary of Comments: One commenter provided information on the square mileage andnumber of CBM wells in this basin, with associated references. This commenter, who is theindividual that was interviewed for some of the information provided in this attachment,provided edits to the interview summary. Another commenter suggested several editorialcorrections pertaining to the location of specific coal groups, the use of the term "group," and theuse of the term "separated laterally" vs. "vertical separation."
EPA Response: EPA has incorporated all appropriate information into the basin description.
H. Western Interior BasinSummary of Comments: This commenter questioned the accuracy of the statement that "coalseams could be coincident with a USDW" within the Cherokee Basin. The commenter discussedthe aerial extent to which various coal seams in the Cherokee Basin coincide with USDWs, andrecommended that EPA also review a 1997 paper entitled "Kansas coal resources and theirpotential for coalbed methane."

Public Comment and Response Summary for June 2004Hydraulic Fracturing CBM Study FINAL32
EPA Response: EPA has modified the report to indicate that "all or part of targeted coal seamscould be coincident with a USDW," thereby clarifying the summary of the data provided inTable A8-2, which presents the relative depths of coal seams and USDWs.
I. Raton BasinSummary of Comments: No comments were submitted on this section.
J. Sand Wash BasinSummary of Comments: One commenter pointed out that in the Sand Wash Basin, the pilot atCraig Dome was abandoned "due to excessive water production." This commenter also believedthat EPA's findings that hydraulic fracturing poses very little potential threat to USDWs does notaccount for proximity or overlap with natural fault lines. The commenter stated that: "if afracture propagates into and along a fault plane, it may contaminate a USDW."
EPA Response: EPA has incorporated the commenter's information into Attachment 10 of thefinal report.
K. Washington Coal Regions (Pacific and Central)Summary of Comments: No comments were submitted on this section.

EPA 816-R-04-003 Master References
Evaluation of Impacts to Underground Sources June 2004of Drinking Water by Hydraulic Fracturing ofCoalbed Methane Reservoirs MR-1
REFERENCES
This master reference list pertains only to Chapters 1 through 7 of thisdocument. Separate reference lists are provided for each appendix andattachment, and are provided at the end of each of these sections.
Alabama Oil and Gas Board, Administrative Code, Oil and Gas Report 1, 400-3.
Alabama Oil and Gas Board. 2002. Public Comment OW-2002-0002-0029 to “DraftEvaluation of Impacts to Underground Sources of Drinking Water by HydraulicFracturing of Coalbed Methane Reservoirs.” Federal Register. Vol. 63, No. 185.p. 33992, September 24, 2002.
Andrews, Richard D., Cardott, Brian J., and Storm, Taylor. 1998. The Hartshorne Playin Southeastern Oklahoma: regional and detailed sandstone reservoir analysis andcoalbed-methane resources. Oklahoma Geological Survey, Special Publication98-7.
Baldwin. 2000. Colorado Oil and Gas Conservation Commission, personalcommunication.
Bodnar, G. 1999. Colorado Department of Health, personal communication.
Bostic, Joy L., Brady, L. L., Howes, M. R., Burchett, R. R., and Pierce, B. S. 1993.Investigation of the coal properties and the potential for coal-bed methane in theForest City Basin. U. S. Geological Survey, Open File Report 93-576.
Brady, L. L. 2002. Kansas Geological Survey, personal communication.
Buckovic. 1979. The Eocene Deltaic System of West-central Washington: inArmentrout, J. M., Cole, M. R., and Terbest H., eds., Cenozoic paleogeographyof the western United States: Los Angeles, Soc. Econ. Paleont. and Min., PacificSection, Pacific Coast Paleogeog. Symposium 3, p. 147-163, as cited by Choate etal., 1980.
Carrol, R.E., Pashin, J.C., and Kugler, R.L. 1993. Burial history and source rockcharacteristics of Mississippian and Pennsylvanian strata, Black Warrior basin,Alabama, Alabama Geological Society Guidebook, pp. 79-88.
Charpentier, Ronald R. 1995. Cherokee Platform Province. U. S. Geological Survey,National Assessment of United States Oil and Gas Resources.
Chavez, F. 2001. New Mexico Oil Conservation Division, personal communication.

EPA 816-R-04-003 Master References
Evaluation of Impacts to Underground Sources June 2004of Drinking Water by Hydraulic Fracturing ofCoalbed Methane Reservoirs MR-2
Choate, R, Johnson, D.A., and McCord, J.P. 1980. Geologic overview, coal, andcoalbed methane resources of the Western Washington coal region, Lakewood,Colorado. TRW Energy Systems Group Report for U.S. Department of Energy,Morgantown Energy Technology Center, Contract DE-AC21-78MC08089, pp. 353-372.
Choate, R., Lent, T., and Rightmire, C.T. 1993. Upper Cretaceous geology, coal, and thepotential for methane recovery from coalbeds in the San Juan Basin – Colorado andNew Mexico. AAPG Studies in Geology, 38:185-222.
Clark, R.C. and Brown, D. W. 1977. Petroleum’s Properties and Analyses in Biotic andAbiotic Systems. In: Effects of Petroleum on Arctic and Subarctic MarineEnvironments and Organisms, (ed. Malins, D.C.) Vol. 1).
Close, Jay. C. 1993. Natural Fractures in Coal; Chapter 5 of AAPG Studies in Geology38, “Hydrocarbons from Coal”, pp. 119-133.
Colorado GIS. 2001. Approved Drilling Permits,http://cogccweb.state.co.us/cogis/DrillingPermitsList.asp
Colorado Oil and Gas Conservation Commission and New Mexico Oil ConservationDivision, personal communication, 2001.
Colorado Oil and Gas Conservation Commission. 2001.http://www.oil-gas.state.co.us/
Condra, G. E. and Reed, E. C. 1959. The geological section of Nebraska. NebraskaGeological Survey Bulletin 14A, 1959.
Consolidated Industrial Services, Inc. 2001. Hydraulic fracturing site visit notes,Western Interior Coal Region, State of Kansas.
Cordova, Robert M. 1963. Reconnaissance of the ground-water resources of theArkansas Valley Region, Arkansas. Contributions to the Hydrology of the UnitedStates, Geological Survey Water-Supply Paper 1669-BB, 1963.
Cramer, D.G. 1992. The unique aspects of fracturing western U.S. coalbeds; Journal ofPetroleum Technology, October 1992, pp. 1126-1133.
DASC Web site. 2001a. Kansas elevation map.http://gisdasc.kgs.ukans.edu/dasc/kanview.html.
DASC Web site. 2001b. Ozark Aquifer base map.http://gisdasc.kgs.ukans.edu/dasc/kanview.html.

EPA 816-R-04-003 Master References
Evaluation of Impacts to Underground Sources June 2004of Drinking Water by Hydraulic Fracturing ofCoalbed Methane Reservoirs MR-3
DeBruin, Rodney H., Lyman, Robert M., Jones, Richard W., and Cook, Lance W. 2000.Information Pamphlet 7. Wyoming State Geological Survey.
Diamond, W.P. 1987a. Underground observations of mined-through stimulationtreatments of coalbeds. Quarterly Review of Methane from Coal SeamsTechnology. v. 4, n. 4 (June 1987), pp. 19-29.
Diamond, W.P. 1987b. Characterization of Fracture Geometry and Roof PenetrationAssociated with Stimulation Treatments in Coalbeds. Proceedings of the 1987Coalbed Methane Symposium, University of Alabama (Tuscaloosa), pp. 243.
Diamond, W.P. and D.C. Oyler. 1987. Effects of stimulation treatments on coalbeds andsurrounding strata, evidence from underground observations. US Department ofInterior, RI9083, USBM, pp. 1-47.
Dion, N. P. 1984. Washington Ground-Water Resources. In National Water Summary,U.S. Geological Survey Water-Supply Paper No. 2275, pp. 433-438.
Duigon, Mark T. and Smigaj, Michael J. 1985. First report on the hydrologic effects ofunderground coal mining in Southern Garrett County, Maryland, U.S. GeologicalSurvey Report of Investigations No. 41.
Energy Information Agency. 2001. “U.S. Crude Oil, Natural Gas, and Natural GasLiquids Reserves 2000 Annual Report,” DOE/EIA-0216 (2000) Advance Summary,Nov. 2001, p. 17.
Elbel, J.L. 1994. Field evaluation of acid-fracturing treatments with geometrysimulation, buildup, and production data; SPE Production and Facilities, v.9 n.1(February 1994), pp. 43-46.
Elder, C.H. and Deul, M. 1974. Degasification of the Mary Lee coalbed near OakGrove, Jefferson county, Alabama, by vertical borehole in advance of mining; U.S.Bureau of Mines Report 7968.
Eleventh Circuit Court of Appeals, 1997. LEAF v. EPA, 118F.3d 1467.
Ellard, J.S., Roark, R.P., and Ayers, W.B. 1992. Geologic controls on coalbed methaneproduction: an example from the Pottsville formation, Black Warrior Basin,Alabama USA. Symposium on Coalbed Methane Research and Development inAustralia. James Cook University, p. 45-61.
Ely, J.W., Zbitowski, R.I., and Zuber, M.D. 1990. How to develop a coalbed methaneprospect: a case study of an exploratory five-spot well pattern in the Warrior basin,Alabama; SPE Paper 20666, Proceedings of the 65th Annual Technical Conference(New Orleans), pp. 487-496.

EPA 816-R-04-003 Master References
Evaluation of Impacts to Underground Sources June 2004of Drinking Water by Hydraulic Fracturing ofCoalbed Methane Reservoirs MR-4
Ely, John W. 1985. Secondary recovery of oil, oil wells, hydraulic fracturing.Stimulation Engineering Handbook, ix, 357 p.
Fetter, C.W. 1994. Applied Hydrogeology, 3rd ed. New York: Macmillan CollegePublishing Company.
Flores, R.M. and Bader, L.R., 1999. Fort Union Coal in the Powder River Basin,Wyoming and Montana: A synthesis. U.S. Geological Survey Professional Paper1625-A, Chapter PS, 49 pp., on CD-ROM.
Flowerday, C. F., Kuzelka, R. D., and Pederson, D. T., compilers. 1998. The GroundWater Atlas of Nebraska.
Foster, James B. 1980. Fresh and saline ground-water map of West Virginia. U. S.Geological Survey, West Virginia Geological and Economic Survey, Map WV-12.
Friedman, Samuel A. 1982. Determination of reserves of methane from coalbeds for usein rural communities in eastern Oklahoma. Oklahoma Geological Survey, SpecialPublication 82-3, 1982.
Garrison, James R., Jr. (non-survey author), van den Bergh, T.C.V. (non-survey author),Barker, Charles E., Tabet, David E. (non-survey author). 1997. Depositionalsequence stratigraphy and architecture of the Cretaceous Ferron Sandstone;implications for coal and coalbed methane resources; a field excursion. Link, PaulKarl (non-survey editor), Kowallis, Bart J. (non-survey editor), Mesozoic to Recentgeology of Utah, Geology Studies, 42(2): 155-202.
Geological Survey of Alabama, 1930’s to Present, Hydrogeology Well Records, open-filedata for Tuscaloosa, Jefferson and Walker Counties, Alabama, as cited by theAlabama State Oil and Gas Board, 2002.
Gloyn, Robert W. and Sommer, Steven N. 1993. Exploration for coalbed methane gainsmomentum in Uinta Basin. Utah Geological Survey, Oil & Gas Journal,Exploration, pp. 73-76, May 31, 1993.
Graham, G. 2001. Colorado Division of Water Resources, personal communication.
Gray, Ian. 1987. Reservoir engineering in coal seams: the physical process of gasstorage and movement in coal seams; SPE Reservoir Engineering, v. 2, no. 1, pp.7-14.
GRI (Gas Research Institute). 1995. Fracturing Experience at the Rock Creek MultipleCoal Seams Project; Topical Report, prepared by S.W. Lambert, J.L. Saulsberry,P.F. Steidl, M.W. Conway, and S.D. Spafford, July 1995.

EPA 816-R-04-003 Master References
Evaluation of Impacts to Underground Sources June 2004of Drinking Water by Hydraulic Fracturing ofCoalbed Methane Reservoirs MR-5
GRI (Gas Research Institute). 1996. Coordinated Studies in Support of HydraulicFracturing of Coalbed Methane, Final Report # GRI-95/0283, prepared by Stim-Lab, Inc. February 1996, pp. 2.4-1-2.4-3.
GTI (Gas Technology Institute) Web site. 2002. Drilling and Production Statistics forMajor US Coalbed Methane and Gas Shale Reservoirs.http://www.gastechnology.org
Halliburton, Inc., Virginia Site Visit. 2001. EPA observed hydraulic fracturing of gaswells performed by Halliburton, Inc. for Consol Energy (VA) in the CentralAppalachian Basin. August 9, 2001.
Halliburton, Inc. 2002. Personal communication with Halliburton staff, fracturing fluidexperts: Joe Sandy, Pat Finley, and Steve Almond. March 1, 2002.
Halliburton, Inc. 2003. Personal communication with Halliburton staff, fracturing fluidexpert, Steve Almond. April 2003.
Hanson, M.E., Neilsen, P.E., Sorrels, G.G., Boyer, C.M., and Schraufnagel, R.A. 1987.Design, execution, and analysis of a stimulation to produce gas from thin multiplecoal seams; SPE Paper 16860, Proceedings, 1987 Society of Petroleum Engineersannual technical conference and exhibition.
Harper, T.R, Hagans, J.T., and Martins, J.P. 1985. Fracturing without proppant. SPE13858, Proceedings SPE Low Permeability Reservoirs Symposium (Denver), p.83.
Heath, Brian. 1999. Environmental Analyst, Wyoming Department of EnvironmentalQuality, Water Quality Division. Telephone Interview with EPA conductedAugust 19, 1999.
Hemborg, H. T. 1998. Spanish Peak Field, Las Animas County, Colorado: Geologicsetting and early development of a coalbed methane reservoir in the Central RatonBasin. Colorado Geological Survey, Dept. of Natural Resources, Denver, CO,Resource Series 33, 34 pp.
Hill, David. 2001. Gas Technology Institute. Personal communication, peer-reviewpanelist.
Hinkel, J.J., Nimerick, K.H., England, K., Norton, J.C., and Roy, M. 1991. Design andevaluation of stimulation and workover treatments in coal seam reservoirs;Proceedings 1991 Coalbed Methane Symposium, University of Alabama(Tuscaloosa), Tuscaloosa, pp. 453-458.

EPA 816-R-04-003 Master References
Evaluation of Impacts to Underground Sources June 2004of Drinking Water by Hydraulic Fracturing ofCoalbed Methane Reservoirs MR-6
Holditch, S.A 1990. Completion methods in coal seam reservoirs. SPE Paper No.20670. Proceedings 1990 SPE Annual Technical Conference and Exhibition(Production Operations and Engineering), pp. 533-542.
Holditch, S.A. 1993 Completion methods in coal-seam reservoirs; Journal of PetroleumTechnology, v.45 n.3 (March 1993), pp. 270-276.
Holditch, S.A., Ely, J.W., Semmelbeck, M.E., Carter, R.H., Hinkle, J., and Jeffrey, R.G.1988. Enhanced recovery of coalbed methane through hydraulic fracturing; SPEPaper 18250, Proceedings 1988 SPE Annual Technical Conference andExhibition (Production Operations and Engineering), p. 689.
Holditch, S.A., Ely, J.W., and Carter, R.H. 1989. Development of a coal seam fracturedesign manual; Proceedings, 1989 Coalbed Methane Symposium, Tuscaloosa,Alabama, pp. 299-320.
Holland, W. 1999. La Plata County, personal communication.
Hopkins, Herbert T. 1966. Fresh-saline water interface map of Kentucky. U. S.Geological Survey, Kentucky Geological Survey, Series X.
Hudson, Harold & Staff, BJ Services, 2002. Personal communication, conference callwith EPA on April 19, 2002.
Hunt, A. M., and Steele, D. J. 1991. Coalbed methane development in the Northern andCentral Appalachian Basins – past, present and future. The 1991 CoalbedMethane Symposium, The University of Alabama/Tuscaloosa, May 13-16, 1991.
Jeffrey, R.G., J.R. Enever, T. Ferguson, J. Bride, R. Phillips, and S. Davidson. 1993.Small-scale hydraulic fracturing and mineback experiments in coal seams.Proceedings of the 1993 International Coalbed Methane Symposium. Universityof Alabama (Tuscaloosa). May 17-21, 1993. pp. 79-88.
Jeu, S.J., Logan, T.L., and McBane, R.A. 1988. Exploitation of deeply buried coalbedmethane using different hydraulic fracturing techniques; SPE paper 18253,Proceedings 63rd Annual Technical Conference (Houston).
Johnson, R. C. 1989. Geologic history and hydrocarbon potential of Late Cretaceous-age, low-permeability reservoirs, Piceance Basin western Colorado: U. S.Geological Survey Bulletin 1787-E, 51 p.
Johnston, William D., Jr., 1933. Ground water in the Paleozoic rocks of northernAlabama: Geological Survey of Alabama, Special Report No. 16, as cited by theAlabama State Oil and Gas Board, 2002.

EPA 816-R-04-003 Master References
Evaluation of Impacts to Underground Sources June 2004of Drinking Water by Hydraulic Fracturing ofCoalbed Methane Reservoirs MR-7
Jones, A.H., and Schraufnagel, R.A. 1991. In-situ stress variations in the Black Warriorbasin; Proceedings of 1991 Coalbed Methane Symposium, University of Alabama(Tuscaloosa), Tuscaloosa, p. 75.
Jones, A.H., Bell, G.J., and Morales, R.H. 1987a. Examination of potential mechanismsresponsible for the high treatment pressures observed during stimulation ofcoalbed reservoirs; SPE Paper 16421, Proceedings, Department of Energy/SPESymposium: Gas from Low Permeability Reservoirs, p. 317.
Jones, A.H., Bell, G.J., and Morales, R.H. 1987b. The influence of coal fines/chips onthe behavior of hydraulic fracture stimulation treatments; Proceedings of 1987Coalbed Methane Symposium, University of Alabama (Tuscaloosa), Tuscaloosa,pp. 93-102.
Kaiser, W.R. and Ayers, W.B.Jr. 1994. Coalbed methane production, Fruitlandformation, San Juan Basin: geologic and hydrologic controls. New MexicoBureau of Mines and Minerals Bulletin 146: Coalbed methane in the upperCretaceous Fruitland formation, San Juan Basin, New Mexico and Colorado, pp.187-207.
Kaiser, W.R. and Scott, A.R. 1994. Hydrologic setting of the Fort Union Formation,Sand Wash Basin. Report of Investigations – Geologic and Hydrologic Controlson Coalbed Methane, Texas, University, Bureau of Economic Geology, 220, pp.115-125.
Kaiser, W.R., Scott, A., Zhou, N., Hamilton, D.S., and Tyler, R. 1994a. Resources andProducibility of Coalbed Methane in the Sand Wash Basin. Report ofInvestigations – Geologic and Hydrologic Controls on Coalbed Methane, TexasUniversity, Bureau of Economic Geology, 220, pp. 129-145.
Kaiser, W.R., Swartz, T.E., and Hawkins, G.J. 1994b. Hydrologic framework of theFruitland formation, San Juan Basin. New Mexico Bureau of Mines and MineralsBulletin 146: Coalbed methane in the upper Cretaceous Fruitland formation, SanJuan Basin, New Mexico and Colorado, pp. 133-164.
Kelafant, J. R., Wicks, D. E., Kuuskraa, V. A. March 1988. A geologic assessment ofnatural gas from coal seams in the Northern Appalachian Coal Basin. TopicalReport – Final Geologic Report (September 1986 – September 1987).
Keller, Adam. 1999. Planner with La Plata County, personal communication.
Koenig, R.A. 1989. Hydrologic characterization of coal seams for optimum dewateringand methane drainage; Quarterly Review of Methane from Coal SeamsTechnology, v.7, pp. 30-33.

EPA 816-R-04-003 Master References
Evaluation of Impacts to Underground Sources June 2004of Drinking Water by Hydraulic Fracturing ofCoalbed Methane Reservoirs MR-8
Larsen, Very E., 1989. Preliminary evaluation of coalbed methane geology and activityin the Recluse Area, Powder River Basin, Wyoming, Quarterly Review ofMethane from Coal Seams Technology, June.
Laubach, S. E., Marrett, R. A., Olson, J. E., and Scott, A. R., 1998, Characteristics and
origins of coal cleat: a review: International Journal of Coal Geology, v. 35, p.175–207, as cited by Olson, Jon, 2002.
Laubach, S.E. and C.M. Tremain, 1991. Regional coal fracture patterns and coalbed
methane development, in J.C. Roegiers, ed., Rock Mechanics as aMultidisciplinary Science, Proceedings of the 32nd U.S. Symposium, Universityof Oklahoma atNorman. Rotterdam, A.A. Balkema, p. 851-859.
Law, Ben E., Rice, Dudley D., Flores, Romeo M. 1991. Coalbed gas accumulations inthe Paleocene Fort Union Formation, Powder River Basin, Wyoming. RockyMountain Association of Geologists, Coalbed Methane.
Levine, J.R. 1993. Coalification: the evolution of coal as a source rock and reservoirrock for oil and gas; AAPG Studies in Geology 38, pp. 39-77. [Note: Thissource was also cited by the Alabama Oil and Gas Board. 2002. Public CommentOW-2002-0002-0029 to “Draft Evaluation of Impacts to Underground Sources ofDrinking Water by Hydraulic Fracturing of Coalbed Methane Reservoirs.” Federal Register. Vol. 63, No. 185. p. 33992, September 24, 2002.]
Lyons, Paul C. 1997. Central-Northern Appalachian Coalbed Methane Flow Grows. Oil& Gas July 7, 1997, pp. 76-79.
Mavor, M.J., Dhir, R., McLennan, J.D., and Close, J.C. 1991. Evaluation of thehydraulic fracture stimulation of the Colorado 32-7 No. 9 well, San Juan basin;Rocky Mountain Association of Geologists Guidebook, “Coalbed methane ofWestern North America”, Fall Conference and Field Trip, pp. 241-249.
McCord, E. 1999. Attorney at Law, personal communication.
Macfarlane, A. 2001. Kansas Geological Survey, personal communication.
McKee, C.R., Bumb, A.C., and Koenig, R.A. 1989. Stress-dependent permeability andporosity of coal; Proceedings 1987 Coalbed Methane Symposium, University ofAlabama (Tuscaloosa), pp. 16-19.
Merchat, Walt. 1999. Consultant for the Powder River Basin Resource Council,Telephone Interview with EPA conducted May 17, 1999.
Messina, Inc. Web site. 2001. Fracturing fluid manufacturer for the oil and gas industry.www.messinaoil-chem.com.

EPA 816-R-04-003 Master References
Evaluation of Impacts to Underground Sources June 2004of Drinking Water by Hydraulic Fracturing ofCoalbed Methane Reservoirs MR-9
Missouri Division of Geological Survey and Water Resources. 1967. Mineral & WaterResources of Missouri, 43(2).
Montgomery, Scott L. 1999. Powder River Basin, Wyoming: An expanding coalbedmethane (CBM) play. American Association of Petroleum Geologists Bulletin,(August).
Morales, R,H, McLennan, J.D., Jones, A.H., and Schraufnagel, R.A. 1990.Classification of treating pressures in coal fracturing; Proceedings of the 31st U.S.Symposium on Rock Mechanics, 31, pp. 687-694.
Mukherjee, Hemanta and Cudney, Greg. 1993. Extension of acid fracture penetration bydrastic fluid-loss control. JPT Journal of Petroleum Technology, 45(2):102-105.
Naceur, K.B. and Touboul, E. 1990. Mechanisms controlling fracture height growth inlayered media; SPE Production Engineering, v.5 n.2 (May 1990), pp. 142-150.
Nielsen, P. E. and Hanson, M. E. 1987. Analysis and Implications of Three FractureTreatments in Coals at the USX Rock Creek Site Near Birmingham, Alabama,1987 Coalbed Methane Symposium, Tuscaloosa, AL (Nov. 16-19, 1987).
Nolte, K.G. and Economides, M.J. 1991. Fracture design and validation with uncertaintyand model limitations; Journal of Petroleum Technology, v.43 n.9 (September1991), pp. 1147-1155.
Nolte, K.G. and Smith, M.B. 1981. Interpretation of fracturing pressures; Journal ofPetroleum Technology, September 1981, pp.1767-1775.
Oklahoma Corporation Commission (OCC), Depth to Base of Treatable Water MapSeries, 2001.
Oklahoma Geological Survey Web site. 2001. http://www.ou.edu/special/ogs-pttc.
Olson, Jon. 2001. University of Texas at Austin. Personal communication, peer-reviewpanelist.
Osborne, Paul. 2002. USEPA Region VIII UIC Program, personal communication.
Palmer, I.D., Davids, M.W., and Jeu, S.J. 1989. Analysis of unconventional behaviorobserved during coalbed fracturing treatments, Proceedings of the 1989 CoalbedMethane Symposium, University of Alabama/Tuscaloosa, April 17-20, 1989, pp.395-411.
Palmer, I.D. and Sparks, D.P. 1990. Measurement of induced fractures by downhole TVcamera in coalbeds of the Black Warrior Basin; Society of Petroleum Engineers

EPA 816-R-04-003 Master References
Evaluation of Impacts to Underground Sources June 2004of Drinking Water by Hydraulic Fracturing ofCoalbed Methane Reservoirs MR-10
paper number 20660, Proceedings, 1990 Society of Petroleum Engineers annualtechnical conference and exhibition, pp. 445-458.
Palmer, I.D., Fryar, R.T., Tumino, K.A., and Puri, R. 1991a. Comparison between gel-fracture and water-fracture stimulations in the Black Warrior basin; Proceedings1991 Coalbed Methane Symposium, University of Alabama (Tuscaloosa), pp.233-242.
Palmer, I.D., Fryar, R.T., Tumino, K.A., and Puri, R. 1991b. Water fracs outperform gelfracs in coalbed pilot; Oil and Gas Journal, August 12, 1991, pp.71 – 76.
Palmer, I.D., King, N.S., and Sparks, D.P. 1991c. The character of coal fracturetreatments in Oak Grove field, Black Warrior basin, SPE paper no. 22914,Proceedings, 1991 Society of Petroleum Engineers annual technical conferenceand exhibition, pp. 277-286.
Palmer, I.D., King, N.S., and Sparks, D.P. 1993a. The character of coal fracturetreatments in the Oak Grove field, Black Warrior Basin. In Situ, Journal of CoalResearch, 17(3):273-309.
Palmer, I.D., Lambert, S.W., and Spitler, J.L. 1993b. Coalbed methane well completionsand stimulations. Chapter 14 of AAPG Studies in Geology 38, pp. 303-341.
Pappajohn, S. P., and Mitchell, T. E. 1991. Delineation of prospective coalbed methanetrends in western and central Washington State. In Schwochow, S. D. Coalbedmethane of western North America guidebook for the Rocky MountainAssociation of Geologists Fall Conference and Field Trip Sept. 17-20, 1991,Glenwood Springs, CO, pp. 163-178.
Pashin, J.C. and Hinkle, F. 1997. Coalbed Methane in Alabama. Geological Survey ofAlabama Circular 192, 71 pp.
Pashin, J.C. 1994a. Coal body geometry and syn-sedimentary detachment folding in theOak Grove coalbed methane field, Black Warrior basin, Alabama; AAPGBulletin, v. 78, pp. 960-980.
Pashin, J.C. 1994b. Cycles and stacking patterns in Carboniferous rocks of the BlackWarrior foreland basin; Transactions of the Gulf Coast Association of GeologicalSocieties (AAPG), 44, pp.555-563.
Pashin, J.C., Ward, W.E., Winston, R.B., Chandler, R.V., Bolin, D.E., Richter, K.E.,Osborne, W.E, and Sarnecki, J.C. 1991. Regional analysis of the Black Creek-Cobb coalbed methane target interval, Black Warrior Basin, Alabama. AlabamaGeological Survey Bulletin 145, 127 pp.

EPA 816-R-04-003 Master References
Evaluation of Impacts to Underground Sources June 2004of Drinking Water by Hydraulic Fracturing ofCoalbed Methane Reservoirs MR-11
Pennsylvania Department of Conservation and Natural Resources, 2002.
Petroleum Technology Transfer Council Web site. 1999.http://www.pttc.org
Petzet, G. Alan. 1996. Utah coalbed gas exploration poised for growth. Oil & GasJournal, Exploration, p. 54, August 5, 1996.
Platt, Steve. January, 2001. U.S. EPA Region 3, personal communication.
Potter, T.L. and K.E. Simmons. 1998. Total Petroleum Hydrocarbon Criteria WorkingGroup Series, Volume 2. Composition of Petroleum Mixtures. The Associationfor Environmental Health and Science. Available on the Internet at:http://www.aehs.com/publications/catalog/contents/tph.htm.
Powder River Coalbed Methane Information Council (PRCMIC). 2000. CoalbedMethane Development Information, Sheridan, Wyoming.
Powell, R. J., McCabe, M. A., Slabaugh, B. F., Terracina, J. M., Yaritz, J. G., and Ferrer,D. 1999. Applications of a new, efficient hydraulic fracturing fluid system. SPEProduction and Facilities, 14(2):139-143, 1064-668X.
Quarterly Review. 1993. Coalbed methane – state of the industry. Methane From CoalSeams Technology, August, 1993.
R. Morrison & Associates, Inc. 2001. Environmental Tool Box (newsletter). “Doesdiesel #2 fuel oil contain benzene?” Fall 2001.
Rahim, Z. and Holditch, S.A. 1992. The effects of mechanical properties and selectionof completion interval upon the created and propped fracture dimensions inlayered reservoirs; SPE Paper 24349, Proceedings of the 1992 Rocky MountainRegional Meeting (Denver).
Rahim, Z., Holditch, S.A, Zuber, M.D., and Buehring, D.R. 1998. Evaluation of fracturetreatment using a layered-reservoir description: Field examples; SPE Productionand Facilities, v.13 n1 (February 1998), pp. 21-27.
Rice, C.A., Ellis, M.S., and Bullock, J.H., Jr. 2000. Water co-produced with coalbedmethane in the Powder River Basin, Wyoming: preliminary compositional data.U.S. Geological Survey Open-File Report 00-372.
Rice, D.D. 1993. Composition and origins of coalbed gas; AAPG Studies in Geology38, pp. 159-184.

EPA 816-R-04-003 Master References
Evaluation of Impacts to Underground Sources June 2004of Drinking Water by Hydraulic Fracturing ofCoalbed Methane Reservoirs MR-12
Saulsberry, J.L., Schraufnagel, R.A., and Jones, A.H. 1990. Fracture height growth andproduction from multiple reservoirs; SPE paper no. 20659, Proceedings, 1990Society of Petroleum Engineers annual technical conference and exhibition, pp.433-443.
Schlumberger, Ltd. 2001. Material Safety Data Sheets for Hydraulic Fracturing Fluids,Memo to EPA from P.A. VanAllan, Health, Safety and Environmental Councel,Western Hemisphere. September 18, 2001.
Schraufnagel, R.A. 1993. Coalbed methane production. Chapter 15 of AAPG Studies inGeology 38, pp. 341-361.
SDWA (Safe Drinking Water Act) Sections 1422 and 1425.
Sedam, A. C., and Stein, R. B. 1970. Saline ground-water resources of Ohio. HydrologicInvestigations Atlas HA-366, Department of the Interior, U. S. GeologicalSurvey.
Smith, D. 2002. Missouri Geological Survey, personal communication.
Soot, P. 1991. Tax incentives spur development of coalbed methane; Oil and GasJournal, June 1991, pp. 40-42.
Spafford, S.D. 1991. Stimulating multiple coal seams at Rock Creek with accessrestricted to a single seam; Proceedings 1991 Coalbed Methane Symposium,University of Alabama (Tuscaloosa), p. 243.
Steidl, P.F. 1991. Inspection of induced fractures intercepted by mining in the Warriorbasin, Alabama; Proceedings 1991 Coalbed Methane Symposium, University ofAlabama (Tuscaloosa), pp. 181-191.
Stevens, S., Lombardi, T. E., Kelso B. S., and Coates, J. M. 1992. A geologicassessment of natural gas from coal seams in the Raton and Vermejo Formations,Raton Basin. GRI Topical Report 92/0345, 84 pp.
Stevens, S.H., Kuuskraa, J.A., and Schraufnagel, R.A. January, 1996. Technology spursgrowth of U.S. coalbed methane. Oil and Gas Journal, pp. 56-63.
Stone, W.J., Lyford, F.P., Frenzel, P.F., Mizell, N.H. and Padgett, E.T. 1983.Hydrogeology and water resources of San Juan Basin, New Mexico. New MexicoBureau of Mines and Mineral Resources, Hydrologic Report 6, 70 p.
TBEG (Texas Bureau of Economic Geology). 2000. Personal communication withTBEG Staff.

EPA 816-R-04-003 Master References
Evaluation of Impacts to Underground Sources June 2004of Drinking Water by Hydraulic Fracturing ofCoalbed Methane Reservoirs MR-13
Tessin, Robert. 2001. Colorado Oil and Gas Conservation Commission, personalcommunication.
Thompson, J. E., Mchain, C., Gregory, G., and Gerbrandt, D. 1991. New continuous-mix process for gelling anhydrous methanol minimizes hazards. Proceedings-SPE Annual Technical Conference and Exhibition, October 6 – 9, 1991.Publication by Society of Petroleum Engineers of AIME, pp. 425-436.
Tyler, R., Scott, A.R. and Kaiser, W.R. 1998. Defining coalbed methane explorationfairways: An example from the Piceance Basin, Rocky Mountain Foreland.Western United States, Conference Document, March 23-25.http://georef.cos.com/cgi-bin/getRec?un=2001-012340
U.S. Department of the Interior, Bureau of Land Management, Colorado State Office.1998. Glenwood Spring Resource Area: Oil & Gas Leasing Development, DraftSupplemental Environmental Impact Statement, June 1998.
U. S. Department of the Interior, Bureau of Land Management, San Juan Field Office.1999. Coalbed Methane Development in the Northern San Juan Basin ofColorado, A Brief History and Observations, Working Document, December1999.
US Environmental Protection Agency. 1987. Guidelines for Delineation of WellheadProtection Areas. Office of Ground-Water Protection. June 22, 1987.
US Environmental Protection Agency. 1993. Memorandum: Assistance on complianceof 40 CFR Part 191 with ground water protection standards. From James R.Elder, Director, Office of Ground Water and Drinking Water, to Margo T. Oge,Director, Office of Radiation and Indoor Air. June 4, 1993.
US Environmental Protection Agency. 1999. USEPA’s Program to Regulate thePlacement of Waste Water and other Fluids Underground. EPA 810-F-99-019,December 1999.
US Environmental Protection Agency. 2000. Underground Injection Control (UIC)Program; Proposed Coal Bed Methane (CBM) Study Design. Federal Register. Vol. 65, No. 143. p. 45774, July 25, 2000.
US Environmental Protection Agency. 2001. Underground Injection Control; Requestfor Information of Ground Water Contamination Incidents Believed To Be Due toHydraulic Fracturing of Coalbed Methane Wells. Federal Register. Vol. 66, No.146. p. 39396, July 30, 2001.
US Environmental Protection Agency. 2002. Underground Injection Control (UIC)Program; Hydraulic Fracturing of Coalbed Methane (CBM) Wells Report--Notice. Federal Register. Vol. 67, No. 167. p. 55249, August 28, 2002.

EPA 816-R-04-003 Master References
Evaluation of Impacts to Underground Sources June 2004of Drinking Water by Hydraulic Fracturing ofCoalbed Methane Reservoirs MR-14
United States Geological Survey. 1971. State of Ohio, 1:500,000 topographic map.
United States Geological Survey. 1973. State of Kentucky, 1:500,000 topographic map.
United States Geological Survey. 1984. National Water Summary. Hydrologic events,selected water-quality trends, and ground-water resources. United StatesGeological Survey Water-Supply Paper No. 2275.
Utah Department of Natural Resources. 2002. Public Comment OW-2001-0002-0090to “Draft Evaluation of Impacts to Underground Sources of Drinking Water byHydraulic Fracturing of Coalbed Methane Reservoirs.” Federal Register. Vol.63, No. 185. p. 33992, September 24, 2002.
VA Division of Gas and Oil, 2002. Public Comment OW-2001-0002-0084 to “DraftEvaluation of Impacts to Underground Sources of Drinking Water by HydraulicFracturing of Coalbed Methane Reservoirs.” Federal Register. Vol. 63, No. 185.p. 33992, September 24, 2002.
Virginia Department of Mines, Minerals, and Energy (VDMME). 2001. Personalcommunication with VDMME staff.
Valkenburg, Nicholas, Christian, Robert, and Green, Margaret, 1975, Occurrence of ironbacteria in ground-water supplies of Alabama: Alabama Geological SurveyCircular 96, 45p, as cited by the Alabama State Oil and Gas Board, 2002.
Warpinski, Norm, 2001. Sandia Laboratories. Personal communication, peer-reviewpanelist.
Warpinski, N.R., Branagan, P.T., Satler, A.R., Cippolla, C.L., Lorenz, J.G., and Thorne,B.J. 1988. A case study of a stimulation experiment in a fluvial, tight, sandstonegas reservoir. Society of Petroleum Engineers Paper No. 18258, Proceedings 63rd
Annual Technology Conference, October 1988 (Houston), pp. 616-632.
Warpinski, N.R., Schmidt, R.A., and Northrop, D.A. 1982. In-situ stresses: thepredominant influence on hydraulic fracture containment; Journal of PetroleumTechnology, March 1982, pp. 653-664.
Warpinski, Norman R. 1996. Hydraulic Fracture Diagnostics, Journal of PetroleumTechnology, (Oct. 1996).
Willberg, D.M., N. Steinsberger, R. Hoover, R.J. Card. 1998. Optimization of FractureCleanup Using Flowback Analysis. SPE #39920. Proceedings-SPE RockyMountain Regional/Low Permeability Reservoirs Symposium and Exhibition,April 5-8, 1998. Publication by Society of Petroleum Engineers, pp. 147-159.

EPA 816-R-04-003 Master References
Evaluation of Impacts to Underground Sources June 2004of Drinking Water by Hydraulic Fracturing ofCoalbed Methane Reservoirs MR-15
Willberg, D.M., R.J. Card, L.K. Britt, M. Samuel, K.W. England, K.E. Cawiezel, H.Krus. 1997. Determination of the Effect of Formation Water of Fracture FluidCleanup Through Field Testing in the East Texas Cotton Valley. SPE #38620.Proceedings-SPE Annual Technical Conference and Exhibition, October 5-8,1997. Publication by Society of Petroleum Engineers, pp. 531-543.
Wilson, Robert. February, 2001. Director, Virginia Division of Gas & Oil, Departmentof Mines, Minerals, and Energy, personal communication.
Winston, R.B. 1990. Vitrinite reflectance of Alabama’s bituminous coal; AlabamaGeological Survey Circular 139, 54 pp.
Wright, C.A. 1992. Effective design, real-data analysis, and post-job evaluation ofhydraulic fracturing treatments. Methane from Coal Seams Technology Journal,pp. 29-32 (July).
Zebrowitz, M. J., Kelafant, J. R., and Boyer, C. M. 1991. Reservoir characterization andproduction potential of the coal seams in Northern and Central AppalachianBasins. Proceedings of the 1991 Coalbed Methane Symposium, The University ofAlabama/Tuscaloosa, May 13-16, 1991.
Zuber, M.D., Kuuskraa, V.A., and Sawyer, W.K. 1990. Optimizing well spacing andhydraulic fracture design for economic recovery of coalbed methane. SPEFormation Evaluation, 5(1):98-102.
Zuber, M.D., Reeves, S.R., Jones, A.H., and Schraufnagel, R.A. 1991. Variability incoalbed-methane well performance: a case study; Journal of PetroleumTechnology, v.43 n.4 (April 1991), pp. 68-475.
Zuber, Michael D. 1998. Production characteristics and reservoir analysis of coalbedmethane reservoirs. Lyons, Paul C. (editor). Appalachian coalbed methane.International Journal of Coal Geology, 38 (1-2):27-45. Meeting: Appalachiancoalbed methane, Lexington, KY, United States, Sept. 27-30, 1997.
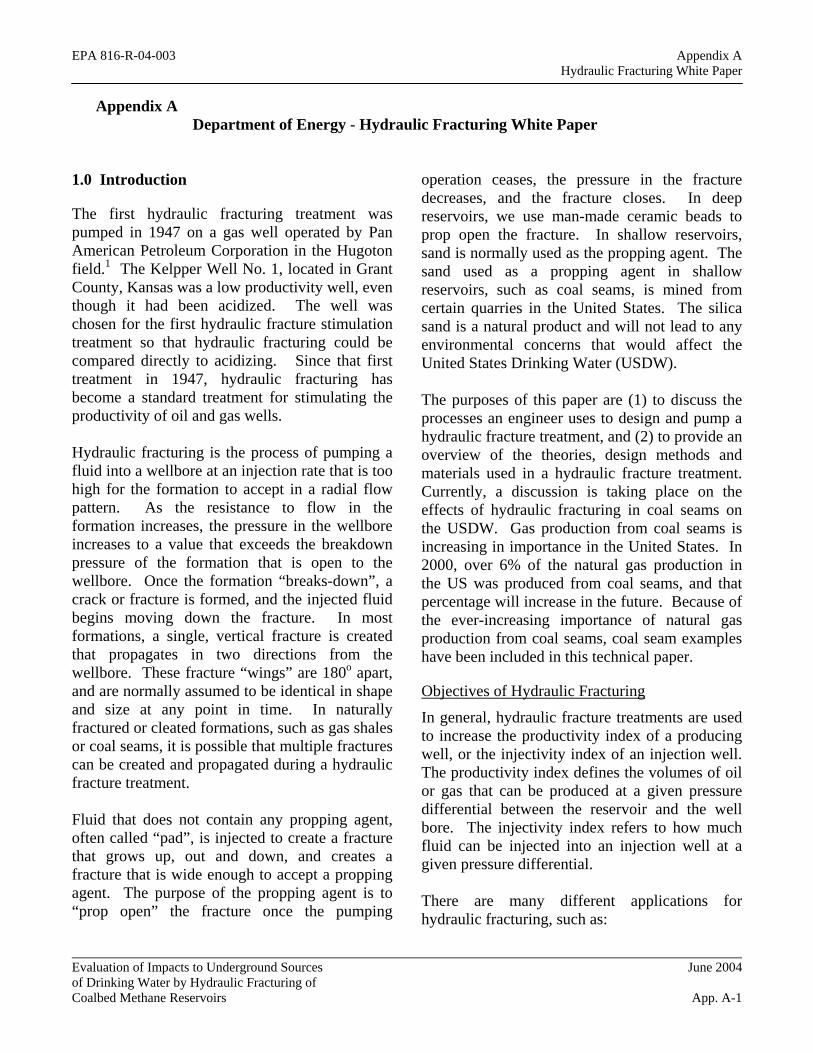
EPA 816-R-04-003 Appendix AHydraulic Fracturing White Paper
Evaluation of Impacts to Underground Sources June 2004of Drinking Water by Hydraulic Fracturing ofCoalbed Methane Reservoirs App. A-1
Appendix ADepartment of Energy - Hydraulic Fracturing White Paper
1.0 Introduction
The first hydraulic fracturing treatment waspumped in 1947 on a gas well operated by PanAmerican Petroleum Corporation in the Hugotonfield.1 The Kelpper Well No. 1, located in GrantCounty, Kansas was a low productivity well, eventhough it had been acidized. The well waschosen for the first hydraulic fracture stimulationtreatment so that hydraulic fracturing could becompared directly to acidizing. Since that firsttreatment in 1947, hydraulic fracturing hasbecome a standard treatment for stimulating theproductivity of oil and gas wells.
Hydraulic fracturing is the process of pumping afluid into a wellbore at an injection rate that is toohigh for the formation to accept in a radial flowpattern. As the resistance to flow in theformation increases, the pressure in the wellboreincreases to a value that exceeds the breakdownpressure of the formation that is open to thewellbore. Once the formation “breaks-down”, acrack or fracture is formed, and the injected fluidbegins moving down the fracture. In mostformations, a single, vertical fracture is createdthat propagates in two directions from thewellbore. These fracture “wings” are 180o apart,and are normally assumed to be identical in shapeand size at any point in time. In naturallyfractured or cleated formations, such as gas shalesor coal seams, it is possible that multiple fracturescan be created and propagated during a hydraulicfracture treatment.
Fluid that does not contain any propping agent,often called “pad”, is injected to create a fracturethat grows up, out and down, and creates afracture that is wide enough to accept a proppingagent. The purpose of the propping agent is to“prop open” the fracture once the pumping
operation ceases, the pressure in the fracturedecreases, and the fracture closes. In deepreservoirs, we use man-made ceramic beads toprop open the fracture. In shallow reservoirs,sand is normally used as the propping agent. Thesand used as a propping agent in shallowreservoirs, such as coal seams, is mined fromcertain quarries in the United States. The silicasand is a natural product and will not lead to anyenvironmental concerns that would affect theUnited States Drinking Water (USDW).
The purposes of this paper are (1) to discuss theprocesses an engineer uses to design and pump ahydraulic fracture treatment, and (2) to provide anoverview of the theories, design methods andmaterials used in a hydraulic fracture treatment.Currently, a discussion is taking place on theeffects of hydraulic fracturing in coal seams onthe USDW. Gas production from coal seams isincreasing in importance in the United States. In2000, over 6% of the natural gas production inthe US was produced from coal seams, and thatpercentage will increase in the future. Because ofthe ever-increasing importance of natural gasproduction from coal seams, coal seam exampleshave been included in this technical paper.
Objectives of Hydraulic Fracturing
In general, hydraulic fracture treatments are usedto increase the productivity index of a producingwell, or the injectivity index of an injection well.The productivity index defines the volumes of oilor gas that can be produced at a given pressuredifferential between the reservoir and the wellbore. The injectivity index refers to how muchfluid can be injected into an injection well at agiven pressure differential.
There are many different applications forhydraulic fracturing, such as:

EPA 816-R-04-003 Appendix AHydraulic Fracturing White Paper
Evaluation of Impacts to Underground Sources June 2004of Drinking Water by Hydraulic Fracturing ofCoalbed Methane Reservoirs App. A-2
• Increase the flow rate of oil and/or gas fromlow permeability reservoirs,
• Increase the flow rate of oil and/or gas fromwells that have been damaged,
• Connect the natural fractures and/or cleats ina formation to the wellbore,
• Decrease the pressure drop around the well tominimize sand production,
• Decrease the pressure drop around the well tominimize problems with asphaltine and/orparaffin deposition,
• Increase the area of drainage or the amount offormation in contact with the wellbore, and
• Connect the full vertical extent of a reservoirto a slanted or horizontal well.
Obviously, there could be other uses of hydraulicfracturing, but the majority of the treatments arepumped for these seven reasons.
A low permeability reservoir is one that has ahigh resistance to fluid flow. In manyformations, chemical and/or physical processesalter a reservoir rock over geologic time.Sometimes, these diagenetic processes restrict theopenings in the rock and reduce the ability offluids to flow through the rock. Lowpermeability rocks are normally excellentcandidates for stimulation by hydraulicfracturing.
Regardless of the permeability, a reservoir rockcan be damaged when a well is drilled throughthe reservoir and when casing is set and cementedin place. Damage occurs because drilling and/orcompletion fluids leak into the reservoir and plugup the pores and pore throats. When the pores areplugged, the permeability is reduced, and thefluid flow in this damaged portion of the reservoirmay be substantially reduced. Damage can besevere in naturally fractured reservoirs, like coalseams. To stimulate damaged reservoirs, a short,conductive hydraulic fracture is often the desiredsolution. As such, hydraulic fracturing worksvery well in many damaged, coal seam reservoirs.
In many cases, especially for low permeabilityformations, damaged reservoirs and horizontalwells in a layered reservoir, the well would be“uneconomic” unless a successful hydraulicfracture treatment is designed and pumped. Thus,the engineer in charge of the economic success ofsuch a well, must (1) design the optimal fracturetreatment, and then (2) go to the field to becertain the optimal treatment is pumpedsuccessfully.
Candidate Selection
The success or failure of a hydraulic fracturetreatment often depends on the quality of thecandidate well selected for the treatment.Choosing an excellent candidate for stimulationoften ensures success, while choosing a poorcandidate will normally result in economicfailure. To select the best candidate forstimulation, the design engineer must considermany variables. The most critical parameters forhydraulic fracturing are formation permeability,the in-situ stress distribution, reservoir fluidviscosity, skin factor, reservoir pressure, reservoirdepth and the condition of the wellbore. The skinfactor refers to whether the reservoir is alreadystimulated or, perhaps is damaged. If the skinfactor is positive, the reservoir is damaged andcould possibly be an excellent candidate forstimulation.
The best candidate wells for hydraulic fracturingtreatments will have a substantial volume of oiland gas in place, and will have a need to increasethe productivity index. Such reservoirs will have(1) a thick pay zone, (2) medium to high pressure,(3) in-situ stress barriers to minimize verticalheight growth, and (4) either be a lowpermeability zone or a zone that has beendamaged (high skin factor). For coalbed methanereservoirs, the ideal candidate, in addition to the 4factors listed above, will be a thick coal seamcontaining both (1) a large volume of sorbed gasand (2) abundant coal cleats to providepermeability.

EPA 816-R-04-003 Appendix AHydraulic Fracturing White Paper
Evaluation of Impacts to Underground Sources June 2004of Drinking Water by Hydraulic Fracturing ofCoalbed Methane Reservoirs App. A-3
Reservoirs that are not good candidates forhydraulic fracturing are those with little oil or gasin place due to thin reservoirs, low reservoirpressure, or small aerial extent. Reservoirs withextremely low permeability may not produceenough hydrocarbons to pay all the drilling andcompletion costs even if successfully stimulated;thus, such reservoirs would not be goodcandidates for stimulation. In coal seamreservoirs, the number, thickness and location ofthe coal seams must be considered when decidingif the coals can be completed and stimulatedeconomically. If the coal seams are too thin ortoo scattered up and down the hole, the coals maynot be ideal candidates for stimulation byhydraulic fracturing.
Developing Data Sets
For most petroleum engineering problems,developing a complete and accurate data set isoften the most time consuming part of solving theproblem. For hydraulic fracture treatment design,the data required to run both the fracture designmodel and the reservoir simulation model can bedivided into two groups. One group lists the datathat can be “controlled” by the engineer. Thesecond group reflects data that must be measuredor estimated, but cannot be controlled.
The primary data that can be controlled by theengineer are the well completion details,treatment volume, pad volume, injection rate,fracture fluid viscosity, fracture fluid density,fluid loss additives, propping agent type, andpropping agent volume. The data that must bemeasured or estimated by the design engineer areformation depth, formation permeability, in-situstresses in the pay zone, in-situ stresses in thesurrounding layers, formation modulus, reservoirpressure, formation porosity, formationcompressibility, and the thickness of thereservoir. There are actually three (3) thicknessthat are important to the design engineer: thegross thickness of the reservoir; the net thicknessof the oil or gas producing interval; and the
permeable thickness that will accept fluid lossduring the hydraulic fracture treatment.
The most critical data for the design of a fracturetreatment are, roughly in order of importance, (1)the in-situ stress profile, (2) formationpermeability, (3) fluid loss characteristics, (4)total fluid volume pumped, (5) propping agenttype and amount, (6) pad volume, (7) fracturefluid viscosity, (8) injection rate, and (9)formation modulus. Since most engineers havemore work to do than time to do the work, thedesign engineer should focus most of his/her timeon the most important parameters. In hydraulicfracture treatment design, by far, the two mostimportant parameters are the in-situ stress profileand the permeability profile of the zone to bestimulated and the layers of rock above andbelow the target zone.
In new fields or reservoirs, most operatingcompanies are normally willing to spend moneyto run logs, cut cores and run well tests todetermine important factors such as the in-situstress and the permeability of the major reservoirlayers. By using such data, along with fracturetreatment records and production records,accurate data sets for a given reservoir in a givenfield can normally be compiled. These data setscan be used on subsequent wells to optimize thefracture treatment designs. It is normally notpractical to cut cores and run well tests on everywell. Thus, the data obtained from cores and welltests must be correlated to log parameters so thelogs on subsequent wells can be used to compileaccurate data sets.
To design a fracture treatment, most engineersuse pseudo 3-dimensional (P3D) models. Full 3-D models exist; however, the use of full 3-Dmodels is currently limited to supercomputers andresearch organizations. To use a P3D model, thedata must be input by reservoir layer. Fig. 1illustrates the profiles of important input datarequired by a P3D model. For the situation in

EPA 816-R-04-003 Appendix AHydraulic Fracturing White Paper
Evaluation of Impacts to Underground Sources June 2004of Drinking Water by Hydraulic Fracturing ofCoalbed Methane Reservoirs App. A-4
Fig. 1, the fracture treatment would be initiated inthe sandstone reservoir. The fracture wouldtypically grow up and down until a barrier isreached to prevent vertical fracture growth. Inmany cases, thick marine shale will be a barrier tovertical fracture growth. In some cases, coalseams will prevent fractures from growingvertically. Many coal seams are highly cleated,and when the fracture fluid enters the coal seam,it remains contained within the coal seam. Inthick, highly cleated coal seams, the growth ofthe hydraulic fracture will normally be limited tothe coal seam.
SiltstoneShale
Siltstone
Shale
Shale
ThicknessShale
SandSand
GR(API)
Resistivity (OHMM)
200'
50' 10'50'100'
200'
100'10'
(ft)Perm(md)
Porosity(frac)
In-situStress(psi)
0.0001 7200
0.01 61000.03 61400.003 6550
0.003 6650
0.0001 7650
0.10
0.120.180.06
0.06
0.10
SiltstoneShale
Siltstone
Shale
Shale
ThicknessShale
SandSand
GR(API)
Resistivity (OHMM)
200'
50' 10'50'100'
200'
100'10'
(ft)Perm(md)
Porosity(frac)
In-situStress(psi)
0.0001 7200
0.01 61000.03 61400.003 6550
0.003 6650
0.0001 7650
0.10
0.120.180.06
0.06
0.10
Fig. 1 – Typical input data for a P3D model.
The data used to design a fracture treatment canbe obtained from a number of sources, such asdrilling records, completion records, well files,open hole geophysical logs, cores and coreanalyses, well tests, production data, geologicrecords, and other public records, such aspublications. In addition, service companiesprovide data on their fluids, additives andpropping agents. Table 1 illustrates typical dataneeded to design a fracture treatment and possiblesources for the data.
Fracture Treatment Optimization
The goal of every design engineer should be todesign the optimum fracture treatment for eachand every well. In 1978, Holditch et al.2 wrote apaper concerning the optimization of both the
Table 1 – Sources of DataData Units Sources
Formation Permeability md Cores, Well Tests,Correlations,Production Data
Formation Porosity % Cores, LogsReservoir Pressure psi Well Tests, Well Files,
Regional DataFormation Modulus psi Cores, Logs,
CorrelationsFormationCompressibility
psi Cores, Logs,Correlations
Poisson’s Ratio Cores, Logs,Correlations
Formation Depth ft Logs, Drilling RecordsIn-situ Stress psi Well Tests, Logs,
CorrelationsFormation Temperature °F Logs, Well Tests,
CorrelationsFracture Toughness psi - in Cores, Correlations
Water Saturation % Logs, CoresNet Pay Thickness Ft Logs, CoresGross Pay Thickness Ft Logs, Cores, Drilling
RecordsFormation Lithology Cores, Drilling
Records, Logs,Geologic Records
Wellbore Completion Well Files, CompletionPrognosis
Fracture Fluids Service CompanyInformation
Fracture Proppants Service CompanyInformation
propped fracture length and the drainage area(well spacing) for low permeability gasreservoirs. Fig. 2 illustrates the methodologyused to optimize the size of a fracture treatment3,4. Fig. 2 clearly shows the following:
• As the propped length of a fracture increases,the cumulative production will increase, andthe revenue from hydrocarbon sales willincrease,
• As the fracture length increases, theincremental benefit ($ of revenue per foot ofadditional propped fracture length) decreases,
• As the treatment volume increases, thepropped fracture length increases,
• As the fracture length increases, theincremental cost of each foot of fracture ($ ofcost per foot of additional propped fracturelength) increases, and

EPA 816-R-04-003 Appendix AHydraulic Fracturing White Paper
Evaluation of Impacts to Underground Sources June 2004of Drinking Water by Hydraulic Fracturing ofCoalbed Methane Reservoirs App. A-5
• When the incremental cost of the treatment iscompared to the incremental benefit ofincreasing the treatment volume, an optimumpropped fracture length can be found forevery situation.
Additional economic calculations can be made todetermine the optimum fracture treatment design.However, in all cases, the design engineer mustconsider the effect of the fracture upon flow ratesand recovery, the cost of the treatment, and theinvestment guidelines of the operator of the well.
Field Considerations
After the optimum fracture treatment has beendesigned, it must be pumped into the wellsuccessfully. A successful field operationsrequires planning, coordination and cooperationof all parties. Treatment supervision and the useof quality control measures will improve thesuccessful application of hydraulic fracturing.Safety is always the primary concern in the field.Safety begins with a thorough understanding byall parties on their duties in the field. A safetymeeting is always held to review the treatmentprocedure, establish a chain of command, be sure
everyone knows his/her job responsibilities forthe day, and to establish a plan for emergencies.The safety meeting should also be used to discussthe well completion details and the maximumallowing injection rate and pressures, as well asthe maximum pressures to be held as backup toan annulus. All casing, tubing, wellheads, valves,and weak links, such as liner tops, should bethoroughly tested prior to rigging up thefracturing equipment. Mechanical failures duringa treatment can be costly and dangerous. Allmechanical problems should be repaired prior topumping the fracture treatment.
Prior to pumping the treatment, the engineer-in-charge should conduct a detailed inventory of allthe equipment and materials on location. Theinventory should be compared to the design andthe prognosis. After the treatment has concluded,the engineer should conduct another inventory ofall the materials left on location. In most cases,the difference in the two inventories can be usedto verify what was mixed and pumped into thewellbore and the hydrocarbon bearing formation.
ReservoirSimulatorReservoirSimulator
HydrafracSimulatorHydrafracSimulator
Cum.Prod.
Time Fracture Length
Fracture LengthFracture Length
Fracture Length
TreatmentVolume
$Revenue
$Cost
$ RevenueLess
$ Cost
Lf = 1,500
Lf = 500
Lf = 1,000
Fig. 2 – Fracture treatment optimization process.

EPA 816-R-04-003 Appendix AHydraulic Fracturing White Paper
Evaluation of Impacts to Underground Sources June 2004of Drinking Water by Hydraulic Fracturing ofCoalbed Methane Reservoirs App. A-6
In addition to an inventory, samples of the basefracturing fluid (usually water) should be takenand analyzed. Typically, a water analysis is doneon the base fluid to determine the mineralspresent and the type of bacteria in the water. Thedata from the water analysis can be used to selectthe additives required to mix the viscous fracturefluid required to create a wide fracture and totransport the propping agent into the fracture.Table 2 shows the typical compositions for mixwaters used in different fracturing situations. Inaddition to testing the water, samples of theadditives used during a treatment and the fracturefluid after all additives have been added shouldbe taken during the job and saved for futureanalyses, if required.
Table 2 – Fracturing Fluids and Conditionsfor Their Use
Base Fluid Fluid TypeMain
Composition Used For
Linear Fluids Gelled Water,GUAR< HPG,HEC, CMHPG
Short Fractures,Low Temperatures
Water BasedCrosslinked
FluidsCrosslinker +GUAR, HPG,
CMHPG, CMHEC
Long Fractures,High Temperatures
Water BasedFoam
Water andFoamer + N2 or CO2
Low Pressure Formations
Foam Based Acid Based Foam Acid and Foamer+ N2
Low Pressures, WaterSensitive Formations
Alcohol BasedFoam
Methanol andFoamer + N2
Low Pressure FormationsWith Water Blocking Problems
Linear Fluids Oil, Gelled Oil Water Sensitive Formations,Short Fractures
Oil Based CrosslinkedFluids
Phosphate EsterGels
Water ExternalEmulsions
Water + Oil +Emulsifier Good For Fluid Loss Control
Water Sensitive Formations,Long Fractures
Base Fluid Fluid TypeMain
CompositionMain
Composition Used For
Linear Fluids Gelled Water,GUAR< HPG,HEC, CMHPG
Gelled Water,GUAR< HPG,HEC, CMHPG
Short Fractures,Low Temperatures
Water BasedCrosslinked
FluidsCrosslinked
FluidsCrosslinker +GUAR, HPG,
CMHPG, CMHEC
Crosslinker +GUAR, HPG,
CMHPG, CMHEC
Long Fractures,High Temperatures
Water BasedFoam
Water BasedFoam
Water andFoamer + N2 or CO2
Water andFoamer + N2 or CO2
Low Pressure Formations
Foam Based Acid Based Foam Acid and Foamer+ N2
Acid and Foamer+ N2
Low Pressures, WaterSensitive Formations
Alcohol BasedFoam
Alcohol BasedFoam
Methanol andFoamer + N2
Methanol andFoamer + N2
Low Pressure FormationsWith Water Blocking Problems
Linear Fluids Oil, Gelled Oil Water Sensitive Formations,Short Fractures
Oil Based CrosslinkedFluids
CrosslinkedFluids
Phosphate EsterGels
Phosphate EsterGels
Water ExternalEmulsions
Water ExternalEmulsions
Water + Oil +Emulsifier
Water + Oil +Emulsifier Good For Fluid Loss Control
Water Sensitive Formations,Long Fractures
Formation temperature is one of the main factorsconcerning the type of additives required to mixthe optimum fracturing fluid. In deep, hotreservoirs (>250oF), more additives are requiredthan in shallow, low temperature reservoirs.Since most coal seams are very shallow, feweradditives are normally required to mix theoptimum fracture fluid.
2.0 Fracture Mechanics
Fracture mechanics has been part of miningengineering and mechanical engineering forhundreds of years. No one is more interested inunderground rock fractures than a miner workingin an underground mine. In petroleumengineering, we have only used fracturemechanics theories in our work for about 50years. Much of what we use in hydraulicfracturing theory and design has been developedby other engineering disciplines many years ago.However, certain aspects, such as poroelastictheory, are unique to porous, permeableunderground formations. The most importantparameters are in-situ stress, Poisson’s ration, andYoung’s modulus.
In-situ Stresses
Underground formations are confined and understress. Fig. 3 illustrates the local stress state atdepth for an element of formation. The stressescan be divided into 3 principal stresses. In Fig. 3,σ1 is the vertical stress, σ2 is the maximumhorizontal stress, while σ3 is the minimumhorizontal stress, where σ1>σ2>σ3. This is atypical configuration for coalbed methanereservoirs. However, depending on geologicconditions, the vertical stress could also be theintermediate (σ2) or minimum stress (σ3). Thesestresses are normally compressive and vary inmagnitude throughout the reservoir, particularlyin the vertical direction (from layer to layer). Themagnitude and direction of the principal stressesare important because they control the pressurerequired to create and propagate a fracture, theshape and vertical extent of the fracture, thedirection of the fracture, and the stresses trying tocrush and/or embed the propping agent duringproduction.
A hydraulic fracture will propagate perpendicularto the minimum principal stress (σ3). If theminimum horizontal stress is σ3, the fracture will
EPA 816-R-04-003 Appendix AHydraulic Fracturing White Paper
Evaluation of Impacts to Underground Sources June 2004of Drinking Water by Hydraulic Fracturing ofCoalbed Methane Reservoirs App. A-7
be vertical and, we can compute the minimumhorizontal stress profile with depth using Eq. 1.
σ1
2σ
3σ
σ1 3σ 2σ> >
σ1σ1
2σ2σ
3σ3σ
σ1 3σ 2σ> >σ1σ1 3σ3σ 2σ2σ> >
σ1σ1
2σ2σ
3σ3σ
σ1 3σ 2σ> >σ1σ1 3σ3σ 2σ2σ> >
σ1σ1
2σ2σ
3σ3σ
σ1σ1 3σ3σ 2σ2σ> >σ1σ1 3σ3σ 2σ2σ> > 2σ2σ> >Fig. 3 – Local in-situ stress at depth.
( ) extppobmin 1σ+σα+σα−σ
ν−ν
≅σ Eq. 1
Where:
σmin = the minimum horizontal stress (in-situstress)
ν = Poissons’ ratioσob = overburden stressα = Biot’s constantσp = reservoir fluid pressure or pore
pressureσext = tectonic stress
Poisson’s ratio can be estimated from acoustic logdata or from correlations based upon lithology.For coal seams, the value of Poisson’s ratio willrange from 0.2 – 0.4. The overburden stress canbe computed using density log data. Normally,the value for overburden pressure is about 1.1 psiper foot of depth. The reservoir pressure must bemeasured or estimated. Biot’s constant must beless than or equal to 1.0 and typically ranges from0.5 to 1.0. The first two (2) terms on the righthand side of Eq.1 represent the horizontal stressresulting from the vertical stress and theporoelastic behavior of the formation. Thetectonic stress term is important in many areas
where plate tectonics or other forces increase thehorizontal stresses.
Poroelastic theory can be used to determine theminimum horizontal stress in tectonically relaxedareas.8,9 Poroelastic theory combines theequations of linear elastic stress-strain theory forsolids with a term that includes the effects of fluidpressure in the pore space of the reservoir rocks.The fluid pressure acts equally in all directions asa stress on the formation material. The “effectivestress” on the rock grains is computed usinglinear elastic stress-strain theory. Combining thetwo sources of stress results in the total stress onthe formation, which is the stress that must beexceeded to initiate fracturing.
In many areas, however, the effects of tectonicactivity must be included in the analyses of thetotal stresses. To measure the tectonic stresses,injection tests are conducted to measure theminimum horizontal stress. The measured stressis then compared to the stress calculated by theporoelastic equation to determine the value of thetectonic contribution.
Basic Rock Mechanics
In addition to the in-situ or minimum horizontalstress, other rock mechanical properties areimportant when designing a hydraulic fracture.Poisson’s ratio is defined as “the ratio of lateralexpansion to longitudinal contraction for a rockunder a uniaxial stress condition”.10 The value ofPoisson’s ratio is used in Eq. 1 to convert theeffective vertical stress component into aneffective horizontal stress component. Theeffective stress is defined as the total stress minusthe pore pressure.
The theory used to compute fracture dimensionsis based upon linear elasticity. To apply thistheory, the modulus of the formation is animportant parameter. Young’s modulus isdefined as “the ratio of stress to strain for uniaxialstress”.10 The modulus of a material is a measure

EPA 816-R-04-003 Appendix AHydraulic Fracturing White Paper
Evaluation of Impacts to Underground Sources June 2004of Drinking Water by Hydraulic Fracturing ofCoalbed Methane Reservoirs App. A-8
of the stiffness of the material. If the modulus islarge, the material is stiff. In hydraulic fracturing,a stiff rock will result in more narrow fractures.If the modulus is low, the fractures will be wider.The modulus of a rock will be a function of thelithology, porosity, fluid type, and othervariables. Table 3 illustrates typical ranges formodulus as a function of lithology.
Table 3. Typical Ranges of Young’s Modulus forVarious Lithologies
Lithology Young’s Modulus
Soft Sandstone 2-5 x 10⁶ psi
Hard Sandstone 6-10 x 106 psi
Limestone 8-12 x 106 psi
Coal 0.1-1 x 10⁶ psi
Shale 1-10 x 106 psi
Because coal is highly cleated, the modulus of thecoal seam in-situ may be very low. In very lowmodulus, highly cleated coal seams, it is likelythat most fractures will be wide and short, that is,not penetrating far into the formation from thewell bore.
Fracture Orientation
A hydraulic fracture will propagate perpendicularto the least principle stress (Fig. 3). In someshallow formations the least principal stress is theoverburden stress; thus, the hydraulic fracturewill be horizontal. Nielsen and Hansen publisheda paper where horizontal fractures in coal seamreservoirs were documented 11. In reservoirsdeeper than 1000 ft or so, the least principal stresswill likely be horizontal; thus, the hydraulicfracture will be vertical. The azimuth orientationof the vertical fracture will depend upon theazimuth of the minimum and maximumhorizontal stresses. Lacy and Smith provided adetailed discussion of fracture azimuth in SPEMonograph 12.12
Injection Tests
The only reliable technique for measuring in-situstress is by pumping into a reservoir, creating afracture, and measuring the pressure at which thefracture closes 13. The well tests used to measurethe minimum principal stress are as follows: in-situ stress tests; step-rate/flow back tests; mini-fracture tests; and step-down tests. For mostfracture treatments, mini-fracture tests and step-down tests are pumped ahead of the main fracturetreatment. As such, accurate data are normallyavailable to calibrate and interpret the pressuresmeasured during a fracture treatment. In-situstress tests and step-rate/flow back tests are notrun on every well. However, it is common to runsuch tests in new fields or new reservoirs to helpdevelop the correlations required to optimizefracture treatments for subsequent wells.
An in-situ stress test (or micro-frac) can be eitheran injection-falloff test or an injection-flow backtest. The in-situ stress test is conducted usingsmall volumes of fluid (a few barrels), injected atlow injection rates (gals/min), normally usingstraddle packers to minimize well bore storageeffects, into a small number of perforations (1-2ft). The objective is to pump a thin fluid (wateror nitrogen) at a rate barely sufficient to create asmall fracture. Once the fracture is open, then thepumps are shut down, and the pressure isrecorded and analyzed to determine when thefracture closes. Thus, fracture closure pressure issynonymous with in-situ stress and withminimum horizontal stress. When the pressure inthe fracture is greater than the fracture closurepressure, the fracture is open. When the pressurein the fracture decreases below the fractureclosure pressure, the fracture is closed. Fig. 4illustrates a typical wellbore configuration forconducting an in-situ stress test. Fig. 5 showstypical data that are measured. Multiple tests areconducted to ensure repeatability. The data fromany one of the injection-falloff tests can beanalyzed to determine when the fracture closes.

EPA 816-R-04-003 Appendix AHydraulic Fracturing White Paper
Evaluation of Impacts to Underground Sources June 2004of Drinking Water by Hydraulic Fracturing ofCoalbed Methane Reservoirs App. A-9
Fig. 6 illustrates how one such test can beanalyzed to determine in-situ stress.
Falloff
SRO gaugeSeating nipple
Packer Perforated joint
Bridge plugPerforated sub
InjectionElectric wireline
Tubing
PerforationsMRO gauge
MRO gauge
30 ft 30 ft
Fluid
Falloff
SRO gaugeSeating nipple
Packer Perforated joint
Bridge plugPerforated sub
InjectionElectric wireline
Tubing
PerforationsMRO gauge
MRO gauge
30 ft30 ft 30 ft
Fluid
Fig. 4 – Cased hole test configuration.
Pres
sure
Inje
ctio
n ra
te
Time
Stage 1 Stage 2
Breakdown
Shut down
Rate Pressure
ISIP
ClosurePres
sure
Inje
ctio
n ra
te
Time
Stage 1 Stage 2
Breakdown
Shut down
Rate Pressure
ISIP
Closure
Fig. 5 – Typical stress test pump-in/shut-in.
0 1 2 3 4 5 60
1,000
2,000
3,000
4,000
5,000
SQUARE-ROOT-OF-SHUT-IN-TIME, sqrt(min)
SUR
FAC
E PR
ESSU
RE,
psi
0.80 psi/ft
PressureDerivative
0.60 psi/ft
Fig. 6 – Closure pressure analysis.
Mini-fracture tests are run to reconfirm the valueof in-situ stress in the pay zone and to estimatethe fluid loss properties of the fracture fluid. Amini-fracture test is run using fluid similar to thefracture fluid that will be used in the maintreatment. Several hundred barrels of fracturingfluid are normally pumped at fracturing rates. Incoal seams, because the fracture height willusually be small, the mini-fracture test will oftenbe eliminated or pumped with only a smallvolume of fracturing fluid. The purpose of theinjection is to create a fracture that will be ofsimilar height to the one created in the mainfracture treatment. After the mini-fracture hasbeen created, the pumps are shut down and thepressure decline is monitored. The pressuredecline can be used to estimate the fractureclosure pressure and the total fluid leak-offcoefficient. Data from mini-fracture treatmentscan be used to alter the design of the mainfracture treatment if the data determined duringthe mini-fracture test is substantially different thatthe data used to design the main fracturetreatment.
For an injection-falloff test to be conductedsuccessfully, it is necessary to have a cleanconnection between the wellbore and the createdfracture. The purpose of in-situ stress tests andmini-fracture tests are to determine the pressurein the fracture when the fracture is open, and thepressure when the fracture is closed. If there isexcess pressure drop near the wellbore, due topoor connectivity between the wellbore and thefracture, the interpretation of in-situ stress testdata can be difficult. In coal seam reservoirs, dueto the highly cleated nature of the coal, multiplefractures that follow tortuous paths are oftencreated during injection tests.14 When thesetortuous paths are created, the pressure drop inthe “near-wellbore” region can be very high,which complicates the analyses of the pressurefalloff data. As such, in-situ stress test data and

EPA 816-R-04-003 Appendix AHydraulic Fracturing White Paper
Evaluation of Impacts to Underground Sources June 2004of Drinking Water by Hydraulic Fracturing ofCoalbed Methane Reservoirs App. A-10
data from mini-fracture tests in coal seams arevery difficult to measure and interpret.
The design engineer needs data from well tests todesign the optimum fracture treatment. It iscommon for an operator to spend a lot of moneyand time running injection tests to determinevalues of in-situ stress, formation permeability,and leak-off coefficient. Fracture treatmenttheory is well grounded in science andengineering and, in most cases, data are collectedfrom logs, cores and well tests to assure thatdesigns are as accurate as possible.
3. Fracture Propagation Models
The first fracture treatments were pumped just tosee if a fracture could be created and if sandcould be pumped into the fracture. In 1955,Howard and Fast15 published the firstmathematical model that an engineer could use todesign a fracture treatment. The Howard and Fastmodel assumed the fracture width was constanteverywhere, allowing the engineer to computefracture area based upon fracture fluid leakoffcharacteristics of the formation and the fracturingfluid.
2D Fracture Propagation Models
The Howard and Fast model was a two-dimensional (2D) model. In the following years,other 2D models were published.16-19 Whenusing a 2D model, the engineer fixes one of thedimensions (normally the fracture height), thencalculates the width and length of the fracture.With experience and accurate data sets, 2Dmodels can be used with confidence because thedesign engineer can accurately estimate thecreated fracture height beforehand.
Figs. 7 and 8 illustrate two of the most common2D models used in fracture treatment design. ThePKN geometry (Fig. 7) is normally used when thefracture length is much greater than the fractureheight, while the KGD geometry (Fig. 8) is used
if fracture height and length are similar 20. Eitherof these two models can be used successfully todesign hydraulic fractures. The key is to usemodels to make decisions. The design engineermust always compare actual results with thepredictions from model calculations. By“calibrating” the 2D model with field results, the2D models can be used to make design changesand improve the success of stimulationtreatments.
h = H
L
Ww
Fig. 7 – PKN geometry.
L
h
Area of LargestFlow Resistance
Approximately EllipticalShape of Fracture
Vx
WwRw
x = F - LL
Fig. 8 – KGD geometry.

EPA 816-R-04-003 Appendix AHydraulic Fracturing White Paper
Evaluation of Impacts to Underground Sources June 2004of Drinking Water by Hydraulic Fracturing ofCoalbed Methane Reservoirs App. A-11
If the correct value of fracture height is used in a2D model, the model will give reasonableestimates of created fracture length and width,provided, of course, that other parameters, suchas in-situ stress, Young’s modulus, formationpermeability and total leakoff coefficient are alsoentered correctly. Engineers had to use 2Dmodels for years due to the lack of computingpower. Today, with high-powered computersavailable to most engineers, Pseudo 3-Dimensional (P3D) models are used by mostfracture design engineers. P3D models are betterthan 2D models for most situations because theP3D model computes the fracture height, widthand length distribution using the data for the payzone and all the rock layers above and below theperforated interval.
3D Fracture Propagation Models
Clifton21 provides a detailed explanation of how3-Dimensional fracture propagation theory isused to derive equations for programming 3Dmodels, as well as P3D models. Figs. 9 and 10illustrate typical results from a P3D model. P3Dmodels give more realistic estimates of fracturegeometry and dimensions, which can lead tobetter designs and better wells. P3D models areused to compute the shape of the hydraulicfracture as well as the dimensions.
h
hi
Layer 1
2
3
4
5
6 UpperHeight
LowerHeight
S1
S2
S3
S4
S5
S6
h
hi
Layer 1
2
3
4
5
6 UpperHeight
LowerHeight
S1
S2
S3
S4
S5
S6
Fig. 9 – Width from a P3D model.
Fracture Half-Length
Frac
ture
Hei
ght
-300
-200
-100
0
100
0 250 500 750 1000 1250 1500
300200
1000
650
3001200
450
1200
1050
900
700
StressContrast
(psi)
Gross Interval
Fracture Half-Length
Frac
ture
Hei
ght
-300
-200
-100
0
100
0 250 500 750 1000 1250 1500
300200
1000
650
3001200
450
1200
1050
900
700
StressContrast
(psi)
Gross Interval
Fig. 10 – Width and height from P3D model.
4. Fracturing Fluids and Additives
To create the fracture, a fluid is pumped into thewellbore at high rate to increase the pressure inthe wellbore at the perforations to a value greaterthan the breakdown pressure of the formation.The breakdown pressure is generally believed tobe the sum of the in-situ stress and the tensilestrength of the rock. Once the formation isbroken down, and the fracture is created, then thefracture can be propagated at a pressure called thefracture propagation pressure. The fracturepropagation pressure is equal to the sum of the in-situ stress, plus the net pressure drop, plus thenear wellbore pressure drop. The net pressuredrop is equal to the pressure drop down thefracture due to viscous fluid flow in the fracture.The near wellbore pressure drop can be acombination of the pressure drop of the viscousfluid flowing through the perforations and/or thepressure drop due to tortuosity between thewellbore and the propagating fracture. Thus, thefracturing fluid properties are very important inthe creation and propagation of the fracture.
Properties of a Fracturing Fluid
The ideal fracturing fluid should be compatiblewith the formation rock, compatible with theformation fluid, generate enough pressure dropdown the fracture to create a wide fracture, be

EPA 816-R-04-003 Appendix AHydraulic Fracturing White Paper
Evaluation of Impacts to Underground Sources June 2004of Drinking Water by Hydraulic Fracturing ofCoalbed Methane Reservoirs App. A-12
able to transport the propping agent in thefracture, break back to a low viscosity fluid forclean up after the treatment, and be cost effective.The family of fracture fluids available consist ofwater base fluids, oil base fluids, acid base fluidsand foam fluids. Table 2 lists the types offracturing fluids that are available and the generaluse of each type of fluid. For most reservoirs,water base fluids with appropriate additives willbe the best fluid. In some cases, foam generatedusing N2 or CO2 can be used to successfullystimulate shallow, low-pressure zones. Whenwater is used as the base fluid, the water shouldbe tested for quality. Table 4 presents generallyaccepted levels of water quality for use inhydraulic fracturing.
Table 4 - Acceptable Levels for Mix Water
pH 6-8
Iron < 10 ppm
Oxidizing Agents None
Reducing Agents None
Carbonate* < 300 ppm
Bicarbonate* < 300 ppm
Bacteria None
Cleanliness Reasonable
*Higher Carbonate/Bicarbonate Content WillRequire Further Pilot Testing on Gel Break,and Crosslinking
The viscosity of the fracture fluid is important.The fluid should be viscous enough (normally50–1000 cp) to create a wide fracture (normally0.2–1.0 in) and transport the propping agent intothe fracture (normally 10s to 100s of feet). Thedensity of the fluid is also important. Waterbased fluids have densities near 8.4 ppg. Oil basefluids, although never used to fracture treat coalseam reservoirs, will have densities that are 70-80% of the water based fluids. Foam fluids canhave densities that are 50% or less those of waterbased fluids. The density affects the surface
injection pressure and the ability of the fluid toflow back after the treatment. In low pressurereservoirs, low density fluids, like foam, can beused to assist in the fluid clean up.
A fundamental equation used in all fracturemodels is that the fracture volume is equal to thetotal volume of fluid injected minus the volumeof fluid that leaks off into the reservoir. The fluidefficiency is the percentage of fluid that is still inthe fracture at any point in time, when comparedto the total volume injected at the same point intime. The concept of fluid loss was used byHoward and Fast to determine fracture area 15. Iftoo much fluid leaks off, the fluid has a lowefficiency (say 10-20%) and the created fracturevolume will be only a fraction of the total volumeinjected. However, if the fluid efficiency is toohigh (say 80-90%), the fracture will not closerapidly after the treatment. Ideally, a fluidefficiency between 40-60% will provide anoptimum balance between creating the fractureand having the fracture close down after thetreatment.
In most low permeability reservoirs, fracture fluidloss and efficiency is controlled by the formationpermeability. In high permeability formations, afluid-loss additive must be added to the fracturefluid to reduce leak-off and improve fluidefficiency. In highly cleated coal seams, the leak-off can be extremely high, with efficiencies downin the 10-20% range. To fracture treat thesehighly cleated coal seams, the treatment mustoften be pumped at high injection rates usingfluid loss additives. In general, the objective ofmost fracture treatments in coal seams is to createa short, wide fracture to connect the coal cleatsystem to the well bore vs. creating longhydraulic fractures that penetrate deeply into thecoal seam. Therefore, water with very fewadditives, pumped at medium to high injectionrates is commonly used to stimulate coal seamreservoirs.

EPA 816-R-04-003 Appendix AHydraulic Fracturing White Paper
Evaluation of Impacts to Underground Sources June 2004of Drinking Water by Hydraulic Fracturing ofCoalbed Methane Reservoirs App. A-13
Fracture Fluid Additives
Typical additives for a fracture fluid have beendescribed in detail by Ely 22. Typical additivesfor a water based fluid are briefly describedbelow.
• Polymers – used to viscosify the fluid• Crosslinkers – used to change the viscous
fluid to a pseudo-plastic fluid• Biocides – used to kill bacteria in the mix
water• Buffers – used to control the pH of the
fracture fluid• Surfactants – used to lower the surface
tension• Fluid loss additives – used to minimize fluid
leak-off into the formation• Stabilizers – used to keep the fluid viscous at
high temperature• Breakers – used to break the polymers and
crosslink sites at low temperature
Additional information on additives is presentedin Table 5.
Table 5 – Summary of Chemical Additives
Type ofAdditive
FunctionPerformed
Typical Products
Biocide Kills bacteria Gluteridehydecarbonate
Breaker Reduces fluidviscosity
Acid, oxidizer,enzyme breaker
Buffer Controls the pH Sodium bicarb.,fumaric acid
Clay stabilizer Prevents clayswelling
KCl, NH CL, KClsubstitutes
Diverting agent Diverts flow of fluidBall sealers, rocksalt, flake boric-acid
Fluid lossadditive
Improves fluidefficiently
Diesel, particulates,fine sand
Friction reducer Reduces thefriction Anionic copolymer
Iron Controller Keeps iron insolution Acetic & citric acid
Surfactant Lowers surfacetension
Fluorocarbon,Nonionic
Gel stabilizer Reduces thermaldegradation
MEOH, sodiumthiosulphate
The owner of the oil or gas well normally doesnot own the equipment or the additives requiredto pump a fracture treatment. The operator willhire a service company to pump the fracturetreatment. Each service company has their ownresearch department for developing fracture fluidsand additives. Each service company obtainstheir additives from various suppliers. As such,there is no set of rules one can use to select theproper additives for a fracture fluid, without firstconsulting with the service company that will mixand pump the fluid into the well. Many times,pilot tests of the fracture fluids must be conductedto be certain all the additives will work properlyat the temperature in the reservoir and for theduration of the treatment.
All operating and service companies areconcerned with protecting the environment andthe USDW. As such, research is being conductedin developing “green additives” to use inhydraulic fracturing, especially in shallowformations like coal seam reservoirs. It costs alot of money to handle additives and dispose offracturing fluids that are either left over after thetreatment or produced back from the well bore.The development of new, green additives will bea new technology that will benefit all parties.
5. Propping Agents and FractureConductivity
Propping agents are required to “prop-open” thefracture once the pumps are shut down and thefracture begins to close. The ideal propping agentwill be strong, resistant to crushing, resistant tocorrosion, have a low density, and readilyavailable at low cost.23 The products that bestmeet these desired traits are silica sand, resin-coated sand, and ceramic proppants.
Types of Propping Agents
Silica sand is obtained from sand miningoperations. There are several sources in the

EPA 816-R-04-003 Appendix AHydraulic Fracturing White Paper
Evaluation of Impacts to Underground Sources June 2004of Drinking Water by Hydraulic Fracturing ofCoalbed Methane Reservoirs App. A-14
United States and a few outside the US. The sandmust be tested to be sure it has the necessarycompressive strength to be used in any specificsituation. Generally, sand is used to prop openfractures in shallow formations. For coal seamreservoirs, sand is usually the best choice for apropping agent and virtually every fracturetreatment in a coal seam reservoir uses sand.Sand is much less expensive per pound than theresin-coated sand or the ceramic proppants.
Resin-coated (epoxy) sand is stronger than sandand is used where more compressive strength isrequired to minimize proppant crushing. Someresins can be used to form a consolidated sandpack in the fracture, which will help to eliminateproppant flow back into the wellbore. Resincoated sand is more expensive than sand.
Ceramic proppants consist of sintered bauxite,intermediate strength proppant (ISP), and lightweight proppant (LWP). The strength of theproppant is proportional to its density. Also, thehigher strength proppants, like sintered bauxite,cost more than ISP and LWP. Ceramic proppantsare used to stimulate deep (>8,000 ft) wells wherelarge values of in-situ stresses will apply largeforces on the propping agent.
Factors Affecting Fracture Conductivity
The fracture conductivity is the product ofpropped fracture width and the permeability ofthe propping agent, as illustrated in Fig. 11. Thepermeability of all the propping agents, sand,resin-coated sand, and the ceramic proppants, willbe 200+ darcies when no stress has been appliedto the propping agent. However, the conductivityof the fracture will be reduced during the life ofthe well because of increasing stress on thefracture, stress corrosion affecting the proppantstrength, proppant crushing, proppant embedmentinto the formation, and damage due to gel residueor fluid loss additives.
• Fracture Conductivity, wkfwkf = fracture width x fracture permeability
• Propped fracture width is primarily a function of proppant concentration
FractureWidth
PermeabilityWellFractureWidth
PermeabilityWell
Fig. 11 – Definition of fracture conductivity.
The effective stress on the propping agent is thedifference between the in-situ stress and theflowing pressure in the fracture, as illustrated inFig. 12. As the well is produced, the effectivestress on the propping agent will normallyincrease because the value of the flowing bottomhole pressure will be decreasing. However, ascan be seen by examining Eq. 1, the in-situ stresswill decrease with time as the reservoir pressuredeclines. This phenomenon of decreasing in-situstress as the reservoir pressure declines wasproven conclusively by Salz.8 In shallow coalseam reservoirs, the effective stress on thepropping agent is always low and does notnormally affect the fracture conductivity.
• The stress on proppant (Peff) increases as the flowing bottomhole pressure decreases
wfeff PσP insitu−=∆
Proppantinsitu
Pwf
• The stress on proppant (Peff) increases as the flowing bottomhole pressure decreases
wfeff PP −=∆
Proppantσ
Pwf
• The stress on proppant (Peff) increases as the flowing bottomhole pressure decreases
wfeff PσP insitu−=∆
Proppantinsitu
Pwf
• The stress on proppant (Peff) increases as the flowing bottomhole pressure decreases
wfeff PP −=∆
Proppantσ
Pwf
Fig. 12 – Effective stress on proppant.
Fig. 13 illustrates the differences is fractureconductivity vs. increasing effective stress on thepropping agent for a variety of commonly used

EPA 816-R-04-003 Appendix AHydraulic Fracturing White Paper
Evaluation of Impacts to Underground Sources June 2004of Drinking Water by Hydraulic Fracturing ofCoalbed Methane Reservoirs App. A-15
propping agents. The data in Fig. 13 clearly showthat for shallow wells, where the effective stressis less than 4000 psi, sand can be used to createhigh conductivity fractures. As the effectivestress increases to larger and larger values, thenthe higher strength, more expensive proppingagents must be used to create a high conductivityfracture.
2,000 4,000 6,000 8,000 10,000
100
1,000
10,000
Frac
ture
Con
duct
ivity
, md
-ft
Effective Stress, psi
LWP
ISP 1
ISP+
Bauxite
RCS
Jordan Sand
RCS(300 F)
2,000 4,000 6,000 8,000 10,000
100
1,000
10,000
Frac
ture
Con
duct
ivity
, md
-ft
Effective Stress, psi
LWP
ISP 1
ISP+
Bauxite
RCS
Jordan Sand
RCS(300 F)
Fig. 13 – Effect of stress on conductivity.
6. Fracture Treatment Design
Data Requirements
In Section 1 of this paper, the data required bythe engineer to design a hydraulic fracturetreatment was discussed. The data were dividedinto two groups: (1) data that must be measuredor estimated and (2) data that can be controlled bythe design engineer. The primary data that can becontrolled by the engineer are the wellcompletion details, treatment volume, padvolume, injection rate, fracture fluid viscosity,fracture fluid density, fluid loss additives,propping agent type, and propping agent volume.
As stated earlier, the most important data are (1)the in-situ stress profile, (2) formationpermeability, (3) fluid loss characteristics, (4)
total fluid volume pumped, (5) propping agenttype and amount, (6) pad volume, (7) fracturefluid viscosity, (8) injection rate, and (9)formation modulus. The two most importantparameters are the in-situ stress profile and thepermeability profile of the zone to be stimulatedand the layers of rock above and below the targetzone.
There is a structured methodology followed bythe engineer to design, optimize, execute,evaluate and re-optimize the fracture treatmentsin any reservoir. The first step is always theconstruction of a complete and accurate data set.Table 1 lists the sources for the data required torun fracture propagation and reservoir models.Notice that the design engineer must be capableof analyzing logs, cores, production data, welltest data, and digging through well files to obtainall the information needed to design and evaluatea well that is hydraulically fracture treated.
Design Procedures
To design the optimum treatment, the engineermust determine the effect of fracture length andfracture conductivity upon the productivity andthe ultimate recovery from the well. As in allengineering problems, sensitivity runs need to bemade to evaluate uncertainties, such as formationpermeability and drainage area. In coal seamreservoirs, uncertainties can also exist in variablessuch as the gas content and the desorption rate.The production data obtained from the reservoirmodel should be used in an economics model todetermine the optimum fracture length andconductivity. Then a fracture treatment must bedesigned using a P3D fracture propagation modelto achieve the desired length and conductivity atminimum cost. The most important concept is todesign a fracture using all data and appropriatemodels that will result in the optimum economicbenefit to the operator of the well.
A P3D hydraulic fracture propagation modelshould be run to determine what needs to be

EPA 816-R-04-003 Appendix AHydraulic Fracturing White Paper
Evaluation of Impacts to Underground Sources June 2004of Drinking Water by Hydraulic Fracturing ofCoalbed Methane Reservoirs App. A-16
mixed and pumped into the well to achieve theoptimum values of propped fracture length andfracture conductivity. The base data set shouldbe used to make a base case run. Then, theengineer determines which variables are the mostuncertain. Many times, the values of in-situstress, modulus, permeability, fluid losscoefficient, for example, are not known withcertainty and have to be estimated. The designengineer acknowledges these uncertainties andmakes sensitivity runs with the P3D model todetermine the effect of these uncertainties on thedesign process. As databases are developed, thenumber and magnitude of the uncertainties willdiminish.In effect, the design engineer should fracture treatthe well many times on his or her computerscreen. Making these sensitivity runs will (1)lead to a better design and (2) educate the designengineer on how certain variables affect theultimate values of both the created and thepropped fracture dimensions. Such designs willbe comprehensive, will consider uncertainties,and will be developed using professionalprocesses.
Fracturing Fluid Selection
A critical decision by the design engineer is theselection of the fracture fluid for the treatment.Economides et al. 24 developed a flow chart thatcan be used to select the category of fracture fluidon the basis of factors such as reservoirtemperature, reservoir pressure, the expectedvalue of fracture half-length, and a determinationif the reservoir is water sensitive. Their fluidselection flow chart for a gas well is presented inFig. 14.
Most productive coal seam reservoirs are lessthan 5000 ft deep. The permeability in highlycleated coal seams decreases with increasingdepth and overburden stress. At depths greaterthan about 5000 ft, in most cases, the coal seamdoes not have enough permeability to beeconomically developed.
Gas Well
Less
No Yes
225ºF More
Less
No Yes
No Yes
More150ºF Less More Less More250ºF300ºF
Linear Fluids
B or T X-LinkedGuar/HPG
k w > 1000 md-ft + x > 300 ft
Low Pressureor Water Sensitive
FoamedFluids
70-75 Qualityor Low pHX-Linked
+25% CO
Low Pressureor Water Sensitive
B, T or Z X-LinkedGuar/HPG
High pHX-Linked
+ 25% N
Low pHX-Linked
+ 25% CO
B, T or Z X-Linked
HPG/CMHPG
2 2 2
Gas Well
LessLess
NoNo YesYes
225ºF225ºF MoreMore
LessLess
NoNo YesYes
NoNo YesYes
MoreMore150ºF150ºF LessLess MoreMore LessLess MoreMore250ºF250ºF300ºF300ºF
Linear FluidsLinear Fluids
B or T X-LinkedGuar/HPG
B or T X-LinkedGuar/HPG
k w > 1000 md-ft + x > 300 ftk w > 1000 md-ft + x > 300 ft
Low Pressureor Water Sensitive
Low Pressureor Water Sensitive
FoamedFluids
70-75 Qualityor Low pHX-Linked
+25% CO
FoamedFluids
70-75 Qualityor Low pHX-Linked
+25% CO
Low Pressureor Water Sensitive
Low Pressureor Water Sensitive
B, T or Z X-LinkedGuar/HPG
B, T or Z X-LinkedGuar/HPG
High pHX-Linked
+ 25% N
High pHX-Linked
+ 25% N
Low pHX-Linked
+ 25% CO
Low pHX-Linked
+ 25% CO
B, T or Z X-Linked
HPG/CMHPG
B, T or Z X-Linked
HPG/CMHPG
2 2 2
Fig. 14 – Selecting a fracture fluid.
Because most productive coal seams are shallow,low temperature reservoirs, then the choice offracturing fluid (according to Fig. 14) will be (1)N2 foam for low pressure reservoirs, (2) linearwater based fluids if all you need is a short, lowconductivity fracture, or (3) cross-linked gel ifyou need a wide or long fracture. Holditch etal.14 discussed the criteria for selecting afracturing fluid in the Gas Research Institute’sCoal Seam Stimulation Manual.
For thick highly cleated coals, a crosslinked fluidshould be used to create wide fractures and placeas much proppant as possible in the fracturesclose to the wellbore. The purpose of thetreatment is to link up the cleats to the wellboreusing the hydraulic fracture and the proppant.The fluid should use the minimum amount of gelpossible and breaker should be used to minimizedamage to the fracture, and to assist in cleanup.
If the fracture is intended to connect up severalthin coal seams that are vertically scattered upand down the wellbore, then coil tubing can beused to selectively stimulate each coal seam. Fig.15 illustrates how coil tubing can be used tostimulated multiple intervals, one at a time.

EPA 816-R-04-003 Appendix AHydraulic Fracturing White Paper
Evaluation of Impacts to Underground Sources June 2004of Drinking Water by Hydraulic Fracturing ofCoalbed Methane Reservoirs App. A-17
g g g• Single or multiple fracturing stimulation using coiled
tubing as a conduit for both the isolation and the treatment.
Bottom Hole Assembly
Fig. 15 – Fracturing using coil tubing.
In low-pressure coal seams, N2 foam can be usedas the fracture fluid. Foamed fracture fluids willcreate wide fractures, can transport the proppingagent, and are easier to clean up than fluids thatdo not contain N2.
Propping Agent Selection
Economides et al. 24 also produced a flow chartfor selecting propping agents. Their chart isincluded as Fig. 16. Because most productivecoal seams are shallow, sand is always used asthe propping agent. In certain cases, whereproppant flow back becomes a problem, thenresin-coated sand is sometimes used. Specialcare must be used to design such treatments,because at low temperature, it may be difficult toget the resin to set and to create the consolidatedsand pack needed to prevent proppant flow back.
Less
Sand
RCS
Less
More
Less More
More
ISP
250ºF
12,000 psi
6,000 psi
HSB
LessLess
SandSand
RCSRCS
LessLess
MoreMore
LessLess MoreMore
MoreMore
ISPISP
250ºF250ºF
12,000 psi12,000 psi
6,000 psi6,000 psi
HSBHSB
Fig. 16 - Proppant selection based on closurepressure.
To determine the optimum fracture conductivity,the design engineer should use the dimensionlessconductivity (Cr) concept published by Cinco-Ley 25.
f
fir wk
LKPC Eq. 2
where w is the fracture width (ft), kf is theproppant permeability (md), k is the formationpermeability (md), and Lf is the fracture half-length. To minimize the pressure drop down thefracture, the value of Cr should be approximatelyequal to ten (10).
For example, in a coal seam, if the formationpermeability is 25 md, and the optimum fracturehalf-length is 50 ft, then the optimum fractureconductivity would be 3,927 md-ft. The engineerneeds to design the treatment to create a fracturewide enough, and pump proppants atconcentrations high enough to achieve the highconductivity required to optimize the treatment.
Some engineers tend to compromise fracturelength and conductivity in an often-unsuccessfulattempt to prevent damage to the formationaround the fracture. Holditch26 showed thatsubstantial damage to the formation around thefracture can be tolerated as long as the optimumfracture length and conductivity are achieved.Ideally, the design engineer can create theoptimum fracture length and conductivity whileminimizing damage to the formation. If theopposite occurs, that is, the formation is notdamaged, but the fracture is not long enough orconductive enough, then the well performancewill be disappointing.
The operator of the well should always evaluatethe risks such as mechanical risks, product pricerisks and geologic risks. Uncertainties in theinput data can be evaluated by making sensitivityruns using both the reservoir models and the

EPA 816-R-04-003 Appendix AHydraulic Fracturing White Paper
Evaluation of Impacts to Underground Sources June 2004of Drinking Water by Hydraulic Fracturing ofCoalbed Methane Reservoirs App. A-18
fracture propagation models. One of the mainrisks in hydraulic fracturing is that the entiretreatment will be pumped and/or paid for (i.e. themoney is spent), but for whatever reason, the welldoes not produce at the desired flow rates norrecovers the expected cumulative recovery.Many times, mechanical problems with the wellor the surface equipment cause the treatment tofail. Other times, the reservoir does not respondas expected.
To evaluate the risk of mechanical or reservoirproblems, the design engineer can use 100% ofthe costs on only a fraction of the revenue in theeconomic analyses. For example, say one (1) inevery five (5) fracture treatments in a certainformation is not successful. Then one can use80% of the expected revenue and 100% of theexpected costs to determine the optimum fracturelength. An illustration of how such an analysescan alter the desired fracture length is presentedin Fig. 17.
NPV
/ IN
V
Optimal
0 150 300 450 600
No Risk
RiskAdjusted
4
8
Half-length,ft
NPV
/ IN
V
Optimal
0 150 300 450 600
No Risk
RiskAdjusted
4
8
Half-length,ftFig. 17 – Economic analysis.
Finally, after the optimum, risk adjusted fracturetreatment has been designed, it is extremelyimportant to be certain the optimum design ispumped correctly into the well. For this to occur,the design engineer and the service company
should work together to provide quality controlbefore, during and after the treatment is pumped.The best engineers tend to spend sufficient timein the office to design the treatment correctly,then go to the field to help supervise the fieldoperations (or provide on-site advice to thesupervisor).
7. Post-Fracture Well Behavior
The original fracture treatments in the 1950’swere designed to increase well productivity.These treatments were normally pumped toremove damage in moderate to high permeabilitywells. McGuire and Sikora27 and Prats28
published equations that were used for manyyears to design fracture treatments that resulted indesired folds of increase in the productivity indexof a well. The productivity index of an oil well is
( )wfe
o
ppqJ−
= Eq. 3
and for a gas well is
( )22wfe
g
pp
zqJ
−
µ= Eq. 4
J is the productivity index in terms of barrels perpsi per day or mcf per psi squared per day. Theviscosity and compressibility are included in theequation for productivity index of a gas well,because they are pressure dependent.
Assuming J is the productivity index for afractured well at steady state flow, and Jo is theproductivity index of the same well under radialflow conditions, Prats28 found that

EPA 816-R-04-003 Appendix AHydraulic Fracturing White Paper
Evaluation of Impacts to Underground Sources June 2004of Drinking Water by Hydraulic Fracturing ofCoalbed Methane Reservoirs App. A-19
=
f
e
w
e
o
Lr
rr
JJ
5.0ln
lnEq. 5
for a well containing an infinite conductivityfracture whose fracture half-length is Lf. Pratsfound that a well with a fracture half-length of100 ft will produce as if the well had been drilledwith a 100 ft diameter drill bit. In other words,the hydraulic fracture, if conductive enough, actsto extend the wellbore and stimulate flow ratefrom the well. If the dimensionless fractureconductivity, Cr (Eq. 2), is equal to 10 or greater,the hydraulic fracture will essentially act as if it isan infinately conductive fracture.
In coal seam reservoirs, the gas diffuses throughthe coal into the cleat system. If the cleat systemis poorly developed and the permeability of thecoal is low (<<1md), then the coal reservoir willprobably not be economic to produce because it isalmost impossible to create long, conductivefractures in thin coal seams. Thus, mostcommercial coal seam reservoirs are highlycleated, moderate permeability (5md<k<100md)reservoirs. As such, short, conductive fracturesare required and large volumes of fluids are notneeded to stimulate highly cleated coal seamreservoirs. The object of a hydraulic fracture in ahighly cleated coal seam is to connect the cleatsystem with the well bore using the hydraulicfracture fluids and proppants.
8.0 Fracture Diagnostics
Fracture diagnostics involves analyzing the databefore, during and after a hydraulic fracturetreatment to determine the shape and dimensionsof both the created and propped fracture.Fracture diagnostic techniques have been dividedinto several groups.29
Group 1 – Direct far field techniques
Direct far field methods are comprised oftiltmeter fracture mapping and microseismicfracture mapping techniques. These techniquesrequire delicate instrumentation that has to beemplaced in boreholes surrounding and near thewell to be fracture treated. When a hydraulicfracture is created, the expansion of the fracturewill cause the earth around the fracture to deform.Tiltmeters can be used to measure thedeformation and to compute the approximatedirection and size of the created fracture. Surfacetiltmeters are placed in shallow holes surroundingthe well to be fracture treated and are best fordetermining fracture orientation and approximatesize. Downhole tiltmeters are placed in verticalwells at depths near the location of the zone to befracture treated. As with surface tiltmeters,downhole tiltmeter data can be analyzed todetermine the orientation and dimensions of thecreated fracture, but are most useful fordetermining fracture height. Tiltmeters have beenused on an experimental basis to map hydraulicfractures in coal seams.11
Microseismic fracture mapping relies on using adownhole receiver array of accelerometers orgeophones to locate microseisms or micro-earthquakes that are triggered by shear slippage innatural fractures surrounding the hydraulicfracture. The principle of microseismic fracturemapping29 is illustrated in Fig. 18. In essence,noise is created in a zone surrounding thehydraulic fracture. Using sensitive arrays ofinstruments, the noise can be monitored,recorded, analyzed and mapped.

EPA 816-R-04-003 Appendix AHydraulic Fracturing White Paper
Evaluation of Impacts to Underground Sources June 2004of Drinking Water by Hydraulic Fracturing ofCoalbed Methane Reservoirs App. A-20
LeakoffRegion
TipRegion
ElasticWavesEmmited
Receiver Detects GroundMotion From Microseism
IncreasedPore Pressure
NaturalFracture
AddedShear
LeakoffRegion
TipRegion
ElasticWavesEmmited
Receiver Detects GroundMotion From Microseism
IncreasedPore Pressure
NaturalFracture
AddedShear
Fig. 18 – Principle of microseismic fracturemapping.
Tiltmeters have been used extensively in the oiland gas industry for more than 10 years, althoughit has only been recent that the technology hasbeen available to look at fractures at depthsgreater than 4,000ft. Current surface tiltmetertechnology can see below 10,000ft.Microseismic monitoring has traditionally beentoo expensive to be used on anything but researchwells, but its cost has dropped dramatically in thepast few years, so although still expensive (on theorder of $50,000 to $100,000), it is being usedmore commonly throughout the industry. Aswith all monitoring and data collectiontechniques, however, the economics of marginalwells makes it difficult to justify any extraexpense. If the technology is used at thebeginning of the development of a field, however,the data and knowledge gained are often used onsubsequent wells, effectively spreading out thecosts.
Group 2 – Direct near-wellbore techniques
Direct near-wellbore techniques are run in thewell that is being fracture treated to locate orimage the portion of fracture that is very near(inches) the wellbore. Direct near-wellboretechniques consist of tracer logs, temperaturelogging, production logging, borehole imagelogging, downhole video logging, and caliper
logging. If a hydraulic fracture intersects thewellbore, these direct near-wellbore techniquescan be of some benefit in locating the hydraulicfracture.
However, these near-wellbore techniques are notunique and can not supply information on the sizeor shape of the fracture once the fracture is 2-3wellbore diameters in distance from the wellbore.In coal seams, where multiple fractures are likelyto exist, the reliability of these direct near-wellbore techniques are even more speculative.As such, very few of these direct near-wellboretechniques are used on a routine basis to look fora hydraulic fracture.
Group 3 – Indirect fracture techniques
The indirect fracture techniques consist ofhydraulic fracture modeling of net pressures,pressure transient test analyses, and productiondata analyses. Because the fracture treatmentdata and the post-fracture production data arenormally available on every well, the indirectfracture diagnostic techniques are the mostwidely used methods to determine the shape anddimensions of both the created and the proppedhydraulic fracture.
The fracture treatment data can be analyzed witha P3D fracture propagation model to determinethe shape and dimensions of the created fracture.The P3D model is used to history match thefracturing data, such as injection rates andinjection pressures. Input data, such as the in-situstress and permeability in key layers of rock canbe varied (within reason) to achieve a historymatch of the field data.
Post-fracture production and pressure data can beanalyzed using a 3D reservoir simulator toestimate the shape and dimensions of the proppedfracture. Values of formation permeability,fracture length and fracture conductivity can bevaried in the reservoir model to achieve a historymatch of the field data.

EPA 816-R-04-003 Appendix AHydraulic Fracturing White Paper
Evaluation of Impacts to Underground Sources June 2004of Drinking Water by Hydraulic Fracturing ofCoalbed Methane Reservoirs App. A-21
The main limitation of these indirect techniques isthat the solutions are not very unique and requireas much fixed data as possible. For example, ifthe engineer has determined the formationpermeability from a well test or production testprior to the fracture treatment, so that the value offormation permeability is known and can be fixedin the models, the solution concerning values offracture length become more unique. Most of theinformation in the literature concerning post-fracture analyses of hydraulic fractures has beenderived from these indirect fracture diagnostictechniques.
Limitations of fracture diagnostic techniques
Warpinski discussed many of these same fracturediagnostic techniques.30 Table 6, fromWarpinski’s paper, lists certain diagnostictechniques and their limitations. In general,fracture diagnostics is expensive and only used inresearch wells. Fracture diagnostic techniques dowork and can provide important data whenentering a new area or a new formation.However, in coal seam wells, where costs mustbe minimized to maintain profitability, fracturediagnostic techniques are rarely used and aregenerally cost prohibitive.
Table 6 – Limitations of Fracture DiagnosticTechniques
Parameter Technique Limitation
FractureHeight
Tracer logs Shallow depth ofinvestigation; shows heightonly near the wellbore
FractureHeight
Temperaturelogs
Difficult to interpret; shallowdepth of investigation;shows height only nearwellbore
FractureHeight
Stress profiling Does not measure fracturedirectly; must be calibratedwith in-situ stress tests
FractureHeight
P3D models Does not measure fracturedirectly; estimates varydepending on which modelis used
FractureHeight
Microseismic Optimally requires nearbyoffset well; difficult tointerpret; expensive
FractureHeight
Tiltmeters Difficult to interpret;expensive and difficult toconduct in the field
FractureLength
P3D models Length inferred, notmeasured; estimates varygreatly depending on whichmodel is used
FractureLength
Well testing Large uncertaintiesdepending uponassumptions and lack ofprefracture welltest data
FractureLength
Microseismic Optimally requires nearbyoffset well; difficult tointerpret; expensive
FractureLength
Tiltmeters Difficult to interpret;expensive and difficult toconduct in the field
FractureAzimuth
Core techniques Expensive to cut core andrun tests; multiple tests mustbe run to assure accuracy
FractureAzimuth
Log techniques Requires open hole logs tobe run; does not work ifnatural fractures are notpresent
FractureAzimuth
Microseismic Analysis intensive;expensive for determinationof azimuth
FractureAzimuth
Tiltmeters Useful only to a depth of5000 ft; requires access tolarge area; expensive

EPA 816-R-04-003 Appendix AHydraulic Fracturing White Paper
Evaluation of Impacts to Underground Sources June 2004of Drinking Water by Hydraulic Fracturing ofCoalbed Methane Reservoirs App. A-22
9.0 Nomenclature
CMHPG = Carboxymethylhydroxypropyl-guar
HEC = HydroxyelthycelluloseHPG = HydroxypropylguarISIP = Instantaneous shut-in pressureISP = Intermediate strength proppantk = Formation permeability, mdKCL = Potassium chlorideKGD = Kristonovich, Geertsma, DaneshyLf = Fracture half-length, ftLWP = Light weight proppantMEOH = MethanolMRO = Memory readout gaugeNH4CL = Ammonium chloridePKN = Perkins, Kern, NordgrenRSC = Resin coated sandSRO = Surface Readout gaugewkf = Fracture conductivity, md-ftα = Biot’s constantν = Poissons’ ratioσext = Tectonic stressσmin = Minimum horizontal stress (in-situ
stress)σob = Overburden stressσp = Reservoir fluid pressure or pore
pressureσ1 = Vertical (overburden) stressσ2 = Minimum horizontal stressσ3 = Maximum horizontal stress
10. References
1. Gidley et al.: Recent Advances in HydraulicFracturing, SPE Monograph 12, Richardson,Texas, (1989), 1
2. Holditch, S.A. et al.: “The Optimization of WellSpacing and Fracture Length in Low PermeabilityGas Reservoirs”, paper SPE 7496 presented at the1978 SPE Annual Technical Conference andExhibition, Houston, Oct. 1-4.
3. Veatch, R.W., Jr.: “Overview of CurrentHydraulic Fracture Design and TreatmentTechnology – Part I”, JPT (April 1983) 677-87.
4. Britt, L.K.: “Optimized Oilwell Fracturing ofModerate-Permeability Reservoirs”, paper SPE14371 presented at the 1985 SPE AnnualTechnical Conference and Exhibition, Las Vegas,Sept. 22-25.
5. Gidley et al.: Recent Advances in HydraulicFracturing, SPE Monograph 12, Richardson,Texas, (1989), 57
6. Hubbart, M.K. and Willis,D.G.: “Mechanics ofHydraulic Fracturing”, Trans., AIME (1957) 210,153.
7. Whitehead, W. S., Hunt, E. R., and Holditch, S.A.: "The Effects of Lithology and ReservoirPressure on the In-Situ Stresses in the Waskom(Travis Peak) Field," SPE 16403 presented at the1987 Low Permeability Reservoir Symposium inDenver, CO, May 18-19.
8. Salz, L.B.: “Relationship Between FracturePropagation Pressure and Pore Pressure”, paperSPE 6870 presented at the 1977 SPE AnnualTechnical Conference and Exhibition, Denver,Oct. 7-12.
9. Veatch, R. W. Jr. and Moschchovidis, Z. A.: “AnOverview of Recent Advances in HydraulicFracturing Technology”, paper SPE 14085presented at the 1986 International Meeting onPetroleum Engineering, Beijing, March 17-20,
10. Gidley et al.: Recent Advances in HydraulicFracturing, SPE Monograph 12, Richardson,Texas, (1989), 62-63
11. Nielsen, P. E. and Hanson, M. E.: “Analysis andImplications of Three Fracture Treatments inCoals at the USX Rock Creek Site NearBirmingham, Alabama”, paper presented at the1987 Coalbed Methane Symposium, Tuscaloosa,AL (Nov. 16-19, 1987).
12. Gidley et al.: Recent Advances in HydraulicFracturing, SPE Monograph 12, Richardson,Texas, (1989), 341
13. Gidley et al.: Recent Advances in HydraulicFracturing, SPE Monograph 12, Richardson,Texas, (1989), 58
14. Holditch, S. A., Ely, J. W., and Carter, R. H.:"Development of a Coal Seam Fracture DesignManual," paper 8976 presented at the 1989

EPA 816-R-04-003 Appendix AHydraulic Fracturing White Paper
Evaluation of Impacts to Underground Sources June 2004of Drinking Water by Hydraulic Fracturing ofCoalbed Methane Reservoirs App. A-23
Coalbed Methane Symposium in Tuscaloosa, AL,April 17-20.
15. Howard, G. C. and Fast, C. R.: “Optimum FluidCharacteristics for Fracture Extension”, Drillingand Production Practice, New York, API, (1957)24, 261-270 (Appendix by E.D. Carter).
16. Perkins, T.K. and Kern, L.R.: “Widths ofHydraulic Fractures,” JPT, (September 1961) 13,No. 9, 937-949.
17. Geertsma, J. and de Klerk, F.: “A Rapid Methodof Predicting Width and Extent of HydraulicallyInduced Fractures”, JPT, (December 1969) 21,1571-1581.
18. Nordgren, R.P.: “Propagation of a VerticalHydraulic Fracture”, SPE Journal, (August 1972)12, No. 8, 306-314.
19. Daneshy, A. A.: “On the Design of VerticalHydraulic Fractures”, JPT (January 1973) 83-93;Trans., AIME, 255.
20. Geertsma, J. and Haafkens, R.: “A Comparison ofthe Theories to Predict Width and Extent ofVertical, Hydraulically Induced Fractures”,Trans., AIME (March 1979) 101, 8.
21. Gidley et al.: Recent Advances in HydraulicFracturing, SPE Monograph 12, Richardson,Texas, (1989), 95
22. Gidley et al.: Recent Advances in HydraulicFracturing, SPE Monograph 12, Richardson,Texas, (1989), 131
23. Holditch, S. A.: “Criteria of Propping AgentSelection”, prepared for the Norton Company(1979a).
24. Economides, M.J. and Nolte, K.G.: ReservoirStimulation, Third Edition, John Wiley & Sons,LTD, West Sussex, England, 2000.
25. Cinco-Ley, H., Samaniego-V., F. and Dominquez,N.: “Transient Pressure Behavior for a Well witha Finite-Conductivity Vertical Fracture”, SPEJournal (August 1978) 18, 253-264.
26. Holditch, S. A.: "Factors Affecting WaterBlocking and Gas Flow From HydraulicallyFractured Gas Wells," Journal of PetroleumTechnology, (Dec. 1979) pp. 1515-1524.
27. McGuire, W.J. and Sikora, V.T.: “The Effect ofVertical Fractures on Well Productivity”, JPT(October 1960) 12, 72-74; Trans. AIME (1960)219, 401-403.
28. Prats, M.: “Effect of Vertical Fractures onReservoir Behavior-Incompressible Fluid Case”,SPE Journal (June 1961) 1, No. 1, 105-118;Trans. AIME (1961) 222.
29. Cipolla, C. L. and Wright, C. A.: “State-of-the-Artin Hydraulic Fracture Diagnostics”, SPE paper64434 presented at the SPE Asia Pacific Oil andGas Conference held in Brisbane, Australia (Oct.16-18, 2000).
30. Warpinski, Norman R.: “Hydraulic FractureDiagnostics”, Journal of Petroleum Technology,(Oct. 1996) pp. 907-910.

EPA 816-R-04-003 Appendix BQA Plan
Evaluation of Impacts to Underground Sources June 2004of Drinking Water by Hydraulic Fracturing ofCoalbed Methane Reservoirs App. B-1
Appendix B
Quality Assurance Plan:Evaluation of Impacts to Underground Sources of Drinking Water by
Hydraulic Fracturing of Coalbed Methane Reservoirs
The U.S. Environmental Protection Agency (EPA), bases environmental protectionefforts on the best available scientific information and sound science. The credibility ofthe resulting policy decision depends, to a large extent, on the strength of the scientificevidence on which it is based. Sound science can be described as organizedinvestigations and observations conducted by qualified personnel using documentedmethods and leading to verifiable results and conclusions (SETAC, 1999).
This Quality Assurance Plan for data collection and evaluation describes the proceduresthe Agency used for a systematic and well-documented, graded approach to realizing thegoal for the “Evaluation of Impacts to Underground Sources of Drinking Water byHydraulic Fracturing of Coalbed Methane Reservoirs.” The goal of Phase I of EPA’shydraulic fracturing study was to assess the potential for contamination of USDWs due tothe injection of hydraulic fracturing fluids into CBM wells and to determine based onthese findings, whether further study is warranted. This Quality Assurance Plan(developed following the guidelines of EPA publication 240/B-01/003) guides theproduction of a set of data and scientific findings that are sound, with conclusionssupported by the data.
1.0 Project Management
This section of the Quality Assurance Plan addresses the basic area of projectmanagement, including the project history and objectives, and roles and responsibilitiesof the participants.
1.1 Project and Task Organization
Overall project management was provided by the EPA’s Office of Water, Groundwaterand Drinking Water (OGWDW), Groundwater Protection Division. Data was gatheredby an EPA OGWDW contractor.
The contractor compiled the gathered data into a draft summary report, reviewed the draftreport, and submitted the draft report to EPA and other federal agencies for review. Afterthe contractor addressed comments from EPA and other federal agencies, EPA submittedthe draft report to a Peer Review Panel for their comments (see Table B-1 for a list of the

EPA 816-R-04-003 Appendix BQA Plan
Evaluation of Impacts to Underground Sources June 2004of Drinking Water by Hydraulic Fracturing ofCoalbed Methane Reservoirs App. B-2
members of the Peer Review Panel). Following receipt of comments from the PeerReview Panel, EPA and its contractors responded to those comments. The availability ofthe report for stakeholder review and comment was announced in the Federal Register onAugust 28, 2002.
Table B-1: Peer Review Panel
Name Affiliation Education Experience
Morris Bell Engineer, ColoradoOil and ConservationCommission
EngineeringDegree, Universityof Oklahoma
Closely involved with coalbed methanedevelopment in the San Juan and RatonBasins. Has investigated water wellcomplaints and directed projects to testwater wells. Worked for Amoco as aproduction engineer, drilling andcompleting tight gas wells. Also workedas a consultant, specializing in thecompletion and evaluation of coalbedmethane wells.
Peter E.Clark
Associate Professor,Dept. of ChemicalEngineering andMaterial Science,University ofAlabama
Ph.D., University ofOklahoma StateUniversity
Specializes in complex fluid flows andhydraulic fracturing. Has taught severalcourses in the Chemical Engineering,Mineral Engineering, EngineeringMechanics, and Civil EngineeringDepartments. These courses includedfluid mechanics, petroleum rock andfluids, well completion, drilling, andnatural gas engineering.
David Hill Manager,EngineeringResources, GasTechnology Institute(GTI)
MBA, NorthwesternUniversity; BS,Marietta College,PetroleumEngineering
Expertise includes unconventionalreservoirs (e.g., coalbed methane, gasshales, tight sands); hydraulic fracturing;and reservoir evaluation in technical,managerial, and marketing aspects oftechnology development, deployment,and commercialization. Has authoredand co-authored over 40 articles aboutoil- and gas-related research anddevelopment, and field-based operations.

EPA 816-R-04-003 Appendix BQA Plan
Evaluation of Impacts to Underground Sources June 2004of Drinking Water by Hydraulic Fracturing ofCoalbed Methane Reservoirs App. B-3
Table B-1: Peer Review Panel
Name Affiliation Education Experience
BuddyMcDaniel
Technical Advisor forProductionEnhancementTechnology,Halliburton
B.S., ChemicalEngineering,University ofOklahoma
Specializes in applications for highlydeviated and horizontal wellbores andunderstanding of reservoir response tofracturing applications. Conductedresearch related to laboratorymeasurement of fracture conductivity ofproppants under simulated reservoirconditions. Was actively involved indesign and application of hydraulicfracturing treatments in soft chalks,deviated and horizontal wellbores, gasstorage wells, geothermal wells, andconventional hydrocarbon reservoirs.
Jon Olson Asst. Professor,Dept. of Petroleumand GeosystemsEngineering,University of Texasat Austin
Ph.D., StanfordUniversity, AppliedEarth Sciences
Worked in the areas of fracturemechanics and coal geology and haspublished several papers on thesesubjects. Was employed by MobilExploration for several years as researchengineer in the areas of rock mechanics,structural geology, and well performance.
Ian Palmer Senior PetroleumEngineer, BP Amoco
Ph.D., University ofAdelaide inAustralia
Has worked extensively in coalbedmethane extraction, including fracturedesign and prediction, rock mechanismsof coal, and openhole cavity completions.Also developed hydraulic fracturingmodels.
NormWarpinski
DistinguishedMember of TechnicalStaff, SandiaLaboratories
Ph.D., University ofIllinois, MechanicalEngineering
Authority on hydraulic fracturing,geomechanics, poroelasticity, in situstresses, and production mechanisms.Has expertise ranging from theoreticalmodeling and laboratory testing to fieldand in situ mineback experiments.Serves as project manager and leadscientist for a program to develophydraulic fracture diagnostic technologyfor use in industry fracturing applications.Has published extensively on subject ofhydraulic fracturing.
1.2 Problem Definition and Background
Hydraulic fracturing is a half century-old technology used in oil and natural gasproduction. The hydraulic fracturing process uses very high hydraulic pressures toinitiate a fracture. A hydraulically induced fracture acts as a conduit in the rock or coal

EPA 816-R-04-003 Appendix BQA Plan
Evaluation of Impacts to Underground Sources June 2004of Drinking Water by Hydraulic Fracturing ofCoalbed Methane Reservoirs App. B-4
formation that allows the oil or coalbed methane to travel more freely from the rock pores(where the oil or methane is trapped) to the production well that can bring it to thesurface.
After a well is drilled into a reservoir rock that contains oil, natural gas, and water, everyeffort is made to maximize the production of oil and gas. One way to improve ormaximize the flow of fluids to the well is to connect many pre-existing fractures and flowpathways in the reservoir rock with a larger fracture. This larger, man-made fracturestarts at the well and extends out into the reservoir rock for as much as several hundredfeet. To create or enlarge fractures, a thick fluid, typically water-based, is pumped intothe coal seam at a gradually increasing rate and pressure. Eventually the coal seam isunable to accommodate the fracturing fluid as quickly as it is injected. When this occurs,the pressure is high enough that the coal fractures along existing weaknesses within thecoal. Along with the fracturing fluids, sand (or some other propping agent or “proppant”)is pumped into the fracture so that the fracture remains “propped” open even after thehigh fracturing pressures have been released. The resulting proppant-containing fractureserves as a conduit through which fracturing fluids and groundwater can more easily bepumped from the coal seam.
To initiate coalbed methane production, groundwater and some of the injected fracturingfluids are pumped out (or “produced” in the industry terminology) from the fracturesystem in the coal seam. As pumping continues, the pressure eventually decreasesenough so that methane desorbs from the coal, flows toward, and is extracted through theproduction well.
EPA is conducting a study to assess the potential for contamination of undergroundsources of drinking water (USDWs) due hydraulic fracturing fluid injection into coalbedmethane wells. The study focuses on hydraulic fracturing used specifically for enhancingcoalbed methane production. EPA, through its contractors and subcontractors, gatheredinformation on the hydraulic fracturing process and requested comment from the publicon contamination allegedly due to hydraulic fracturing practices. In this Phase I effort,EPA did not incorporate new, scientific fact finding, but used existing sources ofinformation, and consolidated pertinent data in a summary report to serve as the basis forthe study. EPA decided if additional research was required based on the findings fromthis effort.
1.3 Project and Task Description
The purpose of this project is to assist EPA in assessing the potential for contamination ofUSDWs from the injection of hydraulic fracturing fluids into coalbed methane wells, andto determine based on these findings if further study is warranted. EPA will use theinformation from this study in any regulatory or policy decisions regarding hydraulicfracturing. The first step in investigating the potential for hydraulic fracturing to affectthe quality of USDWs was to define mechanisms by which contamination could occur.

EPA 816-R-04-003 Appendix BQA Plan
Evaluation of Impacts to Underground Sources June 2004of Drinking Water by Hydraulic Fracturing ofCoalbed Methane Reservoirs App. B-5
EPA defined two hypothetical mechanisms by which hydraulic fracturing of coalbedmethane wells could potentially impact USDWs:
1. Direct injection of fracturing fluids into a USDW in which the coal is located,or injection of fracturing fluids into a coal seam that is already in hydrauliccommunication with a USDW (e.g., through a natural fracture system).
2. Creation of a hydraulic connection between the coalbed formation and anadjacent USDW.
The objective of the project is to consider these two mechanisms, based on existingliterature and data, when evaluating whether hydraulic fracturing fluid injection intocoalbed methane wells could contaminate USDWs.
Information was collected regarding the geology and hydrogeology of the coalbedmethane production regions, the processes used to hydraulically fracture coalbed methaneproduction wells, and the fluids used in the fracturing process. EPA also evaluated watersupply incidents possibly related to hydraulic fracturing of coalbed methane productionwells. EPA relied on currently available literature and data as the primary source ofinformation for project efforts.
1.4 Quality Objectives and Criteria
To ensure that findings are valid, the following quality assurance questions will beaddressed for all sources of data:
• What was the purpose of the study?
• Whose data are they?
• What is their source?
• Are the data reliable?
• Is the interpretation biased?
This Quality Assurance Plan establishes a set of guidelines and general approaches toassess available data and information in a clear, consistent, and explicit manner. Datacollection and review according to this process will make conclusions more transparent,and thus more readily understood and communicable to stakeholders.
The objectives of the systematic expert review of data and information are transparency,avoidance of bias, validity, replicability, and comprehensiveness. Following a data andinformation review protocol can ensure a common understanding of the task and

EPA 816-R-04-003 Appendix BQA Plan
Evaluation of Impacts to Underground Sources June 2004of Drinking Water by Hydraulic Fracturing ofCoalbed Methane Reservoirs App. B-6
adherence to a systematic approach. The components of this Quality Assurance Plan areas follows:
• Specification of the hypotheses to be addressed;
• Justification of the expertise represented in the expert investigators team;
• Specification of the methods to be used for identification of relevant studies,assessment of evidence of the individual studies, and interpretation of theentire body of available evidence (WHO, 2000);
• Review process; and
• Communication of findings.
Revisions to the Quality Assurance Plan may be necessary as new aspects of the taskemerge during the study development process.
1.5 Special Training and Certification
To provide authoritative assessments of data and information, it is important to rely onexpert investigators to evaluate the evidence, draw conclusions on the existence of actualand/or potential hazard, and estimate the magnitude of the associated risk. The team ofexpert investigators, that evaluated the evidence associated with this study, possesses thefollowing qualifications:
• Formal training in basic scientific principles applicable to the project;
• Basic knowledge of the subject or the body of technical informationpertaining to it;
• Experience in scientific review of technical data and information;
• Ability to use descriptive and analytical tools appropriately;
• Ability to design studies to test hypotheses;
• Ability to communicate results accurately to decision-makers andstakeholders; and
• Experience coordinating multiple tasks and disciplines to ensure timely andaccurate delivery of study components.

EPA 816-R-04-003 Appendix BQA Plan
Evaluation of Impacts to Underground Sources June 2004of Drinking Water by Hydraulic Fracturing ofCoalbed Methane Reservoirs App. B-7
The above-listed qualifications ensure that the project team was able to fulfill theobjectives of this project.
1.6 Documents and Records
Documents produced for the project and submitted to EPA included the draft and finalsummary reports (hard copy and digital format). Information and records included in thedata report package following completion of the project included:
• Maps (hard copies);
• Scientific literature (hard copies);
• Books (hard copies);
• Database search results (hard copies);
• Logbooks (hard copies); and
• Site visit notes and photographs (hard copies).
All the above-listed materials are maintained by the EPA OGWDW.
2.0 Data Generation and Acquisition
Processes and methods used to collect the data and information must be clear, explicit,and based on valid practice. It is important to adhere to a rigorous and thoroughapproach to the processes of data collection and data logging.
In Phase I, EPA did not incorporate new, scientific fact finding, but instead used existingsources of information, and consolidated pertinent data in a summary report to serve asthe basis for the study. EPA decided if additional research is required based on thefindings from this effort. As such, this Quality Assurance Plan does not cover areas ofsampling process design, sampling methods, sample handling and custody, analyticalmethods, quality control, instrument/equipment testing, inspection, and maintenance,instrument/equipment calibration and frequency, and inspection/acceptance of suppliesand consumables.
2.1 Non-Direct Measurements
All information summaries and conclusions developed during the course of this projectwere based on non-direct measurements. Available literature and data were used as the

EPA 816-R-04-003 Appendix BQA Plan
Evaluation of Impacts to Underground Sources June 2004of Drinking Water by Hydraulic Fracturing ofCoalbed Methane Reservoirs App. B-8
primary source of information for the summary report. An extensive literature searchwas conducted using the Engineering Index and GeoRef on-line reference databases.Searches will be guided by subject topics and key words within the following areas:
• Hydrogeology of the coalbed methane basins;
• Hydraulic fracturing practices;
• Fracture behavior;
• Hydraulic fracturing fluids and additives; and
• Information regarding water quality incidents.
All search results were printed, catalogued, and surveyed for pertinent journal articles,books and conference proceedings that may contain information meeting the specific dataneeds of the summary report. Most pertinent articles were acquired from the Universityof Texas Library in Austin, Texas, as this library’s holdings include an extensivecollection of oil and gas-related publications. References from the articles wereresearched and documents relevant to the study were acquired. All papers collected forthe study were archived by topic for future reference.
To verify facts extracted from the literature, state regulatory agencies, geological surveys,gas companies, service companies and other relevant organizations were contacted bytelephone. Dated telephone logs were used to document all communications. Personalconversations with the employees of the various organizations yielded additionalinformation in the form of literature, figures and maps. These were collected andreferenced in conjunction with literature identified in the literature searches.
Internet-based searches were used to locate additional information. Relevant web siteswere located using various search engines such as GoogleTM, Yahoo®, and Alta Vista®.More specialized search engines, such as those provided on state geological survey websites, also were searched. All relevant web sites were logged and referencedappropriately. Efforts were made to acquire the most recent literature. EPA offered statedrinking water agencies and the public an opportunity to provide information to EPA onany impacts to groundwater believed to be associated with hydraulic fracturing by arequest for public comment. Submissions were reviewed by EPA staff for informationpertinent to this report. In addition, a request to provide information and commentsregarding incidents of public and private well impacts that could potentially be associatedwith hydraulic fracturing was published in the July 30, 2001 Federal Register (FederalRegister: July 30, 2001; Volume 66; Number 146; Page 39395-39397).
Details on specific methods used to collect information for each of the major reportchapters is included in Chapter 2 of this report.

EPA 816-R-04-003 Appendix BQA Plan
Evaluation of Impacts to Underground Sources June 2004of Drinking Water by Hydraulic Fracturing ofCoalbed Methane Reservoirs App. B-9
2.2 Data Management
Gathered information and data was managed to facilitate finding any one piece ofgathered data. To achieve this goal, the following data management procedures wereused:
• All telephone interviews were recorded in labeled log books;
• All scientific literature, published maps, existing water quality data,conference proceedings, and trade journal articles were filed by coal basin;
• Material safety data sheets and product literature were filed separately;
• Trip folders (to contain notes and photographs) were generated for each sitevisit;
• Computer database searches were filed separately; and
• Internet websites were referenced in the summary report.
Most data was stored in hard copy format. Wherever possible, data was stored digitallyon compact disc.
3.0 Assessment and Oversight
The quality assurance review process provides a means to examine if the results andconclusions are verifiable. The review process results in a determination of whether theconclusions are directly supported by the data or evidence gathered and can beindependently validated by others. This quality assurance review process is hierarchicaland includes four review levels:
• Weighted emphasis on data based on source;
• Cross referencing of data sources when possible;
• EPA and other federal agencies review; and
• Review by a Peer Review Panel.
EPA’s review was accomplished by the Work Assignment Manager in conjunction withother EPA headquarter offices and with other EPA Underground Injection Controlregional offices involved with coalbed methane or hydraulic fracturing. Other federalagencies asked to review work products produced by this project, included the UnitedStates Geological Survey and the Department of Energy.

EPA 816-R-04-003 Appendix BQA Plan
Evaluation of Impacts to Underground Sources June 2004of Drinking Water by Hydraulic Fracturing ofCoalbed Methane Reservoirs App. B-10
EPA assembled a peer review panel consisting of experts in hydraulic fracturing orassociated subjects. The panelists provided comments to EPA regarding the sources ofdata used in the study, the data themselves, and the conclusions drawn from those data.
Comments were requested to assist the investigators in making the study as sound aspossible and to ensure that the study met EPA standards for objectivity, evidence, andresponsiveness to the study charge. Reviewer comments and objections were preservedand made a part of the record for the study. Issue papers were written containing detailedexplanations of responses to comments and objections. Reasons for proceeding or notproceeding with the study were clearly explained.
4.0 Data Validation and Usability
This section describes activities that occurred after the initial collection of data. Theseactivities determined whether or not the gathered data were useful and helpful to theproject.
4.1 Data Review, Verification, and Validation
Subsequent to the data logging process, those reports potentially providing usefulinformation underwent a selection process to evaluate quality of the information andusefulness to the study. Systematic evaluation of the validity of individual studies, data,and information included assessment of the following:
• Source of the data and information;
• Qualitative review of the literature;
• Qualitative review of data and information collected;
• Scientific strength of the data and information;
• Geographical, geological, geochemical, spatial, and temporal relevance;
• Relevance to determining baseline conditions;
• Validity of extrapolation to the scope of the study;
• Characteristics of associations, plausibility, alternative explanations;
• Consistency and specificity of the results;
• Scientific uncertainties, limitations, and confounding variables; and

EPA 816-R-04-003 Appendix BQA Plan
Evaluation of Impacts to Underground Sources June 2004of Drinking Water by Hydraulic Fracturing ofCoalbed Methane Reservoirs App. B-11
• Other evaluation parameters, as appropriate.
A scale or rating of the data and information with respect to a level of proof required tosupport conclusions is specifically not proposed as part of this quality assurance process.Establishing a specific level of scientific evidence required to justify a subsequentconclusion would generate significant controversy. Instead, expert judgment was used toevaluate and weigh available data and information.
A variety of technical methods and tools were utilized to sort through the pertinentinformation and decipher the meaning of the data. These data analysis methods mayinclude:
• Quantitative review of selected data and information collected;
• Tabulating valid data and information;
• Constructing geologic cross sections;
• Evaluating current and historical site operations;
• Review of consistencies between studies;
• Review of sources of discrepancies between studies and information; and
• Other methods/tools as appropriate.
All assumptions were explicitly documented, the basis for the use of any modelsexplained, lack of evidence noted, and scientific uncertainties described as precisely aspossible.
4.2 Reconciliation with User Requirements
This sub-section describes how the gathered and validated data and information wereused to meet the requirements of this project and EPA.
EPA 816-R-04-003 Appendix BQA Plan
Evaluation of Impacts to Underground Sources June 2004of Drinking Water by Hydraulic Fracturing ofCoalbed Methane Reservoirs App. B-12
4.2.1 Drawing Conclusions
Drawing conclusions from evaluated, analyzed, and summarized data and informationinvolve judgment as to whether observations are consistent with the studyhypotheses/objectives, or, whether some alternative is suggested. The expertinvestigators drew upon all evaluated and appropriately summarized data andinformation; however, no checklist or formula was applied to arrive at conclusions.Instead, critical scientific reasoning and judgment was used to draw conclusions. Theprocess of scientific reasoning and judgment was made explicit by describing anddocumenting how investigators:
• Assessed completeness of data and information;
• Accounted for lack of evidence and limitations, and impacts on theconclusions;
• Assessed and accounted for bias in original data and/or information;
• Used applicable guidelines and rationales;
• Used any ranges of estimates to arrive at conclusions, where appropriate and;
• Incorporated assumptions into assessments and accounted for the implicationsof those assumptions in their conclusions.
Conclusions were drawn within the boundaries of the data and the scope of the study.Lack or absence of evidence was addressed. The relative strength or weakness ofavailable information to support conclusions, limitations on where a conclusion mayapply, and alternative interpretations of data, was recognized. Any qualification on theuse of the data and factors that contribute to uncertainty was conveyed.
Much of the information obtained from public response to the Federal Register Notice orfrom other sources cannot be confirmed through review of peer-reviewed publications orother data sources. However, the information was reviewed and contrasted to evaluatethe extent of complaints received and any trends in the complaints within and betweenindividual coalbed methane production basins.
4.2.2 Communication of Findings
This Quality Assurance Plan is reflected in the communication of scientific findings in aclear, accurate, and complete manner to interested parties. Investigators communicated:
• The body of technical information that was considered;

EPA 816-R-04-003 Appendix BQA Plan
Evaluation of Impacts to Underground Sources June 2004of Drinking Water by Hydraulic Fracturing ofCoalbed Methane Reservoirs App. B-13
• The manner for evaluating, and drawing conclusions from, collected data andinformation; and
• Conclusions that address the hypotheses/objectives, supported by the resultsof data evaluation and analysis.
The use of presentation tools such as charts, diagrams, and computer-generated displayswas based on sufficient, valid, and defensible data.

EPA 816-R-04-003 Appendix BQA Plan
Evaluation of Impacts to Underground Sources June 2004of Drinking Water by Hydraulic Fracturing ofCoalbed Methane Reservoirs App. B-14
REFERENCES
Breslin, K. 2000. Airing on the Side of Caution or Pulling Standards Out of Thin Air?Environmental Health Perspectives, 108(4), April 2000.http://ehpnet1.niehs.nih.gov/members/2000/108-4/spheres.html.
Clay, R. 1999. Still Moving Toward Environmental Justice, Environmental HealthPerspectives, 107(6), June 1999.http://ehpnet1.niehs.nih.gov/members/1999/107-6/spheres.html.
Manuel, J. 2000. Truth in Numbers, Environmental Health Perspectives, 108(8), August2000. http://ehpnet1.niehs.nih.gov/docs/2000/108-8/niehsnews.html.
Society of Environmental Toxicology and Chemistry (SETAC). 1999. Sound ScienceTechnical Issue Paper. Society of Environmental Toxicology and Chemistry(SETAC), SETAC Press, Pensacola, FL, 1999. http://www.setac.org/sstip.html.
US Environmental Protection Agency. 2000. Strengthening Science at the U.S.Environmental Protection Agency: Research-Management and Peer-ReviewPractices. National Academy Press, Washington, D.C. (2000).http://www.nap.edu/catalog/9882.html.
US Environmental Protection Agency. 2001. EPA Requirements for Quality AssuranceProject Plans (QA/R-5). EPA/240/B-01/003, March 2001.http://www.epa.gov/quality/Quality Assurance Planps.html.
World Health Organization (WHO). 2000. Evaluation and Use of EpidemiologicalEvidence for Environmental Health Risk Assessment: WHO GuidelineDocument. Environmental Health Perspectives, 108(10), October 2000. WorldHealth Organization European Centre for Environment and Health, BilthovenDivision, A. van Leeuwenhoeklaan 9, Bilthoven, The Netherlands.http://ehpnet1.niehs.nih.gov/members/2000/108p997-1002kryzanowski/abstracts.html.

EPA 816-R-04-003 Attachment 1The San Juan Basin
Evaluation of Impacts to Underground Sources June 2004of Drinking Water by Hydraulic Fracturing ofCoalbed Methane Reservoirs A1-1
Attachment 1The San Juan Basin
The San Juan Basin covers an area of about 7,500 square miles across the Colorado/NewMexico line in the Four Corners region (Figure A1-1). It measures roughly 100 mileslong in the north-south direction and 90 miles wide. The Continental Divide trendsnorth-south along the east side of the basin, and land surface elevations within the basinrange from 5,100 feet on the western side to over 8,000 feet in the northern part.
The San Juan Basin is the most productive coalbed methane basin in North America.Coalbed methane production in the San Juan Basin totaled over 800 billion cubic feet(Bcf) in 1996 (Stevens et al., 1996). This number rose to 925 Bcf in 2000 (GTI, 2002).The coals of the Upper Cretaceous Fruitland Formation range from 20 to over 40 feetthick. Total net thickness of all coalbeds ranges from 20 to over 80 feet throughout theSan Juan Basin. Coalbed methane production occurs primarily in coals of the FruitlandFormation, but some coalbed methane is trapped within the underlying and adjacentPictured Cliffs Sandstone, and many wells are completed in both zones. Coalbedmethane wells in the San Juan Basin range from 550 to 4,000 feet in depth, and about2,550 wells were operating in 2001 (CO Oil and Gas Conservation Commission and NMOil Conservation Division, 2001).
1.1 Basin Geology
The San Juan Basin is a typical asymmetrical, Rocky Mountain basin, with a gentlydipping southern flank and a steeply dipping northern flank (Figure A1-2) (Stone et al.,1983). The Fruitland Formation is the primary coal-bearing unit of the San Juan Basinand the target of most coalbed methane production. Geologic cross sections showinggeneralized relationships between the Fruitland Formation and adjacent are shown in A1-4 through A1-6. The Fruitland coals are thick, with individual beds up to 80 feet thick.The Fruitland Formation is composed of interbedded sandstone, siltstone, shale, and coal.The stratigraphy of the Fruitland Formation is predictable throughout the basin, asfollows:
• The thickest coalbeds are always found in the lower third of the formation;
• Pictured Cliffs Sandstone occurs immediately below the formation;
• Sandstone content is greater in the lower half; and
• Siltstone and shale predominate in the upper half (Choate et al., 1993).

EPA 816-R-04-003 Attachment 1The San Juan Basin
Evaluation of Impacts to Underground Sources June 2004of Drinking Water by Hydraulic Fracturing ofCoalbed Methane Reservoirs A1-2
The San Juan Basin may be subdivided into three unique regions, based on similargeologic, hydrologic, and production characteristics (Figure A1-7). These regions aredenoted as Area 1, Area 2, and Area 3, and are described in more detail below (Kaiserand Ayers, 1994).
Area 1 consists of the northwestern quarter of the basin. Area 1 is characterized by thethickest (>20 feet) and highest-rank coal deposits in the San Juan Basin (Ayers et al.,1994). Most wells produce more than 1,000 cubic feet per day and several wells producemore than 15,000 cubic feet per day. Almost 90 percent of total methane productionfrom the Fruitland Formation comes from three fields in a region of Area 1 known as the“Fairway” (Young et al., 1991; Ayers et al., 1994). Area 1 is an area of active rechargeand in most places is hydrostatically over-pressured (greater than 0.50 pounds per squareinch per foot). Wells in Area 1 usually produce moderate to large volumes of water,some of which meet the quality criteria of less than 10,000 milligrams per liter (mg/L)total dissolved solids (TDS) for an underground source of drinking water (USDW)(Kaiser et al., 1994).
Area 2 (the west-central region of the San Juan Basin) is hydrostatically under-pressured(0.30 to 0.50 pounds per square inch per foot) and is an area of regional groundwaterdischarge. Coalbeds are usually 7 to 15 feet thick, and occur primarily in northwest-trending belts that extend to the southwestern margin of the basin. Methane productionfrom wells can be more than 100 thousand cubic feet per day, and a few wells produce200 to 500 thousand cubic feet per day. Methane gas is produced water-free in this areaas a consequence of the hydrostratigraphy and trapping mechanisms (Kaiser and Ayers,1994). Additionally, Kaiser and Ayers (1994) suggest that water may be less mobile inthe hydrophilic and low permeability coals. The Fruitland Formation in this area where itis under-pressured generally shows the presence of saline-type waters (Kaiser et al.,1994) that most likely have TDS concentrations greater than 10,000 mg/L, which doesnot meet the criteria for a USDW.
Area 3, the eastern region of the San Juan Basin, is hydrostatically under-pressured, andfeatures low permeability and low hydraulic gradient, which suggests slow watermovement within most of the aquifer. Only a few coalbed gas wells are located in thispart of the basin, and they produce up to 8,000 cubic feet of methane per day, with littleor no water content (Kaiser and Ayers, 1994). Produced waters from the FruitlandFormation in most of Area 3 have a high-salinity, resembling seawater (Kaiser andAyers, 1994) in which TDS are too high to meet the water quality criteria of a USDW.However, along the southern margin of Area 3, TDS concentrations are less than 10,000mg/L (Kaiser et al., 1994).

EPA 816-R-04-003 Attachment 1The San Juan Basin
Evaluation of Impacts to Underground Sources June 2004of Drinking Water by Hydraulic Fracturing ofCoalbed Methane Reservoirs A1-3
1.2 Basin Hydrology and USDW Identification
Tertiary sandstones and Quaternary alluvial deposits are present at the surface over muchof the basin interior. These serve as the primary drinking water aquifers in the basin(Figure A1-2), and produced 55 million gallons per day in 1985 (Wilson, 1986).Cretaceous sandstones are an important source of water on the basin’s periphery (Choateet al., 1993). The Paleocene Ojo Alamo Sandstone yields as much as 30 gallons perminute of potable water (Hale et al., 1965) and is mentioned as one of the primarydrinking water aquifers of the region (Brown and Stone, 1979). Cleats and largerfractures in the Fruitland coals and the presence of interbedded permeable sandstonesmake the Fruitland Formation an aquifer and source of drinking water along the northernmargin of the basin where TDS in the groundwater are less than 10,000. In most of Area1, both the Fruitland Formation and the underlying upper Pictured Cliffs Sandstone act asa single hydrologic unit (Kaiser et al., 1994). The Fruitland and upper Pictured CliffsSandstone aquifer is underlain and confined by the low-permeability main Pictured CliffsFormation and is overlain and partly confined by the Kirtland shale, which is up to 1,000feet thick in the central basin. Overlying the Kirtland Formation is the Ojo AlamoSandstone, (Figures A1-4, A1-5 and A1-6) which has been suggested as a possible sourceof groundwater for the municipality of Bloomfield (Stone et al., 1983). At Bloomfield,the coal and gas bearing Fruitland is separated from the Ojo Alamo aquifer by theKirtland shale.
In the northern part of the basin, the Fruitland Formation and the underlying upperPictured Cliffs Sandstone can be considered a single hydrogeologic unit on a regionalscale because they exhibit the same hydraulic head and water quality characteristics andare the source of both the water and gas in the Pictured Cliffs sand tongues (Ayers andZellers, 1994; Ayers et al., 1994). At the local scale, however, the two formations appearto exhibit poor hydraulic continuity, as evidenced by areas of over-pressuring (greaterthan 0.5 pounds per square inch per foot), abrupt changes in potentiometric surface(Figure A1-8), and upward flow (Kaiser et al., 1994). Discrete flow within individualunits here is likely due to pinch out of thick, laterally extensive coal seams and truncationand offset of the beds by faults.
In general, groundwater is recharged along the Fruitland outcrops at the elevated, west,northern, and northwestern margins of the basin, and lateral flow converges primarilyfrom the northeast and southeast toward upward discharge to the San Juan River valley(Kaiser et al., 1994). In the north, the Fruitland and upper Pictured Cliffs Sandstoneaquifer system is confined by the overlying Kirtland shale, but it is poorly confined bythe Kirtland in the central and southern portions of the basin. Water from the Fruitlanddischarges in the western part of the basin and migrates upward across the Kirtland shaleinto the Animas and San Juan Rivers (Stone et al., 1983). Generalized groundwatermovement in the Fruitland system is shown in cross-section and plan view in Figures A1-9 and A1-10 (Kaiser and Swartz, 1988). The results of groundwater flow modeling forthe entire basin (Kaiser et al., 1994) are shown in Figure A1-11.

EPA 816-R-04-003 Attachment 1The San Juan Basin
Evaluation of Impacts to Underground Sources June 2004of Drinking Water by Hydraulic Fracturing ofCoalbed Methane Reservoirs A1-4
In most of Area 1, the Fruitland system produces water containing less than 10,000 mg/LTDS, the water quality criteria for a USDW. Groundwater is usually freshest at theoutcrop in recharge areas. The water dissolves salts and mixes with formation water as itflows, and the groundwater becomes increasingly saline as distance from the rechargesource increases. The presence of low-salinity water at given locations in the San JuanBasin usually marks close proximity to the recharge source or the most permeable flowpaths and implies a dynamic, active aquifer system (Kaiser et al., 1994). Figure A1-12shows the chloride concentration of groundwater in the Fruitland Formation, andindicates that water nearest the northern recharge areas has a low dissolved solids andchloride content. Kaiser et al. (1994) reported that wells in the northern part of Area 1produced water containing from 180 to 3,015 mg/L TDS. This was found to be the caseover large portions of Area 1, especially within freshwater plumes resulting from areas ofhigh permeability or fracture trends (Kaiser and Swartz, 1990; Oldaker, 1991).
Kaiser et al. (1994) conducted a water-quality sampling program in the San Juan Basin.Analyses taken from Fruitland coal wells in Area 1 show that the majority of wells (16 of27 wells) produce water containing less than 10,000 mg/L TDS, (Figures A1-13a and A1-13b), although some nearby wells thought to be in less permeable zones produce waterwith higher TDS concentrations up to 23,000 mg/L (Kaiser et al., 1994). The boundarybetween waters with more and less than 10,000 TDS has not been published. Anothergroup of wells throughout the same area was also sampled, but these wells werecompleted (constructed) in the adjacent and underlying Pictured Cliffs Sandstone bodies,which are in hydrologic communication with the Fruitland system (Kaiser et al., 1994).
Although from the above information it would seem that the Fruitland would beclassified a USDW, the following additional information about disposal of brackish waterproduced along with the methane would seem to indicate that most of the water in theFruitland would not meet the TDS criteria for USDW. Coalbed methane wells in the SanJuan Basin produced from 0 to over 10,500 gallons of water per day, which contain fromless than 300 mg/L TDS to over 25,000 mg/L (Kaiser et al., 1994; Kaiser and Ayers,1994). Brackish water of various TDS concentrations and brine are produced in the over-pressured Area 1 of the basin while virtually no water is produced from coalbed methanewells in Areas 2 and 3 of the basin. Cox (1993) reported “Water disposal in the San Juanbasin is a significant, long-term issue.” In 1992, coalbed methane wells produced over 5million gallons of water per day, and production was expected to increase to over 7.5million gallons per day by 1995 (Cox, 1993). Produced water is disposed of by means ofevaporation ponds, or, more commonly, by Class II injection into deeper zones such asthe Entrada and Bluff sandstones, Morrison Formation, and Mesa Verde sandstone(Kaiser and Ayers, 1994). The authors estimated that injection wells cost up to $2million each and Cox (1993) reported that 51 of them had been constructed in the basinby 1993.
Area 2 is primarily an area of groundwater discharge. The Fruitland coals and PicturedCliffs Sandstone in Area 2 are in hydraulic communication and behave as a singleaquifer. The aquifer is under-pressured (less than 0.50 pounds per square inch per foot),transmits groundwater from the northeast and southeast, and eventually discharges to the

EPA 816-R-04-003 Attachment 1The San Juan Basin
Evaluation of Impacts to Underground Sources June 2004of Drinking Water by Hydraulic Fracturing ofCoalbed Methane Reservoirs A1-5
Animas and San Juan rivers. The TDS of most samples from Area 2 ranges from 10,000to 16,000 mg/L (Kaiser et al., 1994).
The Fruitland system in most of Area 3 contains slow-moving water with salinityapproximately equal to that of seawater, greater than 25,000 mg/L TDS, (Kaiser andAyers, 1994). In Area 3, the Fruitland and Pictured Cliffs are separate, confined aquifers.In the southeastern one-third of Area 3, the Kirtland shale is absent because of Tertiary-age erosion, and the Fruitland and Ojo Alamo Sandstone could be in hydrauliccommunication with one another (Figure A1-6). In this area Tertiary rocks, including theOjo Alamo, are mapped by the United States Geological Survey (Figure A1-14) as anaquifer having water with TDSs ranging from 500 to 1,000 mg/L (Lyford, 1979).
At the basin’s southern margin in Area 3, downward flow occurs from the Ojo Alamothrough the Kirtland shale to the poorly confined Fruitland aquifer through which it thenmoves southward to outcrops at a lower elevation and northward to the San Juan RiverValley (Kaiser et al., 1994) (Figure A1-11). Twenty-four of 26 water samples from theFruitland/Pictured Cliffs aquifer system in the south margin of the basin reported byKaiser and Swartz (1994) had less than 9,000 mg/L TDS (Figure A1-13e & A1-13f).Groundwater in the Fruitland Formation at the southern margin of the basin has less than10,000 mg/L TDS because most recharge there comes from above the Kirtland formation,rather than from southward throughput from the Fruitland Formation.
1.3 Coalbed Methane Production Activity
Coalbed methane production occurs primarily in coals of the Fruitland Formation.However, some methane is absorbed in the underlying and adjacent Pictured CliffsSandstone, therefore many wells are completed in both zones. About 2,550 wells wereoperating in the San Juan Basin in 2001 (CO Oil and Gas Conservation Commission andNM Oil Conservation Division, 2001). All wells are vertical wells that range from about500 to 4,000 feet in depth, and were drilled using water or water-based muds. Almostevery well has been fracture-stimulated, using either conventional hydraulic fracturing inperforated casing or cavitation cycling in open holes (Palmer et al., 1993b). Total gasproduction was 925 Bcf in 2000 (GTI, 2002).
Cavitation cycling is a fracturing method unique to a small area of the north-central SanJuan Basin called the “Sweet Spot,” or Fairway, of Area 1 (Figure A1-15). Almost halfof all San Juan wells are located within the Fairway area and utilize open-holecompletions (no casing across the production interval) and cavitation cycling. Cavitationcycling is used in this area because coals are: 1) very thick (individual coals over 40 feetthick); 2) hydrostatically over-pressured (0.5 to 0.7 pounds per square inch per foot); and3) relatively more permeable than the rest of the basin (and coals in other basins) (Palmeret al., 1993b). This method uses several mechanisms to link the wellbore to the coalfracture system. Cavitation cycling:

EPA 816-R-04-003 Attachment 1The San Juan Basin
Evaluation of Impacts to Underground Sources June 2004of Drinking Water by Hydraulic Fracturing ofCoalbed Methane Reservoirs A1-6
• Creates a physical cavity in the coals of the open-hole section (up to 10 feet indiameter);
• Propagates a self-propping, vertical, tensile fracture that extends up to 200feet away from the wellbore (parallel to the direction of least stress); and
• Creates a zone of shear stress-failure that enhances permeability in a directionperpendicular to the direction of least stress (Palmer et al., 1993a;Khodaverian and McLennan, 1993) (Figure A1-16).
Cavitation is accomplished by applying pressure to the well using compressed air orfoam, and then abruptly releasing the pressure. The over-pressured coal zones provide apressure surge into the wellbore (a “controlled blowout”), and the resulting stress causesdislodgement of coal chips and carries the chips up the well. These cycles of pressureand blowdown are repeated many times over a period of hours or days, and the repeated,alternating stress-shear failure in the coal formation creates effects that extend laterallyfrom the wellbore (Kahil and Masszi, 1984). The resulting vertical fracture is tensile inorigin, that is, it results from a “pulling” force rather than the compressive forces thatcreate conventional hydraulic fractures. Because the fracture is tensile in origin, theheight of the fracture does not usually extend out of the target coal seam (Logan et al.,1989).
Wells outside the Fairway area utilize cased-hole, perforated completions that employconventional hydraulic fracturing (Holditch, 1990). Palmer et al. (1993a) reported thathydraulic fracturing in the San Juan Basin uses between 55,000 to 300,000 gallons ofstimulation and fracturing fluids and between 100,000 to 220,000 pounds of sandproppant. In the San Juan Basin, geologic conditions in conjunction with fracturingtechniques usually produce vertical fractures much longer than they are high, forexample, up to 400 feet radially and less than 150 feet high (e.g., Colorado 32-7 No. 9well, La Plata County, CO; Mavor et al., 1991). The primary reasons for the controlledheight of San Juan coalbed fractures are the thickness and close spacing of coal seams(obviating the need for excessive height), and the presence and petro-physical propertiesof the overlying Kirtland shale (which prevents inadvertent fracture excursion out of theFruitland) (Jeu et al., 1988; Logan et al., 1989; Palmer and Kutas, 1991). Holditch(1993) reports that where the coal seam is not overlain by shale, hydraulic fractures in theSan Juan Basin can grow into overlying beds.
Fassett (1991) found that coalbed methane could migrate into overlying USDWs near thenorthern outcrop, in areas where confining shale layers are absent. Because of thesefactors, hydraulic fracturing in the San Juan Basin may indirectly impact overlyingUSDWs near the Fruitland outcrop at the basin margins, where USDWs are in closerproximity and the Kirtland shale may be eroded. Near the northern and northwesternrecharge zones, groundwater usually contains less than 3,000 mg/L TDS (Kaiser et al.,1994; Cox et al., 1995).

EPA 816-R-04-003 Attachment 1The San Juan Basin
Evaluation of Impacts to Underground Sources June 2004of Drinking Water by Hydraulic Fracturing ofCoalbed Methane Reservoirs A1-7
Fracturing and stimulation fluids utilized in the northern San Juan Basin include (FigureA1-17 and Table A1-1):
• Hydrochloric acid (12% to 28% HCl);
• Plain water;
• Slick water (water mixed with solvent);
• Linear gels (water and a thickener such as guar-gum or a polymer);
• Cross-linked gels with breakers (gels with additives to prevent fluid leak-offfrom the fracture, and “breaker” chemicals to reduce viscosity so that the gelcan be produced back from the well after treatment); and
• Nitrogen and CO2 foam (75 percent gas, 25 percent water or slick water, plusa foaming agent) since about 1992 (Harper et al., 1985; Jeu et al., 1988;Holditch et al., 1989; Palmer et al., 1993a; Choate et al., 1993)
Oilfield service companies supply the stimulation fluid used to fracture the well as part ofthe service. The chemical composition of many fracturing fluids may be proprietary, andEPA was unable to find complete chemical analyses of any fracturing fluids in theliterature. Table A1-1 presents some data from the literature concerning the generalchemical makeup of common San Juan fracturing fluids (Economides and Nolte, 1989;Penny et al., 1991). In addition, most gel fluids utilize a breaker compound (usuallyborate or persulfate compounds or an enzyme, at 2 pounds/1,000 gallons) to allow post-treatment thinning and easier recovery of gels from the fracture (e.g., Jeu et al., 1988;Palmer et al., 1993a; Pashin and Hinkle, 1997).
Many of the compounds listed in Table A1-1 are quite hazardous in their undiluted form.However, these compounds are substantially diluted prior to injection. Coalbed methanedevelopment by fracturing, and stimulation in the San Juan Basin are regulated by theColorado Oil and Gas Conservation Commission and the New Mexico Oil and GasBoard. Based on an analysis of current regulations, neither agency regulates the type oramount of fluids used for fracturing (Colorado State Oil and Gas Board Rules andRegulations 400-3, 2001; New Mexico Energy, Minerals and Natural ResourcesDepartment, Oil Conservation Division Regulations Title 19, Chapter 15, 2001).
About half of the coalbed methane wells in Area 1 are located in the Fairway zone andfeature “cavitation-cycling” completions (Palmer et al., 1993a) (Figure A1-15).Therefore, about half of the wells in Area 1 have probably been stimulated usingconventional fracture treatments. Based on the well density of Area 1 in 1990 (FigureA1-18) compared to the 2001 well population (2,550 wells), it is estimated that between700 and 1,000 coalbed methane wells have been fracture-stimulated in the USDW ofArea 1.
EPA 816-R-04-003 Attachment 1The San Juan Basin
Evaluation of Impacts to Underground Sources June 2004of Drinking Water by Hydraulic Fracturing ofCoalbed Methane Reservoirs A1-8
It has been shown that methane can migrate from gas wells into aquifers along thenorthern margin of the basin, but this condition was remediated with improved gas wellconstruction (Cox et al., 1995). In addition, wells completed in other aquifers in theoutcrop area have been shown to produce water chemically and isotopically similar toFruitland wells, implying communication between the formations (Cox et al., 1995).
1.4 Summary
Coalbed methane development and hydraulic fracturing in some of the northern portionsof the San Juan Basin take place within a USDW. The waters of the Fruitland-upperPicture Cliffs aquifer and producing zone in Area 1 usually contain less than 10,000mg/L TDS. Most waters in the northern half of Area 1 contain less than 3,000 mg/L, andwells near the outcrop produce water that contains less than 500 mg/L.
Each fracture stimulation treatment may inject, on average, approximately 55,000 to300,000 gallons of stimulation and fracturing fluid per treatment. There are no statecontrols on the type, composition, or volume of fracturing fluid employed in each well ortreatment. In contrast to conventional gas formations, the anisotropic nature of fracturepermeability, the volume of treatment fluids employed, and the height and proppantdistribution in coalbed fractures may prevent the effective recovery of fracturing fluidsduring subsequent production.
The potential for fracturing to cause or allow degradation of water in aquifers adjacent tothe producing zones seems relatively remote in the currently active gas producing fields,but the potential for such degradation varies in different parts of the basin. It has beenshown that methane can migrate from gas wells into aquifers along the northern marginof the basin, but this condition was corrected with improved gas well construction. Thereis little potential for fracturing to create communication between the Fruitland-upperPicture Cliffs aquifer and the Ojo Alamo aquifer over much of the basin because theaquifers are separated by the poorly permeable Kirkland shale. However, the Kirklandvaries greatly in thickness and forms a leaky hydrogeologic barrier when it is thinner. Inthe eastern part of the basin, the Kirkland Formation has been eroded and the Ojo Alamolies disconformably and directly upon the Fruitland Formation, potentially allowingfracturing to cause hydraulic communication between the saline waters of the Fruitlandand the fresh waters (500 to 1,000 mg/L) of the Ojo Alamo.

EPA 816-R-04-003 Attachment 1The San Juan Basin
Evaluation of Impacts to Underground Sources June 2004of Drinking Water by Hydraulic Fracturing ofCoalbed Methane Reservoirs A1-9
Table A1-1. Chemical Components of Typical Fracture/Stimulation Fluids Usedfor San Juan Coalbed Methane Wells
Type of Stimulation Fluid Composition pH
Hydrochloric acid 12% to 28% HCl water solution <1-3
“Slick” water miscible or immiscible solvent as NAviscosity reducer (% unknown)
Diesel oil NA NA
Nitrogen and CO2 foam 75 % gas, 25 % water or slick water, NA plus a foaming agent)
Gels1
R-F 3% resorcinol, 3% formaldehyde, 6.50.5% KCl, 0.4% NaHCO3
Pfizer Flocon 4800 0.4% xanthan, 154 ppm Cr3+ 4.0(as CrCl3), 0.5% KCl
Marathon MARCIT 1.4% polyacrylamide (HPAM), 636 ppm 6.0Cr3+ (as acetate), 1% NaCl
DuPont LuDox SM 10% colloidal silica, 0.7% NaCl 8.2
CPAM crosslinked with 0.4% cationic polyacrylamide (CPAM), 7.3Pfizer Floperm 500 1520 ppm glyoxal 2% KCl
Drilling Specialties 0.3% HPAM-AMPS, 100 ppm Cr3+ 5.0HE-100 Crosslinked (as acetate), 2% KCl
Dowell YF-230 Hydroxypropylguar (HPG) x-linked NAwith borate, persulfate with amine
1 Gels are typically mixed at a ratio of 40 lbs. per 1000 gal. water; compositions shown are “asmixed”.

EPA 816-R-04-003 Attachment 1 The San Juan Basin
Evaluation of Impacts to Underground Sources June 2004 of Drinking Water by Hydraulic Fracturing of Coalbed Methane Reservoirs A1-10

EPA 816-R-04-003 Attachment 1The San Juan Basin
Evaluation of Impacts to Underground Sources June 2004of Drinking Water by Hydraulic Fracturing ofCoalbed Methane Reservoirs A1-11

EPA 816-R-04-003 Attachment 1The San Juan Basin
Evaluation of Impacts to Underground Sources June 2004of Drinking Water by Hydraulic Fracturing ofCoalbed Methane Reservoirs A1-12

EPA 816-R-04-003 Attachment 1The San Juan Basin
Evaluation of Impacts to Underground Sources June 2004of Drinking Water by Hydraulic Fracturing ofCoalbed Methane Reservoirs A1-13

EPA 816-R-04-003 Attachment 1The San Juan Basin
Evaluation of Impacts to Underground Sources June 2004of Drinking Water by Hydraulic Fracturing ofCoalbed Methane Reservoirs A1-14

EPA 816-R-04-003 Attachment 1The San Juan Basin
Evaluation of Impacts to Underground Sources June 2004of Drinking Water by Hydraulic Fracturing ofCoalbed Methane Reservoirs A1-15

EPA 816-R-04-003 Attachment 1The San Juan Basin
Evaluation of Impacts to Underground Sources June 2004of Drinking Water by Hydraulic Fracturing ofCoalbed Methane Reservoirs A1-16

EPA 816-R-04-003 Attachment 1The San Juan Basin
Evaluation of Impacts to Underground Sources June 2004of Drinking Water by Hydraulic Fracturing ofCoalbed Methane Reservoirs A1-17

EPA 816-R-04-003 Attachment 1The San Juan Basin
Evaluation of Impacts to Underground Sources June 2004of Drinking Water by Hydraulic Fracturing ofCoalbed Methane Reservoirs A1-18

EPA 816-R-04-003 Attachment 1The San Juan Basin
Evaluation of Impacts to Underground Sources June 2004of Drinking Water by Hydraulic Fracturing ofCoalbed Methane Reservoirs A1-19

EPA 816-R-04-003 Attachment 1The San Juan Basin
Evaluation of Impacts to Underground Sources June 2004of Drinking Water by Hydraulic Fracturing ofCoalbed Methane Reservoirs A1-20

EPA 816-R-04-003 Attachment 1The San Juan Basin
Evaluation of Impacts to Underground Sources June 2004of Drinking Water by Hydraulic Fracturing ofCoalbed Methane Reservoirs A1-21

EPA 816-R-04-003 Attachment 1The San Juan Basin
Evaluation of Impacts to Underground Sources June 2004of Drinking Water by Hydraulic Fracturing ofCoalbed Methane Reservoirs A1-22

EPA 816-R-04-003 Attachment 1The San Juan Basin
Evaluation of Impacts to Underground Sources June 2004of Drinking Water by Hydraulic Fracturing ofCoalbed Methane Reservoirs A1-23

EPA 816-R-04-003 Attachment 1The San Juan Basin
Evaluation of Impacts to Underground Sources June 2004of Drinking Water by Hydraulic Fracturing ofCoalbed Methane Reservoirs A1-24

EPA 816-R-04-003 Attachment 1The San Juan Basin
Evaluation of Impacts to Underground Sources June 2004of Drinking Water by Hydraulic Fracturing ofCoalbed Methane Reservoirs A1-25

EPA 816-R-04-003 Attachment 1The San Juan Basin
Evaluation of Impacts to Underground Sources June 2004of Drinking Water by Hydraulic Fracturing ofCoalbed Methane Reservoirs A1-26

EPA 816-R-04-003 Attachment 1The San Juan Basin
Evaluation of Impacts to Underground Sources June 2004of Drinking Water by Hydraulic Fracturing ofCoalbed Methane Reservoirs A1-27

EPA 816-R-04-003 Attachment 1The San Juan Basin
Evaluation of Impacts to Underground Sources June 2004of Drinking Water by Hydraulic Fracturing ofCoalbed Methane Reservoirs A1-28

EPA 816-R-04-003 Attachment 1The San Juan Basin
Evaluation of Impacts to Underground Sources June 2004of Drinking Water by Hydraulic Fracturing ofCoalbed Methane Reservoirs A1-29

EPA 816-R-04-003 Attachment 1The San Juan Basin
Evaluation of Impacts to Underground Sources June 2004of Drinking Water by Hydraulic Fracturing ofCoalbed Methane Reservoirs A1-30
REFERENCES
AAPG = American Association of Petroleum GeologistsSPE = Society of Petroleum Engineers
Ayers, W.B., Ambrose, W.A., and Yeh, J.S. 1994. Coalbed methane in the FruitlandFormation – depositional and structural controls on occurrence and resources.New Mexico Bureau of Mines and Minerals Bulletin 146: Coalbed methane in theupper Cretaceous Fruitland Formation, San Juan Basin, New Mexico andColorado, pp. 13-40.
Ayers, W.B. and Zellers. 1994. Coalbed methane in the Fruitland Formation, NavajoLake area – geologic controls on occurrence and producibility. New MexicoBureau of Mines and Minerals Bulletin 146: Coalbed methane in the upperCretaceous Fruitland Formation, San Juan Basin, New Mexico and Colorado, pp.63-86.
Brown, D.R. and Stone, W.J. 1979. Hydrogeology of the Aztec quadrangle, San Juancounty, New Mexico. New Mexico Bureau of Mines and Mineral Resources(Sheet 1).
Choate, R., Lent, T., and Rightmire, C.T. 1993. Upper Cretaceous geology, coal, and thepotential for methane recovery from coalbeds in the San Juan Basin – Coloradoand New Mexico. AAPG Studies in Geology, 38:185-222.
Colorado State Oil and Gas Board Rules and Regulations 400-3, 2001.
Colorado Oil and Gas Conservation Commission and New Mexico Oil ConservationDivision. 2001. Personal communication with staff.
Cox, D.O. 1993. Coal-seam water production and disposal, San Juan Basin. QuarterlyReview of Methane from Coal Seams Technology, 11(2): 26-30 (December).
Cox, D.O., Young, G.B.C., and Bell, M.J. 1995. Well testing in coalbed methane (cbm)wells: an environmental remediation case history. Society of PetroleumEngineers Paper No. 30578, Proceedings 1995 SPE Technical Conference(Dallas), pp. 467-500.
Economides, M.J. and Nolte, K.G. 1989. Reservoir Stimulation, Second Edition,Prentice-Hall, New Jersey.
Fassett, J.E. 1991. The mystery of the escaping gas: forensic geology in the northernSan Juan Basin, La Plata County, Colorado. USGS – AAPG AssociationRoundtable, p. 1223.

EPA 816-R-04-003 Attachment 1The San Juan Basin
Evaluation of Impacts to Underground Sources June 2004of Drinking Water by Hydraulic Fracturing ofCoalbed Methane Reservoirs A1-31
Gas Technology Institute (GTI) Web site, 2002. Drilling and Production Statistics forMajor US Coalbed Methane and Gas Shale Reservoirs.http://www.gastechnology.org
Hale, W.E., Reiland, L.J., and Beverage, J.P. 1965. Characteristics of the water supplyin New Mexico. New Mexico State Engineer, Technical Report 31.
Harper, T.R, Hagans, J.T., and Martins, J.P. 1985. Fracturing without proppant. SPE13858, Proceedings SPE Low Permeability Reservoirs Symposium (Denver), p.83.
Holditch, S.A., Ely, J.W., Semmelbeck, M.E., Carter, R.H., Hinkle, J., and Jeffrey, R.G.1989. Enhanced recovery of coalbed methane through hydraulic fracturing. SPEPaper 18250, Proceedings 1988 SPE Annual Technical Conference andExhibition (Production Operations and Engineering), p. 689.
Holditch, S.A. 1990. Completion methods in coal seam reservoirs. SPE 20670,Proceedings 65th SPE Annual Technical Conference (New Orleans), p. 533.
Holditch, S.A. 1993. Completion methods in coal-seam reservoirs. Journal of PetroleumTechnology, 45(3): 270-276 (March).
Jeu, S.J., Logan, T.L., and McBane, R.A. 1988. Exploitation of deeply buried coalbedmethane using different hydraulic fracturing techniques. SPE Paper 18253,Proceedings 63rd Annual Technical Conference (Houston).
Kahil, A. and Masszi, D. 1984. Cavity stress-relief method to stimulate demethanationboreholes. SPE Paper No. 12843, Proceedings 1984 SPE Unconventional GasRecovery Symposium (Pittsburg).
Kaiser, W.R. and Swartz, T.E. 1988. Hydrology of the Fruitland Formation and coalbedmethane producibility, In Geologic evaluation of critical production parametersfor coalbed methane resources, Part 1: San Juan Basin. Annual Report to the GasResearch Institute, GRI-88/0332.1, pp. 61-81.
Kaiser, W.R. and Swartz, T.E. 1990. Hydrodynamics of the Fruitland Formation. InGeologic Evaluation of critical production parameters for coalbed methaneresources, Part 1: San Juan Basin. Annual Report for 1990, Gas ResearchInstitute, GRI-90/0014.1, pp. 99-126.
Kaiser, W.R. and Ayers, W.B. Jr. 1994. Coalbed methane production, FruitlandFormation, San Juan Basin: geologic and hydrologic controls. New MexicoBureau of Mines and Minerals Bulletin 146: Coalbed methane in the upperCretaceous Fruitland Formation, San Juan Basin, New Mexico and Colorado, pp.187-207.

EPA 816-R-04-003 Attachment 1The San Juan Basin
Evaluation of Impacts to Underground Sources June 2004of Drinking Water by Hydraulic Fracturing ofCoalbed Methane Reservoirs A1-32
Kaiser, W.R., Swartz, T.E., and Hawkins, G.J. 1994. Hydrologic framework of theFruitland Formation, San Juan Basin. New Mexico Bureau of Mines and MineralsBulletin 146: Coalbed methane in the upper Cretaceous Fruitland Formation, SanJuan Basin, New Mexico and Colorado, pp. 133-164.
Khodaverian, M. and McLennan. 1993. Cavity completions: a study of mechanisms andapplicability. Proceedings of the 1993 International Coalbed Methane Symposium(Univ. of Alabama/Tuscaloosa), pp. 89-97.
Logan, T,L, Clark, W.F., and McBane, R.A. 1989. Comparing open-hole cavity andcased hole hydraulic fracture completion techniques, San Juan Basin, NewMexico. SPE Paper 19010, Proceedings SPE Low Permeability ReservoirsSymposium (Denver).
Lyford, F.P., 1979. Ground Water in the San Juan Basin, New Mexico and Colorado,USGS Water-Resources Investigations 79-73, 22p.
Mavor, M.J., Dhir, R., McLennan, J.D., and Close, J.C. 1991. Evaluation of thehydraulic fracture stimulation of the Colorado 32-7 No. 9 well, San Juan Basin.Rocky Mountain Association of Geologists Guidebook, “Coalbed methane ofWestern North America”, Fall Conference and Field Trip, pp. 241-249.
New Mexico Bureau of Mines and Minerals. 1993. Atlas of Rocky Mountain GasReservoirs, p. 122.
New Mexico Energy, Minerals and Natural Resources Department, Oil ConservationDivision Regulations Title 19, Chapter 15,http://www.emnrd.state.nm.us/ocd/OCDRules/Oil&Gas/rulebook/rulebook.pdf,2001.
Oldaker, P.R. 1991. Hydrogeology of the Fruitland Formation, San Juan Basin,Colorado and New Mexico. In Coalbed methane of Western North America.Rocky Mountain Association of Geologists, pp. 61-66.
Palmer, I.D. and Kutas, G.M. 1991. Hydraulic fracture height growth in San Juan Basincoalbeds. SPE 21811, Proceedings SPE Low Permeability Reservoirs Symposium(Denver).
Palmer, I.D., Lambert, S.W., and Spitler, J.L. 1993a Coalbed methane well completionsand stimulations. Chapter 14 in AAPG Studies in Geology 38, pp. 303-341.
Palmer, I.D., Mavor, M.J., Spitler, J.L., Seidle, J.P., and Volz, R.F. 1993b. Openholecavity completions in coalbed methane wells in the San Juan Basin. Journal ofPetroleum Technology, 45(11):1072-1080 (November).

EPA 816-R-04-003 Attachment 1The San Juan Basin
Evaluation of Impacts to Underground Sources June 2004of Drinking Water by Hydraulic Fracturing ofCoalbed Methane Reservoirs A1-33
Pashin, J.C. and Hinkle, F. 1997. Coalbed Methane in Alabama. Geological Survey ofAlabama Circular 192, 71pp.
Penny, G.S, Conway, M.W., McBane, R. 1991. Coordinated laboratory studies insupport of hydraulic fracturing of coalbed methane. Proceedings, 1991 SPEAnnual Technical Conference and Exhibition (Sigma Reservoir Engineering), 66,pp. 231-246.
Stevens, S.H., Kuuskraa, J.A., and Schraufnagel, R.A. 1996. Technology spurs growthof U.S. coalbed methane. Oil and Gas Journal, pp. 56-63 (January).
Stone, W.J., Lyford, F.P., Frenzel, P.F., Mizell, N.H. and Padgett, E.T. 1983.Hydrogeology and water resources of San Juan Basin, New Mexico. New MexicoBureau of Mines and Mineral Resources, Hydrologic Report 6, 70 p.
Wilson, B. 1986. Water Use in New Mexico. New Mexico State Engineer TechnicalReport 46, 84 p.
Young, G.B.C., McElhiney, J.E., Paul, G.W., and McBane, R.A. 1991. An analysis ofFruitland coalbed methane production, Cedar Hill field, northern San Juan Basin;SPE Paper No. 22913, Proceedings SPE Annual Technical Conference andExhibition (Dallas).

EPA 816-R-04-003 Attachment 10The Sand Wash Basin
Evaluation of Impacts to Underground Sources June 2004of Drinking Water by Hydraulic Fracturing ofCoalbed Methane Reservoirs A10-1
Attachment 10The Sand Wash Basin
The Sand Wash Basin is in northwestern Colorado and southwestern Wyoming. It is partof the Greater Green River Basin, which includes the Washakie Basin, the Great Divide(Red Desert) Basin, and the Green River Basin (Figure A10-1). These sub-basins areseparated by uplifts caused by deformation of the basement rock. The Cherokee Arch, ananticlinal ridge that runs east to west along the Colorado/Wyoming border, separates theSand Wash Basin from the adjacent Washakie Basin. The Greater Green River Basin, intotal, covers an area of approximately 21,000 square miles. The Sand Wash Basin coversapproximately 5,600 square miles, primarily in Moffat and Routt Counties of Colorado.
Coalbed methane resources in the Sand Wash Basin have been estimated at 101 trillioncubic feet (Tcf). Approximately 90 percent of this resource is within the Williams ForkFormation (Kaiser et al., 1993). Despite this ample resource, economic viability ofrecovery of the gas is limited by the presence of large volumes of water in most coalbeds.Presently, there appears to be no commercial production (GTI, 2002); however,approximately 120 permits for drilling within Moffat County were issued betweenFebruary 2000 and August 2001 (Colorado Oil and Gas Commission, 2001). It is notclear exactly how many of these permits were related to coalbed methane exploration andproduction.
10.1 Basin Geology
The geologic history of the Sand Wash Basin is relatively complex, characterized byperiods of deposition followed by deformation related to tectonic activity. This activityhas impacted depositional patterns, coal occurrence and maturity, and hydrology (Tylerand Tremain, 1994). A very thorough discussion of the geologic history of the SandWash Basin is available in Tyler and Tremain (1994).
The coal-bearing formations in the region include the Iles, Williams Fork, Fort Union,and the Wasatch Formations (Figure A10-2). These formations were deposited, frombottom to top, during the Upper Cretaceous, Paleocene and upper Paleocene periods. Thetotal thickness of the coal seams in these formations can measure up to 150 feet(Quarterly Review, 1993). Basement rock formations in the Sand Wash Basin can be asdeep as 17,000 feet (Tyler and Tremain, 1994). A map of the coal and geologic featuresis presented in Figure A10-3a and a conceptual cross-section is presented in Figure A10-3b.
The Sand Wash Basin was near the western edge of the Western Interior Seaway thatspreads across what is now central North America during the Upper Cretaceous (Figure

EPA 816-R-04-003 Attachment 10The Sand Wash Basin
Evaluation of Impacts to Underground Sources June 2004of Drinking Water by Hydraulic Fracturing ofCoalbed Methane Reservoirs A10-2
A10-4). During the late Cretaceous the seaway retreated to the northeast. Intermontanebasins developed during the Laramide, and coal-bearing fluvial-lacustrine sediments weredeposited (Quarterly Review, 1993). The coal in the Sand Wash Basin was formed frompeat deposited in swamps along a broad coastal plain. Sediments that eroded fromnearby uplift formations covered the peat beds (Tyler and Tremain, 1994). Thealternating deposition of organic material and sands was repeated many times creatinglayers of coal interbedded with layers of sandstone and other sedimentary rocks that filledthe basin.
Cretaceous or Mesaverde Group coal in the Sand Wash Basin ranges in rank from sub-bituminous along the basin margins to high volatile A bituminous coal in the deeper partsof the basin. These ranks are indicative of moderately mature to well-developed maturecoal formed under high pressure and high heat. Within the Mesaverde Group, the mostimportant potential coalbed methane resource in the basin (Kaiser et al., 1993), the coalranks from sub-bituminous along the basin margins to medium volatile bituminous in thebasin center (Kaiser et al., 1993). The methane in these coals formed both biogenically(by bacterial action on organic matter), and thermogenically (under high temperature).The average gas content of 261 coal samples collected during two studies was 147standard cubic feet of methane per ton of coal (Boreck et al., 1977; Tremain and Toomey,1983). Some samples from the Sand Wash Basin have been found to contain as much as540 standard cubic feet of methane feet per ton. Gas content has generally been found toincrease somewhat with depth. At depths of less than 1,000 feet, gas content is typicallyless than 20 standard cubic feet per ton, which has been taken to indicate that gasprobably leaked out of the shallow coalbeds into the atmosphere. Analysis of gassamples has indicated that the gas is typically 90 percent methane, the remainder beingmostly nitrogen and carbon dioxide (Scott, 1994). Carbon dioxide content ranges from 1to more than 25 percent (Scott, 1994).
Of all the coal-bearing formations, the Upper Cretaceous Williams Fork is the mostsignificant unit because it contains the thickest and most extensive coalbeds. TheWilliams Fork Formation is within the Mesaverde Group that also includes the AlmondFormation along the Wyoming state line (Tyler and Tremain, 1994). The AlmondFormation is shown (Figure A10-2) as a separate formation overlying the Williams Fork(Tyler and Tremain, 1994), but is also reported (Kaiser et al., 1993) to be a lateralequivalent of the upper Williams Fork Formation found in the southern Sand WashBasin. For more information relative to this apparent conflict see Kaiser et al. (1993, p.29). The coal-bearing Williams Fork Formation outcrops along the southern and easternmargins of the basin, and may be deeper than 8,000 feet in the deepest part of the basin(Figure A10-3b). The coals are interbedded with sandstones and shale. The thickest totalcoal deposits in the Williams Fork Formation, up to 129 feet, are centered near Craig,CO. This total is made up of several separate coalbeds up to 25 feet thick interbeddedwith sedimentary rock.

EPA 816-R-04-003 Attachment 10The Sand Wash Basin
Evaluation of Impacts to Underground Sources June 2004of Drinking Water by Hydraulic Fracturing ofCoalbed Methane Reservoirs A10-3
Stratigraphically above the Williams Fork Formation, the Paleocene Fort UnionFormation, which includes sandstone, siltstone, shale, and coal, is also a potentiallyproductive zone for coalbed methane production. The Fort Union outcrops at theElkhead Mountains east of the basin and along the southern and western parts of thebasin. The bottom of the Fort Union Formation is about 7,000 feet below the surface.Net coal thickness can be up to 80 feet with as many as nine individual beds. Individualbeds up to 50 feet thick have been identified.
The Wasatch Formation includes beds of shale and sandstone and minor amounts of coal.It can extend as deep as 2,000 feet below the surface. The Wasatch Formation has notbeen targeted for coalbed methane development because of the small quantity of coal.
10.2 Basin Hydrology and USDW Identification
Regional groundwater flow in the Sand Wash Basin is from east to west and to thenorthwest towards the center of the basin. Water enters the aquifers at the exposedoutcrops along the southern and eastern margins of the basin and moves northwestward.Vertical movement of groundwater, including potential artesian conditions, is dependenton local geologic conditions. Kaiser and Scott (1994) summarized their extensiveinvestigation of groundwater movement within the Fort Union and Mesaverde Group.The Mesaverde Group is a highly transmissive aquifer. The coalbeds along withassociated sandstone beds within the group may be the most permeable part of theaquifer. The Williams Fork Formation contains sandstone beds that are reported to beexcellent aquifers (Brownfield, 2002). Lateral flow within the Fort Union Formation isslower, in part, owing to less permeable fluvial sandstones in the unit.
Total dissolved solids (TDS) concentrations of groundwater in the Mesaverde Groupwere investigated by Kaiser and Scott (1994) (Figure A10-5). They found that chlorideconcentrations ranged from 290 milligrams per liter (mg/L) in the eastern area of thebasin near the outcrops where water enters the aquifers, to more than 26,000 mg/L in thecentral part of the basin. Calcium showed a similar pattern of distribution with the lowestconcentrations near the outcrops, increasing toward the basin center. Calciumconcentrations ranged from 10 mg/L to over 2900 mg/L. Based on the chloride andcalcium concentrations presented by Kaiser and Scott (1994), the water in the aquifersnear the recharge areas at the basin margins meets the water quality criteria for anunderground source of drinking water (USDW) of less than 10,000 mg/L, but the water inthe deeper central part of the basin does not (Figure A10-5). The mapped outcrop area(Figure A10-3a) of the Mesaverde Group indicates that the coal seam lies within aUSDW where it is relatively shallow and close to the eastern and southern margins of thebasin.

EPA 816-R-04-003 Attachment 10The Sand Wash Basin
Evaluation of Impacts to Underground Sources June 2004of Drinking Water by Hydraulic Fracturing ofCoalbed Methane Reservoirs A10-4
10.3 Coalbed Methane Production Activity
Coalbed methane resources in the Sand Wash Basin have been estimated at 101 Tcf.Approximately 90 percent of this gas is in the Williams Fork Formation (Kaiser et al.,1993). Approximately 24 Tcf of coalbed methane are located at depths less than 6,000feet below ground surface (Kaiser et al., 1994). Despite this ample resource, economicviability of recovery of the gas is limited by the presence of large volumes of water inmost coalbeds. Exploration in the 1980s and 1990s led to limited commercial use of theresource. Records from the Colorado Oil and Gas Commission indicate thatapproximately 31 million cubic feet of coalbed methane was produced in Moffat Countyduring 1995 (Colorado Oil and Gas Commission, 2001). From 1996 to 1999 (the lastyear that data are available), no further gas was produced in this County (Colorado Oiland Gas Commission, 2001). However, Colorado Oil and Gas Commission recordsindicate that approximately 120 permits for drilling within Moffat County were issuedduring the period from February 2000 through August 2001 (Colorado Oil and GasCommission, 2001). It is not clear exactly how many of these permits were related tocoalbed methane exploration and production, but a handful of the permits were issued togas companies, and the permits are listed as targeting known coalbeds within specificmethane producing formations (Colorado Oil and Gas Commission, 2001).
At Craig Dome in Moffat County, Cockrell Oil Corporation drilled a 16-welldevelopment for exploration in the Williams Fork Formation. According to the ColoradoGeological Survey, Craig Dome is located along the Cedar Mountain fault system(Colorado Geological Survey, 2002). The wells were abandoned a short time laterbecause of excessive water. The Colorado Geological Survey indicated that the faultsystem may act as a conduit for anomalously high water migration from the outcrop. Anaverage total of 40 feet of high-volatile bituminous coal was encountered in beds up to 15feet thick. Gas content was tested at 10 to 350 cubic feet per ton of coal. Wells werecased through the target coalbed, perforated, and hydraulically fractured using water andsand. The wells yielded large volumes of fresh water with TDS levels measuring lessthan 1,000 mg/L, but little gas (Colorado Oil and Gas Commission, 2001). Water wasremoved at an average of 21,756 gallons per day per well during testing. Based onrecords from the Colorado Oil and Gas Commission, Cockrell Oil Corp does not appearto be involved currently with coalbed methane production in this region (Colorado Oiland Gas Commission, 2001).
The Colorado Geological Survey also indicated that faults in Trout Creek Canyonsoutheast of Craig are on trend with (and thus are likely to be related to) the CedarMountain fault system (Colorado Geological Survey, 2002). In addition, KLT Gas Inc.has a pilot program southwest of Craig Dome on the Breeze lease which is on trend withthe Cedar Mountain fault system. If a fracture propagates into and along a fault plane, itmay contaminate a USDW (Colorado Geological Survey, 2002.)

EPA 816-R-04-003 Attachment 10The Sand Wash Basin
Evaluation of Impacts to Underground Sources June 2004of Drinking Water by Hydraulic Fracturing ofCoalbed Methane Reservoirs A10-5
Limited commercial success has been experienced in the basin. As of 1993, only onecommercial operator, Fuelco, was working in the basin. Fuelco was operating 11 wellsalong Cherokee Arch at 40 to 80 acre spacing. Well depths were to 2,500 feet. A total of40 feet of coal was found in the Almond Formation (Mesaverde Group) between 810 to2,360 feet. All wells were cased through the coal, selectively perforated, and stimulatedusing water and sand. Gas production averaged a total of 50,000 cubic feet per day fromfour wells. The highest producing well peaked at 100,000 cubic feet per day (QuarterlyReview, 1993). Total production of gas through 1993 from the Dixon Field, the onlyproducing field in this region, was about 84 million cubic feet (Kaiser et al., 1993). Totalwater production for the four wells was high at 126,000 gallons per day due to the highpermeability of the coal (Quarterly Review, 1993). Water pumped from the wellscontained 1,800 mg/L of TDS and was discharged to the ground with a NationalPollution Discharge Elimination System permit (Quarterly Review, 1993).
The Sand Wash Basin has been used by the University of Texas Bureau of EconomicGeology in the development of its Coalbed Methane Producibility Model (Kaiser et al.,1994). The development of the model was based on a comparison of basins that includedthe Sand Wash Basin and the San Juan Basin of southwestern Colorado and northwesternNew Mexico. The San Juan Basin has proven to be a very productive coalbed methaneresource. The Sand Wash Basin was used as an example of a basin with low potential forproductivity (Figure A10-6) (Kaiser et al., 1994).
Hydraulic fracturing has been used in the Sand Wash Basin to improve the flow of gasinto the wells. Hydraulic fracturing fluids have typically consisted of water with sandused as a proppant. However, very little information was available regarding specifictypes and volumes of fluids and proppants used. No indication of the use of othermaterials was noted in the sources reviewed (Colorado Oil and Gas Commission, 2001).
10.4 Summary
Coalbeds containing methane gas are present within the Sand Wash Basin at accessibledepths. Some investigation and very limited commercial development of this resourcehave occurred, mostly in the late 1980s and early 1990s. There appears to be nocommercial production at present. Development of coalbed methane resources in theSand Wash Basin has been slower than in many other areas due to limited economicviability. The need for extensive dewatering in most wells has been a limiting factor,compounded by relatively low gas recovery.
Between 1996 and 1999, no coalbed methane was produced in Moffat County. Permitsfor new gas wells have been issued indicating that there may be some continued interestin this area (Colorado GIS, 2001).

EPA 816-R-04-003 Attachment 10The Sand Wash Basin
Evaluation of Impacts to Underground Sources June 2004of Drinking Water by Hydraulic Fracturing ofCoalbed Methane Reservoirs A10-6
Groundwater quality in the basin varies greatly. Typically, chloride and calciumconcentrations within the coal-bearing Mesaverde Group are low and potentially withinpotable ranges in the eastern and southern parts of the basin, implying the existence of aUSDW, and therefore the potential for impacts. Concentrations increase as the watermigrates toward the central and western margins of the basin. TDS concentrationssignificantly higher than the 10,000 mg/L USDW water quality standard have beendetected in the western portion of the basin.
Compared to other potentially productive areas of the country, very little information hasbeen published regarding current developments, groundwater location and conditions,drilling techniques, etc. The level of information available seems to be commensuratewith the amount of commercial activity.
The use of fracturing fluids, specifically water and sand proppant, has been reported forthis basin. No record of any other fluid types has been noted. Although variable, thewater quality within the fractured coals indicates the presence of USDWs within thecoalbeds.

EPA 816-R-04-003 Attachment 10The Sand Wash Basin
Evaluation of Impacts to Underground Sources June 2004of Drinking Water by Hydraulic Fracturing ofCoalbed Methane Reservoirs A10-7

EPA 816-R-04-003 Attachment 10The Sand Wash Basin
Evaluation of Impacts to Underground Sources June 2004of Drinking Water by Hydraulic Fracturing ofCoalbed Methane Reservoirs A10-8

EPA 816-R-04-003 Attachment 10The Sand Wash Basin
Evaluation of Impacts to Underground Sources June 2004of Drinking Water by Hydraulic Fracturing ofCoalbed Methane Reservoirs A10-9

EPA 816-R-04-003 Attachment 10The Sand Wash Basin
Evaluation of Impacts to Underground Sources June 2004of Drinking Water by Hydraulic Fracturing ofCoalbed Methane Reservoirs A10-10

EPA 816-R-04-003 Attachment 10The Sand Wash Basin
Evaluation of Impacts to Underground Sources June 2004of Drinking Water by Hydraulic Fracturing ofCoalbed Methane Reservoirs A10-11

EPA 816-R-04-003 Attachment 10The Sand Wash Basin
Evaluation of Impacts to Underground Sources June 2004of Drinking Water by Hydraulic Fracturing ofCoalbed Methane Reservoirs A10-12

EPA 816-R-04-003 Attachment 10The Sand Wash Basin
Evaluation of Impacts to Underground Sources June 2004of Drinking Water by Hydraulic Fracturing ofCoalbed Methane Reservoirs A10-13

EPA 816-R-04-003 Attachment 10The Sand Wash Basin
Evaluation of Impacts to Underground Sources June 2004of Drinking Water by Hydraulic Fracturing ofCoalbed Methane Reservoirs A10-14
REFERENCES
Brownfield, Michael. 2002. USGS, Denver Federal Center, Denver, CO. Personal(written) communication.
Boreck, D. L., Jones, D. C., Murray, D. K., Schultz, J. E., and Suek, D. C. 1977.Colorado coal analyses, 1975 (analyses of 64 samples collected in 1975):Colorado Geological Survey Information series 7, 112 p.
Colorado Geological Survey. 2002. Public Comment OW-2002-0002-0086 to “DraftEvaluation of Impacts to Underground Sources of Drinking Water by HydraulicFracturing of Coalbed Methane Reservoirs.” Federal Register. Vol. 63, No. 185.p. 33992, September 24, 2002.
Colorado Oil and Gas Commission Website-Colorado GIS. 2001. Approved DrillingPermits: http://cogccweb.state.co.us/cogis/DrillingPermitsList.asp.
Gas Technology Institute (GTI) website. 2002. Drilling and Production Statistics forMajor US Coalbed Methane and Gas Shale Reservoirs.http://www.gastechnology.org.
Kaiser, W. R., Scott, A. R., Hamilton, D. S., Tyler, Roger, McMurry, R. G., Zhou,Naijiang, and Tremain, C. M. 1993. Geologic and hydrologic controls oncoalbed methane: Sand Wash Basin, Colorado and Wyoming: The University ofTexas at Austin, Bureau of Economic Geology, topical report prepared for theGas Research Institute under contract no. 5091-214-2261, GRI-92/0420, 151p.
Kaiser, W.R. and Scott, A.R. 1994. Hydrologic setting of the Fort Union Formation,Sand Wash Basin. Report of Investigations – Geologic and Hydrologic Controlson Coalbed Methane, Texas, University, Bureau of Economic Geology, 220, pp.115-125.
Kaiser, W.R., Scott, A., Zhou, N., Hamilton, D.S., and Tyler, R. 1994. Resources andProducibility of Coalbed Methane in the Sand Wash Basin. Report ofInvestigations – Geologic and Hydrologic Controls on Coalbed Methane, TexasUniversity, Bureau of Economic Geology, 220, pp. 129-145.
Quarterly Review of Methane From Coal Seams Technology. 1993. Greater GreenRiver Coal Region Wyoming and Colorado, pp. 13-17.
Scott, Andrew R. 1994. Coal Rank, Gas Content, and Composition and Origin ofCoalbed Gases, Mesaverde Group, Sand Wash Basin. Bureau of EconomicGeology and Colorado Geological Survey, Resource Series 30, pp. 51-62.

EPA 816-R-04-003 Attachment 10The Sand Wash Basin
Evaluation of Impacts to Underground Sources June 2004of Drinking Water by Hydraulic Fracturing ofCoalbed Methane Reservoirs A10-15
Tremain, C. M., and Toomey, J. 1983. Coalbed methane desorption data: ColoradoGeological Survey Open-file Report 81-4, 514 p.
Tyler, R., and Tremain, C.M. 1994. Tectonic evolution, stratigraphic setting, and coalfracture patterns of the Sand Wash Basin. Report of Investigations – Geologic andHydrologic Controls on Coalbed Methane, Texas University, Bureau of EconomicGeology, 220, pp. 3-19.

EPA 816-R-04-003 Attachment 11The Pacific and Central Coal Regions
Evaluation of Impacts to Underground Sources June 2004of Drinking Water by Hydraulic Fracturing ofCoalbed Methane Reservoirs A11-1
Attachment 11The Washington Coal Region (Pacific and Central)
The Pacific Coal Region (Figure A11-1) is approximately 6,500 square miles and liesalong the western and eastern flanks of the Cascade Range from Canada into northernOregon. The coals along the western flank lie within the Puget downwarp. Bellingham,Seattle, Tacoma, and Olympia in the State of Washington, and Portland, Oregon lie in oradjacent to the sub-basins. Choate et al. (1980) estimated coalbed methane resources forfour target sub-basins (Figure A11- 1) representing 1,800 square miles of the 6,500square mile Pacific Coal Region to be 0.3 trillion to 24 trillion cubic feet (Tcf). TheCentral Coal Region (Figure A11-2) is primarily the Columbia Plateau, between theCascade Range to the west and the Rocky Mountains in Idaho, to the east. The Regionextends from the Okanogan Highlands in the north to the Blue Mountains to the south,and encompasses approximately 63,320 square miles. Pappajohn and Mitchell (1991)estimated the coalbed methane potential of the Central Coal Region to be more than 18billion cubic feet (Bcf) per square mile. According to the available literature, there wereno producing fields in either the Pacific Coal Region or the Central Coal Region inWashington as of 2000 (GTI, 2001).
11.1 Basin Geology
A series of discontinuous coal fields lie along the western flank of the Cascade Range(Figure A11-3). The Roslyn and Taneum-Manastash fields are located on the easternflank of the Cascade Range (Figure A11-3). The coal-bearing sediments were formed ina swampy fluvial-deltaic coastal plain depositional environment in the Paleocene to lateEocene Eras. In the Columbia Plateau Region, the Cretaceous to Eocene coal-bearingrocks are buried beneath a thick sequence of extrusive basalts.
The coal-bearing deposits of the Pacific and the Central Coal Regions are Cretaceous toEocene Age and formed within fluvial and deltaic depositional environments prior to theuplift of the Cascade Mountain Range. The coalbeds of the Pacific and Central Basinsare thought to result from peat accumulations in poorly drained swamps of the lowerdeltas while the thinner coalbeds probably formed in the better drained upper deltas(Buckovic, 1979 as cited in Choate et al., 1980). During the Oligocene, Cascade volcanicactivity buried the deltaic sediments and compression caused some deformation of thesediments. During the Miocene, extensive volumes of basalt poured out in centralWashington and covered the coal-bearing fluvial deposits. During the late Pliocene, theCoast Range and the Cascades continued to be uplifted, separating the Pacific CoalRegion from the Central Coal Region, and causing extensive tectonic deformation,folding and faulting, of the coal-bearing sediments.

EPA 816-R-04-003 Attachment 11The Pacific and Central Coal Regions
Evaluation of Impacts to Underground Sources June 2004of Drinking Water by Hydraulic Fracturing ofCoalbed Methane Reservoirs A11-2
Deformation of the coal-bearing rocks increases toward the Cascade front. Fracturingmay enhance porosity and permeability of the coalbeds, allowing greater methane storageand production (Pappajohn and Mitchell, 1991). On the other hand, however, fracturingmay also increase the porosity and permeability of confining beds, allowing methane toescape up the stratigraphic section over time and dissipate in the atmosphere. Continuingdeformation, primarily faulting, may be a limiting factor controlling methane productionin the Pacific Coal Region as well.
11.1.1 Pacific Coal Region Geology
In the Pacific Coal Region, deformation has increased geologic complexity making itdifficult to follow or correlate coalbeds, especially across faults. Geothermal heatingalong the western flank of the Cascades created a thermally altered zone of increased coalrank ranging into the bituminous and anthracite ranks. The maturation to bituminousrank increases potential methane yields (Walsh and Lingley, 1991; Pappajohn andMitchell, 1991).
The major coal-bearing areas are in, from north to south, Whatcom, Skagit, King, Pierce,Kittitas, Thurston, Lewis, and Cowlitz Counties in Washington (Figure A11-3). Thediscussion of regional geology presented here illustrates the geologic conditions in theGreen River district in King County, the Wilkerson-Carbonado coalfield in PierceCounty, and the Centralia-Chehalis district in northern Lewis and southern ThurstonCounties, and does not attempt to provide a detailed description of every coalfield. Formore detailed information on the Bellingham area, Whatcom County, the reader isreferred to Beikman et al. (1961), for Whatcom and Skagit Counties to Jenkins (1923 and1924), and for the Roslyn coal area to Walker (1980). Other areas not discussed butimportant within the Pacific Region are the Toledo-Castle Rock District, and the Roslyn-Cle Elum and Teneum-Manastash fields. The stratigraphy for three sub-basins (GreenRiver, Wilkerson-Carbonado, and Centralia-Chehalis) of the Pacific Coal Region ispresented in Figure A11-4. The general setting and geology of each sub-basin is uniqueand complex.
The coal deposits of King County are located southeast of Seattle (Figure A11-3). TheGreen River district is the largest and most extensively mined coal-bearing area in KingCounty. The King County coals occur in the Puget Group of Eocene Age (Figure A11-4). Evans (1912) divided the Puget Group into 3 coal zones, which, from oldest toyoungest, are the Bayne, Franklin, and Kummer. Deformation has been moderate andmost of the coalbeds dip less than 35 degrees. In parts of the Green River district thedeformation has been more intense, and dips of 50 degrees or more are common. TheKing County coals range in rank from subbituminous to high-volatile bituminous.Within the Green River District, the Puget Group is estimated to be at least 6,500 feetthick and contains at least 15 coalbeds up to 40 feet thick (Beikman et al., 1961). Theprincipal coalbeds are located in the Franklin and Kummer zones in the Puget Group(Vine, 1969). Coal has been mined in the Green River District since about 1883, and it

EPA 816-R-04-003 Attachment 11The Pacific and Central Coal Regions
Evaluation of Impacts to Underground Sources June 2004of Drinking Water by Hydraulic Fracturing ofCoalbed Methane Reservoirs A11-3
has produced more than 25 million tons of coal. Currently there is no coal production inthe district.
The Wilkerson-Carbonado coalfield is located in Pierce County, southeast of Seattle(Figure A11- 3). The Pierce County coals occur in the Eocene Carbonado Formation(Beikman et al., 1961). The Carbonado consists of more than 5,000 feet of interbedded,layered lenses of sandstone, siltstone, mudstone, and shale with carbonaceous shale andcoal (Figure A11-4). At least 10 coalbeds have been identified in the area. Coalbedsrange in thickness from 1 to 5 feet with the maximum thickness of 15 feet. The coalsrange in rank from high-volatile bituminous to low-volatile bituminous. The Wilkerson-Carbonado coals have the highest rank of any major coal-bearing area in WashingtonState. Throughout the field, deformation has been intense. Dips of 60 degrees or moreare common, and fault displacements range from a few feet to more than 1,500 feet.Although these areas have recently been targets of coalbed methane exploration, there iscurrently no production.
The coal deposits of Lewis and Thurston Counties occur in the Skookumchuck Formation(Figure A11-3) of late Eocene Age (Snavely et al., 1958). The Centralia-Chehalis districtis located in northern Lewis and southern Thurston Counties (Figure A11-3).Deformation of the Skookumchuck is moderate resulting in tightly folded anticlines andbroad open synclines. The coal deposits have been cut by a series of high angle reversefaults roughly paralleling the fold axes. The faults dip to the northeast, with thesouthwest block downthrown, and have displacements ranging from 200 to 500 feet. Thecoal rank ranges from lignite to anthracite. The central part of the Centralia-Chehalisdistrict contains as many as 14 subbituminous coalbeds ranging from a few inches to over40 feet in thickness. The district contains more than half of the calculated coal reservesof the State. The TransAlta Centralia Mining Company continues to operate a major stripmine centered about 5 miles northeast of Centralia, where it is anticipated that 9,400acres will be stripped over 35 years. Within the Centralia mine, the Big Dirty bed ismore than 40 feet thick. To the west of Centralia, the Vader coal area contains severallignite beds with thickness up to 20 feet, which may correlate in part with the coals in theCentralia-Chehalis area.
In Whatcom and Skagit counties (Figure A11-3), the Chuckanut Formation contains asmany as 15 coalbeds, ranging from 1 to 15 feet thick and ranking from lignite toanthracite, but generally bituminous. The rank of the coal increases eastward towards thecrest of the Cascades Range.
The rank of Pacific Region coals varies greatly from place to place, ranging from ligniteto anthracite, but generally rank increases toward the crest of the Cascade Range. Thecoal rank is used to identify bituminous coal-target areas where gas yields may begreatest. While the structural geology is very complex, the thermally-alteredmetamorphic zone is rather predictable. Both of these factors will play a major role in

EPA 816-R-04-003 Attachment 11The Pacific and Central Coal Regions
Evaluation of Impacts to Underground Sources June 2004of Drinking Water by Hydraulic Fracturing ofCoalbed Methane Reservoirs A11-4
the design of any exploration and development plans for coalbed methane in the PacificCoal Region.
The complex stratigraphy and structural deformation of the lenticular coals in the PacificCoal Region are major obstacles to the exploration and development of coalbed methanefields. Predicting the location of coalbeds is a complex and difficult process because thegeology in the area has been modified by intense deformation. Additionally, the faultingthat commonly occurs along the axes of anticlines may form conduits for the escape ofmethane through overlying confining beds. Steeply dipping beds of coal have presenteddifficulties in controlling drill bit directions and in development and stimulation forcoalbed methane production.
Choate et al. (1980) estimated coalbed methane resources for four target sub-basins(Figure A11-1), representing 1,800 square miles of the 6,500 square mile Pacific CoalRegion, to be 0.3 trillion to 24 Tcf. Methane had been encountered in 67 oil and gasexploration wells drilled in this region by 1984. Methane gas was found at depths of lessthan 500 feet in 25 wells, less than 1,000 feet in 38 wells, and less than 2,000 feet in 50wells. In western Whatcom County, methane has been found in unconsolidated glacialdrift capped by impervious clay beds. East of Ferndale, methane gas reportedly has beenproduced commercially from unconsolidated deposits at depths ranging from 166 to 193feet at flow rates ranging from 750,000 to 5,000,000 cubic feet per day (Choate et al.,1980).
11.1.2 Central Coal Region Geology
The Central Coal Region refers to the coal-bearing formations east of the Cascade Range.The Columbia River Basalt Group, primarily the Grande Ronde Basalt, Wanapum Basalt,and Saddle Mountains Basalt bury the Cretaceous to Eocene coal-bearing formations ofthe Central Coal Region. In this region, methane is entrained in groundwater fromconfined aquifers in the basalts. Interbedded with the flood basalts are epiclastic andvolcaniclastic sediments. The less fractured zones of basalt appear to act as aquitards(Johnson et al., 1993). Johnson et al. (1993) have concluded that the greatest volume ofmethane is derived from upward migration from the underlying Eocene coals. They alsosuggest that faults through the underlying sediments and basalts provide conduits for themigration of gas-bearing groundwater into the confined zones.
The Yakima fold belt lies between the confluence of the Snake and Columbia Rivers andthe Cascade Range, and is a series of broad asymmetric anticlines and synclines whoseaxes generally trend west northwest to east southeast (Figure A11-5). The anticlinalridges are typically cut by thrust faults that are inclined and steepen with depth (Reidel etal., 1989). While the anticlines may form structural traps for methane in the sourcecoalbeds, the thrust faults in the anticlines may form conduits for the upward migration ofmethane through overlying confining beds. The fold structures are very flat and broad

EPA 816-R-04-003 Attachment 11The Pacific and Central Coal Regions
Evaluation of Impacts to Underground Sources June 2004of Drinking Water by Hydraulic Fracturing ofCoalbed Methane Reservoirs A11-5
and do not result in the steeply dipping strata that are characteristic of the Pacific CoalRegion west of the Cascades.
11.2 Basin Hydrology and USDW Identification
Surficial deposits of Pleistocene glacial outwash locally form aquifers capable ofsustaining public drinking water supplies in the Pacific and Central Washington Regions.In the Central Coal Region, aquifers in the basalts are extensively developed forirrigation. Public water supplies in Pierce County (Olympia area) and King County(Seattle area) of the Puget Sound Region (Pacific Coal Basin) are obtained from theglacial drift aquifer (Dion, 1984) that overlies Eocene sediments, which may contain coaland methane. Water quality information from four gas test wells indicates the presenceof 1,330 to 1,660 milligrams per liter (mg/L) total dissolved solids (TDS) in water withinthe coalbeds of Pierce County (Dion, 1984). This meets the water quality requirementsof an underground source of drinking water (USDW). The Washington Department ofEcology and the EPA deemed this water to be of sufficient quality to permit its dischargeto surface waters of the Carbon River (Pappajohn and Mitchell, 1991).
The Columbia River Basalt Group is identified as a major regional multi-aquifer province(Lindholm and Vaccaro, 1988; Dion, 1984). The aquifer is used extensively forirrigation, but may also be used as a source of drinking water. Wells in the Basaltscommonly yield 150 to 3,000 gallons per minute. TDSs in the water produced generallyrange from 250 to 500 mg/L (Dion, 1984).
The occurrence of methane in groundwater is one factor leading to the assessment of thecoalbed methane production potential in Washington. Methane in groundwater occurs inthe basalts, but only in confined aquifers (porous or fractured zones near the top orbottom of a basalt layer), and is thought to have migrated upward from underlyingcoalbeds. Water supply wells and irrigation wells in the Columbia River Basalts andwater wells in numerous different lithologies in the Pacific Coal Region have beenrecognized as containing methane. Data demonstrating the co-location of a coal seamand a USDW were found for Pierce County, where methane gas test well results reportTDS levels far lower than the 10,000 mg/L USDW water quality threshold (Dion, 1984).
11.3 Coalbed Methane Production Activity
Complex stratigraphy and structural deformation creates major obstacles to thedevelopment of gas from the Pacific Coal Region. The coals are known from active andinactive mines to be gassy, folded, faulted, and commonly steeply inclined. Thedifficulties and dangers involved with underground coal mining led to closure of themines once the shallow deposits were exhausted. However, their characteristics havebeen well documented by the mining operations. Many of these same structural

EPA 816-R-04-003 Attachment 11The Pacific and Central Coal Regions
Evaluation of Impacts to Underground Sources June 2004of Drinking Water by Hydraulic Fracturing ofCoalbed Methane Reservoirs A11-6
characteristics have impeded the development of coalbed methane gas. The availableliterature indicates that no significant production had been achieved by 1996 (GRI, 1999).According to the available literature, there were no producing fields in either the PacificCoal Region or the Central Coal Region in Washington as of 2000 (GTI, 2001).However, in northwest Oregon, the Mist gas field was developed in the 1990s.
11.3.1 Pacific Coal Region Production Activity
Between 1986 and 1993, 19 coalbed methane wells were drilled in the northern PacificCoal Region (Quarterly Review, 1993). Three tests were conducted near the town ofBlack Diamond in the Green River coal area of King County. One of the wells washydraulically fractured and the others completed by open-hole cavitation. Steep dips ofthe strata led to wellbore deviation during drilling and to caving following the fracturingoperations. One well produced 32,000 to 62,000 cubic feet per day of coalbed methanegas with no water in an open-hole test. Another was hydraulically fractured with 12/20mesh sand and nitrogen foam in two zones at depths of 2,228 to 2,442 feet and 2,505 to2,638 feet, but no test results were released. Caving was so prominent that it interferedwith wellbore cleanup following the hydraulic fracturing operations. According toavailable publications, optimal fracturing and completion methods for use in thestructurally difficult Pacific Coal Region are yet to be applied and proven.
11.3.2 Central Coal Region Production Activity
The one commercial gas field (Rattlesnake Hills) in the Central Coal Region was shutdown in 1941. Production from the Cretaceous to Eocene coalbeds that lie below thebasalts may have large potential. Pappajohn and Mitchell (1991) estimated the coalbedmethane potential of the Central Coal Region to be more than 18 Bcf per square mile. Itis unlikely that the whole 63,320 square miles of the region could yield that rate becausethe coals are only known to occur below the basalts in the western part of the basin.Much is not known about the potential coalbed methane production from these obscureddeposits, and development depends on successful exploration.
Although the coals of the Central Coal Region may not be as greatly deformed andunpredictable as those in the Pacific Coal Region, they are overlain by the ColumbiaRiver Basalt Group, in which individual basalt flows up to 300 feet thick can coverthousands of square miles. The Rattlesnake Hills gas field operated between 1913 and1941 in the western part of this region and indicates greater potential for development.

EPA 816-R-04-003 Attachment 11The Pacific and Central Coal Regions
Evaluation of Impacts to Underground Sources June 2004of Drinking Water by Hydraulic Fracturing ofCoalbed Methane Reservoirs A11-7
11.4 Summary
The geologic structure of the coal-bearing rocks is difficult to interpret in the Pacific andCentral Coal Regions, and methane may be technically difficult to produce in theseregions. A connection exists between the Washington coalbeds and a USDW. However,there were no producing coalbed methane wells in the Pacific and Central Coal Regionsin Washington as of 2000 (GTI, 2001). In some areas, the Pacific and Central Regions’coals exist within a potential USDW. In other areas of the basin, there is evidence thatthe coalbeds are below a USDW. Hydraulic fracturing has been documented in thisregion. Data demonstrating the co-location of a coal seam and a USDW were found forPierce County, where methane gas test well results report TDS levels of 1,330 to 1,660mg/L, far less than the USDW classification limit of 10,000 mg/L (Dion, 1984).
In this region, methane occurs in groundwater flowing through fractured zones in basalts,although less fractured zone of the basalts appear to act as hydraulic confining layers.Johnson, et al. (1993) concluded that the greatest volume of this methane has migratedupward from underlying coalbeds. Water supply wells and irrigation wells in theColumbia River Basalts and water wells in numerous different lithologies in the PacificCoal Region have been recognized as containing methane. Development of coalbedmethane in the Washington Coal Region may have some impact on highly productivebasalt aquifers that meet the requirements of a USDW and are already in use as largesources of irrigation water for agriculture.

EPA 816-R-04-003 Attachment 11The Pacific and Central Coal Regions
Evaluation of Impacts to Underground Sources June 2004of Drinking Water by Hydraulic Fracturing ofCoalbed Methane Reservoirs A11-8

EPA 816-R-04-003 Attachment 11The Pacific and Central Coal Regions
Evaluation of Impacts to Underground Sources June 2004of Drinking Water by Hydraulic Fracturing ofCoalbed Methane Reservoirs A11-9
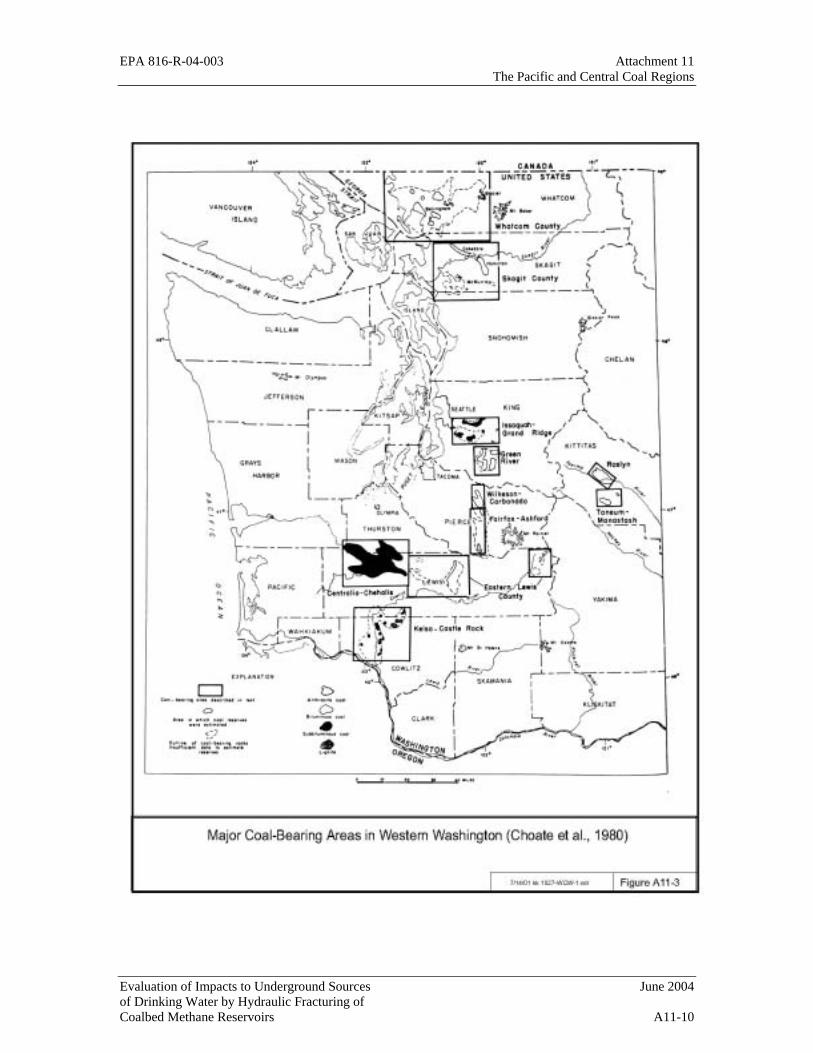
EPA 816-R-04-003 Attachment 11The Pacific and Central Coal Regions
Evaluation of Impacts to Underground Sources June 2004of Drinking Water by Hydraulic Fracturing ofCoalbed Methane Reservoirs A11-10

EPA 816-R-04-003 Attachment 11The Pacific and Central Coal Regions
Evaluation of Impacts to Underground Sources June 2004of Drinking Water by Hydraulic Fracturing ofCoalbed Methane Reservoirs A11-11

EPA 816-R-04-003 Attachment 11The Pacific and Central Coal Regions
Evaluation of Impacts to Underground Sources June 2004of Drinking Water by Hydraulic Fracturing ofCoalbed Methane Reservoirs A11-12

EPA 816-R-04-003 Attachment 11The Pacific and Central Coal Regions
Evaluation of Impacts to Underground Sources June 2004of Drinking Water by Hydraulic Fracturing ofCoalbed Methane Reservoirs A11-13
REFERENCES
Biekman, H.M., H.D. Gower, and T.A.M. Dana. 1961. Coal Reserves of Washington.Washington Division of Mines and Geology Bulletin 47, 115 p.
Buckovic. 1979. The Eocene Deltaic System of West-central Washington: inArmentrout, J. M., Cole, M. R., and Terbest H., eds., Cenozoic paleogeographyof the western United States: Los Angeles, Soc. Econ. Paleont. and Min., PacificSection, Pacific Coast Paleogeog. Symposium 3, p. 147-163, as cited by Choate etal., 1980.
Choate, R., Johnson, D.A., and McCord J.P. 1980. Geologic overview, coal, andcoalbed methane resources of the Western Washington coal region, Lakewood,Colorado. TRW Energy Systems Group Report for U.S. Department of Energy,Morgantown Energy Technology Center, Contract DE-AC21-78MC08089, pp.353-372.
Dion, N. P. 1984. Washington Ground-Water Resources. In National Water Summary,U.S. Geological Survey Water-Supply Paper No. 2275, pp. 433-438.
Evans, G. W. 1912. The coal fields of King County. Washington Geological SurveyBulletin 3, 247 pp.
Gas Research Institute. 1999. North American coalbed methane resource map – U.S.coalbed methane resources.http://www.gri.org/pub/content/jun/19990614/114314/resources/resources.html.
Gas Technology Institute (GTI) Web site. 2002. Drilling and Production Statistics forMajor US Coalbed Methane and Gas Shale Reservoirs.http://www.gastechnology.org.
Jenkins, Olaf P. 1923. Geological investigation of the coal fields of western WhatcomCounty, Washington: Washington Division of Geology Bulletin 28, 135 p., 2plates.
Jenkins, Olaf. P. 1924. Geological investigation of the coal fields of Skagit County,Washington: Washington Division of Geology bulletin 29, 63 p.
Johnson, V. G., D. L. Graham, and Reidel, S. P. 1993. Methane in Columbia River
basalt aquifers: isotopic and geohydrologic evidence for a deep coal-bed gassource in the Columbia Basin. Washington Bulletin of the American Associationof Petroleum Geologists, 77(7):1192-1207 (July).

EPA 816-R-04-003 Attachment 11The Pacific and Central Coal Regions
Evaluation of Impacts to Underground Sources June 2004of Drinking Water by Hydraulic Fracturing ofCoalbed Methane Reservoirs A11-14
Lindholm, G.F. and Vaccaro, J.J. 1988. Region 2, Columbia Lava Plateau. In TheGeology of North America, Vol. 0-2, Hydrogeology. The Geological Society ofAmerica, Boulder CO, pp. 37-50.
Pappajohn, S. P., and Mitchell, T. E. 1991. Delineation of prospective coalbed methanetrends in western and central Washington State. In Schwochow, S. D. Coalbedmethane of western North America guidebook for the Rocky MountainAssociation of Geologists Fall Conference and Field Trip Sept. 17-20, 1991,Glenwood Springs, CO, pp. 163-178.
Quarterly Review of Methane from Coal Seams Technology. 1993. Pacific Coal Region.Methane from Coal Seams Technology, pp. 21 (August).
Reidel, S. P., Fecht, K. R., Hagood, M. C., and Tolan, T. L. 1989. Geologicdevelopment of the central Columbia plateau, in Riedel, S. P. and Hooper, P. R.,eds., Volcanism and tectonism in the Columbia River Flood-Basalt Province:Geological society of America Special Paper 239, pp. 247-264.
Snavely, P. D., Jr., Brown, R. D., Jr., Roberts, A. E., and Rau, W. W. 1958. Geologyand coal resources of the Centralia-Chelhalis district, Washington: U.S.Geological Survey Bulletin 1053, 159 p.
Vine, J. D. 1969. Geology and coal resources of the Cumnberland, Hobart, and MapleValley quadrangles, King County, Washington: U.S. Geological SurveyProfessional Paper 624, 67 p.
Walker, C. W. 1980. Geology and energy resources of the Roslyn-Cle Elum area,Kittitas County, Washington: Washington Department of Natural Resourcesopen-File Report 80-1, 57 p.
Walsh, T. J. and Lingley, W. S., Jr. 1991. Coal maturation and the natural gas potentialof western and central Washington: Washington Division of Geology and EarthResources Open-File Report 91-2, 26 p.

EPA 816-R-04-003 Attachment 2 The Black Warrior Basin
Evaluation of Impacts to Underground Sources June 2004of Drinking Water by Hydraulic Fracturing ofCoalbed Methane Reservoirs A2-1
Attachment 2The Black Warrior Basin
The Black Warrior Basin covers an area of about 23,000 square miles in Alabama andMississippi. The basin is approximately 230 miles long from west to east andapproximately 188 miles long from north to south. Coalbed methane production inAlabama is limited to the bituminous coalfields of west-central Alabama, primarily inJefferson and Tuscaloosa Counties.
Coalbed methane production in the Black Warrior Basin is among the highest in theUnited States. In 1996, approximately 5,000 coalbed methane wells were permitted inAlabama. In 2000, this number increased to over 5,800 wells (Alabama Oil and GasBoard, 2002). Coalbed methane well production rates range from less than 20 to morethan one million cubic feet per day per well (Alabama Oil and Gas Board, 2002).Between 1980 and 2000, coalbed methane wells in Alabama produced roughly 1.2 trillioncubic feet of gas. According to the Gas Technology Institute (GTI), annual gasproduction was 112 billion cubic feet in 2000 (GTI, 2002).
2.1 Basin Geology
Coalbed methane production in the Black Warrior Basin (Figure A2-1) is containedwithin the Upper Pottsville Formation of Pennsylvanian age (300 million years). Thedepositional history along the ancient coastline of prehistoric Alabama was characterizedby 8 to 10 “coal deposition cycles” of sea level rising and lowering. Each of these 10geologic “coal deposition cycles” features mudstone at the base of the cycle (deeperwater) and coalbeds at the top of the cycle (emergence) (Pashin and Hinkle, 1997).
The geologic structure of the Black Warrior Basin is complex. Due to erosion andstructural uplift, not all of the coal zones are present at all locations (Pashin et al., 1991;Young et al., 1993). In general, however, most coalbed methane wells tap the BlackCreek/Mary Lee/Pratt cycles, at depths that range from 350 to 2,500 feet deep (Holditch,1990).
Alabama coalbeds are typically very thin, ranging from less than 1 inch in thickness to 4feet (in rare cases they may be up to 8 feet thick in surface mines) (Horsey, 1981; Heckel,1986; Eble et al., 1991; Carrol et al., 1993; Pashin, 1994) (Figure A2-2). In the area ofcoalbed methane development, the Pottsville Formation exists at or near the surface, andthe depth to commercial coalbeds ranges from the surface outcrop to 3,500 feet,depending on location (Figure A2-3).

EPA 816-R-04-003 Attachment 2 The Black Warrior Basin
Evaluation of Impacts to Underground Sources June 2004of Drinking Water by Hydraulic Fracturing ofCoalbed Methane Reservoirs A2-2
2.2 Basin Hydrology and USDW Identification
In the location where coalbed methane development is taking place in west-centralAlabama, the Pottsville Formation is an unconfined aquifer. The matrix permeability ofPottsville rocks (e.g., mudstone, cemented sandstone) is low, but water is present andflows within an extensive system of faults, fractures, and joints. Flow patterns within thePottsville Formation are strongly controlled by fault- and fold-related isotropic joints andfractures (Koenig, 1989). The close spacing and systematic pattern of cleats, however,make coalbeds the most productive aquifers within the Pottsville Formation (Koenig,1989; Pashin et al., 1991; Pashin and Hinkle, 1997). In the early 1990s, several authorsreported fresh water production from coalbed wells at rates up to 30 gallons per minute(Ellard et al., 1992; Pashin et al., 1991).
Most of the recharge to the Pottsville aquifer is precipitation that infiltrates from thesurface, but some recharge occurs where streamflow enters the outcrop and moveslaterally into the aquifer along folded anticlinal beds (Pashin and Hinkle, 1997) (FigureA2-4). Several researchers also propose upwelling of more saline waters from deeperzones, which takes place along vertical, fault-related, rubble zones (Pashin et al., 1991).Discharge from the Pottsville aquifer is primarily from the dewatering of coalbeds dueto mining and coalbed methane production (Pashin et al., 1991).
Formation water produced from Alabama coalbed methane wells contains between lessthan 50 to over 10,000 milligrams per liter (mg/L) total dissolved solids (TDS) (Koenig,1989; Pashin et al., 1991; Pashin and Hinkle, 1997). Some portions of the PottsvilleFormation contain waters which meet the quality criterion of less than 10,000 mg/L TDSfor an underground source of drinking water (USDW) (Figure A2-7). According to theAlabama Oil and Gas Board, some waters in the Pottsville Formation do not meet thedefinition of a USDW and have TDS levels which are considerably higher than 10,000mg/L (Alabama Oil and Gas Board, 2002). Water quality generally decreases withincreasing depth (Figures A2-7 and A2-8), and areally is related to the faulting pattern(Figure A2-9) (Pashin et al., 1991; Pashin and Hinkle, 1997). Waters exceeding 10,000mg/L TDS can be found below 3,000 feet in areas near deep vertical faults, suggestingupwelling from deeper, more saline zones (Pashin and Hinkle, 1997).
2.3 Coalbed Methane Production Activities
Alabama coalbed methane wells are categorized into three distinct types. The first twotypes, “gob” wells and horizontal wells, are less common. Gob wells are associated withmines. The well is drilled to a depth above the mine roof, and when the mine isabandoned, the roof collapses. Gob wells produce coalbed methane from the fracturedmine debris. A few horizontal wells are drilled from within mines to reduce coalbedmethane concentration in advance of a working face. The third type, which includes 98percent of all Alabama methane wells, includes vertically drilled wells that utilize

EPA 816-R-04-003 Attachment 2 The Black Warrior Basin
Evaluation of Impacts to Underground Sources June 2004of Drinking Water by Hydraulic Fracturing ofCoalbed Methane Reservoirs A2-3
mainstream oilfield technologies (Pashin and Hinkle, 1997). Because neither gob norhorizontal wells typically are hydraulically fractured, this discussion is limited to verticalwells.
According to literature, most coalbed methane wells are drilled using water or air rotarymethods or water-based mud, due to lower cost and concerns that mud fluids will invadethe coal. Wells in Alabama are completed with tubing. Water is pumped up the tubingfor disposal, whereas gas is produced up the annulus. Wells are drilled to a depth 10 to30 feet below the lowest coalbed to create a sump that collects coal fines and allowswater to separate from the coalbed methane (Holditch, 1990).
About 95 percent of produced water is disposed by discharge into surface water, via TypeII National Pollution Discharge Elimination System permits (O’Neil et al., 1989; O’Neilet al., 1993; Pashin and Hinkle, 1997). These permits require some water qualitymonitoring and limit instream water quality to 230 mg/L TDS (Pashin and Hinkle, 1997).Since 1991, about 5 percent of produced water has been injected for disposal into Class IIinjection wells (Pashin and Hinkle, 1997). Eight Class II wells are currently active(Alabama Oil and Gas Board, 2001), disposing coalbed waters into zones between 4,300and 10,000 feet deep (Ortiz et al., 1993).
Most wells are completed in multiple coal zones using perforations. Some wells arecompleted in mudstones immediately below a coal zone, rather than within the coal(“limited entry” completions), and a few wells feature un-cased, open-hole completions.Each well is hydraulically fractured to allow communication with the thin coal seamsoutside of the casing, and most wells are fractured more than once as described below:
• In wells with multiple coal seams present, the hydraulic fracturing processmay involve several or multiple stimulations, using 2 to 5 hydraulic fracturetreatments per well (depending on the number of seams and spacing betweenseams); and,
• Many coalbed methane wells are re-fractured at some time after the initialtreatment, in an effort to re-connect the wellbore to the production zones toovercome plugging or other well problems (remedial fracture-stimulation)(Holditch, 1990; Saulsberry et al., 1990; Palmer et al., 1991a and 1991b;Schraufnagel et al., 1991; Holditch, 1993; Palmer et al., 1993b; Spafford etal., 1993; Schraufnagel et al., 1993) (Figure A2-10).
The geometry of hydraulic fractures in coalbed methane zones usually differs from thatobserved in conventional oil and gas scenarios. In conventional hydrocarbon zones, thegas and/or oil are physically “trapped” by the presence of an impermeable confininglayer, usually shale. Shale formations may present a barrier to upward fracture growthbecause of the stress contrast between the coalbed and the higher-stress shale (seeAppendix A). Therefore, for conventional fracturing, the vertical growth of fractures out

EPA 816-R-04-003 Attachment 2 The Black Warrior Basin
Evaluation of Impacts to Underground Sources June 2004of Drinking Water by Hydraulic Fracturing ofCoalbed Methane Reservoirs A2-4
of the target zone may be limited by the presence (i.e., stress contrast) of overlyingshales. In conventional gas-well fracture environments, fracture half-length (200-1,600feet from the well bore) almost always exceeds fracture height (10-200 feet above theperforations). In the Black Warrior Basin, however, the lithologic properties and stressfields of the coal cycles typically produce fractures that are higher than they are long(“length” refers to horizontal distance from the well bore) (Morales et al., 1990; Zuber etal., 1990; Holditch et al., 1989; Palmer and Sparks, 1990; Jones and Schraufnagel, 1991;Steidl, 1991; Wright, 1992; Palmer et al., 1991b and 1993a).
In the Black Warrior Basin of Alabama, hydraulic fractures created in coalbed methanedeposits are able to grow much higher than some fractures in “conventional” gasreservoirs. There are three primary reasons for this phenomenon:
• Due to coal’s low modulus of elasticity (i.e., brittleness, stiffness) andcomplex fracture geometries, high pressures are required to fracture coalhydraulically (500 to 2,000 pounds per square inch (psi), or 0.7 to 2.0 psi/ft),and high treatment pressure often causes preferential extension of the fracturein the vertical dimension (Jones et al., 1987; Reeves et al., 1987; Morales etal., 1990; Palmer et al., 1991a);
• The economics of coalbed methane production in this basin requires tallfractures that penetrate several coal seams. The coal seams are typically thin(1 to 12 inches) and economically viable production requires the drainage ofas many seams as possible. Because coal seams may be vertically separatedby up to hundreds of feet of intervening rocks, operators usually designfracture treatments to enhance the vertical dimension and might performseveral fracture treatments within a single well (Ely, et al., 1990; Holditch,1990; Saulsberry et al., 1990; Spafford, 1991; Holditch, 1993); and,
• The other rocks within the Pottsville coal cycles (jointed mudstone andsandstone) fracture much more easily than coal (Teufel and Clark, 1981;Saulsberry et al., 1990; Jones and Scraufnagel, 1991; Spafford, 1991).Because there are no significant barriers to fracture height (Simonson et al.,1978; Ely et al., 1990; Palmer et al., 1991a), vertical fractures in the BlackWarrior basin typically penetrate several thin coalbeds and hundreds of feet ofintervening rocks (Teufel and Clark, 1981; Hanson et al., 1987; Holditch etal., 1989; Ely et al., 1990; Palmer et al., 1991c; Schraufnagel et al., 1991;Spafford, 1991; Palmer et al., 1993b) (Figure A2-11).
Mined-through studies in the Black Warrior Basin identified many instances where thin(less than 1-foot thick) shales overlying targeted coalbeds were fractured. Penetrationinto layers above the coal was observed in more than 80 percent of the fracturesintercepted by mines underground in the Black Warrior Basin (Diamond, 1987b). Somefractures continued completely through very thin shales (Diamond, 1987a and b). These

EPA 816-R-04-003 Attachment 2 The Black Warrior Basin
Evaluation of Impacts to Underground Sources June 2004of Drinking Water by Hydraulic Fracturing ofCoalbed Methane Reservoirs A2-5
studies did not conduct a systematic assessment of the extent of the vertical fracturesthrough and above the roof rock shales.
Several researchers conclude (based on pressure behavior during fracturing and severalexamples where mines penetrated hydraulic fractures) that shallow fractures have ahorizontal component as described below:
• Fractures that are created at shallow depth typically have more of a horizontalcomponent and less of a vertical component. The vertical component is mostlikely due to the presence of vertical natural fractures (cleats and joints) aspre-existing planes of weakness from which vertical fractures can initiate.
• Fractures created at a greater depth can propagate vertically to shallowerdepth, and develop a horizontal component. In these “T-fractures”, thefracture tip may fill with coal fines and/or intercept a zone of stress contrast,which causes the fracture to “turn” and to develop horizontally.
As noted above, penetration of the layers above the coal was observed in more than 80percent of the fractures intercepted by mines underground in the Black Warrior Basin(Diamond, 1987b), but, as coals become shallower, the potential for fracture heightgrowth decreases. In general, horizontal fractures are most likely to exist at shallowdepths (less than 1,000 feet). As depths increase, it is more likely that a simple verticalfracture will occur (Gas Research Institute, 1995).
Sand is the most common proppant used in coalbed methane treatments in Alabama. Theamount of sand injected per fracture treatment ranges from 10,000 to 120,000 pounds(Holditch et al., 1989; Palmer et al., 1991b and 1993a). Fracture widths in the formationvary from 0.5 inches to closed (i.e., no proppant emplaced), depending on distance fromwellbore and efficiency of the proppant displacement into the length of the fracture(Palmer and Sparks, 1990; Palmer et al., 1993a; Steidl, 1993).
Fracturing fluid (30,000 to 200,000 gallons per treatment) is injected at a rate of 5 to 50barrels per minute (which equals 210 to 2,100 gallons per minute) at injection pressuresranging from 500 to 2,300 psi (Palmer et al., 1989 and 1993b; Holditch et al., 1989;Pashin and Hinkle, 1997). The most common constituent of fracturing fluid is plainwater. Several researchers conclude that approximately 75 percent of all coalbedmethane wells in Alabama were fractured using cross-linked gel fluids (Palmer et al.,1993a; Pashin and Hinkle, 1997).
According to service companies, diesel fuel is no longer used as a component offracturing fluids in Alabama. In addition, additives that could introduce chemicalsexceeding maximum contaminant levels (MCLs) are no longer used in fracturing fluids inAlabama.

EPA 816-R-04-003 Attachment 2 The Black Warrior Basin
Evaluation of Impacts to Underground Sources June 2004of Drinking Water by Hydraulic Fracturing ofCoalbed Methane Reservoirs A2-6
Table A2-1 presents some data concerning the general chemical makeup of commonfracturing fluids used in Alabama from literature published prior to the Alabamahydraulic fracturing regulation (Economides and Nolte, 1989; Penny et al., 1991). Inaddition, most gel fluids utilize a breaker compound (usually a borate or persulfatecompound or an enzyme, at 2 lb/1,000 gal) to allow post-treatment thinning and easierrecovery of gels from the fracture. Several researchers conclude that approximately 75percent of all coalbed methane wells in Alabama were fractured using cross-linked gelfluids (Palmer et al., 1993a; Pashin and Hinkle, 1997).
According to Hunt and Steele (1992), environmental regulations restrict local disposal ofused fracturing fluids, and fracturing fluids are transported to regulated disposal sites.Robb and Spafford (1991) reported that acids were used to fracture production zones asshallow as 400 feet deep.
In fracture treatments of wells in homogeneous formations in conventional gas fields,injection is temporary and the majority of fracturing fluid is subsequently pumped backup through the well when production resumes.
There are limited data in the literature concerning the volume of fracturing fluidssubsequently pumped back to the well after stimulation has ceased. Palmer et al. (1991b)found that only 61 percent of fracturing fluids were recovered during productionsampling of a coalbed well in the Black Warrior Basin of Alabama, and projected that 20to 30 percent would remain in the formation.
2.4 Summary
Coalbed methane development and hydraulic fracturing in the Black Warrior Basin ofAlabama takes place within a USDW, the Pottsville formation. Some portions of thePottsville Formation contain waters which meet the quality criteria of less than 10,000mg/L TDS for a USDW. Some waters in the Pottsville Formation do not meet thedefinition of a USDW and have TDS levels that are considerably higher than 10,000mg/L (Alabama Oil and Gas Board, 2002).
According to service companies, diesel fuel is no longer used as a component offracturing fluids in Alabama. In addition, additives that could introduce chemicalsexceeding MCLs are no longer used in fracturing fluids in Alabama.
In the Pottsville Formation, the lack of a significant vertical barrier can provide forextensive fracture height growth (Holditch et al., 1989; Lambert et al., 1989; Ely et al.,1990; Saulsberry et al., 1990; Palmer and Sparks, 1990; Spafford, 1991; Palmer et al.,1991a and 1993a; Spafford et al., 1993; Gas Research Institute, 1995). Mined-throughstudies in the Black Warrior Basin identified many instances where thin (less than 1-footthick) shales overlying targeted coalbeds were fractured. Penetration into layers above

EPA 816-R-04-003 Attachment 2 The Black Warrior Basin
Evaluation of Impacts to Underground Sources June 2004of Drinking Water by Hydraulic Fracturing ofCoalbed Methane Reservoirs A2-7
the coal, which are typically shale, was observed in more than 80 percent of the fracturesintercepted by mines underground in the Black Warrior Basin (Diamond, 1987b).

EPA 816-R-04-003 Attachment 2 The Black Warrior Basin
Evaluation of Impacts to Underground Sources June 2004of Drinking Water by Hydraulic Fracturing ofCoalbed Methane Reservoirs A2-8
Table A2-1. Chemical Components Previously Used in TypicalFracturing/Stimulation Fluids for Alabama Coalbed Methane Wells
Type ofStimulation Fluid Composition pH
Fluids
Hydrochloric acid 15% HCl water solution <1-3
“Slick” water water-soluble solvent as NAviscosity reducer (% unknown)
Diesel oil NA NA
Gels1
R-F 3% resorcinol, 3% formaldehyde, 6.50.5% KCl, 0.4% NaHCO3
Pfizer Flocon 4800 0.4% xanthan, 154 ppm Cr3+ 4.0(as CrCl3), 0.5% KCl
Marathon MARCIT 1.4% polyacrylamide (HPAM), 636 ppm 6.0Cr3+ (as acetate), 1% NaCl
DuPont LuDox SM 10% colloidal silica, 0.7% NaCl 8.2
CPAM crosslinked with 0.4% cationic polyacrylamide (CPAM), 7.3 Pfizer Floperm 500 1520 ppm glyoxal, 2% KCl
Drilling Specialties 0.3% HPAM-AMPS, 100 ppm Cr3+ 5.0 HE-100 Crosslinked (as acetate), 2% KCl
1 Gels are typically mixed at a ratio of 40 lbs. per 1000 gal. water; compositions shownare “as mixed”.

EPA 816-R-04-003 Attachment 2 The Black Warrior Basin
Evaluation of Impacts to Underground Sources June 2004of Drinking Water by Hydraulic Fracturing ofCoalbed Methane Reservoirs A2-9

EPA 816-R-04-003 Attachment 2 The Black Warrior Basin
Evaluation of Impacts to Underground Sources June 2004of Drinking Water by Hydraulic Fracturing ofCoalbed Methane Reservoirs A2-10
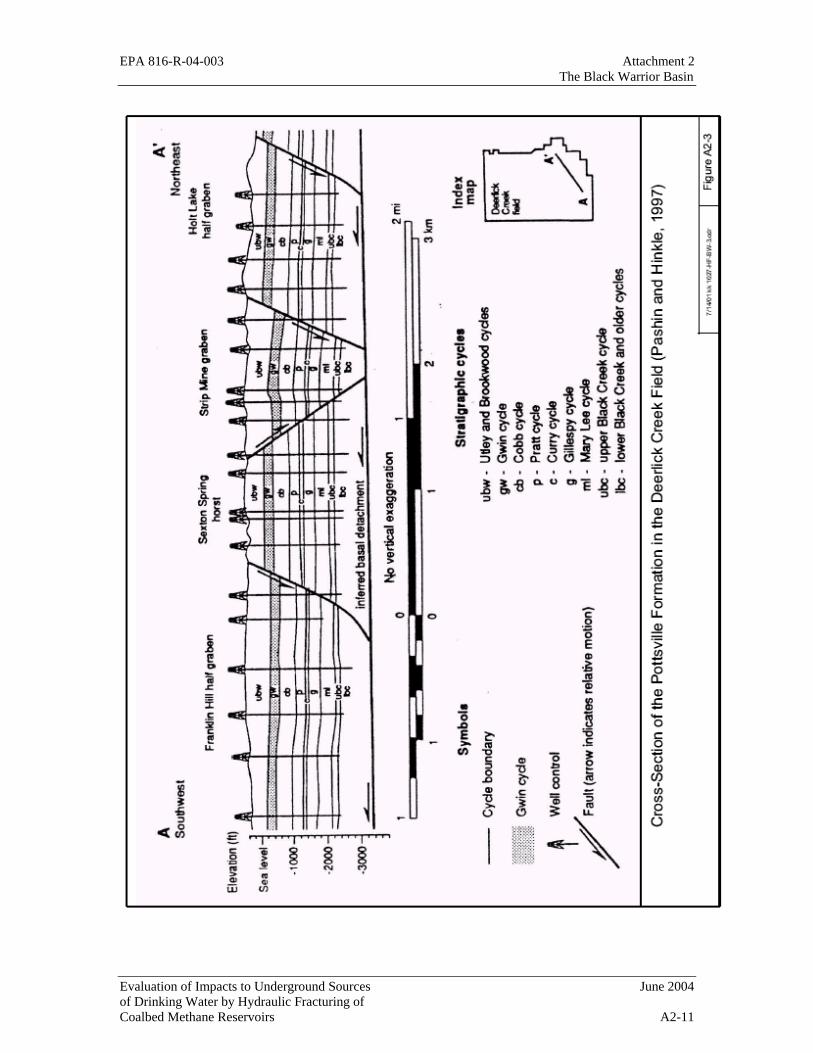
EPA 816-R-04-003 Attachment 2 The Black Warrior Basin
Evaluation of Impacts to Underground Sources June 2004of Drinking Water by Hydraulic Fracturing ofCoalbed Methane Reservoirs A2-11

EPA 816-R-04-003 Attachment 2 The Black Warrior Basin
Evaluation of Impacts to Underground Sources June 2004of Drinking Water by Hydraulic Fracturing ofCoalbed Methane Reservoirs A2-12

EPA 816-R-04-003 Attachment 2 The Black Warrior Basin
Evaluation of Impacts to Underground Sources June 2004of Drinking Water by Hydraulic Fracturing ofCoalbed Methane Reservoirs A2-13

EPA 816-R-04-003 Attachment 2 The Black Warrior Basin
Evaluation of Impacts to Underground Sources June 2004of Drinking Water by Hydraulic Fracturing ofCoalbed Methane Reservoirs A2-14

EPA 816-R-04-003 Attachment 2 The Black Warrior Basin
Evaluation of Impacts to Underground Sources June 2004of Drinking Water by Hydraulic Fracturing ofCoalbed Methane Reservoirs A2-15

EPA 816-R-04-003 Attachment 2 The Black Warrior Basin
Evaluation of Impacts to Underground Sources June 2004of Drinking Water by Hydraulic Fracturing ofCoalbed Methane Reservoirs A2-16

EPA 816-R-04-003 Attachment 2 The Black Warrior Basin
Evaluation of Impacts to Underground Sources June 2004of Drinking Water by Hydraulic Fracturing ofCoalbed Methane Reservoirs A2-17

EPA 816-R-04-003 Attachment 2 The Black Warrior Basin
Evaluation of Impacts to Underground Sources June 2004of Drinking Water by Hydraulic Fracturing ofCoalbed Methane Reservoirs A2-18

EPA 816-R-04-003 Attachment 2 The Black Warrior Basin
Evaluation of Impacts to Underground Sources June 2004of Drinking Water by Hydraulic Fracturing ofCoalbed Methane Reservoirs A2-19

EPA 816-R-04-003 Attachment 2 The Black Warrior Basin
Evaluation of Impacts to Underground Sources June 2004of Drinking Water by Hydraulic Fracturing ofCoalbed Methane Reservoirs A2-20
REFERENCES
AAPG = American Association of Petroleum GeologistsSPE = Society of Petroleum Engineers
Alabama Oil and Gas Board, 2001. Alabama OGB staff, personal communication.
Alabama Oil and Gas Board, 2002. Public Comment OW-2002-0002-0029 to “DraftEvaluation of Impacts to Underground Sources of Drinking Water by HydraulicFracturing of Coalbed Methane Reservoirs.” Federal Register. Vol. 63, No. 185.p. 33992, September 24, 2002
Carrol, R.E., Pashin, J.C., and Kugler, R.L. 1993. Burial history and source rockcharacteristics of Mississippian and Pennsylvanian strata, Black Warrior Basin,Alabama. Alabama Geological Society Guidebook, pp. 79-88.
Diamond, W.P. 1987a. Underground observations of mined-through stimulationtreatments of coalbeds. Quarterly Review of Methane from Coal SeamsTechnology. v. 4, n. 4 (June 1987), pp. 19-29.
Diamond, W.P., 1987b, Characterization of fracture geometry and roof penetrationsassociated with stimulation treatments in coalbeds; Proceedings of the 1987Coalbed Methane Symposium, University of Alabama (Tuscaloosa), p. 243.
Diamond, W.P. and D.C. Oyler. 1987. Effects of stimulation treatments on coalbeds andsurrounding strata, evidence from underground observations. US Department ofInterior, RI9083, USBM, pp. 1-47.
Eble, C.F., Gastaldo, R.A., Demko, T.M., Liu, Y. 1991. Coal compositional changesalong a swamp interior to swamp margin transect in the Mary Lee coalbed,Warrior Basin, Alabama USA. Proceedings of the Eighth Annual Meeting of theSociety for Organic Petrology, pp. 3-8.
Ellard, J.S., Roark, R.P., and Ayers, W.B. 1992. Geologic controls on coalbed methaneproduction: an example from the Pottsville formation, Black Warrior Basin,Alabama USA. Symposium on Coalbed Methane Research and Development inAustralia. James Cook University, p. 45-61.
Ely, J.W., Zubitowski, R.L., and Zuber, M.D. 1990. How to develop a coalbed methaneprospect: a case study of an exploratory five-spot well pattern in the WarriorBasin, Alabama. Proceedings, 1990 Society of Petroleum Engineers AnnualTechnical Conference and Exhibition (Production Operations and Engineering),pp. 487-496.

EPA 816-R-04-003 Attachment 2 The Black Warrior Basin
Evaluation of Impacts to Underground Sources June 2004of Drinking Water by Hydraulic Fracturing ofCoalbed Methane Reservoirs A2-21
Gas Research Institute (GRI), 1995, Fracturing Experience at the Rock Creek MultipleCoal Seams Project; Topical Report, prepared by S.W. Lambert, J.L. Saulsberry,P.F. Steidl, M.W. Conway, and S.D. Spafford, July 1995.
Gas Technology Institute (GTI) Web site, 2002. Drilling and Production Statistics forMajor US Coalbed Methane and Gas Shale Reservoirs.http://www.gastechnology.org
Hanson, M.E., Neilsen, P.E., Sorrels, G.G., Boyer, C.M., and Schraufnagel, R.A. 1987.Design, execution, and analysis of a stimulation to produce gas from thin multiplecoal seams. SPE Paper No. 16860, Proceedings, 1987 Society of PetroleumEngineers Annual Technical Conference and Exhibition.
Heckel, P.H. 1986. Sea-level curve for Pennsylvanian eustatic transgressive-regressivedepositional cycles along mid-continent outcrop belt, North America. Geology,14:330-334.
Hill, David. 2001. Gas Technology Institute (GTI). Expert peer-review panelist, personalcommunication.
Holditch, S.A., Ely, J.W., Semmelbeck, M.E., Carter, R.H., Hinkle, J., and Jeffrey, R.G.1989. Enhanced recovery of coalbed methane through hydraulic fracturing. SPEPaper No. 18250, Proceedings 1988 SPE Annual Technical Conference andExhibition (Production Operations and Engineering), p. 689.
Holditch, S.A 1990. Completion methods in coal seam reservoirs. SPE Paper No.20670. Proceedings 1990 SPE Annual Technical Conference and Exhibition(Production Operations and Engineering), pp. 533-542.
Holditch, S.A., 1993. Completion methods in coal-seam reservoirs. Journal of PetroleumTechnology, March 1993.
Horsey, C.A. 1981. Depositional environments of the Pennsylvanian Pottsvilleformation in the Black Warrior Basin of Alabama. Journal of SedimentaryPetrology, 51:799-806.
Hunt, A.M. and Steele, D.J. 1992. Coalbed methane technology development in theAppalachian Basin. Quarterly Review of Methane from Coal Seams Technology,pp. 15-17 (April).
Jones, A.H., Bell, G.J., and Morales, R.H. 1987. The influence of coal fines/chips on thebehavior of hydraulic fracture stimulation treatments. Proceedings of 1987Coalbed Methane Symposium, University of Alabama (Tuscaloosa), Tuscaloosa,pp. 93-102.

EPA 816-R-04-003 Attachment 2 The Black Warrior Basin
Evaluation of Impacts to Underground Sources June 2004of Drinking Water by Hydraulic Fracturing ofCoalbed Methane Reservoirs A2-22
Jones, A.H., and Schraufnagel, R.A. 1991. In-situ stress variations in the Black WarriorBasin. Proceedings of 1991 Coalbed Methane Symposium, University ofAlabama (Tuscaloosa), Tuscaloosa, p. 75.
Koenig, R.A. 1989. Hydrologic characterization of coal seams for optimum dewateringand methane drainage. Quarterly Review of Methane from Coal SeamsTechnology, 7:30-33.
Lambert, S.W., Graves, S.L., and Jones, A.H. 1989. Warrior basin drilling andstimulation. Oil and Gas Journal, p.19 (October 9, 1989).
Morales, R, H, McLennan, J.D., Jones, A.H., and Schraufnagel, R.A. 1990.Classification of treating pressures in coal fracturing. Proceedings of the 31st U.S.Symposium on Rock Mechanics, 31, pp. 687-694.
Naceur, K.B. and Touboul, E., 1990, Mechanisms controlling fracture height growth inlayered media; SPE Production Engineering, v.5 n.2 (May 1990), pp. 142-150.
O’Neil, P.E., Harris, S.C., Drottar, K.R., Mount, D.R, Fillo, J.P., and Mettee, M.F., 1989,Biomonitoring of a produced water discharge from the Cedar Cove degasificationfield, Alabama; Alabama Geological Society, Bulletin 135, 195 pp.
O’Neil, P.E., Harris, S.C., Mettee, M.F., Shepard, T.E., and McGregor, S.W., 1993,Surface discharge of produced waters from the production of methane from coalseams in Alabama; Alabama Geological Society, Bulletin 155, 259 pp.
Ortiz, I., Weller, T.F., Anthony, R.V., Frank, J., and Nakles, D., 1993, Disposal ofproduced waters: underground injection option in the Black Warrior basin;Proceedings 1993 Coalbed Methane Symposium, University of Alabama(Tuscaloosa), pp. 339-364.
Palmer, I.D., Davids, M.W., and Jeu, S.F. 1989. Analysis of unconventional behaviorobserved during coalbed fracturing treatments. Proceedings 1989 CoalbedMethane Symposium, University of Alabama (Tuscaloosa).
Palmer, I.D. and Sparks, D.P. 1990. Measurement of induced fractures by downhole TVcamera in coalbeds of the Black Warrior Basin. Society of Petroleum EngineersPaper No. 20660, Proceedings, 1990 Society of Petroleum Engineers AnnualTechnical Conference and Exhibition, pp. 445-458.
Palmer, I.D., King, N.S., and Sparks, D.P. 1991a. The character of coal fracturetreatments in Oak Grove field. Black Warrior Basin, SPE Paper No. 22914,Proceedings, 1991 Society of Petroleum Engineers Annual Technical Conferenceand Exhibition, pp.277-286.

EPA 816-R-04-003 Attachment 2 The Black Warrior Basin
Evaluation of Impacts to Underground Sources June 2004of Drinking Water by Hydraulic Fracturing ofCoalbed Methane Reservoirs A2-23
Palmer, I.D., Fryar, R.T., Tumino, K.A., and Puri, R. 1991b. Comparison between gel-fracture and water-fracture stimulations in the Black Warrior Basin. Proceedings1991 Coalbed Methane Symposium, University of Alabama (Tuscaloosa), pp.233-242.
Palmer, I.D., Fryar, R.T., Tumino, K.A., and Puri, R. 1991c. Water fracs outperform gelfracs in coalbed pilot. Oil and Gas Journal, pp.71-76 (August 12, 1991).
Palmer, I.D., King, N.S., and Sparks, D.P. 1993a. The character of coal fracturetreatments in the Oak Grove field, Black Warrior Basin. In Situ, Journal of CoalResearch, 17(3):273-309.
Palmer, I.D., Lambert, S.W., and Spitler, J.L. 1993b. Coalbed methane well completionsand stimulations. Chapter 14 of AAPG Studies in Geology 38, pp. 303-341.
Pashin, J.C., 1994, Coal body geometry and syn-sedimentary detachment folding in theOak Grove coalbed methane field, Black Warrior basin, Alabama; AAPGBulletin, v. 78, pp. 960-980.
Pashin, J.C., Ward, W.E., Winston, R.B., Chandler, R.V., Bolin, D.E., Richter, K.E.,Osborne, W.E, and Sarnecki, J.C. 1991. Regional analysis of the Black Creek-Cobb coalbed methane target interval, Black Warrior Basin, Alabama. AlabamaGeological Survey Bulletin 145, 127pp.
Pashin, J.C. and Hinkle, F. 1997. Coalbed Methane in Alabama. Geological Survey ofAlabama Circular 192, 71pp.
Reeves, S.R., Wallaca, J.A., and Beavers, W.M., 1987, The influences of reservoirproperties and geologic setting on coal bed fracturing and production. SPE Paper16423, Proceedings, SPE/DOE Symposium on Gas Production from LowPermeability Reservoirs.
Robb, J.C. and Spafford, S.D., 1991, Stimulations without proppant and resultingproduction from four wells completed in the Pratt coal group near depths of 500feet; Proceedings 1991 Coalbed Methane Symposium, University of Alabama(Tuscaloosa) (Tuscaloosa), pp. 381-389.
Saulsberry, J.L., Schraufnagel, R.A., and Jones, A.H. 1990. Fracture height growth andproduction from multiple reservoirs. SPE Paper No. 20659, Proceedings, 1990Society of Petroleum Engineers Annual Technical Conference and Exhibition, pp.433-443.

EPA 816-R-04-003 Attachment 2 The Black Warrior Basin
Evaluation of Impacts to Underground Sources June 2004of Drinking Water by Hydraulic Fracturing ofCoalbed Methane Reservoirs A2-24
Schraufnagel, R.A., Spafford, S.D., and Saulsberry, J.L. 1991. Multiple seamcompletion and production experience at Rock Creek, Alabama. Proceedings1991 Coalbed Methane Symposium, University of Alabama (Tuscaloosa), pp.211-221.
Schraufnagel, R.A., Spafford, S.D., and Conway, M.W. 1993. Restimulation techniquesto improve fracture geometry and overcome damage. Proceedings, GasTechnology Symposium, pp. 611-625.
Simonson, E.R., Abou-Sayed, A.S., Clifton, R.J., 1978, Containment of massivehydraulic fractures; SPE Journal, February 1978, pp. 27-32.
Spafford, S.D. 1991. Stimulating multiple coal seams at Rock Creek with accessrestricted to a single seam. Proceedings 1991 Coalbed Methane Symposium,University of Alabama (Tuscaloosa), p. 243.
Spafford, S.D, Saulsberry, J.L., and Scraufnagel, R.A. 1993. Field verification offracture height growth associated with a restricted-access completion.Proceedings 1993 Coalbed Methane Symposium, University of Alabama(Tuscaloosa), pp. 139-144.
Steidl, P.F., 1991, Inspection of induced fractures intercepted by miningin the Warriorbasin, Alabama; Proceedings 1991 Coalbed Methane Symposium, University ofAlabama (Tuscaloosa), pp. 181-191.
Teufel, L.W. and Clark, J.A. 1981. Hydraulic fracture propagation in layered rock:experimental studies of fracture containment. SPE Paper No. 9878, Proceedingsof the DOE/SPE Symposium: Gas Production from Low Permeability Reservoirs.
Wright, C.A. 1992. Effective design, real-data analysis, and post-job evaluation ofhydraulic fracturing treatments. Methane from Coal Seams Technology Journal,pp. 29-32 (July).
Young, G.B., Paul, G.W., Saulsberry, J.L., and Schraufnagel, R.A. 1993.Characterization of coalbed reservoirs at the Rock Creek project site, Alabama.Proceedings 1993 Coalbed Methane Symposium, University of Alabama(Tuscaloosa), pp. 705-714.
Zuber, M.D., Kuuskraa, V.A., and Sawyer, W.K. 1990. Optimizing well spacing andhydraulic fracture design for economic recovery of coalbed methane. SPEFormation Evaluation, 5(1): 98-102.

EPA 816-R-04-003 Attachment 3The Piceance Basin
Evaluation of Impacts to Underground Sources June 2004of Drinking Water by Hydraulic Fracturing of Coalbed Methane Reservoirs A3-1
Attachment 3The Piceance Basin
The Piceance Coal Basin is entirely within the northwest corner of Colorado. (Figure A3-1). The coalbed methane reservoirs are found in the Upper Cretaceous MesaverdeGroup, which covers about 7,225 square miles and ranges in thickness from about 2,000feet on the west to about 6,500 feet on the east side of the basin (Johnson, 1989). It isestimated that 80 trillion to 136 trillion cubic feet (Tcf) of gas are contained in coalbedswithin the basin (Tyler et al., 1998). Total coalbed methane production was 1.2 billioncubic feet in 2000 (GTI, 2002).
3.1 Basin Geology
The Piceance is a northwest trending asymmetrical, Laramide-age basin in the RockyMountain foreland with gently dipping western and southwestern flanks and a sharplyupturned eastern flank (Figure A3-1) (Tremain and Tyler, 1997). The Douglas CreekArch bounds the basin on the northwest, and separates it from the Uinta Coal Basin,which lies almost entirely in Utah. The Mesaverde Group is sharply upturned to nearvertical along the Grand Hogback, which forms the eastern boundary of the basin andseparates the basin from the White River uplift to the east. Most of the Piceance Basin’scoal deposits are contained in the Iles and Williams Fork Formations of the LateCretaceous Age Mesaverde Group, which are approximately 100 to 65 million years inage (McFall et al., 1986). These formations composed of sandstone and shale, weredeposited in a series of regressive marine environments (McFall et al., 1986; Johnson,1989). It is believed that the coals were deposited in marine transitional, brackish,interdistributary marshes and freshwater deltaic swamps (Collins, 1976 in McFall et al.,1986). Figure A3-2 presents a stratigraphic section shown with a gamma ray-inductionlog from the Barrett 1-27 Arco Deep well (Reinecke et al., 1991). The Mesaverde Groupis underlain by the marine Mancos Shale and overlain by the lower Tertiary Age FortUnion and Wasatch Formations, which consist of fluvial sandstones and shales. TheMancos Shale, Fort Union, and Wasatch Formations are essentially barren of coals(McFall et al., 1986). Depths to the coal-bearing sediments vary from outcrops aroundthe margins of the basin (Figure A3-1) to more than 12,000 feet in the deepest part of thebasin (Tyler et al., 1996).
The major fold structure of the Piceance Basin is the Grand Hogback Monocline, formedas the White River Uplift was uplifted and thrust westward during the Laramide Orogenyin Late Cretaceous through Eocene time (McFall et al., 1986). Broad folds, such as theCrystal Creek and Rangley Syncline, trend northwest to southeast, and generally parallelto the axis of the basin (Figure A3-1). Intrusions occur throughout the southeast part ofthe basin, locally elevating coal ranks to as high as anthracite grade. A buried laccolith

EPA 816-R-04-003 Attachment 3The Piceance Basin
Evaluation of Impacts to Underground Sources June 2004of Drinking Water by Hydraulic Fracturing of Coalbed Methane Reservoirs A3-2
intrusion is thought to be present under a coal basin anticline along the southeast marginof the basin (Figure A3-1) where high quality coking coal was mined since the 1800s(Collins, 1976).
Coalbed methane reservoirs occur exclusively in the Upper Cretaceous Mesaverde Group(Figure A3-2), which covers an area of approximately 7,255 square miles (Tremain andTyler, 1997). Depths to the Mesaverde Group range from outcrop to greater than 12,000feet along the axis of the basin (Tyler et al., 1996; Tremain and Tyler, 1997). Two-thirdsof the coalbed methane occurs in coals deeper than 5,000 feet, making the Piceance Basinone of the deepest coalbed methane areas in the United States (Quarterly Review, August1993).
The major coalbed methane target, the Cameo-Wheeler-Fairfield coal zone (Figure A3-3), is contained within the Williams Fork Formation of the Mesaverde Group and holdsapproximately 80 to 136 Tcf of coalbed methane (Tyler et al., 1998). This coal zoneranges in thickness from 300 to 600 feet, and lies more than 6,000 feet below the groundsurface over a large portion of the basin (Tyler et al., 1998). Individual coal seams of upto 20 to 35 feet thick can be found within the group, with net coal thickness of theWilliams Fork Formation averaging 80 to 150 feet thick. In 1991, at the Grand Valleyfield (Figure A3-4), there were 23 coalbed methane wells and 18 conventional gas wells(Reinecke et al., 1991). However, in 1984, most wells at the Rulison field (Figure A3-4)were conventional gas wells.
Initially, it was anticipated that coalbed methane wells in the sandstones and coals of theCameo Zone would have high production rates of water. However, testing later showedthat they produced very little water (Reinecke et al., 1991). Both the sandstones andcoalbeds are tight, poorly permeable, and are generally saturated with gas rather thanwater or a mixture of water and gas. The dynamic flow of a hydrologic system enhancesthe collection of gas in traps, but in much of the Piceance Basin that flow is not presentbecause of the over-pressuring and saturation with gas.
Consequently, the conventional models for coalbed methane accumulation developed forother basins do not apply well for exploration and development in the Piceance Basin.Tyler et al. (1996) concluded, “very low permeability and extensive hydrocarbonoverpressure indicate that meteoric recharge, and, hence, hydropressure, is limited to thebasin margins and that long-distance migration of groundwater is controlled by faultsystems.” Recharge is limited along the eastern and northeastern margins of the basinbecause of offsetting faults, but zones of transition between hydropressure andhydrocarbon overpressure in the western part of the basin and on the flanks of the DivideCreek Anticline in the southeastern part of the basin may possess better coalbed methanepotential, as indicated by the exploration targets delineated in Tyler et al. (1998) (FigureA3-5).

EPA 816-R-04-003 Attachment 3The Piceance Basin
Evaluation of Impacts to Underground Sources June 2004of Drinking Water by Hydraulic Fracturing of Coalbed Methane Reservoirs A3-3
3.2 Basin Hydrology and USDW Identification
The Piceance Basin contains both alluvial and bedrock aquifers. Unconsolidated alluvialaquifers are the most productive aquifers in the Piceance Basin. These alluvial depositsare narrow, and thin deposits of sand and gravel formed primarily along stream courses.The City of Meeker, Colorado is supplied by wells tapping these deposits where they areover 100 feet thick in the White River Valley (Taylor, 1987).
The most important bedrock aquifers are known as the upper and lower Piceance Basinaquifer systems. These consolidated rock aquifers are lower Tertiary Eocene in age andoccur within and above the large oil shale reserves. The upper and lower aquifers areseparated by the Mahogany Zone of the Parachute Creek Member (Figure A3-6). TheMahogany Zone is a poorly permeable oil shale, which retards water movement but doesnot stop it. Both bedrock aquifers overlie the older Cretaceous Mesaverde Group wherethe coal and coalbed methane are located.
The upper aquifer system is about 700 feet thick and consists of several permeable zonesin the Eocene Uinta Formation and the upper part of the Parachute Creek Member of theEocene Green River Formation. Sub-aquifers of the Uinta Formations are silty sandstoneand siltstone, while those of the Parachute Creek Member of the Green River Formationare fractured dolomite marlstone. There is some primary porosity (i.e., the porositypreserved from during or shortly after sediment deposition, such as the spaces betweengrains) in the sandstone and the permeability of the sub-aquifers has been enhanced bynatural fracturing that occurred during post-deposition deformation. Layers between theindividual sub-aquifers are less permeable than the sub-aquifers themselves, but they donot prevent water movement between the sub-aquifers.
The lower aquifer system is about 900 feet thick and consists of a fractured dolomiticmarlstone of part of the lower Parachute Creek Member of the Green River Formation. Itis semi-confined below the Mahogany Zone and above the Garden Gulch Member of theGreen River Formation and a high resistivity zone just above it (USGS, 1984 and Taylor,1987) (Figure A3-6). Fracturing during deformation of the rocks and subsequent solutionenlargement owing to dissolution of soluble evaporite minerals has increasedpermeability of this lower aquifer system.
Groundwater is recharged from snowmelt on high ground from where it travels downthrough the upper aquifer system, the Mahogany Zone, and into the lower aquifer system.The groundwater then moves laterally and/or upward discharging from both the upperand lower aquifer systems into streams (Figure A3-7). The minerals nahcolite(NaHCO3), dawsonite (NaAl(OH)2CO3) and halite (NaCl) are present in the groundwater,and the circulation of the groundwater (with these minerals in solution) has causedenlargement of the natural fractures (Taylor, 1987). Water in the lower aquifer isreported to contain several hundred milligrams per liter (mg/L) of chloride (Taylor,1987).

EPA 816-R-04-003 Attachment 3The Piceance Basin
Evaluation of Impacts to Underground Sources June 2004of Drinking Water by Hydraulic Fracturing of Coalbed Methane Reservoirs A3-4
Wells in these two bedrock aquifer systems, the upper and lower Piceance Basin aquifers,typically range in depth from 500 to 2,000 feet and commonly produce between 2 to 500gallons per minute of water (USGS, 1984). These Tertiary bedrock aquifers arestratigraphically separated from the base of the Cameo Coal Zone in the CretaceousMesaverde Group by from less than 1,500 feet of strata along the Douglas Creek Arch tomore than 11,000 feet along the basin trough just west of the Grand Hogback (Johnsonand Nuccio, 1986) (Figure A3-2).
Aquifer maps do not exist for the Piceance Basin, but water quality in the Piceance Basinis poor owing to nahcolite (sodium bicarbonate) deposits and salt beds within the basin(Graham, 2001). Only very shallow waters such as those from the surficial Green RiverFormation are used for drinking water (Graham, CDWR, 2001). In general, the potablewater wells in the Piceance Basin extend no further than 200 feet in depth, based on wellrecords maintained by the Colorado Division of Water Resources (CDWR). At least twowells in the area are approximately 1,000 feet in depth, but they are used for stockwatering. A composite water quality sample taken from 4,637 to 5,430 feet deep withinthe Cameo Coal Group in the Williams Fork Formation exhibited a total dissolved solid(TDS) level of 15,500 mg/L, which is above the 10,000 TDS water quality criterion for aunderground source of water (USDW) (Graham, CDWR, 2001). The produced waterfrom coalbed methane extraction in the Piceance Basin is of such low quality that it mustbe disposed of in evaporation ponds or re-injected into the formation from which it cameor at even greater depths (Tessin, 2001).
It is unlikely that any USDWs and coals targeted for methane production would coincidein this basin. These targeted coals are generally located at great depth, of at least 4,000feet. The thousands of feet of stratigraphic separation between the coal gas bearingCameo Zone and the lower aquifer system in the Green River Formation should preventany of the effects from the hydrofracturing of gas-bearing strata from reaching either theupper or the lower bedrock aquifers.
Permeability of the coal and the surrounding sandstone and shale is generally quite lowexcept near outcrop, creating little potential for these rocks to contain a USDW.Researchers (Reinecke et al., 1991) report that the permeability of gas-bearing coal andsandstone of the Cameo Zone is so low that the gas is over-pressured and has forcedgroundwater out of the zone, a condition that tends to disfavor the entrapment ofmethane. Tyler et al. (1998) state that high coalbed methane gas productivity requiresgeologic and hydrologic conditions, and that these conditions are not optimal throughoutmuch of the Piceance Basin because of the absence of dynamic groundwater flow and thelow permeability of the host rocks.
The above conditions prevail in the central part of the basin, previously favored as acoalbed methane development fairway, and heavily targeted for exploration (Nowak,1991). However, analyses by Tyler et al. (1998) suggest that a transitional zone, betweenthe deeply buried coal and the outcrops at the boundaries of the basin, where groundwater

EPA 816-R-04-003 Attachment 3The Piceance Basin
Evaluation of Impacts to Underground Sources June 2004of Drinking Water by Hydraulic Fracturing of Coalbed Methane Reservoirs A3-5
circulation may be sufficient to create more favorable trapping conditions (Figure A3-5),may be a better target area for coalbed methane production exploration. Theseexploration target zones could possibly have sufficient meteoric groundwater circulationto meet the water quality criterion of USDWs. However, Figure A3-3 shows that thedepths to coals in the targeted methane producing zones (Figure A3-5) are greater than4,000 feet below ground surface and therefore, are not likely to contain water that wouldmeet the USDW quality criterion of less than 10,000 mg/L TDS. Currently, test-drillinginformation is insufficient to determine if this is the case. Nevertheless, due to the verylow permeability, great depth, and expected poor water quality of the targeted coalbedmethane producing zones, conflicts with USDWs are considered to be of very lowprobability.
3.3 Coalbed Methane Production Activity
Measurements of coal permeabilities in the Piceance Basin have shown that the deepcoals typical of the basin are much less permeable than coals in top-producing coalbedmethane basins such as the San Juan Basin in Colorado (Quarterly Review, 1993).Consequently, operators rely on large hydraulic fractures to produce coalbed methanefrom the deep, low permeability coals (Quarterly Review, 1993).
Exploration for coalbed methane began in the basin during the early 1980s, but viablecommercial production did not begin until 1989 (Quarterly Review, 1993). The first wellto commercially produce coalbed methane from the Piceance Basin, Exxon’s Vega No. 2well in Mesa County, went off-line in 1983 (Quarterly Review, 1993). AmocoProduction Company attempted multi-well coalbed methane development in the late1980s, and finally ceased activity in 1989. Commercial production was finally achievedin 1989 in the Parachute fields operated by Barrett Resources. Barrett Resources drilled68 wells in 1990 and had planned for 22 more in 1991 (Western Oil World, 1991). Thewells targeted both coals and sandstone within the Cameo Coal Zone and the Mesaverdesandstones, just above the Cameo coals. Other operators soon followed suit, includingFuelco at White River Dome field in the northern part of the basin (Figure A3-1),Conquest Oil Company near Barretts Resource’s production in the central part of thebasin, Chevron USA Inc., and many others. However, not all operators were successfulin locating or producing coalbed gas. Ultimately, Barrett found the sandstones to be farmore productive than the coalbeds, and attempts to complete wells in the coalbeds werelargely abandoned.
According to the Colorado Geological Survey (2002), some operators are having successin their pilot coalbed methane production program in White River Dome Field northwestof Meeker. Their success is attributed to the extensive natural fracturing found in thecoal seams at White River Dome. Fracturing may be particularly extensive as a result ofthe formation of the White River anticline and the proximity to the large Danforth HillsMesaverde outcrop. As a result, operators are taking another look at coalbed methane

EPA 816-R-04-003 Attachment 3The Piceance Basin
Evaluation of Impacts to Underground Sources June 2004of Drinking Water by Hydraulic Fracturing of Coalbed Methane Reservoirs A3-6
development in the Piceance Basin. In addition, one of the operators is drilling (but notfracturing) horizontal wells in the coal seams to take advantage of the anomalous naturalfracturing found at White River Dome field. In some areas of coalbed methane potential,horizontal well technology may replace hydraulic fracturing as a method to enhancecoalbed methane well performance.
Within the Cameo Coal Zone, Barrett Resources typically used 3,000 to 3,500 barrels ofgelled 2% potassium chloride water with 273,000 to 437,000 pounds of sand over amaximum 450 feet of the Cameo Coal Zone to stimulate coalbed methane wells(Quarterly Review, 1993). It was shown that these hydraulic stimulations created short(100-foot), multiple fractures around the wells (Quarterly Review, August 1993). FuelResources Development Company used 3,000 to 10,000 barrels of gelled water and200,000 to 1,300,000 pounds of sand to fracture their wells in the White River DomeField (Quarterly Review, 1993). All but one of Conquest Oil Company’s wells washydraulically fractured with 1,500 barrels of water or cross-linked gel and 31,000 to230,000 pounds of regular or resin-coated sand (Quarterly Review, 1993).
3.4 Summary
The Piceance Basin shows promise as a source for coalbed methane production based onthe estimated 80 to 136 Tcf of gas contained within the Cameo-Wheeler-Fairfield coalzone (Tyler et al., 1998). However, overall low permeabilities as well as great depths tocoalbeds appear to have slowed coalbed methane development in the basin.Nevertheless, a pilot program in White River Dome Field has had success in coalbedmethane production, attributable primarily to the extensive natural fracturing in the area.As a result, operators are taking another look at coalbed methane development in thisbasin.
Hydraulic fracturing is the common method used to extract coalbed methane. Drilling ofhorizontal wells in the coal seams is a method that is being evaluated in the White RiverDome Field pilot project as an alternative to hydraulic fracturing. In some areas ofcoalbed methane potential, horizontal well technology may replace hydraulic fracturingas a method to enhance coalbed methane performance.
The fluids used for fracturing vary from water with sand proppant to gelled water andsand. Between 1,500 to more than 11,000 feet of strata separate the coals from theshallow USDWs, indicating that the potential for water quality contamination fromhydraulic fracturing techniques is minimal. The only hydraulic fracturing fluidcontamination pathway to the USDWs might be through faults or fractures extendingbetween the deep coal layers and the shallow aquifers. The occurrence of these fracturesand faults has not been substantiated in any of the literature examined for thisinvestigation.

EPA 816-R-04-003 Attachment 3The Piceance Basin
Evaluation of Impacts to Underground Sources June 2004of Drinking Water by Hydraulic Fracturing of Coalbed Methane Reservoirs A3-7
Research suggests that exploration may target areas where groundwater circulation mayenhance gas accumulation in the coal and associated sandstones (Tyler et al., 1998).Under these exploration and development conditions, a USDW located in shallowerCretaceous rocks near the margins of the basin, could be affected by hydraulic fracturing.The depth to methane-bearing coals (about 6,000 feet) seems to indicate that, in thePiceance Basin, the chances of contaminating any overlying, shallower USDWs (nodeeper than 1,000 feet) from injection of hydraulic fracturing fluids and subsequentsubsurface fluid transport are minimal. Potable wells in the Piceance Basin generallyextend no further than 200 feet in depth. The coalbed methane producing Cameo Zoneand the deepest known aquifer, the lower bedrock aquifer, have a stratigraphic separationof over 6,000 feet.

EPA 816-R-04-003 Attachment 3The Piceance Basin
Evaluation of Impacts to Underground Sources June 2004of Drinking Water by Hydraulic Fracturing of Coalbed Methane Reservoirs A3-8

EPA 816-R-04-003 Attachment 3The Piceance Basin
Evaluation of Impacts to Underground Sources June 2004of Drinking Water by Hydraulic Fracturing of Coalbed Methane Reservoirs A3-9

EPA 816-R-04-003 Attachment 3The Piceance Basin
Evaluation of Impacts to Underground Sources June 2004of Drinking Water by Hydraulic Fracturing of Coalbed Methane Reservoirs A3-10

EPA 816-R-04-003 Attachment 3The Piceance Basin
Evaluation of Impacts to Underground Sources June 2004of Drinking Water by Hydraulic Fracturing of Coalbed Methane Reservoirs A3-11

EPA 816-R-04-003 Attachment 3The Piceance Basin
Evaluation of Impacts to Underground Sources June 2004of Drinking Water by Hydraulic Fracturing of Coalbed Methane Reservoirs A3-12

EPA 816-R-04-003 Attachment 3The Piceance Basin
Evaluation of Impacts to Underground Sources June 2004of Drinking Water by Hydraulic Fracturing of Coalbed Methane Reservoirs A3-13

EPA 816-R-04-003 Attachment 3The Piceance Basin
Evaluation of Impacts to Underground Sources June 2004of Drinking Water by Hydraulic Fracturing of Coalbed Methane Reservoirs A3-14

EPA 816-R-04-003 Attachment 3The Piceance Basin
Evaluation of Impacts to Underground Sources June 2004of Drinking Water by Hydraulic Fracturing of Coalbed Methane Reservoirs A3-15
REFERENCES
Collins, B.A. 1976. Coal deposits of the Carbondale, Grand Hogback, and SouthernDanforth Hills coal fields, Eastern Piceance Basin, Colorado. Colorado School ofMines Quarterly, 71(1).
Colorado Geological Survey. 2002. Public Comment OW-2001-0002-0086 to “DraftEvaluation of Impacts to Underground Sources of Drinking Water by HydraulicFracturing of Coalbed Methane Reservoirs.” Federal Register. Vol. 63, No. 185.p. 33992, September 24, 2002.
Gas Technology Institute (GTI) Web site. 2002. Drilling and Production Statistics forMajor US Coalbed Methane and Gas Shale Reservoirs.http://www.gastechnology.org
Graham, G. 2001. Colorado Division of Water Resources. Personal communication.
Johnson, R. C., 1989. Geologic history and hydrocarbon potential of Late Cretaceous-age, low-permeability reservoirs, Piceance Basin western Colorado: U. S.Geological Survey Bulletin 1787-E, 51 p.
Johnson, R. C., and Nuccio, V. F. 1986. Structural and Thermal history of the PiceanceCreek Basin, western Colorado, in relation to hydrocarbon occurrence in theMesaverde Group: in Spencer, C. W., and Mast, R. F., eds., Geology of TightGas Reservoirs: American Association of Petroleum Geologists Studies inGeology No. 24, p. 165-205.
McFall, K.S., Wicks, D.E., Kruuskraa, V.A., and Sedwick, K.B. 1986. A geologicassessment of natural gas from coal seams in the Piceance Basin, Colorado. GasResearch Institute, Topical Report. GRI-87/0060 (September 1985-September1986), 76 p.
Nowak, Henry C. 1991. Depositional environments and stratigraphy of MesaverdeFormation, Southeastern Piceance Basin, Colorado-Implications for coalbedmethane exploration. Guidebook for the Rocky Mountain Association ofGeologists Fall Conference and Field Trip September, 17-20, 1991, RockyMountain Association of Geologists Denver, Colorado, pp. 1-20.
Quarterly Review. 1993. Coalbed Methane – State of the Industry. Methane from CoalSeams Technology, August.

EPA 816-R-04-003 Attachment 3The Piceance Basin
Evaluation of Impacts to Underground Sources June 2004of Drinking Water by Hydraulic Fracturing of Coalbed Methane Reservoirs A3-16
Reinecke, Kurt M., Rice, D. D. and Johnson, R. C. 1991. Characteristics anddevelopment of fluvial sandstone and coalbed reservoirs of Upper CretaceousMesaverde Group, Grand Valley field, Colorado. Guidebook for the RockyMountain Association of Geologists Fall Conference and Field Trip September,17-20, 1991, Rocky Mountain Association of Geologists Denver, Colorado, pp.209-225.
Taylor, O. J. 1987. Oil shale, water resources, and valuable minerals of the Piceancebasin, Colorado: The challenges and choices of development. U. S. GeologicalSurvey Professional Paper 1310, 143 p.
Tessin, Robert. 2001. Colorado Oil and Gas Conservation Commission. Personalcommunication.
Tremain, Carol M. and Tyler, R. 1997. Cleat, fracture, and stress patterns in thePiceance Basin, Colorado: Controls on coalbed methane producibility. RockyMountain Association of Geologists, Fractured Reservoirs: Characterizations andModeling Guidebook.
Tyler, R, Scott, A. R., Kaiser, W.R., Nance, H. S., McMurry, R. G., Tremain, C. M., andMavor, M. J. 1996. Geologic and hydrologic controls critical to coalbed methaneproducibility and resource assessment: Williams Fork Formation, Piceance Basin,Northwest Colorado. The University of Texas at Austin, Bureau of EconomicGeology, topical report prepared for the Gas Research Institute, GRI-95/0532,398 p.
Tyler, R., Scott, A. R. and Kaiser, W. R. 1998. Defining coalbed methane explorationfairways: An example from the Piceance Basin, Rocky Mountain Foreland.Western United States; in Mastalerz, M., and Glikson, M. eds., Coalbed Methane,Scientific, Environmental and Economic Evaluation: International Conference onCoal Seam Gas and Oil, Brisbane, Queensland, Australia, pp. 67-87.
USGS-National Water Summary. 1984. Hydrologic events, selected water-qualitytrends, and ground-water resources. United States Geological Survey Water-Supply Paper No. 2275.
Western Oil World. December 1991. Colorado-Utah coalbed methane projects multiply.
EPA 816-R-04-003 Attachment 4The Uinta Basin
Evaluation of Impacts to Underground Sources June 2004of Drinking Water by Hydraulic Fracturing ofCoalbed Methane Reservoirs A4-1
Attachment 4The Uinta Basin
The Uinta Coal Basin is located mostly within eastern Utah; a very small portion of thebasin is in northwestern Colorado (Figure A4-1). The basin covers approximately 14,450square miles (Quarterly Review, 1993) and is structurally separated from the PiceanceBasin by the Douglas Creek Arch (Figure A4-1), an up-warp near the Utah – Coloradostate line. Coalbeds are present within Cretaceous strata throughout much of the UintaBasin. However, coalbed methane exploration, to date, has targeted coalbeds in theFerron Sandstone Member of the Mancos Shale and coalbeds in the BlackhawkFormation of the Mesaverde Group. The total, in-place, coalbed gas resources in theWasatch Plateau, Emory, Book Cliffs and Sago coal fields have been estimated at 8trillion cubic feet (Tcf) to more than 10 Tcf by the Utah Geological Survey (Gloyn andSommer, 1993). This estimate is based on extrapolation of known coal resources to adepth of 9,000 feet and an average projected gas content of 330 cubic feet per ton anddoes not include the Tabby Mountain or Vernal coalfields, or the Sevier-Sanpete coalregion. Total production stood at 75.7 billion cubic feet (Bcf) of coalbed methane in2000 (GTI, 2002).
4.1 Basin Geology
Much of the Rocky Mountain region, including the Uinta Basin was covered by anepicontinental sea. Deposition in the sea lasted from the Albian (about 100 million yearsago) through the Cenonmanian (about 83 million years ago), with the deposition of theupper part of the Mesaverde Group generally marking the end of marine deposition in thebasin (Howells et al., 1987).
The Uinta Basin formed as a result of uplift and deformation that began in the LateCretaceous. The Cretaceous sediments outcrop along the perimeter of the basin. Thebasin is asymmetrical in shape with strata on the northern flank of the basin dippingsteeply toward the basin axis, while strata on the southern flank dip gently toward thebasin axis. The stratigraphic units of the coal bearing Cretaceous rocks of the UintaBasin are shown in Figure A4-2.
Two Cretaceous stratigraphic units have been targeted for coalbed methane exploration:the Ferron Sandstone Member of the Mancos Shale and the Blackhawk Formation of theMesaverde Group (Figure A4-2). The Ferron Sandstone Member was deposited in theLast Chance delta, a fluvial-deltaic environment (Garrison et al., 1997). The coalbedsand interbedded sandstone units form a wedge of clastic sediment 150 to 750 feet thickstratigraphically above the Tunuck Shale Member of the Mancos Shale and below theLower Blue Gate Shale Member of the Mancos Shale (Figure A4-2). Both of these shale

EPA 816-R-04-003 Attachment 4The Uinta Basin
Evaluation of Impacts to Underground Sources June 2004of Drinking Water by Hydraulic Fracturing ofCoalbed Methane Reservoirs A4-2
units have a very low permeability and constitute confining units for water and gas in theFerron Sandstone Member. The coal-bearing rocks are thickest to the west and southmargins of the basin, nearer to the upland sources of sediment. Coalmines producingfrom the Ferron Sandstone Member are located along the eastern boundary of theWasatch Plateau south of Castle Dale, Utah (Figure A4-1). Depths to coal in the FerronSandstone Member range from 1,000 to over 7,000 feet (Garrison et al., 1997). Primarycoalbed methane activity from the Ferron Sandstone takes place in the Drunkard’s WashUnit. Total coal thickness in this area ranges from 4 to 48 feet (averaging 24 feet) fromdepths of 1,200 to 3,400 feet (Lamarre and Burns, 1996).
The Blackhawk Formation consists of coal interbedded with sandstone and a combinationof shale and siltstone. The Blackhawk Formation is underlain by the Star PointSandstone and overlain by the Castlegate Sandstone (Figure A4-2). The CastlegateProject in the Book Cliffs coalfield initially targeted coals in the Blackhawk Formation atdepths ranging from 4,200 to 4,400 feet (Gloyn and Sommer, 1993).
4.2 Basin Hydrology and USDW Identification
Groundwater hydrology of the Uinta Basin is controlled primarily by the geologicstructure of the region (Howells et al., 1987). Variations of aquifer and aquitardpermeability owing to differences of lithology and facies changes also play an importantrole in the hydrology, as does widespread faulting and fracturing of the rocks (Howells etal., 1987). Because of the basin’s structure, the area may be a groundwater basin withinternal drainage. If there were a deep groundwater outlet for the basin, it would be alongor near the axis of the Uinta Basin at its western edge. The general pattern ofgroundwater flow is centripetal, with water flowing inward from recharge areas atexposures of permeable strata at the margins of the basin. Recharge is greatest near thenorthern edge of the basin. Other recharge areas include Eocene and OligoceneFormations in the basin interior.
Most of the sandstone formations in the Mesozoic rocks in the Upper Colorado RiverBasin are identified as aquifers by the United States Geological Survey (Freethey andCordy, 1991). Freethey and Cordy stated that in the Uinta Basin, the older and deeperaquifers in strata below the Ferron Sandstone Member, (for example, the Navajo-NuggetAquifer, Entrada-Preuss Aquifer, Morrison Aquifer, and the Dakota Aquifer) generallycontain very saline to briny water, with total dissolved solids (TDS) values greater than10,000 milligrams per liter (mg/L). The water quality component of the undergroundsource of drinking water (USDW) definition specifies that a USDW contain less than10,000 mg/L of TDS. The Ferron Sandstone Member (Figure A4-3) is designated as aproducing aquifer in east-central Utah (Freethey and Cordy, 1991). In regard to theMesaverde Group Aquifer, which includes the Star Point Sandstone, the BlackhawkFormation, the Castlegate Sandstone and the Price River Formation, (Figure A4-3)Freethey and Cordy (1991), stated that, “water in these aquifers is more likely to be

EPA 816-R-04-003 Attachment 4The Uinta Basin
Evaluation of Impacts to Underground Sources June 2004of Drinking Water by Hydraulic Fracturing ofCoalbed Methane Reservoirs A4-3
developed where the saturated thickness is large and the depth to the aquifer is less than2,000 ft.” They further stated that the margins of the Uinta Basin where these rocks arenear the surface or outcrop is a possible location for development of groundwater withlow enough TDS to be used for drinking water.
Wells in the Ferron Sandstone Member at the Drunkard’s Wash coalbed methane fieldtypically penetrate to depths ranging from 1,200 to 3,400 feet (Lamarre and Burns, 1996).An average water quality value of 13,120 mg/L TDS (Gwynn, 1998) for productionwaters that have been retained in catchment ponds suggests that these wells are not withina USDW. Gwynn (1998) however, does state that due to the ponding of the producedwater in evaporation lagoons, the concentration of salts in these waters has probablyincreased from their original levels. This implies that these water quality data may not beuseful in the confirmation of USDW qualifications. Quarterly Review (1993) reportedthat three wells producing gas and water from the Ferron Sandstone Member coalbeds inthe Drunkard’s Wash field yielded over 49,000 gallons of water per day with a TDS levelof about 5,000 mg/L (sodium bicarbonate) during the first 2 to 3 months of operation.The Ferron Sandstone is hydrologically confined above and below by shale members ofthe Mancos Shale formation. Water produced from the Ferron Sandstone is thought to beconnate water that was trapped in the sediment during coalification (Gloyn and Sommer,1993). Hunt (Utah Division of Oil, Gas, and Mining, 2001) noted that there were noUSDWs located immediately above the Ferron Sandstone Member due to the thicktongues of Mancos Shale that encapsulate the coal-bearing interval (Figure A4-2).
Beds targeted for methane gas exploration and production within the BlackhawkFormation are approximately 4,200 to 4,400 feet below the ground surface (Gloyn andSommer, 1993). Coalbed gas production in the Castlegate Field accounted for less than10 percent of the coalbed methane production in the Uinta Basin (Petzet, 1996). Theaverage gas well producing from the coalbeds in the Blackhawk Formation (Castlegatefield) yielded 318 barrels of water per day, and TDS levels of 5,489 mg/L have beenmeasured in the produced waters (Gloyn and Sommer, 1993).
According to the State of Utah Department of Natural Resources (DNR), Division of Oil,Gas and Mining, the water quality in the Ferron and Blackhawk varies greatly withlocation, each having some TDS levels below and some above 10,000 mg/L (Utah DNR,2002). In general, the quality of Blackhawk water is higher than that of Ferron water.The most recent Underground Injection Control application received for the Drunkard’sWash field (Ferron) showed a composite quality of input water to be about 31,000 mg/LTDS, and for the Castlegate field (Blackhawk) 9,286 mg/L TDS. At some locations,either formation member would not qualify as a USDW.
In the western part of the Uinta Basin, the Castlegate Sandstone, an aquifer, is separatedfrom the Black Hawk Formation coalbeds by approximately 300 feet of alternating shaleand sandstone (Utah DNR 2002). The Star Point Sandstone is located belowapproximately 400 feet of alternating sandstone and shale that underlies the bottom coal

EPA 816-R-04-003 Attachment 4The Uinta Basin
Evaluation of Impacts to Underground Sources June 2004of Drinking Water by Hydraulic Fracturing ofCoalbed Methane Reservoirs A4-4
of the Black Hawk Formation. In some areas, the shale and sandstone underlying theBlack Hawk coals are highly faulted. There is some potential that hydraulic fracturingfluids could be transported through natural fracture networks in these areas and reach theStar Point Sandstone. The relatively impermeable upper Blue Gate Shale Member of theMancos Shale Further would prevent further downward migration.
In reference to the quality of water produced by the coalbed gas wells in both the FerronSandstone Member of the Mancos Shale and the Blackhawk Formation, QuarterlyReview (1993) states: “Disposal of produced water does not appear to present a majorenvironmental problem in the Uinta basin, unlike the San Juan and some other westernbasins. Rates are moderate, 200 to 300 barrels per day per well during early stages ofproduction and TDS levels are not high (about 5,000 mg/L).” Because these TDS valuesare less than the 10,000 mg/L limit, both the Ferron Sandstone Member of the MancosShale and the Blackhawk Formation may qualify as USDWs.
Tabet (2001) suggests that coalbed methane extraction wells are not located in“producing” aquifers and that most of the potable water in the sparsely populated area issupplied by surface water and shallow alluvial aquifers.
4.3 Coalbed Methane Production Activity
Full-scale exploration in the Uinta Basin began in the 1990s (Quarterly Review, 1993).The most active operators at that time were PG&E Resources Company, the River GasCorporation, Cockrell Oil Corporation, and Anadarko Petroleum Corporation. PG&Eacquired the Castlegate Field, from Cockrell Oil (Gloyn and Sommer, 1993). Gas wasproduced from coalbeds in the Blackhawk Formation. The five wells initially drilled inthe Castlegate Field were hydraulically fractured with 80,000 to 143,000 pounds of sandand unreported volumes of fluid. Other wells were to be fractured with a low-residue gelsystem to ensure breakdown within the reservoir (Quarterly Review, 1993).
The Castlegate field was off-line due to production water disposal problems (Tabet,2001; and Hunt, Utah Division of Oil, Gas, and Mining, 2001). According, to the Stateof Utah DNR, Division of Oil, Gas and Mining, the field is now on production (UtahDNR, 2002).
The River Gas Corporation operates the Drunkard’s Wash Unit, producing methane gasfrom coals within the Ferron Sandstone Member. The company reported that highfracture gradients hampered hydraulic fracturing stimulations using cross-linked borategel with 250,000 pounds of proppant (Quarterly Review, 1993). Excessive proppantflowback resulted in one well where nitrogen foam was used for the fracturing. TheBuzzard Bench Field, also producing gas from the Ferron Sandstone Member, wasinitially operated by Chandler & Associates, Inc. (Petzet, 1996) and is currently beingmanaged by Texaco (Garrison et al., 1997).

EPA 816-R-04-003 Attachment 4The Uinta Basin
Evaluation of Impacts to Underground Sources June 2004of Drinking Water by Hydraulic Fracturing ofCoalbed Methane Reservoirs A4-5
A query of a database covering the Uinta Basin revealed that there are about 1,255coalbed methane wells in production in the basin (Osborne, 2002). Gas TechnologyInstitute (GTI) places the annual coalbed methane production in the Uinta Basin at 75.7Bcf in 2000 (GTI, 2002).
4.4 Summary
Waters from coalbed methane production in the Ferron Sandstone Member of the MancosShale in the Drunkard’s Wash Unit are conflictingly reported to have TDS values ofabout 13,000 mg/L according to one source of information or to have levels of TDS ofabout 5,000 mg/L from another. However, the higher values were derived from watersamples taken from evaporation lagoons and these high values might represent elevatedconcentrations of salts owing to evaporation. Consequently, if the more moderate TDSlevels were correct, then the Ferron Sandstone would qualify as a USDW.
According to the State of Utah DNR, Division of Oil, Gas and Mining, the water qualityin the Ferron and Blackhawk varies greatly with location, each having TDS levels belowand above 10,000 mg/L (Utah DNR, 2002). In general, the quality of Blackhawk water isfresher than Ferron water. The most recent Underground Injection Control applicationreceived for the Drunkard’s Wash field (Ferron) showed a composite quality of inputwater to be about 31,000 mg/L TDS, and for the Castlegate field (Blackhawk) 9,286mg/L TDS. At some locations, neither formation member would qualify as a USDW.
The Drunkard’s Wash and Castlegate coalbed methane extraction fields are located in asparsely populated section of Utah. Tabet (Utah Geological Survey, 2001) suggests thatcoalbed gas extraction wells are not located in “producing” aquifers and that most of thepotable water in the sparsely populated area is supplied by surface water and shallowalluvial aquifers.
The Blackhawk Formation is underlain by 300 feet of shale and sandstone that separate itfrom the Castlegate Sandstone aquifer. It is underlain by similar geologic strata, whichseparate it for the Star Point Sandstone. Only in highly faulted areas is there a reasonablepossibility that hydraulic fracturing fluids could migrate down to the Star PointSandstone.

EPA 816-R-04-003 Attachment 4 The Uinta Basin
Evaluation of Impacts to Underground Sources June 2004 of Drinking Water by Hydraulic Fracturing of Coalbed Methane Reservoirs A4-6

EPA 816-R-04-003 Attachment 4 The Uinta Basin
Evaluation of Impacts to Underground Sources June 2004 of Drinking Water by Hydraulic Fracturing of Coalbed Methane Reservoirs A4-7

EPA 816-R-04-003 Attachment 4The Uinta Basin
Evaluation of Impacts to Underground Sources June 2004of Drinking Water by Hydraulic Fracturing ofCoalbed Methane Reservoirs A4-8

EPA 816-R-04-003 Attachment 4The Uinta Basin
Evaluation of Impacts to Underground Sources June 2004of Drinking Water by Hydraulic Fracturing ofCoalbed Methane Reservoirs A4-9
REFERENCES
Freethey and Cordy, 1991. Geohydrology of Mesozoic Rocks in the Upper ColoradoRiver Basin in Arizona, Colorado, New Mexico, Utah, and Wyoming. UnitedStates Geological Survey Professional Paper 1411-C
Garrison, James R., Jr. (non-survey author), van den Bergh, T.C.V. (non-survey author),Barker, Charles E., Tabet, David E. (non-survey author). 1997. Depositionalsequence stratigraphy and architecture of the Cretaceous Ferron Sandstone;implications for coal and coalbed methane resources; a field excursion. Link,Paul Karl (non-survey editor), Kowallis, Bart J. (non-survey editor), Mesozoic toRecent geology of Utah, Geology Studies, 42(2): 155-202.
Gloyn, Robert W. and Sommer, Steven N. 1993. Exploration for coalbed methane gainsmomentum in Uinta Basin. Utah Geological Survey, Oil & Gas Journal,Exploration, pp. 73-76, May 31, 1993.
Gas Technology Institute (GTI) website. 2002. Drilling and Production Statistics forMajor US Coalbed Methane and Gas Shale Reservoirs.http://www.gastechnology.org
Gwynn, J. Wallace. November 1998. Potential mineral precipitation and watercompatibilities related to the Drunkards Wash Project, Carbon County, Utah.Report of Investigation 241, Utah Geological Survey.
Howells, Lewis, Longson, Mark S., and Hunt, Gilbert L. 1987. Base of moderatelysaline groundwater in the Uinta Basin, Utah, with an introductory sectiondescribing the methods used in determining its position. State of Utah,Department of Natural Resources, Technical Publication No. 92, U.S. GeologicalSurvey Open-File Report 87-394, 1987.
Hunt, Gill. January 2001. Utah Division of Oil, Gas and Mining, Salt Water DisposalUnit. Personal communication.
Lamarre, Robert A. and Burns, Terry D. 1996. Drunkard’s Wash Unit: Coalbedmethane production from ferron coals in East-Central, Utah. GSA Abstracts withPrograms, p. A-58.
Osborne, Paul. 2002. USEPA Region VIII UIC Program. Personal communication.
Petzet, G. Alan. 1996. Utah coalbed gas exploration poised for growth. Oil & GasJournal, Exploration, p. 54, August 5, 1996.

EPA 816-R-04-003 Attachment 4The Uinta Basin
Evaluation of Impacts to Underground Sources June 2004of Drinking Water by Hydraulic Fracturing ofCoalbed Methane Reservoirs A4-10
Quarterly Review. 1993. Coalbed methane – state of the industry. Quarterly Review,1993.
Tabet, D. January 2001. Utah Geological Survey, Personal communication.
Utah Department of Natural Resources. 2002. Public Comment OW-2001-0002-0090 to“Draft Evaluation of Impacts to Underground Sources of Drinking Water byHydraulic Fracturing of Coalbed Methane Reservoirs.” Federal Register. Vol.63, No. 185. p. 33992, September 24, 2002.

EPA 816-R-04-003 Attachment 5The Powder River Basin
Evaluation of Impacts to Underground Sources Junes 2004of Drinking Water by Hydraulic Fracturing ofCoalbed Methane Reservoirs A5-1
Attachment 5The Powder River Basin
The Powder River Basin is located in northeastern Wyoming and southern Montana. Thebasin covers an area of approximately 25,800 square miles (Larsen, 1989), approximately75 percent of which is within Wyoming (Figure A5-1). Fifty percent of the basin (FigureA5-2) is believed to have the potential for production of coalbed methane (Powder RiverCoalbed Methane Information Council, 2000). Much of the coalbed methane-relatedactivity has been north and south of Gillette in northeastern Wyoming (Figure A5-2).The majority of the potentially productive coal zones range from about 450 feet to over6,500 feet below ground surface (Montgomery, 1999). In addition to being an importantresource for coalbed methane, the basin has also produced coal, petroleum, conventionalnatural gas, and uranium oxide (Law et al., 1991; Randall, 1991). Recent estimates ofcoalbed methane reserves in the Powder River Basin have been as much as 40 trillioncubic feet (Tcf) (PRCMIC, 2000) but more conservative estimates range from 7 to 12 Tcf(Montgomery, 1999). Annual production volume was estimated at 147 billion cubic feet(Bcf) in 2000 (GTI, 2002). In 2002, wells in the Powder River Basin produced about 823million cubic feet (Mcf) per day of coalbed methane (DOE, 2002).
The information available indicates that hydraulic fracturing currently is not widely usedin this region due to concerns about the potential for increased groundwater flow into thecoalbed methane production wells and collapse of open hole wells in coal upondewatering. According to the available literature, where hydraulic fracturing has beenused in this basin, it has not been an effective method for extracting methane.
5.1 Basin Geology
The Powder River Basin is a thick sequence of sedimentary rock formed in a largedownwarp within the Precambrian basement. The basin is bounded on the east by theBlack Hills uplift, on the west by the Big Horn uplift and Casper Arch, on the south bythe Laramie and Hartville uplifts and, on the north, it is separated from the WillistonBasin by the Miles City Arch and the Cedar Creek Anticline (Larsen, 1989) (Figure A5-1). The long axis of the basin is aligned in a generally southeast to northwest direction,and it is as much as 18,000 feet deep (Randall, 1991) (Figures A5-1 and A5-3).Sediments range from Paleozoic at the bottom through Mesozoic to Tertiary at the top(DeBruin et al., 2000). The basin is a large asymmetrical syncline with its axis (deepestpart) near the west side of the basin (Figure A5-3). From outcrops along the eastern edgeof the basin, the sediments slope gently (1.5o, about 100 feet per mile) downward to thesouthwest and then bend steeply upward (10 to 45o) to outcrop in a monocline along thewestern edge of the basin.
Several periods of deposition by marine and fluvial-deltaic processes have occurredwithin the basin during the Cretaceous and Tertiary periods. These Cretaceous and lower
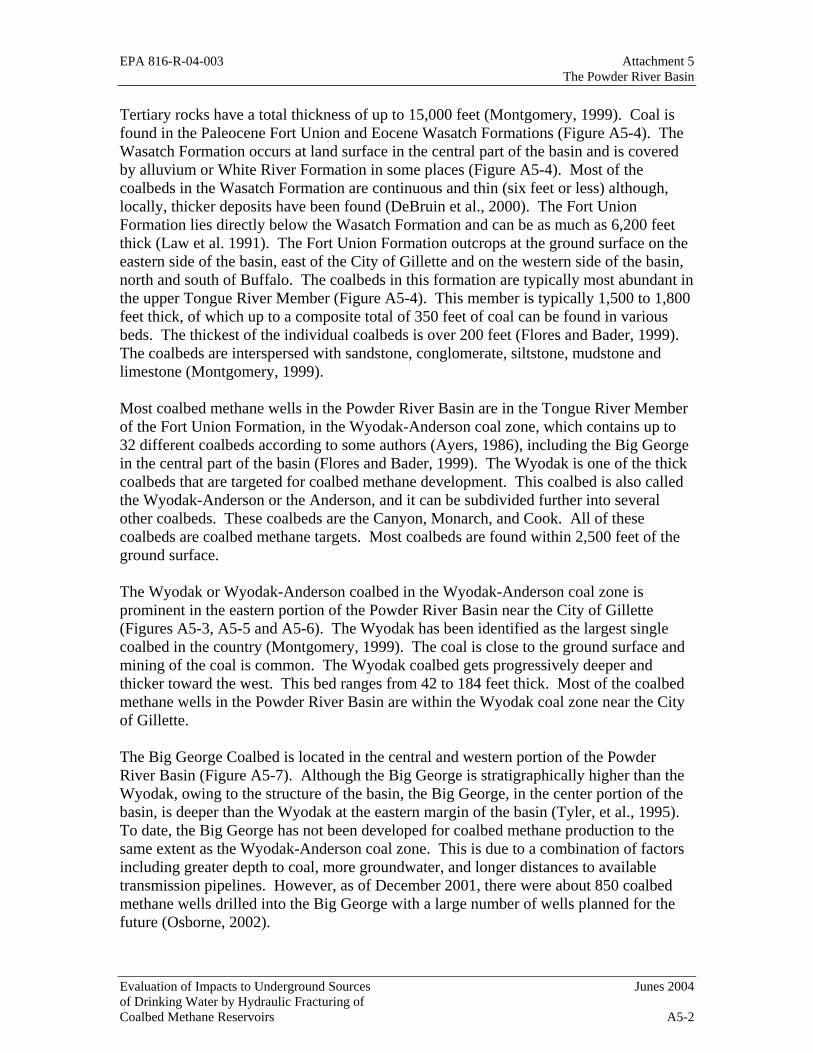
EPA 816-R-04-003 Attachment 5The Powder River Basin
Evaluation of Impacts to Underground Sources Junes 2004of Drinking Water by Hydraulic Fracturing ofCoalbed Methane Reservoirs A5-2
Tertiary rocks have a total thickness of up to 15,000 feet (Montgomery, 1999). Coal isfound in the Paleocene Fort Union and Eocene Wasatch Formations (Figure A5-4). TheWasatch Formation occurs at land surface in the central part of the basin and is coveredby alluvium or White River Formation in some places (Figure A5-4). Most of thecoalbeds in the Wasatch Formation are continuous and thin (six feet or less) although,locally, thicker deposits have been found (DeBruin et al., 2000). The Fort UnionFormation lies directly below the Wasatch Formation and can be as much as 6,200 feetthick (Law et al. 1991). The Fort Union Formation outcrops at the ground surface on theeastern side of the basin, east of the City of Gillette and on the western side of the basin,north and south of Buffalo. The coalbeds in this formation are typically most abundant inthe upper Tongue River Member (Figure A5-4). This member is typically 1,500 to 1,800feet thick, of which up to a composite total of 350 feet of coal can be found in variousbeds. The thickest of the individual coalbeds is over 200 feet (Flores and Bader, 1999).The coalbeds are interspersed with sandstone, conglomerate, siltstone, mudstone andlimestone (Montgomery, 1999).
Most coalbed methane wells in the Powder River Basin are in the Tongue River Memberof the Fort Union Formation, in the Wyodak-Anderson coal zone, which contains up to32 different coalbeds according to some authors (Ayers, 1986), including the Big Georgein the central part of the basin (Flores and Bader, 1999). The Wyodak is one of the thickcoalbeds that are targeted for coalbed methane development. This coalbed is also calledthe Wyodak-Anderson or the Anderson, and it can be subdivided further into severalother coalbeds. These coalbeds are the Canyon, Monarch, and Cook. All of thesecoalbeds are coalbed methane targets. Most coalbeds are found within 2,500 feet of theground surface.
The Wyodak or Wyodak-Anderson coalbed in the Wyodak-Anderson coal zone isprominent in the eastern portion of the Powder River Basin near the City of Gillette(Figures A5-3, A5-5 and A5-6). The Wyodak has been identified as the largest singlecoalbed in the country (Montgomery, 1999). The coal is close to the ground surface andmining of the coal is common. The Wyodak coalbed gets progressively deeper andthicker toward the west. This bed ranges from 42 to 184 feet thick. Most of the coalbedmethane wells in the Powder River Basin are within the Wyodak coal zone near the Cityof Gillette.
The Big George Coalbed is located in the central and western portion of the PowderRiver Basin (Figure A5-7). Although the Big George is stratigraphically higher than theWyodak, owing to the structure of the basin, the Big George, in the center portion of thebasin, is deeper than the Wyodak at the eastern margin of the basin (Tyler, et al., 1995).To date, the Big George has not been developed for coalbed methane production to thesame extent as the Wyodak-Anderson coal zone. This is due to a combination of factorsincluding greater depth to coal, more groundwater, and longer distances to availabletransmission pipelines. However, as of December 2001, there were about 850 coalbedmethane wells drilled into the Big George with a large number of wells planned for thefuture (Osborne, 2002).

EPA 816-R-04-003 Attachment 5The Powder River Basin
Evaluation of Impacts to Underground Sources Junes 2004of Drinking Water by Hydraulic Fracturing ofCoalbed Methane Reservoirs A5-3
A third significant coal zone, the Lake De Smet coal zone in the Wasatch Formation, isup to 200 feet thick and is located in the Lake De Smet area (Figure A5-8), 55 milessouthwest of Recluse on the western side of the basin (Larsen, 1989). It has not yet beenwidely used for coalbed methane production.
Most of the coal in the Powder River Basin is subbituminous in rank, which is indicativeof a low level of maturity. Some lignite, lower in rank, has also been identified. Thethermal content of the coals found in the Powder River Basin is typically 8,300 Britishthermal units per pound (Randall, 1991). Coal in the Powder River Basin was formed atrelatively shallow depths and relatively low temperatures. Most of the methanegenerated under these conditions is biogenic, which means that it was formed by bacterialdecomposition of organic matter. Thermogenic formation (formed under hightemperature) was not significant in most locations within the Powder River Basin.Consequently, coal in the Powder River Basin contains less methane per unit volume thanmany other coal deposits in other parts of the country. Coal in the Powder River Basinhas been found to contain 30 to 40 standard cubic feet of methane per ton of coalcompared to 350 standard cubic feet of methane per ton in other areas (DeBruin et al.,2000). The gas is typically more than 95 percent methane, the remainder being mostlynitrogen and carbon dioxide. This resource was overlooked for many years because itwas thought to be too shallow for the production of significant amounts of methane(Petzet, 1997). However, the relatively low gas content of Powder River Basin coal iscompensated by the thickness of the coal deposits. Because of the thickness of thedeposits and their accessibility, commercial development of the coalbed methane hasbeen found to be economical.
The Powder River Basin contains approximately 60 percent of the coalbed methanereserves in the State of Wyoming (DeBruin et al., 2000). Recent estimates of coalbedmethane reserves in the Powder River Basin have been as much as 40 Tcf (PRCMIC,2000) but more conservative estimates range from 7 to 12 Tcf (Montgomery, 1999). Asof December 1999, monthly production exceeded 7 Bcf from 1,657 wells (DeBruin et al.,2000). Wells typically produce 160,000 cubic feet of gas per day (DeBruin et al., 2000).Annual production volume was estimated at 147 Bcf in 2000 (GTI, 2002). In 2002, wellsin the Powder River Basin produced about 823 Mcf per day of coalbed methane (DOE,2002). Coalbed methane has been developed along both the east and west flanks of thebasin where the coalbeds are buried but relatively shallow. Many existing wells areawaiting connection to the distribution system and still more wells are being drilled. Theestimated lifetime production from these wells is 300 to 400 Mcf per well (Petzet, 1997).
The amount of coalbed methane produced from each well is highly variable, and thevolume of gas depends on the quality and thickness of the coal, the frequency of naturalcleats in the coal, and the amount of water present. Other factors, such as wellcompletion techniques and well stimulation techniques, also control the amount of gasproduced from a well. Maximum coalbed methane flow from a well is typically achievedafter one to six months of dewatering (Montgomery, 1999). Stable production is usuallyexperienced for one to two years before production begins to decline (Montgomery,

EPA 816-R-04-003 Attachment 5The Powder River Basin
Evaluation of Impacts to Underground Sources Junes 2004of Drinking Water by Hydraulic Fracturing ofCoalbed Methane Reservoirs A5-4
1999). Production often declines at a rate of 20 percent per year until the well is nolonger economically useful (Montgomery, 1999). Several options exist at that point,including re-fracturing the well, completing the well in a deeper coal formation,converting the well to a water supply well, or abandoning the well.
5.2 Basin Hydrology and USDW Identification
A report prepared by the United States Geological Survey (USGS) showed that samplesof water co-produced from 47 coalbed methane wells in the Powder River Basin all hadtotal dissolved solids (TDS) levels of less than 10,000 milligrams per liter (mg/L) (Riceet al., 2000). Based on the water quality component of the underground source ofdrinking water (USDW) definition, which specifies that a USDW contain less than10,000 mg/L of TDS, the Fort Union Formation coalbeds are within a USDW. The waterproduced by coalbed methane wells in the Powder River Coal Field commonly meetsdrinking water standards, and production waters such as these have been proposed as aseparate or supplemental source for municipal drinking water in some areas (DeBruin etal., 2000). Sandstones in the sediments both above and below the coalbeds are alsoaquifers.
In 1990, Wyoming withdrew an average of 384 million gallons per day of groundwaterfor a variety of purposes, the majority of which was agriculture. Approximately 13percent was used for potable water supplies. Approximately 22 percent was withdrawnby industry and mining (Brooks, 2001). The proportion of this 22 percent attributable tocoalbed methane production is increasing rapidly, and a concern exists that such goodquality water in a semiarid region should be conserved (Quarterly Review, 1993). In1990, before the rapid expansion of coalbed methane extraction in the region, CampbellCounty was identified by the USGS as an area of major groundwater withdrawal.
Approximately 80 percent of Wyoming residents rely on groundwater as their drinkingwater source (Powder River Basin Resource Council, 2001). Few public water supplysystems exist in the Powder River Basin due to relatively low population densities. TheCity of Gillette, the largest in the major coalbed methane development area (Figure A5-2), uses groundwater from two sources identified as “in-town wells”, and the “MadisonWell Field”. The city has experienced considerable drawdown and reduced productionfrom their in-town wells that are completed in the Fort Union and Lance/Fox Hillsaquifers (Brooks, 2001). It is unclear how much of the drawdown is attributable towithdrawals for water supply as a consequence of population growth and how much isattributable to nearby coalbed methane production. Between 1995 and 1998, the cityrestored and/or replaced several of its wells. The Madison Well Field produces waterfrom the Madison Formation and is approximately 60 miles east of the city. There are nocoalbed methane wells in the vicinity of the Madison Well Field (Brooks, 2001).
Regional groundwater flow in the basin is reported to be toward the northwest (Martin etal., 1988 in Law, 1991), with recharge occurring in the east along the Rochelle Hills.

EPA 816-R-04-003 Attachment 5The Powder River Basin
Evaluation of Impacts to Underground Sources Junes 2004of Drinking Water by Hydraulic Fracturing ofCoalbed Methane Reservoirs A5-5
Cleats and other fractures within the coalbeds create high hydraulic conductivities andfacilitate the flow of groundwater and high water production within the coalbeds(Montgomery, 1999). The coalbeds are largely hydraulically confined by underlyingshale and by basinward pinch-out. Surficial water and rainwater can enter the Fort Unioncoals from land surface at the eastern edge of the basin and at the Black Hills uplift. Thisflow inward from outcrop areas at higher elevations on the edge of the basin may havecreated artesian conditions in the deeper central portions of the basin. However, thisview may not be entirely correct. For example, coalbed research (Law et al., 1991)hypothesizes that the sodium bicarbonate water in the Fort Union coal near the centralpart of the basin may not be derived from meteoric recharge, but rather from interstitialwaters of the original peat deposits. Furthermore, Martin et al. (1988, as cited in Law etal., 1991) concluded on the basis of isotopic composition of water samples that only partof the water near outcrops was of meteoric origin. Although artesian pressure in thecenter of the basin has been thought to be evidence that the center of the basin is fed frommeteoric recharge at the basin margins, the apparent artesian pressure (flowing wells)could be explained by the airlift effect of methane coming out of solution within therising well water column.
Because the coalbeds are productive aquifers, they also require more dewatering ofcoalbed methane wells for methane production. Groundwater production, in terms ofvolume of water produced, was a major factor considered in the selection of sites forearly coalbed methane wells and may still guide development of sites in some parts of thePowder River Basin. Wells in the eastern portion of the basin have been found to containless water due to their location above the water table within the eastern anticlinal updip ofthe formation and, in some areas, due to the presence of nearby mines that dewater theaquifer. Drawdowns of up to 80 feet have been measured in wells near active mines;however, water levels have been reported to be unaffected at distances of more than threemiles from mines (Randall, 1991). The Bureau of Land Management in conjunction withthe State Engineer’s Office has been conducting ongoing research on the effects ofcoalbed methane production on drawdown (Wyoming Geological Association, 1999).
5.3 Coalbed Methane Production Activity
Coalbed methane activity in Wyoming occurs predominantly in Campbell, Sheridan andJohnson Counties (DeBruin, 2001). Wells are spaced from 40 to 80 acres per well, asdetermined by the State. Permits are required under both state water well regulations andstate gas well regulations before drilling can commence. A discharge permit from theWyoming Department of Environmental Quality is also required for the water that isremoved from the well. Coalbed methane production wells in the Powder River Basinare typically 400 to 1,500 feet deep and can be as shallow as 150 feet (PRCMIC, 2000).By comparison, conventional gas and oil wells installed in the area are typically4,000 to 12,000 feet deep (PRCMIC, 2000). Plans for construction of approximately4,000 new coalbed methane production wells in the Montana portion of the Powder RiverBasin await completion of an in-depth environmental study (DeBruin, 2001).

EPA 816-R-04-003 Attachment 5The Powder River Basin
Evaluation of Impacts to Underground Sources Junes 2004of Drinking Water by Hydraulic Fracturing ofCoalbed Methane Reservoirs A5-6
Commercial development of methane directly from the coal seams began approximatelyin 1986. There were only 18 wells producing coalbed methane in the Powder RiverBasin by 1989. The number grew slowly through the early 1990s with 171 wellsproducing approximately 8 Bcf of gas per year. The rate of development of the resourceaccelerated greatly from 1997 to 1999. In 1999, there were 1,657 coalbed methane wellsoperating in the Powder River Basin, producing approximately 58 Bcf per year (FigureA5-9) of coalbed methane. As of November 2000, there were about 4,270 wells inWyoming producing 15 Bcf of coalbed methane in that month alone (Osborne, 2002).By November 2001, monthly coalbed methane production had climbed to 23.5 Bcf from7,870 producing wells in Wyoming (Osborne, 2002). In Montana, 246 active wellsproduced 872,008 Mcf of coalbed methane in December, 2001 (Osborne, 2002). ThePowder River Basin has become the most active coalbed methane exploration andproduction area in the country (DeBruin et al., 2000). Despite all of the activity, less than5 percent of the land underlain by coal in the Powder River Basin had been explored forthe presence of coalbed methane as of the year 2000 (PRCMIC, 2000).
During the early years of coalbed methane development in the Powder River Basin(1980s to early 1990s), gas exploration and development companies completed wellswith and without hydraulic fracture techniques. Larsen (1989) indicated that early wellswere completed without fracturing treatments, particularly wells targeting gas reserves incoals interspersed between sandstone layers. However, the Quarterly Review (1989)reported that in one well, Rawhide 15-17, located north of Gillette, Wyoming, an “openfrac” hydraulic fracturing was performed using 13,000 lbs of 12/20-mesh sand in 3,500gallons of gelled water. Several wells installed in the early 1990s by Betop, Inc. werefractured using 4,000 to 15,000 gallons of a solution with 2 percent potassium chloride(KCl) in water. Sand was used to prop the fractures open in five of these wells (QuarterlyReview, 1993). However, hydraulic fracturing experienced little success in this basin.Fractured wells produced poorly because the permeable, shallow subbituminous coalscollapsed under the pressure of the overburden after they were dewatered (Lyman, 2001).
The Powder River Basin contains coals of high permeability. The permeability is so highin many areas that drilling fluid (typically water) is lost when drilling the coalbeds.Many times drilling mud is substituted to prevent loss of circulation (DeBruin, 2001).Because of this high permeability, most coalbed wells in the Fort Union Formation canbe drilled and completed without the use of hydraulic fracturing (DeBruin, 2001;Quarterly Review, 1993). This has been confirmed by USGS officials in Wyoming(Brooks, 2001). Hydraulic fracturing is also avoided to prevent fracturing ofimpermeable formations adjacent to the coal, such as shales, that prevent the migration ofgroundwater. It is thought that fracturing the shale would increase the amount of waterflowing into the wells. When fracturing has been done, it has been with water orsand/water mixtures. Unspecified “modest” improvements in coalbed methane gas flowhave been observed (Quarterly Review, 1993).
In the Powder River Basin, two different coalbed methane sources are commonlydeveloped: (1) gas extraction from methane-charged dry sand layers overlying or

EPA 816-R-04-003 Attachment 5The Powder River Basin
Evaluation of Impacts to Underground Sources Junes 2004of Drinking Water by Hydraulic Fracturing ofCoalbed Methane Reservoirs A5-7
interbedded with the coals, and (2) conventional methane extraction from the watersaturated coal seams. In the eastern (up dip) portion of the basin, the coals in theWyodak-Anderson seam are relatively shallow and interbedded with sands (Montgomery,1999) (Figure A5-6). In up dip areas above the water table, wells require minimaldewatering for coalbed methane production because there is little to no water in the sands(Quarterly Review, 1989; Montgomery, 1999). Coal mining operations near Gillettehave lowered the water table in the vicinity of the mines, thereby dewatering nearbycoalbeds and allowing desorption of methane gas from the coal. The sands are penetratedusing open-hole techniques, generally without any fracture treatments (Quarterly Review,1989). Further west, down dip (Figure A5-6), the coalbed methane producing sands andcoals of the Fort Union Formation are separated from the overlying Wasatch Formationby a poorly permeable shale of limited areal extent (Quarterly Review, 1989; QuarterlyReview, 1993). Further west, down dip (Figure A5-6) in this more water-saturated partof the basin, coalbed methane wells are also completed as open-hole wells.
The practice of open-hole drilling is commonly used in this region. In this practice, aportion of the borehole in the coal is drilled without any casing or well screen. Mostother regions of the country where coalbed methane is recovered use a perforated casingthroughout the target coal interval. The open coal zone is then cleaned out with water,and the surrounding coal formation is sometimes fractured to improve recovery of themethane. A submersible pump is set at the bottom of the target zone with tubing to theground surface to remove groundwater from the well. The methane gas travels up thespace between the water tubing and the casing. The well is capped to control the flow ofmethane gas. Wells are often dewatered for several months before producing optimalquantities of methane gas.
Side jetting has also been performed with some success; however, dynamic open-holecavitation had not been attempted as of 1993. Side jetting is the process by which waterand air are injected at high pressure to enlarge the boring in the coal seam. The cavitationprocess uses dynamic pressure changes to break apart the coal and to widen the boringwithin in the coal seam (Quarterly Review, 1993).
Production of coalbed methane from water-saturated coalbeds below the water table firstrequires partial dewatering of the coal to allow desorption of methane from the coal.Production from water-bearing coal seams can yield significant volumes of water;enough to make it difficult or infeasible to dewater the formation sufficiently to initiatecoalbed methane flow (Montgomery, 1999). Tests on 11 wells reported by Crockett(2000) indicate that coalbed methane is desorbed from coal as a consequence ofdecreased hydrostatic pressure caused by pumping groundwater. One well starteddesorbing at 92 percent of the original reservoir pressure. “Most drilling to date hasattempted to remain near or above the existing water table to minimize water production”(Montgomery, 1999). Modifications to well spacing and pumping configuration havebeen cited by Montgomery (1999) as showing some promise for allowing greaterproduction from the water-saturated coal seams in the future. Because the water in thedeeper coal seams may be original interstitial water, and recharge from meteoric water

EPA 816-R-04-003 Attachment 5The Powder River Basin
Evaluation of Impacts to Underground Sources Junes 2004of Drinking Water by Hydraulic Fracturing ofCoalbed Methane Reservoirs A5-8
might not be an important factor (Montgomery, 1999), dewatering of these coals for thepurposes of coalbed methane production might become economically feasible.
Disposal of water produced by coalbed methane wells is an issue at many well locations.Coalbed methane wells are generally pumped constantly, removing as much as 168,000gallons per day of water from deeper formations (Randall, 1991). Averages of 17,000gallons per day per well are more common (Powder River Basin Resource Council,2001). Water produced during the dewatering of coalbed wells is generally discharged tostock ponds, water impoundments (reservoirs), drainages with ephemeral and intermittentstreams, and surface waters. A National Pollution Discharge Elimination System permitis required for surface discharge of production water. The water is generally of potablequality in the center of the basin, becoming more saline to the north and south. It issometimes used for irrigation and watering livestock (DeBruin, 2001). TDS levels aretypically less than 5,000 parts per million. The water’s salt content is primarily sodiumbicarbonate (Quarterly Review, 1993). Average analytical results from 47 USGS waterquality analyses of untreated, co-produced water from coalbed methane wells in thePowder River Basin are displayed in Table A5-1 below.
Table A5-1. Average Water Quality Results from Produced Waters (Rice et al.,2000)
Parameter Result UnitspH 7.3 N/A
temperature 19.6 oCspecific conductance 1,300 microsiemens
TDS 850 mg/Lfluoride 0.92 mg/Lchloride 13.0 mg/Lsulfate 2.4 mg/L
bromide 0.12 mg/Lalkalinity (as HCO3) 950 mg/L
ammonium 2.4 mg/Lcalcium 32 mg/L
potassium 8.4 mg/Lmagnesium 16 mg/L
sodium 300 mg/Lbarium 0.62 mg/L
iron 0.8 mg/L
As a result of the rapid growth in the coalbed methane industry, the Wyoming StateEngineer’s Office (SEO) requested funding for drilling, equipping, and monitoring ofobservation wells, and the installation of surface water measuring devices to be located incoalbed methane production areas. These monitoring facilities would become part of theSEO statewide observation well network to monitor changes in groundwater levels andstream flow over time. As of 1999, work was underway, but no report of results had yetbeen made available.

EPA 816-R-04-003 Attachment 5The Powder River Basin
Evaluation of Impacts to Underground Sources Junes 2004of Drinking Water by Hydraulic Fracturing ofCoalbed Methane Reservoirs A5-9
5.4 Summary
Based on the information for the Powder River Basin, the coalbeds that are beingdeveloped, or which may be developed, for coalbed methane in the Powder River Basinare also USDWs. Coalbeds in this basin are interspersed with sandstone and shale atvarying depths. The Fort Union Formation that supplies municipal water to the City ofGillette is the same formation that contains the coals that are developed for coalbedmethane. The coalbeds contain and transmit more water than the sandstones. Thesandstones and coalbeds have been used for both the production of water and theproduction of coalbed methane. TDS levels in the water produced from coalbeds meetthe water quality criteria for USDWs.
The information available indicates that currently hydraulic fracturing is not widely usedin this region due to concerns about the potential for increased groundwater flow into thecoalbed methane production wells and the consequent collapse of open hole wells in coalupon dewatering. According to the available literature, where hydraulic fracturing hasbeen used in this basin, it has not been an effective method for extracting methane.Hydraulic fracturing has been conducted primarily with water, or gelled water and sand,although the recorded use of a solution of KCl was identified in the literature.

EPA 816-R-04-003 Attachment 5The Powder River Basin
Evaluation of Impacts to Underground Sources Junes 2004of Drinking Water by Hydraulic Fracturing ofCoalbed Methane Reservoirs A5-10

EPA 816-R-04-003 Attachment 5The Powder River Basin
Evaluation of Impacts to Underground Sources Junes 2004of Drinking Water by Hydraulic Fracturing ofCoalbed Methane Reservoirs A5-11

EPA 816-R-04-003 Attachment 5The Powder River Basin
Evaluation of Impacts to Underground Sources Junes 2004of Drinking Water by Hydraulic Fracturing ofCoalbed Methane Reservoirs A5-12

EPA 816-R-04-003 Attachment 5The Powder River Basin
Evaluation of Impacts to Underground Sources Junes 2004of Drinking Water by Hydraulic Fracturing ofCoalbed Methane Reservoirs A5-13

EPA 816-R-04-003 Attachment 5The Powder River Basin
Evaluation of Impacts to Underground Sources Junes 2004of Drinking Water by Hydraulic Fracturing ofCoalbed Methane Reservoirs A5-14

EPA 816-R-04-003 Attachment 5The Powder River Basin
Evaluation of Impacts to Underground Sources Junes 2004of Drinking Water by Hydraulic Fracturing ofCoalbed Methane Reservoirs A5-15

EPA 816-R-04-003 Attachment 5The Powder River Basin
Evaluation of Impacts to Underground Sources Junes 2004of Drinking Water by Hydraulic Fracturing ofCoalbed Methane Reservoirs A5-16

EPA 816-R-04-003 Attachment 5The Powder River Basin
Evaluation of Impacts to Underground Sources Junes 2004of Drinking Water by Hydraulic Fracturing ofCoalbed Methane Reservoirs A5-17

EPA 816-R-04-003 Attachment 5The Powder River Basin
Evaluation of Impacts to Underground Sources Junes 2004of Drinking Water by Hydraulic Fracturing ofCoalbed Methane Reservoirs A5-18

EPA 816-R-04-003 Attachment 5The Powder River Basin
Evaluation of Impacts to Underground Sources Junes 2004of Drinking Water by Hydraulic Fracturing ofCoalbed Methane Reservoirs A5-19
REFERENCES
Ayers, W.B. Jr. 1986. Coal Resources of the Tongue River Member, Fort UnionFormation, Powder River basin, Wyoming. Geological Survey of WyomingReport of Investigations 35, 21 p.
Brooks, Myron. 2001. (Water Resources Division, Wyoming District Office Chief)United States Geologic Survey, Wyoming. Personal communication.
Crockett, F.J. 2000. Interim Drainage Report on Coalbed Methane Development in T.43-52 N., R. 70-75 W., Campbell County Wyoming. Wyoming ReservoirManagement Group.
DeBruin, Rodney H., Oil and Gas Geologist. 2001. Wyoming State Geological Survey.Personal communication.
DeBruin, Rodney H., Lyman, Robert M., Jones, Richard W., and Cook, Lance W. 2000.Information Pamphlet 7. Wyoming State Geological Survey.
Department of Energy. 2002. Public Comment OW-2001-0002-0141 to “DraftEvaluation of Impacts to Underground Sources of Drinking Water by HydraulicFracturing of Coalbed Methane Reservoirs.” Federal Register. Vol. 63, No. 185.p. 33992, September 24, 2002.
Flores, R.M. and Bader, L.R. 1999. Fort Union Coal in the Powder River Basin,Wyoming and Montana: A synthesis. U.S. Geological Survey Professional Paper1625-A, Chapter PS, 49 p., on CD-ROM.
Gas Technology Institute (GTI) website. 2002. Drilling and Production Statistics forMajor US Coalbed Methane and Gas Shale Reservoirs.http://www.gastechnology.org
Larsen, Very E. 1989. Preliminary evaluation of coalbed methane geology and activityin the Recluse Area, Powder River Basin, Wyoming, Quarterly Review ofMethane from Coal Seams Technology, June
Law, Ben E., Rice, Dudley D., and Flores, Romeo M. 1991. Coalbed gas accumulationsin the Paleocene Fort Union Formation, Powder River Basin, Wyoming. RockyMountain Association of Geologists, Coalbed Methane.
Lyman, Bob. 2001. (Coalbed Methane Expert) Wyoming State Geological Survey.Personal communication.

EPA 816-R-04-003 Attachment 5The Powder River Basin
Evaluation of Impacts to Underground Sources Junes 2004of Drinking Water by Hydraulic Fracturing ofCoalbed Methane Reservoirs A5-20
Martin, L.J., Naftz, D.L., Lowham, H.W., and Rankl, J.C. 1988. Cumulative potentialhydrologic impacts of surface mining in the eastern Powder River structuralbasin, northeastern Wyoming. U.S. Geological Survey Water-ResourcesInvestigations Report 88-4046, 201 p.
Montgomery, Scott L. 1999. Powder River Basin, Wyoming: An expanding coalbedmethane (CBM) play. American Association of Petroleum Geologists Bulletin,(August).
Osborne, Paul. 2002. USEPA Region VIII UIC Program. Personal communication.
Petzet, G. Alan. 1997. Powder River coalbed methane output growing fast. Oil and GasJournal, March 10, 1997.
Powder River Basin Resource Council, February 15, 2001,http://www.PowderRiverBasin.org
Powder River Coalbed Methane Information Council (PRCMIC). 2000. CoalbedMethane Development Information, Sheridan Wyoming.
Quarterly Review, Methane from Coal Seams Technology. 1989. Larsen, Very E.,Preliminary evaluation of coalbed methane geology and activity in the RecluseArea, Powder River Basin, Wyoming. Methane from Coal Seams Technology,June.
Quarterly Review, Methane from Coal Seams Technology. 1993. Powder River BasinWyoming and Montana. Methane from Coal Seams Technology, August.
Randall, A.G. 1991. Shallow tertiary gas production, Powder River Basin, Wyoming.The Coalbed Methane, May 13-16, 1991.
Rice, C.A., Ellis, M.S., and Bullock, J.H., Jr. 2000. Water co-produced with coalbedmethane in the Powder River Basin, Wyoming: preliminary compositional data.U.S. Geological Survey Open-File Report 00-372.
Tyler, R., W.A. Ambrose, A.R. Scott, and W.R. Kaiser. 1995. Geologic and hydrologicassessment of natural gas from coal: Greater Green River, Piceance, PowderRiver, and Raton basins. University of Texas at Austin, Bureau of EconomicGeology, Report of Investigations 228, 219 p.
Wyoming Geological Association. 1999. Coalbed Methane & Tertiary Geology, PowderRiver Basin 50th Field Conference Guidebook.

EPA 816-R-04-003 Attachment 6 The Central Appalachian Basin
Evaluation of Impacts to Underground Sources June 2004of Drinking Water by Hydraulic Fracturing of Coalbed Methane Reservoirs A6-1
Attachment 6The Central Appalachian Coal Basin
The Central Appalachian Coal Basin is the middle basin of three basins that comprise theAppalachian Coal Region of the eastern United States. It includes parts of Kentucky, Tennessee,Virginia, and West Virginia (Figure A6-1). It covers approximately 23,000 square miles, containssix major Pennsylvanian age coal seams, and contains an estimated 5 trillion cubic feet (Tcf) ofcoalbed methane (Zebrowitz et al., 1991; Zuber, 1998). These coal seams typically containmultiple coalbeds that are widely distributed (Zuber, 1998). The coals seams, from oldest toyoungest (West Virginia/Virginia name), are the Pocahontas No. 3, Pocahontas No. 4, FireCreek/Lower Horsepen, Beckley/War Creek, Sewell/Lower Seaboard, and Iager/Jawbone(Kelafant et al., 1988). The Pocahontas coal seams include the Squire Jim and Nos. 1 to 7 andNos. 3 and 4 are the thickest and most areally extensive. The majority of the coalbed methane(2.7 Tcf) occurs in the Pocahontas seams (Kelafant et al., 1988). The highest potential formethane development is in a small, 3,000 square mile area in southwest Virginia and south centralWest Virginia, where target coal seams achieve their greatest thickness and occur at depths ofabout 1,000 to 2,000 feet (Kelafant et al., 1988). The Gas Technology Institute (GTI) reportedthat the entire basin’s annual production was 52.9 billion cubic feet (Bcf) of gas in 2000 (GTI,2002).
6.1 Basin Geology
The Central Appalachian Basin is characterized structurally by broad, open, northeast-southwesttrending folds that typically dip less than five degrees (Kelafant et al., 1988) (Figure A6-2). Theonly documented exception to this is the Pine Mountain Overthrust Block in the southeastportion of the basin (Kelafant et al., 1988). Faults and folds associated with this 25 mile-wideand 125 mile-long structural feature are more intense as evidenced by overturned beds and evenbrecciated zones in some locations (Kelafant et al., 1988). The overthrust block is believed tohave been transported about five miles from the southeast to the northwest (Kelafant et al.,1988). The two dominant joint patterns within the coals are most likely due to the basin havingundergone two distinct patterns of structural deformation. These deformations include theAppalachian Orogeny and the tectonic event associated with development of the Pine Mountainoverthrust (Kelafant et al., 1988).
The regional dip of coal-bearing Pennsylvanian strata is to the northwest at a rate of 75 feet permile (Kelafant et al., 1988). Sedimentation within the Central Appalachian Basin was influencedsomewhat by the Rome Trough, an Early Cambrian graben structure. Sediment depositionduring early Pennsylvanian time (about 320 million years ago) occurred to the southeast of theRome Trough in a rapidly but intermittently subsiding basin (Kelafant et al., 1988). As thistectonic activity began to abate in the Central Appalachian Basin, subsidence to the northeast ofthe Rome Trough began to form the Northern Appalachian Basin. However, subsidence rates in

EPA 816-R-04-003 Attachment 6 The Central Appalachian Basin
Evaluation of Impacts to Underground Sources June 2004of Drinking Water by Hydraulic Fracturing of Coalbed Methane Reservoirs A6-2
the Northern Appalachian Basin were comparatively slower, enabling the formation of moreregionally extensive coalbeds (Kelafant et al., 1988).
There are three coal-bearing formations in the Central Appalachian Basin (Kelafant et al., 1988).From deepest to shallowest, they are the Pocahontas Formation, the New River/Lee Formation,and the Kanawha/Norton Formation. Each formation [Pennsylvanian in age (approximately 320to 290 million years old)] is part of the Pottsville Group, and has varying nomenclature fromstate to state (Kelafant et al., 1988).
The Pocahontas Formation directly overlies the Mississippian Bluestone Formation, and wasdeposited in an unstable basin that was rapidly subsiding to the southeast (Kelafant et al., 1988).This is reflected in the thickness of the formation, which is thickest in the southeast and thins tothe northwest. It also thins to the south and west due to erosion caused by the basal sandstonemember of the overlying New River/Lee Formation (Kelafant et al., 1988). The PocahontasFormation reaches its maximum thickness of 750 feet near Pocahontas, Virginia (Kelafant et al.,1988). The formation consists mostly of massively bedded, medium-grained subgraywacke,which can be locally conglomeratic (Kelafant, 1988). Gray siltstones and shales are interbeddedwithin the sandstone (subgraywacke) unit, and coal seams comprise about two percent of thetotal thickness of the Pocahontas Formation (Kelafant et al., 1988).
The New River/Lee Formation conformably overlies the Pocahontas Formation in thenortheastern portions of the basin (i.e., there are no time gaps in the depositional record), butthere is an unconformity in the east-central portion of the basin (Kelafant et al., 1988). In thesouthern portion of the basin, the New River/Lee Formation unconformably overlies theBluestone Formation. It is difficult to correlate this formation across state boundaries asnomenclature varies (Kelafant et al., 1988). The overall thickness of the formation decreasesfrom east to west, with the thickest portion (1,000 feet) in parts of Virginia and West Virginia,lessening to fewer than 100 feet along the Ohio River in Kentucky (Kelafant et al., 1988).Coalbeds encountered in the New River/Lee Formation include the Fire Creek/Lower Horsepen,Beckley/War Creek, Sewell/Lower Seaboard, and the Iager/Jawbone (Kelafant et al., 1988).These coalbeds thin and pinch-out towards the south and west; therefore, there are no equivalentcoalbeds in Kentucky and Tennessee (Kelafant et al., 1988).
The Kanawha/Norton Formation varies from a maximum thickness of 2,000 feet in WestVirginia to less than 600 feet in portions of Dickenson and Wise Counties, Virginia (Kelafant etal., 1988). The formation is composed of irregular, thin- to massively-bedded subgraywackesinterbedded with shale. Several thin carbonate units also occur within the formation as well asover 40 multi-bedded coalbeds.
All coal seams within the basin occur within the Pennsylvanian Pottsville Group (Figure A6-3).Specific stratigraphic nomenclature varies from state to state within the basin. (Names used inthis summary are consistent with the West Virginia/Virginia nomenclature).

EPA 816-R-04-003 Attachment 6 The Central Appalachian Basin
Evaluation of Impacts to Underground Sources June 2004of Drinking Water by Hydraulic Fracturing of Coalbed Methane Reservoirs A6-3
The Pocahontas No. 3 coal seam ranges in depth from outcrop along the northeastern edge of thebasin to about 2,500 feet, with a thickness ranging up to seven feet (Kelafant et al., 1988).Depths to the Pocahontas No. 4 coal seam are somewhat similar to those for the Pocahontas No.3 coal seam, as the No. 4 seam overlies the No. 3 seam by roughly 30 to 100 feet. The thicknessof the No. 3 coal seam varies, with a maximum of approximately seven feet (Kelafant et al.,1988). The Fire Creek/Lower Horsepen coalbed ranges in depth from roughly 500 feet over halfof its area, to a maximum depth of approximately 1,500 feet, with a maximum thickness ofroughly six feet (Kelafant et al., 1988). The Beckley/War Creek coalbed is approximately two tofive feet thick, and reaches to a maximum depth of about 2,000 feet (Kelafant et al., 1988). TheSewell/Lower Seaboard coalbed is fairly shallow, less than 500 feet in depth over half the area itcovers, reaching to a depth over 1,000 feet in one small area. While this coal ranges in thicknessfrom two to six feet, it averages about two feet in West Virginia and one foot in Virginia(Kelafant et al., 1988). The youngest targeted coal seam, the Iaeger/Jawbone, is generally lessthan 500 feet in depth, reaching its maximum depth of over 1,000 feet in two Virginia Counties.The thickness of the Iaeger/Jawbone coal ranges from two to six feet (Kelafant et al., 1988).Figures A6-4 through A6-9 are isopach maps for the six major coal groups of the AppalachianCoal Basin (adapted from Kelafant, et al., 1988).
6.2 Basin Hydrology and USDW Identification
The primary aquifer in the Kentucky portion of the Central Appalachian Basin is aPennsylvanian sandstone aquifer underlain by limestone aquifers (National Water Summary,1984). Water wells are typically 75 to 100 feet deep in the Pennsylvanian aquifer and commonlyproduce one to five gallons per minute of water (National Water Summary, 1984). The basin islocated in a portion of the Cumberland Plateau physiographic province in Tennessee (NationalWater Summary, 1984). The primary aquifer in this area is a Pennsylvanian sandstone aquifer,comprising water-bearing sandstone and conglomerate subunits with interbedded shale and coal(National Water Summary, 1984). Water wells are typically 100 to 200 feet deep and usuallyproduce 5 to 50 gallons per minute of water (National Water Summary, 1984). In Virginia, thebasin is located in a portion of the Appalachian Plateau physiographic province. The primaryaquifer in this region is the Appalachian Plateau Aquifer, a consolidated sedimentary aquiferconsisting of sandstone, shale, siltstone, and coal (National Water Summary, 1984). Water wellsare typically 50 to 200 feet deep, and commonly produce one to 50 gallons per minute of water(National Water Summary, 1984). In West Virginia, the basin is in a portion of the AppalachianPlateaus physiographic province of that state. The primary aquifers in this area are LowerPennsylvanian aquifers, which include the Pottsville Group (National Water Summary, 1984).Wells are commonly 50 to 300 feet deep and typically produce one to 100 gallons per minute ofwater (National Water Summary, 1984).
Produced water volumes from coal seams within the Central Appalachian Basin are relativelysmall, typically only several barrels or less per day per well, with high total dissolved solid(TDS) levels, usually greater than 30,000 milligrams per liter (mg/L) (Quarterly Review, 1993).Half the states (Kentucky and Ohio) within the Central Appalachian Basin have maps to locate

EPA 816-R-04-003 Attachment 6 The Central Appalachian Basin
Evaluation of Impacts to Underground Sources June 2004of Drinking Water by Hydraulic Fracturing of Coalbed Methane Reservoirs A6-4
the undulating interface between saline and freshwater aquifers. The remaining states(Tennessee and Virginia) have no maps defining this interface. Mike Burton (2001), a geologistwith the Oil and Gas Office of the Tennessee Geology Division (TGD), reports that the state hasno data relating to coalbed methane, which suggests that little or no coalbed methane extractionoccurs inside Tennessee’s borders (Burton, 2001). Luke Ewing (Ewing, 2001) of the TGDreported that the state had no aquifer maps. Scotty Sorles (Sorles, 2001) of Tennessee’sUnderground Injection Control Program mentioned that within the state, produced water disposalmethods vary on a site-by-site basis. Depending on site characteristics, all injected waters musteither be returned to the formation from which they came, or be treated to drinking water levelsprior to injection elsewhere (Sorles, 2001).
Robert Wilson, Director of the Virginia’s Division of Gas & Oil, stated that there is no mappingprogram for underground sources of drinking water (USDWs) or for the fresh/saline groundwaterinterface in Virginia. He reported that the most potable water is found far above the coal zonesused for coalbed methane extraction, with fresh water typically found at less than 300 feet deep.He believes most drinking water in southwestern Virginia comes from wells in fractured bedrockaquifers or shallow coal aquifers, or, in some areas, directly from springs. Mr. Wilson alsostated that some coalbed methane exploration has moved to shallower coal seams. TheCommonwealth of Virginia has instituted a voluntary program concerning depths at whichhydraulic fracturing may be performed (Virginia Division of Oil and Gas, 2002). This programinvolves an operator’s determination of the elevations of the lowest topographic point and thedeepest water well within a 1,500-foot radius of any proposed extraction well (Wilson, 2001).Hydraulic fracturing should occur at least 500 feet deeper than the lower of these two points(Wilson, 2001).
According to Mr. Tony Scales of the Virginia Department of Mines, Minerals and Energy, coalseams are the most permeable layers in the geologic subsurface in Virginia. For this reason,many private wells in the coalbed methane-producing counties are finished within the coalbeds.Mr. Scales stated that impacts to water supplies have occurred if the coal seams have beenpunctured by coalbed methane well drilling. The puncture hole acts as a conduit for the flow ofwater out of the coals and into lower formations. The puncture hole also allows methane to riseup to the surface (Virginia Department of Mines, Minerals, and Energy, 2002).
The following table contains information concerning the relative locations of the base of the zoneof fresh water and potential methane-bearing coalbeds in the Central Appalachian Coal Basin.The table provides useful information that can help in determining whether coalbeds being usedor slated for methane development lie within USDWs. Note that the 10,000 mg/L level of TDSin groundwater is the water quality criterion for a USDW. The depth to the USDW will thus liewell below the fresh water/ saline water interface. The area of focus for coalbed methaneexploration in the basin only covers parts of Virginia and West Virginia (Figure A6-1). InVirginia, the depth to the base of fresh water is approximately 300 feet, whereas the depths to thebases of USDWs are greater. Thus, as can be seen in Table A6-1, methane-producing coalbedscould lie within USDWs in Virginia. West Virginia’s interface between fresh and saline water(Foster, 1980) is based on a qualitative assessment, and is estimated at 280 to 730 feet. Again,

EPA 816-R-04-003 Attachment 6 The Central Appalachian Basin
Evaluation of Impacts to Underground Sources June 2004of Drinking Water by Hydraulic Fracturing of Coalbed Methane Reservoirs A6-5
the depths to USDWs are greater, and thus the coalbeds of interest could lie within potentialUSDWs in West Virginia. Finally, in Kentucky the interface between fresh water and salinewater is based on a TDS level of 1,000 mg/L (Hopkins, 1966). Although the depths to methane-producing coalbeds in Kentucky are not listed in the Table A6-1, it is possible that, as in Virginiaand West Virginia, such depths could be lower than the base of USDWs in Kentucky.
Table A6-1. Relative Locations of USDWs and Methane-Bearing Coalbeds
6.3 Coalbed Methane Production Activity
Coalbed methane operators in the Central Appalachian Basin include Equitable Resources,CONSOL (Consolidation Coal Company), and Pocahontas Gas Partnership, all located inVirginia (Zuber, 1998). GTI reported that the entire basin’s annual production was 52.9 Bcf ofgas in 2000 (GTI, 2002).
The Nora Field in southwestern Virginia is one of the better known coalbed methane productionfields. Equitable Resources operates the Nora Field in southwestern Virginia. According to the

EPA 816-R-04-003 Attachment 6 The Central Appalachian Basin
Evaluation of Impacts to Underground Sources June 2004of Drinking Water by Hydraulic Fracturing of Coalbed Methane Reservoirs A6-6
Virginia Division of Gas and Oil, over 700 coalbed methane wells were drilled in the Nora Fieldin 2002 and more than 1,800 coalbed methane wells were drilled in southwestern Virginia’sBuchanan County (VA Division of Gas and Oil, 2002). Foam or water is used as the fracturingfluid and about 70,000 to 100,000 pounds of sand per well serve as proppant (Zuber, 1998).CONSOL and Pocahontas Gas Partnership produce coal methane from coal mine developmentsin Buchanan County, in southwestern Virginia (Zuber, 1998).
Many other smaller test projects were carried out in the basin in the 1970s, including the NewRiver Coal Company/Lick Run Mine Project, Department of Energy (DOE)/Clinchfield CoalCompany Project, U.S. Bureau of Mines (USBM)/Occidental Research/Island Creek CoalCompany Project, Gas Research Institute/Wyoming County Co-op Project, USBM Federal No. 1Project, and the Consolidation Coal Company/ Kepler Mine Project (Hunt and Steele, 1991).These projects were very small (five wells or fewer) and achieved limited success in terms ofproduction. During development of some wells in the DOE/Clinchfield Coal Company projectand the USBM Federal Project No. 1, fracture treatments “screened out” (i.e., the proppantplacement failed), affecting those coalbed methane wells’ production viability.
No coalbed methane production occurred in Tennessee between 1995 and 1997 (Lyons, 1997).Three coalbed methane wells produced gas from 1957 to 1980 in Harlan County, Kentucky, andonly one test well was in production in the early 1990s in eastern Kentucky (Lyons, 1997). TheKentucky Department of Mines and Minerals website (2002) indicated that 1,338 gas wells werein operation in Kentucky at the end of 2000, but no indication was given whether these werecoalbed methane wells or conventional gas wells.
In August 2001, EPA attended a hydraulic fracturing field visit in the Central Appalachian coalbasin in Virginia. Pocahontas Oil & Gas, a subsidiary of Consol Energy, Inc., invited EPApersonnel to a well location where a hydraulic fracturing treatment was being performed byHalliburton Energy Services, Inc. This treatment employed a variety of fluids and additives tocreate fractures in select coal seams at various depths. The main fracturing fluid was nitrogenfoam (70% nitrogen / 30% water mixture). Prior to injection of the foam, 6 barrels of 15 percenthydrochloric acid were introduced into the well to dissolve the grout surrounding the injectionperforations. Once the fracture was propagated to its maximum extent, 16/30 sand suspended ina 10-pound linear gel was injected to prop the fracture open. All the fluids and additives usedwere produced by Halliburton, including a scale inhibitor and a microbicide additive.Halliburton staff stated that typical fractures range in length from 300 to 600 feet from the wellbore in either direction, but that fractures have been known to extend from as few as 150 feet toas many as 1,500 feet in length. According to the fracturing engineer on-site, fracture widthsrange from one eighth of an inch to almost one and a half inches (Virginia Site Visit, 2001).
Once a well is drilled and fractured in Virginia, several weeks might elapse before fracturingfluid flowback is initiated because a pipeline system must be constructed to transport theproduced coalbed methane away from the well. Flowback fracturing fluids are collected in linedpits and tanks and transported off-site for disposal. The State of Virginia does not regulate theuse of any drilling or fracturing fluids (Wilson, 2001).

EPA 816-R-04-003 Attachment 6 The Central Appalachian Basin
Evaluation of Impacts to Underground Sources June 2004of Drinking Water by Hydraulic Fracturing of Coalbed Methane Reservoirs A6-7
6.4 Summary
The area with the highest potential for coalbed methane production in the Central AppalachianCoal Basin is southwestern Virginia (Dickenson and Buchanan Counties) and southern WestVirginia (Wyoming and McDowell Counties) (Figure A6-1). The coal seams achieve theirgreatest thickness in these regions and occur at depths of approximately 1,000 to 2,000 feet.Based on Table A6-1, methane-producing coal may lie within a USDW, providing the potentialfor impact of water supplies.
Hydraulic fracturing is common practice in this region. Foam and water are the fracturing fluidsof choice and sand serves as the proppant. Because most of the coal strata dip, a coalbedmethane well’s location within the basin may determine if hydraulic fracturing during the well’sdevelopment will likely affect water quality within the surrounding USDW. For instance, on thenortheastern side of the basin, the depth to the Pocahontas No. 3 coalbed is less than 500 feet.This depth increases to over 2,000 feet in the western portion of the basin, in the direction of thecoal seam dip. Therefore, a well tapping this coal seam in the western portion of the basin maybe below the base of a USDW but a well tapping this coal seam in the eastern portion of thebasin may be within a USDW. Additionally, the base of the freshwater is not a flat surface, butrather an undulating one. These factors indicate that the relationship between a coalbed and aUSDW must be determined on a site-specific basis.

EPA 816-R-04-003 Attachment 6 The Central Appalachian Basin
Evaluation of Impacts to Underground Sources June 2004of Drinking Water by Hydraulic Fracturing of Coalbed Methane Reservoirs A6-8

EPA 816-R-04-003 Attachment 6 The Central Appalachian Basin
Evaluation of Impacts to Underground Sources June 2004of Drinking Water by Hydraulic Fracturing of Coalbed Methane Reservoirs A6-9

EPA 816-R-04-003 Attachment 6 The Central Appalachian Basin
Evaluation of Impacts to Underground Sources June 2004of Drinking Water by Hydraulic Fracturing of Coalbed Methane Reservoirs A6-10

EPA 816-R-04-003 Attachment 6 The Central Appalachian Basin
Evaluation of Impacts to Underground Sources June 2004of Drinking Water by Hydraulic Fracturing of Coalbed Methane Reservoirs A6-11

EPA 816-R-04-003 Attachment 6 The Central Appalachian Basin
Evaluation of Impacts to Underground Sources June 2004of Drinking Water by Hydraulic Fracturing of Coalbed Methane Reservoirs A6-12

EPA 816-R-04-003 Attachment 6 The Central Appalachian Basin
Evaluation of Impacts to Underground Sources June 2004of Drinking Water by Hydraulic Fracturing of Coalbed Methane Reservoirs A6-13

EPA 816-R-04-003 Attachment 6 The Central Appalachian Basin
Evaluation of Impacts to Underground Sources June 2004of Drinking Water by Hydraulic Fracturing of Coalbed Methane Reservoirs A6-14

EPA 816-R-04-003 Attachment 6 The Central Appalachian Basin
Evaluation of Impacts to Underground Sources June 2004of Drinking Water by Hydraulic Fracturing of Coalbed Methane Reservoirs A6-15

EPA 816-R-04-003 Attachment 6 The Central Appalachian Basin
Evaluation of Impacts to Underground Sources June 2004of Drinking Water by Hydraulic Fracturing of Coalbed Methane Reservoirs A6-16

EPA 816-R-04-003 Attachment 6 The Central Appalachian Basin
Evaluation of Impacts to Underground Sources June 2004of Drinking Water by Hydraulic Fracturing of Coalbed Methane Reservoirs A6-17
REFERENCES
Burton, Mike. January, 2001. Tennessee Geology Division. Personal communication.
Ewing, Luke. January, 2001. Tennessee Geology Division. Personal communication.
Foster, James B. 1980. Fresh and saline ground-water map of West Virginia. U. S. GeologicalSurvey, West Virginia Geological and Economic Survey, Map WV-12.
Gas Technology Institute (GTI) website, 2002. Drilling and Production Statistics for Major USCoalbed Methane and Gas Shale Reservoirs.http://www.gastechnology.org
Hopkins, Herbert T. 1966. Fresh-saline water interface map of Kentucky. U. S. GeologicalSurvey, Kentucky Geological Survey, Series X.
Hunt, A. M., and Steele, D. J. 1991. Coalbed methane development in the Northern and CentralAppalachian Basins – past, present and future. The 1991 Coalbed Methane Symposium,The University of Alabama/Tuscaloosa, May 13-16, 1991.
Kelafant, J. R., Wicks, D. E., Kuuskraa, V. A. March, 1988. A geologic assessment of naturalgas from coal seams in the Northern Appalachian Coal Basin. Topical Report – FinalGeologic Report (September 1986 – September 1987).
Kentucky Department of Mines and Minerals website, 2002. 2000 Annual Report.http://www.caer.uky.edu/kdmm/ar00.htm
Lyons, Paul C. 1997. Central-Northern Appalachian Coalbed Methane Flow Grows. Oil & GasJuly 7, 1997, pp. 76-79.
Quarterly Review. 1993. Coalbed methane – state of the industry. Quarterly Review, August,1993.
Scales, Tony. 2001. Virginia Division of Mines, Minerals and Energy. Personalcommunication.
Sorles, Scott. February, 2001. Tennessee Underground Injection Control Program. Personalcommunication.
United States Geological Survey. 1973. State of Kentucky, 1:500,000 topographic map.

EPA 816-R-04-003 Attachment 6 The Central Appalachian Basin
Evaluation of Impacts to Underground Sources June 2004of Drinking Water by Hydraulic Fracturing of Coalbed Methane Reservoirs A6-18
United Stated Geological Survey. 1984. National Water Summary. Hydrologic events, selectedwater-quality trends, and ground-water resources. United States Geological SurveyWater-Supply Paper No. 2275.
Virginia Site Visit. 2001. EPA observed hydraulic fracturing performed by Halliburton,Inc. for Consol Energy (VA), August 9, 2001.
Virginia Division of Oil Gas & Oil. 2002. Public Comment OW-2001-0002-0084 to “DraftEvaluation of Impacts to Underground Sources of Drinking Water by HydraulicFracturing of Coalbed Methane Reservoirs.” Federal Register. Vol. 63, No. 185. p.33992, September 24, 2002.
Wilson, Robert. February, 2001. Director, Virginia Division of Gas & Oil, Department ofMines, Minerals, and Energy. Personal communication.
Zebrowitz, M. J., Kelafant, J. R., and Boyer, C. M. 1991. Reservoir characterization andproduction potential of the coal seams in Northern and Central Appalachian Basins.Proceedings of the 1991 Coalbed Methane Symposium, The University ofAlabama/Tuscaloosa, May 13-16, 1991.
Zuber, Michael D. 1998. Production characteristics and reservoir analysis of coalbed methanereservoirs. Lyons, Paul C. (editor). Appalachian coalbed methane. International Journalof Coal Geology, 38 (1-2):27-45. Meeting: Appalachian coalbed methane, Lexington,KY, United States, Sept. 27-30, 1997.

EPA 816-R-04-003 Attachment 7The Northern Appalachian Basin
Evaluation of Impacts to Underground Sources June 2004of Drinking Water by Hydraulic Fracturing ofCoalbed Methane Reservoirs A7-1
Attachment 7The Northern Appalachian Coal Basin
The Northern Appalachian Coal Basin is the northernmost of the three basins comprisingthe Appalachian Coal Region of the eastern United States, and includes parts of the Statesof Pennsylvania, West Virginia, Ohio, Kentucky, and Maryland (Figure A7-1). Thebasin trends northeast-southwest and the Rome Trough, a major graben structure, formsthe southeastern and southern structural boundaries (Kelafant et al., 1988). The basin isbounded on the northeast, north, and west by outcropping Pennsylvanian-aged sediments(Kelafant et al., 1988). The basin lies completely within the Appalachian Plateaugeomorphic province, covering an area of approximately 43,700 square miles (Adams etal., 1984 as cited in Pennsylvania Department of Conservation and Natural Resources,2002). It consists of six Pennsylvanian age coal units, and contains an estimated 61trillion cubic feet of coalbed methane (Kelafant et al., 1988). Coal seam depths rangefrom surface outcrops to up to 2,000 feet below ground surface, with most coal occurringat depths shallower than 1,000 feet (Quarterly Review, 1993). Annual coalbed methaneproduction stood at 1.41 billion cubic feet in 2000 (GTI, 2002).
7.1 Basin Geology
The six Pennsylvanian aged coal zones located within the Northern Appalachian CoalBasin are the Brookville-Clarion, Kittanning, Freeport, Pittsburgh, Sewickley, and theWaynesburg. These coal units are contained within the Pottsville, Allegheny, and theMonongahela Groups (Figure A7-3) (Kelafant et al., 1988).
In the Northern Appalachian Basin, the Pottsville stratigraphic group is generally 200 to300 feet thick, and thins to the north and west into Ohio and Pennsylvania (Kelafant etal., 1988). The coals in this group are interbedded with fluvial and deltaic sands andshales and are capped by marine limestones and shales (Kelafant et al., 1988).Deposition of this group took place on irregular Mississippian terrain, forming thin anderratic coals (Kelafant et al., 1988).
The Allegheny Group reaches a maximum thickness of 200 to 300 feet in westernMaryland and thins westward to about 150 to 200 feet in Ohio. Deposition of this groupoccurred as cyclothem-type sedimentation, resulting in a complex sequence of lenticular,thin- to massive-bedded subgraywacke, shale, and mudstone interbedded with clays andcoal (Kelafant et al., 1988). Due to their alluvial and delta plain depositionalenvironments, Allegheny coals, which include the Brookville/Clarion, Kittanning, andthe Freeport, are 2 to 6 feet thick and aerially extensive (Kelafant et al., 1988). Thecoalbeds decrease in number from the eastern to the western edge of the basin (Kelafantet al., 1988).

EPA 816-R-04-003 Attachment 7The Northern Appalachian Basin
Evaluation of Impacts to Underground Sources June 2004of Drinking Water by Hydraulic Fracturing ofCoalbed Methane Reservoirs A7-2
The Monongahela Group was deposited primarily in lacustrine and swamp environments.Some of the most important economic coals of the basin were deposited in large lakes,such as the Pittsburgh and Sewickley coals (Kelafant et al., 1988). The MonongahelaGroup is thickest along the Monongahela River at 400 feet and thins to 250 feet in thesouthwest along the Ohio River. Shales, mudstones, and freshwater limestones are themajor rock types of the Group (Kelafant et al., 1988). The Waynesburg coals are alsocontained within the Monongahela Group. In general, the coalbeds of the MonongahelaGroup are laterally extensive.
The total thickness of the Pennsylvanian-aged coal system averages 25 feet; however,better-developed seams within the coal zones can increase in thickness by up to twice theaverage (Quarterly Review, 1993). Within the Pennsylvanian Coal System, the deepestcoal, the Brookville-Clarion, ranges in depth from surface exposures in anticlines to2,000 feet below ground surface. The Kittanning Group reaches a maximum depth of2,000 feet and is approximately 800 feet deep in more than half the area in which thegroup occurs. The distance between the Upper and Lower Kittanning is approximately100 feet (Kelafant et al., 1988). Freeport coals are at a maximum depth of 1,800 feet inthe central portion of the Northern Appalachian Coal Basin. The Upper and LowerFreeport are separated vertically by a distance of 40 to 60 feet (Kelafant et al., 1988).The Pittsburgh coals achieve a maximum depth of 1,200 feet and roughly half of thecoals can be found at depths greater than 400 feet (Kelafant et al., 1988). Sewickleycoals are deeper than 400 feet with the deepest coals located at 1,200 feet below groundsurface (Kelafant et al., 1988). The final and youngest group discussed here, theWaynesburg group, is the shallowest, reaching a maximum depth of 800 feet in the centerof the basin. Figures A7-4 through A7-9 (adapted from Kelafant et al., 1988) are isopachmaps of sediment cover for the six major coal zones of the Appalachian Coal Basin.
7.2 Basin Hydrology and USDW Identification
The Northern Appalachian Basin is situated in the Appalachian Plateaus physiographicprovince of the region. The primary aquifer in this area is a Pennsylvanian sandstoneaquifer underlain by limestone aquifers (National Water Summary, 1984). Water wellsare typically 75 to 100 feet in depth in the Pennsylvanian aquifer and commonly produceone to five gallons per minute of water (National Water Summary, 1984). The primaryaquifers in the Maryland portion of the basin are Appalachian sedimentary aquifers,which are mostly sandstones, shales, and siltstones with some limestone, dolomite, andcoal. Water wells here are typically 30 to 400 feet in depth and usually produce 10 to100 gallons per minute of water (National Water Summary, 1984).
In Ohio, the primary aquifers are sandstone aquifers, shaly sandstone and carbonateaquifers, and coarse-grained aquifers (comprised of alluvium and glacial outwash)associated with river valleys (National Water Summary, 1984). Water wells within theseaquifers typically range from 25 to 300 feet in depth, and common water production ratesvary between 1 and 500 gallons per minute (National Water Summary, 1984).

EPA 816-R-04-003 Attachment 7The Northern Appalachian Basin
Evaluation of Impacts to Underground Sources June 2004of Drinking Water by Hydraulic Fracturing ofCoalbed Methane Reservoirs A7-3
In Pennsylvania, the primary aquifers are sandstone and shale aquifers, with smallerunconsolidated sand and gravel aquifers surrounding river courses (National WaterSummary, 1984). Well depths in the sandstone and shale aquifers in Pennsylvania areusually 80 to 200 feet in depth, and the wells typically produce 5 to 60 gallons per minuteof water (National Water Summary, 1984).
In West Virginia, the primary aquifer is an Upper Pennsylvanian-aged aquifer consistingof the Dunkard, Monongahela, and Conemaugh Groups (National Water Summary,1984). This aquifer consists of nearly horizontal beds of shale, sandstone, siltstone, coal,and limestone (National Water Summary, 1984). Water wells typically extend from 50 to300 feet in depth in this area of West Virginia, and commonly produce 1 to 30 gallons perminute of water (National Water Summary, 1984).
Individual states containing portions of the basin have developed various maps anddocuments locating underground sources of drinking water (USDWs) and aquifers withintheir state boundaries, mostly as a part of their respective Underground Injection Control(UIC) Programs. EPA’s Regional Office also has information concerning the location ofthese resources, as not all states within the Northern Appalachian Coal Basin haveprimacy over their UIC Program. Water quality data from eight historic NorthernAppalachian Coal Basin projects show that estimated total dissolved solids (TDS) levelsranged from 2,000 to 5,000 milligrams per liter (mg/L) at depths ranging from 500 to1,025 feet below ground surface (Zebrowitz et al., 1991), well within EPA's water qualitycriterion for a USDW of less than 10,000 mg/L of TDS (40 CFR §144.3).
Most states within the Northern Appalachian Basin, including Kentucky, Ohio, and WestVirginia have mapped the interface between saline and freshwater aquifers. ForMaryland and Pennsylvania, no maps have been identified that define the interfacebetween saline and freshwater aquifers. In Maryland, a deep well drilled in southernGarrett County encountered the fresh/saltwater interface at a depth of 940 feet (Duigonand Smigaj, 1985). Groundwater in Pennsylvania deeper than 450 feet is not consideredto be a USDW (Platt, 2001) because of the existence of non-water producing shale from450 to 1000 feet, and TDS levels in water below this shale that are typically greater than100,000 mg/L. The following table contains information concerning the relative locationof potential USDWs and potential methane-bearing coalbeds in the Northern AppalachianCoal Basin.
As shown in Table A7-1, coalbeds with methane production potential in the NorthernAppalachian Basin do occur within USDWs, indicating the potential for impact. WestVirginia’s interface line between fresh and saline water (Foster, 1980) is based on aqualitative assessment, Ohio’s interface line is based on a TDS level of 3,000 mg/L(Sedam and Stein, 1970), and Kentucky’s interface line is based on a TDS level of 1,000mg/L (Hopkins, 1966). In Maryland, the fresh water distinction was probably madebased on a TDS level of 1,000 mg/L, as the reference refers to sodium and chlorideconcentrations of 1,800 mg/L and 2,900 mg/L as “high levels” (Duigon and Smigaj,1985).

EPA 816-R-04-003 Attachment 7The Northern Appalachian Basin
Evaluation of Impacts to Underground Sources June 2004of Drinking Water by Hydraulic Fracturing of
Coalbed Methane Reservoirs A7-4

EPA 816-R-04-003 Attachment 7 The Northern Appalachian Basin
Evaluation of Impacts to Underground Sources June 2004of Drinking Water by Hydraulic Fracturing ofCoalbed Methane Reservoirs A7-5
Therefore, in these states, the depth to the 10,000 mg/L level of TDS in groundwater ispotentially and likely deeper than the depths presented above (Table A7-1). Thisassumption is confirmed by a structure elevation map (Figure A7-6) of the Upper andLower Freeport Sandstones of the Upper Allegheny Group (Figure A7-3) in Ohio. Withthe increasing depth of these stratigraphic units toward the basin center, much of theformation waters in these units south of the easternmost counties in Ohio contain TDSlevels in excess of 10,000 mg/L (Vogel, 1982). Likewise, the Pittsburgh Group Coals inPennsylvania range in depth from outcrop to 1,200 feet below ground surface (Figure A7-7). Over this length of “dip”, it is likely that the coals intersect drinking water aquifersbefore they reach depths where TDS levels exceed the 10,000 mg/L TDS water qualitycriterion of a USDW.
7.3 Coalbed Methane Production Activity
Coalbed methane has been produced in commercial quantities from the Pittsburghcoalbed of the Northern Appalachian Coal Basin since 1932 (Lyons, 1997), after the1905 discovery of the Big Run Field in Wetzel County, West Virginia (Hunt and Steele,1991). Coalbed methane production development in the Northern Appalachian Basin haslagged, however, due to insufficient reservoir knowledge, inadequate well completiontechniques, and coalbed gas ownership issues revolving around whether the gas is ownedby the mineral owner or the oil and gas owner (Zebrowitz et al., 1991). Annual coalbedmethane production stood at 1.41 billion cubic feet in 2000 (GTI, 2002). As of October2002, 185 coalbed methane wells were producing coalbed methane in Pennsylvania(Pennsylvania Department of Conservation and Natural Resources, 2002). Discharge ofproduced waters has also proven to be problematic (Lyons, 1997) for coalbed methanefield operators in the Northern Appalachian Coal Basin.
Some operators in the Northern Appalachian Coal Basin and several test projects arediscussed below. As of 1993, O’Brien Methane Production, Inc. had at least 20 wells insouthern Indiana County, Pennsylvania (Quarterly Review, 1993). They received a watertreatment and discharge permit that allowed O'Brien to discharge produced water intoBlacklick Creek. The wells in O’Brien’s field were hydraulically fractured with waterand sand. Nitrogen was being contemplated for future fracturing. O’Brien's operationshave since been assumed by Belden and Blake. BTI Energy, Inc. also had a few coalbedwells in northern Fayette County, Pennsylvania. Two were completed in 1993 and thefirm held permits for eight additional wells.
Other projects in the basin included the Lykes/Emerald Mines Project of the UnitedStates Bureau of Mines (USBM) and the Penn State University/Carnegie NaturalGas/U.S. Steel Wells Project, both in Greene County, Pennsylvania. Depths to the top ofthe Pittsburgh coals in Greene County range from 800 to 1,200 feet below ground surface(Kelafant et al., 1988). Hydraulic fracturing fluids included water and sand, and nitrogenfoam and sand (Hunt and Steele, 1991). The Christopher Coal Company/Spindler WellsProject, which took place from 1952 to 1959, fractured one well with 12 quarts of

EPA 816-R-04-003 Attachment 7 The Northern Appalachian Basin
Evaluation of Impacts to Underground Sources June 2004of Drinking Water by Hydraulic Fracturing ofCoalbed Methane Reservoirs A7-6
nitroglycerin (Hunt and Steele, 1991). In the Vesta Mines Project of Washington County,Pennsylvania, the USBM used gelled water and sand to complete five wells in thePittsburgh Seam (Hunt and Steele, 1991).
Within the State of Pennsylvania, there have been complaints of methane migrating intowater supplies (Markowski, 2001). According to the Pennsylvania Department ofConservation and Natural Resources (2002), none of these complaints were linkedspecifically to hydraulic fracturing of coalbed methane wells. During a telephoneinterview (Markowski, 2001), Ms. Markowski stated methane contamination is due to thefact that many coalbed methane wells in southwestern Pennsylvania are completed inabandoned mine shafts. A puncture in the roof of the mineshaft provides a migrationpathway for methane into overlying groundwater. These wells are known as gob wells,and are not usually hydraulically fractured or stimulated.
7.4 Summary
Based on available information, coal seams with methane production potential are locatedwithin USDWs throughout the Northern Appalachian Coal Basin, and hydraulicfracturing takes place in this basin. Because most of the coal strata dip, a well’s locationwithin the basin determines whether it is within a USDW, and whether the potential forimpact exists. For example, in the Pittsburgh Coal Zone in Pennsylvania, the depth to thetop of this coal zone varies from outcrop to about 1,200 feet in the very southwesterncorner of the state. The approximate depth to the bottom of the USDW is 450 feet.Therefore, production wells operating down to approximately 500 feet could potentiallybe hydraulically connected to the USDW. However, those wells operating at depthsgreater than 900 feet would probably not be hydraulically connected to the USDW,unless a fracture extending beyond the coal layers to the shallower aquifer was to occur.
Milici (2002) indicated that the Pittsburgh Coal in Pennsylvania is mined out along itsoutcrop and the remaining coal resources are deeper (> 450 feet) in the basin. While thissituation would greatly minimize the possibility of water quality impacts for this coalzone in Pennsylvania, the potential for contamination from the Pittsburgh coalbeds inother states within the basin still exists (see Table A7-1).

EPA 816-R-04-003 Attachment 7 The Northern Appalachian Basin
Evaluation of Impacts to Underground Sources June 2004of Drinking Water by Hydraulic Fracturing ofCoalbed Methane Reservoirs A7-7

EPA 816-R-04-003 Attachment 7 The Northern Appalachian Basin
Evaluation of Impacts to Underground Sources June 2004of Drinking Water by Hydraulic Fracturing ofCoalbed Methane Reservoirs A7-8

EPA 816-R-04-003 Attachment 7 The Northern Appalachian Basin
Evaluation of Impacts to Underground Sources June 2004of Drinking Water by Hydraulic Fracturing ofCoalbed Methane Reservoirs A7-9

EPA 816-R-04-003 Attachment 7 The Northern Appalachian Basin
Evaluation of Impacts to Underground Sources June 2004of Drinking Water by Hydraulic Fracturing ofCoalbed Methane Reservoirs A7-10

EPA 816-R-04-003 Attachment 7 The Northern Appalachian Basin
Evaluation of Impacts to Underground Sources June 2004of Drinking Water by Hydraulic Fracturing ofCoalbed Methane Reservoirs A7-11

EPA 816-R-04-003 Attachment 7 The Northern Appalachian Basin
Evaluation of Impacts to Underground Sources June 2004of Drinking Water by Hydraulic Fracturing ofCoalbed Methane Reservoirs A7-12

EPA 816-R-04-003 Attachment 7 The Northern Appalachian Basin
Evaluation of Impacts to Underground Sources June 2004of Drinking Water by Hydraulic Fracturing ofCoalbed Methane Reservoirs A7-13

EPA 816-R-04-003 Attachment 7 The Northern Appalachian Basin
Evaluation of Impacts to Underground Sources June 2004of Drinking Water by Hydraulic Fracturing ofCoalbed Methane Reservoirs A7-14

EPA 816-R-04-003 Attachment 7 The Northern Appalachian Basin
Evaluation of Impacts to Underground Sources June 2004of Drinking Water by Hydraulic Fracturing ofCoalbed Methane Reservoirs A7-15

EPA 816-R-04-003 Attachment 7 The Northern Appalachian Basin
Evaluation of Impacts to Underground Sources June 2004of Drinking Water by Hydraulic Fracturing ofCoalbed Methane Reservoirs A7-16
REFERENCES
Adams et al., 1984, as cited by Pennsylvania Department of Conservation and NaturalResources, 2002) Adams, M.A., Eddy, G.E., Hewitt, J.L., and others. 1982.Northern Appalachian coal basin report - A study of Carboniferous geology, coal,and the potential coalbed methane resources of the Northern Appalachian coalbasin in Pennsylvania, Ohio, Maryland, West Virginia and Kentucky: McLean,VA, TRW Inc., TRW Coalbed Methane Program, Report to DOE/METC,Contract No. DE-AC21-81 MC 14900, 179 p.
Duigon, Mark T. and Smigaj, Michael J. 1985. First report on the hydrologic effects ofunderground coal mining in Southern Garrett County, Maryland, U.S. GeologicalSurvey Report of Investigations No. 41.
Foster, James B. 1980. Fresh and saline ground-water map of West Virginia. U. S.Geological Survey, West Virginia Geological and Economic Survey, Map WV-12.
Gas Technology Institute (GTI) Web site. 2002. Drilling and Production Statistics forMajor US Coalbed Methane and Gas Shale Reservoirs.http://www.gastechnology.org
Hopkins, Herbert T. 1966. Fresh-saline water interface map of Kentucky. U.S.Geological Survey, Kentucky Geological Survey, Series X.
Hunt, A. M., and Steele, D. J. 1991. Coalbed methane development in the Northern andCentral Appalachian Basins – past, present and future. Proceedings of the 1991Coalbed Methane Symposium, The University of Alabama/Tuscaloosa, May 13-16, 1991.
Kelafant, J. R., Wicks, D. E., and Kuuskraa, V. A. March, 1988. A GeologicAssessment of Natural Gas from Coal Seams in the Northern Appalachian CoalBasin. Topical Report – Final Geologic Report to the Gas Research Institute(September 1986 – September 1987).
Lyons, Paul C. 1997. Central-Northern Appalachian Coalbed Methane Flow Grows. Oil& Gas July 7, 1997, pp. 76-79.
Markowski, Toni. January, 2001. Pennsylvania Geological Survey. Personalcommunication.
Milici, R.C. February, 2002. U. S. Geological Survey. Personal communication.

EPA 816-R-04-003 Attachment 7 The Northern Appalachian Basin
Evaluation of Impacts to Underground Sources June 2004of Drinking Water by Hydraulic Fracturing ofCoalbed Methane Reservoirs A7-17
National Water Summary. 1984. Hydrologic events, selected water-quality trends, andground-water resources. United States Geological Survey Water-Supply PaperNo. 2275.
Pennsylvania Department of Conservation and Natural Resources. 2002. PublicComment OW-2001-0002-0089 to "Draft Evaluation of Impacts to UndergroundSources of Drinking Water by Hydraulic Fracturing of Coalbed MethaneReservoirs." Federal Register. Vol. 63, No. 185. p. 33992, September 24, 2002.
Platt, Steve. January, 2001. U.S. EPA Region 3. Personal communication.
Quarterly Review. 1993. Coalbed Methane – State of the Industry. Methane From CoalSeams Technology, August 1993.
Sedam, A. C., and Stein, R. B. 1970. Saline ground-water resources of Ohio. HydrologicInvestigations Atlas HA-366, Department of the Interior, U. S. GeologicalSurvey.
Vogel, Donald A. 1982. Final Report, U.I.C. Program, Salt/Fresh Water InterfaceGround-Water Mapping Project. Ohio Dept. of Natural Resources, Division ofWater, Columbus.
Zebrowitz, M. J., Kelafant, J. R., and Boyer, C. M. 1991. Reservoir characterization andproduction potential of the coal seams in Northern and Central AppalachianBasins. Proceedings of the 1991 Coalbed Methane Symposium, The University ofAlabama/Tuscaloosa, May 13-16, 1991.

EPA 816-R-04-003 Attachment 8The Western Interior Basin
Evaluation of Impacts to Underground Sources June 2004of Drinking Water by Hydraulic Fracturing ofCoalbed Methane Reservoirs A8-1
Attachment 8The Western Interior Coal Region
The Western Interior Coal Region comprises three coal basins, the Arkoma, theCherokee, and the Forest City Basins, and encompasses portions of six states: Arkansas,Oklahoma, Kansas, Missouri, Nebraska, and Iowa (Figure A8-1). The Arkoma Basincovers about 13,500 square miles in Arkansas and Oklahoma, with an estimated 1.58 to3.55 trillion cubic feet (Tcf) of gas reserves, primarily in the Hartshorne coals (QuarterlyReview, 1993).
The Cherokee Basin is part of the Cherokee Platform Province, which coversapproximately 26,500 square miles (Charpentier, 1995) in Oklahoma, Kansas, andMissouri. The basin contains an estimated 1.38 million cubic feet of gas per square mile(Stoeckenger, 1990) in the targeted Mulky, Weir-Pittsburg, and Riverton coal seams ofthe Cherokee Group (Quarterly Review, 1993). In total, the basin contains approximately36.6 billion cubic feet (Bcf) of gas. However, the Petroleum Technology TransferCouncil (1999) indicates that there are nearly 10 Tcf of gas in eastern Kansas alone. TheForest City Basin covers about 47,000 square miles (Quarterly Review, 1993) in Iowa,Kansas, Missouri, and Nebraska, and contains an estimated 1 Tcf of gas (Nelson, 1999).For the entire region, coalbed methane production was 6.5 Bcf in 2000 (Gas TechnologyInstitute (GTI), 2002).
8.1 Basin Coals
The Arkoma Basin is the southernmost of the three basins comprising the WesternInterior Coal Region, and is bounded structurally by the Ozark Dome to the north, theCentral Oklahoma Platform and Seminole Uplift on the west, and the OuachitaOverthrust Belt to the south (Quarterly Review, 1993). Middle Pennsylvanian coalbedsoccur within the Hartshorne and McAlester Formations (Figure A8-2), as well as theSavanna and Boggy Formations (Quarterly Review, 1993).
The Cherokee Basin is the central basin of the Western Interior Coal Region, and isbounded on the east and southeast by the Ozark Dome, on the west by the Nehama Uplift,and on the north by the Bourbon Arch (Quarterly Review, 1993). Principal coals occur inthe Krebs and Cabaniss Formations of the middle Pennsylvanian Cherokee Group (FigureA8-3).
The Forest City Basin (Figure A8-4), the northernmost basin of the Western Interior CoalRegion, is a shallow cratonic depression bounded by the Nemaha Ridge to the west, theThurman-Redfield structural zone to the north, the Mississippi River Arch to the east, andthe Bourbon Arch to the south (Bostic et al., 1993). Methane-bearing coals occur in the

EPA 816-R-04-003 Attachment 8The Western Interior Basin
Evaluation of Impacts to Underground Sources June 2004of Drinking Water by Hydraulic Fracturing ofCoalbed Methane Reservoirs A8-2
middle Pennsylvanian Cherokee and Marmaton Groups, with the Cherokee Group beingof primary interest (Tedesco, 1992).
8.1.1 Arkoma Basin Coals
The Hartshorne coals of the Hartshorne Formation are the most important for coalbedmethane production in the Arkoma Basin. Their depths range from 600 to 2,300 feet intwo productive areas in southeastern Oklahoma (Quarterly Review, 1993). Iannacchioneand Puglio (1979) estimated that 58 percent of the coalbed methane in the Hartshornecoals in southeastern Oklahoma occurs at 500- to 1,000-foot depths. These coals canreach depths of greater than 5,000 feet, and are three to nine feet thick (Quarterly Review,1993). Depths to the top of the Hartshorne coal in southeastern Oklahoma range from380 to 1,540 feet (Friedman, 1982). As of March 2000, there were 377 coalbed methanewells in eastern Oklahoma, ranging in depth from 589 to 3,726 feet (OklahomaGeological Survey, 2001).
8.1.2 Cherokee Basin Coals
The primary coal seams targeted by operators in Kansas are the Riverton Coal of theKrebs Formation and the Weir-Pittsburg and Mulky coals of the Cabaniss Formation(Quarterly Review, 1993). The Riverton and Weir-Pittsburg seams are about 3 to 5 feetthick and range from 800 to 1,200 feet deep (Quarterly Review, 1993). The Mulky Coal,which ranges up to 2 feet thick, occurs at depths of 600 to 1,000 feet (Quarterly Review,1993).
8.1.3 Forest City Basin Coals
Individual coal seams in the Cherokee Group in the Forest City Basin range from a fewinches to about 4 feet thick, with some seams up to 6 feet thick (Brady, 2002; Smith,2002). Cumulative maximum coal thickness within the Cherokee Group is about 25 to30 feet (Brady, 2002; Smith, 2002). Depths to the top of the Cherokee Group coals rangefrom surface exposures in the shallower portion of the basin in southeastern Iowa, toabout 1,220 feet in the deeper part of the basin, in northeastern Kansas (Bostic et al.,1993). At one location in Nebraska, the depth to the Cherokee Group is about 1,396 feet,and the base is at a depth of 2,096 feet (Condra and Reed, 1959). Maximum thickness ofthe Cherokee and Marmaton Groups is about 800 feet in the southeastern tip of Nebraska(Burchett, unpublished paper).

EPA 816-R-04-003 Attachment 8The Western Interior Basin
Evaluation of Impacts to Underground Sources June 2004of Drinking Water by Hydraulic Fracturing ofCoalbed Methane Reservoirs A8-3
8.2 Basin Hydrology and USDW Identification
8.2.1 Arkoma Basin Hydrology and USDW Identification
In Arkansas, the Arkoma Basin falls within the Interior Highlands physiographicprovince (Figure A8-5). According to the National Water Summary (1984), there is noprincipal aquifer in this area, only small alluvial aquifers bounding the Arkansas River(Figure A8-5). In these alluvial aquifers, water wells typically penetrate to depths of 100to 150 feet, and common well yields are in the order of 1,000 to 2,000 gallons of waterper minute (National Water Summary, 1984). In Oklahoma, the Arkoma Basin iscontained within the Ouachita and Central Lowland physiographic province (Figure A8-6). Much like in Arkansas, there are no principal aquifers in this portion of the state, butthere are smaller alluvium and terrace deposits along the Arkansas, North Canadian, andCanadian Rivers (National Water Summary, 1984) that serve as aquifers (Figure A8-6).Marcher (1969) also identifies these smaller deposits as the most favorable forgroundwater supplies. Water well depths in the alluvium and terrace deposits of theArkansas River in Oklahoma typically range from 50 to 100 feet (National WaterSummary, 1984). Water well production rates in all three aquifers commonly range from100 to 600 gallons of water per minute in alluvium, and 50 to 300 gallons of water perminute in terrace deposits (National Water Summary, 1984).
Bill Prior, a geologist with the Arkansas Geological Commission, stated that withinArkansas, the Arkoma Basin was in the Arkansas River Physiographic Province, whichlacks a true aquifer. Most of the rocks within this physiographic province are tightsandstones and shales, and most communities within the province use surface watersupplies (Prior, 2001). Doug Hansen of the Arkansas Geological Commission said thatthere were a few scattered bedrock wells within the Arkoma Basin (Hansen, 2001). Totaldissolved solids (TDS) levels in the McAlester Formation in Arkansas (which containsthe Hartshorne coals; Potts, 1987) range between 55 to 534 milligrams per liter (mg/L) atdepths ranging from 32.4 to 190 feet below land surface (Cordova, 1963). The base offresh water in the area is about 500 to 2,000 feet below ground surface (Cordova, 1963).However, Cordova (1963) does not define “fresh water;” therefore, it is difficult todetermine if the depths reported by Cordova coincide with the base of an undergroundsource of drinking water (USDW).
Water quality test results from the targeted Hartshorne seam in Oklahoma have shownthe water to be highly saline (Quarterly Review, 1993). Ken Luza, a geologist with theOklahoma Geological Survey, stated that a hydrologic atlas prepared by the OklahomaGeological Survey delineated a 5,000 mg/L TDS water quality contour line in a portionof the state, including the Arkoma Basin (Marcher, 1969; Marcher and Bingham, 1971).Maps such as these atlas maps show that, based on water quality and rock type, very littleof the area falls within a zone “most favorable for groundwater supplies” or “moderatelyfavorable for groundwater supplies.” Most of the area falls within a zone designated as“least favorable for groundwater supplies” (Cardott, 2001). Pam Hudson, Manager of the

EPA 816-R-04-003 Attachment 8The Western Interior Basin
Evaluation of Impacts to Underground Sources June 2004of Drinking Water by Hydraulic Fracturing ofCoalbed Methane Reservoirs A8-4
Geologic Section of the Oklahoma Corporation Commission, stated that the Commissionhas a series of maps, one for each county in Oklahoma, showing the depth to the 10,000mg/L TDS line (Hudson, 2001). The water quality criterion for a USDW is a TDS levelof less than 10,000 mg/L. The Oklahoma Corporation Commission maps are used toassist drillers in complying with state regulations that require oil and gas wells to becased through USDWs.
The following table contains information concerning the relative location of potentialUSDWs and methane-bearing coalbeds in the Arkoma Basin.
Table A8-1 Relative Locations of USDWs and Potential Methane-BearingCoalbeds, Arkoma Basin
Arkansas OklahomaArkoma CoalBasin, States andCoal Group
Depth to top ofCoal 1 (ft)
Depth to baseof Fresh
Water 2,3 (ft)
Depth to top ofCoal 1 (ft)
Depth tobase of
USDW 4 (ft)Hartshorne Coals 0 to < 4,500 500 to 2000 > ~1000 < ~9001 Andrews et al., 19982 Note: The base of “fresh water” is not the base of the USDW (depth to the base of the USDW is unknownor not available). Fresh water is within the USDW and the base of fresh water is above the base of theUSDW. Cordova (1963) does not define “fresh water.”
3 Cordova, 19634 Oklahoma Corporation Commission Depth to Base of Treatable Water Map Series (2001)
Based on Table A8-1, it can be determined that in Arkansas, there is a possibility for theHartshorne Coals to be located within a USDW, allowing the potential for impacts. Thepotential for impacts from fracturing coalbeds below the USDW is not known. Cordova(1963) does not specify the TDS level used to determine the depth of the base of freshwater in the Arkansas Valley region; he merely states that it is the depth to salt water, andhe does not provide a definition of “salt water.” The position of a coalbed methane wellwithin the basin would ultimately determine if coals and USDWs coincide, as theHartshorne Coals are typically shallower on basin margins (Andrews et al., 1998) andprogressively increase in depth toward the basin’s center (where they are potentially toodeep to be located within a USDW).
8.2.2 Cherokee Basin Hydrology and USDW Identification
The Cherokee Basin underlies parts of the States of Kansas, Missouri, and Oklahoma. InKansas, the Cherokee Basin is part of the Central Lowlands and Ozark Plateausphysiographic provinces (Figure A8-7). While the majority of this area does not containa principal aquifer, the Ozark and Douglas aquifers (Figure A8-7) are contained in thebasin (National Water Summary, 1984). The confined Ozark Aquifer, composed ofweathered and sandy dolomites, typically contains water wells that extend from 500 to

EPA 816-R-04-003 Attachment 8The Western Interior Basin
Evaluation of Impacts to Underground Sources June 2004of Drinking Water by Hydraulic Fracturing ofCoalbed Methane Reservoirs A8-5
1,800 feet in depth, commonly yielding 30 to 150 gallons of water per minute (NationalWater Summary, 1984). The usually unconfined Douglas Aquifer is channel sandstoneof Pennsylvanian Age (National Water Summary, 1984). Water wells are usually 5 to400 feet deep in this aquifer and typically produce 10 to 40 gallons of water per minute(National Water Summary, 1984).
In Missouri, only a very small portion of the basin falls within the Osage Plains area ofthe Central Lowlands physiographic province (Figure A8-8). The principal aquifers inthis portion of Missouri are the Ozark and Pennsylvanian-Mississippian age aquifers(National Water Summary, 1984) (Figure A8-8). Water well depths in the Ozark Aquifertypically range from 200 to 1,700 feet, and those in the Pennsylvanian-Mississippian ageaquifers typically range from 100 to 400 feet in depth (National Water Summary, 1984).Common well yields are 15 to 700 gallons of water per minute and 1 to 15 gallons ofwater per minute in the Ozark and Pennsylvanian-Mississippian aquifers, respectively(National Water Summary, 1984). Only a very small portion of the Cherokee Basin,bounded from the Forest City Basin to its north by the Bourbon Arch, falls within theState of Missouri (Figure A8-9). Jim Vandike, Chief of Missouri’s Water ResourcesBranch at the Missouri Geological Survey, stated that only two public water suppliesobtain water from Pennsylvanian strata, and those wells were outside of the CherokeeBasin (Vandike, 2001).
In Oklahoma, the Cherokee Basin lies within the Central Lowland physiographicprovince (Figure A8-6). In addition to the alluvium and terrace deposit aquiferspreviously discussed in the Arkoma Basin aquifer descriptions, this area also contains theGarber-Wellington and Vamoosa-Ada Aquifers (Figure A8-6), which are unconfined toconfined sandstone with shale and siltstone aquifers (National Water Summary, 1984).The Vamoosa-Ada Aquifer contains some conglomerate aquifers as well. Water welldepths in these two aquifers usually range from 100 to 900 feet, and wells typicallyproduce from 100 to 300 gallons of water per minute (National Water Summary, 1984).At least half of the area of this basin in Oklahoma does not contain a principal aquifer(National Water Summary, 1984).
In Kansas, Al Macfarlane, of the Kansas Geological Survey, stated that the OzarkAquifer was located in the Cherokee Basin in Kansas (Macfarlane, 2001). An OzarkAquifer Extent map indicates that the “usable” part of the aquifer (defined as having lessthan 10,000 mg/L of TDS per Macfarlane; no definition of “usable” is provided by themap) covers the three southeastern-most counties (Bourbon, Crawford, and Cherokee) ofthe state (Figure A8-7) and parts of the adjacent four counties (Linn, Allen, Neosho, andLabette) (DASC Ozark Aquifer Extent Map, 2001c). Because the land surface elevationin that portion of the state is roughly 850 feet above sea level (DASC Kansas ElevationMap, 2001b) and the elevation of the base of the Ozark Aquifer is roughly 900 feet belowsea level (Ozark Aquifer Base Map, 2001c), the base of the Ozark aquifer is roughly1,750 feet below ground surface. Groundwater samples taken from lower Paleozoic

EPA 816-R-04-003 Attachment 8The Western Interior Basin
Evaluation of Impacts to Underground Sources June 2004of Drinking Water by Hydraulic Fracturing ofCoalbed Methane Reservoirs A8-6
aquifers in Kansas show TDS levels ranging from <500 to 5,000 mg/L (Figure A8-10)(Macfarlane and Hathaway, 1987), well within the range for a USDW.
Table A8-2 contains information concerning the relative location of potential USDWsand methane-bearing coalbeds in the Cherokee Basin. The table shows that all or part ofthe targeted coal seams could be coincident with a USDW, allowing the potential forimpacts. Most past coalbed methane production activity within the Cherokee Basin tookplace in Kansas (Quarterly Review, 1993). However, coalbed methane productionactivity within the Cherokee Basin in Oklahoma has increased markedly in recent years(Hudson, 2001).
Table A8-2 Relative Locations of USDWs and Potential Methane-BearingCoalbeds, Cherokee Basin
Kansas Missouri Oklahoma
Coal Group
Depth to topof Coal 1
(ft)
Depth tobase of
Fresh Water(USDW) 2
(ft)
Depth totop ofCoal 1
(ft)
Depth tobase ofFresh
Water 3(ft)
Depth to topof Coal 1
(ft)
Depth tobase ofFreshWater
(ft)Mulky 600 to 1000 600 to
1000600 to 1000
Weir-Pittsburg
800 to 1200 800 to1200
800 to 1200
Riverton 800 to 1200
~ 1750
800 to1200
N/A4
800 to 1200
N/A4
1 Quarterly Review, 19932 Ozark Aquifer extent and base, and Kansas elevation maps from the Kansas Data Access and Support Center (DASC) 2001b above3 Missouri’s Geological Survey, Water Resources Branch, claims no water supplies in these strata4 Not Available
8.2.3 Forest City Basin USDW Identification
The Forest City Basin includes parts of the States of Iowa, Kansas, Missouri, andNebraska. In Iowa, the Forest City Basin lies within the Southern Iowa Drift Plainphysiographic province (Figure A8-11). The most productive aquifer in this area is thedolomite and sandstone Jordan Aquifer (Figure A8-11). Wells in this aquifer commonlyrange in depth from 300 to 2,000 feet (some are as deep as 3,000 feet) and usuallyproduce 100 to 1,000 gallons of water per minute (National Water Summary, 1984). Thisaquifer usually contains in excess of 1,500 mg/L TDS in the southern portion of the state(National Water Summary, 1984). Other aquifers used at various locations in the basinare found in the Silurian-Devonian age and in the Mississippian-age strata (Figure A8-11). Water wells in these aquifers range from 150 to 750 feet deep with variable

EPA 816-R-04-003 Attachment 8The Western Interior Basin
Evaluation of Impacts to Underground Sources June 2004of Drinking Water by Hydraulic Fracturing ofCoalbed Methane Reservoirs A8-7
production (Howes, 2002). Also contained within this basin in Iowa is a portion of theconfined, poorly cemented sandstone Dakota aquifer (National Water Summary, 1984)(Figure A8-11). Water wells in this aquifer are typically 100 to 600 feet in depth, andcommonly produce 100 to 250 gallons of water per minute (National Water Summary,1984). An Iowa Division of Natural Resources Geological Survey Bureau geologist,Mary Howes, said that few towns in Iowa use Pennsylvanian strata for water, as theytypically contain high concentrations of sulfate and TDSs (Howes, 2001). Mostcommunity water supplies in the southern portion of Iowa use surface water and shallowalluvial aquifers as drinking water sources, and there are a few wells in fractured bedrock.Private water supplies typically are derived from seepage wells, shallow bedrock wells,or purchased from a public supply (Howes, 2002).
In Kansas, the basin is located in the Lowlands physiographic province (Figure A8-7),and only the northeastern corner of the state falls within the Forest City Basin boundary.In addition to the Douglas Aquifers described above in the Cherokee Basin Aquiferdescriptions, this portion of the Forest City Basin in Kansas also contains a glacial driftaquifer (is this and some alluvial aquifers adjacent to the Kansas River (National WaterSummary, 1984) (Figure A8-7). In the glacial drift, wells are typically 10 to 300 feet indepth and usually produce 10 to 100 gallons of water per minute (National WaterSummary, 1984). Wells in the alluvium are usually 10 to 150 feet deep and typicallyproduce 10 to 500 gallons of water per minute (National Water Summary, 1984). Theglacial drift aquifer’s base varies from about 850 to 1,300 feet above sea level (DASC,Glacial Drift Base Map, 2001a). Since the elevation of the land surface in this portion ofKansas is roughly between 1,000 and 1,400 feet above sea level (DASC, KansasElevation Map, 2001b), the aquifer appears to extend only to an approximate maximumdepth of 150 feet below the ground surface.
In Missouri, the basin lies within the Central Lowland physiographic province (FigureA8-8). The principal aquifer in this area is a glacial-drift aquifer (Figure A8-8). In thisaquifer, water wells are typically 100 to 250 feet in depth and produce 5 to 200 gallons ofwater per minute. In addition to this aquifer, alluvial deposits along the Missouri Riverare also developed for water (National Water Summary, 1984)(Figure A8-8). Welldepths in the alluvium usually range from 80 to 100 feet in depth, and the wells typicallyproduce 100 to 1,000 gallons of water per minute (National Water Summary, 1984).Two public supply wells in Cass County, Missouri, extract water from Pennsylvanianstrata for the town of East Lynn. A map of groundwater quality within Paleozoic aquifersof Missouri (Figure A8-12) shows that within the Forest City Basin, water quality rangesfrom about 500 mg/L TDS to 40,000 mg/L TDS in deeper portions of the basin (MissouriDivision of Geological Survey and Water Resources, 1967). A 10,000 mg/L TDSboundary line delineated in the Mississippian aquifers of Missouri (located directly belowPennsylvanian-age strata) includes portions of Cass, Jackson, Lafayette, Carroll, Saline,Ray, Clay, Caldwell, Clinton, and Platte Counties (Netzler, 1982) (Figure A8-8).

EPA 816-R-04-003 Attachment 8The Western Interior Basin
Evaluation of Impacts to Underground Sources June 2004of Drinking Water by Hydraulic Fracturing ofCoalbed Methane Reservoirs A8-8
Only the southeastern tip of Nebraska (primarily Richardson County) falls within thelimits of the Forest City Basin. The principal aquifers in this area are undifferentiatedaquifers in Paleozoic-age rocks (National Water Summary, 1984) (Figure A8-13).Locally overlain by saturated Quaternary-age sand and gravel deposits, wells within thisarea are commonly 30 to 2,200 feet in depth, and produce about 10 to 200 gallons ofwater per minute. TDS levels in the water can be as high as 6,000 mg/L, but are usuallyless than 1,500 mg/L (National Water Summary, 1984). The Ground Water Atlas ofNebraska (Flowerday et al., 1998) indicates that Richardson County is within theSoutheastern Nebraska Glacial Drift rock unit. The thickness of the aquifer inRichardson County is less than 100 feet and the depth to water is 30 to 200 feet. Theinformation in the Ground Water Atlas of Nebraska (Flowerday et al., 1998) appears tobe in conflict with the data presented by the U.S. Geological Survey in the NationalWater Summary (1984). Matt Jokel of the Nebraska Conservation and Survey Divisionsaid it is very difficult to obtain water in this portion of the state, and most people usevalley fill materials and paleochannels as water supply sources. He also believes that thecoal resources, which could possibly be used for methane extraction, are probably toodeep to be located coincident with the shallow water supplies in the area (Jokel, 2001).
Table A8-3 contains information concerning the relative location of potential USDWsand potential methane-bearing coalbeds in the Forest City Basin.
Table A8-3 Relative Locations of USDWs and Potential Methane-BearingCoalbeds, Forest City Basin
Iowa Kansas Missouri Nebraska
Coal Group
Depthto top
ofCoal 1
(ft)
Depthto base
offresh
water3
(ft)
Depthto top
ofCoal 1
(ft)
Depthto base
offresh
water 4(ft)
Depthto top
ofCoal 1
(ft)
Depthto base
offresh
water 5(ft)
Depthto top
ofCoal1,6
(ft)
Depth tobase offresh
water 2,7
(ft)CherokeeGroup
0 to>230
N/A8 720 to1220
~ 150 300 to1100
N/A8 1220to
1396
129 to299
1 Bostic et al., 19932 Note: The base of “fresh water” is not the base of the USDW. Fresh water is within the USDW and the base of fresh water is above the base of the USDW.3 Howes, Iowa Geological Survey Bureau (2001) believes water quality data may be available to define thisdepth
4 Glacial Drift base and Kansas elevation maps from the Kansas Data Access and Support Center (DASC), 2001b5 Maps (Netzler, 1982) sent by Missouri show the extent of aquifers containing less than 10,000 mg/L of TDS, but not depths6 Condra and Reed, 19597 The Groundwater Atlas of Nebraska, (Flowerday et al., 1998)8 Not Available

EPA 816-R-04-003 Attachment 8The Western Interior Basin
Evaluation of Impacts to Underground Sources June 2004of Drinking Water by Hydraulic Fracturing ofCoalbed Methane Reservoirs A8-9
Presently, there does not appear to be a USDW located at the same depth as the coals ofthe Cherokee Group in the Forest City Basin. However, very little is known about thecoal resources of this basin (Quarterly Review, 1993). Further research is required todelineate the possible link between coalbed methane resources and USDWs in the ForestCity Basin.
8.3 Coalbed Methane Production Activity
GTI places total coalbed gas production in the Western Interior Coal region at 6.5 Bcf forthe year 2000 (GTI, 2002).
8.3.1 Arkoma Basin Production Activity
In 1989, Bear Production Company became the first company to target coalbed methaneproduction from the Hartshorne Coals of the Arkoma Basin in Haskell County,Oklahoma (Quarterly Review, 1993). As of 1993, Bear Production had 38 wells inoperation, Aztec Energy Corporation had 19 wells, and Redwine Resources, Inc. had 40wells in the Arkoma Basin (Quarterly Review, 1993).
As of 1993, Bear Production was not fracturing its wells, but rather completing them asopen holes without perforated casings (Quarterly Review, 1993). However, otherproduction companies were fracturing their wells for methane production. Before 1992,water, linear gel, acid, and nitrogen foam fracturing fluids were used, with most operatorsusing foam with small sand volumes (35,000 to 60,000 lbs) (Quarterly Review, 1993). In1993, slick water fracturing fluids containing no proppant were becoming more common(Quarterly Review, 1993). Well fracturing data from 36 wells in the Spiro SoutheastField of LeFlore County, Oklahoma show that either water or nitrogen foam was the basefracturing fluid used to carry sand proppant into coal cleats (Andrews et al., 1998).Fracturing continues in the Arkoma Basin today, at least in Oklahoma, where undisclosedamounts of initial water production are “frac” waters introduced during fracturestimulation (Cardott, 2001). Both Wendell (2001) and Marshall (2001) outline currenthydraulic fracturing practices within the Arkoma Basin, and Wendell (2001) includesacids, benzene, xylene, toluene, gasoline, diesel, solvents, bleach, and surfactants asdetrimental hydraulic fracturing substances in his “lessons learned” category.
A search of the Oklahoma Coal Database, updated on January 17, 2001, indicated thatover 360 coalbed methane wells had been completed in Haskell, Le Flore, and Pittsburgcounties alone, targeting the Hartshorne, McAlester, and Savanna coals. Additionaloperators in the Arkoma Basin today include Continental Resources, SJM Inc., Brower O& G, Mannix Oil, and OGP Operating (Oklahoma Coal Database, 2001).
Apparently there is little to no coalbed methane activity in the Arkoma Basin inArkansas, based on the Arkansas Geological Commission’s Web site, which states,

EPA 816-R-04-003 Attachment 8The Western Interior Basin
Evaluation of Impacts to Underground Sources June 2004of Drinking Water by Hydraulic Fracturing ofCoalbed Methane Reservoirs A8-10
“…there exists the potential for coalbed methane production in this area of the state”(Arkansas Geological Commission, 2001). The low coalbed methane activity in thisBasin is further confirmed by Andrews et al. (1998), which outlines Arkansas’ restrictivefield-spacing policy from the 1930s of only one well per 640-acre section for eachproducing zone in the Hartshorne. This policy effectively made explorationuneconomical. A change in field-spacing rules in 1995 has stimulated new interestamong independent producers in Arkansas to develop methane from the Hartshorne coals(Andrews et al., 1998).
8.3.2 Cherokee Basin Production Activity
In the Cherokee Basin, unknown amounts of coalbed methane gas have been producedwith conventional natural gas for over 50 years (Quarterly Review, 1993). Targetedcoalbed methane production increased in the late 1980s, and at least 232 coalbed methanewells had been completed as of January 1993 (Quarterly Review, 1993). During thistimeframe, development was centered on Montgomery County, Kansas, with the mostactive operators being Great Eastern Energy and Development Corporation with 81 wells,Kan Map Inc. with 47 wells, and Stroud Oil Properties Inc. with 35 wells, (QuarterlyReview, 1993). In addition to these operators, Bonanza Energy Corporation, ConquestOil Company, Foster Oil & Gas, Hunter, Quantum Energy, Uranus, and U.S. Explorationhad active development programs, and Derrick Industries was planning a program(Quarterly Review, 1993).
The coalbed methane wells were typically fractured with water or nitrogen-based fluidsand sand, although the shallower Mulky coal received fracturing treatments of 40-poundlinear gel and sand (Quarterly Review, 1993). On average, 5,000 pounds of sand wereused per foot of coal (Quarterly Review, 1993). Another technique used in Kansasconsists of injecting 4 barrels of 15 percent hydrochloric acid mixed with 16 barrels ofpotassium chloride and 15,000 standard cubic feet of nitrogen (Stoeckinger, 1990). In theSycamore Valley field in Kansas, Stroud Oil Properties used 426 barrels of cross-linkedfluid with 52 percent pad and 3 percent flush, and 30,000 pounds of 12/20 sand mixed atone to nine pounds per gallon injected at 20 barrels per minute. Operators were avoidinglarge-volume treatments due to a fear that fractures could be induced in thick water-bearing sands above and below the coals, which would have created excess waterproduction (Quarterly Review, 1993). Stoeckinger (2000) reports that current hydraulicfracturing practices in the Cherokee Basin in Kansas are water only, no gel, with nitrogenbeing popular and “slick-water down tubing.”
Pam Hudson, of the Oklahoma Corporation Commission, indicated that coalbed methaneextraction was beginning to grow in the Cherokee Basin in the northeastern section ofOklahoma, and more development was now centered on that region as opposed to theArkoma Basin to the south. Ms. Hudson expected that much of the development wouldbe focused on Washington, Nowata, and Craig Counties (Hudson, 2001).

EPA 816-R-04-003 Attachment 8The Western Interior Basin
Evaluation of Impacts to Underground Sources June 2004of Drinking Water by Hydraulic Fracturing ofCoalbed Methane Reservoirs A8-11
In Missouri, there appears to be little to no coalbed methane extraction within theCherokee Basin. David Smith, a geologist with the Missouri Geological Survey, statedthat coalbed methane extraction in Missouri is essentially non-existent (Smith, 2001).
8.3.3 Forest City Basin Production Activity
The Forest City Basin was relatively unexplored in 1993, with about ten coalbed wellsconcentrated in Kansas’ Atchison, Jefferson, Miami, Leavenworth, and Franklin Counties(Quarterly Review, 1993). The wells were hydraulically fractured with 500 to 30,000pounds (with an average of 5000 pounds) of sand proppant. The types of fluids usedduring the fracturing process were not mentioned (Quarterly Review, 1993).
David Smith, believes that at one time there were some coalbed methane wells just southof Kansas City in Cass County (Smith, 2001). Sherri Stoner, of the Missouri GeologicalSurvey, confirmed this in February 2001, and remarked that they were no longer inoperation (Stoner, 2001). An Iowa Division of Natural Resources Geological SurveyBureau geologist, Mary Howes, stated that presently there was no coalbed methaneproduction in Iowa (Howes, 2001).
Information concerning coalbed methane production activity in Nebraska could not befound.
8.4 Summary
Based on depths to the Hartshorne Coal and the base of fresh water presented in TableA8-1, it appears that coalbed methane extraction wells in the Arkoma Basin could becoincident with potential USDWs in Arkansas, potentially allowing for impacts. Basedon maps provided by the Oklahoma Corporation Commission (2001), which depicts thedepths to the10,000 mg/L of TDS groundwater quality boundary in Oklahoma, thelocation of coalbed methane wells and USDWs would most likely not coincide inOklahoma. This is based on depths to coals typically greater than 1,000 feet (Andrews etal., 1998) and depths to the base of the USDW typically shallower than 900 feet(Oklahoma Corporation Commission, 2001).
Table A8-2 supports the possibility that coalbed methane wells in the Cherokee Basintargeting the Cherokee Group coals in Kansas may coincide with USDWs, indicating thepotential for impacts to drinking water. In Missouri, more water quality data is requiredprior to any determination of coalbed methane well/USDW conflict. In addition, sinceonly a very small portion of the Cherokee Basin falls within the state, this portion of thebasin needs to be delineated more precisely to see which USDWs lay within this smallpart of the basin. However, current levels of coalbed methane activity in Missouri areminimal.

EPA 816-R-04-003 Attachment 8The Western Interior Basin
Evaluation of Impacts to Underground Sources June 2004of Drinking Water by Hydraulic Fracturing ofCoalbed Methane Reservoirs A8-12
Last, in the Forest City Basin, there appears to be little physical relationship betweencoalbeds that may be used for coalbed methane extraction and water supplies. However,aquifer and well information from the National Water Summary (1984) indicate that a co-location of the two could exist in Nebraska. More information would be needed to fullyinvestigate the relationship between coalbeds and USDWs in the Forest CityBasin.
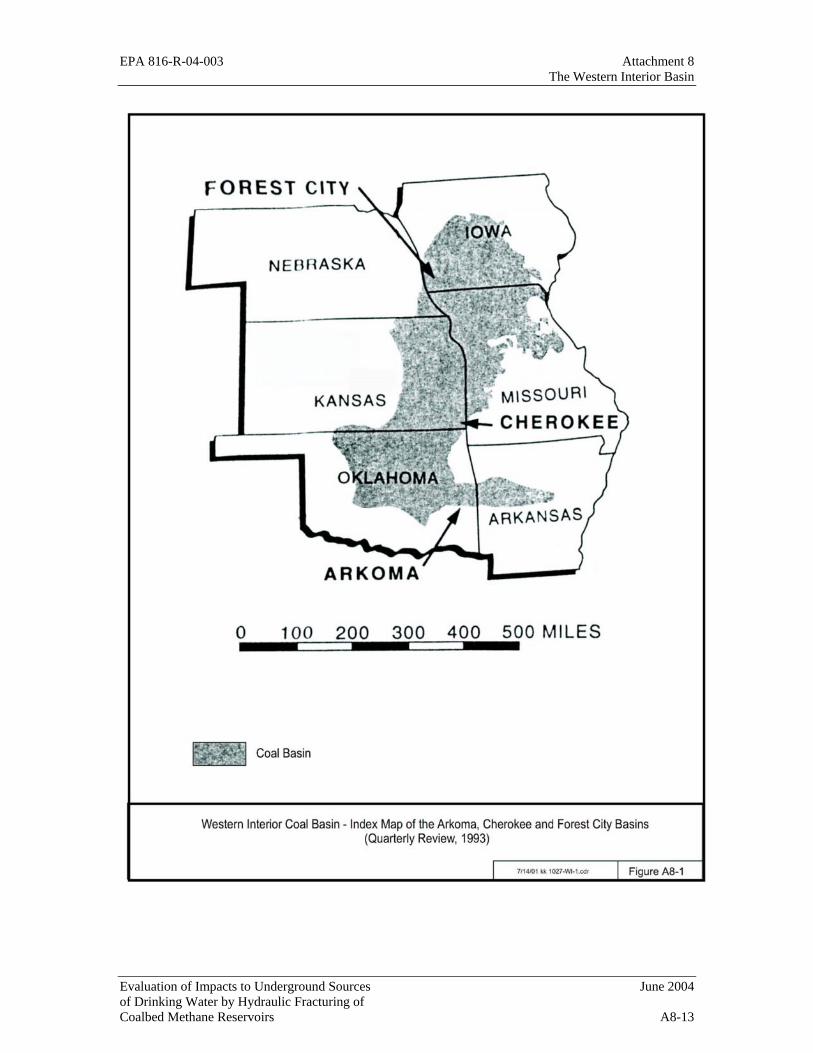
EPA 816-R-04-003 Attachment 8 The Western Interior Basin
Evaluation of Impacts to Underground Sources June 2004 of Drinking Water by Hydraulic Fracturing of Coalbed Methane Reservoirs A8-13

EPA 816-R-04-003 Attachment 8The Western Interior Basin
Evaluation of Impacts to Underground Sources June 2004of Drinking Water by Hydraulic Fracturing ofCoalbed Methane Reservoirs A8-14

EPA 816-R-04-003 Attachment 8The Western Interior Basin
Evaluation of Impacts to Underground Sources June 2004of Drinking Water by Hydraulic Fracturing ofCoalbed Methane Reservoirs A8-15

EPA 816-R-04-003 Attachment 8The Western Interior Basin
Evaluation of Impacts to Underground Sources June 2004of Drinking Water by Hydraulic Fracturing ofCoalbed Methane Reservoirs A8-16

EPA 816-R-04-003 Attachment 8The Western Interior Basin
Evaluation of Impacts to Underground Sources June 2004of Drinking Water by Hydraulic Fracturing ofCoalbed Methane Reservoirs A8-17

EPA 816-R-04-003 Attachment 8 The Western Interior Basin
Evaluation of Impacts to Underground Sources June 2004 of Drinking Water by Hydraulic Fracturing of Coalbed Methane Reservoirs A8-18

EPA 816-R-04-003 Attachment 8 The Western Interior Basin
Evaluation of Impacts to Underground Sources June 2004 of Drinking Water by Hydraulic Fracturing of Coalbed Methane Reservoirs A8-19

EPA 816-R-04-003 Attachment 8 The Western Interior Basin
Evaluation of Impacts to Underground Sources June 2004 of Drinking Water by Hydraulic Fracturing of Coalbed Methane Reservoirs A8-20

EPA 816-R-04-003 Attachment 8 The Western Interior Basin
Evaluation of Impacts to Underground Sources June 2004 of Drinking Water by Hydraulic Fracturing of Coalbed Methane Reservoirs A8-21

EPA 816-R-04-003 Attachment 8 The Western Interior Basin
Evaluation of Impacts to Underground Sources June 2004 of Drinking Water by Hydraulic Fracturing of Coalbed Methane Reservoirs A8-22

EPA 816-R-04-003 Attachment 8 The Western Interior Basin
Evaluation of Impacts to Underground Sources June 2004 of Drinking Water by Hydraulic Fracturing of Coalbed Methane Reservoirs A8-23

EPA 816-R-04-003 Attachment 8 The Western Interior Basin
Evaluation of Impacts to Underground Sources June 2004 of Drinking Water by Hydraulic Fracturing of Coalbed Methane Reservoirs A8-24

EPA 816-R-04-003 Attachment 8The Western Interior Basin
Evaluation of Impacts to Underground Sources June 2004of Drinking Water by Hydraulic Fracturing ofCoalbed Methane Reservoirs A8-25

EPA 816-R-04-003 Attachment 8The Western Interior Basin
Evaluation of Impacts to Underground Sources June 2004of Drinking Water by Hydraulic Fracturing ofCoalbed Methane Reservoirs A8-26
REFERENCES
Andrews, Richard D., Cardott, Brian J., and Storm, Taylor. 1998. The Hartshorne Playin Southeastern Oklahoma: regional and detailed sandstone reservoir analysis andcoalbed-methane resources. Oklahoma Geological Survey, Special Publication98-7.
Arkansas Geological Commission Web site. 2001. http://www.state.ar.us/agc.htm.
Bostic, Joy L., Brady, L. L., Howes, M. R., Burchett, R. R., and Pierce, B. S. 1993.Investigation of the coal properties and the potential for coal-bed methane in theForest City Basin. U. S. Geological Survey, Open File Report 93-576.
Brady, L. L. 2002. Kansas Geological Survey. Personal communication.
Burchett, Raymond R. No date specified. Coalbed methane potential in the Nebraskaportion of the Forest City Basin. Institute of Agriculture and Natural Resources,University of Nebraska-Lincoln.
Cardott, Brian J. 2001. Coalbed -Methane Activity in Oklahoma, 2001. OklahomaCoalbed-Methane Workshop 2001: Oklahoma Geological Survey, Open FileReport 2-2001, p. 93-118.
Charpentier, Ronald R. 1995. Cherokee Platform Province. U. S. Geological Survey,National Assessment of United States Oil and Gas Resources.
Condra, G. E. and Reed, E. C. 1959. The geological section of Nebraska. NebraskaGeological Survey Bulletin 14A, 1959.
Cordova, Robert M. 1963. Reconnaissance of the ground-water resources of theArkansas Valley Region, Arkansas. Contributions to the Hydrology of the UnitedStates, Geological Survey Water-Supply Paper 1669-BB.
DASC website. 2001a. Glacial drift base map.http://gisdasc.kgs.ukans.edu/dasc/kanview.html.
DASC website. 2001b. Kansas elevation map.http://gisdasc.kgs.ukans.edu/dasc/kanview.html.
DASC website. 2001c. Ozark Aquifer base map.http://gisdasc.kgs.ukans.edu/dasc/kanview.html.

EPA 816-R-04-003 Attachment 8The Western Interior Basin
Evaluation of Impacts to Underground Sources June 2004of Drinking Water by Hydraulic Fracturing ofCoalbed Methane Reservoirs A8-27
Flowerday, C. F., Kuzelka, R. D., and Pederson, D. T., compilers. 1998. The GroundWater Atlas of Nebraska.
Friedman, Samuel A. 1982. Determination of reserves of methane from coalbeds for usein rural communities in eastern Oklahoma. Oklahoma Geological Survey, SpecialPublication 82-3, 1982.
Gas Technology Institute (GTI) website. 2002. Drilling and Production Statistics forMajor US Coalbed Methane and Gas Shale Reservoirs.http://www.gastechnology.org
Hansen, D. 2001. Arkansas Geological Commission. Personal communication.
Howes, M. R. 2001. Iowa Geological Survey Bureau. Personal communication.
Howes, M. R. 2002. Iowa Geological Survey Bureau. Personal communication.
Hudson, P. 2001. Oklahoma Corporation Commission. Personal communication.
Iannacchione, A.T., and D.G. Puglio. 1979. Methane content and geology of theHartshorne coalbed in Haskell and Le Flore Counties, Oklahoma: U.S. Bureau ofMines Report of Investigations 8407, 14 p.
Jokel, M. 2001. Nebraska Conservation and Survey Division. Personal communication.
Luza, K. 2001. Oklahoma Geological Survey. Personal communication.
Macfarlane, A. 2001. Kansas Geological Survey. Personal communication.
Macfarlane, P. A. and Hathaway, L. R. 1987. The Hydrologic and Chemical Quality ofGround Waters from the Lower Paleozoic Aquifers in the Tri-State Region ofKansas, Missouri, and Oklahoma: Kansas Geological Survey Groundwater Series9.
Marcher, M. V. 1969. Reconnaissance of the Water Resources of the Fort SmithQuadrangle, East-Central Oklahoma: Oklahoma Geological Survey HydrologicAtlas 1.
Marcher, M. V. and Bingham. 1971. Reconnaissance of the Water Resources of theTulsa Quadrangle, Northeastern Oklahoma: Oklahoma Geological SurveyHydrologic Atlas 2.

EPA 816-R-04-003 Attachment 8The Western Interior Basin
Evaluation of Impacts to Underground Sources June 2004of Drinking Water by Hydraulic Fracturing ofCoalbed Methane Reservoirs A8-28
Marshall, R. 2001. Midcontinent Evolving Coalbed-Methane Completion Techniquesand Practices. Oklahoma Coalbed-Methane Workshop 2001: OklahomaGeological Survey, Open File Report 2-2001, p. 140-150.
Missouri Division of Geological Survey and Water Resources. 1967. Mineral & WaterResources of Missouri, 43(2).
Nelson, Charles R. 1999. Changing perceptions regarding the size and productionpotential of coalbed methane resources. Gas Research Institute, June 1999.
Netzler, Bruce W. 1982. Maps of total dissolved solids concentrations in ground waterfrom the Mississippian aquifers, the Jefferson City, Cotter and Powell Dolomites,and the Roubidoux Formation in Missouri.
National Water Summary. 1984. Hydrologic events, selected water-quality trends, andground-water resources. United States Geological Survey Water-Supply PaperNo. 2275.
Oklahoma Coal Database, January 17, 2001.
Oklahoma Corporation Commission, Depth to Base of Treatable Water Map Series,2001.
Oklahoma Geological Survey website. 2001. http://www.ou.edu/special/ogs-pttc.
Petroleum Technology Transfer Council website. 1999. http://www.pttc.org.
Potts, Ronald. 1987. Water Quality and Quantity in Abandoned Underground CoalMines of West-Central Arkansas and Use of Surface Electrical Resistivity inAttempting Quality Determinations. Arkansas Geological Commission -Information Circular 20-N.
Prior, W. 2001. Arkansas Geological Commission. Personal communication.
Quarterly Review. 1993. Coalbed Methane – State of the Industry. Methane From CoalSeams Technology, August 1993.
Stoeckinger, William T. 1990. Kansas coalbed methane comes on stream. Oil & GasJournal, June 4, 1990.
Stoeckinger, William T. 2000. Coalbed Methane Completion Practices on the CherokeePlatform. Oklahoma Coalbed-Methane Workshop: Oklahoma Geological Survey,Open-File Report OF 2-2000, pp. 36-51.

EPA 816-R-04-003 Attachment 8The Western Interior Basin
Evaluation of Impacts to Underground Sources June 2004of Drinking Water by Hydraulic Fracturing ofCoalbed Methane Reservoirs A8-29
Smith, D. 2001. Missouri Geological Survey. Personal communication.
Smith, D. 2002. Missouri Geological Survey. Personal communication.
Stoner, S. 2001. Missouri Geological Survey. Personal communication.
Tedesco, Steven A. 1992. Coalbed methane potential assessed in Forest City Basin. Oil& Gas Journal, Exploration, February 10, 1992.
Vandike, J. 2001. Missouri Geological Survey. Personal communication.
Wendell, John H. JR. 2001. Arkoma Basin Coalbed-Methane Potential and Practices.Oklahoma Coalbed-Methane Workshop 2001: Oklahoma Geological Survey,Open File Report 2-2001, pp. 119-139.

EPA 816-R-04-003 Attachment 9 The Raton Basin
Evaluation of Impacts to Underground Sources June 2004of Drinking Water by Hydraulic Fracturing ofCoalbed Methane Reservoirs A9-1
Attachment 9The Raton Basin
The Raton Basin covers an area of about 2,200 square miles in southeastern Colorado andnortheastern New Mexico (Figure A9-1). It is the southernmost of several major coal-bearing basins along the eastern margin of the Rocky Mountains. The basin extends 80miles north to south and as much as 50 miles east and west (Stevens et al., 1992). It is anelongate asymmetric syncline, with 20,000 to 25,000 feet of sedimentary rock in thedeepest part. Coalbed methane resources in the basin, which have been estimated atapproximately 10.2 trillion cubic feet (Tcf), are contained in the upper CretaceousVermejo Formation and upper Cretaceous and Paleocene Raton Formation (Stevens etal., 1992). In 2000, the average gas production rate per well in the Raton Basin was closeto 300,000 cubic feet per day, and annual production was 30.8 billion cubic feet (Bcf)(GTI, 2002).
9.1 Basin Geology
The Raton structural basin is an asymmetric synclinal sedimentary basin containingsedimentary rocks as old as Devonian overlying basement Precambrian rocks, withHolocene sediments at the surface. The coal occurs in the Vermejo and the RatonFormations, which overlie the Trinidad Sandstone, a basin-wide regressive marinesandstone (Figure A9-2). The Vermejo and Raton Formations consist of deltaic lowercoastal plain and fluvial deposits (Flores and Pillmore, 1987). Numerous discontinuousand thin coalbeds are located in the Vermejo Formation and the Raton Formation, whichoverlie the Trinidad Sandstone (Figure A9-3). The top of the Trinidad Sandstone formsthe lower boundary of the Raton coal basin as shown in Figure A9-1. Development ofcoalbed methane wells has focused on development of the Vermejo coals rather than theRaton coals because the former are thicker and more abundant. The coalbeds are oflimited extent and cannot be correlated over more than a few miles.
Individual coalbeds in the Vermejo Formation range from a few inches to about 14 feetthick, and total coal thickness typically ranges from 5 to 35 feet. An isopach map of totalcoal thickness in the Vermejo Formation, based on 92 well logs and measured sections,was published by Stevens et al. (1992) (Figure A9-4). Total coal thickness in the RatonFormation ranges from 10 feet to greater than 140 feet, with individual seams rangingfrom several inches to greater than 10 feet thick. Although the Raton Formation is muchthicker and contains more total coal than the Vermejo Formation, individual coal seamsin the Raton are less continuous and generally thinner. Additionally, because ofextensive erosion of the Raton Formation, particularly in the eastern part of the basin,much of the original coal is no longer present (Stevens et al., 1992). Between 5 and 15individual coalbeds produce coalbed methane for wells in the basin (Hemborg, 1996).

EPA 816-R-04-003 Attachment 9 The Raton Basin
Evaluation of Impacts to Underground Sources June 2004of Drinking Water by Hydraulic Fracturing ofCoalbed Methane Reservoirs A9-2
Middle Tertiary igneous intrusions are present in the central part of the basin (Steven,1975). Sills and dikes have invaded sediments of the basin including both the Vermejoand Raton Formations. Sills have intruded along the coal seams destroying tremendousquantities of coal (Carter, 1956).
Coal seam depth is an important variable used to estimate gas production potential.Figure A9-5 is a thickness of overburden map from Stevens et al. (1992). The mapshows the depth below land surface to the midpoint depth of the coal-bearing interval,using coal thickness as a weighting factor. Overburden thickness ranges from less than500 feet near the basin perimeter to greater than 4,100 feet in the deep northwestern partof the basin. Many of the differences in thickness of overburden can be attributed tovariations in topography and are thus a consequence of erosion and not necessarilysubsurface geologic structure.
Stratigraphic cross-sections constructed to illustrate the regional subsurface geologicstructure and the distribution of coal seams and igneous intrusions, as well as the areallocations of these cross-sections, are shown in Figures A9-6 through A9-8. The cross-sections use the top of the Trinidad Sandstone as the horizontal datum. The VermejoFormation has a relatively uniform thickness of about 350 feet throughout the basin. TheRaton Formation varies from about 0 to 2,100 feet thick. It grades westward into and isoverlain by the conglomeratic Poison Canyon Formation (Flores, 1987; Flores andPillmore, 1987).
A study of the relationship between coal cleat orientation and the compression stressesdue to tectonic forces can indicate areas likely to have increased coal seam permeabilityand provide increased coalbed methane yield (Stevens et al., 1992). Cleats, or small-scale fractures in the coal, are commonly oriented perpendicularly to the maximum stress.These fractures tend to expand, thereby providing greater permeability and coalbedmethane yields on the axes of the anticlines, such as the Vermejo Park anticline. Wellsdrilled near the axis of the La Veta syncline, in contrast, did not encounter adequatepermeability (Stevens et al., 1992). Initially it was thought that sills that intrude along thebedding plane of the coal seams would reduce methane production, but several operatorshave noted that elevated methane contents have sometimes been measured in coal seamsthat have been intruded by igneous rocks (Stevens et al., 1992).
9.2 Basin Hydrology and USDW Identification
Regional groundwater flow in the Raton Basin is dependent on geologic structure andtopography. Regional flow is generally down-slope from west to east or southeast(Figure A9-9). In the northern part of the basin, however, flow is radial away fromSpanish Peaks (Howard, 1982; Geldon, 1990). Additionally, along the eastern margin ofthe basin, sediments dip to the west and groundwater flow is locally down-dip to thewest. While recharge occurs primarily at elevations greater than 7,500 feet, discharge is

EPA 816-R-04-003 Attachment 9 The Raton Basin
Evaluation of Impacts to Underground Sources June 2004of Drinking Water by Hydraulic Fracturing ofCoalbed Methane Reservoirs A9-3
mainly through streams and by evapotranspiration in the central and eastern parts of thebasin.
Principle bedrock aquifers in the basin are the Cuchara-Poison Canyon, the Raton-Vermejo-Trinidad, the Fort Hayes-Codell, the Dakota-Purgatoire, and the Entrada(Geldon, 1990) (Figure A9-3). The pressure regime in the basin is poorly understood.Under-pressured conditions, or hydraulic heads in deep bedrock aquifers that are lowerthan those in shallow formations, appear to exist throughout much of the basin (Howard,1982; Geldon, 1990; Tyler et al., 1995). This hydraulic head difference suggests that thedeep bedrock aquifers are not in communication with shallow formations. Meteoriccirculation, however, is indicated by the regional freshness of the produced waters(Stevens et al., 1992; Tyler et al., 1995).
All of the water produced along with coalbed methane in the Raton Basin has a totaldissolved solids (TDS) content of less than 10,000 milligrams per liter (mg/L) (the waterquality criterion for an underground source of drinking water (USDW)), and the aquifersfrom which the gas is produced meet the water quality criterion for a USDW (NationalWater Summary, 1984). A scatter diagram of potentiometric head versus TDS fromcoalbed methane wells in the Raton Basin (Figure A9-10) shows little correlationbetween potentiometric head and water quality. More importantly, this figure shows thatall of the water had less than 10,000 mg/L of TDS, nearly all had a TDS of less than2,500 mg/L, and more than half had a TDS of less than 1,000 mg/L. Two producers usedinjection wells for disposal, but operating permits issued to one gas producer (EvergreenResources, Inc.) by the Colorado Department of Public Health and Environment alloweddischarge of produced water into streambeds and stock ponds, indicating that the waterwas not too saline for surface discharge. Hemborg (1998) suggests that the wellsyielding larger quantities of groundwater might be connected to the underlying water-bearing Trinidad Sandstone.
9.3 Coalbed Methane Production Activity
Hydraulic fracturing employed for enhancement of coalbed methane production isdesigned to enable gas within the rock to flow more readily to an extraction well.Coalbed methane well stimulation using hydraulic fracturing techniques is a commonpractice in the Raton Basin. Records show that fluids used are typically gels and waterwith sand proppants.
Hemborg (1996) reported that the average water production from coalbed methane wellsin the Raton Basin was 700 barrels per million cubic feet (Mcf), and average dailyproduction for 42 wells in the Spanish Peak Field was 0.309 Mcf (Hemborg, 1998).Conversion of these rates from coalbed methane industry units to those commonly usedfor water supplies gives an average water production rate for those wells of only 6.3

EPA 816-R-04-003 Attachment 9 The Raton Basin
Evaluation of Impacts to Underground Sources June 2004of Drinking Water by Hydraulic Fracturing ofCoalbed Methane Reservoirs A9-4
gallons per minute. These rates are generally not considered sufficient for public watersupply or irrigation; however, they meet the water supply volume criterion for a USDW.
Hemborg (1998) showed that in most cases water yield decreased dramatically as coalbedmethane production continued over time (Figure A9-11). However, some wells exhibitedincreased water production as coalbed methane production continued or increased overtime (Figure A9-12). Two causal factors were suggested (Hemborg, 1998) for the rise inwater production:
1. Well stimulation had increased the well’s zone of capture to include adjacentwater-bearing sills or sandstones that were hydraulically connected torecharge areas; or
2. Well stimulation had created a connection between the coal seams and theunderlying water-bearing Trinidad Sandstone.
The Trinidad Sandstone is a bedrock aquifer confined by the Pierre Shale below and theshales and siltstones of the Vermejo Formation above (Figure A9-2). The TrinidadSandstone exhibits low vertical and horizontal permeabilities of 0.186 and 0.109 metersper day, respectively, as reported by Howard (1982) in Stevens et al. (1992). One gascompany reported that lower water production and improved gas production wereachieved by avoiding known water-bearing horizons and by selectively completing thecoal zones (Quarterly Review, 1993).
In-place coalbed methane resources in the Vermejo and Raton Formations were estimatedby Stevens (1992) to be between 8.4 and 12.1 Tcf with a mean estimate of 10.2 Tcf. Asof 1992, 114 coalbed methane exploration wells had been drilled in the basin (QuarterlyReview, 1993). Soon after the Picketwire Lateral was constructed to convey gas from thefields to Trinidad and then to markets, gas well development in the basin increasedsignificantly. The Purgatoire River Valley (Figure A9-1), which had been identified ashaving the highest coalbed methane potential in the basin, up to 8 Bcf per square mile(Stevens et al., 1992), became the focus of development. The Purgatoire Valley area wasconsidered favorable for development because total coal thickness ranges from 5 to over15 feet, drilling depths are shallow and coalbed methane content is high. The NewMexico portion of the basin was estimated to have methane resources ranging from 4 Bcfper square mile in the southern and eastern margins of the basin to more than 8 Bcf persquare mile in the area south of the Vermejo Park anticline. Coal seams in the VermejoPark area (Figure A9-1) are relatively thick, but shallow and of low rank, makingestimates of coalbed methane content relatively low (Stevens et al., 1992).
The Spanish Peak Field, in the Purgatoire River development area in Las Animas County,Colorado (Figure A9-1), had 53 active wells in December 1996. Plans had beenannounced by Evergreen Resources, Inc. to drill and complete an additional 40 wells in1997 (Hemborg, 1998). In 1996, the Purgatoire development area was projected to be

EPA 816-R-04-003 Attachment 9 The Raton Basin
Evaluation of Impacts to Underground Sources June 2004of Drinking Water by Hydraulic Fracturing ofCoalbed Methane Reservoirs A9-5
capable of producing 122-137 Mcf per day in 3 to 4 years (Figure A9-1) (Hemborg,1996). Total coalbed methane production within the Raton Basin was 30.8 Bcf per yearin 2000 (GTI, 2002).
Methane production wells have generally been completed with 5.5-inch (outer diameter)casing with two to eight perforations per foot through the casing at the depths of the coalseams. The coal seams are stimulated with hydraulic fracturing treatments of sand andgelled-water, but detailed information on the nature, volumes, and use of hydraulicfracturing fluids in gas well development in this basin are not readily available. Waterand gels with 10/40-mesh sand proppant seem to be the fluids of choice for fracturingpractices in the Raton Basin. Stevens et al. (1992) report that multiple zones in one wellare typically developed with 200,000 pounds of 10/20 or 20/40-mesh sand with 100,000gallons of cross-linked gel per well. In one series of tests, wells were hydraulicallyfractured with 283,000 to 532,000 pounds of 12/20 and 20/40-mesh sand as proppant and110,000 to 769,000 barrels of water or gel. The wells were fractured in two stages, onefor a 25-foot thick upper zone and another for a 75-foot thick lower zone (QuarterlyReview, 1993). Relatively high rates of water flow in these wells may be the result offractures penetrating sandstones as well as coal seams. Another set of tests led a differentmethane producer to conclude that high water production was the consequence ofinduced fractures that intercept water-bearing sandstone and intrusive rocks. Whileoperators initially assumed that large hydraulic fracture stimulations were necessary tolink the thin and widely-spaced coal seams, it was found that such fracturing increasedunwanted water production from associated sandstones, sills and water-bearing faults(Quarterly Review, 1993).
9.4 Summary
There are two major coal formations in the Raton Basin, the Vermejo Formation and theRaton Formation. The Vermejo coals range in thickness from 5 to 35 feet while theRaton coal layers range from 10 to over 140 feet thick. The coal seams of the Vermejoand Raton Formations, developed for methane production, also contain water that meetsthe water quality criteria for a USDW; therefore, it can be assumed that the Raton Basincoals are located within a USDW. The Cuchara-Poison Canyon, Fort Hayes-Codell,Dakota-Purgatoire, Entrada and Trinidad Sandstone and other sandstone beds within theVermejo and Raton Formations, as well as intrusive dikes and sills, also contain water ofsufficient quality to meet the USDW water quality criteria. Hydraulic fracturing maycreate connections to the Trinidad Sandstone, as shown by increases in water withdrawalfrom production wells over time. On the other hand, hydraulic connections to otheradjacent water-bearing formations may also account for the increase in water production.

EPA 816-R-04-003 Attachment 9 The Raton Basin
Evaluation of Impacts to Underground Sources June 2004of Drinking Water by Hydraulic Fracturing ofCoalbed Methane Reservoirs A9-6

EPA 816-R-04-003 Attachment 9 The Raton Basin
Evaluation of Impacts to Underground Sources June 2004of Drinking Water by Hydraulic Fracturing ofCoalbed Methane Reservoirs A9-7

EPA 816-R-04-003 Attachment 9 The Raton Basin
Evaluation of Impacts to Underground Sources June 2004of Drinking Water by Hydraulic Fracturing ofCoalbed Methane Reservoirs A9-8

EPA 816-R-04-003 Attachment 9 The Raton Basin
Evaluation of Impacts to Underground Sources June 2004of Drinking Water by Hydraulic Fracturing ofCoalbed Methane Reservoirs A9-9

EPA 816-R-04-003 Attachment 9 The Raton Basin
Evaluation of Impacts to Underground Sources June 2004of Drinking Water by Hydraulic Fracturing ofCoalbed Methane Reservoirs A9-10
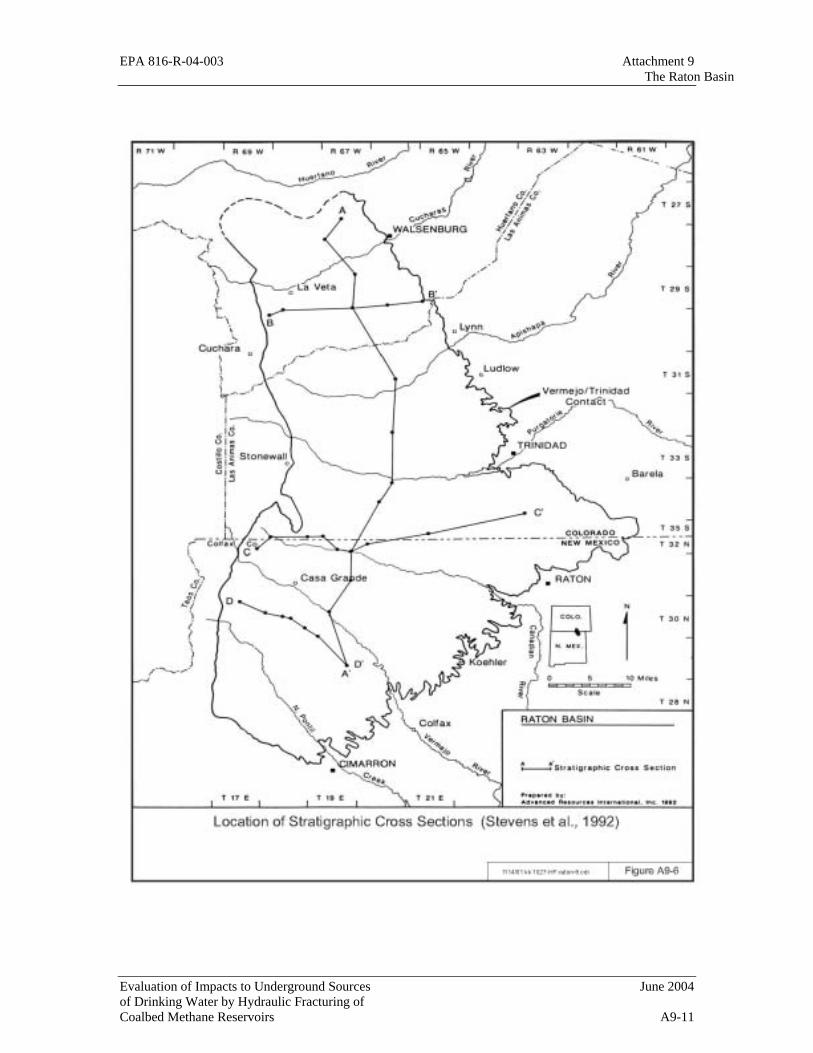
EPA 816-R-04-003 Attachment 9 The Raton Basin
Evaluation of Impacts to Underground Sources June 2004of Drinking Water by Hydraulic Fracturing ofCoalbed Methane Reservoirs A9-11

EPA 816-R-04-003 Attachment 9 The Raton Basin
Evaluation of Impacts to Underground Sources June 2004of Drinking Water by Hydraulic Fracturing ofCoalbed Methane Reservoirs A9-12

EPA 816-R-04-003 Attachment 9 The Raton Basin
Evaluation of Impacts to Underground Sources June 2004of Drinking Water by Hydraulic Fracturing ofCoalbed Methane Reservoirs A9-13

EPA 816-R-04-003 Attachment 9 The Raton Basin
Evaluation of Impacts to Underground Sources June 2004of Drinking Water by Hydraulic Fracturing ofCoalbed Methane Reservoirs A9-14

EPA 816-R-04-003 Attachment 9 The Raton Basin
Evaluation of Impacts to Underground Sources June 2004of Drinking Water by Hydraulic Fracturing ofCoalbed Methane Reservoirs A9-15

EPA 816-R-04-003 Attachment 9 The Raton Basin
Evaluation of Impacts to Underground Sources June 2004of Drinking Water by Hydraulic Fracturing ofCoalbed Methane Reservoirs A9-16

EPA 816-R-04-003 Attachment 9 The Raton Basin
Evaluation of Impacts to Underground Sources June 2004of Drinking Water by Hydraulic Fracturing ofCoalbed Methane Reservoirs A9-17

EPA 816-R-04-003 Attachment 9 The Raton Basin
Evaluation of Impacts to Underground Sources June 2004of Drinking Water by Hydraulic Fracturing ofCoalbed Methane Reservoirs A9-18
REFERENCES
Carter, D. A. 1956. Coal deposits of the Raton Basin; in McGinnis, C. J., ed., Geologyof the Raton Basin, Colorado: Rocky Mountain Association of GeologistsGuidebook, pp. 89-92
Gas Technology Institute (GTI) Web site. 2002. Drilling and Production Statistics forMajor US Coalbed Methane and Gas Shale Reservoirs.http://www.gastechnology.org.
Geldon, A. L. 1990. Ground-water hydrology of the Central Raton Basin, Colorado andNew Mexico: U.S. Geological Survey Water-Supply Paper 2288, 81 p.
Flores, R. M. 1987. Sedimentology of Upper Cretaceous and Tertiary silliciclastics andcoals in the Raton Basin, New Mexico and Colorado, in Lucas, S. G., and Hunt,A. Pl, eds., Northeastern New Mexico: New Mexico Geological Society Annual38th Field Conference, pp. 255-264.
Flores, R. M., and Pillmore, C. L. 1987. Tectonic control on alluvial paleoarchitectureof the Cretaceous and Tertiary Raton Basin, Colorado and New Mexico, inEthridge, F. G., Flores, R. M., and Harvey, M. D., eds., Recent developments inFluvial Sedimentology: Society of Economic Paleontologists and MineralogistsSpecial Publication 39, pp. 311-321.
Hemborg, H. T. 1998. Spanish Peak Field, Las Animas County, Colorado: Geologicsetting and early development of a coalbed methane reservoir in the Central RatonBasin. Colorado Geological Survey, Dept. of Natural Resources, Denver, CO,Resource Series 33, 34 p.
Hemborg, H. T. 1996. Raton Basin coalbed methane production picking up in Colorado.Oil & Gas Journal, pp.101-102 (Nov 11. 1996).
Howard, W.B. 1982. The Hydrogeology of the Raton Basin, South-Central Colorado.M.A. Thesis, Department of Geology, Indiana University.
National Water Summary. 1984. Hydrologic events, selected water-quality trends, andground-water resources. United States Geological Survey Water-Supply PaperNo. 2275.
Oldaker, P., Stevens, S.H., Lombardi, T.E., Kelso, B.S., and McBane, R.A. 1993.Geologic and hydrologic controls on coalbed methane resources in the RatonBasin. Proceedings of the 1993 International Coalbed Methane Symposium,Tuscaloosa, AL, pp. 69-78 (May 17-21, 1993).

EPA 816-R-04-003 Attachment 9 The Raton Basin
Evaluation of Impacts to Underground Sources June 2004of Drinking Water by Hydraulic Fracturing ofCoalbed Methane Reservoirs A9-19
Quarterly Review of Methane from Coal Seams Technology. 1993. Raton BasinColorado and New Mexico. Methane from Coal Seams Technology, pp. 33-36(August).
Steven, T. A., 1975. Middle Tertiary Volcanic field in the southern Rocky Mountains: inCurtis, B. F., ed. Cenozoic History of the Southern Rocky Mountains: GeologicalSociety of America Memoir 144, pp. 75-91.
Stevens, S., Lombardi, T. E., Kelso B. S., and Coates, J. M. 1992. A geologicassessment of natural gas from coal seams in the Raton and Vermejo Formations,Raton Basin. GRI Topical Report 92/0345, 84 pp.
Tyler, R., Kaiser, W. R., Scott, A. R., Hamilton, D. S., and Ambrose, W. A. 1995.Geologic and hydrologic assessment of natural gas from coal: Greater GreenRiver, Piceance, Powder River, and Raton Basins, Western United States: Austin,Tex., Bureau of Economic Geology, Report of Investigations 228, 219 p.


