TRANSPORTATION RESEARCH RECORD 1115 113 Evaluation of Indirect Tensile Tests for Assessing Stripping of Alabama Asphalt Concrete Mixtures FRAZIER PARKER, JR., AND FouAo A. GHARAYBEH Stripping In asphalt concrete bas long been recogni7.ed as a cause of premature pavement damage. Yet, after many years of research and application, there are few generally accepted conclusions about the severity of the problem, the nature and causes of the process, or methods for evaluating stripping. The evolution of test procedures for assessing stripping potential appears to be progressing toward procedures that measure strength loss of moisture-conditioned mixtures compacted to 6 to 8 percent voids. Indirect tensile tests were performed on asphalt concrete mixes composed of materials common in Ala- bama. The purpose of these tests was to study the stripping process and to evaluate the test procedure for assessing strip- ping potential. Results Indicate that published moisture-condi- tioning procedures produce variable strength loss but that either of the two procedures evaluated is acceptable. Results also Indicate that asphalt cement content, as well as type of mix, has a significant influence on test results and that gener- alities concerning stripping potential of aggregate sources, types, and blends are not valid. Finally, test results did not distinctly delineate reported stripping and nonstrlpping aggre- gate combinations. Reasons may be that the reported perfor- mance of an aggregate combination Is not valid for all mix types, or that the test Is not a positive indicator of stripping potential. The former Is more likely, but Incorrect predictions for specific mixes are a definite possibility. Implications are that specific mix designs must be tested and results conser- vatively Interpreted until field performance studies permit fur- ther refinements. Stripping in asphalt concrete has long been recognized as a cause of premature pavement damage. In 1938 Hubbard wrote, "It [stripping] has been observed ... ever since asphalt paving came into existence" (1, p. 239). Yet, after many years of research and application, there are few generally accepted conclusions about the severity of the problem, the nature and cause of the process, or methods for evaluating the stripping potential of asphalt-aggregate mixtures. Tunnicliff and Root (2), in the latest of a series of extensive studies of stripping, found no agreement on the severity of the problem, the causes of stripping, or test procedures for predicting stripping. This lack of consensus is not surprising given the complexity of the process. Stripping was initially considered to be the separation of asphalt coatings from aggregate surfaces (3 ). This is still considered the dominant failure mode, but some re- searchers have added that a loss of cohesion in the asphalt cement may also result (4). Compounding the complexity are numerous contributing factors (i.e., coarse and fine aggregate Civil Engineering Department, Auburn University, Auburn, Ala. 36849-3501. properties, asphalt cement properties, mix design, construction conditions, environment, and traffic). The evolution of test procedures for assessing stripping po- tential appears to be progressing toward procedures that mea- sure strength or modulus loss (loss of adhesion or cohesion, or both) of mixtures (particular aggregate and asphalt proportions) that have been compacted and conditioned (construction, en- vironment, and traffic). This appears to be a logical choice because loss of strength is the most serious consequence of stripping. However, tests that attempt to measure other funda- mental properties are still used. Some of these listed by Taylor and Khosla (5) are static immersion, dynamic immersion, chemical immersion, boiling, abrasion, simulated traffic, swell, and stress pedestal. Evolution of loading has progressed from compression, as standardized in ASTM Method D 1075, to tensile (2, 6-11). Sample preparation has evolved from standard Marshall or Hveem procedures to procedures that compact aged mix to controlled void contents. Conditioning has progressed from simple soaking to vacuum saturation followed by various com- binations of freezing, thawing, and soaking. The objective of the research reported herein was to evaluate indirect tensile tests for assessing the stripping potential of asphalt-aggregate mixtures made from typical Alabama mate- rials. Five aggregate combinations were tested. LABORATORY TESTS Tests on compacted mixtures to evaluate moisture damage have historically compared strength or modulus of moisture-condi- tioned specimens with strength or modulus of unconditioned specimens. This comparison has been made by computing a strength or modulus ratio by dividing the conditioned strength or modulus by the unconditioned strength or modulus. There have been numerous differences in proposed test pro- cedures. These variations can cause differences in measured strength and modulus values and, therefore, differences in strength or modulus ratios. Consideration of these differences is necessary when evaluating test procedures and selecting limiting criteria. Variations have been in the following general areas: 1. Sample preparation, 2. Moisture conditioning, 3. Loading conditions, and 4. Interpretation of test results. Each will be discussed and details used in this study noted.
Transcript
TRANSPORTATION RESEARCH RECORD 1115 113
Evaluation of Indirect Tensile Tests for Assessing Stripping of Alabama Asphalt Concrete Mixtures FRAZIER PARKER, JR., AND FouAo A. GHARAYBEH
Stripping In asphalt concrete bas long been recogni7.ed as a cause of premature pavement damage. Yet, after many years of research and application, there are few generally accepted conclusions about the severity of the problem, the nature and causes of the process, or methods for evaluating stripping. The evolution of test procedures for assessing stripping potential appears to be progressing toward procedures that measure strength loss of moisture-conditioned mixtures compacted to 6 to 8 percent voids. Indirect tensile tests were performed on asphalt concrete mixes composed of materials common in Alabama. The purpose of these tests was to study the stripping process and to evaluate the test procedure for assessing stripping potential. Results Indicate that published moisture-conditioning procedures produce variable strength loss but that either of the two procedures evaluated is acceptable. Results also Indicate that asphalt cement content, as well as type of mix, has a significant influence on test results and that generalities concerning stripping potential of aggregate sources, types, and blends are not valid. Finally, test results did not distinctly delineate reported stripping and nonstrlpping aggregate combinations. Reasons may be that the reported performance of an aggregate combination Is not valid for all mix types, or that the test Is not a positive indicator of stripping potential. The former Is more likely, but Incorrect predictions for specific mixes are a definite possibility. Implications are that specific mix designs must be tested and results conservatively Interpreted until field performance studies permit further refinements.
Stripping in asphalt concrete has long been recognized as a cause of premature pavement damage. In 1938 Hubbard wrote, "It [stripping] has been observed ... ever since asphalt paving came into existence" (1, p. 239). Yet, after many years of research and application, there are few generally accepted conclusions about the severity of the problem, the nature and cause of the process, or methods for evaluating the stripping potential of asphalt-aggregate mixtures. Tunnicliff and Root (2), in the latest of a series of extensive studies of stripping, found no agreement on the severity of the problem, the causes of stripping, or test procedures for predicting stripping.
This lack of consensus is not surprising given the complexity of the process. Stripping was initially considered to be the separation of asphalt coatings from aggregate surfaces (3 ). This is still considered the dominant failure mode, but some researchers have added that a loss of cohesion in the asphalt cement may also result (4). Compounding the complexity are numerous contributing factors (i.e., coarse and fine aggregate
Civil Engineering Department, Auburn University, Auburn, Ala. 36849-3501.
properties, asphalt cement properties, mix design, construction conditions, environment, and traffic).
The evolution of test procedures for assessing stripping potential appears to be progressing toward procedures that measure strength or modulus loss (loss of adhesion or cohesion, or both) of mixtures (particular aggregate and asphalt proportions) that have been compacted and conditioned (construction, environment, and traffic). This appears to be a logical choice because loss of strength is the most serious consequence of stripping. However, tests that attempt to measure other fundamental properties are still used. Some of these listed by Taylor and Khosla (5) are static immersion, dynamic immersion, chemical immersion, boiling, abrasion, simulated traffic, swell, and stress pedestal.
Evolution of loading has progressed from compression, as standardized in ASTM Method D 1075, to tensile (2, 6-11). Sample preparation has evolved from standard Marshall or Hveem procedures to procedures that compact aged mix to controlled void contents. Conditioning has progressed from simple soaking to vacuum saturation followed by various combinations of freezing, thawing, and soaking.
The objective of the research reported herein was to evaluate indirect tensile tests for assessing the stripping potential of asphalt-aggregate mixtures made from typical Alabama materials. Five aggregate combinations were tested.
LABORATORY TESTS
Tests on compacted mixtures to evaluate moisture damage have historically compared strength or modulus of moisture-conditioned specimens with strength or modulus of unconditioned specimens. This comparison has been made by computing a strength or modulus ratio by dividing the conditioned strength or modulus by the unconditioned strength or modulus.
There have been numerous differences in proposed test procedures. These variations can cause differences in measured strength and modulus values and, therefore, differences in strength or modulus ratios. Consideration of these differences is necessary when evaluating test procedures and selecting limiting criteria.
Variations have been in the following general areas:
1. Sample preparation, 2. Moisture conditioning, 3. Loading conditions, and 4. Interpretation of test results.
Each will be discussed and details used in this study noted.
114
Sample Preparation
Recommended sample preparation generally follows or permits the Marshall (ASTM D 1559) or some form of kneading (ASTM D 1561) or gyratory shear (ASTM D 3387) procedure. There is no evidence to indicate that strength or modulus ratios might be affected by the method of application of compaction energy. Two parameters that are thought to be important in determining moisture effects are mix aging before compaction and voids content after compaction.
Some test procedures (7, 9, 11) call for aging the uncompacted mix at 140°F for 15 hr before compaction. This aging allows oxidation and hardening of the asphalt cement that, in theory, simulate construction and in-service conditions. There is some agreement that high-viscosity asphalts may be more effective in resisting stripping (2, 4, 5, 12), but the magnitude or significance is not well established. Aging of uncompacted mix was a variable included in this study. Condition 1 specimens were not aged, and Condition 2 specimens were aged for 15 hr at 140°F.
Additional details of the test conditions will be presented subsequently. Condition 1 was recommended by Tunnicliff and Root (2), and Condition 2 is basically a modified version of the accelerated procedure developed by Lottman (7). It is contained in Hazlett (11) as Texas Test Method Tex-531-C.
Air void content will determine the potential intensity of exposure to water. The trend in specifying void content is toward setting specific limits in order to minimize the effect of void content. Lottman (7, 8) recommends no specific limits, but implications are that specification voids should be achieved. Three procedures (2, 9, 11) recommend 6 to 8 percent voids. The Georgia procedure ( 10) recommends variable voids content depending on mix type, but the range is normally within 5 to 8 percent. All specimens for this study were compacted to void contents of from 6 to 8 percent.
Moisture Conditioning
The following parameters are critical in the moisture-conditioning phase:
1. Initial saturation achieved during vacuum application, 2. Freezing after vacuum saturation, and 3. Soaking.
Vacuum saturation is the first and possibly most important step in moisture conditioning. It determines the extent to which voids are filled with water and, thus, the intensity of exposure of the mix to water. The degree of saturation achieved depends primarily on the magnitude of the vacuum and to a lesser extent on the time of exposure. Three procedures (7, 8, 10) recommend a 26-in. vacuum applied for 30 min. This results in variable degrees of saturation depending on specimen properties. Several vacuum saturation schemes are reported in Kennedy and Anagnos (9) with a recommendation that degree of saturation be limited to from 60 to 80 percent.
Root and Tunnicliff (2) recommend an initial saturation of from 55 to 80 percent and the Texas procedure (11) an initial
TRANSPORTATION RESEARCH RECORD 1115
saturation of from 60 to 80 percent. Saturation of specimens for this study was maintained within 60 to 80 percent.
There is no consensus about what additional conditioning may be needed after vacuum saturation to promote development of stripping. Freezing, cyclic freezing-thawing, soaking, and freezing plus soaking have been tried. Data from Lottman (7) and Kennedy and Anagnos (9) plotted in Figure 1 indicate that freezing after soaking increases strength loss and that, overall, 18 freeze-thaw cycles are somewhat more severe than freezing plus soaking. However, examination of individual mixes reveals that for many the difference between freeze-soak and cyclic freeze-thaw is small. For nine mixes the freeze-plussoak conditioning produced the greatest strength loss. The validity of using freezing to simulate the stripping mechanisms has been questioned. It is the opinion of some that the strength reduction caused by freezing may be due to damage that is unrelated to the stripping process.
Data in Figure 2 from Kennedy and Anagnos (9) indicate that soaking, alone or in conjunction with freezing, may have a dominant effect on strength loss. Soaking, whether alone or in conjunction with freezing, should be an integral part of a conditioning procedure. Soaking provides conlacl Lime required for stripping mechanisms to develop. For the study reported herein, Condition 1 involved soaking only at 140°F for 24 hr, and Condition 2 involved one 15-hr freeze cycle to 0°F ± 4°F followed by a 24-hr SOak at 140°F.
Loading Conditions
The following loading parameters have been varied in studies of strength or stiffness loss:
1. Type of loading, 2. Rate of application, and 3. Specimen temperature.
Indirect tensile (ASTM D 4123) appears to be the loading currently favored for assessing water damage to asphalt concrete. Unconfined compression (ASTM D 1075), Marshall (ASTM D 1559), and Hveem (ASTM D 1560) loadings have been and are being used (2), but they have not received extensive recent research attention. Double punch loading as proposed by Jimenez (6) has received little additional attention. Indirect tensile loading was used in this study.
Rate of loading and specimen temperature are variables that will affect absolute values of tensile strength and modulus but will probably not have a profound effect on strength or modulus ratios. Rates of loading have varied from 0.065 to 2.0 in./ min and specimen temperature has varied from 55°F to 77°F. The study by Maupin (13) is often cited to illustrate insensitivity to rate of loading and temperature and to justify the use of a 2.0 in./min loading rate and a 77°F specimen temperature. These practical conditions were used for this study.
Interpretation of Test Results
Specimens were loaded to failure and vertical diametral load and horizontal diametral deformation were recorded. Indirect tensile strength was computed with the relationship
tensile modulus, vertical diametral load, and horizontal diametral deformation at load P.
Tensile strength ratio (TSR) was computed by dividing the average strength of a minimum of three conditioned specimens by the average strength of a minimum of three unconditioned control specimens. Specimens were grouped for conditioning and control by sorting so that average void contents of the groups were as close as possible. All individual samples, and thus averages for the groups, have compacted void contents of from 6 to 8 percent.
Tangent modulus values were computed using the initial slope of the load-deformation curve for PIA. Secant modulus values were also computed using the ultimate load and corresponding deformation.
MATERIALS
Five aggregate combinations and one asphalt cement were obtained for testing. These were selected to represent typical materials used for asphalt concrete in Alabama. The aggregate combinations were selected to provide a range of field stripping performance from good to poor. The asphalt cement was from the largest producer in Alabama. Three of the aggregate mixes were used in a study of boil and stress pedestal tests (14).
Tensile modulus values were computed with the relationship
The asphalt cement used for sample fabrication was grade AC-20, which meets Alabama Highway Department (AHD) specifications, from a source widely used in Alabama. The manufacturers mix crude from various sources, but at the time of sampling the majority of the crude oil was from the Gulf of Mexico.
Aggregate
Five aggregate combinations of three to five individual aggregates each was selected and arbitrarily labeled A-E. Each component of each mix was arbitrarily numbered 1-5 (e.g., the second of the three components of Combination A was as• signed A2). The five aggregate combinations initially selected were real surface mixes (A-E were AHD 416 wearing surfaces and D was an AHD 411 wearing surface). Aggregate from the five combinations was also combined to produce mixes meet
ing base/binder specification (AHD 414 binder layer/ARD 327 bituminous base). Therefore, for each aggregate combination A-E, there will be a surface mix and a base/binder mix. The asphalt cement contents were design asphalt contents for the
specific aggregate combinations. Properties of the mixes are given in Table 1.
The nature of the materials in each mix is distinctly different, but each meets specifications for a surface, binder, or base course. Different gradations of limestone for particular combinations were from the same source. Different types of gravel and coarse sands for particular combinations were from the same source, but the fine sands (C and D) were from different sources than were the gravels and coarse sands. The field performance histories of the aggregate combinations, included in the following descriptions, are a result of a limited survey of highway department personnel. They reflect general opinions regarding mixes from the primary aggregate source rather than specific observations of particular mixes.
Combination A
These are basically limestone mixes, and good performance of similar mixes with few signs of pavement distress attributable to stripping has been reported. Surface Mix A contains 85 percent crushed limestone and 15 percent natural sand and has been used for shoulder paving and leveling. Base/binder Mix A contains 100 percent crushed limestone. The limestone is
a Asphalt content based on weight of asphalt cement and aggregate.
dense (specific gravity "' 2.8) dolomitic material with an absorption of about 1 percent.
Combination B
These are basically gravel mixes with variable reported performance. Before the use of antistrip additives was required, stripping damage was severe. With the use of antistrip additives, performance has improved; however, some stripping problems are still reported. Both the surface and the base/ binder mixes contain 10 percent limestone screenings and 90 percent siliceous sand and gravel. The gravel and sand are from the same source and are described as "cherty" materials (specific gravity = 2.5) with relatively high absorption (3 percent). The surface mix contains crushed gravel and the base/binder mix contains basically uncrushed gravel (10 percent crushed gravel added to meet gradation requirements).
Combination C
These are siliceous gravel mixes with good reported performance. Even before the use of antistrip additives only minor
117
stripping problems were reported. Both the surface and the base/binder mixes contain 15 percent fine sand and 85 percent coarse sand and gravel from a primary source. The coarse sand and gravel are predominately sound quartz and quartzite materials (specific gravity = 2.6) with relatively low absorption (0.9 percent).
Combination D
These are siliceous gravel mixes with poor reported stripping performance. The use of antistrip additives has improved performance, but gravel mixes from this region of the state continue to be regarded as particularly susceptible to water damage. The mixes contain 10 and 15 percent fine sand and 90 and 85 percent washed sand and gravel from a primary source. The washed sand is primarily sound quartz, but the coarser particles tend to be similar to the gravel. The gravel is a highly variable cherty material (specific gravity = 2.5) that includes light and porous particles. Absorption is relatively high at about 2.6 percent.
Combination E
These are basically limestone mixes with good reported stripping performance. Both the surface and the base/binder mixes contain 10 percent natural sand and 90 percent crushed limestone from a primary source. The limestone has a relatively high calcium carbonate content (=90 percent), a specific gravity of about 2.6, and absorption of about 1 percent.
PREPARATION AND TESTING OF SAMPLES
Samples were produced following the method described in ASTM D 1559 except for the following modification. Aggregate was combined according to the percentages given in Table 1 and sieved on eight sieves to produce portions with particle sizes in the range that passes the 11/2 in. to the No. 200 sieve. Required aggregate for two samples was then combined to meet the job mix formula gradation. The preheated aggregate and asphalt cement were mixed at 300°F for 3 min. The mixture was then placed in two Marshall molds. Thereafter sample preparation continued according to the requirements given in Table 2.
Condition 1
The mixtures in molds were heated for 2 to 3 hr at the compaction temperature (285°F) for temperature stabilization. Compaction was accomplished using a predetermined number of blows in order to achieve 6 to 8 percent air voids. Specimens were cooled to room temperature (3 to 4 hr), and their bulk specific gravity was determined in accordance with ASTM D 2726 (no wax used). The maximum theoretical specific gravity of the mix was determined in accordance with ASTM D 2041, and air voids were calculated in accordance with ASTM D 3203.
118
TABLE 2 CONDITIONING PROCEDURES
Treatment
Mix aging
Condition 1
No aging No curing
TRANSPORTATION RESEARCH RECORD 1115
Condition 2
15 hr at 140°F Curing of compacted specimens Initial saturation Freezing
Between 60% and 80% No freezing
24 hr at room temperature Between 60% and 80% 15 hr at 0°F ± 4°F
Soaking Age of specimen at testing Similar procedure
24 hr at l 40°F 2 days
24 hr at l 40°F 4 days
Tunnicliff and Root (2) Modified Texas ( 11)
Compacted specimens were sorted into two groups (minimum of three specimens) such that both groups had, as nearly as possible, the same average air voids. One group was subjected to accelerated moisture conditioning and the other was used for control. Control specimens were placed in a desiccator and tested at the same time as conditioned specimens.
The conditioning procedure was similar to that described by Tunnicliff and Root (2). It was accomplished in two stages, vacuum saturation and soaking. Specimens were submerged in distilled water at room temperature and a partial vacuum was applied for approximately 5 min. The vacuum level needed for saturation was dependent on the type of mix and ranged from 15 to 26 in. of mercury. In all cases the degree of saturation achieved was between 60 and 80 percent. Soaking was achieved by placing the vacuum-saturated specimens in distilled water at 140°F for 24 hr. The final degree of saturation achieved during soaking was highly variable.
Condition 2
This procedure is similar to that described by Hazlett (11). After it Willi placed in molds, the mix was cooled to room temperature for a minimum of 3 hr. It was then aged at 140°F
TABLE 3 INDIRECT TENSILE TESTS RESULTS
for 15 hr, reheated to compaction temperature (285°F) for 2 to 3 hr, and compacted using a predetermined number of blows to produce 6 to 8 percent air voids. The molded specimens were then cured at room temperature for 24 hr. Measurement and computation of specimen properties and sorting and handling of control specimens were the same as for Condition 1.
Specimens were subjected to moisture conditioning in three stages: vacuum saturation, freezing, and soaking. Vacuum saturation was the same as described for Condition 1. Freezing was started immediately after vacuum saturation and lasted for 15 hr at 0.0°F ±4°F. Each specimen was placed in a plastic bag and this bagged specimen was placed inside another plastic bag. Ten milliliters of distilled water was added to the outer bag to form a moisture barrier and provide sufficient water for saturation. The inside bag was kept open and the outer bag was sealed. The double-bagged specimens were removed from the freezer after 15 hr, taken out of the bags, and placed in a 140°F water bath for 24 hr.
Testing Procedure
After they were soaked, specimens we"J"e t11ken out of the 140°F water bath and placed in another water bath at room tempera-
* Strength and modular ratios were computed for averages of minimum of 3 dry and 3 conditioned specimens.
Parker and Gharaybeh
ture (77°F) for 2 to 3 hr. Each specimen's final bulk specific gravity and thickness were then determined as described previously.
Inunediately after thickness measurement, specimens were loaded in indirect tensile using a Marshall testing machine. Vertical diametral load was applied through 1/z-in.-wide loading strips by controlling vertical deformation at 2 in./min. Horizontal diametral deformation was measured with a device similar to that described by Hudson and Kennedy (15). Vertical diametral load and horizontal diametral deformation were recorded with an X-Y plotter to obtain relationships for tensile strength and modulus calculations.
Calculations
Maximum theoretical mix specific gravity was calculated in accordance with ASTM D 2041. Bulk specific gravity and air voids before and after conditioning were calculated in accordance with ASTM D 2726 and ASTM D 3203, respectively. Degree of saturation, before and after conditioning, was calculated using the relationship
B-A S = V (B _ CJ x 100
where
s = degree of saturation, A = dry weight of specimen in air, B = weight of surface-dry specimen after
saturation, c = weight of saturated specimen in Wl!,ter, and v = voids ratio of specimen.
D E
c D B
A&B c c
~ E E
a:: 60 (/) B t-
40
Ar-------J. A 20
0 C\J
c: c: c: 0
~ ,g :;:
Surface Mixes Base/Binder 'O 'O 'O c: c: c:
Mixes 0 0 0 u u u
FIGURE 3 Comparison of sample preparation and moisture conditioning.
C\J
c: ,g 'O c: 0 u
(3)
119
Tensile strength and secant modulus values were calculated using Equations 1 and 2, respectively. Tensile strength ratio (TSR) and secant modulus ratio (SMR), expressed as percentages, were calculated with the relationships
TSR =Average conditioned indirect tensile strength x 100
(4
) Average dry indirect tensile slrength
and
SMR =Average conditioned secant modulus x 100
Average dry secant modulus
TEST RESULTS AND ANALYSIS
(5)
A summary of test results is given in Table 3. TSRs and SMR.s are tabulated. Ratios of initial tangent modulus were also computed but are not presented because of their high variability as a result of imprecision in the initial portion of the load-deformation curves.
Effects of Sample Preparation and Conditioning Procedures
Numerous variations in sample preparation and conditioning procedures have been studied to try to simulate conditions necessary for stripping. These variations can result in significant differences in test results, as shown in Figures 1 and 2.
For certain applications, such as determining the effectiveness of antistripping agents, absolute values of strength or modulus ratios may not be critical (assuming reasonable approximations of stripping conditions are achieved). However, absolute values are important if the results are to be used for predicting stripping and the need for antistripping additives. They are important because they must be correlated with field stripping performance in order to establish limiting criteria.
Figure 3 shows the differences in TSRs observed for the two sample preparation and moisture conditions. The average difference is about 8 percent, and Condition 2 generally gives lower values. The exception is Combination B for which Condition 2 gives a larger value for the base/binder mix. Condition 2 is more severe primarily because of the freezing, but the effects are somewhat mitigated by the beneficial effects of curing and aging. Differences in SMR-values were similar.
Effects of Sample Properties
Aggregate properties are considered the dominant factor in determining mix stripping. When considering prediction of stripping potential and the associated need for antistripping additives, aggregate constituents are most often considered the controlling influence. However, specimen properties, such as void content and degree of saturation, will also affect strength retention and thereby potentially confound estimates of stripping potential. The effects of these variables are minimized by compacting specimens to standard voids (6 to 8 percent) and moisture conditioning using consistent procedures.
120
D E
0 c 80 C A&B
~ 0 E
a: 60 (f) B
f-
40
A
20
0 Cl> .... Cl> u Cl> u
2 "" 2 Condition I c: Condition 2 .... CD ....
::::J ::i (f) Q; (f)
<I)
0 Ill
FIGURE 4 Comparison of surface and base/binder mixes.
Gi "" c: CD Q;
<I)
0 Ill
Additional sample properties that may influence the characterization of a mix as stripping or nonstripping are asphalt cement content and aggregate gradation. They will determine asphalt cement film thickness and void size, which have the potential for influencing strength and modulus retention. Smaller film thickness will make removal from aggregate easier. Larger voids will allow easier access for water. Although void content is controlled (6 to 8 percent), coarser gradations will likely produce fewer but larger voids for a given void content.
TRANSPORTATION RESEARCH RECORD 1115
The effect of void size on penneability was apparent during the vacuum saturation process. A trial-and-error procedure was used to achieve 60 to 80 percent saturation. Less intense partial vacuums and smaller exposure times were required to achieve the required degree of saturation for base/binder specimens than for surface specimens with the same void content.
Film thickness and void size are elusive parameters that defy accurate quantification and thus precise study. They were studied indirectly by examining surface and base/binder mixes of the five aggregate combinations. Figure 4 shows the effect of mix type. In general, base/binder mixes give lower strength retention. This would be the expected response if film thickness were smaller, as indicated by the lower asphalt content. However, base/binder mixes have coarser gradations and should require less asphalt cement for particle coating. Nevertheless, base/binder mixes do appear "leaner." The general trend is also consistent with the postulated influence of void size (i.e., coarser base/binder mixes have larger voids that provide easier access for water).
Notable exceptions to the general trend in Figure 4 are the responses of Combinations A and E. These are limestone aggregate combinations. Combination A base/binder mix hos dramatically smaller (60 and 58 percent) TSR-values whereas Combination E base/binder mix has slightly larger (7 and 5 percent) TSR-values. No quantitative reasons can be formulated to explain this divergent behavior, but qualitatively the response is consistent with visual mix richness.
The influence of film thickness was examined by computing particle surface area with procedures suggested by Hudson and Kennedy (16). These values, as well as the ratios of asphalt content to surface area, are given in Table 4. No tendencies were noted when these ratios were plotted versus tensile strength ratios. This is attributed to the influence of other factors such as aggregate properties, and further studies of individual mixes were conducted.
Tests were run on mixes with asphalt cement contents dif-
TABLE 4 TENSILE STRENGTH AND ASPHALT FILM TIIlCKNESS DATA
ferent from design asphalt contents. Base/binder Mixes B, D, and E at design asphalt contents appeared "rich," and additional tests were run at lower asphalt contents. Base/binder Mix A appeared lean at 4.25 percent asphalt content, and tests were run with 5.25 percent asphalt contenl Surface Mix A at 5.5 percent design asphalt content appeared rich, and tests were run at 4.5 percent asphalt content.
Ratios of asphalt content to aggregate surface area were computed and plotted versus tensile strength ratio (Figure 5). The general trend exhibited is as expected: higher asphalt content-to-surface ratios give higher TSRs. Implications are that film thickness has a definite effect on tensile strength retention. The data cannot be used to infer that asphalt content can be used to control stripping because other mix requirements (stability, flow, voids, cost, etc.) will limit the practical range for asphalt content.
Prediction of Stripping
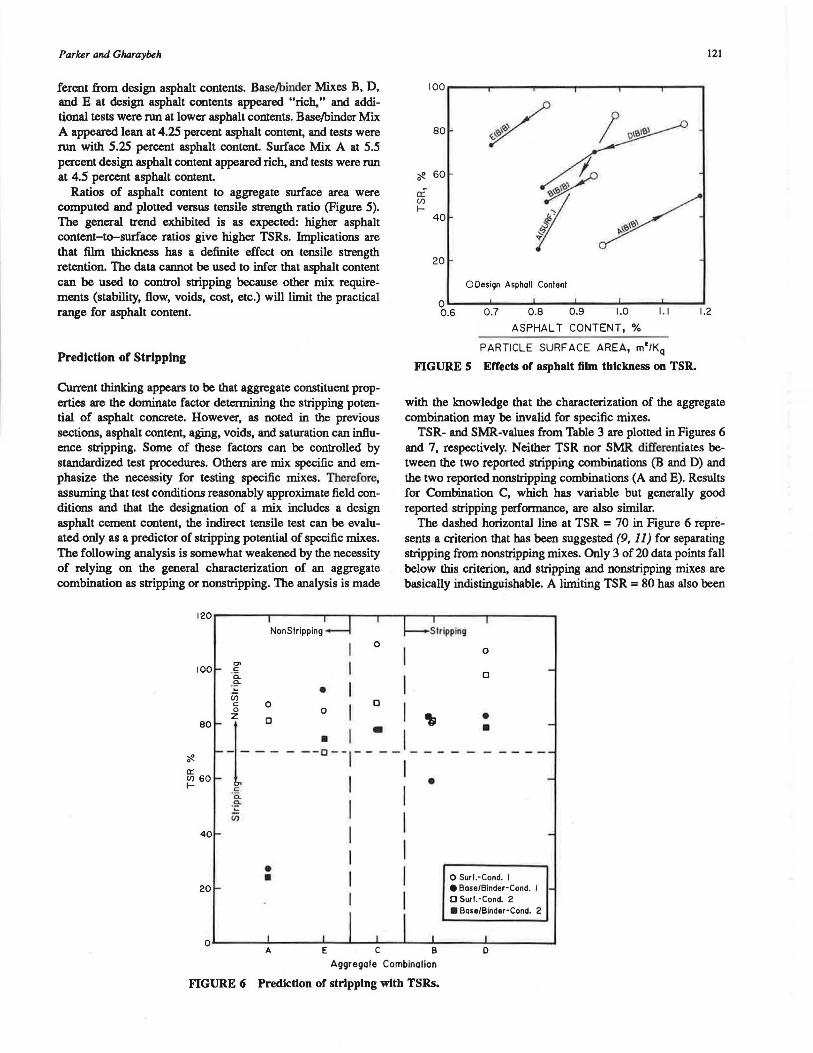
Current thinking appears to be that aggregate constituent properties are the dominate factor determining the stripping potential of asphalt concrete. However, as noted in the previous sections, asphalt content, aging, voids, and saturation can influence stripping. Some of these factors can be controlled by standardized test procedures. Others are mix specific and emphasize the necessity for testing specific mixes. Therefore, assuming that test conditions reasonably approximate field conditions and that the designation of a mix includes a design asphalt cement content, the indirect tensile test can be evaluated only as a predictor of stripping potential of specific mixes. The following analysis is somewhat weakened by the necessity of relying on the general characterization of an aggregate combination as stripping or nonstripping. The analysis is made
NanStripping
80
~ 60
r£ Cf)
I-40
20
0 Design Asphalt Content
o ..... ~~"'-~~.._~~--~~ ....... ~~---~--
121
o.6 0.7 0.8 0.9 t.O I. t 1.2
ASPHALT CONTENT, %
PARTICLE SURF ACE AREA, m1 /KQ
FIGURE 5 Effects of asphalt film thickness on TSR.
with the knowledge that the characterization of the aggregate combination may be invalid for specific mixes.
TSR- and SMR-values from Table 3 are plotted in Figures 6 and 7, respectively. Neither TSR nor SMR differentiates between the two reported stripping combinations (B and D) and the two reported nonstripping combinations (A and E). Results for Combination C, which has variable but generally good reported stripping performance, are also similar.
The dashed horizontal line at TSR = 70 in Figure 6 represents a criterion that has been suggested (9, 11) for separating stripping from nonstripping mixes. Only 3 of 20 data points fall below this criterion, and stripping and nonstripping mixes are basically indistinguishable. A limiting TSR = 80 has also been
Stripping
O> c
I 0 I I
0
100
BO
a: V) 60 1--
40
20
·a. .9-~
(jj c 0 0
-1- _"_ c ·a.
·~ ({)
• •
• I I o I a I "'
--~--:--· __ I_ - -I I I I I I I I
•
I I I I
Aggregate Combination
FIGURE 6 Prediction of stripping with TSRs.
a
• •
O Surt.-Cond. I e Base/Binder-Cond. I 0 Surt.-Cond. 2 • Base/Binder-Cond. 2
100
Stripping
80 0
0 0
60 0 0 • ~ 0 • 0 a:: :::::E • • Cl) • •
40
• 20
0 Surl.-Cond. I • Bose/Binder-Cond. I
I 0 Suri. -Cond. 2 • Bose/Binder-Cond. 2
0 A E c B 0
Aggregate Combination
FIGURE 7 Prediction of stripping with SMRs.
1110,000- -----------..---.--r--...-----..-----.
a; "6
NonStripping--1 I S I ripping 0
UJ., a; 0
I d ~ ~ ~ MOOO 0
~ I c: 0 u • c: I " = c • I .,
0 j!
0 Ci I .r: 1•100 • 0.
I c: ~ "' • • Ci) c: ·a. 'O
Q.
I ·;: ., (ij c:
~ t- • 'O -- --~ -I 1w•'oo.,1-c:
0 u "' c: c 1110 ·a.
= -~
I • ~
(ij c: 0
:0 z " I .<> 0 O Surl.-Cond. I ct • Bose/Binder-Cond. I
O Surf.-Cond. 2 • Bose/Binder-Cond. 2 0
t•I A E c B 0
Aggregate Combination
FIGURE 8 Prediction of stripping with probabilistic mean strength comparison.
123
TABLB 5 TSR-VALUBS AND PROBABll.ISTIC MBAN STRENGTH COMPARISON
Moi1ture Condition l Moi 1tur1 Condition 2
A11re1ate TSR Prob. Rial * TSR Prob, Real * Combination 00 Stren1th Ditf, (%) Stren1th DUf,
Surf, 87 11200 81 ) 1:10()0 A
B/B 27 ) 111000 24 ) l: 1000
Surf, 80 111000 81 > 111000 I
B/B .59 ) 111000 82 112.5
Surf, 109 ** 88 1:1000 c B/B 78 1191 78 11.56
Surf, 107 D ** 98 1:2
I/I 83 118 79 1 :.500
Surf, 8.5 1:143 70 > 1:1000 !
I/I 92 l: 61 7.5 l: 23.5
* 'l'wa tail "t" t11t to compare mean t enlill 1tren1th.
** Conditioned 1tr1n1th 1reat1r than control 1tr1n1th.
su11eated (8, 10). Examination of Fi1ure 6 reveals that four of ei1ht data points for nomtrippinJ mixes and two of eight data points for strippina mixes fall below this criterion. For Com· bination C the base/binder mixes fall below the TSR 80 criterion, and the surf ace mixes are above.
Comparison of Fi1ures 6 and 7 reveals that patterns for SMR are similar to pattema for TSR. SMR-values do not appear to dUTerentiate between stripplna and nonstrippina mixes.
Tunnicliff and Root (2) have su11ested a criterion for pre· dictin1 strippin1 that is based on probabilistic comparison of the mean tensile strenath of conditioned and control speclmens. Their criterion is "a probability of 20:1 or more that the difference between wet and dry specimens is real waa used to indicate that an additive should be considered" (2, p. 18). The 1tren1th data were analyzed uaina the auaested criterion. The results are tabulated in Table S and plotted in Figure 8.
Compariaon of TSRs with the probability that the mean strengths are dl!f'crcnt (Table S) indicates 1eneral correlation but with comiderable variability. Figure 8, with the sugsested criterion shown 11 a horizontal line, indicates that 16 of 20 points fall above the line indicatina potential stripper&. This ia contradictory to the predictiom in Figure 6 where only 8 of 20 points fell in the atripplna cate1ory as defined by the TSR • 80 criterion. Application of the probabilistic criterion generally indicates hiiber atripplna potential, and application of the llm· itin1 TSR criterion 1enerally indicates lower 1trippin1 potential.
For nonstripping mixes (A and B), the probabiliatic criterion predicts that all would strip whereaa the TSR • 80 criterion predicts that four of eiiht would atrip. For &tripping mixes (B
and D), the probabilistic criterion predict& that five of eight would strip whereas the TSR • 80 criterion predicts that three of eiiht would strip.
CONCLUSIONS
Conclusions drawn from reaults of the testing prosram follow.
1. Condition 2 (vacuum 1aturation, freezing, and 1oekin1) produced lower TSR-value1 than did Condition 1 (vacuum aaturation and soakina), but either appear& acceptable in light of uncertaintiea in modelinl the field environment.
2. Base/binder mixes are somewhat more susceptible to atripplna than are surface mixes of the same constituents. This may reflect the influence of a1phalt cement film thickne11 (su1ceptibillty to stripplna increases with decreased film thick· ness). Differences in the 1ize and distribution of void• resultins from differences in gradation (coarser gradation producins larger void•) may al10 be a factor. Lar1er voids would provide ea1ier acce11 for water.
3. The probabilistic criterion for separatina strippins and nonstrippina mixes 11 1u11ested by Tunnicliff and Root (2) i1 more 1everc than a deterministic limitin1 terulile strength ratio of 70 (9, 11) or 80 (8, 10).
4. The indirect tensile test did not distinctly differentiate reported 1trippin1 and nonstripping assregate combinations. Reuons may be that the reported 1trippin1 performance of an a1sre1ate combination i1 not valid for all mix types or that the test i1 not a valid indicator of strippin1 performance. The
124
former is more likely, but incorrect prediction for specific mixes is a definite possibiiity. Impiications are that specific mix designs must be tested and results conservatively interpreted until field performance studies permit further refinements.
ACKNOWLEDGMENTS
The work reported in this paper was sponsored by the State of Alabama Highway Department (Alabama Highway Department Project 930-111) through the Federal Highway Administration, U.S. Department of Transportation. The authors are grateful for the sponsorship, assistance, and cooperation of these organizations.
REFERENCES
1. P. Hubbard. Adhesion of Asphalt to Aggregate in the Presence of Water. HRB Proc., HRB, National Research Council, Washington, D.C., Vol. 18, Part I, 1938, pp. 238-249.
2. D. G. Tunnicliff and R. E. Root NCHRP Report 274: Use of Antistripping Additives in AspJUJltic Concrete Mixtures-LaboraU>ry Phase. TRB, National Research Council, Washington, D.C., 1984.
3. B. Nicholson. Adhesion Tension in Asphalt Pavements, Its Significance and Methods Applicable in Its Determination. Proc., Association of Asphalt Paving Technologists, Vol. 13, 1932.
4. J. J. Fromm. The Mechanisms of Asphalt Stripping from Aggregate Surfaces. Proc., Association of Asphalt Paving Technologists, Vol. 43, 1974.
5. M A. Taylor and N. P. Khosla. Stripping of Asphalt Pavements: State of the Art. In Transportation Research Record 9ll. TRB, National Research Council, Washington, D.C., 1983, pp. 150-158.
6. R. A. Jimenez. Testing for Debonding of Asphalt from Aggregates. In 1ransportaJion Research Record 515, TRB, National Research Council, Washington, D.C., 1974, pp. 1-17.
7. R. P. Lottman. NCHRP Report 192: Predicting Moisture-Induced Damage toAsphaltic Concrete. TRB, National Research Council, Washington, D.C., 1978.
8. R. P. Lottman. NCHRP Report 246: Predicting Moisture-lndw:ed Damage to Asphaltic Concrei--Field Evaluation. TRB, National Research Council, Washington, D.C., 1982.
TRANSPORTATION RESEARCH RECORD 1115
9. T. W. Kennedy and J. N. Anagnos. Wet-Dry Indirect Tensile Test for Evaluating Moistun Su.sceptibilily of .A..sphalt Mi_uures. Research Report 253-8. Center for Transportation Research, University of Texas at Austin, 1984.
10. T. W. Kennedy and J. N. Anagnos. Method of Test for Evaluating the Moisture Susceptibility of Bituminous Mixtures by Diametrial Tensile SpliUing. Test method GHD-66. Georgia Department of
ransponation, Atlanta, l~IS!l: -- --11. D. G. Hazlett Evaluation of Moisture Susceptibility Tests for
Asphalt Concrete. Report 3-C-2-102. Matl(rials and Test Division, Texas State Department of Highways and Public Transportation, Austin, 1985.
12. R. J. Schmidt and P. E. Graf. The Effects of Water on the Resilient Modulus of Asphalt-Treated Mixes. Proc., Association of Asphalt Paving Technologists, Vol. 41, 1972.
13. G. W. Maupin, Jr. Implementation of Stripping Test for Asphaltic Concrete. In Transportation Research Record 712, TRB, National Research Council, Washington, D.C., 1979, pp. 8-12.
14. F. Parker and M. S. Wilson. Evaluation of Boiling and Slress Pedestal Tests for Assessing Stripping Potential of Alabama Asphalt Concrete Mixtures. In Transportation Research Record 1096, TRB, National Research Council, Washington, D.C., 1986, pp. 90-100.
15. W. R. Hudson and T. W. Kennedy. Indirect Tensile Test for Stabilized Malerials. Research Report 98-1. Center for Highway Research, University of Texas at Austin, 1968.
16. W. R. Hudson and T. W. Kennedy. Mix Design Methods for Asphalt Concrete. MS-2. The Asphalt Institute, College Park, Md., 1984.
The contents of this paper reflect the views of the authors who are responsible for the/acts and the accuracy of the data presented herein. The contents do not necessarily reflect the official views or policies of the State of Alabama Highway Department or the Federal Highway Administralion. This paper does not constitute a standard, specification, or regulation.
Publication of this paper sponsored by Committee on Characteristics of Bituminous Paving Mixtures To Meet Structural Requirements.