+ All Categories
Home > Documents > Evaluation of Investment in Education in the Ongoing European Integration Process The XV....

Evaluation of Investment in Education in the Ongoing European Integration Process The XV....

Date post: 02-Jan-2016
Category:
Upload: george-price
View: 216 times
Download: 0 times
Share this document with a friend
Popular Tags:
23
Evaluation of Investment in Education in the Ongoing European Integration Process The XV. International Scientific Conference Human Capital and Investment in Education Assist.Prof.Dr. Yılmaz BAYAR September 25, 2012 Congress Centre VŠFS, Prague
Transcript

Evaluation of Investment in Education in the Ongoing European Integration Process

The XV. International Scientific Conference Human Capital and Investment in Education

Assist.Prof.Dr. Yılmaz BAYARSeptember 25, 2012

Congress Centre VŠFS, Prague

• Introduction

• The Main Developments in Education and Training during the Ongoing European Integration Process

• Evaluation of Investment in Education and The Results Obtained in EU

• Conclusion

Outline

The XV. International Scientific Conference Human Capital and Investment in Education

• Education is a basic human need and a key factor in economic growth and development. Therefore investment in education will directly raise the well-being of individuals, but it will also raise their human capital and capacity to acquire means for the satisfaction of other basic needs.

• World economy began to make transition to information based economy in the middle of the twentieth century and the importance of information technology has been increasing day by day.

• The information technology has been becoming inevitable for development of other industries and gaining competitiveness in a globalized world.

• The shift toward information based economy has increased the importance of human capital in recent years.

• Countries have begun to restructure their education and training systems and increased the investments in education in order to meet the necessary qualified workforce in rapidly changing world.

Introduction

The XV. International Scientific Conference Human Capital and Investment in Education

• European cooperation in education and training began about 20 years later after Treaty of Rome during European integration process with the first Community action programme on education in 1976.

• The launch of programmes such as Comett I, Comett II, Erasmus, PETRA, Youth for Europe, Lingua, Eurotecnet and FORCE in the second half of the 1980s was one of the main milestones in cooperation of EU in training in education.

• While vocational training was identified as an area of Community action in the Treaty of Rome 1957, education was formally recognized as an area of European Union competency in the Maastricht Treaty in 1992. The treaty enabled the words education, students and professionals training to appear in the European vocabulary.

The Main Developments in Education and Training during the Ongoing European Integration Process

The XV. International Scientific Conference Human Capital and Investment in Education

• Delors White Paper on “Growth, Competitiveness, Employment” played a key role in development of cooperation in education. The urgent need for an adaptation of the education and vocational training systems in order to answer the societal challenges of the Community and putting the education and training in the centre of a new model of development was expressed in the paper.

• The goal of Lisbon Strategy (2000-2010) was to make the EU "the most dynamic and competitive knowledge based economy in the world capable of sustainable economic growth with more and better jobs and greater social cohesion and respect for the environment" by 2010.

The Main Developments in Education and Training during the Ongoing European Integration Process

The XV. International Scientific Conference Human Capital and Investment in Education

• In the context of the Lisbon Strategy , the Council of EU has agreed to establish the following reference levels:

- EU average rate of no more than 10 % early school leavers,- Increase the total number of graduates in mathematics, science and

technology in the EU by at least 15 % and decrease the level of gender imbalances,

- Achieve at least 85 % of 22 year olds in the EU to complete upper secondary education,

- Decrease the percentage of low-achieving 15 years old in reading literacy in the EU by at least 20% compared to the year 2000,

- Achieve at least 12,5% of the adult working age population (25-64 age group) of EU to participate in lifelong learning. • The endorsement by the March 2002 Barcelona European Council of the 'Education and Training 2010' work programme which established for the first time a solid framework for European cooperation in the field of education and training.

The Main Developments in Education and Training during the Ongoing European Integration Process

The XV. International Scientific Conference Human Capital and Investment in Education

• European cooperation in education and training (ET 2020) addressed the following strategic objectives:

- Making lifelong learning and mobility a reality,

- Improving the quality and efficiency of education and training,

- Promoting equity, social cohesion and active citizenship,

- Enhancing creativity and innovation, including entrepreneurship, at all levels of education and training.

The Main Developments in Education and Training during the Ongoing European Integration Process

The XV. International Scientific Conference Human Capital and Investment in Education

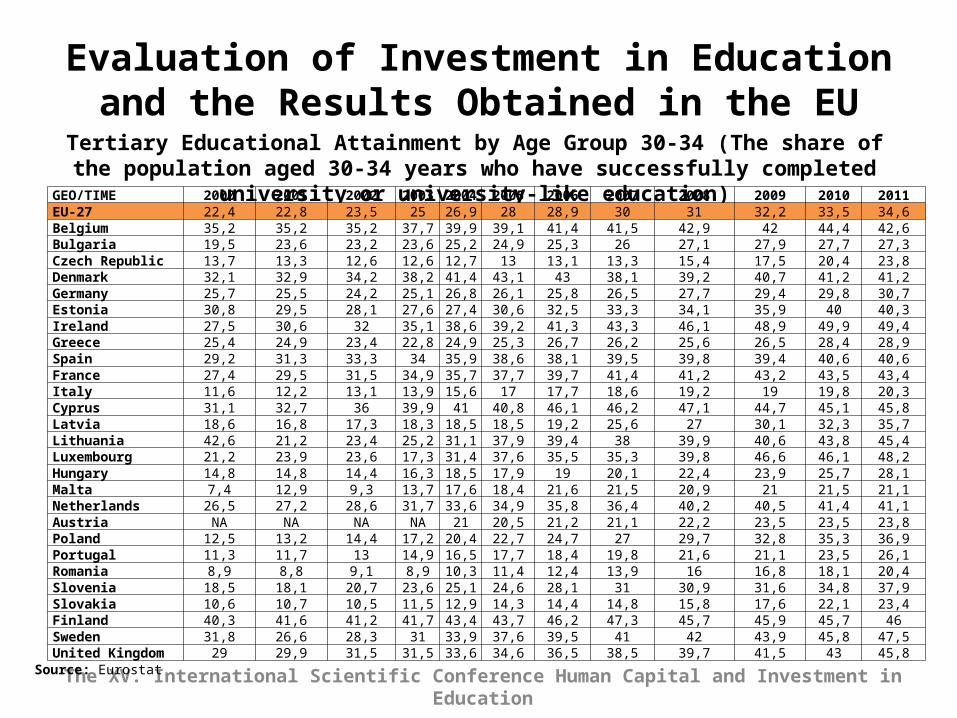
• Europe 2020 strategy set the following benchmarks for 2020 for education:- At least 95% of children between 4 years old and the age for starting compulsory primary education should participate in early childhood education, - the share of early leavers from education and training should be less than 10%, - the share of low-achieving 15-years olds in reading, mathematics and science should be less than 15%,- the share of 30-34 year olds with tertiary educational attainment should be at least 40% ,- an average of at least 15 % of adults should participate in lifelong learning, - EU flagship initiative "Youth on the move" to enhance the performance of education systems and to reinforce the international attractiveness of Europe's higher education,- A new European benchmark on the employability of young graduates was adopted by the Council of the European Union on 11 May 2012. The Council agreed that the share of employed among the graduates 34 year olds having left education and training no more than three years before the reference year should be at least 82% as compared to 76,5% in 2010 until 2020.

The Main Developments in Education and Training during the Ongoing European Integration Process

The XV. International Scientific Conference Human Capital and Investment in Education

• When we analyze the total public expenditure on education for all levels of education combined by EU-27, we see that the average investment in education in EU-27 is about 6,20%

Evaluation of Investment in Education and the Results Obtained in the EU

The XV. International Scientific Conference Human Capital and Investment in Education

Public and Private Investment in Education and Training by EU-27 (as % of GDP, for all levels of education combined)

TimePublic

Investment in Education

Private Investment in

Education

Total Investment in

Education2000 4,90 0,56 5,462001 4,99 0,60 5,592002 5,10 0,60 5,702003 5,14 0,64 5,782004 5,06 0,65 5,712005 5,04 0,69 5,732006 5,03 0,67 5,702007 4,95 0,71 5,662008 5,08 0,75 5,832009 5,41 0,79 6,20Source: Eurostat

Evaluation of Investment in Education and the Results Obtained in the EU

The XV. International Scientific Conference Human Capital and Investment in Education

Public and Private Investment in Education and Training in EU-27 Member Countries in 2009

(as % of GDP, for all levels of education combined)GEO/TIME Public Expenditure on

EducationPrivate Expenditure on

Education Total Expenditure on EducationBelgium 6,57 0,38 6,95Bulgaria 4,58 0,66 5,24Czech Republic 4,38 0,58 4,96Denmark 8,72 0,33 9,05Germany 5,06 0,8 5,86Estonia 6,09 0,36 6,45Ireland 6,50 0,37 6,87Greece NA NA NASpain 5,01 0,72 5,73France 5,89 0,61 6,50Italy 4,70 0,45 5,15Cyprus 7,98 1,53 9,51Latvia 5,64 0,58 6,22Lithuania 5,64 0,66 6,30Luxembourg NA NA NAHungary 5,12 NA NAMalta 5,46 1,36 6,82Netherlands 5,94 1,01 6,95Austria 6,01 0,51 6,52Poland 5,10 0,77 5,87Portugal 5,79 0,38 6,17Romania 4,24 0,11 4,35Slovenia 5,70 0,68 6,38Slovakia 4,09 0,72 4,81Finland 6,81 0,16 6,97Sweden 7,26 0,18 7,44United Kingdom 5,67 1,87 7,54

Source: Eurostat

Evaluation of Investment in Education and the Results Obtained in the EU

The XV. International Scientific Conference Human Capital and Investment in Education

Early Leavers from Education and Training (% of the Population Aged 18-24 with at Most Lower Secondary Education and not in

Further Education or Training)GEO/TIME 2000 2001 2002 2003 2004 2005 2006 2007 2008 2009 2010 2011EU-27 17,6 17,2 17 16,5 16 15,8 15,5 15,1 14,9 14,4 14,1 13,5Belgium 13,8 13,8 14,1 14,3 13,1 12,9 12,6 12,1 12 11,1 11,9 12,3Bulgaria NA 20,5 20,7 21,9 21,4 20,4 17,3 14,9 14,8 14,7 13,9 12,8Czech Republic NA NA 5,7 6,5 6,3 6,2 5,1 5,2 5,6 5,4 4,9 4,9Denmark 11,7 9,2 9 10,4 8,8 8,7 9,1 12,9 12,5 11,3 11 9,6Germany 14,6 12,3 12,5 12,8 12,1 13,5 13,7 12,5 11,8 11,1 11,9 11,5Estonia 15,1 14,4 13,2 12,9 13,1 13,4 13,5 14,4 14 13,9 11,6 10,9Ireland NA NA 14,6 13,1 13,1 12,5 12,1 11,6 11,3 11,6 11,4 10,6Greece 18,2 17,1 16,5 16 14,7 13,6 15,5 14,6 14,8 14,5 13,7 13,1Spain 29,1 29,7 30,7 31,6 32 30,8 30,5 31 31,9 31,2 28,4 26,5France 13,3 13,5 13,4 12,4 12,1 12,2 12,4 12,6 11,5 12,2 12,6 12Italy 25,1 25,9 24,2 23 22,3 22 20,6 19,7 19,7 19,2 18,8 18,2Cyprus 18,5 17,9 15,9 17,3 20,6 18,2 14,9 12,5 13,7 11,7 12,6 11,2Latvia NA NA 16,9 18 14,7 14,4 14,8 15,1 15,5 13,9 13,3 11,8Lithuania 16,5 14,9 13,4 11,4 10,5 8,1 8,2 7,4 7,4 8,7 8,1 7,9Luxembourg 16,8 18,1 17 12,3 12,7 13,3 14 12,5 13,4 7,7 7,1 6,2Hungary 13,9 13,1 12,2 12 12,6 12,5 12,6 11,4 11,7 11,2 10,5 11,2Malta 54,2 54,4 53,2 49,9 42,1 38,9 39,9 38,3 38,1 36,8 36,9 33,5Netherlands 15,4 15,1 15,3 14,3 14,1 13,5 12,6 11,7 11,4 10,9 10 9,1Austria 10,2 10,2 9,5 9 9,5 9,1 9,8 10,7 10,1 8,7 8,3 8,3Poland NA 7,4 7,2 6 5,6 5,3 5,4 5 5 5,3 5,4 5,6Portugal 43,6 44,2 45 41,2 39,4 38,8 39,1 36,9 35,4 31,2 28,7 23,2Romania 22,9 21,7 23 22,5 22,4 19,6 17,9 17,3 15,9 16,6 18,4 17,5Slovenia NA 6,4 5,1 4,6 4,3 4,9 5,6 4,1 5,1 5,3 5 4,2Slovakia NA NA 6,7 5,3 6,8 6,3 6,6 6,5 6 4,9 4,7 5Finland 9 9,5 9,7 10,1 10 10,3 9,7 9,1 9,8 9,9 10,3 9,8Sweden 7,3 10,2 10 9,2 9,2 10,8 13 12,2 12,2 10,7 9,7 6,6United Kingdom

18,2 17,8 17,6 NA 12,1 11,6 11,3 16,6 17 15,7 14,9 15

• Early school leaving is an obstacle to economic growth and employment. It hampers productivity and competitiveness, and fuels poverty and social exclusion.

• EU has to make full use of its human resources due to its shrinking workforce. Young people who leave education and training prematurely are bound to lack skills and to face serious, persistent problems on the labour market.

• Therefore EU should head for different ways to reduce the number of early school-leavers in order to reach this goal by 2020.

Evaluation of Investment in Education and the Results Obtained in the EU

The XV. International Scientific Conference Human Capital and Investment in Education

Evaluation of Investment in Education and the Results Obtained in the EU

The XV. International Scientific Conference Human Capital and Investment in Education

Total/Male/Female Graduates in EU-27 ((International Standard Classification of Education (ISCED) 5-6) in Mathematics, Science and Technology per 1.000 of

Population Aged 20-29)

Year Total Graduates Male Graduates

Female Graduates

2000 10,1 13,8 6,32001 10,7 14,6 6,72002 11,3 15,4 7,12003 12,3 16,5 7,92004 12,5 18,9 7,92005 13,3 18,0 8,32006 13,5 18,2 8,62007 13,8 18,6 9,02008 14,5 19,2 9,62009 14,4 19,2 9,42010 12,5 16,6 8,3

Source: Eurostat

Evaluation of Investment in Education and the Results Obtained in the EU

The XV. International Scientific Conference Human Capital and Investment in Education

Upper Secondary Graduation Rates of Persons of the Age 20 to 24 in EU(Percentage of the population of the age 20 to 24)

Source: Eurostat

GEO/TIME 2000 2001 2002 2003 2004 2005 2006 2007 2008 2009 2010 2011EU-27 76,6 76,6 76,7 77,1 77,3 77,5 77,9 78,1 78,4 78,6 79 79,5Belgium 81,7 81,7 81,6 81,2 81,8 81,8 82,4 82,6 82,2 83,3 82,5 81,6Bulgaria 75,2 78,1 77,4 76,3 76,1 76,5 80,5 83,3 83,7 83,7 84,4 85,5Czech Republic 91,2 90,6 92,2 92,1 91,4 91,2 91,8 91,8 91,6 91,9 91,9 91,7Denmark 72 78,4 78,6 76,2 76,2 77,1 77,4 69,4 68,9 69,9 68,6 70Germany 74,7 73,6 73,3 72,5 72,8 71,4 71,9 72,9 74,1 73,7 74,4 75,8Estonia 79 79,8 81,4 81,5 80,3 82,6 82 80,9 82,2 82,3 83,2 82,6Ireland 82,6 83,9 84 85,1 85,3 85,8 85,8 86,8 87,7 86,4 86,5 86,9Greece 79,2 80,2 81,1 81,7 83 84,1 81 82,1 82,1 82,2 83,4 83,6Spain 66 65 63,7 62,2 61,2 61,8 61,6 61,1 60 59,9 61,2 61,7France 81,6 81,8 81,7 82,8 83 83,4 83,3 82,4 83,8 83,6 83,2 83,8Italy 69,4 67,9 69,6 71 73,4 73,6 75,5 76,3 76,5 76,3 76,3 76,9Cyprus 79 80,5 83,5 79,5 77,6 80,4 83,7 85,8 85,1 87,4 86,3 87,7Latvia 76,5 71,7 77,1 75,4 79,5 79,8 81 80,2 80 80,5 79,9 80,4Lithuania 78,9 80,5 81,3 84,2 85 87,8 88,2 89 89,1 86,9 86,9 86,9Luxembourg 77,5 68 69,8 72,7 72,5 71,1 69,3 70,9 72,8 76,8 73,4 73,3Hungary 83,5 84,7 85,9 84,7 83,5 83,4 82,9 84 83,6 84 84 83,3Malta 40,9 40,1 39 45,1 51 53,7 51,1 55,5 51,1 53,3 53,3 59,2Netherlands 71,9 72,7 73,1 75 75 75,6 74,7 76,2 76,2 76,6 77,6 78,2Austria 85,1 85,1 85,3 84,2 85,8 85,9 85,8 84,1 84,5 86 85,6 85,4Poland 88,8 89,7 89,2 90,3 90,9 91,1 91,7 91,6 91,3 91,3 91,1 90Portugal 43,2 44,4 44,4 47,9 49,6 49 49,6 53,4 54,3 55,5 58,7 64,4Romania 76,1 77,3 76,3 75 75,3 76 77,2 77,4 78,3 78,3 78,2 79,6Slovenia 88 88,2 90,7 90,8 90,5 90,5 89,4 91,5 90,2 89,4 89,1 90,1Slovakia 94,8 94,4 94,5 94,1 91,7 91,8 91,5 91,3 92,3 93,3 93,2 93,3Finland 87,7 86,1 85,8 85,3 84,5 83,4 84,7 86,5 86,2 85,1 84,2 85,4Sweden 85,2 85,5 86,7 85,8 86 87,5 84,9 85,5 85,6 86,4 85,9 88,7United Kingdom

76,7 76,9 77,1 78,6 77 78,1 78,8 78,1 78,2 79,3 80,4 80,1

Evaluation of Investment in Education and the Results Obtained in the EU

The XV. International Scientific Conference Human Capital and Investment in Education

Low Reading Literacy Performance of Pupils (Share of 15-year-old pupils who are at level 1 or below of the PISA combined reading

literacy scale)GEO/TIME 2000 2003 2006 2009EU-27 19,8 20,8 22,6 19,6Belgium 19 17,9 19,4 17,7Bulgaria 40,3 NA 51,1 41Czech Republic 17,5 19,3 24,8 23,1Denmark 17,9 16,5 16 15,2Germany 22,6 22,3 20 18,5Estonia NA NA 13,6 13,3Ireland 11 11 12,1 17,2Greece 24,4 25,3 27,7 21,3Spain 16,3 21,1 25,7 19,6France 15,2 17,5 21,7 19,8Italy 18,9 23,9 26,4 21Latvia 30,6 18 21,2 17,6Lithuania NA NA 25,7 24,4Luxembourg 35,1 22,7 22,9 26Hungary 22,7 20,5 20,6 17,6Netherlands 9,5 11,5 15,1 14,3Austria 14,6 20,7 21,5 27,6Poland 23,3 16,8 16,2 15Portugal 26,3 21,9 24,9 17,6Romania NA NA 53,5 40,4Slovenia NA NA 16,5 21,2Slovakia NA 24,9 27,8 22,2Finland 6,9 5,7 4,8 8,1Sweden 12,6 13,3 15,3 17,4United Kingdom 12,8 NA 19 18,4

Source: Eurostat

Evaluation of Investment in Education and the Results Obtained in the EU

The XV. International Scientific Conference Human Capital and Investment in Education

Life-Long Learning in EU (Percentage of the adult population aged 25 to 64 participating in education and training)

Source: Eurostat

GEO/TIME 2000 2001 2002 2003 2004 2005200

6 2007 2008 2009 2010 2011EU-27 7,1 7,1 7,2 8,5 9,2 9,6 9,5 9,3 9,4 9,3 9,1 8,9Belgium 6,2 6,4 6 7 8,6 8,3 7,5 7,2 6,8 6,8 7,2 7,1Bulgaria NA 1,4 1,2 1,3 1,3 1,3 1,3 1,3 1,4 1,4 1,2 1,2Czech Republic NA NA 5,6 5,1 5,8 5,6 5,6 5,7 7,8 6,8 7,5 11,4Denmark 19,4 18,4 18 24,2 25,6 27,4 29,2 29 29,9 31,2 32,5 32,3Germany 5,2 5,2 5,8 6 7,4 7,7 7,5 7,8 7,9 7,8 7,7 7,8Estonia 6,5 5,4 5,4 6,7 6,4 5,9 6,5 7 9,8 10,5 10,9 12Ireland NA NA 5,5 5,9 6,1 7,4 7,3 7,6 7,1 6,3 6,7 6,8Greece 1 1,2 1,1 2,6 1,8 1,9 1,9 2,1 2,9 3,3 3 2,4Spain 4,5 4,4 4,4 4,7 4,7 10,5 10,4 10,4 10,4 10,4 10,8 10,8France 2,8 2,7 2,7 6,8 6 5,9 6,4 6,1 6 5,7 5 5,5Italy 4,8 4,5 4,4 4,5 6,3 5,8 6,1 6,2 6,3 6 6,2 5,7Cyprus 3,1 3,4 3,7 7,9 9,3 5,9 7,1 8,4 8,5 7,8 7,7 7,5Latvia NA NA 7,3 7,8 8,4 7,9 6,9 7,1 6,8 5,3 5 5Lithuania 2,8 3,5 3 3,8 5,9 6 4,9 5,3 4,9 4,5 4 5,9Luxembourg 4,8 5,3 7,7 6,5 9,8 8,5 8,2 7 8,5 13,4 13,4 13,6Hungary 2,9 2,7 2,9 4,5 4 3,9 3,8 3,6 3,1 2,7 2,8 2,7Malta 4,5 4,6 4,4 4,2 4,3 5,3 5,4 6 6,3 6,1 6,2 6,6Netherlands 15,5 15,9 15,8 16,4 16,4 15,9 15,6 16,6 17 17 16,6 16,7Austria 8,3 8,2 7,5 8,6 11,6 12,9 13,1 12,8 13,2 13,8 13,7 13,4Poland NA 4,3 4,2 4,4 5 4,9 4,7 5,1 4,7 4,7 5,3 4,5Portugal 3,4 3,3 2,9 3,2 4,3 4,1 4,2 4,4 5,3 6,5 5,8 11,6Romania 0,9 1 1 1,1 1,5 1,6 1,3 1,3 1,5 1,5 1,3 1,6Slovenia NA 7,3 8,4 13,3 16,2 15,3 15 14,8 13,9 14,6 16,2 15,9Slovakia NA NA 8,5 3,7 4,3 4,6 4,1 3,9 3,3 2,8 2,8 3,9Finland 17,5 17,2 17,3 22,4 22,8 22,5 23,1 23,4 23,1 22,1 23 23,8Sweden 21,6 17,5 18,4 NA NA 17,4 18,4 18,6 22,2 22,2 24,5 25United Kingdom 20,5 20,9 21,3 27,2 29 27,6 26,7 20 19,9 20,1 19,4 15,8

Evaluation of Investment in Education and the Results Obtained in the EU

The XV. International Scientific Conference Human Capital and Investment in Education

Employment Rates (20-34 years old)

Source: Eurostat

GEO/TIMEAll Education Levels

2005 2007 2008 2009 2010EU-27 75,8 79,9 81,0 77,2 76,5Belgium 77,7 79,9 82,5 79,5 78,9Bulgaria 67,4 72,1 79,6 73,7 68,5Czech Republic NA 87,6 87,8 84,5 81,2Denmark 86,2 90,7 88,7 86,8 83,1Germany 78,7 82,4 85,2 83,8 84,7Estonia 72,6 85,0 81,9 65,0 64,2Ireland 84,8 86,8 85,4 74,5 71,1Greece 59,2 67,6 67,5 64,6 58,3Spain 77,2 85,0 79,1 70,3 66,6France 77,1 77,5 80,8 75,2 75,6Italy 62,1 65,9 65,1 60,4 57,7Cyprus 77,3 82,3 85,8 81,2 78,6Latvia 81,1 81,8 81,6 69,6 64,0Lithuania 78,0 83,2 78,0 70,9 71,7Luxembourg 88,7 86,5 85,2 84,7 88,1Hungary 73,6 79,5 79,8 75,3 73,8Malta 92,5 93,3 94,2 93,3 93,0Netherlands 89,7 91,4 91,0 90,4 91,1Austria 87,2 90,1 90,1 88,3 88,4Poland 66,8 77,4 79,0 78,0 76,2Portugal 82,1 80,7 81,1 81,4 79,5Romania 72,1 79,2 84,8 77,6 71,1Slovenia 78,2 81,3 83,3 82,2 80,7Slovakia 72,8 81,0 81,3 74,4 69,5Finland 79,3 82,8 82,3 77,8 79,7Sweden 79,3 85,0 85,1 81,2 82,4United Kingdom 86,1 84,8 83,0 78,8 80,7

Evaluation of Investment in Education and the Results Obtained in the EU

The XV. International Scientific Conference Human Capital and Investment in Education

Tertiary Educational Attainment by Age Group 30-34 (The share of the population aged 30-34 years who have successfully completed university or university-like education)

Source: Eurostat

GEO/TIME 2000 2001 20022003

2004 2005 2006 2007 2008 2009 2010 2011

EU-27 22,4 22,8 23,5 25 26,9 28 28,9 30 31 32,2 33,5 34,6Belgium 35,2 35,2 35,2 37,7 39,9 39,1 41,4 41,5 42,9 42 44,4 42,6Bulgaria 19,5 23,6 23,2 23,6 25,2 24,9 25,3 26 27,1 27,9 27,7 27,3Czech Republic 13,7 13,3 12,6 12,6 12,7 13 13,1 13,3 15,4 17,5 20,4 23,8Denmark 32,1 32,9 34,2 38,2 41,4 43,1 43 38,1 39,2 40,7 41,2 41,2Germany 25,7 25,5 24,2 25,1 26,8 26,1 25,8 26,5 27,7 29,4 29,8 30,7Estonia 30,8 29,5 28,1 27,6 27,4 30,6 32,5 33,3 34,1 35,9 40 40,3Ireland 27,5 30,6 32 35,1 38,6 39,2 41,3 43,3 46,1 48,9 49,9 49,4Greece 25,4 24,9 23,4 22,8 24,9 25,3 26,7 26,2 25,6 26,5 28,4 28,9Spain 29,2 31,3 33,3 34 35,9 38,6 38,1 39,5 39,8 39,4 40,6 40,6France 27,4 29,5 31,5 34,9 35,7 37,7 39,7 41,4 41,2 43,2 43,5 43,4Italy 11,6 12,2 13,1 13,9 15,6 17 17,7 18,6 19,2 19 19,8 20,3Cyprus 31,1 32,7 36 39,9 41 40,8 46,1 46,2 47,1 44,7 45,1 45,8Latvia 18,6 16,8 17,3 18,3 18,5 18,5 19,2 25,6 27 30,1 32,3 35,7Lithuania 42,6 21,2 23,4 25,2 31,1 37,9 39,4 38 39,9 40,6 43,8 45,4Luxembourg 21,2 23,9 23,6 17,3 31,4 37,6 35,5 35,3 39,8 46,6 46,1 48,2Hungary 14,8 14,8 14,4 16,3 18,5 17,9 19 20,1 22,4 23,9 25,7 28,1Malta 7,4 12,9 9,3 13,7 17,6 18,4 21,6 21,5 20,9 21 21,5 21,1Netherlands 26,5 27,2 28,6 31,7 33,6 34,9 35,8 36,4 40,2 40,5 41,4 41,1Austria NA NA NA NA 21 20,5 21,2 21,1 22,2 23,5 23,5 23,8Poland 12,5 13,2 14,4 17,2 20,4 22,7 24,7 27 29,7 32,8 35,3 36,9Portugal 11,3 11,7 13 14,9 16,5 17,7 18,4 19,8 21,6 21,1 23,5 26,1Romania 8,9 8,8 9,1 8,9 10,3 11,4 12,4 13,9 16 16,8 18,1 20,4Slovenia 18,5 18,1 20,7 23,6 25,1 24,6 28,1 31 30,9 31,6 34,8 37,9Slovakia 10,6 10,7 10,5 11,5 12,9 14,3 14,4 14,8 15,8 17,6 22,1 23,4Finland 40,3 41,6 41,2 41,7 43,4 43,7 46,2 47,3 45,7 45,9 45,7 46Sweden 31,8 26,6 28,3 31 33,9 37,6 39,5 41 42 43,9 45,8 47,5United Kingdom 29 29,9 31,5 31,5 33,6 34,6 36,5 38,5 39,7 41,5 43 45,8

Evaluation of Investment in Education and the Results Obtained in the EU

The XV. International Scientific Conference Human Capital and Investment in Education

Students (ISCED 5-6) Studying in Another EU-27, European Economic Area or Candidate Country (1.000)

Source: Eurostat

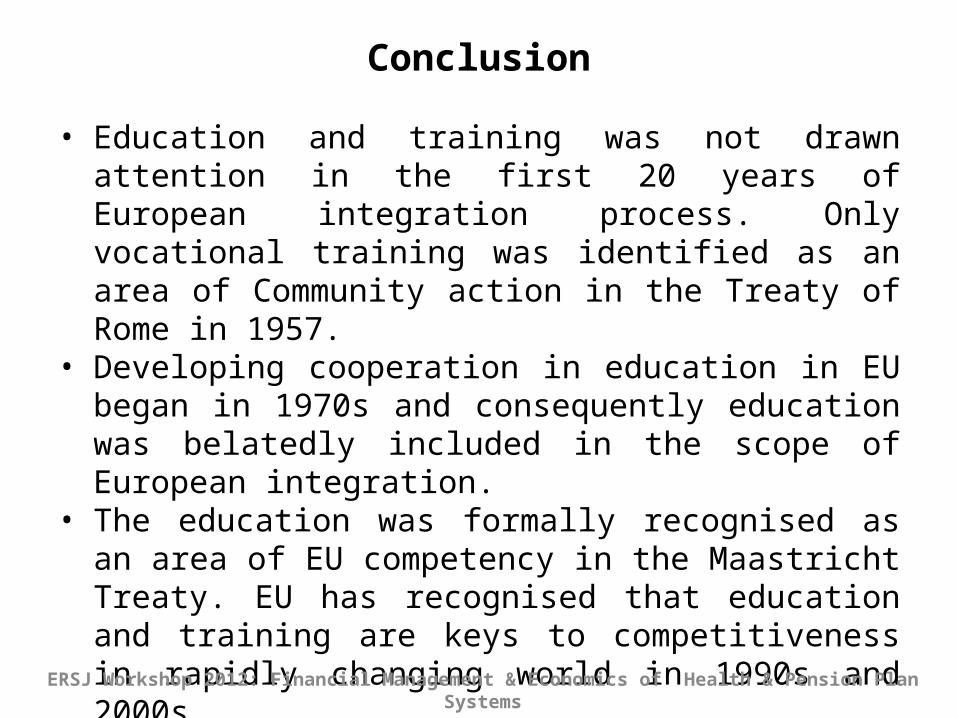
• Education and training was not drawn attention in the first 20 years of European integration process. Only vocational training was identified as an area of Community action in the Treaty of Rome in 1957.

• Developing cooperation in education in EU began in 1970s and consequently education was belatedly included in the scope of European integration.

• The education was formally recognised as an area of EU competency in the Maastricht Treaty. EU has recognised that education and training are keys to competitiveness in rapidly changing world in 1990s and 2000s.

• The EU has primarily set goals by 10-year strategies and then tried to reach this goal within the determined period by evaluating the developments yearly.

ERSJ Workshop 2012: Financial Management & Economics of Health & Pension Plan Systems

Conclusion

• EU failed to reach the goals determined by Lisbon strategy for 2000-2010. Progress towards achieving the new 2020 benchmarks can not yet be monitored.

• But although EU couldn't reach the goals of Lisbon strategy, the determined goals in education contributed to the progress in education and training by acting as an anchor.

• The main reasons of the failure are - The global finanical crisis of 2008 and - The ongoing Eurozone sovereign debt crisis.

• One of the main reasons of the European debt crisis is differences in development levels and competitiveness of economies of the Eurozone countries.

• Similarly there are great variations in statistics of education and training which are the components of competitiveness.

ERSJ Workshop 2012: Financial Management & Economics of Health & Pension Plan Systems

Conclusion

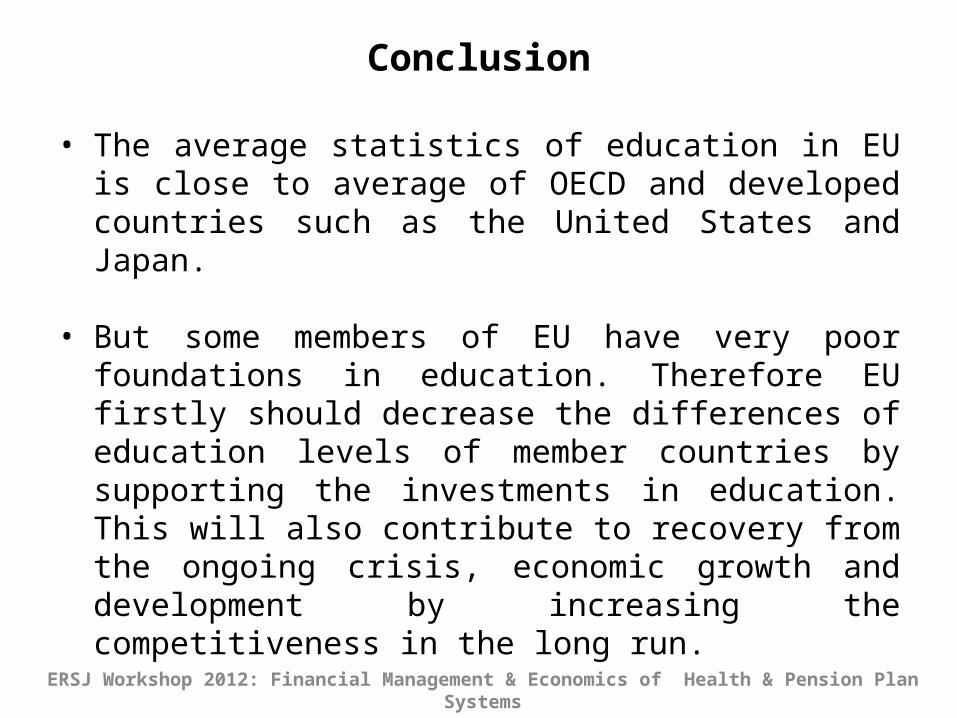
• The average statistics of education in EU is close to average of OECD and developed countries such as the United States and Japan.

• But some members of EU have very poor foundations in education. Therefore EU firstly should decrease the differences of education levels of member countries by supporting the investments in education. This will also contribute to recovery from the ongoing crisis, economic growth and development by increasing the competitiveness in the long run.

ERSJ Workshop 2012: Financial Management & Economics of Health & Pension Plan Systems

Conclusion

Thank you for your attention!


Recommended