70
Evaluation of IR LIS531H
| Date post: | 29-Dec-2015 |
| Category: |
Documents |
| Upload: | suzanna-park |
| View: | 216 times |
| Download: | 2 times |

Evaluation of IR
LIS531H

Why eval?
• When designing and using a system there are decisions to be made: Manual or automatic indexing? Controlled vocabularies or natural language. Stem or not? Use stop lists? What kind of query syntax? How to display the retrieved items to the user? What would be best for your user population and company/library?
• Are human judgments consistent? Reliable?• Need to demonstrate empirically that a system is good …and find ways to improve it.

How to evaluate
• Consider IR evaluation as any other research project: need repeatable criteria to evaluate how effective an IR system is in meeting the information needs of the user.
• How to define the task that the human is attempting?
• What criteria mean success?

How to evaluate?
• Big question! What specifically or whole system? Speed of retrieval? Resources required Presentation of documents Market appeal
• Eval generally comparative: system A vs. B
• Cost-benefit analysis• Most commonly: Retrieval Effectiveness

How to evaluate
• Relevance and test collections• Metrics:
Recall and precision E and F Swets and operating characteristics Expected search length
• Case studies (known item searches)• Significance tests• Other issues and problems

Relevance
• A relevant doc is one judged useful in the context of a query, but … Who judges? What’s useful? Serendipitous utility Humans aren’t consistent in judgments
• With real collections, one never knows the full set of relevant documents in the collection
• Retrieval models incorporate the notion of relevance Probability of (relevance | query, document) How similar to the query What language model is used in the IR system

How to find all relevant docs?
• Collection needs complete judges: “yes”, “no” or some score for every query-doc pair!
• For small test collections: can review all docs for all queries
• Not practical for medium- or large-collections
• Other approaches: Pooling, sampling, search-based

Finding relevant docs (2)
• Search based: Rather than read every doc, use manually-guided search; read retrieved docs until convinced all relevance found
• Pooling: Retrieve docs using several, usually automatic, techniques; Judge the top n docs for each technique. Relevant set is the union; subset of true relevant set
• Sampling: Estimate size of true relevant set by sampling
• All are incomplete, so when testing… How should unjudged documents be treated? How might this affect results?

Evaluation Fundamentals
D = set of documents
A = set of documents that satisfy some user-based criterion
B = set of documents
identified by the search
system

Evaluation Fundamentals
retrieved relevant | A B | relevant | A |
retrieved relevant | A B | retrieved | B |
retrieved not-relevant | B - A B | not-relevant | D - A |
recall = =
precision = =
fallout = =

Evaluation Fundamentals
• Recall and Precision: depend on concept of relevance.
• Relevance is a context-, task-dependent property of documents. [What’s linguistically and philosophically wrong about this approach?]
“Relevance is the correspondence in context between an information requirement statement ... and an article (a document), that is, the extent to which the article covers the material that is appropriate to the requirement statement.?
F. W. Lancaster, 1979

Evaluation Fundamentals
• Relevancy judgments vary in reliability: For text documents, users knowledgeable about a subject are usually in close agreement in deciding whether a document is relevant to an info requirement (the query)
Less consistency with non-textual docs, such as photos
Attempts to use a level of relevance such as a Likert scale haven’t worked. [Do you believe it? Why not? Other tests?]

Effectiveness Measures - Recall & Precision
• Precision Proportion of a retrieved set that’s relevant Precision = |relevant retrieved| ÷ |relevant|
• Recall Proportion of all relevant docs in the collection included in the retrieval set
Recall = |relevant retrieved| ÷ |relevant| = P(retrieved | relevant)
• Precision & recall well-defined for sets.• For ranked retrieval:
compute a P/R point for each relevant document; compare a value at fixed recall points (e.g., Precision at 20% recall); compute value at fixed rank cutoffs (e.g., precision at rank 20)

Another common representation
• Relevant = A+C• Retrieved = A+B• Collection size=A+B+C+D
• Precision = A÷(A+B)• Recall = A ÷ (A+C)• Miss = C ÷ (A+C)• False alarm (fallout) = B ÷ (B+D)
Retrieved
Not relevan
t
Retrieved
A B
Not retrieved
C D

Precision & Recall example
QuickTime™ and aTIFF (LZW) decompressor
are needed to see this picture.

Average precision of a query
• Often want a single-number effectiveness measure; average precision is widely used
• Calculate by averaging precision when recall increases:
QuickTime™ and aTIFF (LZW) decompressor
are needed to see this picture.

Precision and Recall - ex. 2
QuickTime™ and aTIFF (LZW) decompressor
are needed to see this picture.

Evaluation Fundamentals - History
• Cranfield Experiments - Cyril Cleverdon, Cranfield College of Aeronautics, 1957-68.
• SMART System, G. Salton, Cornell, 1964-1988
• TREC, Donna Hartman, National Institute of Standards and Technology (NIST), 1992 - Various TREC tracks

Sample test collections
Collection
Cranfield CACM ISI West Trec2
Coll size 1,400 docs
3,204 1,460 11,953 742,611
Size (mb) 1.5 2.3 2.2 254 2,162
Year 1968 1983 1983 1990 1991
Unique stems
8,226 5,493 5,448 196,707 1,040,415
Stem occurrences
123,200 11,568 98,304 21,798,833
243,800,000
Max within doc freq
27 27 1,309
Mean doc length
88 36.7 67.3 1,823 328
# of queries
225 50 35 44 100

Sample Experiment (Cranfield)
Comparative efficiency of indexing systems:
(Universal Decimal Classification, alphabetical subject index, a special facet classification, Uniterm system of co-ordinate indexing)
Four indexes prepared manually for each document in three batches of 6,000 documents -- total 18,000 documents, each indexed four times. The documents were reports and paper in aeronautics.
Indexes for testing were prepared on index cards and other cards.
Very careful control of indexing procedures.

Sample Experiment (Cranfield)
Searching:
• 1,200 test questions, each satisfied by at least one document
• Reviewed by expert panel
• Searches carried out by 3 expert librarians
• Two rounds of searching to develop testing methodology
• Subsidiary experiments at English Electric Whetstone Laboratory and Western Reserve University

Sample Experiment (Cranfield)
The Cranfield data was made widely available and used by other researchers
• Salton used the Cranfield data with the SMART system (a) to study the relationship between recall and precision, and (b) to compare automatic indexing with human indexing
• Sparc Jones and van Rijsbergen used the Cranfield data for experiments in relevance weighting, clustering, definition of test corpora, etc.

Sample Experiment (Cranfield)
Cleverdon's work was applied to matching methods. He made extensive use of recall and precision, based on concept of relevance.
recall (%)
precision (%)
x
xxx
xx
x
x
x
x
Each x represents one search. The graph illustrates the trade-off between precision and recall.

Typical precision-recall graph for different queries
1.0
0.75
0.5
0.25
1.00.750.50.25recall
precision
Broad, general query
Narrow, specific query
Using Boolean type queries

Some Cranfield Results
• The various manual indexing systems have similar retrieval efficiency
• Retrieval effectiveness using automatic indexing can be at least as effective as manual indexing with controlled vocabularies
-> original results from the Cranfield + SMART experiments (published in 1967) -> considered counter-intuitive -> other results since then have supported this conclusion

Precision and Recall with Ranked Results
• Precision and recall are defined for a fixed set of hits, e.g., Boolean retrieval.
• Their use needs to be modified for a ranked list of results.

Ranked retrieval: Recall and precision after retrieval of n documents
SMART system using Cranfield data, 200 documents in aeronautics of which 5 are relevant
n relevant recall precision1 yes 0.2 1.02 yes 0.4 1.03 no 0.4 0.674 yes 0.6 0.755 no 0.6 0.606 yes 0.8 0.677 no 0.8 0.578 no 0.8 0.509 no 0.8 0.4410 no 0.8 0.4011 no 0.8 0.3612 no 0.8 0.3313 yes 1.0 0.3814 no 1.0 0.36
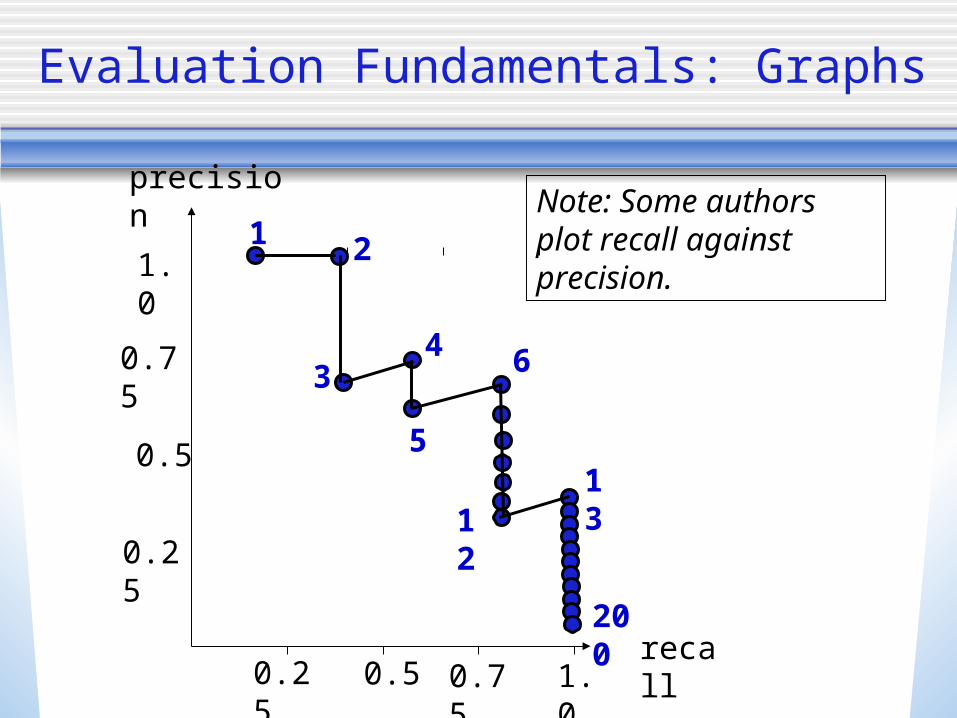
Evaluation Fundamentals: Graphs
1.0
0.75
0.5
0.25
1.00.750.50.25recall
precision
1 2
34
5
6
1213
200
Note: Some authors plot recall against precision.

11 Point Precision (Recall Cut Off)
p(n) is precision at that point where recall has first reached n
Define 11 standard recall points p(r0), p(r1), ... p(r10),
where p(rj) = p(j/10)
Note: if p(rj) is not an exact data point, use interpolation

Recall cutoff graph: choice of interpolation points
1.0
0.75
0.5
0.25
1.00.750.50.25recall
1 2
34
5
6
1213
200
The blue line is the recall cutoff graph.

Example 2: SMART
Recall Precision 0.0 1.0 0.1 1.0 0.2 1.0 0.3 1.0 0.4 1.0 0.5 0.75 0.6 0.75 0.7 0.67 0.8 0.67 0.9 0.38 1.0 0.38
Precision values in blue are actual data.
Precision values in red are by interpolation (by convention equal to the next actual data value).

Average precision
Average precision for a single topic is the mean of the precision obtained after each relevant document is obtained.
Example:
p = (1.0 + 1.0 + 0.75 + 0.67 + 0.38) / 5
= 0.75
Mean average precision for a run consisting of many topics is the mean of the average precision scores for each individual topic in the run.
Definitions from TREC-8

Normalized recall measure
5 10 15 200195
ideal ranks
actual ranks
worst ranks
recall
ranks of retrieved documents

Normalized recall
area between actual and worst area between best and worstNormalized recall =
Rnorm = 1 - (after some mathematical manipulation)
ri - i
n(N - n)
i = 1
n
i = 1
n

Combining Recall and Precision: Normalized Symmetric Difference
Relevant Retrieved
D = set of documents
AB
Symmetric difference, S = A B - A B
Normalized symmetric difference = |S| / 2 (|A| + |B|)
= 1 - 1(1/recall + 1/precision)
Symmetric Difference: The set of elements belonging to one but not both of two given sets.
12 { }

Statistical tests
Suppose that a search is carried out on systems i and j
System i is superior to system j if, for all test cases,
recall(i) >= recall(j)precisions(i) >= precision(j)
In practice, we have data from a limited number of test cases. What conclusions can we draw?

Recall-precision graph
1.0
0.75
0.5
0.25
1.00.750.50.25
recall
precision
The red system appears better than the black, but is the difference statistically significant?

Statistical tests
• The t-test is the standard statistical test for comparing two table of numbers, but depends on statistical assumptions of independence and normal distributions that do not apply to these data.
• The sign test makes no assumptions of normality and uses only the sign (not the magnitude) of the the differences in the sample values, but assumes independent samples.
• The Wilcoxon signed rank uses the ranks of the differences, not their magnitudes, and makes no assumption of normality but but assumes independent samples.

Test collections
• Compare retrieval performance using a test collection: a set of documents, a set of queries, and as et of relevance judgments (which docs are relevant to each query)
• To compare the performance of 2 techniques: Each technique used to evaluate test queries Results (set or ranked list) compared using some performance measure; most commonly precision and recall
• Usually multiple measures to get different views of performance; usually test with multiple collections (performance is collection dependent)

Recall/Precision graphs
• Average precision hides info• Sometimes better to show tradeoff in table or graph
QuickTime™ and aTIFF (LZW) decompressor
are needed to see this picture.

Averaging across queries
• Hard to compare P/R graphs or tables for individual queries (too much data)
• Two main types of averaging: Micro-average (each relevant doc is a point in the avg)
Macro-average (each query is a point in the avg)*
• Also done with average precision value Average of many queries’ average precision values
Called mean average precision (MAP)

Averaging Graphs: a false start
• The raw plots of P/R usually require interpolation
QuickTime™ and aTIFF (LZW) decompressor
are needed to see this picture.
QuickTime™ and aTIFF (LZW) decompressor
are needed to see this picture.

Interpolation
• As recall increases, precision decreases (on average!)
• One approach takes a set of recall/precision points (R,P) and make a step function:
€
P(R) = max{P':R'≥ R∧(R',P')∈ S}

Step graph
QuickTime™ and aTIFF (LZW) decompressor
are needed to see this picture.

Another example
QuickTime™ and aTIFF (LZW) decompressor
are needed to see this picture.
Van Rijsbergen, p. 117 (1979)

Interpolation and Averaging
QuickTime™ and aTIFF (LZW) decompressor
are needed to see this picture.

Interpolated average precision
• Average precision at standard recall points
• For a given query, compute P/R point for every relevant doc
• Interpolate precision at standard recall levels 11-pt is usually 100%, 90%… 10%, 0% 3-pt is usually 75%, 50%, 25%
• Average overall queries to get average precision at each recall level
• Average interpolated recall levels to get single result “mean average precision” is common.

Improvements in IR over the years
QuickTime™ and aTIFF (LZW) decompressor
are needed to see this picture.

Effectiveness Measures: E & F
• E measure (van Rijsbergen)
• Used to emphasize precision (or recall) Essentially a weighted avg of precision and recall
Large a increases importance of precision Can transform by = 1(2+1), b=P/R
When =1 (=1/2), equal importance of P and R Normalized symmetric difference of retrieved and relevant sets
€
E =1−1
α1
P+ (1−α )
1
R
€
E =1−(β 2 +1)PR
β 2P + R

Symmetric Difference and E
QuickTime™ and aTIFF (LZW) decompressor
are needed to see this picture.

F measure
• F=1-E often used - good results mean larger values of F
• “F1” measure is popular, especially with classification researchers: F with =1
€
Fβ =1− E =(β 2 +1)PR
β 2P + R
€
F1 =2PR
P + R

F measure as an average
• Harmonic mean of P and R (inverse of averages of their inverses!); Heavily penalizes low values of P or R
QuickTime™ and aTIFF (LZW) decompressor
are needed to see this picture.

F measure, geometric interpretation
QuickTime™ and aTIFF (LZW) decompressor
are needed to see this picture.

Other single-valued measures
• Swets (next)• Expected search length• Normalized precision or recall (measures area between actual and ideal curves)
• Breakeven point (point at which precision = recall)
• Utility measures Assign costs to each cell in the contingency table; sum costs for all queries
• Many others!

Swets Model, 1963
• Based on signal detection & statistical decision theory
• “Properties of a desirable measure of retrieval performance” Based on ability of system to distinguish between wanted and unwanted items
Should express discrimination power independent of “any acceptance criterion” employed by system or user!
• Characterizes recall-fallout curve generated by variation of control valuable , e.g., P(Q|D)
• Assume is normally distributed on the set of relevant docs and also on the set of non-relevant documents

Probability distributions for relevant and non-relevant
documents.
QuickTime™ and aTIFF (LZW) decompressor
are needed to see this picture.
Two normal distributions for l, one on the set of relevant docs; the other on non-relevant documents. Shaded areas represent recall and fallout.

Swets model, con’t.
• Note - we’re skipping a lot more about interpreting Swets. Recognize that Swets doesn’t use R/P but Recall/Fallout
• From this, DARPA studies are probabilities of missing documents vs. probability of false alarm (false hits).

Expected Search Length Evaluation
• Eval is based on type of info need: Only one relevant doc is required Some arbitrary number n All relevant documents A given proportion of relevant documents
• Search strategy output assumed to be weak ordering• Simple ordering means never have 2+ docs at the
same level of ordering• Search Length in a single ordering is the number
of non-relevant doc a suer must scan before the info need is satisfied
• Expected Search Length appropriate for weak ordering

Expected Search Length
QuickTime™ and aTIFF (LZW) decompressor
are needed to see this picture.

Evaluation Case Study: Known Item Search
• What if purpose of query is to find something you know exists? (e.g., a homepage)
• Effective Site Finding using Anchor Information (Craswell, Hawking, and Robertson, SIGIR 2001)
• Links turn out to be more useful than content!
• Turning this idea into a researchable problem …

Problem statement
• Site finding A site is an organized collection of pages on a specific topic, maintained by a single person or group
Not the same as a domain (e.g., aol.com which has numerous sites)
Topic can be extremely broad
• Examples (from a query log) Where can I find the official Harry Potter site?
[Not: “Who was Cleopatra”, “Where’s Paris”]
• Therefore, given a query, find a URL.

Setting up for an evaluation
• Recall:need docs, queries, and relevance judgments
• Doc set is a collection of 18.5 million web pages• Here, will create <site-finding query,URL> pairs• Query-first selection:
Randomly choose a query from an Excite query log Have a human find the URL that is a match Must ensure that page exists in the test collection
• Document-first selection: Randomly select a web page Navigate to its “entry page” Create a query that matches it May not be representative, tho

Evaluation the Known Item
• Usually there’s only 1 possible answer (the site’s page) So recall is either 0 or 1 Recall/precision graphs are not very interesting, tho
• Instead, measure the rank where the site’s URL was found Sometimes scored as 1/rank (“reciprocal rank”)
When averaged over many queries, called “mean reciprocal rank”
• Can also plot it as a graph

Rank where site found
• Anchor method vastly more likely to get answer at top rank: Anchor: MRR = .791 Content: MRR = .321
• Intuition: On avg, ranchor method finds the site at rank 1/.791=1.25; content finds it at rank 3.1
• Precision at rank 1: Anchor: 68%; content: 21%

University example
QuickTime™ and aTIFF (LZW) decompressor
are needed to see this picture.

Evaluation: Significance Tests
• System A beats System B on one query… Just lucky? Maybe System B is better for some things
• System A and B are identical on all but 1 query If A beats B by enough on that one query, average will make A look better than B
• System A is .00001% better … so what?• Significance tests consider those issues…

Significance Tests
• Are the observed differences statistically different? Can’t make assumptions about underlying distribution Most significance tests do make such assumptions See linguistic corpora for distributions, but …
• Sign test or Wilcoxon signed-ranks tests are typical Don’t require normally distributed data; sign test answers “how often”; Wilcoxon answers “how much”
• But are these differences detectable by users?

Feedback Evaluation
• Will review relevance feedback later, too.• How to treat documents that have been seen
before? • Rank freezing:
Ranks of relevant docs are fixed for subsequent iterations; compare ranking with original ranking; performance can’t get worse
• Residual collection: All previously-seen docs (e.g., the top n) are removed from the collection; compare reranking with original (n+1…D)
• Both approaches are problematic: Users probably want to see the good documents move to the top of the list

Feedback Eval: user perceptions
• Effectiveness measures give a user’s sense of quality - but might consider: Time to complete a retrieval task User ‘satisfaction’ How well users believe the system works
• An “intelligent” IR system is one that doesn’t look stupid to the users
• User studies difficult to design and expensive to conduct
• Subjects can’t repeat queries• Hard to isolate effects of search engine and user
interface• Hard to control for individual performance
differences• TREC “interactive” track

Problems with evaluation
• Retrieval techniques are highly collection- and query-specific Single techniques must be tested on multiple coll. Comparison of techniques must be on same coll. Isolated tests aren’t very useful; Scalability, too
• Standard methods assume user knows right collection• Usually impossible to control all variables• Hard to separate effects of retrieval model and
interface when model requires user interaction• Good test collections are hard + expensive to produce• Usually can’t do cost-benefit analysis• Haven’t satisfied criteria specified by Swets and
others in the 1960s … in short, the question is wide open how to evaluate retrieval effectiveness.


