EVALUATION OF LOCALIZED DEER MANAGEMENT TECHNIQUES FOR THE REDUCTION OF DAMAGE CAUSED BY WHITE-TAILED DEER IN MINNESOTA: A PILOT STUDY Gino D’Angelo SUMMARY OF FINDINGS Minimizing damage caused by white-tailed deer (Odocoileus virginianus) is an important consideration for managing deer densities in Minnesota. I conducted a pilot study during April- December 2013 in southeast Minnesota to begin assessing the effectiveness of localized management of deer (i.e., targeted removal of deer in a limited area) to reduce damage to agricultural crops. I developed an efficient methodology for assessing crop damage caused by deer. I also used baited infrared camera surveys to estimate the abundance of deer on individual properties. Preliminary data on the number of deer harvested relative to the number of deer utilizing properties was important for planning the expansion of localized management in Minnesota. The pilot study provided the basis for a broader study which was initiated in spring 2014. A more comprehensive examination of crop losses relative to deer abundance will be conducted as part of the broader study. INTRODUCTION Damage caused by white-tailed deer can be severe in the United States with >$100 million lost annually by agricultural producers (Conover 1997). Researchers have used multiple methods to evaluate crops depredated by deer (Krueger and McAninch 1990, Wywialowski 1996, Tzilkowski et al. 2002, Stewart et al. 2007), but there are no standard protocols. Regional factors such as growing regime (e.g., timing of planting, fertilizer and herbicide applications, harvest), conservation practices (e.g., contour farming, tillage, irrigation), and local conditions mean that specific techniques to evaluate crop depredation may not be applicable for all settings. Wywialowski (1996) found that producers generally predicted losses to wildlife well. However, Tzilkowski et al. (2002) compared on-the-ground estimates of damage to corn with estimates by farmers. They found that estimates by farmers were not reliable for assessing an individual farmer’s level of damage, but may be more useful to generate damage estimates for a larger sample of farms. Certainly, reliance on estimates of crop losses by producers is not ideal when seeking objective assessments to guide regulations for managing deer. Stewart et al. (2007) recommended that crop damage be assessed on a field-by-field basis using actual evaluation of the plants and the damage plants sustain from deer. Results from previous studies have demonstrated through anecdotal evidence that population reduction of deer can reduce damage to agriculture (McShea et al. 1993, Frost et al. 1997, Conover 2001). In some situations, localized management has effectively reduced the abundance of deer to maintain lowered deer densities over time (McNulty et al. 1997). As a result, damage to resources targeted for protection should be reduced because fewer deer are available to cause damage. However, conditions including high deer densities in surrounding areas (Miller et al. 2010), seasonal migratory behavior of deer (Vercauteren and Hygnstrom 1998), and colonization by deer from adjacent populations (Comer et al. 2007) may inhibit the creation of sufficient temporal periods of low deer densities to provide resource protection. Studies of the effectiveness of localized management to reduce damage to specific properties in agricultural settings are lacking. In many deer permit areas (DPAs) in Minnesota, deer are managed at or near population goals annually. However, complaints of deer damage from agricultural producers are common. During 2010, wildlife managers received 614 complaints about damage caused by wildlife, and 23% (n = 142) of those complaints involved deer (Reindl and Benson 2011). Complaints of depredation by deer in Minnesota include consumption of forage stored for livestock, damage to specialty crops (e.g., produce, Christmas trees, nursery stock), row crops (corn [Zea mays] and soybeans [Glycine max]), alfalfa (Medicago sativa), and forest stands. Page 1
Transcript
EVALUATION OF LOCALIZED DEER MANAGEMENT TECHNIQUES FOR THE REDUCTION OF DAMAGE CAUSED BY WHITE-TAILED DEER IN MINNESOTA: A PILOT STUDY
Gino D’Angelo
SUMMARY OF FINDINGS
Minimizing damage caused by white-tailed deer (Odocoileus virginianus) is an important consideration for managing deer densities in Minnesota. I conducted a pilot study during April-December 2013 in southeast Minnesota to begin assessing the effectiveness of localized management of deer (i.e., targeted removal of deer in a limited area) to reduce damage to agricultural crops. I developed an efficient methodology for assessing crop damage caused by deer. I also used baited infrared camera surveys to estimate the abundance of deer on individual properties. Preliminary data on the number of deer harvested relative to the number of deer utilizing properties was important for planning the expansion of localized management in Minnesota. The pilot study provided the basis for a broader study which was initiated in spring 2014. A more comprehensive examination of crop losses relative to deer abundance will be conducted as part of the broader study.
INTRODUCTION
Damage caused by white-tailed deer can be severe in the United States with >$100 million lost annually by agricultural producers (Conover 1997). Researchers have used multiple methods to evaluate crops depredated by deer (Krueger and McAninch 1990, Wywialowski 1996, Tzilkowski et al. 2002, Stewart et al. 2007), but there are no standard protocols. Regional factors such as growing regime (e.g., timing of planting, fertilizer and herbicide applications, harvest), conservation practices (e.g., contour farming, tillage, irrigation), and local conditions mean that specific techniques to evaluate crop depredation may not be applicable for all settings. Wywialowski (1996) found that producers generally predicted losses to wildlife well. However, Tzilkowski et al. (2002) compared on-the-ground estimates of damage to corn with estimates by farmers. They found that estimates by farmers were not reliable for assessing an individual farmer’s level of damage, but may be more useful to generate damage estimates for a larger sample of farms. Certainly, reliance on estimates of crop losses by producers is not ideal when seeking objective assessments to guide regulations for managing deer. Stewart et al. (2007) recommended that crop damage be assessed on a field-by-field basis using actual evaluation of the plants and the damage plants sustain from deer.
Results from previous studies have demonstrated through anecdotal evidence that population reduction of deer can reduce damage to agriculture (McShea et al. 1993, Frost et al. 1997, Conover 2001). In some situations, localized management has effectively reduced the abundance of deer to maintain lowered deer densities over time (McNulty et al. 1997). As a result, damage to resources targeted for protection should be reduced because fewer deer are available to cause damage. However, conditions including high deer densities in surrounding areas (Miller et al. 2010), seasonal migratory behavior of deer (Vercauteren and Hygnstrom 1998), and colonization by deer from adjacent populations (Comer et al. 2007) may inhibit the creation of sufficient temporal periods of low deer densities to provide resource protection. Studies of the effectiveness of localized management to reduce damage to specific properties in agricultural settings are lacking.
In many deer permit areas (DPAs) in Minnesota, deer are managed at or near population goals annually. However, complaints of deer damage from agricultural producers are common. During 2010, wildlife managers received 614 complaints about damage caused by wildlife, and 23% (n = 142) of those complaints involved deer (Reindl and Benson 2011). Complaints of depredation by deer in Minnesota include consumption of forage stored for livestock, damage to specialty crops (e.g., produce, Christmas trees, nursery stock), row crops (corn [Zea mays] and soybeans [Glycine max]), alfalfa (Medicago sativa), and forest stands.
Page 1
Deer damage is reported throughout Minnesota, but distinct clusters of complaints occur in the southeastern and southwestern regions of the state (Reindl and Benson 2011).
In Minnesota, most deer damage occurs during the growing season in standing row crops and alfalfa in the field or during winter when deer consume forage stored for livestock. By excluding deer from stored forage, the damage can be effectively eliminated. Farmers who enter into a Cooperative Damage Management Agreement (CDMA) with Minnesota Department of Natural Resources (MNDNR) are eligible for a material assistance program to aid in the installation of exclusion fencing. However, funds for deer damage assistance are limited and fencing is only practical for protecting areas that are relatively small (i.e., stored forage and specialty crops). Sound and visual deterrents and taste and smell repellents have proven ineffective for reducing deer damage in agricultural fields (Belant et al. 1996, Belant et al. 1998, Gilsdorf et al. 2004). Therefore, most attempts to reduce damage to standing crops in Minnesota involve the use of localized deer damage management techniques such as shooting permits and depredation permits.
MNDNR Regional Offices have issued shooting permits to agricultural producers experiencing extreme damage caused by deer for use outside of hunting seasons. Shooting permits allow landowners to shoot deer at any time of day or night and with a high-powered rifle. For years 2004 through 2010, an average of 55 shooting permits for nuisance deer were issued annually for use during summer and winter (Reindl and Benson 2011). In southeast Minnesota, landowners with support from local legislators requested shooting permits to be issued during the regular hunting seasons to reduce depredation to standing row crops. As an alternative to their request, a pilot program using depredation permits allocated to specific properties (herein, focal properties) was instituted in 2012 in southeast Minnesota (Luedtke 2013). Depredation permits were to be used by private sport-hunters during regular hunting seasons. Additionally, a temporary MNDNR position, the Landowner Assistance Specialist, was created to administer the program in Fillmore, Goodhue, Houston, Olmsted, Wabasha and Winona counties.
Depredation permits allowed up to 15 hunters per focal property to harvest up to 5 antlerless deer in addition to established bag limits during regular hunting seasons. Consequently, an additional 75 deer could be harvested on an individual property using this program. To be eligible, applicants had to demonstrate: 1) crop losses verified by MNDNR personnel, 2) enrollment in a CDMA with MNDNR including a plan for deer hunting management, and 3) hunting was allowed on the property during the previous hunting season. Depredation permits were issued for 8 properties encompassing 971 hectares during 2012. Seventy five hunters were awarded permits and 166 deer were harvested on depredation permits.
The program was deemed successful because deer were harvested on depredation permits (Luedtke 2013). Anecdotally, landowners and hunters participating in the program felt that the program was beneficial. Several landowners suggested that private properties adjacent to their parcels were providing sanctuary to deer, which inhibited adequate harvest (C. Luedkte, personal communication). Undoubtedly, the service provided by MNDNR staff to facilitate positive interactions among landowners and hunters was important for improving localized management on focal properties. However, without objective measurement of relevant indices including deer abundance and crop depredation, the effects of deer harvest through localized management may not be fully understood. Documentation is lacking regarding the magnitude of damage caused by deer to various agricultural crops in Minnesota. With complaints of deer damage and localized overabundance of deer in other parts of the state, MNDNR Wildlife Managers would like the opportunity to utilize depredation permits throughout the state in future years (MNDNR Deer Management Committee, 28 January 2013, personal communication).
The goal of this pilot study was to develop methods to quantify damage caused by deer in an agricultural landscape which will improve understanding of the relationships between deer damage and localized deer abundance, and the efficacy of localized management.
Page 2
PILOT STUDY RESEARCH OBJECTIVES
1. To develop methods for evaluating depredation caused by white-tailed deer to agricultural crops in Minnesota.
2. To evaluate the intensity of deer management on focal properties where localized management of deer is utilized.
3. To provide a preliminary assessment of localized management in southeast Minnesota.
STUDY AREA
The study was conducted in the Minnesota counties of Fillmore, Houston, and Winona. Southeast Minnesota is characterized by a mosaic of rolling limestone uplands dominated by agriculture (Mossler 1999). Typical crops include corn, soybeans, and alfalfa. Steep ravines cut by narrow streams are interspersed throughout the uplands. Ravines are rocky and primarily forested by mature hardwoods (Omernik and Gallant 1988).
DPAs 345, 346, and 349 were included in the study area. Pre-fawn deer densities in these DPAs averaged 6 deer per km2 (Grund and Walberg 2012), which represents the highest deer densities found in the farmland zone of Minnesota. An average of 2.3 deer per km2 was harvested in these DPAs during 2012, which was nearly twice the statewide average (McInenly 2013). METHODS Experimental Design
Crop Evaluations–During the pilot study, my intent was to develop methods to evaluate
agricultural crops, which would minimize: 1) visits to properties, 2) disturbance to the sites, and 3) disruption to normal agricultural processes. Therefore, to achieve these objectives I worked with landowners, who were willing to cooperate closely with MNDNR, but may not necessarily use localized management of deer on their properties. Refining methods during the pilot study improved my ability to work efficiently on properties where landowners may be less tolerant of my research. For the pilot study, I selected 3 corn fields and 3 soybean fields on properties where landowners were willing to communicate with me about their farming practices and afforded regular access for research purposes.
Management Intensity–Another important aspect of the pilot study was to estimate the intensity of localized deer management. I estimated deer abundance and surveyed landowners about deer harvest on 3 individual properties. Crop evaluations and estimates of management intensity were not conducted on the same properties. Data Collection
Corn Evaluations–I delineated 6 plots within each field, which were stratified into interior (beginning 25 m from the field edge) and edge (beginning on the field edge). Each plot included 2 paired 5-m X 5-m subplots separated by 5 m. One subplot of each pair was fenced to exclude deer and the other subplot was unfenced. I assigned the fencing randomly within each pair. Square exclosures were constructed with 2-m high heavy-duty plastic mesh attached to 4 2.4-m u-posts. Exclosures surrounding subplots were approximately 6 m X 6 m to reduce the effects of fencing on plants within the subplot. Exclosures were installed immediately following planting. When necessary, I temporarily (<72 hours) removed exclosures during herbicide application. I evaluated corn crops near the estimated date of plant maturity before
Page 3
senescence. I recorded the number of rows, number of plants, plant height, level of herbivory per plant, and I classified the quality of each ear of corn relative to damage caused by deer for each subplot. I estimated grain yield (bushels per hectare) for fenced and unfenced subplots using a standard yield estimator. I consulted with the agricultural producer to determine the variety of corn planted in each field.
Soybean Evaluations–I established plots and installed exclosures in soybean fields immediately after planting. I used the aforementioned protocols for placement and number of plots as outlined for evaluations in corn fields. Exclosures surrounding subplots were approximately 5 m X 5 m. The square subplots were smaller (2 X 2 m) than those used for the corn evaluations. Soybeans are planted at a higher density than corn and the plants are shorter in height. The smaller subplots used for soybeans included a sufficient number of individual plants for measurement, but were located far enough to the interior to reduce the effects of fencing on plant growth. I temporarily (<72 hours) removed exclosures during herbicide application when necessary. I evaluated soybean crops near the estimated date of plant maturity before senescence. I recorded the number of rows and the number of plants within each subplot. I then measured plant height, number of bean pods per plant and classified the level of browsing of trifoliate leaves per plant on 30 randomly selected plants in the subplot. I estimated grain yield (bushels per hectare) for fenced and unfenced subplots using a standard yield estimator. I consulted with the agricultural producer to determine the variety of soybeans planted in each field.
Deer Abundance Estimates–I used baited infrared camera surveys to estimate the abundance of deer in the area of crop fields to estimate harvest rates of deer on focal properties. This method of survey was conducted according to previous research by Jacobson et al. (1997). These researchers demonstrated that the abundance of deer in an area could be determined using baited surveys, where bucks could be uniquely identified by antler characteristics and their number used to infer the number of does and fawns visiting repeatedly a bait site. Cameras were placed at a density of 1 camera per 65 hectares in wooded or brushy habitat immediately adjacent to crop fields. This relatively high density of cameras was intended to reduce bias associated with capturing adult bucks at a higher rate at lower camera densities because males have larger home ranges (Jacobson et al. 1997). A bait site was established at each camera location during a 7-day pre-baiting period. During pre-baiting, whole kernel corn and trace mineral salts were placed at each bait site in a quantity sufficient to maintain consistent access by deer 24 hours per day. Following this acclimatization period, an infrared camera was set to record still photographs of deer 24 hours a day at 10-minute intervals during a 14-day survey period. As in the pre-baiting period, bait was provided ad libitum. I generated deer abundance estimates using data pooled from all cameras on a property according to the methods of Jacobson et al. (1997). Deer abundance estimates were conducted during August. This timing increased the likelihood that: 1) fawns were mobile with their dams and available for survey, 2) antler growth of bucks was sufficient to uniquely identify individuals, 3) deer photographed near crop fields were likely those that caused damage during the growing season and should have been available for harvest in the same area, and 4) harvest mortality and disturbance of deer by hunting activities was minimized since the survey preceded deer hunting seasons. RESULTS AND DISCUSSION I conducted the pilot study from April-December 2013. My methods to evaluate crops were acceptable to agricultural producers, did not interfere with normal farming practices, and generated estimates of crop yields and crop losses attributed to deer that may be compared among properties. On the properties where I evaluated crops for the pilot study, agricultural producers did not have complaints about damage caused by deer. Correspondingly, my estimates of crop losses due to deer were low for corn (<10%, Table 1) and negligible for soybeans (Table 2). However, I speculate that focal properties where producers complain of deer damage would have higher deer densities and greater crop losses.
Page 4
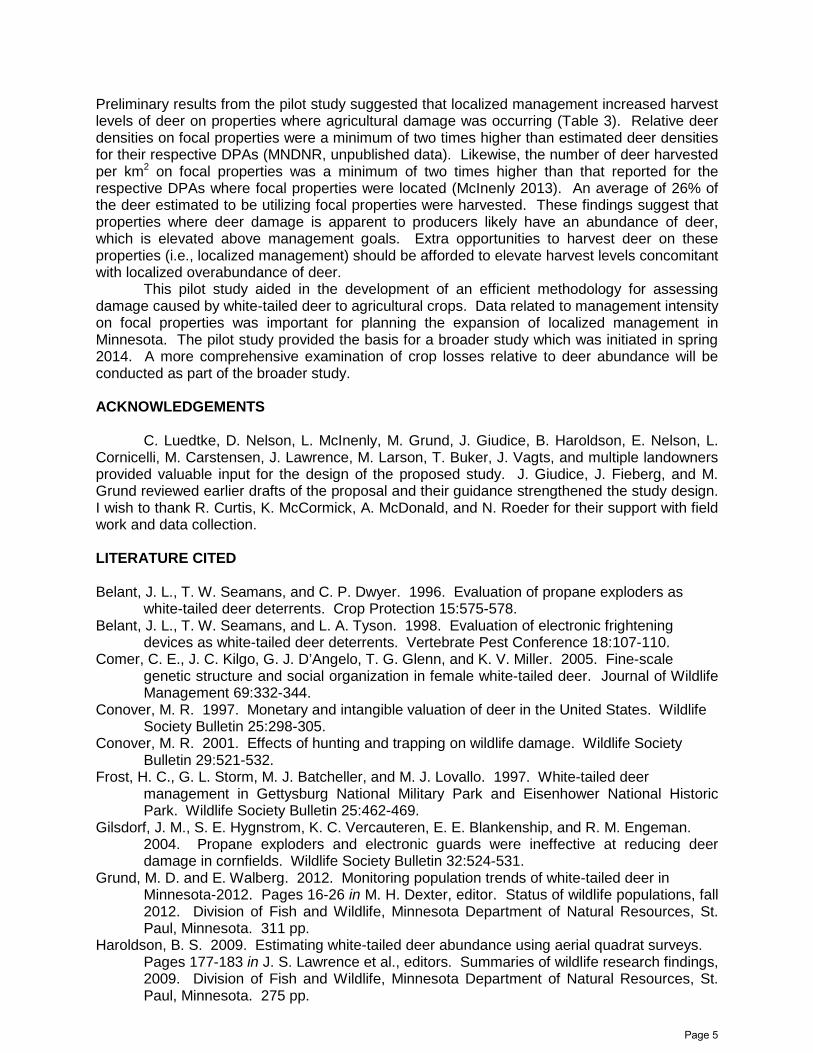
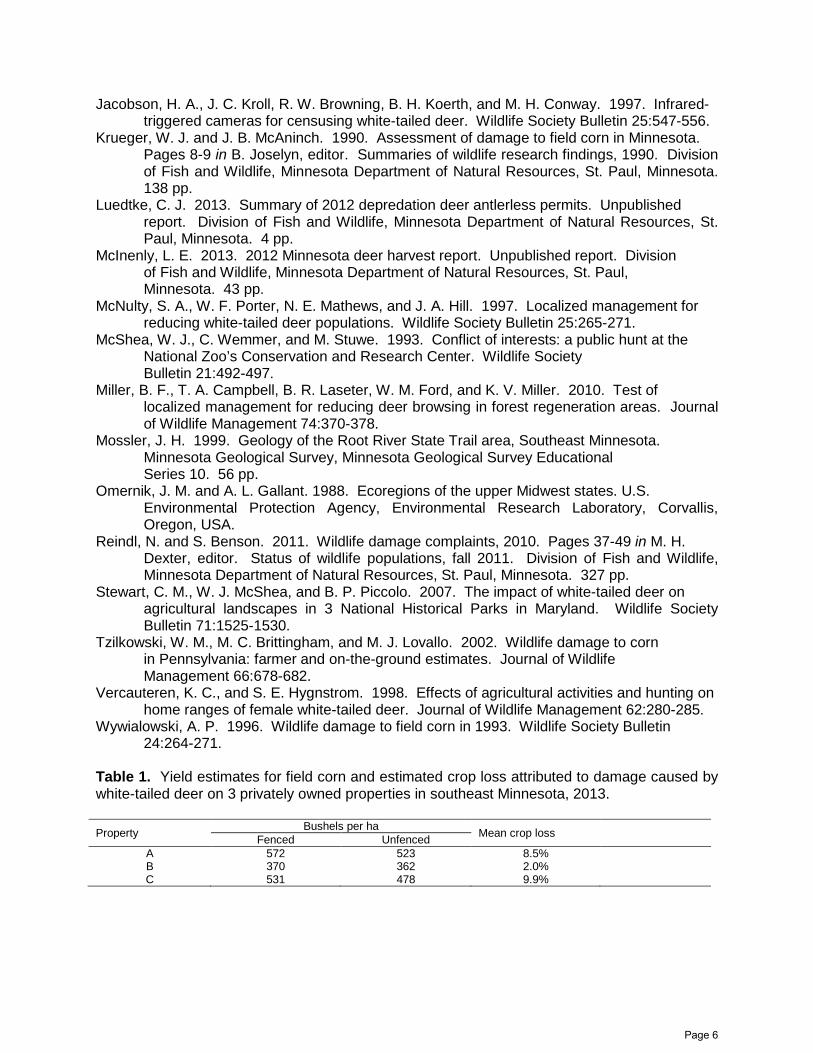
Preliminary results from the pilot study suggested that localized management increased harvest levels of deer on properties where agricultural damage was occurring (Table 3). Relative deer densities on focal properties were a minimum of two times higher than estimated deer densities for their respective DPAs (MNDNR, unpublished data). Likewise, the number of deer harvested per km2 on focal properties was a minimum of two times higher than that reported for the respective DPAs where focal properties were located (McInenly 2013). An average of 26% of the deer estimated to be utilizing focal properties were harvested. These findings suggest that properties where deer damage is apparent to producers likely have an abundance of deer, which is elevated above management goals. Extra opportunities to harvest deer on these properties (i.e., localized management) should be afforded to elevate harvest levels concomitant with localized overabundance of deer.
This pilot study aided in the development of an efficient methodology for assessing damage caused by white-tailed deer to agricultural crops. Data related to management intensity on focal properties was important for planning the expansion of localized management in Minnesota. The pilot study provided the basis for a broader study which was initiated in spring 2014. A more comprehensive examination of crop losses relative to deer abundance will be conducted as part of the broader study. ACKNOWLEDGEMENTS
C. Luedtke, D. Nelson, L. McInenly, M. Grund, J. Giudice, B. Haroldson, E. Nelson, L. Cornicelli, M. Carstensen, J. Lawrence, M. Larson, T. Buker, J. Vagts, and multiple landowners provided valuable input for the design of the proposed study. J. Giudice, J. Fieberg, and M. Grund reviewed earlier drafts of the proposal and their guidance strengthened the study design. I wish to thank R. Curtis, K. McCormick, A. McDonald, and N. Roeder for their support with field work and data collection. LITERATURE CITED Belant, J. L., T. W. Seamans, and C. P. Dwyer. 1996. Evaluation of propane exploders as
white-tailed deer deterrents. Crop Protection 15:575-578. Belant, J. L., T. W. Seamans, and L. A. Tyson. 1998. Evaluation of electronic frightening
devices as white-tailed deer deterrents. Vertebrate Pest Conference 18:107-110. Comer, C. E., J. C. Kilgo, G. J. D’Angelo, T. G. Glenn, and K. V. Miller. 2005. Fine-scale
genetic structure and social organization in female white-tailed deer. Journal of Wildlife Management 69:332-344.
Conover, M. R. 1997. Monetary and intangible valuation of deer in the United States. Wildlife Society Bulletin 25:298-305.
Conover, M. R. 2001. Effects of hunting and trapping on wildlife damage. Wildlife Society Bulletin 29:521-532.
Frost, H. C., G. L. Storm, M. J. Batcheller, and M. J. Lovallo. 1997. White-tailed deer management in Gettysburg National Military Park and Eisenhower National Historic Park. Wildlife Society Bulletin 25:462-469.
Gilsdorf, J. M., S. E. Hygnstrom, K. C. Vercauteren, E. E. Blankenship, and R. M. Engeman. 2004. Propane exploders and electronic guards were ineffective at reducing deer damage in cornfields. Wildlife Society Bulletin 32:524-531.
Grund, M. D. and E. Walberg. 2012. Monitoring population trends of white-tailed deer in Minnesota-2012. Pages 16-26 in M. H. Dexter, editor. Status of wildlife populations, fall 2012. Division of Fish and Wildlife, Minnesota Department of Natural Resources, St. Paul, Minnesota. 311 pp.
Haroldson, B. S. 2009. Estimating white-tailed deer abundance using aerial quadrat surveys. Pages 177-183 in J. S. Lawrence et al., editors. Summaries of wildlife research findings, 2009. Division of Fish and Wildlife, Minnesota Department of Natural Resources, St. Paul, Minnesota. 275 pp.
Page 5
Jacobson, H. A., J. C. Kroll, R. W. Browning, B. H. Koerth, and M. H. Conway. 1997. Infrared- triggered cameras for censusing white-tailed deer. Wildlife Society Bulletin 25:547-556.
Krueger, W. J. and J. B. McAninch. 1990. Assessment of damage to field corn in Minnesota. Pages 8-9 in B. Joselyn, editor. Summaries of wildlife research findings, 1990. Division of Fish and Wildlife, Minnesota Department of Natural Resources, St. Paul, Minnesota. 138 pp.
Luedtke, C. J. 2013. Summary of 2012 depredation deer antlerless permits. Unpublished report. Division of Fish and Wildlife, Minnesota Department of Natural Resources, St. Paul, Minnesota. 4 pp.
McInenly, L. E. 2013. 2012 Minnesota deer harvest report. Unpublished report. Division of Fish and Wildlife, Minnesota Department of Natural Resources, St. Paul, Minnesota. 43 pp.
McNulty, S. A., W. F. Porter, N. E. Mathews, and J. A. Hill. 1997. Localized management for reducing white-tailed deer populations. Wildlife Society Bulletin 25:265-271.
McShea, W. J., C. Wemmer, and M. Stuwe. 1993. Conflict of interests: a public hunt at the National Zoo’s Conservation and Research Center. Wildlife Society Bulletin 21:492-497.
Miller, B. F., T. A. Campbell, B. R. Laseter, W. M. Ford, and K. V. Miller. 2010. Test of localized management for reducing deer browsing in forest regeneration areas. Journal of Wildlife Management 74:370-378.
Mossler, J. H. 1999. Geology of the Root River State Trail area, Southeast Minnesota. Minnesota Geological Survey, Minnesota Geological Survey Educational Series 10. 56 pp.
Omernik, J. M. and A. L. Gallant. 1988. Ecoregions of the upper Midwest states. U.S. Environmental Protection Agency, Environmental Research Laboratory, Corvallis, Oregon, USA.
Reindl, N. and S. Benson. 2011. Wildlife damage complaints, 2010. Pages 37-49 in M. H. Dexter, editor. Status of wildlife populations, fall 2011. Division of Fish and Wildlife, Minnesota Department of Natural Resources, St. Paul, Minnesota. 327 pp.
Stewart, C. M., W. J. McShea, and B. P. Piccolo. 2007. The impact of white-tailed deer on agricultural landscapes in 3 National Historical Parks in Maryland. Wildlife Society Bulletin 71:1525-1530.
Tzilkowski, W. M., M. C. Brittingham, and M. J. Lovallo. 2002. Wildlife damage to corn in Pennsylvania: farmer and on-the-ground estimates. Journal of Wildlife Management 66:678-682.
Vercauteren, K. C., and S. E. Hygnstrom. 1998. Effects of agricultural activities and hunting on home ranges of female white-tailed deer. Journal of Wildlife Management 62:280-285.
Wywialowski, A. P. 1996. Wildlife damage to field corn in 1993. Wildlife Society Bulletin 24:264-271.
Table 1. Yield estimates for field corn and estimated crop loss attributed to damage caused by white-tailed deer on 3 privately owned properties in southeast Minnesota, 2013. Property Bushels per ha Mean crop loss
Fenced Unfenced A 572 523 8.5% B 370 362 2.0% C 531 478 9.9%
Page 6
Table 2. Yield estimates for soybeans and estimated crop loss attributed to damage caused by white-tailed deer on 3 privately owned properties in southeast Minnesota, 2013. Property Bushels per ha Mean crop loss1
Fenced Unfenced A 100 101 -1.0% B 167 171 -2.7% C 182 176 3.0%
1Negative values indicate higher average yield estimates in unfenced subplots versus subplots fenced to exclude deer. Table 3. Estimates of the abundance of white-tailed deer and management intensity of deer on 4 privately owned properties in southeast Minnesota, 2013.
Property Area (km2) Estimated deer abundance
Relative deer density (deer per km2)
Total deer removed
Deer removed per km2
Management intensity1
D 0.9 80 89 12 13.3 15% E 1.0 37 37 10 10.0 27% F 2.5 106 42 43 17.2 41% G 3.8 107 28 21 5.5 20%
1Proportion (%) of the number of deer estimated to be using a property that were harvested.
Page 7
EVALUATING PREFERENCES OF HUNTERS AND LANDOWNERS FOR MANAGING WHITE-TAILED DEER IN SOUTHWEST MINNESOTA1
Gino D’Angelo and Marrett Grund
SUMMARY OF FINDINGS
During 2012, Minnesota Department of Natural Resources (MNDNR) conducted goal-setting process to gather public input to aid in setting white-tailed deer (Odocoileus virginianus) population goals for southwest Minnesota. The goal-setting process included development of recommendations for deer population goals by stakeholder teams and an online questionnaire of voluntary participants. The results of the goal-setting process were not clear, with 46% of respondents indicating that deer numbers were about right and 50% of respondents indicating that deer numbers were too low. With no major opinion about deer population levels in southwest Minnesota, the results of the goal-setting process were difficult to apply to management. In addition, only 36% of online respondents were satisfied with the goal-setting process. Thus, the purpose of our study was to obtain detailed public input data to aid in setting deer population goals for southwest Minnesota.
We mailed surveys to 3,600 hunters and 4,604 landowners in southwest Minnesota to evaluate their experiences and attitudes regarding white-tailed deer densities, hunting opportunities, and potential regulations for deer hunting (Figure 1). We received a total of 2,063 completed surveys from hunters for a response rate of 59.3%. We received a total of 2,105 completed surveys from landowners for a response rate of 47.8%.
Most respondents (98%) to the hunter survey participated in the 2012 deer hunting season. Fifty-two percent of landowners either deer hunted during 2012 (26%) or hunted in Minnesota in the past (26%). Hunters had an average of 23 years of experience hunting in Minnesota, whereas landowners hunted an average of 33 years in Minnesota. Twelve percent of hunters archery hunted, 98% firearm hunted, and 17% muzzleloader hunted. Almost nineteen percent of landowners who hunt participated in archery season, 90% firearm hunted, and 25% muzzleloader hunted. Most hunters (57%) and landowners who hunt (62%) would prefer to kill a mature buck versus female deer or smaller bucks.
One-third of respondents who hunted harvested a buck in southwest Minnesota in 2012. Most hunters (>57%) were satisfied with the number of antlerless deer and the total number of deer seen while hunting. Likewise, most hunters (>76%) felt that the number of either-sex permits provided was either too low or about right. Only about one-third of all hunters were satisfied with the number and quality of bucks.
The landowners we surveyed controlled relatively large landholdings, which were primarily used for row-crop agriculture. They represented approximately 50% of landowners with >160 acres in southwest Minnesota. Two-thirds of respondents had knowledge about wildlife damage to crops on their properties. Therefore, the opinions of landowners included in this survey should accurately describe those of agricultural producers in southwest Minnesota. Although 73% of landowners reported at least some damage due to deer, average total crop damage due to deer was $4885. Considering the large-scale production by respondents, crop losses to deer damage were relatively minor. Also, most landowners recognized that other species caused damage to crops, and attributed an average of 35% of damage to deer. Sixty-nine percent of landowners believed that deer damage was less than or the same as 5 years ago, which suggests that perceptions about crop damage may not be influenced by increased commodity prices.
1For full report, please see: D’Angelo, G. J., and M. D. Grund. 2014. Evaluating preferences of hunters and landowners for managing white-tailed deer in southwest Minnesota. Division of Fish and Wildlife, Minnesota Department of Natural Resources, St. Paul, Minnesota. 101 pp.
Page 8
Ninety percent of landowners allow family members to hunt on their property and 19% of landowners allow hunting by non-family. Other than family, most landowners will allow friends or neighbors to hunt (80%). Eighteen percent of landowners will allow strangers who ask permission to hunt, and few allow specific hunting groups (5%). The average number of people landowners allow to hunt their land was 5 individuals, which equates to about 1 hunter per 123 acres. Less than 1% of landowners stated that they do not allow people to hunt because they do not believe in hunting.
Only 36% of hunters and 18% of landowners felt that there were fewer deer in 2012 than 5 years ago in their area. Similar proportions of hunters (28%) and landowners (30%) believed there should be no change in the level of the deer population. However, the opinions of hunters trended toward increasing the deer population, while landowners tended to want the deer population decreased. Our results indicated that most hunters and landowners believed that there was an adequate number of deer in the population.
Landowners were less concerned about the specifics of deer harvest regulations than hunters. This is evident in their response rates, and answers which were distributed among categories of support or opposition with no clear majority opinion. Most hunters (59%) support a regulation to increase the proportion of antlered bucks in the population (Figure 2). Hunters were asked to rate their support for three potential regulations to reduce harvest pressure on bucks–buck permit lottery, antler point restriction, and a prohibition on cross-tagging of bucks. There was little support among hunters for a buck permit lottery (28%) or a prohibition on the cross-tagging of bucks (28%), however 50% of hunters supported an antler point restriction and 50% of hunters supported a youth-only deer season.
Only one-third of hunters supported buck-only hunting or a prohibition of cross-tagging antlerless deer. It is unlikely that these regulatory changes will be necessary since deer population levels are at or near goal levels and most hunters and landowners are satisfied with current deer numbers. Despite claims voiced by some hunters, there is little support for starting firearm season earlier (14%) or later (26%).
Our results indicated that that most hunters and landowners were satisfied with current deer numbers and believed the number of either-sex permits issued by the MNDNR has been appropriate. Although reports of damage due to deer were relatively minor, nearly one-half of landowners wanted deer densities reduced. Although hunters tend to prefer higher deer densities to maximize recreational opportunities, 20% of hunters wanted deer densities reduced. Thus, current deer densities should be considered to be near maximum levels to be acceptable to all stakeholders. Special opportunities to harvest deer should be afforded to landowners when non-lethal measures are not sufficient to minimize damage.
About two-thirds of the hunters we surveyed were not satisfied with the number or quality of bucks in the southwest Minnesota deer population. As demonstrated in southeast Minnesota and in other states, an antler-point restriction regulation reduces harvest mortality rates of young bucks thereby allowing bucks to reach older-age classes and grow larger racks. Previous hunter surveys conducted in Minnesota suggested that buck harvest mortality would slightly decrease if hunters were not able to cross-tag bucks with their hunting licenses. Our results suggest that 50% of hunters support an antler-point restriction regulation but there was strong opposition from hunters about prohibiting the cross-tagging of deer. Based on these findings, we believe wildlife managers should consider implementing an antler-point restriction to address satisfaction levels associated with the quantity and quality of bucks in southwest Minnesota deer populations.
Page 9
Figure 1. Location of deer permit areas in southwest Minnesota where Minnesota Department of Natural Resources surveyed hunters and landowners during 2013 to evaluate their preferences for managing white-tailed deer in the region.
Figure 2. Support of hunters for regulatory changes to white-tailed deer hunting in southwest Minnesota, 2012.
Page 10
ESTABLISHMENT OF FORBS IN EXISTING GRASS STANDS DOMINATED BY WARM-SEASON GRASSES
Nicole Davros, Molly Tranel Nelson, Kurt Haroldson, and Véronique St-Louis
SUMMARY OF FINDINGS
Interseeding native forbs into reconstructed grasslands dominated by warm-season grasses could restore plant species diversity and improve wildlife habitat, yet many managers report having limited experience with interseeding and poor success with a few early attempts. Survival of forbs interseeded directly into existing vegetation may be enhanced by management treatments that reduce competition from established warm-season grasses. In 2009, we initiated a field experiment to investigate the effects of two mowing and two herbicide treatments on diversity and abundance of forbs interseeded into established grasslands on 15 sites across southern Minnesota. Each site was burned and interseeded in fall 2009 (n=8) or spring 2010 (n=7), and two mowing treatments (Mow 1, Mow 2) and two grass-selective herbicide treatments (Low Herbicide, High Herbicide) were applied during the 2010 growing season. Sites were surveyed during summer 2011, burned during spring 2013, and surveyed again during summer 2013. We also completed a cost analysis to determine the cost per acre of 3 management options (interseeding + mowing twice, interseeding + herbicide spraying at higher rate, cropping + new planting). We observed 24 (83%) of the 29 native seeded forbs in study plots each year. Species richness of seeded forbs was marginally greater in the high herbicide treatment than the control in 2011. Additionally, total species richness and total plant community diversity were greater in the high herbicide and mow 2 treatments than the control in 2011. However, these treatment differences disappeared by 2013. Overall, seeded forb species richness, total species richness, and total plant community diversity were lower in 2013 than 2011. None of the treatments were more effective than the control in helping to increase the percent canopy cover of native forbs over time, and warm season grasses continued to dominate canopy cover 3 years post-treatment. Our cost analysis indicated that interseeding plus mowing ($296/acre) or herbicide spraying at the higher rate ($342/acre) were cheaper options than eliminating existing vegetation and planting entirely new seed ($450/acre). However, the results from our field experiment indicate that neither mowing nor spraying a grass-selective herbicide during the first growing season post-interseeding are effective ways to establish forbs in grasslands dominated by warm-season grasses. Natural resource managers may obtain improved vegetation structure and diversity by spending the additional money to completely eliminate the existing vegetation and then re-planting a higher diversity seed mix into bare ground.
INTRODUCTION
Minnesota Department of Natural Resources (MNDNR) wildlife managers indicated a need for more information on establishing and maintaining an abundance and diversity of forbs in reconstructed grasslands (Tranel 2007). A diversity of forbs in grasslands provides the heterogeneous vegetation structure needed by many bird species for nesting and brood rearing
Page 11
(Volkert 1992, Sample and Mossman 1997). Forbs also provide habitat for pollinators and other invertebrates, essential foods for breeding grassland birds and their broods (Buchanan et al. 2006).
The forb component in many restored grasslands has been lost or greatly reduced. Managers interested in increasing the diversity and quality of forb-deficient grasslands are faced with the costly option of completely eliminating the existing vegetation and planting into bare ground, or attempting to interseed forbs directly into existing vegetation. Management techniques that reduce competition from established grasses may provide an opportunity for forbs to become established in existing grasslands (Collins et al. 1998, McCain et al. 2010). Temporarily suppressing dominant grasses may increase light, moisture, and nutrient availability to seedling forbs, ultimately increasing forb abundance and diversity (Schmitt-McCain 2008, McCain et al. 2010). Williams et al. (2007) found that frequent mowing of grasslands in the first growing season after interseeding increased forb emergence and reduced forb mortality. Additionally, Hitchmough and Paraskevopoulou (2008) found that forb density, biomass, and richness were greater in meadows where a grass herbicide was used.
In this study, we examined the effects of two mowing and two herbicide treatments on diversity and abundance of forbs interseeded into established grasslands dominated by warm-season grasses in southern Minnesota. Further, we calculated costs associated with two management approaches for comparison with the cost of a re-planting option. Our results can help guide future management decisions made by wildlife managers. METHODS Field Experiment
Study Site Selection. – We selected study sites (n=15) throughout the southern portion of Minnesota’s prairie/farmland region on state- and federally-owned wildlife areas. Each site was ≥4 ha and characterized by relatively uniform soils, hydrology, and vegetative composition. All sites were dominated by relatively uniform stands of warm-season grasses with few forbs, most of which were non-native species [e.g., sweet clover (Melitotus alba, M. officinalis)]. Dominant grasses included big bluestem (Andropogon gerardii), switchgrass (Panicum virgatum), and Canada wild rye (Elymus canadensis).
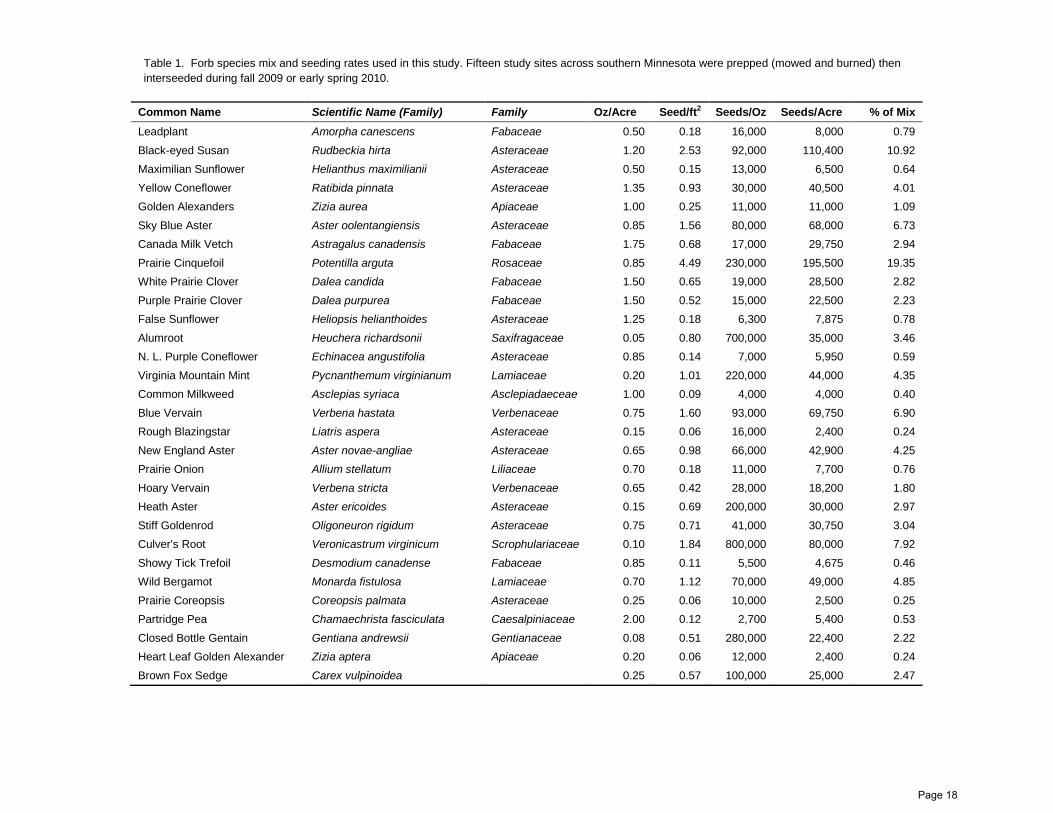
Site Preparation and Interseeding. – Eight sites were burned in October and November 2009 and frost interseeded during December 2009 and March 2010, whereas 7 sites were burned and interseeded during April and May 2010. The same 30-species mix of seed was broadcast seeded at all sites at a rate of 239 pure live seeds/m2 (Table 1). Seed used on spring-burned sites was cold-moist stratified for 3-5 weeks in wet sand to stimulate germination prior to interseeding; seed used on fall-burned sites was not cold-moist stratified prior to interseeding.
Treatments. – We divided sites into 10 study plots of approximately equal size and randomly assigned each of 4 treatments and the control. Each site received all treatments to account for variability among sites, and the control and each treatment were replicated twice at each site. The following treatments, designed to suppress grass competition, were applied during the first growing season after interseeding (2010) while the forbs were becoming established:
• Mow 1: mowed once to a height of 10-15 cm when vegetation reached 25-35 cm in height.
Page 12
• Mow 2: mowed twice to a height of 10-15 cm when vegetation reached 25-35 cm in height.
• Low Herbicide: applied grass herbicide Clethodim (Select Max®) at 108 mL/ha (9 oz/A) when vegetation reached 10-15 cm.
• High Herbicide: applied grass herbicide Clethodim (Select Max®) at 215 mL/ha (18 oz/A) when vegetation reached 10-15 cm.
Sampling Methods. – We visited all sites once annually between 25 July – 27 September
in 2011 and between 22 July and 15 August 2013. Twenty points within each study plot were randomly chosen for sampling. We estimated presence of all plant species in a 76 x 31 cm2 quadrat at each sampling point. In addition, we estimated litter depth and percent cover (Daubenmire 1959) of native grasses, exotic grasses, native forbs, exotic forbs, bare ground, and duff within each sampling quadrat. We estimated percent cover within 6 classes: 0-5%, 5-25%, 25-50%, 50-75%, 75-95%, and 95-100%. Finally, we recorded visual obstruction readings (VOR; Robel et al. 1970) in the 4 cardinal directions at the 5th, 10th, 15th, and 20th quadrats in each plot to determine vegetation vertical density. Deviations from the field protocol occurred in 2012 in the following ways: 1) Only 10 of the 15 sites were visited; 2) Several flags and markers disappeared or fell down between seasons, and plot corners were not remarked or reflagged prior to the start of data collection. As a result, plot boundaries could not be reliably determined; 3) The start of data collection was delayed. All data was collected between 28 August – 23 September 2012, a period of drought in southern Minnesota that could have affected species detection rates; 4) Robel pole readings were only taken at 7 of the 10 sites. Due to these deviations from the original protocol, we have not included the 2012 data in our analyses.
Post-Treatment Management. – To aid forb establishment and persistence, managers conducted prescribed burns at 14 sites during April and May 2013. Due to time and weather limitations, 1 site was not burned.
Statistical Analyses. – We used mixed models to evaluate the effects of treatments, years, and the treatment x year interaction on our estimates of canopy cover, vegetation vertical density, species richness, and diversity. We nested plots within site as a random effect. We did not correct for detection probability in our analyses of richness and diversity measures. We defined species richness as the average number of species present in a sampling quadrat, and we estimated two measures of species richness: interseeded forbs only and total species richness. We calculated the Shannon-Wiener index of diversity, H = -ƩPi(lnPi), where Pi is the proportion of each species in the sample. This diversity index combines measures of species richness and evenness, and a greater value indicates a more diverse suite of species are present. We estimated two different measures of diversity – interseeded forb species diversity and overall plant community diversity. We report untransformed data throughout the text. Cost Analysis
During winter 2012, we obtained work summaries from the area wildlife offices at Talcot Lake and Slayton. The work summaries contained detailed notes on the number of personnel, the type(s) of fleet vehicles and equipment, and the number of man hours spent prepping, burning, and treating (i.e., mowing or herbicide spraying) the sites used for our study which allowed us to estimate the cost of 3 particular management activities: 1) interseeding + mowing
Page 13
twice, 2) interseeding + herbicide spraying at higher rate, 3) cropping + new planting. Some variables (e.g., fleet costs, number of personnel needed for a prescribed burn) varied widely in cost depending on the distance to or the size of the site so we calculated average costs based on a range of site sizes and distances traveled. Additionally, managers provided estimates for activities and supplies not included in the work summaries (e.g., acres/hour of planting into recently cropped soil). We used seed prices from a current MNDNR state contract vendor (Shooting Star) to determine the cost of our 30-species interseed mix versus the typical mesic southwest prairie seed mix used by MNDNR wildlife managers when they seed into bare soil. Finally, managers often use cooperative farming agreements (CFAs) to accomplish certain activities (e.g., mowing, row cropping to prep soil) on state land. The CFAs are essentially a barter system between the state and a private cooperator in which work is done at no cost to the state. We accounted for CFAs where appropriate in our cost analysis. RESULTS Field Experiment
In 2011 (i.e., one year post-treatment), we observed 24 (82.7%) of the 29 interseeded species across all study plots and detected 1718 individual interseeded forb plants. Black-eyed Susan (Rudbeckia hirta) was the most common seeded forb species (forming 40.2% of all seeded forb observations), followed by wild bergamot (Monarda fistulosa, 16.5%), golden Alexander (Zizia aurea, 10.1%), common milkweed (Asclepias syriaca, 8.0%), and yellow coneflower (Ratibida pinnata, 7.2%). In 2013, we again observed 24 (82.7%) of the 29 seeded forb species across all study plots but had fewer overall detections (n = 520). Black-eyed Susan (21.5%), wild bergamot (18.5%), common milkweed (15.2%), Canada milk vetch (Astragalus canadensis, 8.1%), and golden Alexander (6.7%) were the most common seeded forb species in 2013.
Native grasses formed the greatest component of canopy cover (48.1%) across both years (Fig. 1). Canopy cover of native grasses was lowest in the Mow 2 treatment compared to the other treatments and control in 2011 (Table 2), but there were no overall treatment effects. Canopy cover of native forbs, including interseeded species, averaged 22.3% across all treatments and the control in 2011 but decreased to 9.5% by 2013 (Fig. 2). Canopy cover of native forbs was slightly greater in the High Herbicide treatment in both years (Table 2); however, none of the treatments significantly affected the cover of native forbs compared to the control. Exotic grasses and exotic forbs also showed reduced canopy cover over time (Table 2) but there were no differences among the treatments and control.
The control plots had slightly greater vegetation vertical density than the treatment plots in 2011 (Table 2; Fig. 3) but these differences were not significant. Vertical density was significantly less in 2013 compared to 2011.
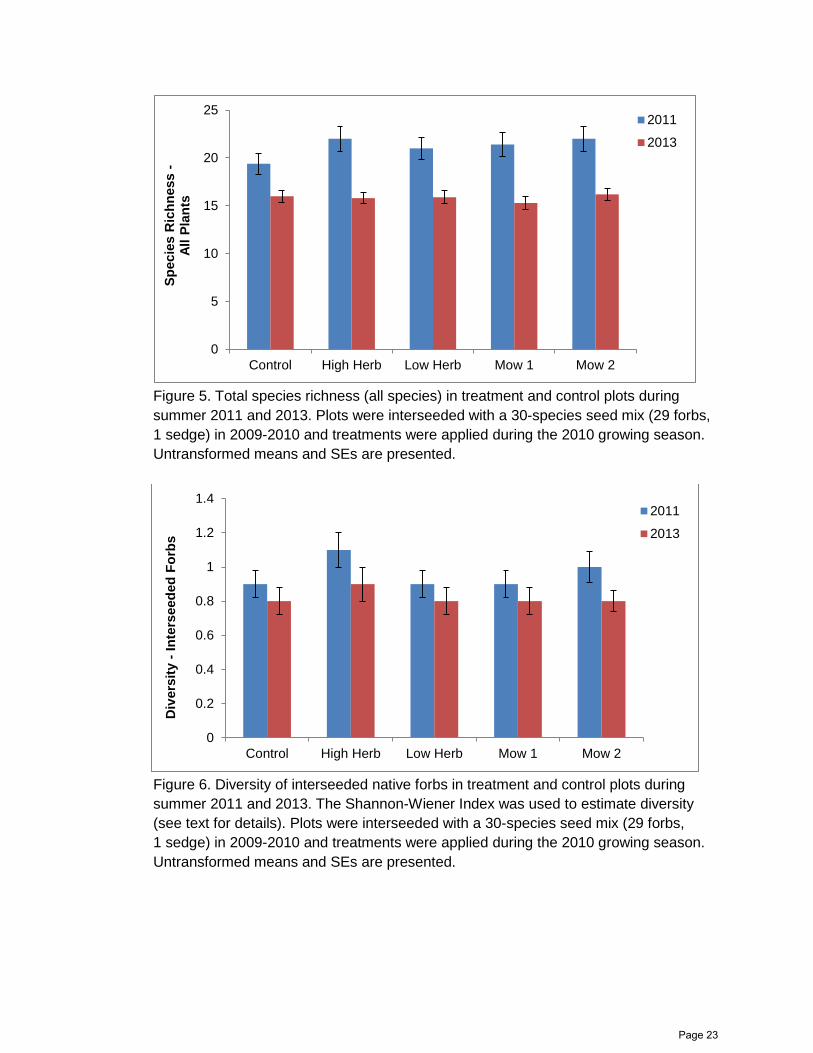
Species richness of interseeded forbs was higher in the High Herbicide treatment plots compared to the controls in 2011, but these differences did not persist in 2013 (Table 2; Fig. 4). Total species richness was also greater in the High Herbicide treatment plots than the control in 2011 (Table 2; Fig. 5), but total species richness declined through time.
The diversity of interseeded forbs was greater in 2011 than 2013 but did not vary significantly among the treatments and controls (Fig. 6). Overall, interseeded forb diversity was slightly greater in the High Herbicide and Mow 2 treatments in 2011 (Table 2). High Herbicide
Page 14
and Mow 2 treatments had greater overall plant community diversity than the control in 2011 but these differences were no longer evident in 2013 (Table 2; Fig. 7). Cost Analysis
“Interseeding + Mowing Twice” was the cheapest management option ($296/acre) available to wildlife managers for attempting to increase diversity on a WMA followed by the “Interseeding + High Herbicide” option ($342/acre)(Table 3). In both scenarios, the cost of the forb-only seed mix helped make these options more affordable. Although forb seeds are generally more expensive than grass seeds, fewer forb seeds are needed for an interseeding approach. The “Crop + Re-Plant” option was the most expensive option ($450/acre), and an entirely new seed mix, including grasses and forbs, drove the price of this option (Table 3). DISCUSSION
Mowing and herbicide treatments were effective in suppressing grasses during the first growing season after application during a pilot study (Tranel 2009). Here, we also found that the High Herbicide treatment had some effect on increasing the percent canopy cover of native forbs, species richness, and plant diversity during the first growing season (2011) after treatment. The Mow 2 treatment helped reduce the percent canopy cover of native grasses and increase plant diversity in 2011. However, each of these treatment effects were weak and none persisted into 2013. Although we found that most of the seeded forb species (82.7%) were established in relatively low numbers in 2011, their numbers had dropped by 2013 whereas the percent canopy cover of native grasses remained dominant each year. Thus, the mowing and herbicide treatments were not effective at suppressing warm-season native grasses over the long term. Other studies have reported better success with persistence of forbs over time. Williams et al. (2007) observed similarly abundant seeded forbs in mowed and control treatments at the end of a second growing season, but seeded forbs were twice as abundant in mowed treatments by the beginning of year 5. Hitchmough and Paraskevopoulou (2008) found that, in treatments where grass was suppressed with a graminoid herbicide, sown forb density was higher in the second and third year after treatment and forb richness was greater 3 years after treatment.
The goal of our study was to test potential management options that would be applicable for grassland restoration across a broad spectrum of sites. Despite choosing study plots with relatively uniform vegetation (i.e., dominated by warm-season native grasses), our sites still had a high degree of among-site variability. Factors beyond vegetation type (e.g., soil moisture, nutrients, and microbes) undoubtedly play a role in determining plant competition and the success or failure of seed establishment (e.g., Grygiel et al. 2012, Rossiter 2013). Thus, management options that are suitable for one particular site may not work well at another site. As a result, broadly applicable management options for increasing diversity through interseeding may not be a viable option.
Our cost analysis indicated that starting over on a WMA planting (i.e., tilling the vegetation under, cropping, then re-planting with a new seed mix) is the most costly option for grassland restoration considered in this study. However, MNDNR wildlife managers report having good long-term success with increasing forb canopy cover and plant diversity when they use this option (J. Beech, personal communication). Managers may be able to increase the
Page 15
effectiveness of interseeding by giving more attention to a site (e.g., mowing more than twice within a season, mowing across multiple seasons, spraying a grass-selective herbicide more often), but such activities would only add to the cost of interseeding-based restoration. Therefore, starting over may be the most costly option in the short-term but it is likely the cheapest option in the long-term.
MANAGEMENT IMPLICATIONS
The use of the pre-emergent grass selective herbicide Clethodim (Select Max®) at 215
mL/ha (18 oz/A) had limited effectiveness at helping forbs establish in sites dominated warm-season native grasses during the first growing season post-application. Growth of grass was stunted but grass mortality was not observed even at the high application rate at any of the study sites. However, forbs did not persist over time and native grasses continued to dominate regardless of treatment. We suggest that starting a restoration over may be the more expensive option in the short-term, but it is likely to provide better results (i.e., increased forb cover and plant community diversity) over the longer term when compared to mowing or herbicide-spraying options.
ACKNOWLEDGMENTS
This project was funded by the Minnesota Department of Natural Resources. Wildlife
managers from the Minnesota Department of Natural Resources and U.S. Fish and Wildlife Service provided study sites, equipment, and labor for prepping, treating, and burning the sites. J. Zajac suggested the idea behind this study. J. Fieburg and J. Giudice provided valuable advice and assistance on the study design and analysis. B. Bermel, S. Betzler, A. Krenz, J. Luttrell, M. Miller, H. Rauenhorst, J. Swanson, and K. Zajak conducted most of the field work. J. Markl and staff at the Talcot Lake and Slayton area wildlife offices provided work summaries and supply and labor cost estimates used in the cost analysis. J. Roberts and J. Stangel provided information on seed mix costs. M. Grund provided comments on an earlier draft of this report. LITERATURE CITED Buchanan, G.M., M.C. Grant, R.A. Sanderson, and J.W. Pearce-Higgins. 2006. The contribution
of invertebrate taxa to moorland bird diets and the potential implications of land-use management. Ibis 148:615-628.
Collins, S.L., A.K. Knapp, J.M. Briggs, J.M. Blair, and E.M. Steinauer. 1998. Modulation of diversity by grazing and mowing in native tallgrass prairie. Science 280:745-747.
Grygiel, C.E., J.E. Norland, and M.E. Biondini. 2012. Can carbon and phosphorous amendments increase native forbs in a restoration process? A case study in the Northern Tallgrass Prairie (USA). Restoration Ecology 20:122-130.
Page 16
Hitchmough, J. and A. Paraskevopoulou. 2008. Influence of grass suppression and sowing rate on the establishment and persistence of forb dominated urban meadows. Urban Ecosystems 11:33-44.
McCain, K.N.S., S.G. Baer, J.M. Blair, and G.W.T. Wilson. 2010. Dominant grasses suppress local diversity in restored tallgrass prairie. Restoration Ecology 18:40-49.
Robel, R.J., J.N. Briggs, A.D. Dayton, and L.C. Hulbert. 1970. Relationships between visual obstruction measurements and weight of grassland vegetation. Journal of Range Management 23:295-297.
Rossiter, S.C. 2013. Effects of the seed bank and interseeding in reconstructed tallgrass prairies. Thesis, University of North Dakota, Grand Forks, North Dakota, USA.
Sample, D.W. and M.J. Mossman. 1997. Managing habitat for grassland birds, a guide for Wisconsin. Wisconsin Department of Natural Resources, Bureau of Integrated Science Services, Madison, Wisconsin.
Schmitt-McCain, K.N. 2008. Limitations to plant diversity and productivity in restored tallgrass prairie. Thesis. Kansas State University, Manhattan, USA.
Tranel, M.A. 2007. Management focused research needs of Minnesota’s wildlife managers- grassland management activities. In MW DonCarlos, RO Kimmel, JS Lawrence, and MS Lenarz (eds.). Summaries of Wildlife Research Findings. Minnesota Department of Natural Resources, St. Paul, Minnesota.
Tranel, M.A. 2009. Establishment and maintenance of forbs in existing grass stands- pilot season update. In MW DonCarlos, RO Kimmel, JS Lawrence, and MS Lenarz (eds.). Summaries of Wildlife Research Findings. Minnesota Department of Natural Resources, St. Paul, Minnesota.
Volkert, W.K. 1992. Response of grassland birds to a large-scale prairie planting project. Passenger Pigeon 54: 191-195.
Williams, D.W., L.L. Jackson, and D.D. Smith. 2007. Effects of frequent mowing on survival and persistence of forbs seeded into a species-poor grassland. Restoration Ecology 15:24-33.
Page 17
Table 1. Forb species mix and seeding rates used in this study. Fifteen study sites across southern Minnesota were prepped (mowed and burned) then interseeded during fall 2009 or early spring 2010.
Table 2. Comparison of estimated (means ± SE) percent canopy cover (native grass, exotic grass, native forbs, exotic forbs), vegetation vertical density (visual obstruction reading), species richness (interseeded native forbs only, all species), and species diversity (interseeded native forbs only, all species) on 15 study sites across southern Minnesota during summer 2011 and 2013. Sites were prepped (mowed and burned) then interseeded during fall 2009 or early spring 2010 with a 30-species seed mix. Treatments were applied during the 2010 growing season.
Table 3. Results of a cost analysis comparing 3 management options aimed at increasing forb diversity on Minnesota Department of Natural Resources (MNDNR) Wildlife Management Areas (WMAs). Costs are calculated as $/acre. Cooperative farming agreements (CFA) are often used by wildlife managers for certain management activities and occur at no cost to the state. Not all activities need to occur under each management situation (denoted with a period).
Management Option Management Activity Interseed + Mow Twice Interseed + High Herbicide Crop + Re-Plant Site preparation
Spray with Round-up herbicide .
.
$10 Haying CFA
CFA
.
Mow firebreaks and conduct fall prescribed burn $32
$32
$32 Frost interseed (broadcast spread) - labor only $30
$30
$30
Cost of seed mix $202
$202
$336
Management treatment Crop for 2 years .
.
CFA
Mow first time CFA
.
. Mow second time CFA
.
.
Spray grass-selective herbicide (labor and herbicide costs) .
$46
. Spot spray for weeds .
.
$10
Future site management Mow firebreaks and conduct prescribed burn $32
$32
$32
Total cost/acre $296 $342 $450
Page 20
Figure 1. Estimated canopy cover of native grasses in treatment and control plots during summer 2011 and 2013. Plots were interseeded with a 30-species seed mix (29 forbs, 1 sedge) in 2009-2010, and treatments were applied during the 2010 growing season. Warm-season grasses, especially big bluestem (Andropogon gerardii), switchgrass (Panicum virgatum), and Canada wild rye (Elymus canadensis) dominated this category. Untransformed means and SEs are presented.
Figure 2. Estimated canopy cover of native forbs, including interseeded species, in treatment and control plots during summer 2011 and 2013. Plots were interseeded with a 30-species seed mix (29 forbs, 1 sedge) in 2009-2010 and treatments were applied during the 2010 growing season. Untransformed means and SEs are presented.
0
10
20
30
40
50
60
70
Control High Herb Low Herb Mow 1 Mow 2
% N
ativ
e G
rass
es
20112013
0
5
10
15
20
25
30
35
Control High Herb Low Herb Mow 1 Mow 2
% N
ativ
e Fo
rbs
20112013
Page 21
Figure 3. Vegetation vertical density (i.e., visual obstruction readings; Robel et al. 1970) in treatment and control plots during summer 2011 and 2013. Plots were interseeded with a 30-species seed mix (29 forbs, 1 sedge) in 2009-2010 and treatments were applied during the 2010 growing season. Untransformed means and SEs are presented.
Figure 4. Species richness of interseeded native forbs in treatment and control plots during summer 2011 and 2013. Plots were interseeded with a 30-species seed mix (29 forbs, 1 sedge) in 2009-2010 and treatments were applied during the 2010 growing season. Untransformed means and SEs are presented.
0.0
1.0
2.0
3.0
4.0
5.0
6.0
7.0
Control High Herb Low Herb Mow 1 Mow 2
Vert
ical
Den
sity
(dm
)
20112013
0
1
2
3
4
5
6
Control High Herb Low Herb Mow 1 Mow 2
Spec
ies
Ric
hnes
s -
In
ters
eede
d Fo
rbs
2011
2013
Page 22
Figure 5. Total species richness (all species) in treatment and control plots during summer 2011 and 2013. Plots were interseeded with a 30-species seed mix (29 forbs, 1 sedge) in 2009-2010 and treatments were applied during the 2010 growing season. Untransformed means and SEs are presented.
Figure 6. Diversity of interseeded native forbs in treatment and control plots during summer 2011 and 2013. The Shannon-Wiener Index was used to estimate diversity (see text for details). Plots were interseeded with a 30-species seed mix (29 forbs, 1 sedge) in 2009-2010 and treatments were applied during the 2010 growing season. Untransformed means and SEs are presented.
0
5
10
15
20
25
Control High Herb Low Herb Mow 1 Mow 2
Spec
ies
Ric
hnes
s -
Al
l Pla
nts
2011
2013
0
0.2
0.4
0.6
0.8
1
1.2
1.4
Control High Herb Low Herb Mow 1 Mow 2
Div
ersi
ty -
Inte
rsee
ded
Forb
s
2011
2013
Page 23
Figure 7. Diversity of the entire plant community in treatment and control plots during summer 2011 and 2013. The Shannon-Wiener Index was used to estimate diversity (see text for details). Plots were interseeded with a 30-species seed mix (29 forbs, 1 sedge) in 2009-2010 and treatments were applied during the 2010 growing season. Untransformed means and SEs are presented.